Embed Size (px)
Citation preview
MACROECONOMICS
February 20th, 2014
Lecture 1. Gross Domestic Product
Lecturer: Dragana Stanišić
Classes: Thursdays, 10:00 – 13:00, MO 309
Course page: http://home.cerge-ei.cz/dragana/Macroeconomics14.html
Textbook: Mankiw, N. G. (2007). Principles of Economics (any edition)
Course Info
• Attendance list
• Active participation is encouraged
***
Assignments
Presentation (20 min)
***
Grading
Written evaluation to the Head of the Economics Department
Class Policies
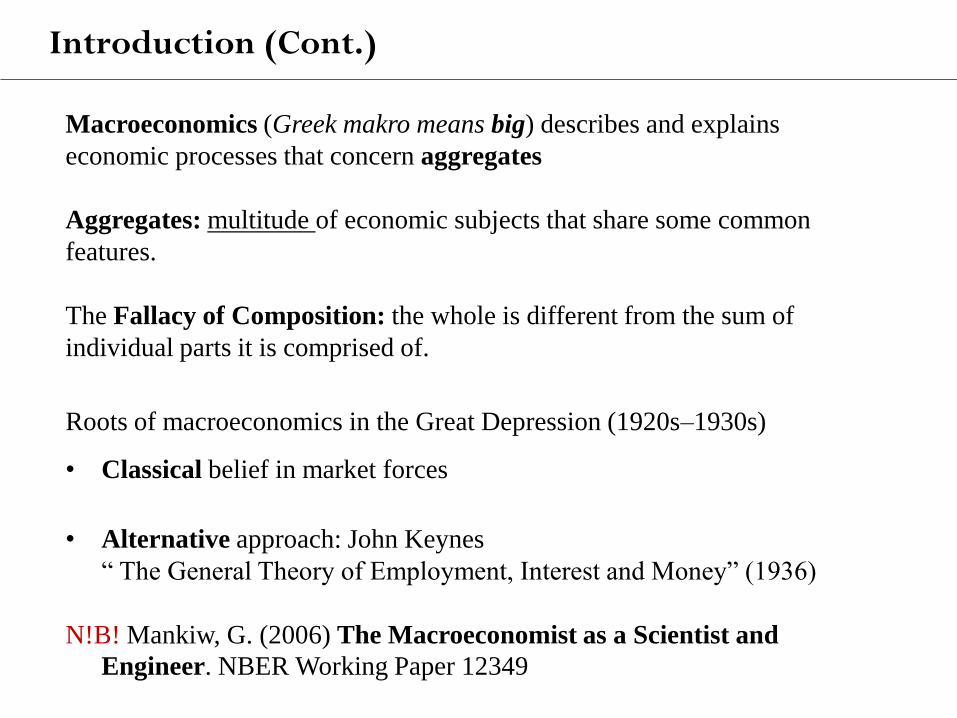
Macroeconomics (Greek makro means big) describes and explains
economic processes that concern aggregates
Aggregates: multitude of economic subjects that share some common
features.
The Fallacy of Composition: the whole is different from the sum of
individual parts it is comprised of.
Roots of macroeconomics in the Great Depression (1920s–1930s)
• Classical belief in market forces
• Alternative approach: John Keynes
“ The General Theory of Employment, Interest and Money” (1936)
N!B! Mankiw, G. (2006) The Macroeconomist as a Scientist and
Engineer. NBER Working Paper 12349
Introduction (Cont.)
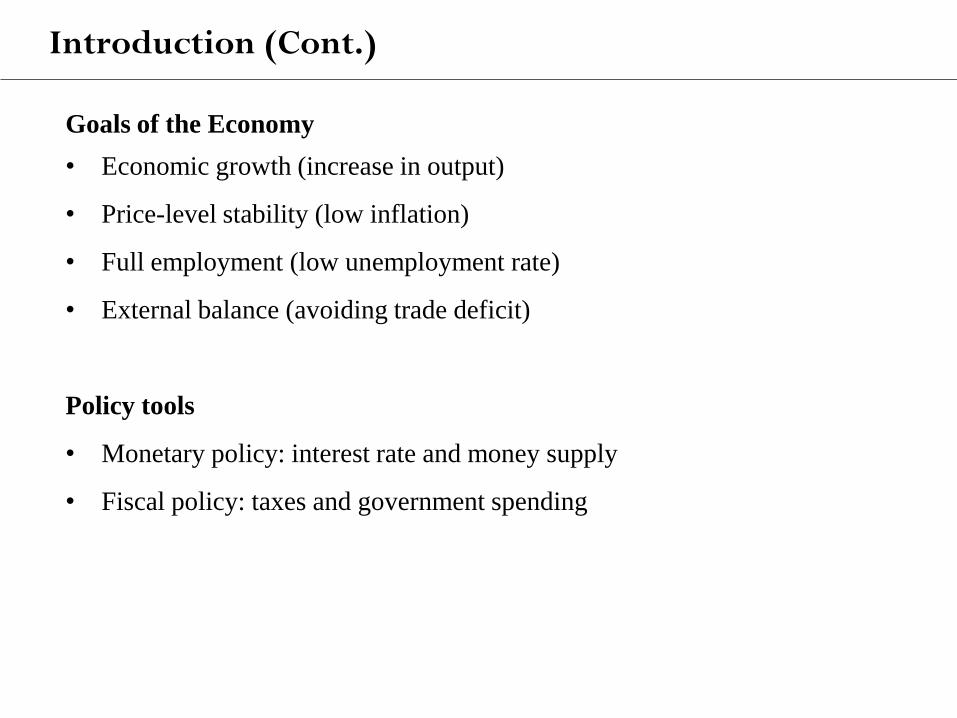
Goals of the Economy
• Economic growth (increase in output)
• Price-level stability (low inflation)
• Full employment (low unemployment rate)
• External balance (avoiding trade deficit)
Policy tools
• Monetary policy: interest rate and money supply
• Fiscal policy: taxes and government spending
Introduction (Cont.)
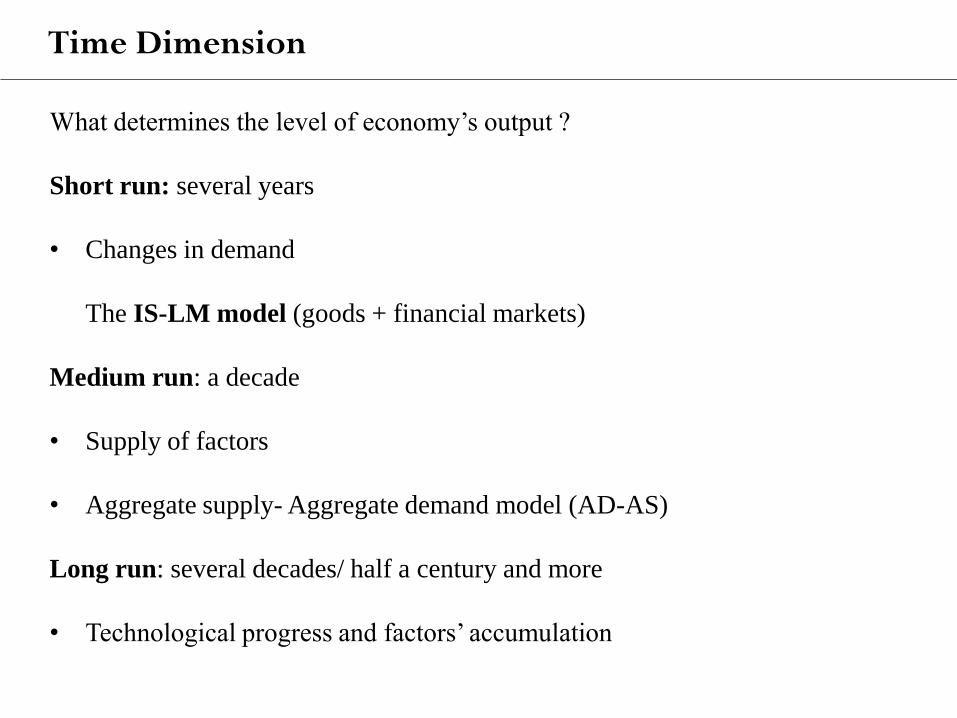
What determines the level of economy’s output ?
Short run: several years
• Changes in demand
The IS-LM model (goods + financial markets)
Medium run: a decade
• Supply of factors
• Aggregate supply- Aggregate demand model (AD-AS)
Long run: several decades/ half a century and more
• Technological progress and factors’ accumulation
Time Dimension
Year GDP (mil CZK)
1990 632,691
1991 815,579
1992 925,476
1993 1,144,645
1994 1,323,328
1995 1,533,676
1996 1,761,575
1997 1,884,924
1998 2,061,583
1999 2,149,023
2000 2,269,695
2001 2,448,557
2002 2,567,530
2003 2,688,107
2004 2,929,172
2005 3,116,056
2006 3,352,599
2007 3,662,573
2008 3,848,411
2009 3,758,979
2010 3,799,547
2011 3,841,370
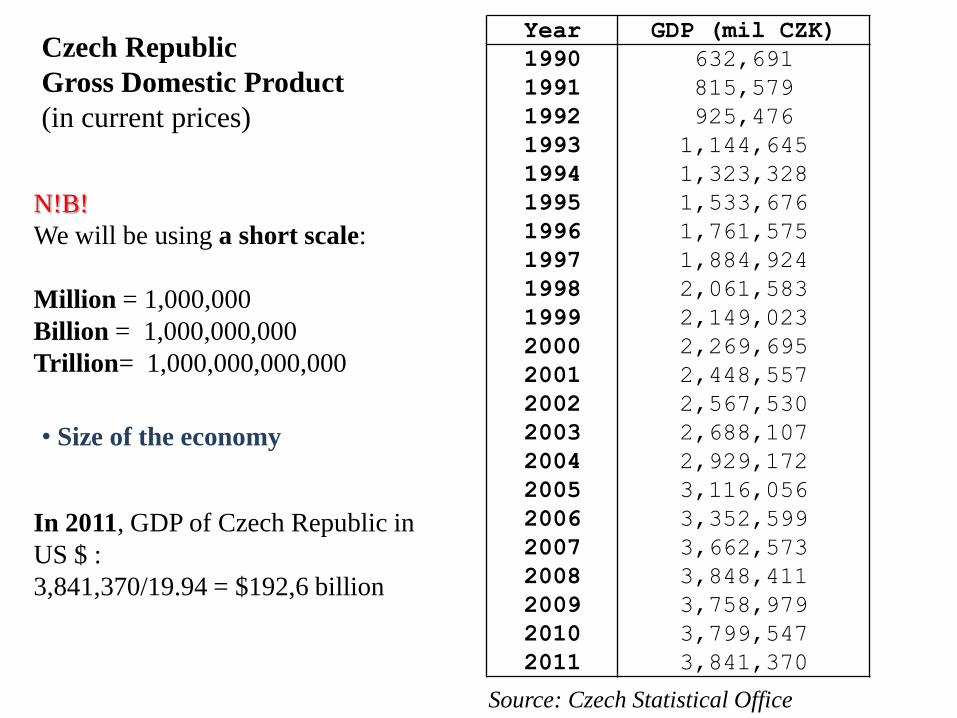
N!B!
We will be using a short scale:
Million = 1,000,000
Billion = 1,000,000,000
Trillion= 1,000,000,000,000
In 2011, GDP of Czech Republic in
US $ :
3,841,370/19.94 = $192,6 billion
Source: Czech Statistical Office
• Size of the economy
Czech Republic
Gross Domestic Product
(in current prices)
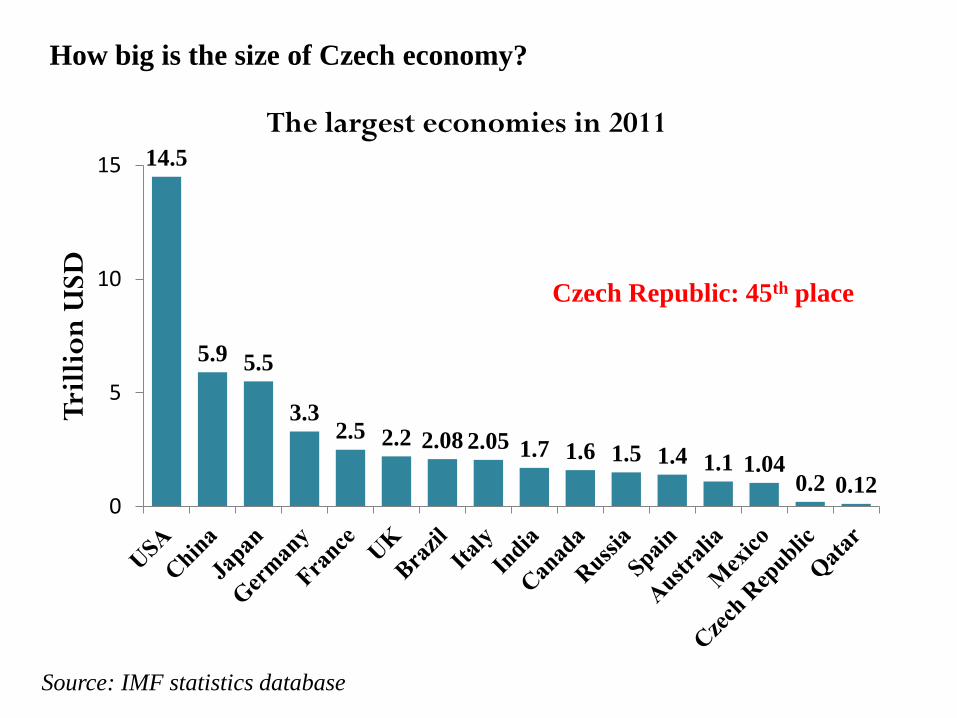
How big is the size of Czech economy?
Source: IMF statistics database
14.5
5.9 5.5
3.3 2.5 2.2 2.08 2.05 1.7 1.6 1.5 1.4 1.1 1.04
0.2 0.12 0
5
10
15
Tri
llio
n U
SD
The largest economies in 2011
Czech Republic: 45th place
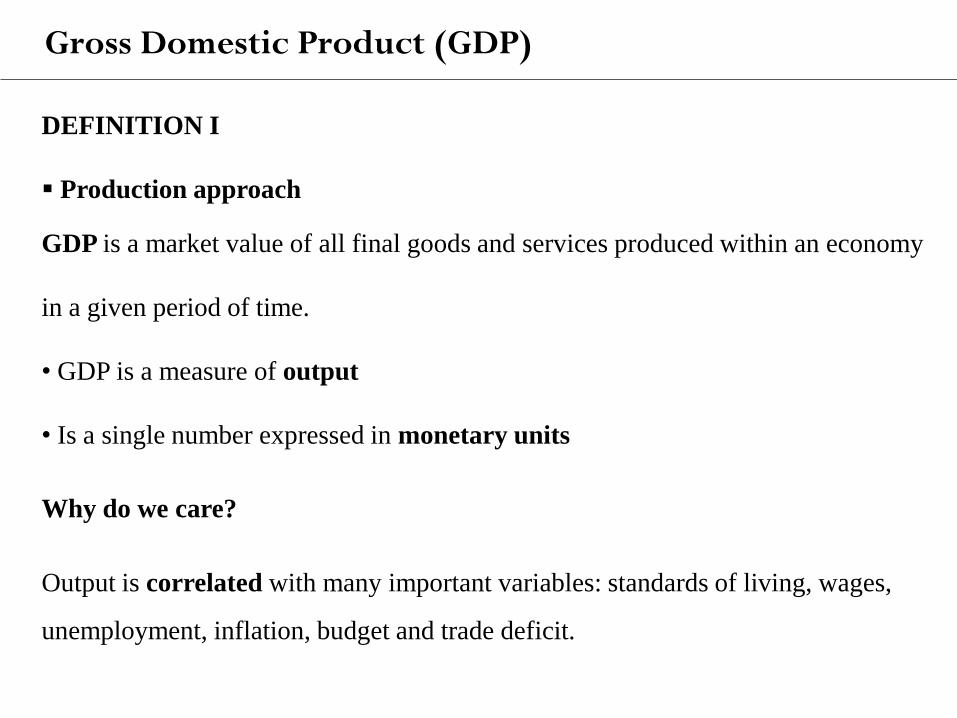
DEFINITION I
Production approach
GDP is a market value of all final goods and services produced within an economy
in a given period of time.
• GDP is a measure of output
• Is a single number expressed in monetary units
Why do we care?
Output is correlated with many important variables: standards of living, wages,
unemployment, inflation, budget and trade deficit.
Gross Domestic Product (GDP)
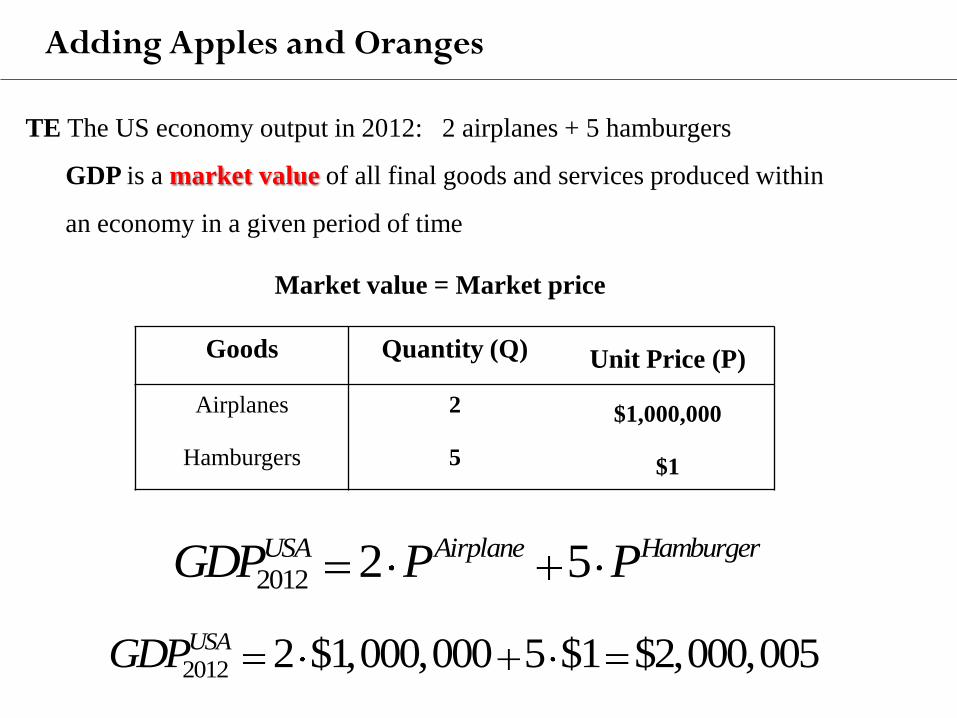
TE The US economy output in 2012: 2 airplanes + 5 hamburgers
2012 2 5USA Airplane HamburgerGDP P P
2012 2 $1,000,000 5 $1 $2,000,005USAGDP
GDP is a market value of all final goods and services produced within
an economy in a given period of time
Market value = Market price
Goods Quantity (Q) Unit Price (P)
Airplanes 2 $1,000,000
Hamburgers 5 $1
Adding Apples and Oranges
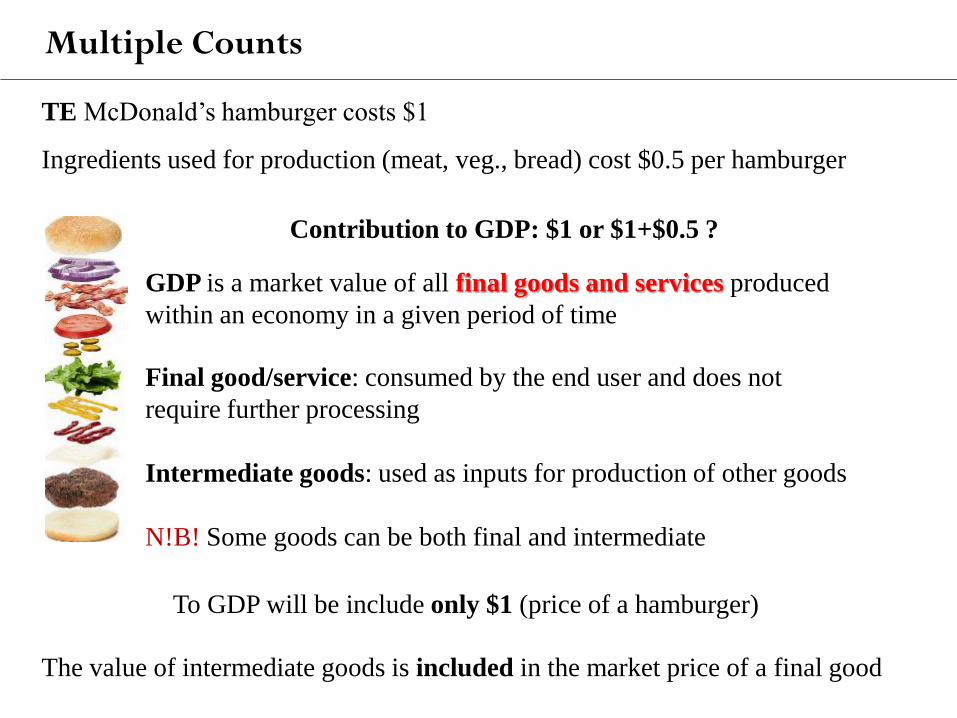
TE McDonald’s hamburger costs $1
Ingredients used for production (meat, veg., bread) cost $0.5 per hamburger
Contribution to GDP: $1 or $1+$0.5 ?
GDP is a market value of all final goods and services produced
within an economy in a given period of time
Final good/service: consumed by the end user and does not
require further processing
Intermediate goods: used as inputs for production of other goods
N!B! Some goods can be both final and intermediate
To GDP will be include only $1 (price of a hamburger)
The value of intermediate goods is included in the market price of a final good
Multiple Counts
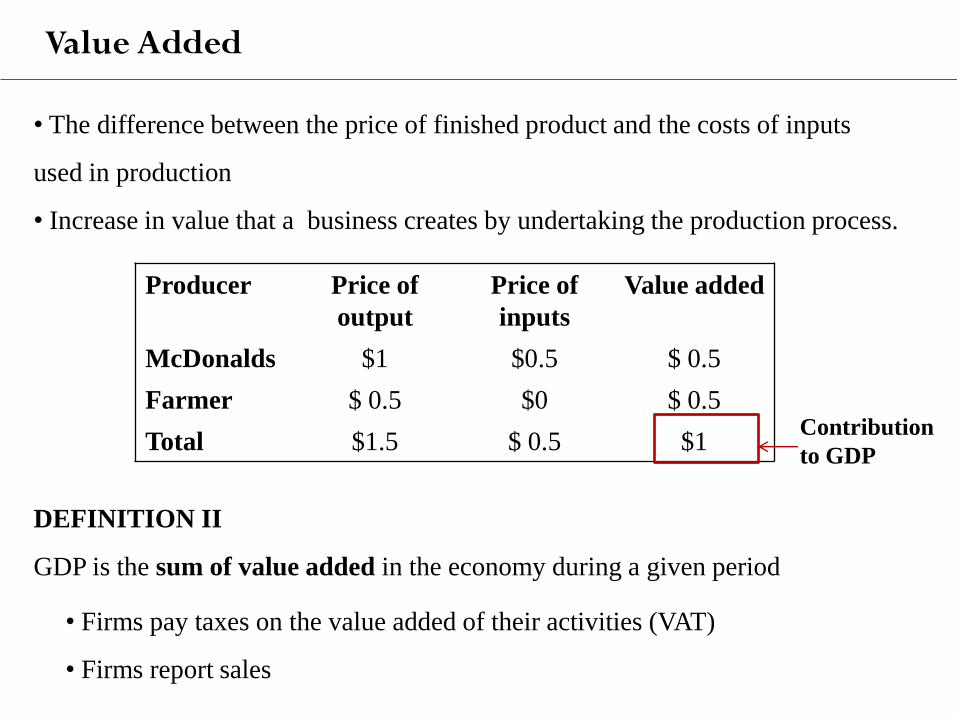
• The difference between the price of finished product and the costs of inputs
used in production
• Increase in value that a business creates by undertaking the production process.
Producer Price of
output
Price of
inputs
Value added
McDonalds $1 $0.5 $ 0.5
Farmer $ 0.5 $0 $ 0.5
Total $1.5 $ 0.5 $1
DEFINITION II
GDP is the sum of value added in the economy during a given period
Contribution
to GDP
• Firms pay taxes on the value added of their activities (VAT)
• Firms report sales
Value Added
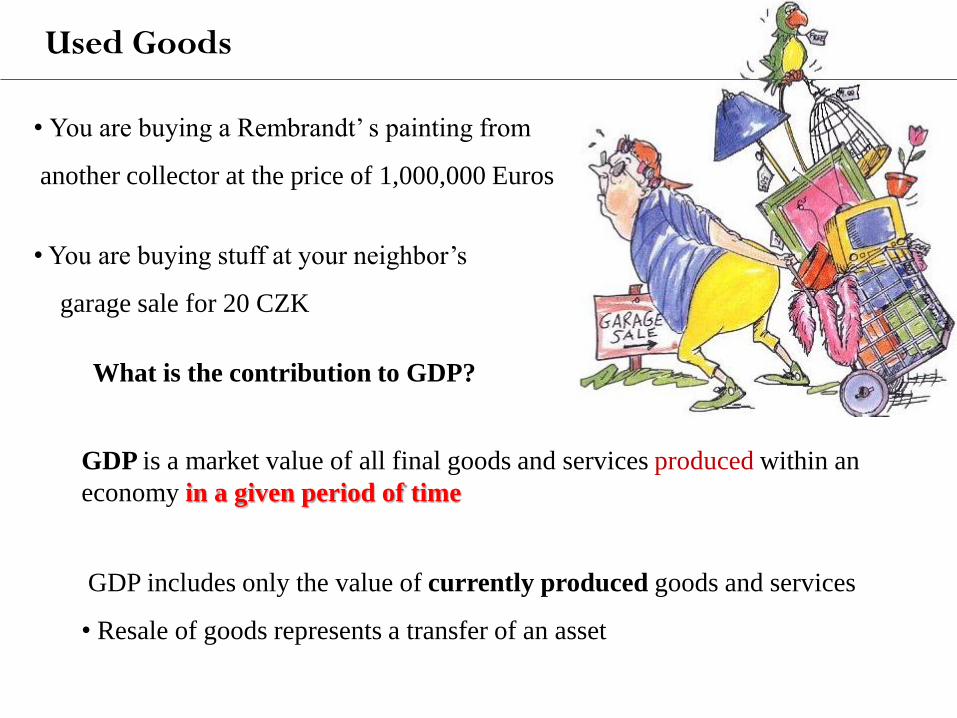
• You are buying a Rembrandt’ s painting from
another collector at the price of 1,000,000 Euros
• You are buying stuff at your neighbor’s
garage sale for 20 CZK
What is the contribution to GDP?
GDP is a market value of all final goods and services produced within an
economy in a given period of time
GDP includes only the value of currently produced goods and services
• Resale of goods represents a transfer of an asset
None
Used Goods
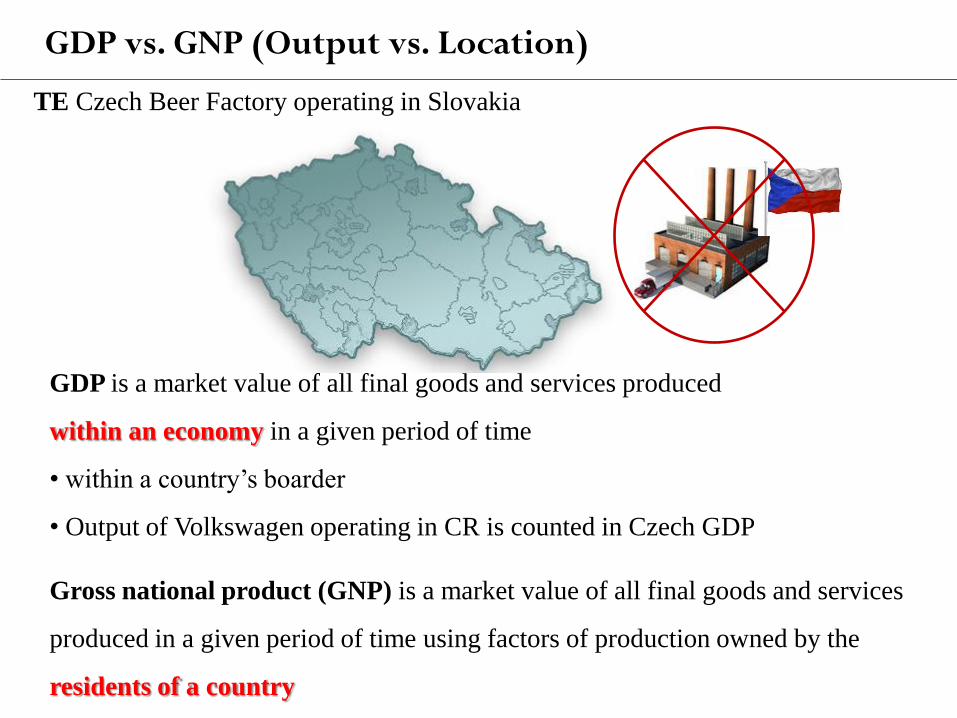
TE Czech Beer Factory operating in Slovakia
GDP is a market value of all final goods and services produced
within an economy in a given period of time
• within a country’s boarder
• Output of Volkswagen operating in CR is counted in Czech GDP
Gross national product (GNP) is a market value of all final goods and services
produced in a given period of time using factors of production owned by the
residents of a country
GDP vs. GNP (Output vs. Location)
Does not account for
• Goods and services not sold in the market (home production, child care)
• Underground economy: legal activities hidden from government and illegal
activities
• Imputed values
Assumption: The level of inaccuracy in GDP calculations is roughly constant
from year to year
=> Inaccuracy can be neglected
GDP Accuracy
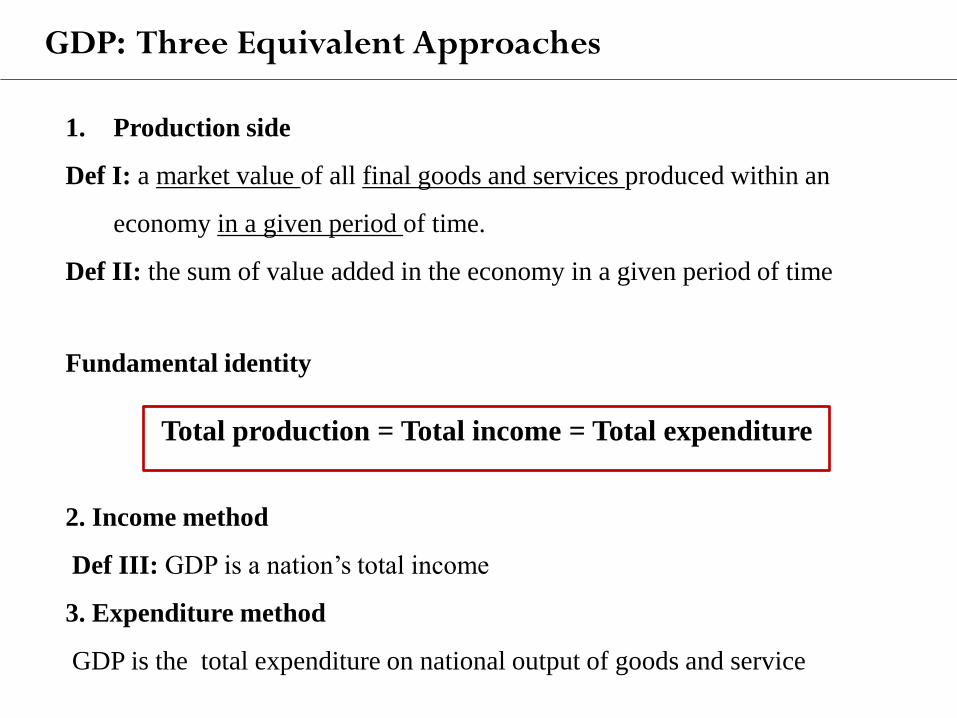
1. Production side
Def I: a market value of all final goods and services produced within an
economy in a given period of time.
Def II: the sum of value added in the economy in a given period of time
Fundamental identity
Total production = Total income = Total expenditure
2. Income method
Def III: GDP is a nation’s total income
3. Expenditure method
GDP is the total expenditure on national output of goods and service
GDP: Three Equivalent Approaches
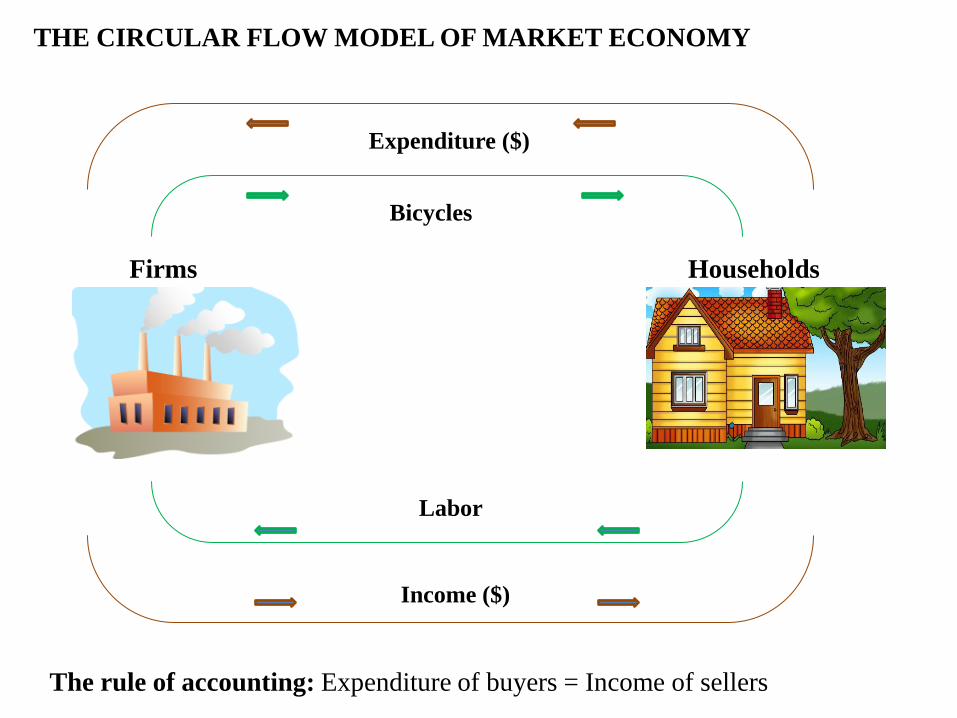
Firms Households
Labor
THE CIRCULAR FLOW MODEL OF MARKET ECONOMY
Bicycles
Expenditure ($)
Income ($)
The rule of accounting: Expenditure of buyers = Income of sellers
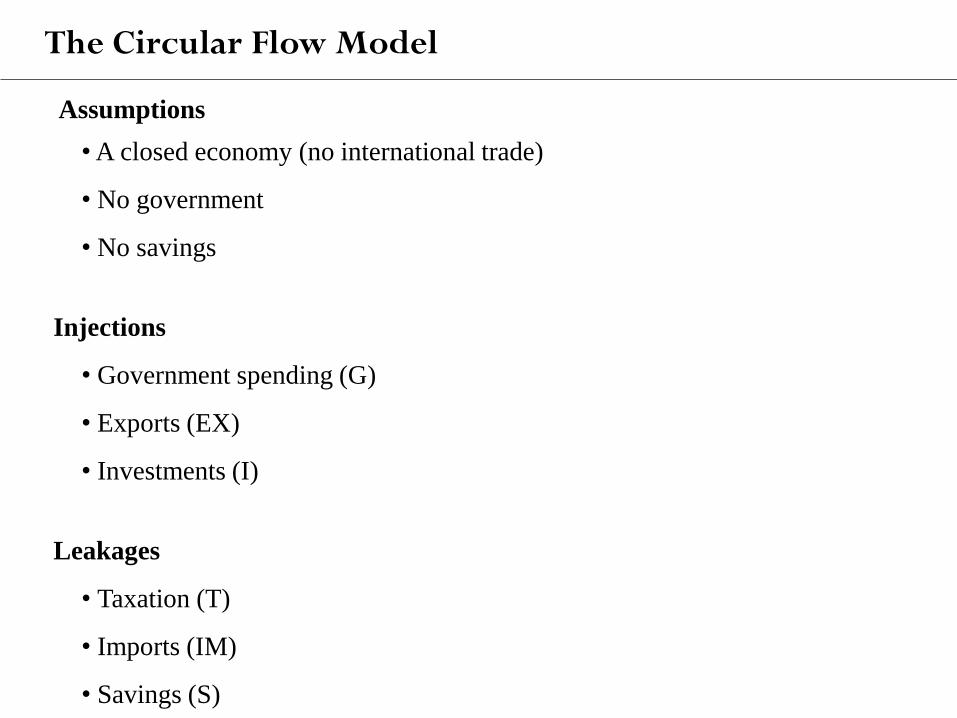
Assumptions
• A closed economy (no international trade)
• No government
• No savings
Injections
• Government spending (G)
• Exports (EX)
• Investments (I)
Leakages
• Taxation (T)
• Imports (IM)
• Savings (S)
The Circular Flow Model
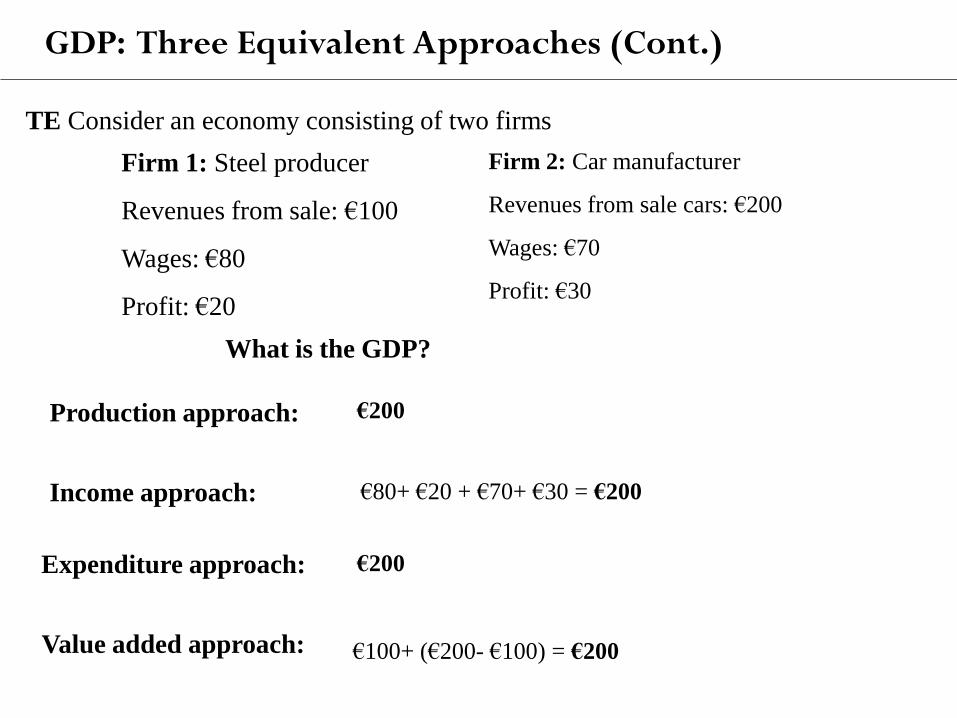
TE Consider an economy consisting of two firms
Firm 1: Steel producer
Revenues from sale: €100
Wages: €80
Profit: €20
What is the GDP?
Firm 2: Car manufacturer
Revenues from sale cars: €200
Wages: €70
Profit: €30
Production approach: €200
Income approach: €80+ €20 + €70+ €30 = €200
Expenditure approach: €200
Value added approach: €100+ (€200- €100) = €200
GDP: Three Equivalent Approaches (Cont.)
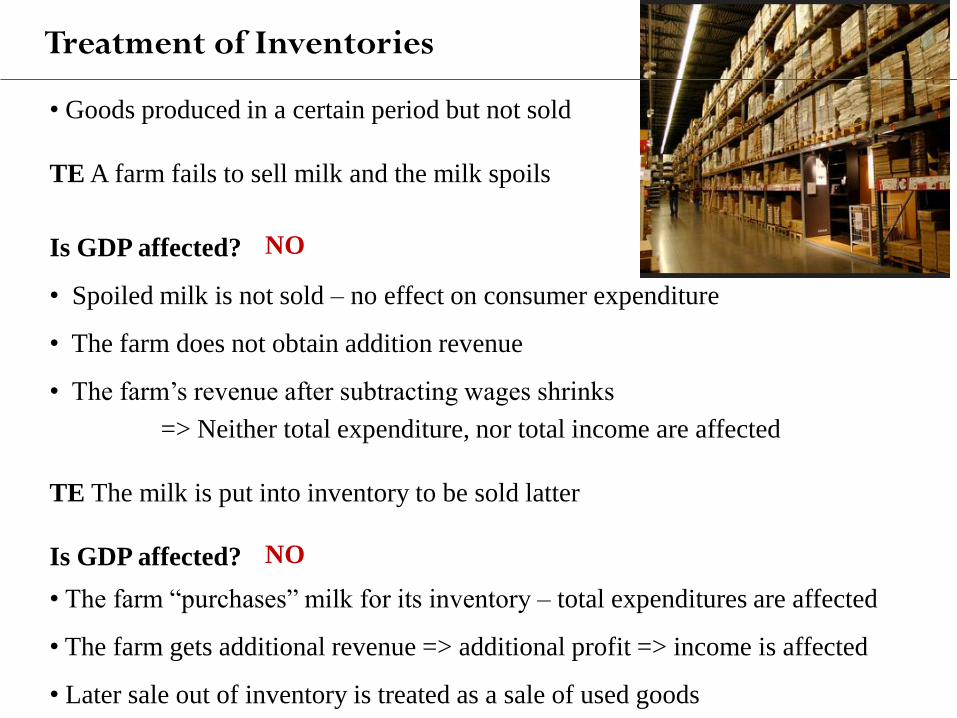
• Goods produced in a certain period but not sold
TE A farm fails to sell milk and the milk spoils
Is GDP affected?
• Spoiled milk is not sold – no effect on consumer expenditure
• The farm does not obtain addition revenue
• The farm’s revenue after subtracting wages shrinks
=> Neither total expenditure, nor total income are affected
TE The milk is put into inventory to be sold latter
Is GDP affected?
• The farm “purchases” milk for its inventory – total expenditures are affected
• The farm gets additional revenue => additional profit => income is affected
• Later sale out of inventory is treated as a sale of used goods
NO
NO
Treatment of Inventories
Housing services
• Home owners pay a “rent” to themselves
• Included in homeowner expenditures and income
Imputed rent: how much it would cost to rent out the owner’s dwelling unit
In the case of no imputations, what effect would the increase in house
ownership have on GDP?
Government services (Police officers, politician, etc.)
• Wages are used as a value of service
Services and Imputations
GDP would decline
GDP is a measure of aggregate output
Approaching from production or income side
Aggregate production = Aggregate income
THREE EQUIVALENT APPROACHES
GDP as the value of the final goods output
GDP as a sum of value added
GDP as a sum of income
•In a given period of time
•In a particular economy
Summary
0
500
1,000
1,500
2,000
2,500
3,000
3,500
4,000
4,500
1990 1992 1994 1996 1998 2000 2002 2004 2006 2008 2010
Bil
lio
ns
of
CZ
K
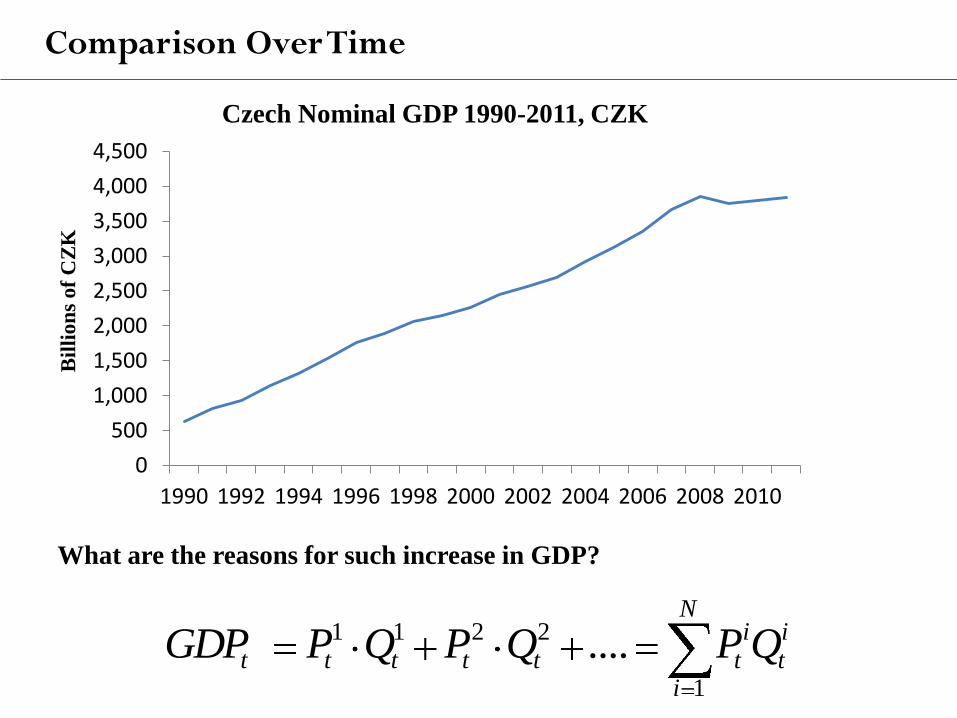
Czech Nominal GDP 1990-2011, CZK
What are the reasons for such increase in GDP?
1 1 2 2
1
....N
i i
t t t t t t ti
GDP P Q P Q P Q
Comparison Over Time
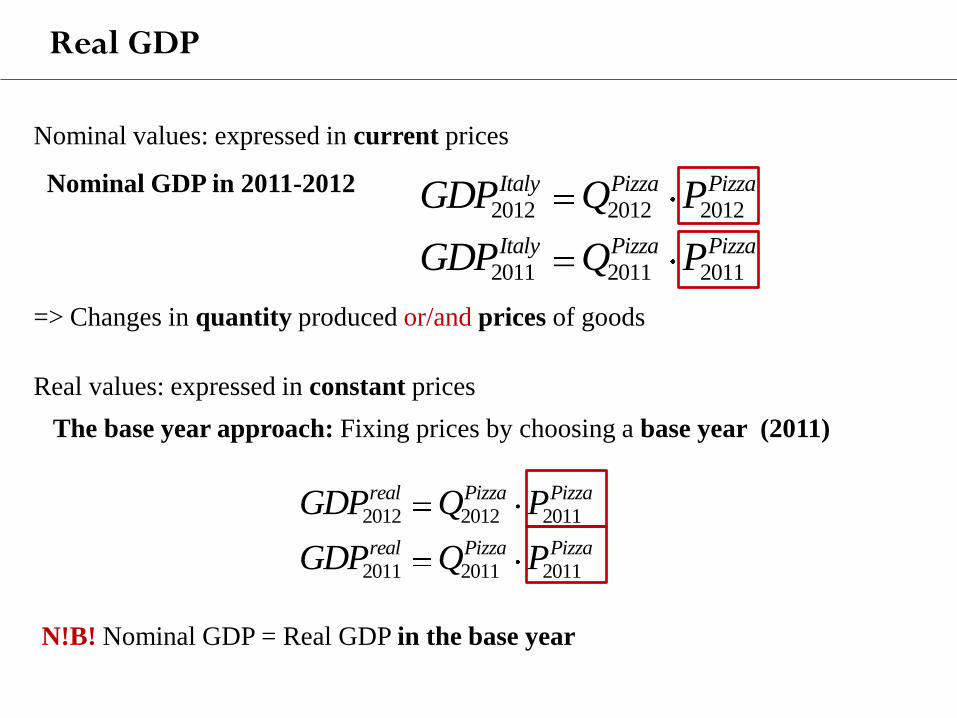
Nominal values: expressed in current prices
Nominal GDP in 2011-2012
=> Changes in quantity produced or/and prices of goods
2012 2012 2012
2011 2011 2011
Italy Pizza Pizza
Italy Pizza Pizza
GDP Q P
GDP Q P
2012 2012 2011
2011 2011 2011
real Pizza Pizza
real Pizza Pizza
GDP Q P
GDP Q P
Real values: expressed in constant prices
The base year approach: Fixing prices by choosing a base year (2011)
N!B! Nominal GDP = Real GDP in the base year
Real GDP
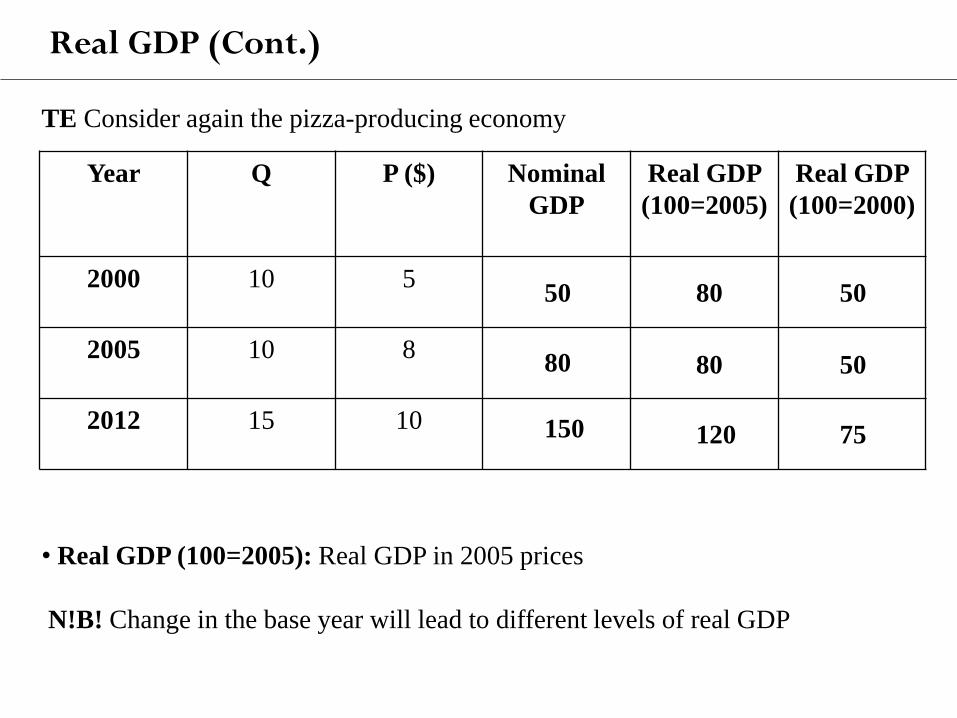
TE Consider again the pizza-producing economy
• Real GDP (100=2005): Real GDP in 2005 prices
N!B! Change in the base year will lead to different levels of real GDP
Year Q P ($) Nominal
GDP
Real GDP
(100=2005)
Real GDP
(100=2000)
2000 10 5
2005 10 8
2012 15 10
50
80
150
80
80
120
50
50
75
Real GDP (Cont.)
0
500
1,000
1,500
2,000
2,500
3,000
3,500
4,000
4,500
1990
1991
1992
1993
1994
1995
1996
1997
1998
1999
2000
2001
2002
2003
2004
2005
2006
2007
2008
2009
2010
2011
Bil
lion
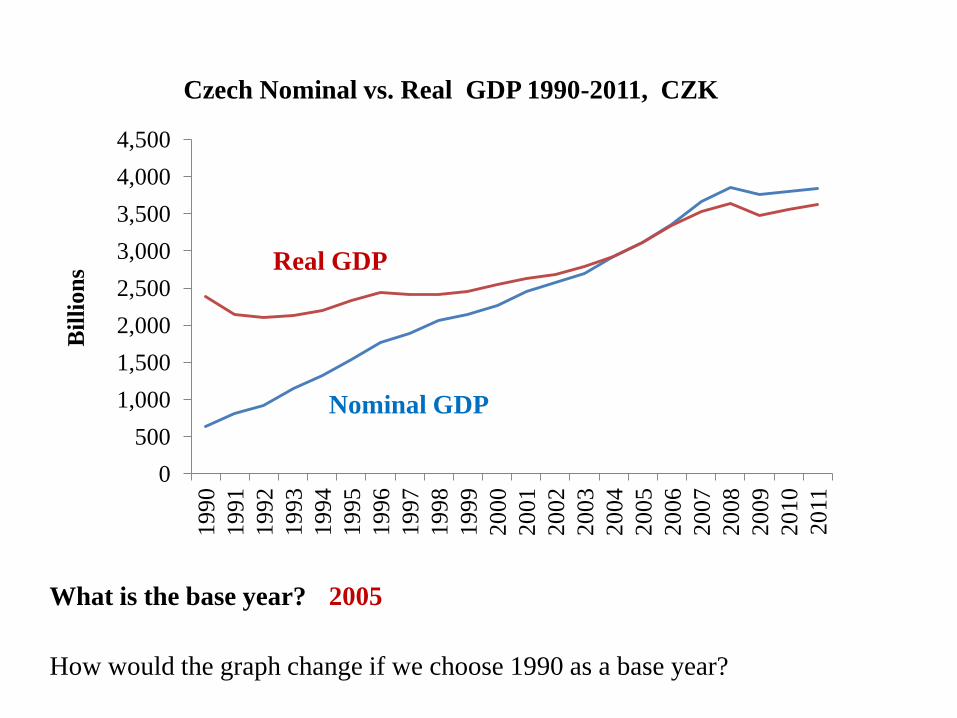
s Czech Nominal vs. Real GDP 1990-2011, CZK
Real GDP
Nominal GDP
What is the base year? 2005
How would the graph change if we choose 1990 as a base year?
0
5000
10000
15000
20000
25000
30000
35000
40000
45000
50000
Bill
ion
s o
f Yu
ans
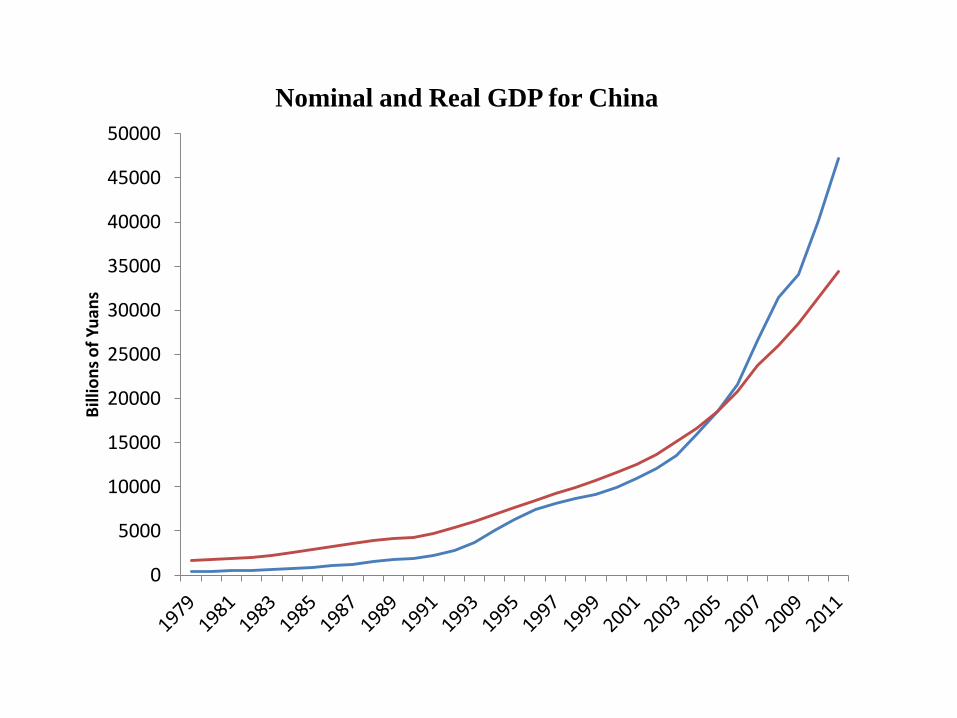
Nominal and Real GDP for China
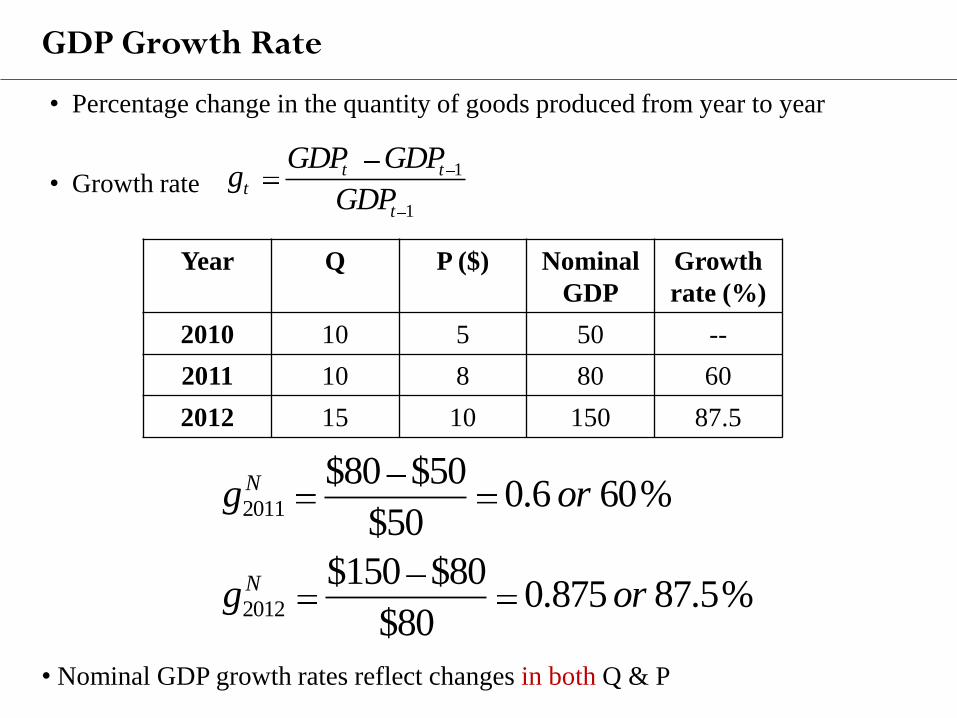
• Percentage change in the quantity of goods produced from year to year
• Growth rate
2011
2012
$80 $500.6 60%
$50
$150 $800.875 87.5%
$80
N
N
g or
g or
1
1
t tt
t
GDP GDPg
GDP
Year Q P ($) Nominal
GDP
Growth
rate (%)
2010 10 5 50 --
2011 10 8 80 60
2012 15 10 150 87.5
GDP Growth Rate
• Nominal GDP growth rates reflect changes in both Q & P
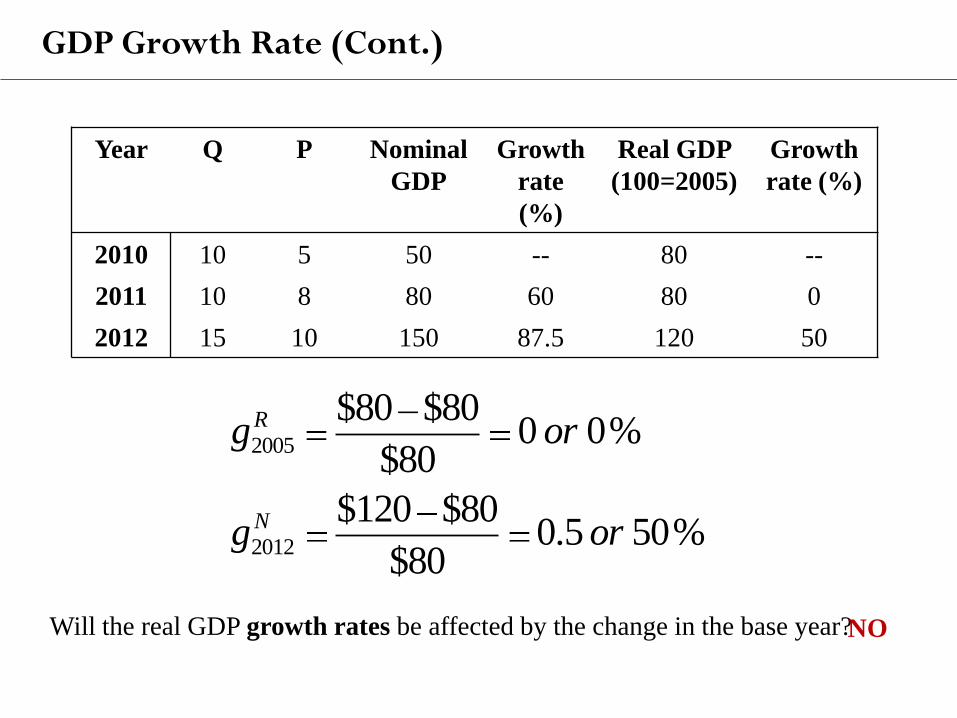
Year Q P Nominal
GDP
Growth
rate
(%)
Real GDP
(100=2005)
Growth
rate (%)
2010 10 5 50 -- 80 --
2011 10 8 80 60 80 0
2012 15 10 150 87.5 120 50
2005
2012
$80 $800 0%
$80
$120 $800.5 50%
$80
R
N
g or
g or
Will the real GDP growth rates be affected by the change in the base year?
GDP Growth Rate (Cont.)
NO
GDP Growth Rate (Cont.)
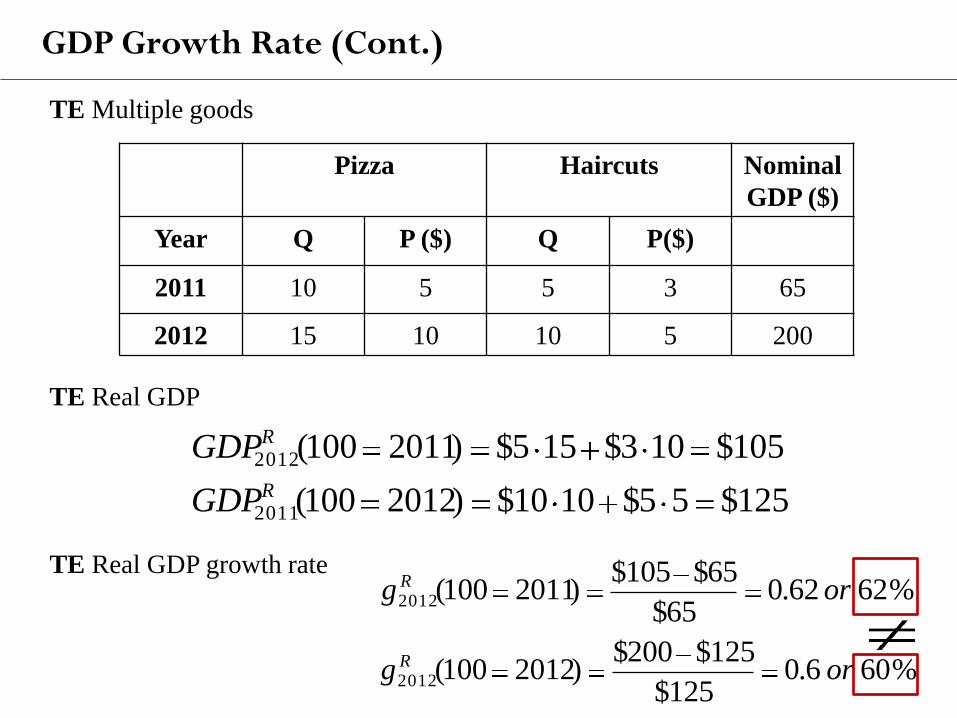
Pizza Haircuts Nominal
GDP ($)
Year Q P ($) Q P($)
2011 10 5 5 3 65
2012 15 10 10 5 200
TE Multiple goods
125$55$1010$)2012100(
105$103$155$)2011100(
2011
2012
R
R
GDP
GDP
TE Real GDP
%6262.065$
65$105$)2011100(2012 org R
TE Real GDP growth rate
%606.0125$
125$200$)2012100(2012 org R
Real GDP: The Chain-Weighted Approach
• Variety of goods of services
• Changes in relative prices of goods over time
The GDP growth rate is affected by the choice of the base year
What year to be used as the base year?
• A common practice, the base year is changed every 5 years
What are the consequences?
Solution: the chain-weighted approach
• Updates prices every year => more accurate
Real GDP: The Chain-Weighted Approach (Cont.)
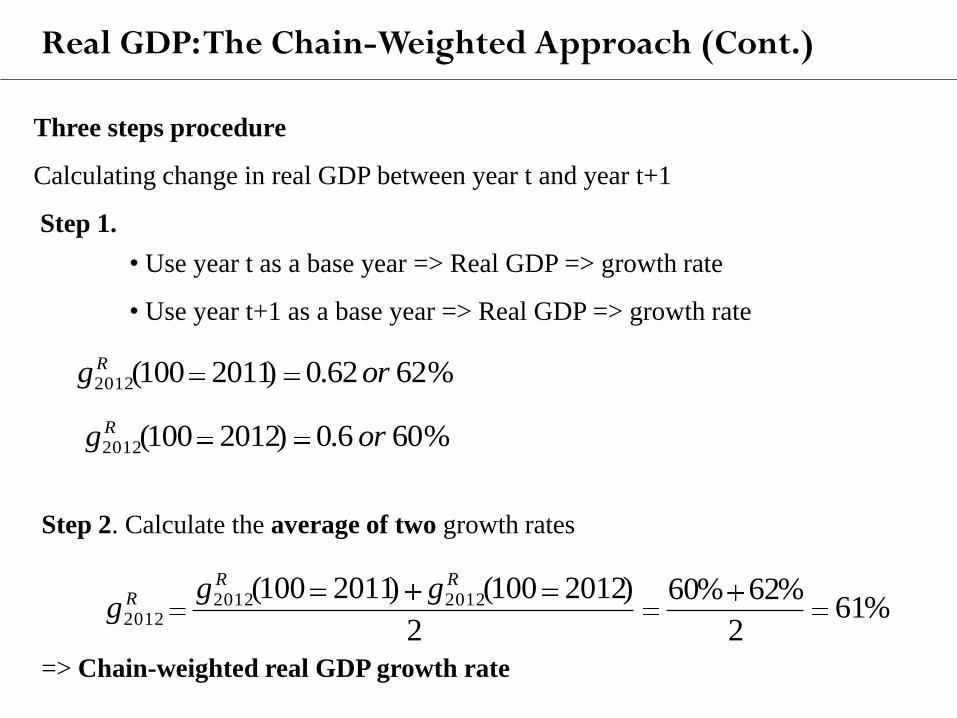
Three steps procedure
Calculating change in real GDP between year t and year t+1
Step 1.
• Use year t as a base year => Real GDP => growth rate
• Use year t+1 as a base year => Real GDP => growth rate
%6262.0)2011100(2012 orgR
%606.0)2012100(2012 orgR
Step 2. Calculate the average of two growth rates
=> Chain-weighted real GDP growth rate
%612
%62%60
2
)2012100()2011100( 201220122012
RRR gg
g
Real GDP: The Chain-Weighted Approach (Cont.)
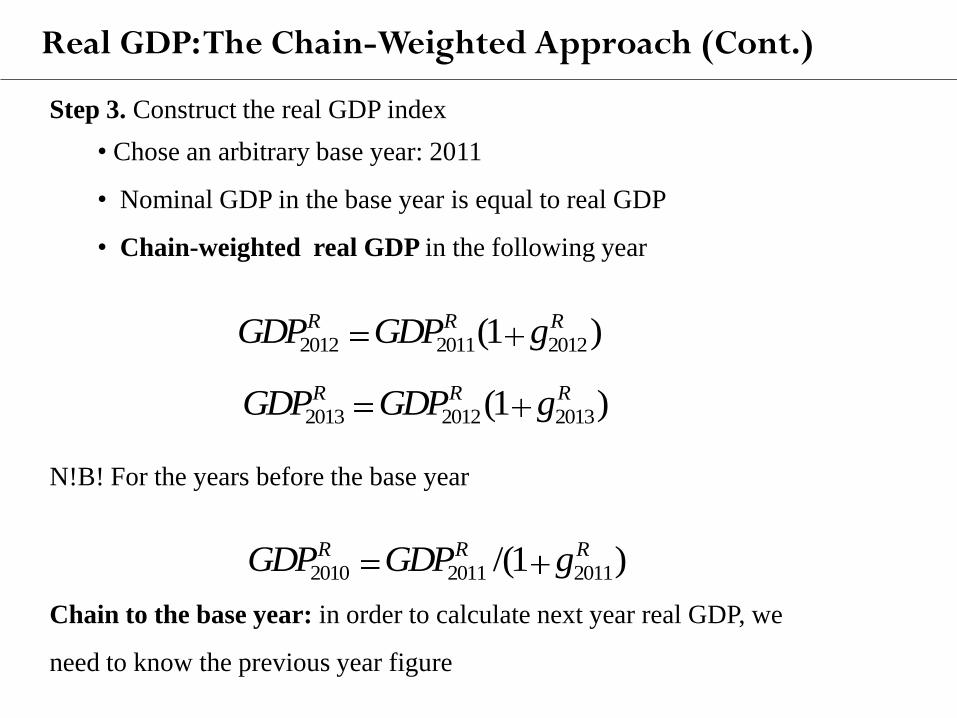
Step 3. Construct the real GDP index
• Chose an arbitrary base year: 2011
• Nominal GDP in the base year is equal to real GDP
• Chain-weighted real GDP in the following year
N!B! For the years before the base year
Chain to the base year: in order to calculate next year real GDP, we
need to know the previous year figure
2012 2011 2012(1 )R R RGDP GDP g
2013 2012 2013(1 )R R RGDP GDP g
2010 2011 2011/(1 )R R RGDP GDP g
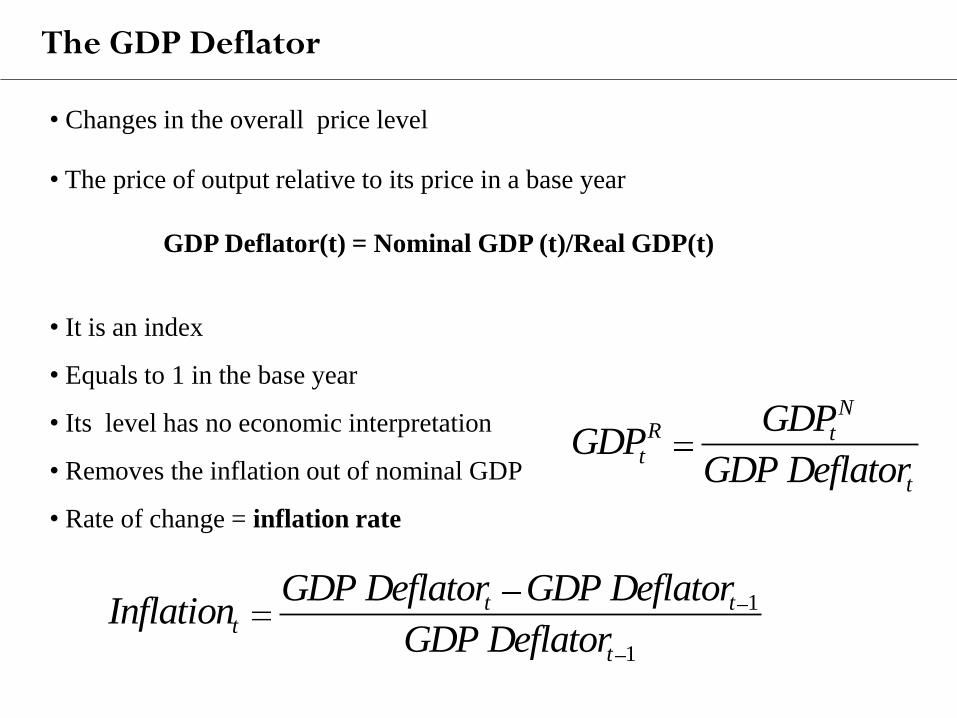
The GDP Deflator
• Changes in the overall price level
• The price of output relative to its price in a base year
GDP Deflator(t) = Nominal GDP (t)/Real GDP(t)
• It is an index
• Equals to 1 in the base year
• Its level has no economic interpretation
• Removes the inflation out of nominal GDP
• Rate of change = inflation rate
NR t
t
t
GDPGDP
GDP Deflator
1
1
t tt
t
GDP Deflator GDP DeflatorInflation
GDP Deflator
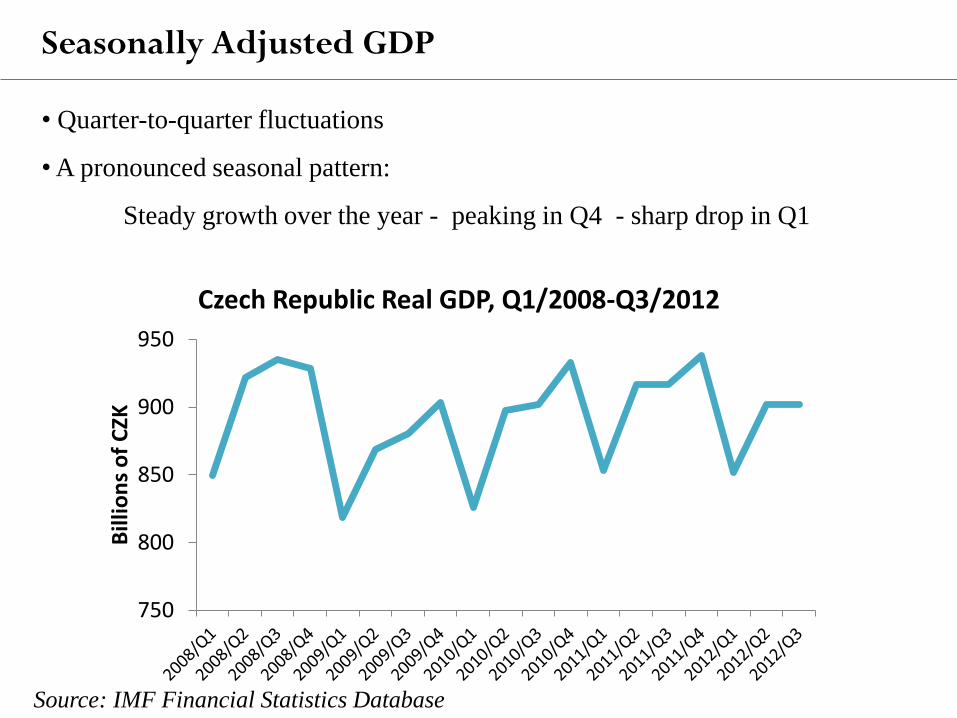
Seasonally Adjusted GDP
• Quarter-to-quarter fluctuations
• A pronounced seasonal pattern:
Steady growth over the year - peaking in Q4 - sharp drop in Q1
750
800
850
900
950
Bill
ion
s o
f C
ZK
Czech Republic Real GDP, Q1/2008-Q3/2012
Source: IMF Financial Statistics Database
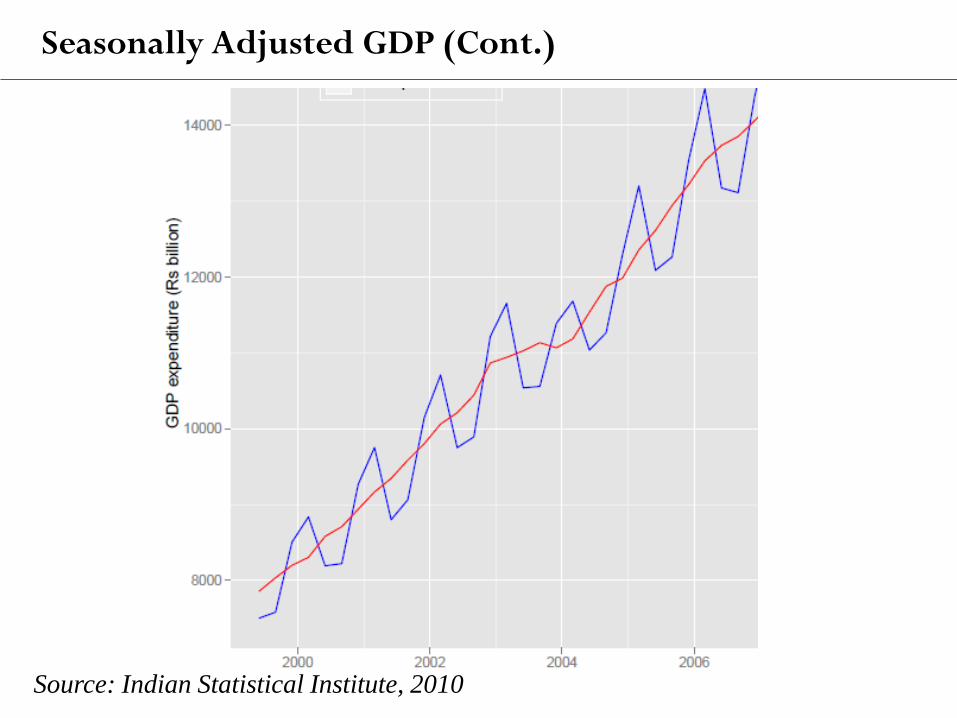
Seasonally Adjusted GDP (Cont.)
Source: Indian Statistical Institute, 2010
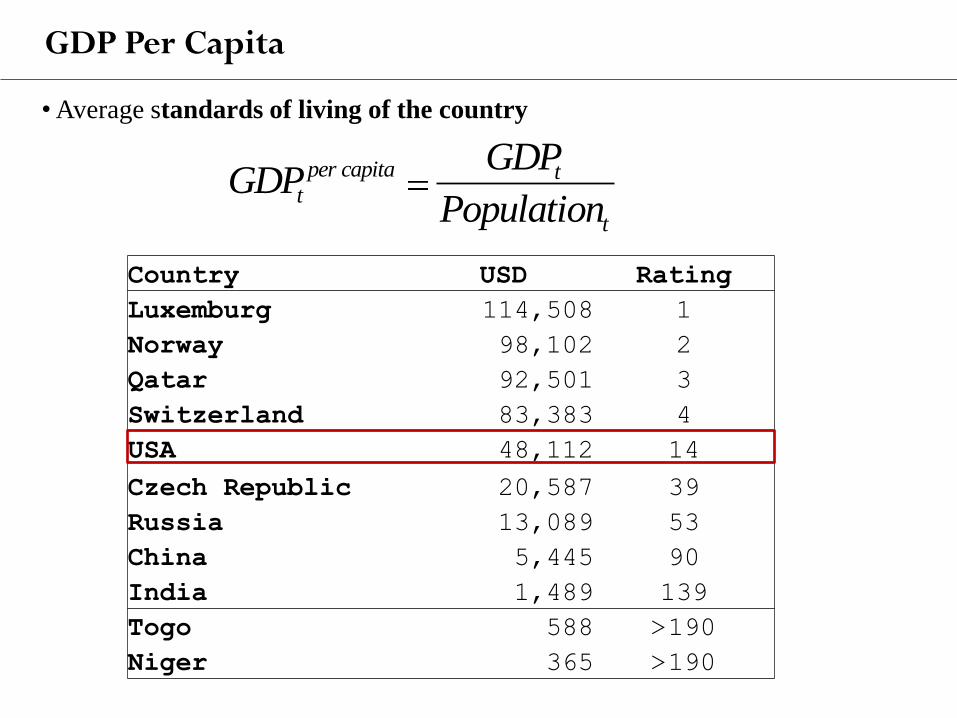
• Average standards of living of the country
Country USD Rating
Luxemburg 114,508 1
Norway 98,102 2
Qatar 92,501 3
Switzerland 83,383 4
USA 48,112 14
Czech Republic 20,587 39
Russia 13,089 53
China 5,445 90
India 1,489 139
Togo 588 >190
Niger 365 >190
per capita tt
t
GDPGDP
Population
GDP Per Capita
PPP Adjusted GDP
Comparing the standards of living (GDP per capita) across countries
• Converting GDP into common currency using currency exchange rates
Issues:
1. Variation of exchange rates
2. Difference in prices of basic goods
Solution: using a common set of prices which reflects the purchasing power
Purchasing power parity: The price of a typical basket of goods is equal
across countries being converted into the common currency
GDP as a Measure of Well-Being
GDP does not account for:
• Non-marker transactions
• Leisure
• Improved product quality
• Distribution of income
• Quality of environment
• Depletion of resources
Developed by Simon Kuznets in 1930 for BEA as a tool which allows to
monitor the effect of government policy
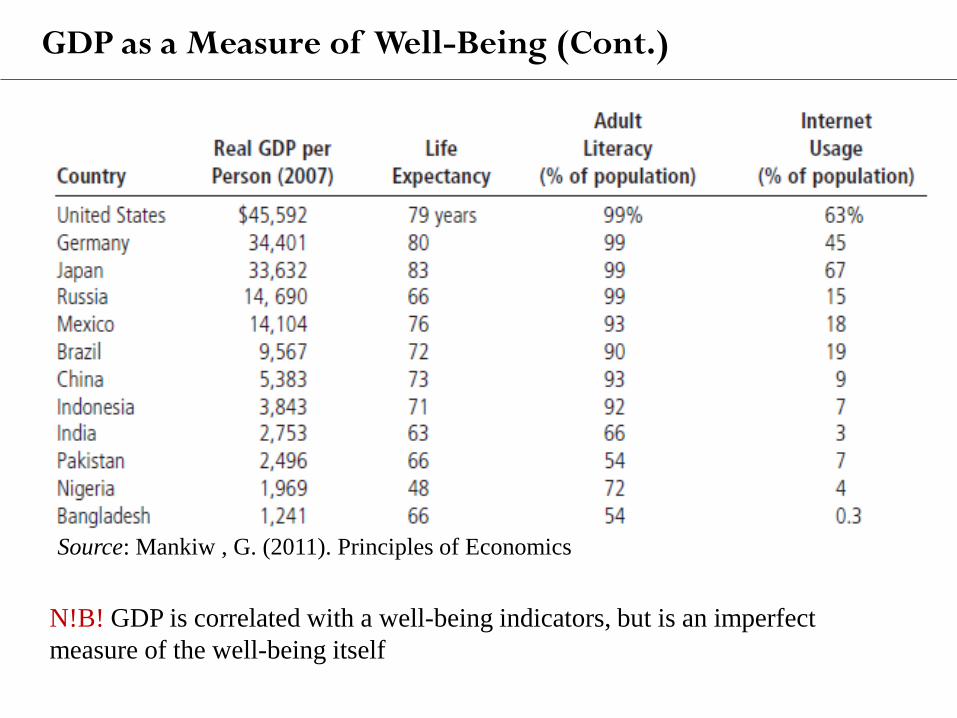
GDP as a Measure of Well-Being (Cont.)
Source: Mankiw , G. (2011). Principles of Economics
N!B! GDP is correlated with a well-being indicators, but is an imperfect
measure of the well-being itself
Czech Republic: Czech statistical office
Český statistický úřad (CSU)
www.czso.cz
Czech National Bank: Global Economics Outlook
USA
U.S. Bureau of Economic Analysis (BEA)
www.bea.gov
European Union
Directorate General on Economic and Financial Affairs of the European
Commission
http://ec.europa.eu/economy_finance/eu/index_en.htm
OECD
www.oecd.org
Data Sources
Next class: The National Accounts. Economic Growth