Embed Size (px)
Citation preview
Lec 10: FishI. Fish Research and Limnology
II. Taxonomy and Systematics
III. Species Richness
IV. Life History
V. Growth
VI. Fisheries and Yield
VII. Local Fisheries
1
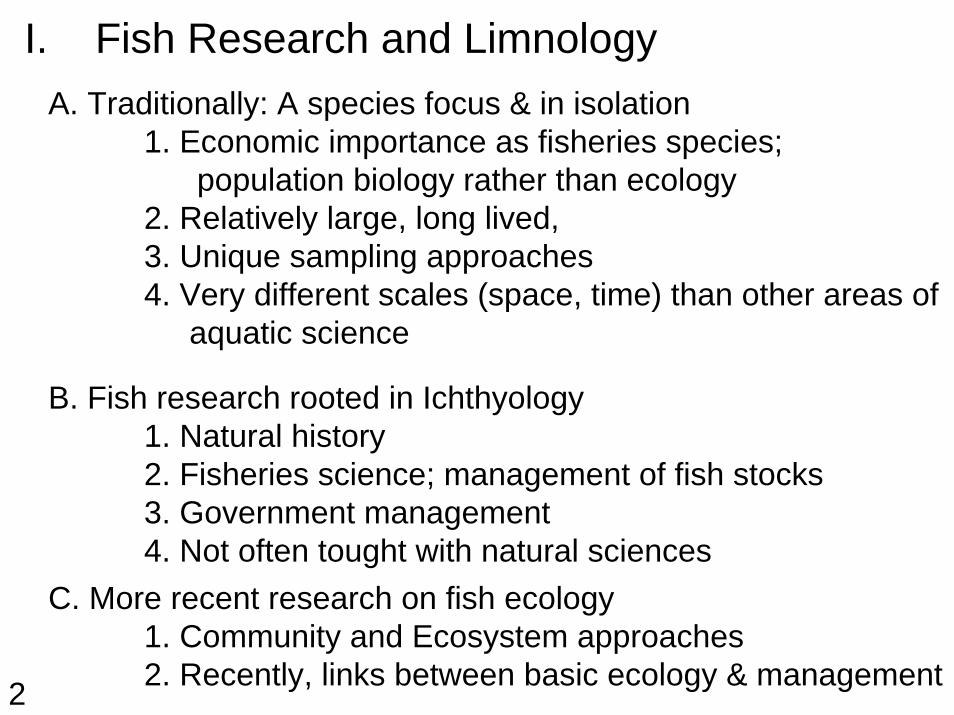
I. Fish Research and LimnologyA. Traditionally: A species focus & in isolation
1. Economic importance as fisheries species; population biology rather than ecology
2. Relatively large, long lived, 3. Unique sampling approaches4. Very different scales (space, time) than other areas of
aquatic science
B. Fish research rooted in Ichthyology1. Natural history2. Fisheries science; management of fish stocks3. Government management4. Not often tought with natural sciences
C. More recent research on fish ecology1. Community and Ecosystem approaches2. Recently, links between basic ecology & management2
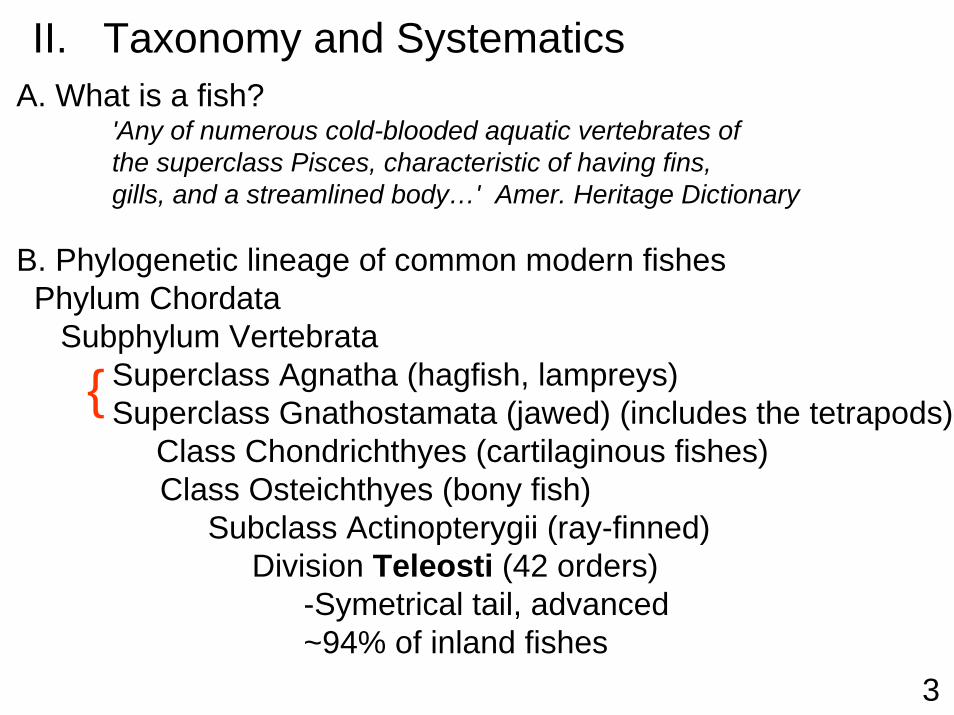
II. Taxonomy and SystematicsA. What is a fish?
'Any of numerous cold-blooded aquatic vertebrates of the superclass Pisces, characteristic of having fins, gills, and a streamlined body…' Amer. Heritage Dictionary
B. Phylogenetic lineage of common modern fishesPhylum Chordata
Subphylum VertebrataSuperclass Agnatha (hagfish, lampreys)Superclass Gnathostamata (jawed) (includes the tetrapods)
Class Chondrichthyes (cartilaginous fishes) Class Osteichthyes (bony fish)
Subclass Actinopterygii (ray-finned)Division Teleosti (42 orders)
-Symetrical tail, advanced~94% of inland fishes
{
3
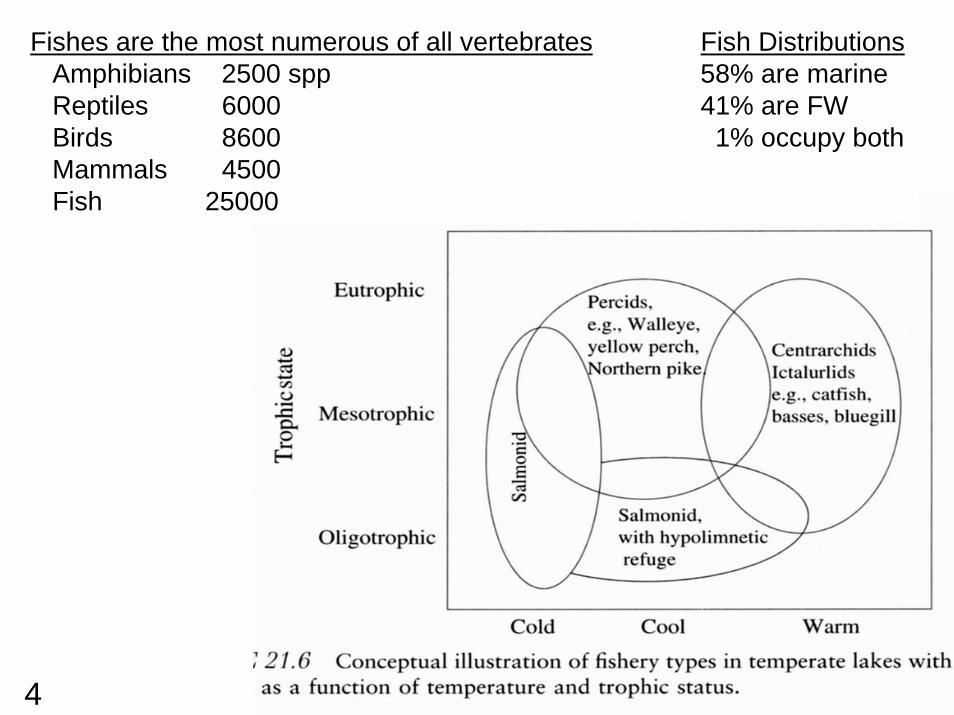
Fishes are the most numerous of all vertebrates Fish DistributionsAmphibians 2500 spp 58% are marine Reptiles 6000 41% are FWBirds 8600 1% occupy both Mammals 4500Fish 25000
4
4
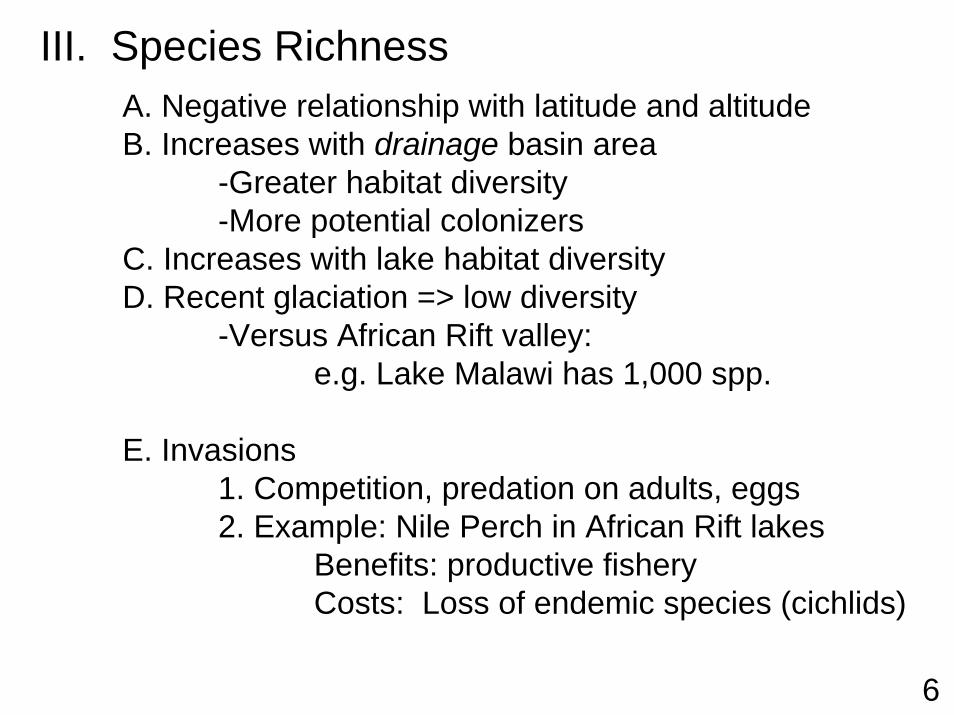
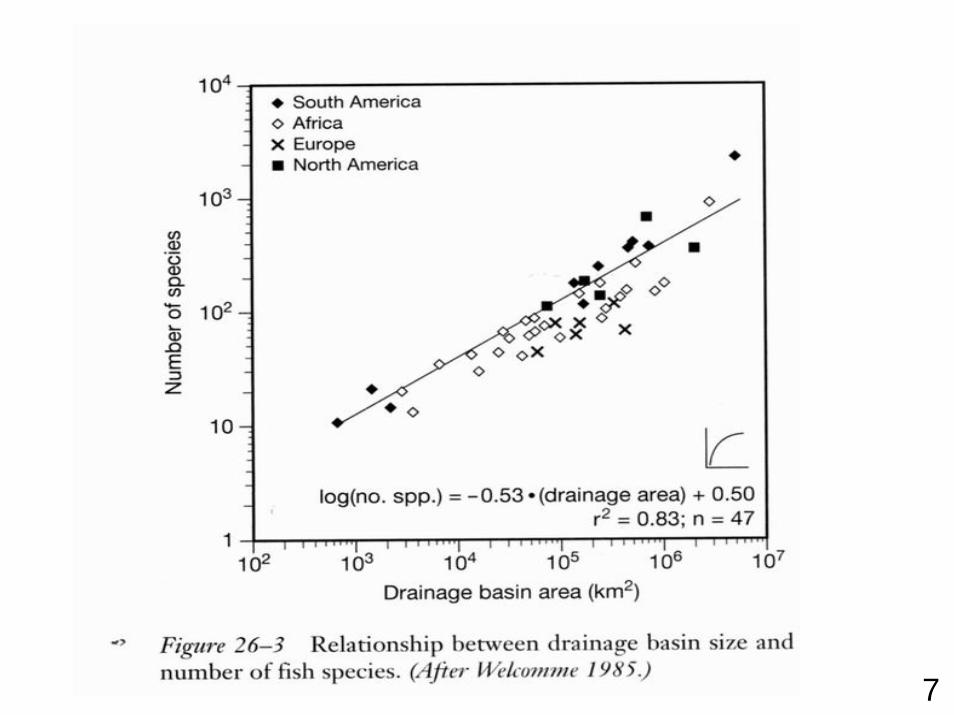
III. Species RichnessA. Negative relationship with latitude and altitudeB. Increases with drainage basin area
-Greater habitat diversity-More potential colonizers
C. Increases with lake habitat diversityD. Recent glaciation => low diversity
-Versus African Rift valley: e.g. Lake Malawi has 1,000 spp.
E. Invasions1. Competition, predation on adults, eggs2. Example: Nile Perch in African Rift lakes
Benefits: productive fisheryCosts: Loss of endemic species (cichlids)
6
7
IV. Life HistoryA. Reproductive diversity in fishes is enormous
1. Varies by: size at maturity, # eggs, egg size, reproductive season and timing, longevity, # clutches / female (year, life)
2. Although closely related species usually use similarspawning strategies, there is little general evolutionary trend from primitive to advanced groups.(large variation w/in diverse FW groups like cyprinids, percids)
B. Hypothesis: Selection for reproductive strategies that minimize the ratios of:
1. Energy expended for reproduction 2. Fitness of the genes passed to offspring (F1 => F2)
8
IV. Life HistoryC. Reproductive Effort - energy or time invested in reproduction
1. Assumed to be greater in females – choosya. Number of eggs (fecundity)b. Fecundity scales geometrically with sizec. Size of eggs (reproductive investment per individual)d. Trade-off between number and size of eggs
2. Male gametes assumed to be relatively inexpensive, reproductive effort is expended in : a. Courtshipb. Territorialityc. Parental care
9
IV. Life HistoryD. Frequency of Reproduction over lifetime
1. Semelparous -a. Spawn once in lifetime, putting eggs in one basketb. Catadromous species do this a lot
2. Iteroparousa. Spawn more than once over lifetimeb. Even out variance in reproductive success…..
but contribute a lot of energy to reproduction over lifetimec. Single, extended spawning season (fractional spawning)d. Multiple spawning seasons - long lived fishes
E. Spawning Migrations1. Hydrodynamic, trophic, reproductive needs met in
a given environment?2. May have to migrate if not: (sardines => whales)3. Diadromy: Catadromous & Anadromous 10
IV. Life HistoryF. Population Biology
1. Life history traits are extremely plastic in fishes 2. Survival of young more important than fecundity3. Extremely high juvenile mortality (starvation,
predation) limits recruitment to the population4. Recruitment is variable among age-classes & is
reflected in Cohort (or year-class) strength; the number of fish of a given age in a population
5. Small changes in larval and juvenile mortality can affect cohort strength
6. Rare to have several strong, consecutive year-classes
11
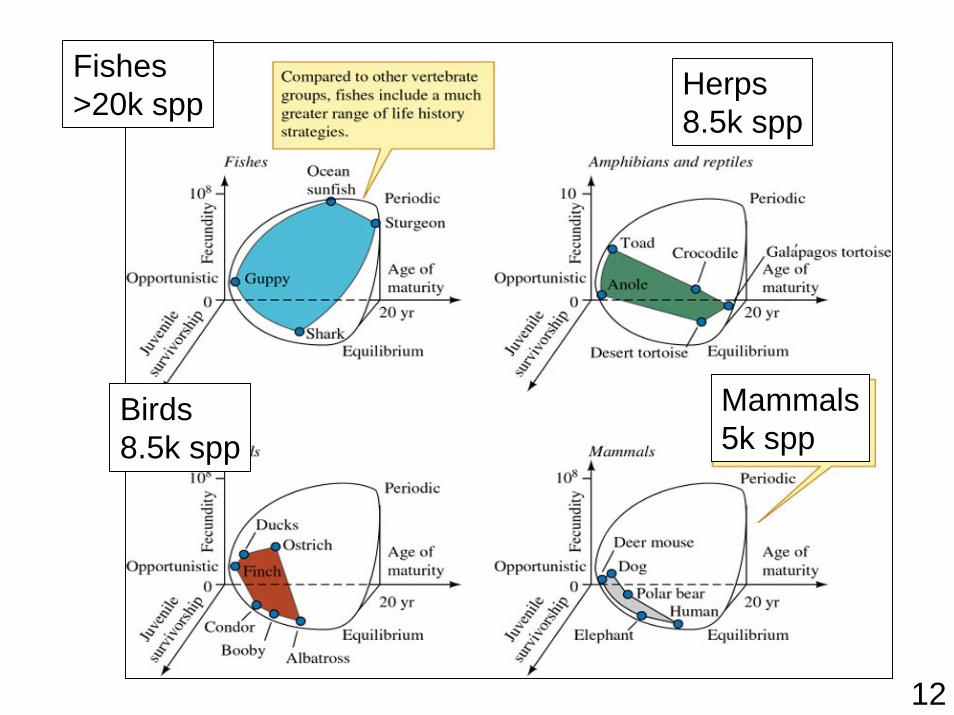
Fishes>20k spp Herps
8.5k spp
Birds8.5k spp
Mammals5k spp
12
V. GrowthA. Size of fish (state, world records)
1 cm Goby in the Phillipines (accounts for a 15,000 (dry)lb / yr fishery)
18m whale shark (eats plankton)
B. Why grow?1. Predation risk: Prob(predation) vs. size (-linear)
2. Fecudity: eggs/female vs. size (exponential)-small increase in size => large increase in fecundity
3. Natural mortality: Prob(death by nat. causes) vs. size (-linear)-less susceptible to lack of food in winter-small animals are more likely to die by starvation
4. Social rank-access to and defense of mates and nest sites 13
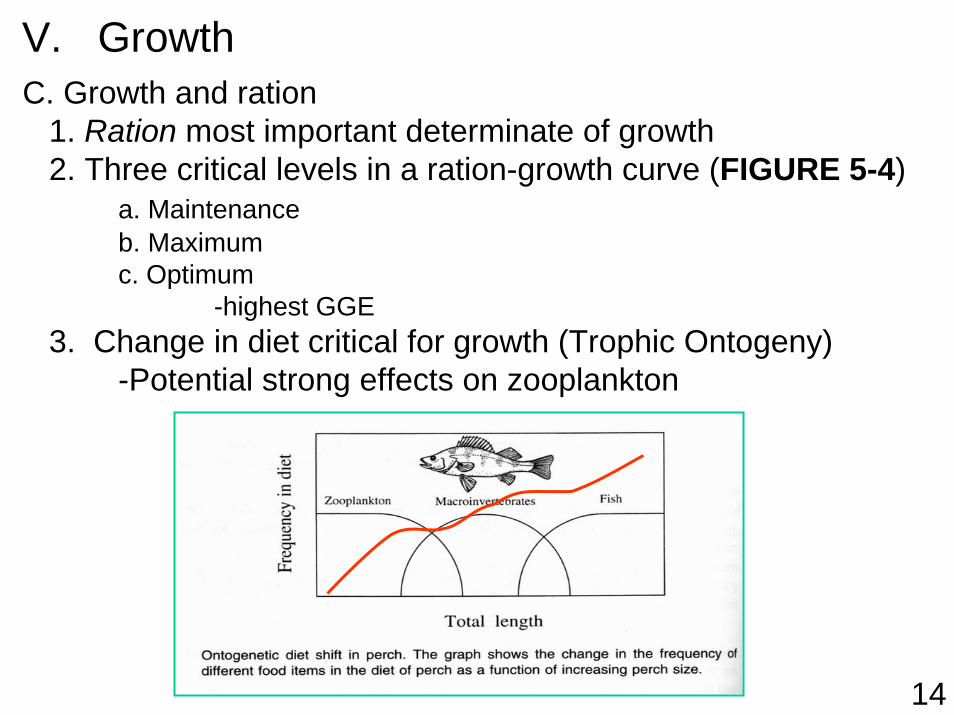
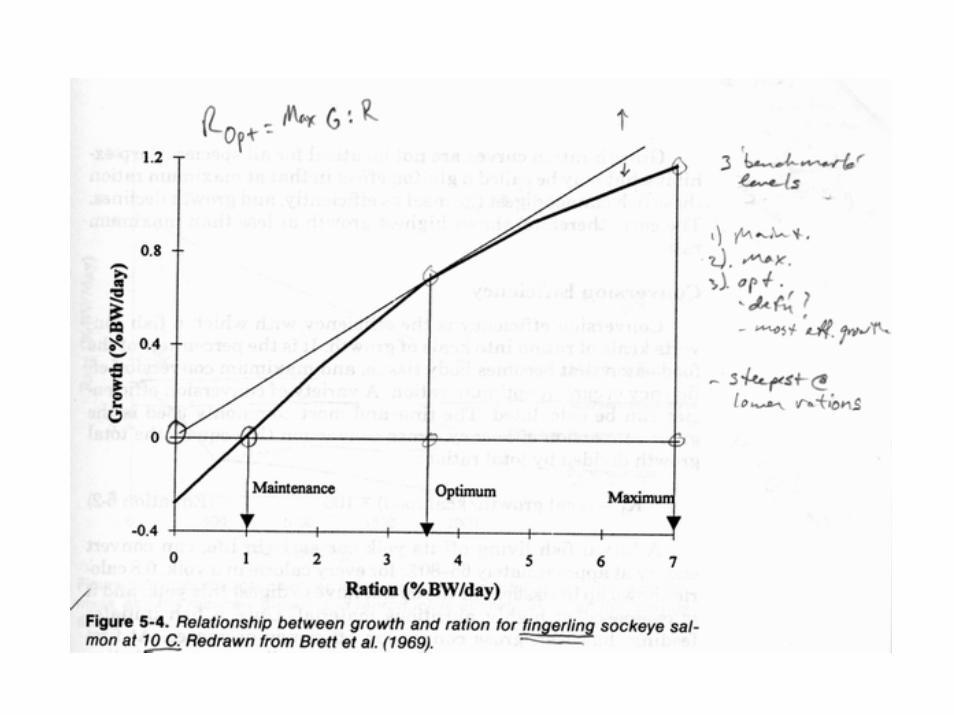
V. GrowthC. Growth and ration
1. Ration most important determinate of growth2. Three critical levels in a ration-growth curve (FIGURE 5-4)
a. Maintenanceb. Maximumc. Optimum
-highest GGE3. Change in diet critical for growth (Trophic Ontogeny)
-Potential strong effects on zooplankton
14
V. GrowthD. Determinate vs. Indeterminate Growth
1. Indeterminate growth in many fishes Why?Think about the forces affecting vertebrate morphology and anatomy in general
2. Birds & mammals vs. fish a. Determinate:
-grow rapidly to a relatively uniform, unchanging adult size
b. Indeterminate (most fishes)-age, size, maturity not fixed-mature at relatively small, but variable size,
then keep growing (or grow larger and die)
15
F. Why is determining fish growth rate so difficult?1. Can you rely on size or maturity?2. Habitat effect (food, temperature)3. Sampling biases and artifacts4. Growth of individuals or the population?
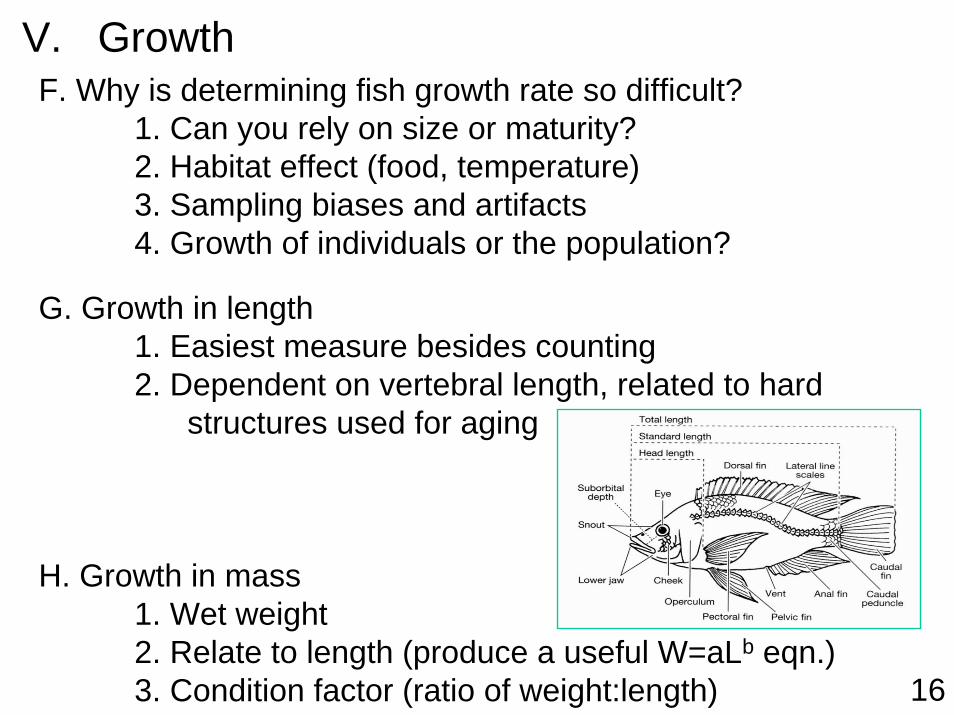
G. Growth in length1. Easiest measure besides counting 2. Dependent on vertebral length, related to hard
structures used for aging
H. Growth in mass1. Wet weight2. Relate to length (produce a useful W=aLb eqn.)3. Condition factor (ratio of weight:length)
V. Growth
16
I. Determining the age of fish1. General
-Need 'markers' of time-Seasonal growth rates in temperate lats.-Seasonal deposition of bone, scales-Hard structures reflect growth rates as annuli (influence of reprod?)
2. Structuresa. Scales
i. non lethal ii. circuli: like tree ringsiii. problems: false annuli, regenerated scales,
older fish, difficult to observeiv. cross-validation
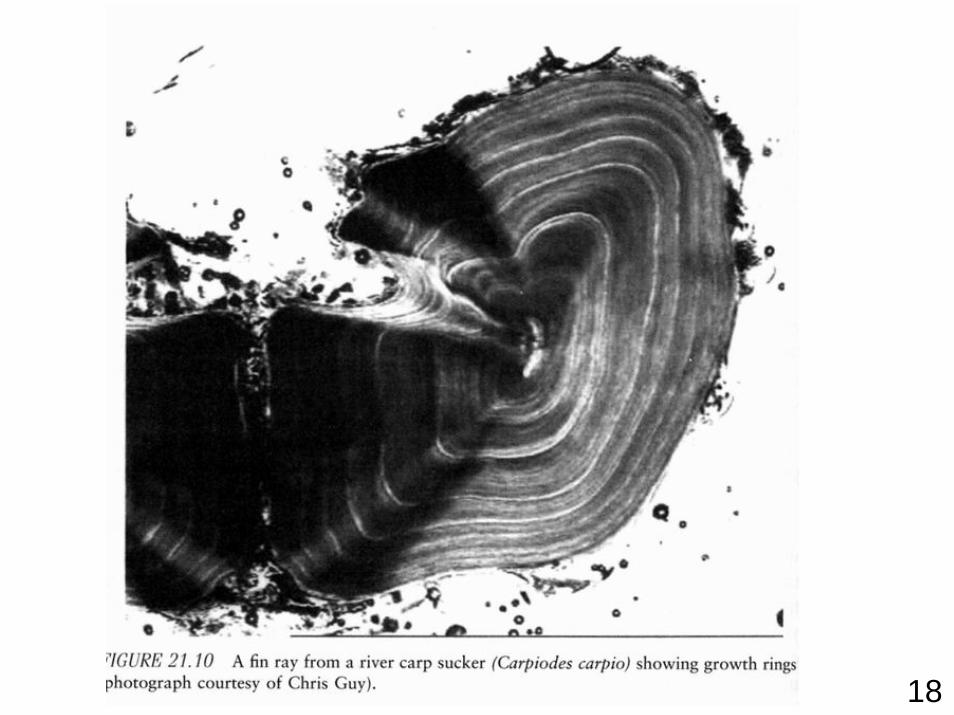
b. Bones (Otolith, Operculum)i. lethal except for fin raysii. annuli clearer than circuliiii. no regeneration, good for older individuals
V. Growth
17
18
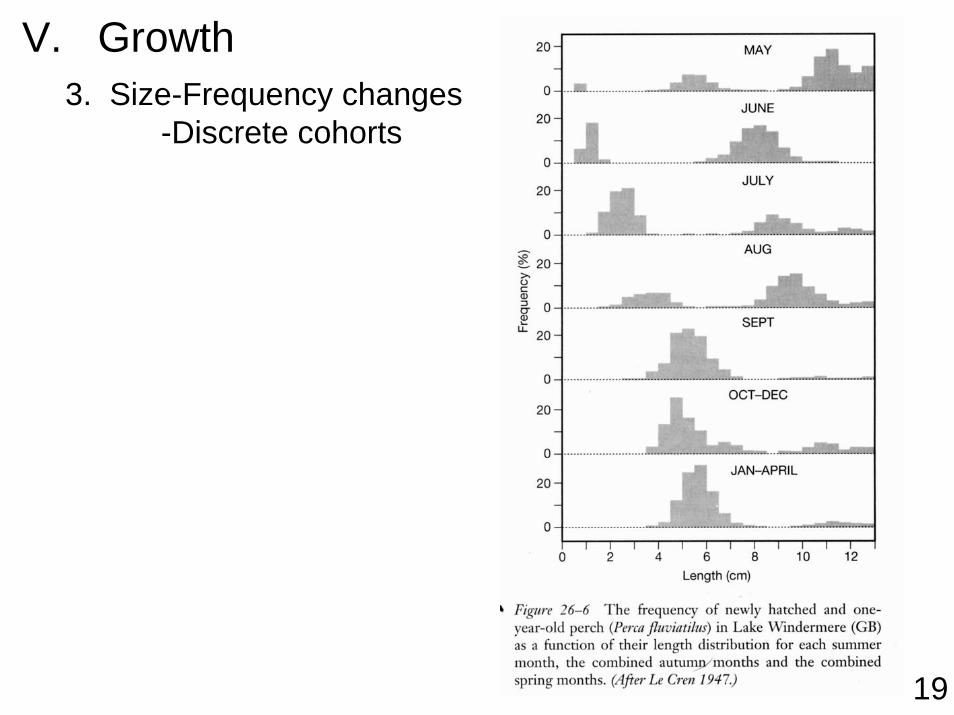
V. Growth3. Size-Frequency changes
-Discrete cohorts
19
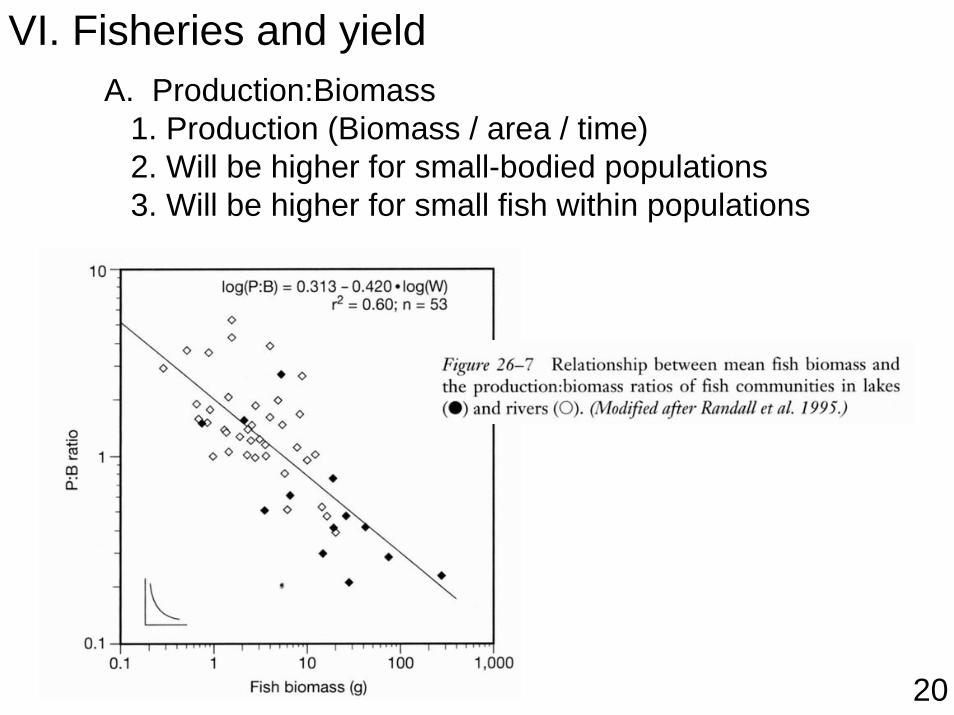
VI. Fisheries and yieldA. Production:Biomass
1. Production (Biomass / area / time)2. Will be higher for small-bodied populations3. Will be higher for small fish within populations
20
VI. Fisheries and yieldB. Management
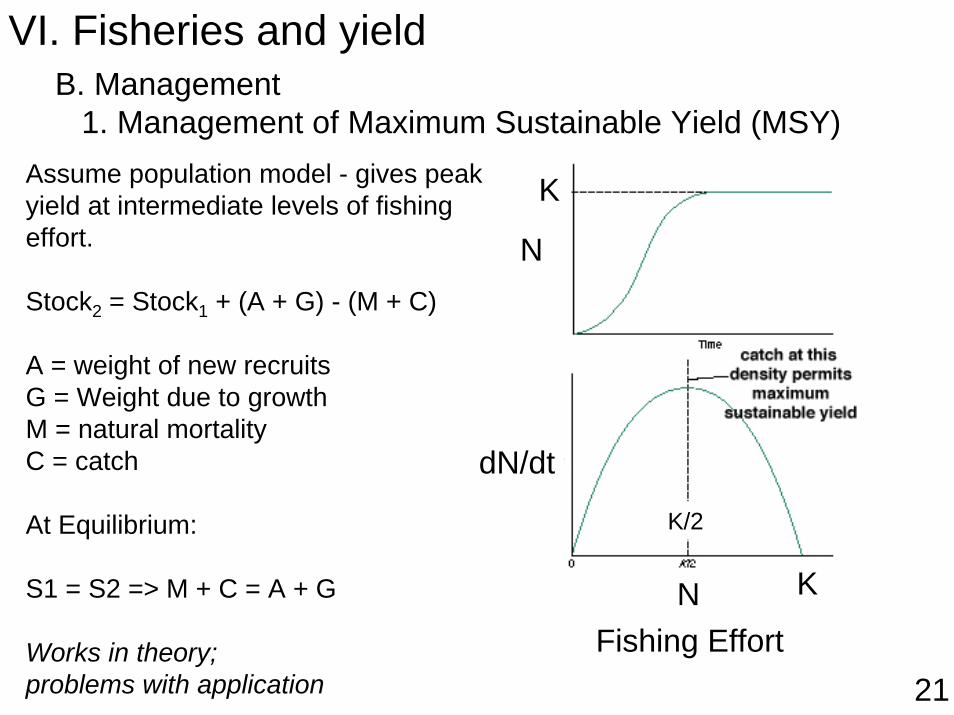
1. Management of Maximum Sustainable Yield (MSY)Assume population model - gives peak yield at intermediate levels of fishing effort.
Stock2 = Stock1 + (A + G) - (M + C)
A = weight of new recruitsG = Weight due to growthM = natural mortalityC = catch
At Equilibrium:
S1 = S2 => M + C = A + G
Works in theory; problems with application
Fishing Effort
dN/dt
KN
K/2
N
K
21
VI. Fisheries and yieldB. Management
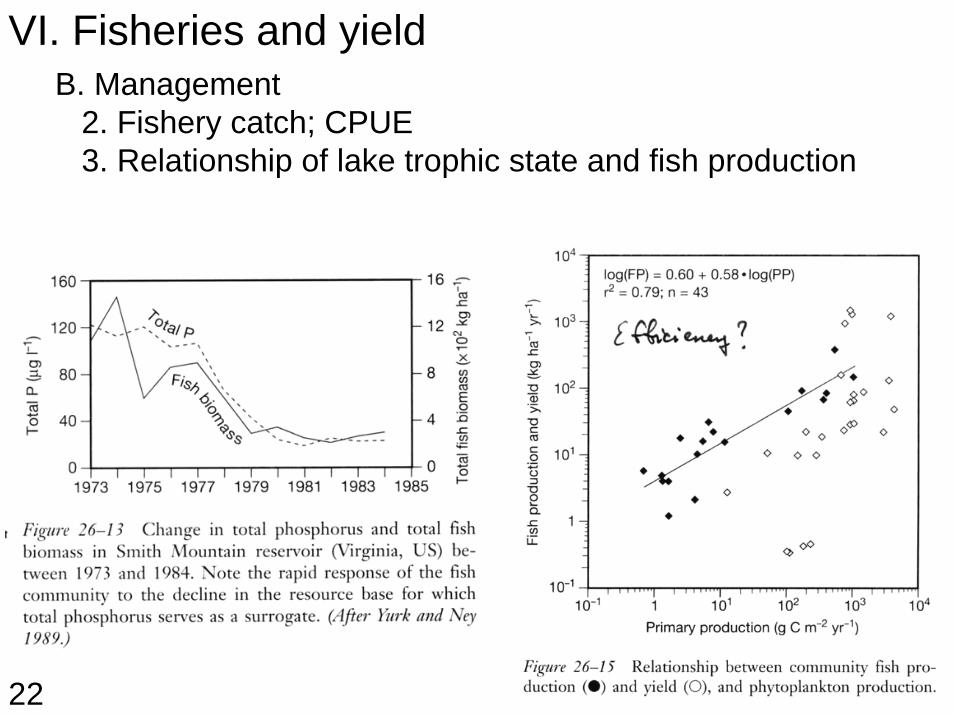
2. Fishery catch; CPUE3. Relationship of lake trophic state and fish production
22
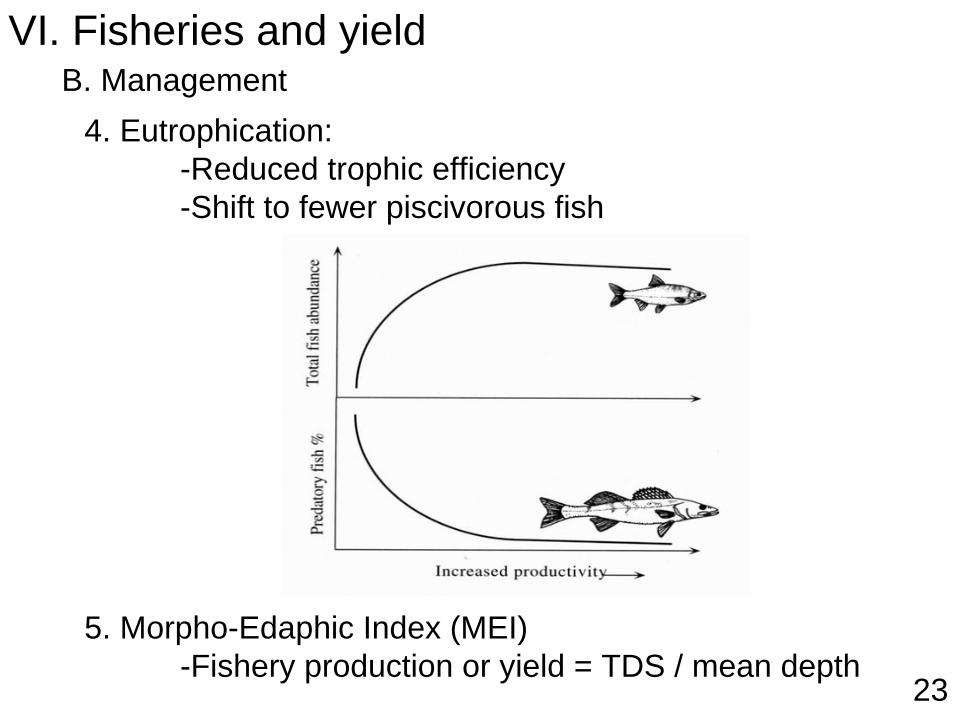
4. Eutrophication: -Reduced trophic efficiency-Shift to fewer piscivorous fish
5. Morpho-Edaphic Index (MEI)-Fishery production or yield = TDS / mean depth
VI. Fisheries and yieldB. Management
23