Embed Size (px)
Citation preview
Learning With Animation and Illusions of Understanding
Eugene S. Paik and Gregory SchrawUniversity of Nevada, Las Vegas
The illusion of understanding hypothesis asserts that, when people are learning with multimediapresentations, the addition of animation can affect metacognitive monitoring such that they perceive thepresentation to be easier to understand and develop more optimistic metacomprehension. As a result,learners invest less cognitive effort when learning with animation. This study tested the illusion ofunderstanding hypothesis with a randomized, double-blind, 2 � 2 factorial design using two differenttypes of animation—representational and directive. Representational animation had a negative effect onlearning, and directive animation had a positive effect. Both representational and directive animationsinduced illusion of understanding. Moreover, the animations induced multiple forms of the illusion.Consistent with expertise reversal effect, the animations induced more optimistic metacomprehension inlow-proficiency learners but more pessimistic metacomprehension in high-proficiency learners.
Keywords: animation, multimedia, metacognition, metacomprehension, expertise reversal effect
Supplemental materials: http://dx.doi.org/10.1037/a0030281.supp
Research shows that adding animation to multimedia presenta-tions can have negative as well as positive effects on learning(Betrancourt, 2005; Betrancourt & Tversky, 2000; Höffler & Leut-ner, 2007; Tversky & Morrison, 2002). Multimedia theorists havepostulated that animation can impede learning by perturbing meta-cognitive monitoring. In particular, animation can induce an illu-sion of understanding in which learners develop more optimisticmetacomprehension. As a result, learners reduce their cognitiveengagement when learning with animation (Betrancourt, 2005;Kühl, Scheiter, Gerjets, & Gemballa, 2011; Lewalter, 2003;Schnotz & Rasch, 2005).
Numerous studies have examined the effects of animation onlearning, but few have systematically examined the effects ofanimation on metacognitive processes during learning. The presentstudy fills this gap by examining claims made by the illusion ofunderstanding hypothesis and the accuracy of performance stan-dard hypothesis. This examination was conducted with two differ-ent types of animation—representational and directive. The resultspromote a clearer theoretical understanding of how animationaffects learning through its influence on metacognition.
Representational and Directive Animation
Representational animation and directive animation embodytwo distinct cognitive strategies for helping the learner. An ani-mation is said to be representational if it illustrates the content of
the presentation (Höffler & Leutner, 2007; Paik, 2009; Schnotz &Lowe, 2008). Typically, representational animations have beenused to depict the behavior of dynamic systems as they changeover time. For example, in this study representational animationwas used to show the movement of the parts in a flushing toilettank (see Figure 1). Although representational animations canexplicitly portrait the dynamic behavior of the system, such be-haviors can only be implied with static images (Betrancourt, 2005;Schnotz & Lowe, 2003, 2008). Therefore, with static images, thelearner must infer the system’s behavior. In the extreme case,representational animation can enable the learner to form a mentalvisualization of the system’s behavior that the learner is incapableof forming with only static images. Even when the learner iscapable of inferring the system’s behavior from static images,representational animation can facilitate the inferential processand, thereby, reduce cognitive demand (Schnotz & Lowe, 2008;Schnotz & Rasch, 2005).
An animation is said to be directive when it directs the viewer’sattention to a particular component or area of an image (Schnotz &Lowe, 2008). The concept of directive animation has had numer-ous labels in the literature including highlighting (Jeung, Chandler& Sweller, 1997), signaling (Kriz & Hegarty, 2007), and cuing (deKoning, Tabbers, Rikers, & Paas, 2009). Directive animations canbe implemented with a variety of techniques including flashing(i.e., quickly lightening and darkening an image area) or displayingan image area in different colors, as well as with animated peda-gogical agents (e.g., cartoon characters) that point to or look in thedirection of an image area (de Koning et al., 2009; Mayer, 2005;Moreno, 2005). Directive animations typically have been used tohelp the learner integrate aural and visual components of multi-media presentations. By synchronizing directive animation withrunning narration, directive animation can support the process ofsearching the image for the referents of the narration. In thismanner, directive animation can increase the cognitive efficiencyof visually identifying thematically salient components of an im-
This article was published Online First October 8, 2012.Eugene S. Paik and Gregory Schraw, Department of Educational Psy-
chology and Higher Education, University of Nevada, Las Vegas.The experiment presented in this article was conducted as part of Eugene
Paik’s doctoral dissertation at the University of Nevada, Las Vegas.Correspondence concerning this article should be addressed to Eugene
Paik, 1943 Sunset Village Circle, Henderson, NV 89014. E-mail:[email protected]
Thi
sdo
cum
ent
isco
pyri
ghte
dby
the
Am
eric
anPs
ycho
logi
cal
Ass
ocia
tion
oron
eof
itsal
lied
publ
ishe
rs.
Thi
sar
ticle
isin
tend
edso
lely
for
the
pers
onal
use
ofth
ein
divi
dual
user
and
isno
tto
bedi
ssem
inat
edbr
oadl
y.
Journal of Educational Psychology © 2012 American Psychological Association2013, Vol. 105, No. 2, 278–289 0022-0663/13/$12.00 DOI: 10.1037/a0030281
278
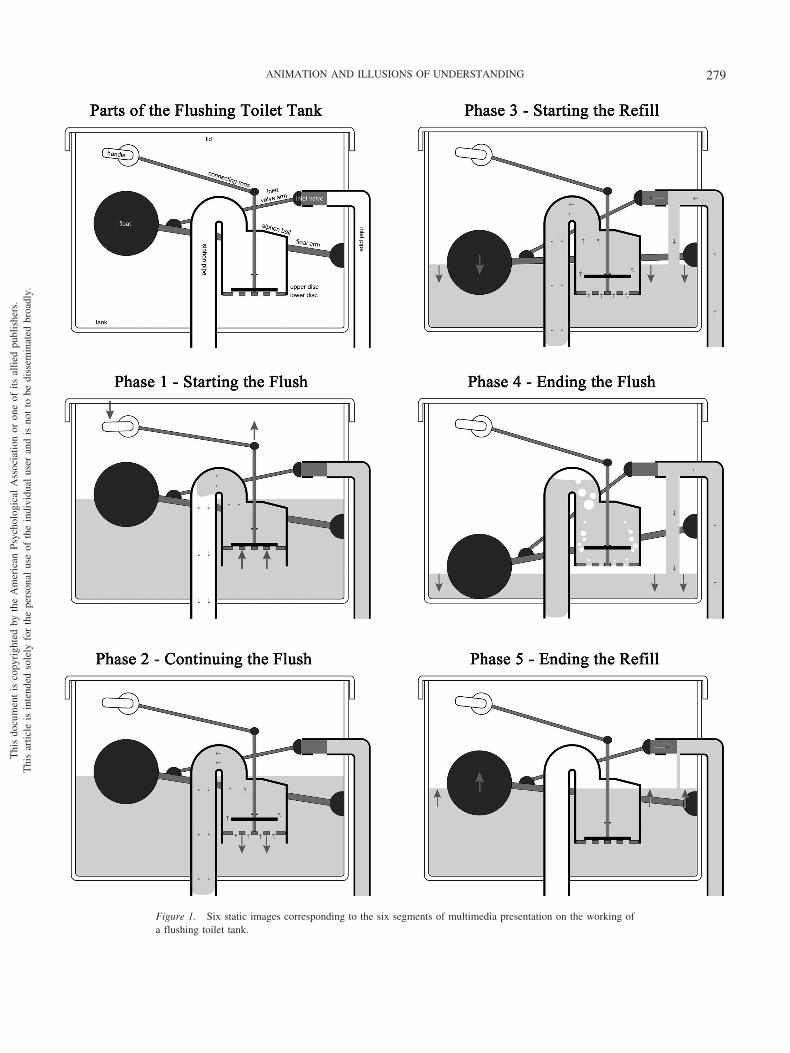
Figure 1. Six static images corresponding to the six segments of multimedia presentation on the working ofa flushing toilet tank.
Thi
sdo
cum
ent
isco
pyri
ghte
dby
the
Am
eric
anPs
ycho
logi
cal
Ass
ocia
tion
oron
eof
itsal
lied
publ
ishe
rs.
Thi
sar
ticle
isin
tend
edso
lely
for
the
pers
onal
use
ofth
ein
divi
dual
user
and
isno
tto
bedi
ssem
inat
edbr
oadl
y.
279ANIMATION AND ILLUSIONS OF UNDERSTANDING
age, thereby enhancing learning (Jeung et al., 1997; Schnotz &Lowe, 2008).
Illusion of Understanding
The addition of directive animation in multimedia presentationsgenerally has a positive effect on learning when the animationhelps the learner integrate aural and visual components of thepresentation (Höffler & Leutner, 2007). In contrast, the addition ofrepresentational animation in multimedia presentations can havenegative as well as positive effects on learning (Betrancourt, 2005;Betrancourt & Tversky, 2000; Höffler & Leutner, 2007; Tversky& Morrison, 2002). Multimedia theorists have proposed a numberof cognitive mechanisms by which representational animation mayimpede learning. For example, Hegarty, Kriz, and Cate (2003)provided some support for the idea that cognitive representation(i.e., the manner in which the behavior of dynamic systems isrepresented in the cognitive system) is more similar to series ofstatic images than to animations. Mayer, Hegarty, Mayer, andCampbell (2005) provided a plausible rationale for why germanecognitive processes are engendered more by static images than byrepresentational animations. Others argued that representationalanimation impedes learning because animations can negativelyimpact metacognition. That is, representational animations caninduce an illusion of understanding in learners (Betrancourt, 2005;Kühl et al., 2011; Lewalter, 2003; Schnotz & Rasch, 2005).
According to the illusion of understanding (IU) model, addinganimation to multimedia presentations can cause learners to over-estimate how easy it is to comprehend the presented material and,thereby, develop inflated metacomprehension. As a result, learnersinvest less cognitive resources to the learning task. This effect issimilar to the illusion of knowing phenomenon described in cali-bration research (Glenberg, Wilkinson, & Epstein, 1982; Serra &Metcalfe, 2009) in which learners overestimate the degree towhich they understand information presented in text. As a result,learners allocate less attention and fail to monitor with full vigi-lance due to inappropriate judgments of learning.
We define the IU hypothesis as three metacognitive assertions.These assertions are based on a view of self-regulation as adynamic cycle in which monitoring informs control processes thatfacilitate ongoing planning and implementation of strategies andsubsequent monitoring (Azevedo & Witherspoon, 2009; Efklides,2008; Nelson & Narens, 1990; Terricone, 2011; Winne, 2001).The judgment of difficulty (JOD) assertion states that, when peopleare learning about the behavior of dynamic systems with multi-media presentations, the addition of representational animationthat explicitly illustrates the system’s behavior causes them toperceive the presentation as being easier to learn (Betrancourt,2005; Salomon, 1984; Schnotz & Rasch, 2005, 2008). With rep-resentational animation, mentally visualizing the behavior of thesystem is essentially a perceptual exercise. In contrast, when thebehavior of the system is implied with static images, the learnermust expend cognitive resources to mentally animate the system.
The judgment of comprehension (JOC) assertion states that theaddition of representational animation causes learners to formmore optimistic metacomprehension (Schnotz & Rasch, 2005).The relative ease with which learners visually experience thesystem’s dynamic behavior with representational animation causesthem to inflate their judgment of how well they comprehend that
system. Serra and Metcalfe (2009) used the term fluency heuristicsto refer to an analogous relationship reported in text comprehen-sion research in which metacognitive judgments of task difficulty(e.g., retrieval fluency, ease of learning) influence judgments ofcomprehension. Also, Serra and Dunlosky (2010) reported thatbeliefs about the efficacy of multimedia formats influence learn-ers’ metacomprehension judgments.
The disengagement assertion states that the addition of repre-sentational animation causes learners to reduce their cognitiveengagement (Schnotz & Rasch, 2005). An inflated sense of com-prehension leads learners to conclude that less cognitive resourcesand effort are needed to sufficiently comprehend the presentedinformation.
Prior Studies
Two think-aloud studies (Kühl et al., 2011; Lewalter, 2003)provided some support for the IU hypothesis based on the fre-quency of comprehension and planning statements. First, in bothstudies animation learners uttered more positive comprehensionstatements than static image learners. Consistent with the JOCassertion, this difference may have resulted from animation learn-ers having developed an inflated sense of comprehension relativeto that of static image learners. Second, in the Lewalter study,animation learners uttered fewer planning statements than staticimage learners. Consistent with the disengagement assertion, thisdifference may indicate that animation learners invested less cog-nitive effort than static image learners in remediation.
Although the two findings described above may be consistentwith animation learners having experienced an illusion of under-standing, the overall pattern of data from Lewalter (2003) andKühl et al. (2011) is also consistent with an alternate explanation,that the differences in the frequency of comprehension and plan-ning statements were caused by differences in learning. Becausethe differences in learning between static image learners andanimation learners were statistically not significant in the twostudies, there is the possibility that animation had a positive effecton learning, but this effect was undetected due to lack of statisticalpower. If so, increased learning by animation learners may havebeen responsible for their higher frequency of comprehensionstatements and lower frequency of planning statements. Two ad-ditional findings in Kühl et al.’s study cast further doubt that theiranimation learners experienced an illusion of understanding. First,Kühl et al.’s animation learners uttered fewer erroneous statementsthan did static image learners, indicating that animation may haveimproved comprehension. Second, no significant differences injudgment of difficulty or mental effort were detected betweenanimation and static image learners. Taken together, the results ofthe Lewalter study and the Kühl et al. study do not provideconclusive evidence that animation had induced illusion of under-standing.
Accuracy of Performance Standard
The IU hypothesis explicates a metacognitive process by whichrepresentational animation may impede learning. We now intro-duce a metacognitive process by which representational animationmay enhance learning. We generated the accuracy of performancestandard (APS) hypothesis because it constitutes a plausible andtheoretically important counterargument to the IU hypothesis.
Thi
sdo
cum
ent
isco
pyri
ghte
dby
the
Am
eric
anPs
ycho
logi
cal
Ass
ocia
tion
oron
eof
itsal
lied
publ
ishe
rs.
Thi
sar
ticle
isin
tend
edso
lely
for
the
pers
onal
use
ofth
ein
divi
dual
user
and
isno
tto
bedi
ssem
inat
edbr
oadl
y.
280 PAIK AND SCHRAW
According to the APS hypothesis, when the behavior of adynamic system is explicitly illustrated with representational ani-mation, the learner has access to a more reliable standard inmemory (i.e., mental representation) by which to evaluate his orher comprehension. In contrast, when the behavior of dynamicsystems is presented as a set of static images, the learner’s meta-comprehension must depend on the behavior of the system that thelearner infers. These inferences may be inaccurate or incomplete.Therefore, the APS hypothesis asserts that, when people are learn-ing about the behavior of dynamic systems with multimedia pre-sentations, the addition of representational animation that explic-itly illustrates the system’s behavior causes them to generate moreaccurate JOC. This accuracy assertion has significant ramifica-tions for the efficiency of the self-regulatory system becauselearners are better able to plan, select strategies, and allocateresources (Azevedo & Witherspoon, 2009; Nelson & Narens,1990; Terricone, 2011; Tobias & Everson, 2009; Winne, 2001).Serra and Metcalfe (2009) referred to this sequence as theaccuracy–control link by which accurate monitoring enhancescontrol, which enhances self-regulation.
Present Study
This study tested the assertions of the IU and the APS hypoth-esis with both representational animation and directive animation.The experiment had four treatment conditions: static (i.e., noanimation); representational animation only; directive animationonly; and both representational and directive animations. Follow-ing the precedent of Mayer et al. (2005), two types of learningoutcomes were measured. A retention test asked the participants torecall information explicitly provided in a multimedia presenta-tion. A transfer test asked the participants to solve diagnostic andprognostic problems.
Judgment of difficulty (JOD), judgment of comprehension(JOC), and judgment of visualization (JOV) were used as depen-dent variables to test the assertions of the IU and APS hypotheses.JOD was estimated by asking the participants to characterize theirlearning experience (e.g., “How difficult was it to learn about theflushing toilet tank from the presentation?”) and the multimediapresentation (e.g., “How would you rate the quality of the presen-tation that you just saw?”). JOC was estimated by asking theparticipants to predict their learning outcome. After the treatmentwas administered, the participants were asked to estimate how theywould perform on a number of different problems. As these werethe problems in the instruments used to measure their learningoutcome (i.e., the retention test and the transfer test), the partici-pants were effectively predicting their learning outcome. JOV wasmeasured by asking the participants to mentally visualize thebehavior of the flushing toilet tank that they had learned aboutduring the treatment. They were then asked to characterize thequality of their visualization experience in terms of difficulty,accuracy, and level of detail.
The analysis utilized two covariates: spatial ability and priorknowledge. Prior studies showed that spatial ability and imagetype (e.g., animation vs. statistic images) can have interactionaleffects on learning (Höffler & Leutner, 2007). Prior knowledgehad been shown to affect learning in general (Kalyuga, Ayres,Chandler, & Sweller, 2003).
Predictions
We did not include predictions of learning outcome because anumber of potential cognitive mechanisms have been hypothesizedby which animation may influence learning. As yet, however, thereis an absence of a unifying framework that describes (a) theconditions under which each of these mechanisms become acti-vated and (b) how the activated processes are integrated to producethe learning outcome. Indeed, one of our goals for this study wasto contribute to the theoretical advancement with regard to (a).
The JOD assertion of the IU hypothesis was tested with the nullhypothesis that representational animation learners would producelower JOD (i.e., find the presentation easier) than no representa-tional animation learners. The JOC assertion of the IU hypothesiswas tested with the null hypothesis that representational animationlearners would produce higher JOC (i.e., form more optimisticmetacomprehension) than no representational animation learners.The disengagement assertion of the IU hypothesis was testedtangentially with JOV. According to the disengagement assertion,representational animation learners invest less cognitive resourcesand effort than no representational animation learners when learn-ing about the behavior of a dynamic system. One cognitive activitythat representational animation learners are less likely to engage inis mentally simulating the behavior of the system (Schnotz &Rasch, 2005). If so, then representational animation learners willhave more difficulty mentally visualizing the system after thelearning phase because they had less practice mentally visualizingthe system during learning. Hence, the disengagement assertionwas tested with the null hypothesis that representational animationlearners would produce lower JOV (i.e., poorer quality of visual-ization) than no representational animation learners. The accuracyassertion of the APS hypothesis was tested with the null hypothesisthat representational animation learners would generate more ac-curate JOC than no representational animation learners.
The predictions derived from the IU and APS hypotheses areapplicable only to representational animation. They are not appli-cable to directive animation because the assertions of the hypoth-eses do not rely on the concept of directive animation. They do,however, rely on the concept of representational animation. Nev-ertheless, directive animation was included in the present study totest the hypothesized causal relationship between representationalanimation and metacognitive monitoring. Significant differencesin JOD, JOC, or JOV between directive and no directive animationlearners would suggest that current theories may be deficient. Forexample, evidence that representational and directive animationshave a similar pattern of effect on metacognitive monitoring wouldnecessitate substantive theoretical changes to account for the sim-ilarity.
Analytical Methods
Groupwise comparisons of JOD, JOC, and JOV were made notwith raw scores but with bias scores. The bias of a variable wasdefined as the component of the variable that is not attributable tolearning. The bias of a variable was estimated with the residualwhen the variable is regressed by overall learning (i.e., the averageof retention and transfer test scores). This analytical approacheliminated the potential explanation that a detected difference in avariable was caused by differences in learning.
Thi
sdo
cum
ent
isco
pyri
ghte
dby
the
Am
eric
anPs
ycho
logi
cal
Ass
ocia
tion
oron
eof
itsal
lied
publ
ishe
rs.
Thi
sar
ticle
isin
tend
edso
lely
for
the
pers
onal
use
ofth
ein
divi
dual
user
and
isno
tto
bedi
ssem
inat
edbr
oadl
y.
281ANIMATION AND ILLUSIONS OF UNDERSTANDING
The accuracy of JOC for a group was estimated with the Pearsoncorrelation between JOC and overall learning (Blanch-Hartigan,2011). Groupwise comparisons of JOC accuracy were made withFisher’s Z-transformation.
Method
This study used a randomized, double-blind, 2 � 2 between-subjects factorial design. The two factors were the absence orpresence of representational animation and the absence or presenceof directive animation. This resulted in four treatment groups:static (i.e., no animation), representational animation only, direc-tive animation only, and both animations (i.e., representationalanimation and directive animation).
Participants
The participants were 65 undergraduate psychology students (49female, 16 male, Mage � 24.3 years, age range � 18 to 44 years)at a major university in the southwestern region of the UnitedStates. We do not report the participants’ SAT scores because amajority of the participants did not provide them.
Material
The experiment protocol was administered by an interactivemultimedia computer program that recorded all participant re-sponses. All the participants worked on an identical model ofcomputer hardware that included a 24-in. color monitor with1920 � 1080 resolution and a headphone. A version of thecomputer program that was used to administer the protocol isprovided as online supplemental material. With this computerprogram, the reader may examine the entire protocol including theinstruments, the treatment (i.e., the four versions of the multimediapresentation on the workings of a flushing toilet tank), as well asthe manner in which each instrument and treatment condition wasadministered. The following describes the components of the pro-tocol in the order that they were administered.
Introduction. The introduction explained what was expectedof the participants in the study. At the conclusion, the participantswere asked to enter a treatment code that was provided to them bythe protocol administrator.
Participant survey. The participant survey asked the partic-ipants about their demographic characteristics. The survey alsoasked the participants to characterize their background knowledgerelevant to flushing toilet tanks.
Treatment. The treatment was a multimedia presentation onhow a flushing toilet tank works that was adapted from Mayer etal. (2005) and Hegarty et al. (2003) with the addition that naviga-tional control and the narration modality were controlled across thetreatment conditions (Ginns, 2005; Low & Sweller, 2005; Mayer& Chandler, 2001; Mousavi, Low, & Sweller, 1995). Participantsin this study viewed the presentation twice so as to provide a morerealistic learning scenario than those in the Mayer et al. andHegarty et al. studies.
The multimedia presentation contained six segments. Each seg-ment contained graphic illustrations (see Figure 1) with an auralnarration (see the Appendix). The first segment introduced theparts of the flushing toilet tank. The remaining segments described
the five phases of generating the flush and refilling the tank. Thefirst segment lasted about 60 seconds, and the remaining segmentslasted about 30 seconds each. The participants viewed all thesegments continuously from start to finish. The participants werenot provided any mechanism (e.g., pause or rewind buttons) tointerrupt the presentation. At the completion of the first viewing,the presentation was paused. When the participant clicked a buttonon the computer screen, the presentation of the second viewingcommenced.
The images in the presentation contained a limited palette ofcolors. The parts of the toilet tank were in shades of gray. Thewater and the arrows representing the flow of water were in shadesof blue. The arrows that indicated how the parts of the toilet tankmoved were in red.
The multimedia presentations across the four treatment condi-tions were identical except for their visual component. The staticversion presented a single still image for each segment (see Figure1). Each static image was a key frame from the animated versions.For several static images, however, water flow arrows were addedto better illustrate the directionality of the water’s flow.
The directive-only version was identical to the static versionexcept that several directive animation techniques were incorpo-rated. In the first segment, parts appeared and disappeared from thescreen in synchrony with the narration so that only those partspertinent to the narration were displayed. For example, during theportion of the narration that stated “The flow of water into the tankis controlled by these parts . . .” only those enumerated parts werevisible. Furthermore, the parts were displayed in a lighter shadeuntil a part was explicitly referenced in the narration. At that point,the part being referenced was presented in normal shade, therebyproviding the participant a clear visual indication of the part thatwas being referred to by the narration. In the remaining segmentsthat described the dynamic behavior of the flushing toilet tank,blinking and tinting were used as visual cues to the narrativereferents. For example, when the narration stated “When thehandle is pressed down,” the color of the handle was tinted red andthe arrow pointing down on the handle flashed on and off.
In the representational-only version, representational animationdepicted the movement of the parts and the flow of water. Therepresentational animation and the narration were synchronized.For example, when the narration in phase 2 stated that “The twodisks start to drop and separate from each other,” the animationshowed the two discs falling and separating from each other. Theflow of water was animated by a continuous movement of arrows.
The representational–directive version incorporated both repre-sentational and directive animations described above. Logistically,we created first the representational–directive version such thatdirective animation and representational animation always ap-peared sequentially and never simultaneously. The other threeversions of the presentation were then produced by replacing eachunneeded animation clip with an appropriate static image.
Post-treatment survey. The post-treatment survey asked theparticipants to evaluate the format and the content of the multi-media presentation (e.g., “How difficult was it to learn about theflushing toilet tank from the presentation?”). The survey alsodescribed a set of problems to the participants. For each problem,the participants were asked how well they thought they would beable to solve the problem. For example, one of the questions was
Thi
sdo
cum
ent
isco
pyri
ghte
dby
the
Am
eric
anPs
ycho
logi
cal
Ass
ocia
tion
oron
eof
itsal
lied
publ
ishe
rs.
Thi
sar
ticle
isin
tend
edso
lely
for
the
pers
onal
use
ofth
ein
divi
dual
user
and
isno
tto
bedi
ssem
inat
edbr
oadl
y.
282 PAIK AND SCHRAW
as follows: “When a flushing toilet tank behaves abnormally, it isusually an indication that something in the tank is broken. Howwell do you think that you will be able to diagnose the cause ofabnormal behaviors in flushing toilet tanks?” As the problemdescriptions also described the problems used in the instruments tomeasure their learning outcome (i.e., the retention and transfertests), the participants were asked, in effect, to predict their learn-ing outcome.
Visualization exercise and survey. The visualization exer-cise asked the participants to mentally visualize the processes ofthe flushing toilet tank as described in the multimedia presentation.The participants were provided 30 seconds to perform the mentalvisualization. The visualization survey then asked the participantsto characterize their visualization experience (e.g., “How detaileddid your visualization seem to you? That is, compared to the levelof detail provided in the presentation.”).
Retention test. The retention test required the participants torecall information that was explicitly provided in the presentation.There were 10 part-recall problems and one process-recall prob-lem. For each part-recall problem, an image of a part of theflushing toilet tank was displayed on the screen. The image wasidentical to that shown during the treatment presentation. All of theother parts were also shown, but they were visually distinguishedwith a lighter shade. Each part-recall problem required the partic-ipant to provide two responses: part-name and part-purpose. Theparticipants provided their responses by selecting an entry in twodrop-down list boxes. For the part-name response, the list includednames that were explicitly referred to in the presentation (e.g.,connecting rod, float, float arm) as well as those that were not (e.g.,regulator). Similarly, the list for the part-purpose response in-cluded concepts explicitly referred to in the presentation (e.g., flowof water into the tank) as well as those that were not (e.g., flow ofair into the tank). The participants were given a maximum of 20seconds to complete each part-recall problem. If a participant didnot provide both responses within 20 seconds, the participant wasnotified that the time limit had been exceeded and the next ques-tion was automatically displayed.
The process-recall problem asked the participants to write downall the key events of the flushing toilet tank. The participants typedtheir responses into a basic text editor window. To help theparticipants understand what was expected of them, we providedthree key events as a starting point: (a) the handle is pressed; (b)float drops toward the bottom of the tank; and (c) the inlet valve ispushed in the inlet pipe. The participants were provided a maxi-mum of 3 minutes to respond.
Transfer test. The transfer test required the participants toapply the principles that were introduced in the treatment presen-tation in novel situations. The transfer test consisted of two prog-nostic problems (e.g., “Suppose that the float were to break offfrom the float arm. How would the flushing toilet tank misbehave?Describe all the symptoms that you can think of.”) and twodiagnostic problems (e.g., “Suppose that you push down on thehandle, but there is no flush. No water flows into the toilet bowl,none whatsoever. Describe all the causes that you can think of.”).The participants were provided 90 seconds to complete eachprognostic problem and 120 seconds to complete each diagnosticproblem.
Spatial ability test. The Paper Folding Test (Ekstrom, French,Harman, & Derman, 1976) was adapted for online administration.
An earlier pilot study indicated that the Paper Folding Test posedsignificant cognitive demands on the participants. Therefore, onlythe first 10 problems of the original test were administered in thepresent study. In the original test, the first 10 problems were ofcomparable difficulty to the second 10. Also, the Paper FoldingTest was administered at the end of the experiment to minimize thepotential impact of cognitive fatigue induced by the test. Althoughthis ordering left open the possibility that the treatment conditionssystematically and differentially affected the participants’ perfor-mance of the Paper Folding Test, we judged this more advanta-geous than the other order (i.e., where the differential effects of thePaper Folding Test occurs prior to the treatment) because keystatistical analyses of the study did not rely on the results of thePaper Folding Test (see Results). The participants were given amaximum of 20 seconds to complete each Paper Folding Testproblem. If a participant did not respond within the 20 seconds, theparticipant was notified that the time limit had been exceeded andthe next question was automatically displayed.
Procedure
The experiment was administered in four group sessions, rang-ing from 10 to 22 participants each, within a span of 1 week. Eachparticipant was seated in front of a computer. The participantswere instructed to put on the headphone and were shown how toadjust the volume. They were then instructed to begin their par-ticipation by pressing a button on the screen. Upon completion ofthe introductory presentation, each participant had the option ofeither terminating participation or signing the informed consentform and continuing participation. No participant chose to termi-nate participation.
When the participant submitted the signed consent form, theadministrator gave the participant a sheet of paper with a treatmentcode. The participant was then informed that the administrator wasno longer available for assistance. Participants were instructed toproceed as best they could if any issues or questions arose duringthe session. Once a participant entered the treatment code, acomputer program administered the experiment protocol. At thecompletion of the protocol, the computer program instructed theparticipant to notify the administrator. When the participant noti-fied the administrator, the administrator thanked the participantand directed the participant to leave the lab.
Random assignment. Random assignment and even distribu-tion of the participants across the treatment groups were imple-mented as follows. The treatment codes that were distributed to theparticipants were ordered such that each consecutive four treat-ment codes (a) contained all four treatment conditions and (b) wereshuffled in random order. The treatment codes were distributed inthe order that the participants submitted their signed consentforms.
Double blind control. Double blind control of the experimentwas achieved as follows. First, the sheets of paper containing thetreatment codes were folded and stapled so that the codes werehidden. Therefore, when the administrator handed a treatment codepaper to a participant, the administrator did not know to whichtreatment condition the participant was being assigned. Second,the administrator did not engage in any interaction, including eyecontact, with a participant once the participant had opened thetreatment code paper. Third, physical partitions were erected be-
Thi
sdo
cum
ent
isco
pyri
ghte
dby
the
Am
eric
anPs
ycho
logi
cal
Ass
ocia
tion
oron
eof
itsal
lied
publ
ishe
rs.
Thi
sar
ticle
isin
tend
edso
lely
for
the
pers
onal
use
ofth
ein
divi
dual
user
and
isno
tto
bedi
ssem
inat
edbr
oadl
y.
283ANIMATION AND ILLUSIONS OF UNDERSTANDING
tween the participants’ desks so that one participant could not seethe computer screen of another participant. Finally, during thescoring process, participant responses were encoded and collatedso that the scorers did not know to which individual or treatmentgroup a response belonged.
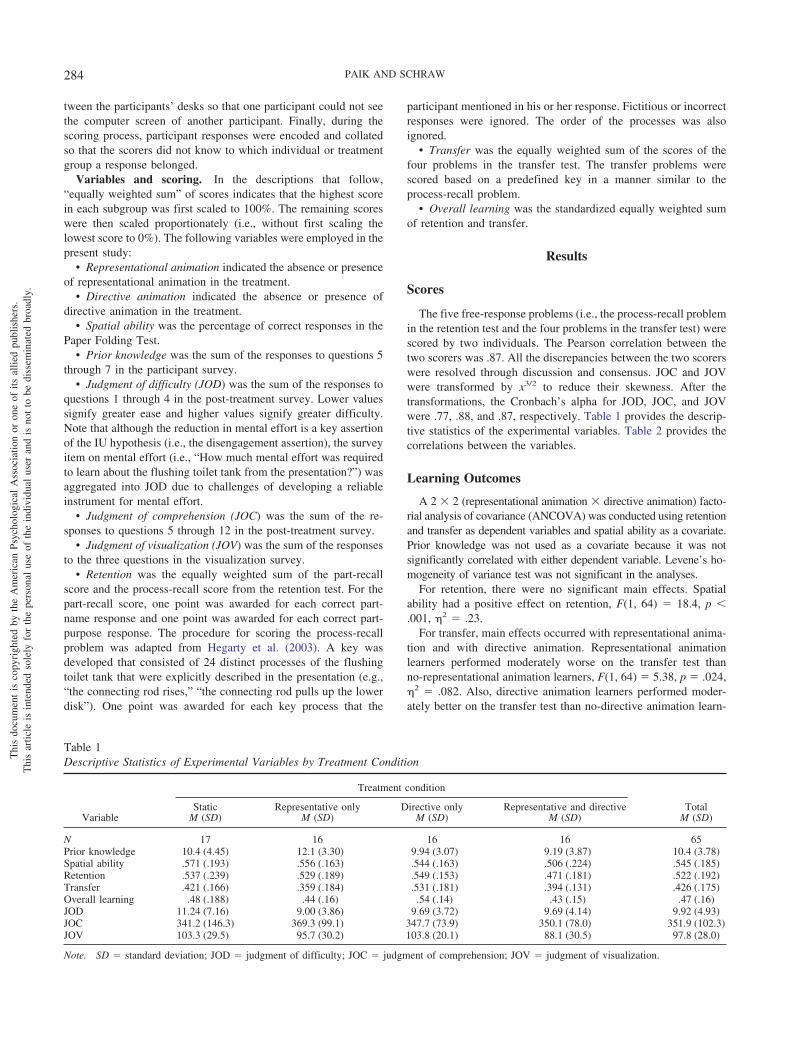
Variables and scoring. In the descriptions that follow,“equally weighted sum” of scores indicates that the highest scorein each subgroup was first scaled to 100%. The remaining scoreswere then scaled proportionately (i.e., without first scaling thelowest score to 0%). The following variables were employed in thepresent study:
• Representational animation indicated the absence or presenceof representational animation in the treatment.
• Directive animation indicated the absence or presence ofdirective animation in the treatment.
• Spatial ability was the percentage of correct responses in thePaper Folding Test.
• Prior knowledge was the sum of the responses to questions 5through 7 in the participant survey.
• Judgment of difficulty (JOD) was the sum of the responses toquestions 1 through 4 in the post-treatment survey. Lower valuessignify greater ease and higher values signify greater difficulty.Note that although the reduction in mental effort is a key assertionof the IU hypothesis (i.e., the disengagement assertion), the surveyitem on mental effort (i.e., “How much mental effort was requiredto learn about the flushing toilet tank from the presentation?”) wasaggregated into JOD due to challenges of developing a reliableinstrument for mental effort.
• Judgment of comprehension (JOC) was the sum of the re-sponses to questions 5 through 12 in the post-treatment survey.
• Judgment of visualization (JOV) was the sum of the responsesto the three questions in the visualization survey.
• Retention was the equally weighted sum of the part-recallscore and the process-recall score from the retention test. For thepart-recall score, one point was awarded for each correct part-name response and one point was awarded for each correct part-purpose response. The procedure for scoring the process-recallproblem was adapted from Hegarty et al. (2003). A key wasdeveloped that consisted of 24 distinct processes of the flushingtoilet tank that were explicitly described in the presentation (e.g.,“the connecting rod rises,” “the connecting rod pulls up the lowerdisk”). One point was awarded for each key process that the
participant mentioned in his or her response. Fictitious or incorrectresponses were ignored. The order of the processes was alsoignored.
• Transfer was the equally weighted sum of the scores of thefour problems in the transfer test. The transfer problems werescored based on a predefined key in a manner similar to theprocess-recall problem.
• Overall learning was the standardized equally weighted sumof retention and transfer.
Results
Scores
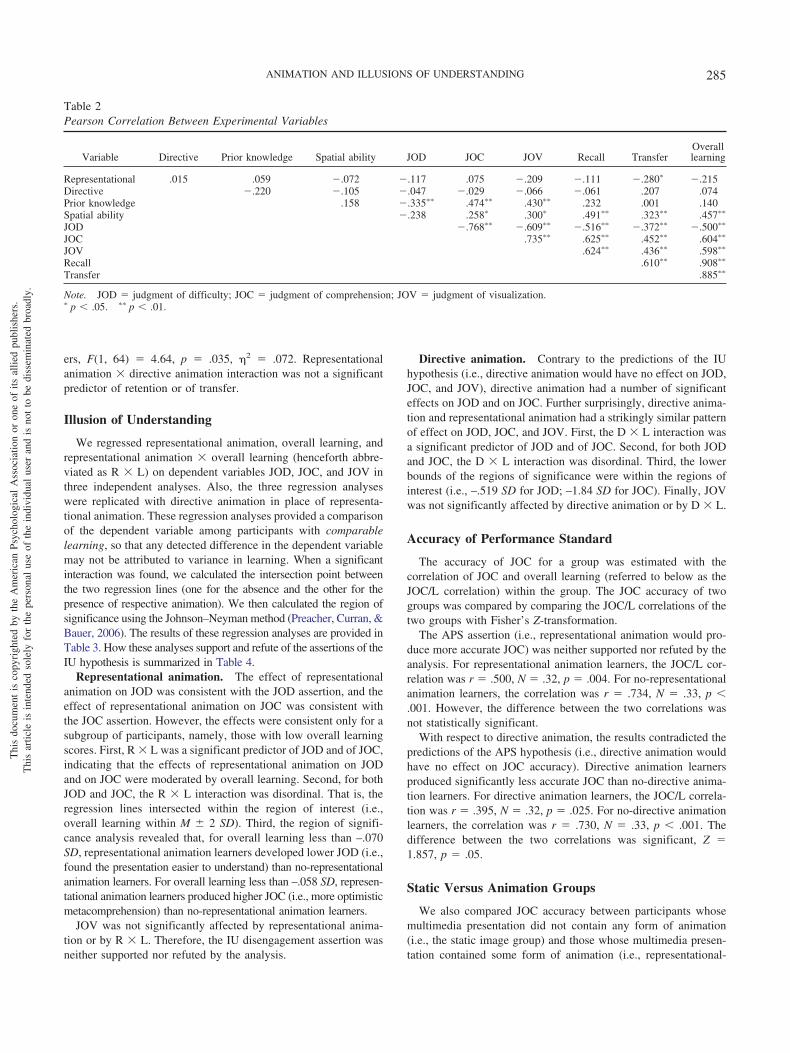
The five free-response problems (i.e., the process-recall problemin the retention test and the four problems in the transfer test) werescored by two individuals. The Pearson correlation between thetwo scorers was .87. All the discrepancies between the two scorerswere resolved through discussion and consensus. JOC and JOVwere transformed by x3/2 to reduce their skewness. After thetransformations, the Cronbach’s alpha for JOD, JOC, and JOVwere .77, .88, and .87, respectively. Table 1 provides the descrip-tive statistics of the experimental variables. Table 2 provides thecorrelations between the variables.
Learning Outcomes
A 2 � 2 (representational animation � directive animation) facto-rial analysis of covariance (ANCOVA) was conducted using retentionand transfer as dependent variables and spatial ability as a covariate.Prior knowledge was not used as a covariate because it was notsignificantly correlated with either dependent variable. Levene’s ho-mogeneity of variance test was not significant in the analyses.
For retention, there were no significant main effects. Spatialability had a positive effect on retention, F(1, 64) � 18.4, p �.001, �2 � .23.
For transfer, main effects occurred with representational anima-tion and with directive animation. Representational animationlearners performed moderately worse on the transfer test thanno-representational animation learners, F(1, 64) � 5.38, p � .024,�2 � .082. Also, directive animation learners performed moder-ately better on the transfer test than no-directive animation learn-
Table 1Descriptive Statistics of Experimental Variables by Treatment Condition
Treatment condition
VariableStatic
M (SD)Representative only
M (SD)Directive only
M (SD)Representative and directive
M (SD)Total
M (SD)
N 17 16 16 16 65Prior knowledge 10.4 (4.45) 12.1 (3.30) 9.94 (3.07) 9.19 (3.87) 10.4 (3.78)Spatial ability .571 (.193) .556 (.163) .544 (.163) .506 (.224) .545 (.185)Retention .537 (.239) .529 (.189) .549 (.153) .471 (.181) .522 (.192)Transfer .421 (.166) .359 (.184) .531 (.181) .394 (.131) .426 (.175)Overall learning .48 (.188) .44 (.16) .54 (.14) .43 (.15) .47 (.16)JOD 11.24 (7.16) 9.00 (3.86) 9.69 (3.72) 9.69 (4.14) 9.92 (4.93)JOC 341.2 (146.3) 369.3 (99.1) 347.7 (73.9) 350.1 (78.0) 351.9 (102.3)JOV 103.3 (29.5) 95.7 (30.2) 103.8 (20.1) 88.1 (30.5) 97.8 (28.0)
Note. SD � standard deviation; JOD � judgment of difficulty; JOC � judgment of comprehension; JOV � judgment of visualization.
Thi
sdo
cum
ent
isco
pyri
ghte
dby
the
Am
eric
anPs
ycho
logi
cal
Ass
ocia
tion
oron
eof
itsal
lied
publ
ishe
rs.
Thi
sar
ticle
isin
tend
edso
lely
for
the
pers
onal
use
ofth
ein
divi
dual
user
and
isno
tto
bedi
ssem
inat
edbr
oadl
y.
284 PAIK AND SCHRAW
ers, F(1, 64) � 4.64, p � .035, �2 � .072. Representationalanimation � directive animation interaction was not a significantpredictor of retention or of transfer.
Illusion of Understanding
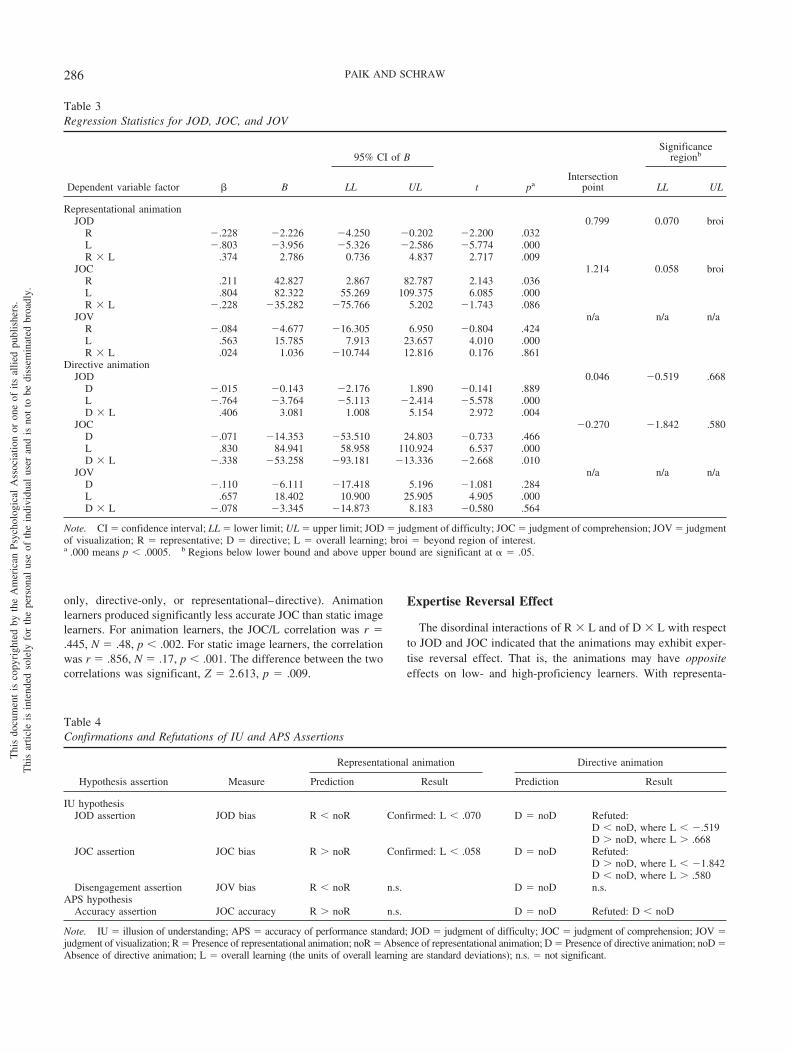
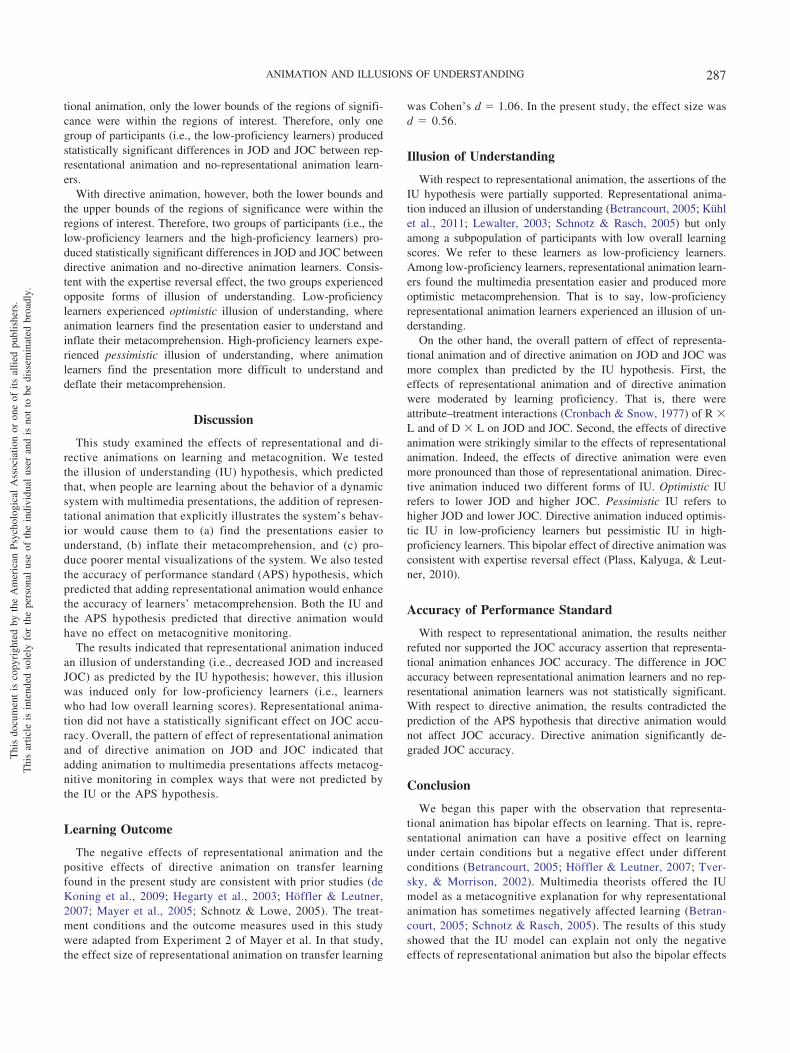
We regressed representational animation, overall learning, andrepresentational animation � overall learning (henceforth abbre-viated as R � L) on dependent variables JOD, JOC, and JOV inthree independent analyses. Also, the three regression analyseswere replicated with directive animation in place of representa-tional animation. These regression analyses provided a comparisonof the dependent variable among participants with comparablelearning, so that any detected difference in the dependent variablemay not be attributed to variance in learning. When a significantinteraction was found, we calculated the intersection point betweenthe two regression lines (one for the absence and the other for thepresence of respective animation). We then calculated the region ofsignificance using the Johnson–Neyman method (Preacher, Curran, &Bauer, 2006). The results of these regression analyses are provided inTable 3. How these analyses support and refute of the assertions of theIU hypothesis is summarized in Table 4.
Representational animation. The effect of representationalanimation on JOD was consistent with the JOD assertion, and theeffect of representational animation on JOC was consistent withthe JOC assertion. However, the effects were consistent only for asubgroup of participants, namely, those with low overall learningscores. First, R � L was a significant predictor of JOD and of JOC,indicating that the effects of representational animation on JODand on JOC were moderated by overall learning. Second, for bothJOD and JOC, the R � L interaction was disordinal. That is, theregression lines intersected within the region of interest (i.e.,overall learning within M � 2 SD). Third, the region of signifi-cance analysis revealed that, for overall learning less than –.070SD, representational animation learners developed lower JOD (i.e.,found the presentation easier to understand) than no-representationalanimation learners. For overall learning less than –.058 SD, represen-tational animation learners produced higher JOC (i.e., more optimisticmetacomprehension) than no-representational animation learners.
JOV was not significantly affected by representational anima-tion or by R � L. Therefore, the IU disengagement assertion wasneither supported nor refuted by the analysis.
Directive animation. Contrary to the predictions of the IUhypothesis (i.e., directive animation would have no effect on JOD,JOC, and JOV), directive animation had a number of significanteffects on JOD and on JOC. Further surprisingly, directive anima-tion and representational animation had a strikingly similar patternof effect on JOD, JOC, and JOV. First, the D � L interaction wasa significant predictor of JOD and of JOC. Second, for both JODand JOC, the D � L interaction was disordinal. Third, the lowerbounds of the regions of significance were within the regions ofinterest (i.e., –.519 SD for JOD; –1.84 SD for JOC). Finally, JOVwas not significantly affected by directive animation or by D � L.
Accuracy of Performance Standard
The accuracy of JOC for a group was estimated with thecorrelation of JOC and overall learning (referred to below as theJOC/L correlation) within the group. The JOC accuracy of twogroups was compared by comparing the JOC/L correlations of thetwo groups with Fisher’s Z-transformation.
The APS assertion (i.e., representational animation would pro-duce more accurate JOC) was neither supported nor refuted by theanalysis. For representational animation learners, the JOC/L cor-relation was r � .500, N � .32, p � .004. For no-representationalanimation learners, the correlation was r � .734, N � .33, p �.001. However, the difference between the two correlations wasnot statistically significant.
With respect to directive animation, the results contradicted thepredictions of the APS hypothesis (i.e., directive animation wouldhave no effect on JOC accuracy). Directive animation learnersproduced significantly less accurate JOC than no-directive anima-tion learners. For directive animation learners, the JOC/L correla-tion was r � .395, N � .32, p � .025. For no-directive animationlearners, the correlation was r � .730, N � .33, p � .001. Thedifference between the two correlations was significant, Z �1.857, p � .05.
Static Versus Animation Groups
We also compared JOC accuracy between participants whosemultimedia presentation did not contain any form of animation(i.e., the static image group) and those whose multimedia presen-tation contained some form of animation (i.e., representational-
Table 2Pearson Correlation Between Experimental Variables
Variable Directive Prior knowledge Spatial ability JOD JOC JOV Recall TransferOveralllearning
Representational .015 .059 �.072 �.117 .075 �.209 �.111 �.280� �.215Directive �.220 �.105 �.047 �.029 �.066 �.061 .207 .074Prior knowledge .158 �.335�� .474�� .430�� .232 .001 .140Spatial ability �.238 .258� .300� .491�� .323�� .457��
JOD �.768�� �.609�� �.516�� �.372�� �.500��
JOC .735�� .625�� .452�� .604��
JOV .624�� .436�� .598��
Recall .610�� .908��
Transfer .885��
Note. JOD � judgment of difficulty; JOC � judgment of comprehension; JOV � judgment of visualization.� p � .05. �� p � .01.
Thi
sdo
cum
ent
isco
pyri
ghte
dby
the
Am
eric
anPs
ycho
logi
cal
Ass
ocia
tion
oron
eof
itsal
lied
publ
ishe
rs.
Thi
sar
ticle
isin
tend
edso
lely
for
the
pers
onal
use
ofth
ein
divi
dual
user
and
isno
tto
bedi
ssem
inat
edbr
oadl
y.
285ANIMATION AND ILLUSIONS OF UNDERSTANDING
only, directive-only, or representational–directive). Animationlearners produced significantly less accurate JOC than static imagelearners. For animation learners, the JOC/L correlation was r �.445, N � .48, p � .002. For static image learners, the correlationwas r � .856, N � .17, p � .001. The difference between the twocorrelations was significant, Z � 2.613, p � .009.
Expertise Reversal Effect
The disordinal interactions of R � L and of D � L with respectto JOD and JOC indicated that the animations may exhibit exper-tise reversal effect. That is, the animations may have oppositeeffects on low- and high-proficiency learners. With representa-
Table 3Regression Statistics for JOD, JOC, and JOV
95% CI of BSignificance
regionb
Dependent variable factor � B LL UL t paIntersection
point LL UL
Representational animationJOD 0.799 0.070 broi
R �.228 �2.226 �4.250 �0.202 �2.200 .032L �.803 �3.956 �5.326 �2.586 �5.774 .000R � L .374 2.786 0.736 4.837 2.717 .009
JOC 1.214 0.058 broiR .211 42.827 2.867 82.787 2.143 .036L .804 82.322 55.269 109.375 6.085 .000R � L �.228 �35.282 �75.766 5.202 �1.743 .086
JOV n/a n/a n/aR �.084 �4.677 �16.305 6.950 �0.804 .424L .563 15.785 7.913 23.657 4.010 .000R � L .024 1.036 �10.744 12.816 0.176 .861
Directive animationJOD 0.046 �0.519 .668
D �.015 �0.143 �2.176 1.890 �0.141 .889L �.764 �3.764 �5.113 �2.414 �5.578 .000D � L .406 3.081 1.008 5.154 2.972 .004
JOC �0.270 �1.842 .580D �.071 �14.353 �53.510 24.803 �0.733 .466L .830 84.941 58.958 110.924 6.537 .000D � L �.338 �53.258 �93.181 �13.336 �2.668 .010
JOV n/a n/a n/aD �.110 �6.111 �17.418 5.196 �1.081 .284L .657 18.402 10.900 25.905 4.905 .000D � L �.078 �3.345 �14.873 8.183 �0.580 .564
Note. CI � confidence interval; LL � lower limit; UL � upper limit; JOD � judgment of difficulty; JOC � judgment of comprehension; JOV � judgmentof visualization; R � representative; D � directive; L � overall learning; broi � beyond region of interest.a .000 means p � .0005. b Regions below lower bound and above upper bound are significant at � � .05.
Table 4Confirmations and Refutations of IU and APS Assertions
Representational animation Directive animation
Hypothesis assertion Measure Prediction Result Prediction Result
IU hypothesisJOD assertion JOD bias R � noR Confirmed: L � .070 D � noD Refuted:
D � noD, where L � �.519D noD, where L .668
JOC assertion JOC bias R noR Confirmed: L � .058 D � noD Refuted:D noD, where L � �1.842D � noD, where L .580
Disengagement assertion JOV bias R � noR n.s. D � noD n.s.APS hypothesis
Accuracy assertion JOC accuracy R noR n.s. D � noD Refuted: D � noD
Note. IU � illusion of understanding; APS � accuracy of performance standard; JOD � judgment of difficulty; JOC � judgment of comprehension; JOV �judgment of visualization; R � Presence of representational animation; noR � Absence of representational animation; D � Presence of directive animation; noD �Absence of directive animation; L � overall learning (the units of overall learning are standard deviations); n.s. � not significant.
Thi
sdo
cum
ent
isco
pyri
ghte
dby
the
Am
eric
anPs
ycho
logi
cal
Ass
ocia
tion
oron
eof
itsal
lied
publ
ishe
rs.
Thi
sar
ticle
isin
tend
edso
lely
for
the
pers
onal
use
ofth
ein
divi
dual
user
and
isno
tto
bedi
ssem
inat
edbr
oadl
y.
286 PAIK AND SCHRAW
tional animation, only the lower bounds of the regions of signifi-cance were within the regions of interest. Therefore, only onegroup of participants (i.e., the low-proficiency learners) producedstatistically significant differences in JOD and JOC between rep-resentational animation and no-representational animation learn-ers.
With directive animation, however, both the lower bounds andthe upper bounds of the regions of significance were within theregions of interest. Therefore, two groups of participants (i.e., thelow-proficiency learners and the high-proficiency learners) pro-duced statistically significant differences in JOD and JOC betweendirective animation and no-directive animation learners. Consis-tent with the expertise reversal effect, the two groups experiencedopposite forms of illusion of understanding. Low-proficiencylearners experienced optimistic illusion of understanding, whereanimation learners find the presentation easier to understand andinflate their metacomprehension. High-proficiency learners expe-rienced pessimistic illusion of understanding, where animationlearners find the presentation more difficult to understand anddeflate their metacomprehension.
Discussion
This study examined the effects of representational and di-rective animations on learning and metacognition. We testedthe illusion of understanding (IU) hypothesis, which predictedthat, when people are learning about the behavior of a dynamicsystem with multimedia presentations, the addition of represen-tational animation that explicitly illustrates the system’s behav-ior would cause them to (a) find the presentations easier tounderstand, (b) inflate their metacomprehension, and (c) pro-duce poorer mental visualizations of the system. We also testedthe accuracy of performance standard (APS) hypothesis, whichpredicted that adding representational animation would enhancethe accuracy of learners’ metacomprehension. Both the IU andthe APS hypothesis predicted that directive animation wouldhave no effect on metacognitive monitoring.
The results indicated that representational animation inducedan illusion of understanding (i.e., decreased JOD and increasedJOC) as predicted by the IU hypothesis; however, this illusionwas induced only for low-proficiency learners (i.e., learnerswho had low overall learning scores). Representational anima-tion did not have a statistically significant effect on JOC accu-racy. Overall, the pattern of effect of representational animationand of directive animation on JOD and JOC indicated thatadding animation to multimedia presentations affects metacog-nitive monitoring in complex ways that were not predicted bythe IU or the APS hypothesis.
Learning Outcome
The negative effects of representational animation and thepositive effects of directive animation on transfer learningfound in the present study are consistent with prior studies (deKoning et al., 2009; Hegarty et al., 2003; Höffler & Leutner,2007; Mayer et al., 2005; Schnotz & Lowe, 2005). The treat-ment conditions and the outcome measures used in this studywere adapted from Experiment 2 of Mayer et al. In that study,the effect size of representational animation on transfer learning
was Cohen’s d � 1.06. In the present study, the effect size wasd � 0.56.
Illusion of Understanding
With respect to representational animation, the assertions of theIU hypothesis were partially supported. Representational anima-tion induced an illusion of understanding (Betrancourt, 2005; Kühlet al., 2011; Lewalter, 2003; Schnotz & Rasch, 2005) but onlyamong a subpopulation of participants with low overall learningscores. We refer to these learners as low-proficiency learners.Among low-proficiency learners, representational animation learn-ers found the multimedia presentation easier and produced moreoptimistic metacomprehension. That is to say, low-proficiencyrepresentational animation learners experienced an illusion of un-derstanding.
On the other hand, the overall pattern of effect of representa-tional animation and of directive animation on JOD and JOC wasmore complex than predicted by the IU hypothesis. First, theeffects of representational animation and of directive animationwere moderated by learning proficiency. That is, there wereattribute–treatment interactions (Cronbach & Snow, 1977) of R �L and of D � L on JOD and JOC. Second, the effects of directiveanimation were strikingly similar to the effects of representationalanimation. Indeed, the effects of directive animation were evenmore pronounced than those of representational animation. Direc-tive animation induced two different forms of IU. Optimistic IUrefers to lower JOD and higher JOC. Pessimistic IU refers tohigher JOD and lower JOC. Directive animation induced optimis-tic IU in low-proficiency learners but pessimistic IU in high-proficiency learners. This bipolar effect of directive animation wasconsistent with expertise reversal effect (Plass, Kalyuga, & Leut-ner, 2010).
Accuracy of Performance Standard
With respect to representational animation, the results neitherrefuted nor supported the JOC accuracy assertion that representa-tional animation enhances JOC accuracy. The difference in JOCaccuracy between representational animation learners and no rep-resentational animation learners was not statistically significant.With respect to directive animation, the results contradicted theprediction of the APS hypothesis that directive animation wouldnot affect JOC accuracy. Directive animation significantly de-graded JOC accuracy.
Conclusion
We began this paper with the observation that representa-tional animation has bipolar effects on learning. That is, repre-sentational animation can have a positive effect on learningunder certain conditions but a negative effect under differentconditions (Betrancourt, 2005; Höffler & Leutner, 2007; Tver-sky, & Morrison, 2002). Multimedia theorists offered the IUmodel as a metacognitive explanation for why representationalanimation has sometimes negatively affected learning (Betran-court, 2005; Schnotz & Rasch, 2005). The results of this studyshowed that the IU model can explain not only the negativeeffects of representational animation but also the bipolar effects
Thi
sdo
cum
ent
isco
pyri
ghte
dby
the
Am
eric
anPs
ycho
logi
cal
Ass
ocia
tion
oron
eof
itsal
lied
publ
ishe
rs.
Thi
sar
ticle
isin
tend
edso
lely
for
the
pers
onal
use
ofth
ein
divi
dual
user
and
isno
tto
bedi
ssem
inat
edbr
oadl
y.
287ANIMATION AND ILLUSIONS OF UNDERSTANDING
of animation in general. Learning is impeded when animationinduces optimistic IU, and learning is enhanced when animationinduces pessimistic IU.
Although the results showed that animation perturbs meta-cognitive monitoring (e.g., raises and lowers JOD and JOC), acausal explanation for this perturbation remains unresolved.Explanations that rely on the representational characteristics ofanimation (e.g., the IU and the APS hypotheses as defined inthe introduction) do not explain the following: (a) Why were theeffects of animation moderated by learning? (b) Why did di-rective animation affect JOD and JOC? (c) Why were theeffects of representational and directive animations so similar toeach other? However, given that the present study included oneexperiment using one set of content material (i.e., the workingsof a flushing toilet tank), our findings should be replicated andextended to new materials.
References
Azevedo, R., & Witherspoon, A. M. (2009). Self-regulated use of hyper-media. In D. J. Hacker, J. Dunlosky, & A. C. Graesser (Eds.), Handbookof metacognition in education (pp. 319–339). Mahwah, NJ: Erlbaum.
Betrancourt, M. (2005). The animation and interactivity principle of mul-timedia learning. In R. Mayer (Ed.), Cambridge handbook of multimedialearning (pp. 287–296). New York, NY: Cambridge University Press.
Betrancourt, M., & Tversky, B. (2000). Effects of computer animation onusers’ performance: A review. Le Travail Humain, 63, 311–329.
Blanch-Hartigan, D. (2011). Medical students’ self-assessment of perfor-mance: Results from three meta-analyses. Patient Education and Coun-seling, 84, 3–9. doi:10.1016/j.pec.2010.06.037
Cronbach, L. J., & Snow, R. E. (1977). Aptitudes and instructional meth-ods: A handbook for research on interaction. New York, NY: Irvington.
de Koning, B. B., Tabbers, H. K., Rikers, R. M. J. P., & Paas, F. (2009).Towards a framework for attention cueing in instructional animations:Guidelines for research and design. Educational Psychology Review, 21,113–140. doi:10.1007/s10648-009-9098-7
Efklides, A. (2008). Metacognition: Defining its facets and levels offunctioning in relation to self-regulation and co-regulation. EuropeanPsychologist, 13, 277–287. doi:10.1027/1016-9040.13.4.277
Ekstrom, R. B., French, J. W., Harman, H. H., & Derman, D. (1976). Kitof factor-referenced cognitive tests. Princeton, NJ: Educational TestingService.
Ginns, P. (2005). Meta-analysis of the modality effect. Learning andInstruction, 15, 313–331. doi:10.1016/j.learninstruc.2005.07.001
Glenberg, A. M., Wilkinson, A. C., & Epstein, W. (1982). The illusion ofknowing: Failure in the self-assessment of comprehension. Memory &Cognition, 10, 597–602. doi:10.3758/BF03202442
Hegarty, M., Kriz, S., & Cate, C. (2003). The roles of mental animationsand external animations in understanding mechanical systems. Cogni-tion and Instruction, 21, 209–249. doi:10.1207/s1532690xci2104_1
Höffler, T. N., & Leutner, D. (2007). Instructional animation versus staticpictures: A meta-analysis. Learning and Instruction, 17, 722–738. doi:10.1016/j.learninstruc.2007.09.013
Höffler, T. N., & Leutner, D. (2011). The role of spatial ability in learningfrom instructional animations—Evidence for an ability-as-compensatorhypothesis. Computers in Human Behavior, 27, 209–216. doi:10.1016/j.chb.2010.07.042
Jeung, H., Chandler, P., & Sweller, J. (1997). The role of visual indicatorsin dual sensory mode instruction. Educational Psychology, 17, 329–345.doi:10.1080/0144341970170307
Kalyuga, S., Ayres, P., Chandler, P., & Sweller, J. (2003). The expertisereversal effect. Educational Psychologist, 38, 23–31. doi:10.1207/S15326985EP3801_4
Kriz, S., & Hegarty, M. (2007). Top-down and bottom-up influences onlearning from animations. International Journal of Human-ComputerStudies, 65, 911–930. doi:10.1016/j.ijhcs.2007.06.005
Kühl, T., Scheiter, K., Gerjets, P., & Gemballa, S. (2011). Can differencesin learning strategies explain the benefits of learning from static anddynamic visualizations? Computers & Education, 56, 176–187. doi:10.1016/j.compedu.2010.08.008
Lewalter, D. (2003). Cognitive strategies for learning from static anddynamic visuals. Learning and Instruction, 13, 177–189. doi:10.1016/S0959-4752(02)00019-1
Low, R., & Sweller, J. (2005). The modality principle in multimedialearning. In R. Mayer (Ed.), Cambridge handbook of multimedia learn-ing (pp. 147–158). New York, NY: Cambridge University Press.
Mayer, R. E. (2005). Principles of multimedia learning based on socialcues: Personalization, voice, and image principles. In R. Mayer (Ed.),Cambridge handbook of multimedia learning (pp. 201–212). New York,NY: Cambridge University Press.
Mayer, R. E., & Chandler, P. (2001). When learning is just a click away:Does simple user interaction foster deeper understanding of multimediamessages? Journal of Educational Psychology, 93, 390 –397. doi:10.1037/0022-0663.93.2.390
Mayer, R. E., Hegarty, M., Mayer, S., & Campbell, J. (2005). When staticmedia promote active learning: Annotated illustrations versus narratedanimation in multimedia instruction. Journal of Experimental Psychol-ogy: Applied, 11, 256–265. doi:10.1037/1076-898X.11.4.256
Moreno, R. (2005). Multimedia learning with animated pedagogicalagents. In R. Mayer (Ed.), Cambridge handbook of multimedia learning(pp. 507–524). New York, NY: Cambridge University Press.
Mousavi, S. Y., Low, R., & Sweller, J. (1995). Reducing cognitive load bymixing auditory and visual presentation modes. Journal of EducationalPsychology, 87, 319–334. doi:10.1037/0022-0663.87.2.319
Nelson, T. O., & Narens, L. (1990). Metamemory: A theoretical frameworkand new findings. Psychology of Learning and Motivation, 26, 125–173.
Paik, E. (2009). Learning about dynamic systems with multimedia presen-tations containing motion animation and highlighting animation. In G.Siemens & C. Fulford (Eds.), Proceedings of World Conference onEducational Multimedia, Hypermedia and Telecommunications 2009(pp. 684–693). Chesapeake, VA: AACE.
Preacher, K. J., Curran, P. J., & Bauer, D. J. (2006). Computational toolsfor probing interaction effects in multiple linear regression, multilevelmodeling, and latent curve analysis. Journal of Educational and Behav-ioral Statistics, 31, 437–448. doi:10.3102/10769986031004437
Salomon, G. (1984). Television is “easy” and print is “tough”: The differ-ential investment of mental effort in learning as a function of perceptionsand attributions. Journal of Educational Psychology, 76, 647–658. doi:10.1037/0022-0663.76.4.647
Schnotz, W., & Lowe, R. (2003). External and internal representations inmultimedia learning. Learning and Instruction, 13, 117–123. doi:10.1016/S0959-4752(02)00015-4
Schnotz, W., & Lowe, R. K. (2008). A unified view of learning fromanimated and static graphics. In R. K. Lowe & W. Schnotz (Eds.),Learning with animation: Research implications for design (pp. 304–356). New York, NY: Cambridge University Press.
Schnotz, W., & Rasch, T. (2005). Enabling, facilitating, and inhibitingeffects of animation in multimedia learning: Why reduction of cognitiveload can have negative results on learning. Educational TechnologyResearch and Development, 53, 47–58. doi:10.1007/BF02504797
Serra, M. J., & Dunlosky, J. (2010). Metacomprehension judgementsreflect the belief that diagrams improve learning from text. Memory, 18,698–711. doi:10.1080/09658211.2010.506441
Serra, M. J., & Metcalfe, J. (2009). Effective implementation of metacog-nition. In D. J. Hacker, J. Dunlosky, & A. C. Graesser (Eds.), Handbookof metacognition in education (pp. 278–298). Mahwah, NJ: Erlbaum.
Sweller, J. (2005). Implications of cognitive load theory for multimedia
Thi
sdo
cum
ent
isco
pyri
ghte
dby
the
Am
eric
anPs
ycho
logi
cal
Ass
ocia
tion
oron
eof
itsal
lied
publ
ishe
rs.
Thi
sar
ticle
isin
tend
edso
lely
for
the
pers
onal
use
ofth
ein
divi
dual
user
and
isno
tto
bedi
ssem
inat
edbr
oadl
y.
288 PAIK AND SCHRAW
learning. In R. Mayer (Ed.), Cambridge handbook of multimedia learn-ing (pp. 19–30). New York, NY: Cambridge University Press.
Terricone, P. (2011). The taxonomy of metacognition. Hove, England:Psychology Press.
Tobias, S., & Everson, H. T. (2009). The importance of knowing what you know.In D. J. Hacker, J. Dunlosky, & A. C. Graesser (Eds.), Handbook ofmetacognition in education (pp. 107–127). Mahwah, NJ: Erlbaum.
Tversky, B., & Morrison, J. B. (2002). Animation: Can it facilitate?International Journal of Human-Computer Studies, 57, 247–262. doi:10.1006/ijhc.2002.1017
Winne, P. H. (2001). Self-regulated learning viewed from models ofinformation processing. In B. Zimmerman & D. Schunk (Eds.), Self-regulated learning and academic achievement: Theoretical perspectives(pp. 153–189). Mahwah, NJ: Erlbaum.
Appendix
Treatment Narration
The narration of the six segments of the multimedia presentationin the treatment was as follows:
1. A flushing toilet tank is made up of a number of parts. The tankand the lid store the water used to flush the toilet and house the otherparts. The flow of water into the tank is controlled by these parts: theinlet pipe, the inlet valve, the inlet valve arm, the float arm, and thefloat. The rise and fall of the float pushes the inlet valve in and outof the inlet pipe. The flow of water out of the tank and into thetoilet bowl is controlled by these parts: the handle, the connectingrods, the upper disc, the lower disc, the siphon bell, and the siphonpipe. The upper disc is free to move up and down on its own. Thelower disc can be moved up and down with the handle.
2. Phase 1 - Starting the flush. When the handle is pressed down,the connecting rods are pulled up, causing the lower disk to riseand to push up the upper disk. As a result, the water in the siphonbell is forced over the siphon pipe into the toilet bowl.
3. Phase 2 - Continuing the flush. Once the handle is released,the two disks start to drop and separate from each other. As aresult, the water flows through the holes in the lower disk, aroundthe edges of the upper disk, over the siphon pipe, and into the toilet
bowl. Note: the two disks separate, because the water that flowsthrough the holes in the lower disk pushes up the upper disk.
4. Phase 3 - Starting the refill. As the water flows out of the tank,the water level drops. As the water level falls, the float dropstoward the bottom, pulling out the inlet valve, and uncovering thehole in the inlet pipe. This allows the water to flow into the tank.
5. Phase 4 - Ending the flush. When the water flows out of thetank as well as into the tank, the water level continues to dropbecause the flow of water out of the tank is faster than into thetank. When the water level falls below the bottom of the siphonbell, air enters and breaks the siphon. This stops the flow of waterinto the toilet bowl.
6. Phase 5 - Ending the refill. When water flows into the tankbut not out of the tank, the water level rises. As the water levelrises, the float rises, pushing in the inlet valve, and closing the inlethole. When the water level rises high enough, the flow of waterinto the tank is stopped. Now, the tank is ready for the next flush.
Received October 16, 2011Revision received August 22, 2012
Accepted September 4, 2012 �
Thi
sdo
cum
ent
isco
pyri
ghte
dby
the
Am
eric
anPs
ycho
logi
cal
Ass
ocia
tion
oron
eof
itsal
lied
publ
ishe
rs.
Thi
sar
ticle
isin
tend
edso
lely
for
the
pers
onal
use
ofth
ein
divi
dual
user
and
isno
tto
bedi
ssem
inat
edbr
oadl
y.
289ANIMATION AND ILLUSIONS OF UNDERSTANDING