Embed Size (px)
Citation preview

University of IowaIowa Research Online
Theses and Dissertations
Fall 2009
Learning to rank documents with support vectormachines via active learningRobert James ArensUniversity of Iowa
Copyright 2009 Robert James Arens
This dissertation is available at Iowa Research Online: https://ir.uiowa.edu/etd/331
Follow this and additional works at: https://ir.uiowa.edu/etd
Part of the Computer Sciences Commons
Recommended CitationArens, Robert James. "Learning to rank documents with support vector machines via active learning." PhD (Doctor of Philosophy)thesis, University of Iowa, 2009.https://doi.org/10.17077/etd.qorr3t44

LEARNING TO RANK DOCUMENTS WITH SUPPORT VECTORMACHINES VIA ACTIVE LEARNING
by
Robert James Arens
An Abstract
Of a thesis submitted in partial fulfillment of therequirements for the Doctor of Philosophy
degree in Computer Science in theGraduate College of The
University of Iowa
December 2009
Thesis Supervisor: Professor Alberto Segre
1
ABSTRACT
Navigating through the debris of the information explosion requires powerful,
flexible search tools. These tools must be both useful and useable; that is, they
must do their jobs effectively without placing too many burdens on the user. While
general interest search engines, such as Google, have addressed this latter challenge
well, more topic-specific search engines, such as PubMed, have not. These search
engines, though effective, often require training in their use, as well as in-depth
knowledge of the domain over which they operate. Furthermore, search results
are often returned in an order irrespective of users’ preferences, forcing them to
manually search through search results in order to find the documents they find
most useful.
To solve these problems, we intend to learn ranking functions from user rele-
vance preferences. Applying these ranking functions to search results allows us to
improve search usability without having to reengineer existing, effective search en-
gines. Using ranking SVMs and active learning techniques, we can effectively learn
what is relevant to a user from relatively small amounts of preference data, and
apply these learned models as ranking functions. This gives users the convenience
of seeing relevance-ordered search results, which are tailored to their preferences as
opposed to using a one-size-fits-all sorting method. As giving preference feedback
does not require in-depth domain knowledge, this approach is suitable for use by
domain experts as well as neophytes. Furthermore, giving preference feedback does
not require a great deal of training, adding very little overhead to the search process.

2
Abstract Approved:Thesis Supervisor
Title and Department
Date

LEARNING TO RANK DOCUMENTS WITH SUPPORT VECTORMACHINES VIA ACTIVE LEARNING
by
Robert James Arens
A thesis submitted in partial fulfillment of therequirements for the Doctor of Philosophy
degree in Computer Science in theGraduate College of The
University of Iowa
December 2009
Thesis Supervisor: Professor Alberto Segre

Copyright by
ROBERT JAMES ARENS
2009All Rights Reserved

Graduate CollegeThe University of Iowa
Iowa City, Iowa
CERTIFICATE OF APPROVAL
PH.D. THESIS
This is to certify that the Ph.D. thesis of
Robert James Arens
has been approved by the Examining Committeefor the thesis requirement for the Doctor ofPhilosophy degree in Computer Science at the December 2009graduation.
Thesis Committee:Alberto Segre, Thesis Supervisor
Padmini Srinivasan
Nick Street
Faiz Currim
Juan Pablo Hourcade

To my family
ii

ACKNOWLEDGMENTS
This thesis could not have been completed without the help of many people.
I would like to thank Dr. Steve Bruell, Dr. Padmini Srinivasan, and Dr. Nick
Street for their constant encouragement. I would also like to thank the entire
administrative staff of the Computer Science Department, especially Catherine Till,
the source from which all good things flow.
iii

ABSTRACT
Navigating through the debris of the information explosion requires powerful,
flexible search tools. These tools must be both useful and useable; that is, they
must do their jobs effectively without placing too many burdens on the user. While
general interest search engines, such as Google, have addressed this latter challenge
well, more topic-specific search engines, such as PubMed, have not. These search
engines, though effective, often require training in their use, as well as in-depth
knowledge of the domain over which they operate. Furthermore, search results
are often returned in an order irrespective of users’ preferences, forcing them to
manually search through search results in order to find the documents they find
most useful.
To solve these problems, we intend to learn ranking functions from user rele-
vance preferences. Applying these ranking functions to search results allows us to
improve search usability without having to reengineer existing, effective search en-
gines. Using ranking SVMs and active learning techniques, we can effectively learn
what is relevant to a user from relatively small amounts of preference data, and
apply these learned models as ranking functions. This gives users the convenience
of seeing relevance-ordered search results, which are tailored to their preferences
as opposed to using a one-size-fits-all sorting method. As giving preference feed-
back does not require in-depth domain knowledge, this approach is suitable for use
by domain experts as well as neophytes. Furthermore, giving preference feedback
does not require a great deal of training, adding very little overhead to the search
process.
iv

TABLE OF CONTENTS
Page
LIST OF TABLES . . . . . . . . . . . . . . . . . . . . . . . . . . . . . . . . viii
LIST OF FIGURES . . . . . . . . . . . . . . . . . . . . . . . . . . . . . . . x
CHAPTER
1 INTRODUCTION 1
1.1 Overview . . . . . . . . . . . . . . . . . . . . . . . . . . . . . . . 11.2 Motivation: Searching MEDLINE with PubMed . . . . . . . . . 2
1.2.1 MEDLINE and PubMed . . . . . . . . . . . . . . . . . . 2
2 FOUNDATIONS AND RELATED WORK 10
2.1 Information Retrieval . . . . . . . . . . . . . . . . . . . . . . . . 102.1.1 Basic Retrieval and Sorting of Documents . . . . . . . . 102.1.2 Term Weighting . . . . . . . . . . . . . . . . . . . . . . . 122.1.3 Stemming . . . . . . . . . . . . . . . . . . . . . . . . . . 132.1.4 Relevance Feedback and Query Expansion . . . . . . . . 132.1.5 Evaluation of Information Retrieval Systems . . . . . . . 15
2.2 Support Vector Machines . . . . . . . . . . . . . . . . . . . . . . 192.2.1 Linear SVMs . . . . . . . . . . . . . . . . . . . . . . . . 192.2.2 Nonlinear SVMs . . . . . . . . . . . . . . . . . . . . . . . 212.2.3 Ranking SVMs . . . . . . . . . . . . . . . . . . . . . . . 222.2.4 SVMs and Information Retrieval . . . . . . . . . . . . . . 23
2.3 Active Learning . . . . . . . . . . . . . . . . . . . . . . . . . . . 232.3.1 SVMs and Active Learning . . . . . . . . . . . . . . . . . 24
2.4 Learning to Rank from Preferences . . . . . . . . . . . . . . . . 24
3 DATA COLLECTIONS 27
3.1 Biomedical Data Collections . . . . . . . . . . . . . . . . . . . . 273.1.1 MEDLINE . . . . . . . . . . . . . . . . . . . . . . . . . . 273.1.2 OHSUMED . . . . . . . . . . . . . . . . . . . . . . . . . 313.1.3 LETOR . . . . . . . . . . . . . . . . . . . . . . . . . . . 31
3.2 Enterprise Data Collection . . . . . . . . . . . . . . . . . . . . . 323.2.1 TREC Enterprise 2007 . . . . . . . . . . . . . . . . . . . 323.2.2 Dublin Core Metadata . . . . . . . . . . . . . . . . . . . 35
4 DESCRIPTION OF SYSTEM AND SIMULATION FRAMEWORK 37
v

4.1 Initial Retrieval . . . . . . . . . . . . . . . . . . . . . . . . . . . 394.2 The Feedback Round . . . . . . . . . . . . . . . . . . . . . . . . 394.3 Ranking . . . . . . . . . . . . . . . . . . . . . . . . . . . . . . . 394.4 Choosing Examples . . . . . . . . . . . . . . . . . . . . . . . . . 404.5 Eliciting Feedback . . . . . . . . . . . . . . . . . . . . . . . . . . 404.6 Convergence Threshold . . . . . . . . . . . . . . . . . . . . . . . 41
4.6.1 The Kendall Tau Rank Correlation Coefficient . . . . . . 41
5 SIMULATIONS IN THE BIOMEDICAL DOMAIN 43
5.1 Adapting the General Framework to the Biomedical Domain . . 435.2 Simulations Using OHSUMED . . . . . . . . . . . . . . . . . . . 44
5.2.1 Motivation for Using the Interquartile Mean . . . . . . . 455.2.2 Results and Discussion . . . . . . . . . . . . . . . . . . . 47
5.3 Active Learning by Proximity Sampling . . . . . . . . . . . . . . 565.3.1 Results and Discussion . . . . . . . . . . . . . . . . . . . 57
5.4 Nonrandom Seeding of Feedback Rounds . . . . . . . . . . . . . 575.4.1 Results and Discussion . . . . . . . . . . . . . . . . . . . 61
5.5 Simulation with a Gradient Oracle . . . . . . . . . . . . . . . . . 615.5.1 Results and Discussion . . . . . . . . . . . . . . . . . . . 64
5.6 Conclusion . . . . . . . . . . . . . . . . . . . . . . . . . . . . . . 66
6 SIMULATIONS IN THE ENTERPRISE DOMAIN 68
6.1 Adapting the General Framework to the Enterprise Domain . . 686.2 Simulations Using the TREC Enterprise 2007 Data Set . . . . . 696.3 Results and Discussion . . . . . . . . . . . . . . . . . . . . . . . 69
6.3.1 Limitations . . . . . . . . . . . . . . . . . . . . . . . . . 716.4 Conclusion . . . . . . . . . . . . . . . . . . . . . . . . . . . . . . 72
7 USER STUDY IN THE BIOMEDICAL DOMAIN 73
7.1 User Study . . . . . . . . . . . . . . . . . . . . . . . . . . . . . . 737.1.1 Participants . . . . . . . . . . . . . . . . . . . . . . . . . 747.1.2 Materials and Procedure . . . . . . . . . . . . . . . . . . 74
7.2 Results and Discussion . . . . . . . . . . . . . . . . . . . . . . . 767.2.1 Ranking Performance . . . . . . . . . . . . . . . . . . . . 777.2.2 Satisfaction Survey . . . . . . . . . . . . . . . . . . . . . 787.2.3 Limitations . . . . . . . . . . . . . . . . . . . . . . . . . 78
7.3 Conclusion . . . . . . . . . . . . . . . . . . . . . . . . . . . . . . 80
8 CONCLUSION AND FUTURE WORK 81
8.1 Future Work . . . . . . . . . . . . . . . . . . . . . . . . . . . . . 828.1.1 Full User Study . . . . . . . . . . . . . . . . . . . . . . . 828.1.2 Expansion into Legal Discovery . . . . . . . . . . . . . . 82
vi

8.1.3 Active Learning Methods . . . . . . . . . . . . . . . . . . 838.1.4 Consistency Checking and Concept Drift . . . . . . . . . 848.1.5 Collaborative Filtering . . . . . . . . . . . . . . . . . . . 85
APPENDIX
A USER STUDY MATERIALS 86
A.1 Training Document . . . . . . . . . . . . . . . . . . . . . . . . . 86A.2 Consent Form . . . . . . . . . . . . . . . . . . . . . . . . . . . . 87A.3 Demographic Survey . . . . . . . . . . . . . . . . . . . . . . . . 88A.4 Satisfaction Survey . . . . . . . . . . . . . . . . . . . . . . . . . 88
vii
LIST OF TABLES
Table
3.1 Calculation of low-level LETOR features . . . . . . . . . . . . . . . 33
3.2 Calculation of high-level LETOR features . . . . . . . . . . . . . . . 33
5.1 Skewness calculated across all thresholds and examples per round fortop sampling . . . . . . . . . . . . . . . . . . . . . . . . . . . . . . 47
5.2 NDCG calculated across all queries at positions 1 through 10 forranking SVMs trained on all data available for a query. . . . . . . . 47
5.3 Averaged performance for random sampling method, for all exam-ples per round and thresholds. The top subtable reports NDCG@10,middle reports number of rounds until the convergence threshold ismet, bottom reports number of examples seen until convergence. . . 49
5.4 Averaged performance for mid sampling method, for all examples perround and thresholds. The top subtable reports NDCG@10, middlereports number of rounds until the convergence threshold is met,bottom reports total number of examples seen until convergence. . . 50
5.5 Averaged performance for top sampling method, for all examplesper round and thresholds. Top subtable reports NDCG@10, middlereports number of rounds until the convergence threshold is met,bottom reports total number of examples seen until convergence. . . 51
5.6 Standard deviations in performance for top sampling. Italics indi-cates standard deviations significantly higher than the mean standarddeviation, while boldface indicates significantly smaller standard de-viations. . . . . . . . . . . . . . . . . . . . . . . . . . . . . . . . . . 56
5.7 Averaged performance for proximity sampling method, for all ex-amples per round and thresholds. Top subtable reports NDCG@10,middle reports number of rounds until the convergence threshold ismet, bottom reports total number of examples seen until convergence. 59
5.8 Averaged performance for random vs. nonrandom seeding methodsover all examples per round at a threshold of 0.9. Top subtablereports NDCG@10, middle reports number of rounds until the con-vergence threshold is met, bottom reports total number of examplesseen until convergence. . . . . . . . . . . . . . . . . . . . . . . . . . 63
5.9 Averaged results for the gradient oracle experiments. . . . . . . . . 64
viii

6.1 Averaged performance for top sampling method, for all examples perround at a stopping threshold of 0.9. . . . . . . . . . . . . . . . . . 69
6.2 NDCG@10 compared to average percentage of data utilized, for OHSUMEDdata vs. TREC Enterprise data. Calculation is done for all numbersof examples per round using top sampling and a stopping thresholdof 0.9. . . . . . . . . . . . . . . . . . . . . . . . . . . . . . . . . . . 71
7.1 Search query, number of results retrieved, and NDCG@10 for theeight queries analyzed for ranking performance. . . . . . . . . . . . 77
ix

LIST OF FIGURES
Figure
1.1 Picture of slider interface from [36] . . . . . . . . . . . . . . . . . . 5
1.2 PubMed query produced by the settings in Figure 1.1, from the sys-tem described in [36] . . . . . . . . . . . . . . . . . . . . . . . . . . 6
2.1 Sample precision and recall curve . . . . . . . . . . . . . . . . . . . 17
2.2 Normalized recall curve . . . . . . . . . . . . . . . . . . . . . . . . . 18
3.1 Sample view of the results page from PubMed. Inset: documentranking options. . . . . . . . . . . . . . . . . . . . . . . . . . . . . . 28
3.2 Sample MeSH hierarchy . . . . . . . . . . . . . . . . . . . . . . . . 30
3.3 Full translation of the query “diabetes” . . . . . . . . . . . . . . . . 30
4.1 Illustration of learning ranking functions from user feedback . . . . 38
5.1 Box and whisker plot of the distribution of performance across the101 queries for top sampling at a convergence threshold of 0.9, acrossall examples per round. . . . . . . . . . . . . . . . . . . . . . . . . . 46
5.2 Comparison of the total number of examples seen to NDCG@10 forall sampling methods, at thresholds 0.7, 0.8 and 0.9. Markers indicatenumber of examples per round, from one to five. . . . . . . . . . . . 53
5.3 Total number of examples seen vs. examples per round, plotted forall convergence thresholds. . . . . . . . . . . . . . . . . . . . . . . . 55
5.4 NDCG@10 vs. total examples seen until convergence for proximitysampling learning experiments. Values are for all sampling methods,thresholds, and examples per round. . . . . . . . . . . . . . . . . . . 58
5.5 NDCG@10 calculated for rankings produced by the 25 LETOR fea-tures. L1 T through L10 T indicate features L1-L10 calculated overthe title, and L1 A through L10 A indicate features L1-L10 calculatedover the abstract. . . . . . . . . . . . . . . . . . . . . . . . . . . . . 60
5.6 NDCG@10 vs. total examples seen until convergence for nonrandomseeding methods for all examples per round and at a convergencethreshold of 0.9. . . . . . . . . . . . . . . . . . . . . . . . . . . . . . 62
x
5.7 NDCG@10 calculated for Gradient Oracle values, dashed line indi-cates the line x = y. Note that values along the x-axis are in de-creasing order, to better demonstrate declining performance as theoracle’s accuracy declines. . . . . . . . . . . . . . . . . . . . . . . . 65
6.1 Performance comparison with TREC Enterprise 2007 systems, ourperformance in grey. . . . . . . . . . . . . . . . . . . . . . . . . . . 70
7.2 Results from the demographic survey. Each graph is labeled with thequestion answered, and the percentage of respondents choosing theindicated response. . . . . . . . . . . . . . . . . . . . . . . . . . . . 75
7.3 Documents retrieved vs. documents seen for all queries. . . . . . . . 78
7.5 Results from the user satisfaction survey. Each graph is labeled withthe question answered, and the percentage of respondents choosingthe indicated response. . . . . . . . . . . . . . . . . . . . . . . . . . 79
A.1 Screenshot of the demographic survey . . . . . . . . . . . . . . . . . 89
A.2 Screenshot of the satisfaction survey . . . . . . . . . . . . . . . . . 90
xi
1
CHAPTER 1
INTRODUCTION
1.1 Overview
Navigating through the debris of the information explosion requires powerful,
flexible search tools. These tools must be both useful and useable; that is, they
must do their jobs effectively without placing too many burdens on the user. While
general interest search engines, such as Google, have addressed this latter challenge
well, more topic-specific search engines, such as PubMed, have not. These search
engines, though effective, often require training in their use, as well as in-depth
knowledge of the domain over which they operate. Furthermore, search results
are often returned in an order irrespective of users’ preferences, forcing them to
manually search through search results in order to find the documents they find
most useful.
To solve these problems, we intend to learn ranking functions from user rele-
vance preferences. Applying these ranking functions to search results allows us to
improve search usability without having to reengineer existing, effective search en-
gines. Using ranking SVMs and active learning techniques, we can effectively learn
what is relevant to a user from relatively small amounts of preference data, and
apply these learned models as ranking functions. This gives users the convenience
of seeing relevance-ordered search results, which are tailored to their preferences as
opposed to using a one-size-fits-all sorting method. As giving preference feedback
does not require in-depth domain knowledge, this approach is suitable for use by
domain experts as well as neophytes. Furthermore, giving preference feedback does

2
not require a great deal of training, adding very little overhead to the search process.
1.2 Motivation: Searching MEDLINE withPubMed
MEDLINE search via PubMed serves as an illustrative microcosm of the chal-
lenges we seek to address. While work presented in this thesis does not focus solely
on this search domain, it is used in our simulation framework simulation and as
a sample application for our user study. The importance of improving the search
experience for this system is evidenced not only by its ubiquity, but also by the
amount of academic work seeking to improve it.
1.2.1 MEDLINE and PubMed
MEDLINE is the National Library of Medicine’s bibliographic database. It
contains over 18 million citations from over 5,000 publications [39], and can be
searched online using the PubMed search engine. The use of this resource is ubiqui-
tous throughout the biomedical community and beyond, by researchers, clinicians,
and amateurs interested in the field.
The PubMed search engine is quite robust, implementing a number of features
to improve coverage and automatically improve user queries. Chief among these re-
finements is the use of Medical Subject Heading (MeSH) hierarchy metadata terms.
Citations in MEDLINE are tagged with one or more MeSH terms, describing the
content of the article as well as its structure (e.g., drug study, clinical trial, cohort
study, etc.) and country of origin. These terms are arranged hierarchically, with
specific topics organized under more general topics (e.g., “Head” is under “Body
Regions”, which is under “Anatomy”). Users can employ MeSH terms in their
3
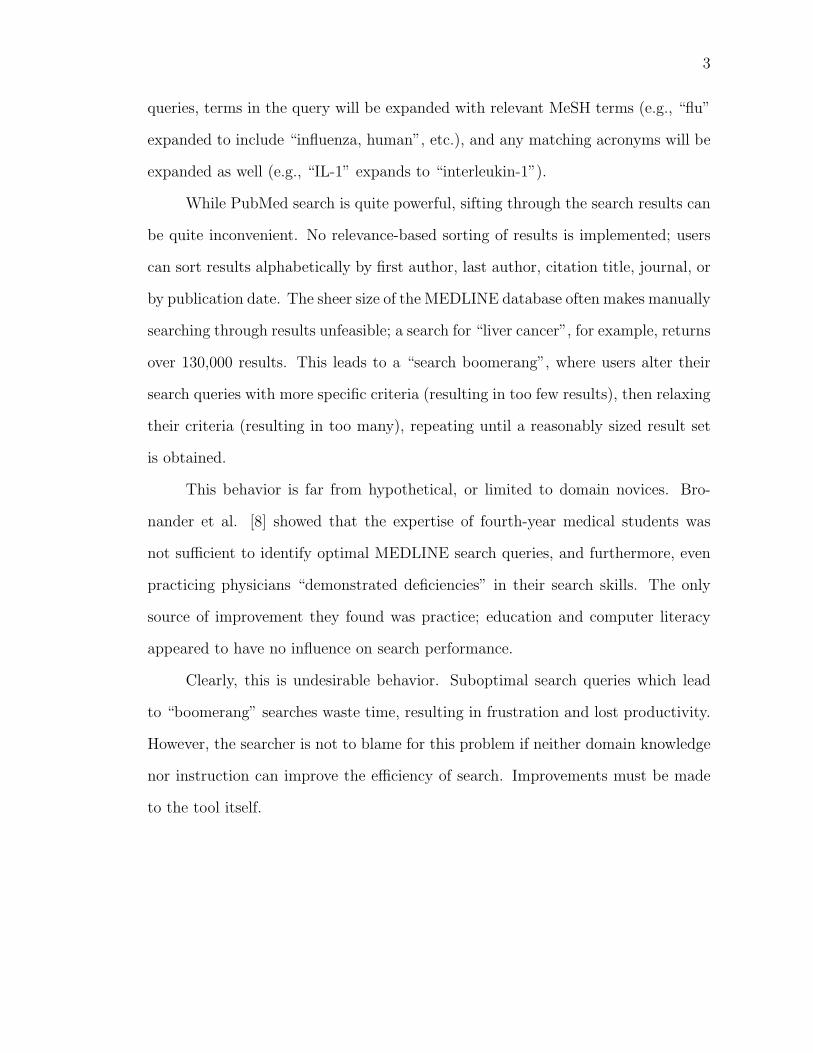
queries, terms in the query will be expanded with relevant MeSH terms (e.g., “flu”
expanded to include “influenza, human”, etc.), and any matching acronyms will be
expanded as well (e.g., “IL-1” expands to “interleukin-1”).
While PubMed search is quite powerful, sifting through the search results can
be quite inconvenient. No relevance-based sorting of results is implemented; users
can sort results alphabetically by first author, last author, citation title, journal, or
by publication date. The sheer size of the MEDLINE database often makes manually
searching through results unfeasible; a search for “liver cancer”, for example, returns
over 130,000 results. This leads to a “search boomerang”, where users alter their
search queries with more specific criteria (resulting in too few results), then relaxing
their criteria (resulting in too many), repeating until a reasonably sized result set
is obtained.
This behavior is far from hypothetical, or limited to domain novices. Bro-
nander et al. [8] showed that the expertise of fourth-year medical students was
not sufficient to identify optimal MEDLINE search queries, and furthermore, even
practicing physicians “demonstrated deficiencies” in their search skills. The only
source of improvement they found was practice; education and computer literacy
appeared to have no influence on search performance.
Clearly, this is undesirable behavior. Suboptimal search queries which lead
to “boomerang” searches waste time, resulting in frustration and lost productivity.
However, the searcher is not to blame for this problem if neither domain knowledge
nor instruction can improve the efficiency of search. Improvements must be made
to the tool itself.

4
1.2.1.1 Improvements to PubMed/MEDLINE
Here we present a selection of work aimed at improving the search experience
for users of MEDLINE and PubMed. This is by no means a comprehensive survey of
the available literature, but a representative view of different approaches illustrat-
ing the breadth of the improvement problem. This section is split into two general
areas of research; improvements to the search faculty itself, and improvements to
the presentation of search results.
Improvements to Search
While PubMed offers users a powerful search system, learning that system
can be an impediment to its use. Lewis et al. [33] sought to obviate this issue
by implementing a “free-text” query system, which took as its input a paragraph
of prose text regarding the subject to be searched, and returned documents simi-
lar to that input paragraph. A number of methods for computing similarity were
tested, each producing a score based on comparing individual words from the input
paragraph to words in the target documents. In a similar vein, Goetz and von der
Lieth [22] used a pool of representative documents to generate search results by
mining that pool for a set of words occurring significantly more often in the pool
than MEDLINE documents in general. Other documents were scanned and scored
for their relevance to the set of discriminating words.
These search methods provide a number of improvements over PubMed search.
Both systems remove the need for a user to learn the complicated PubMed search
system. Furthermore, search results can be presented in order of relevance to the
user’s query since a similarity score is computed. These improvements come at the
cost of not taking advantage of PubMed’s features, which is quite a high price to
5
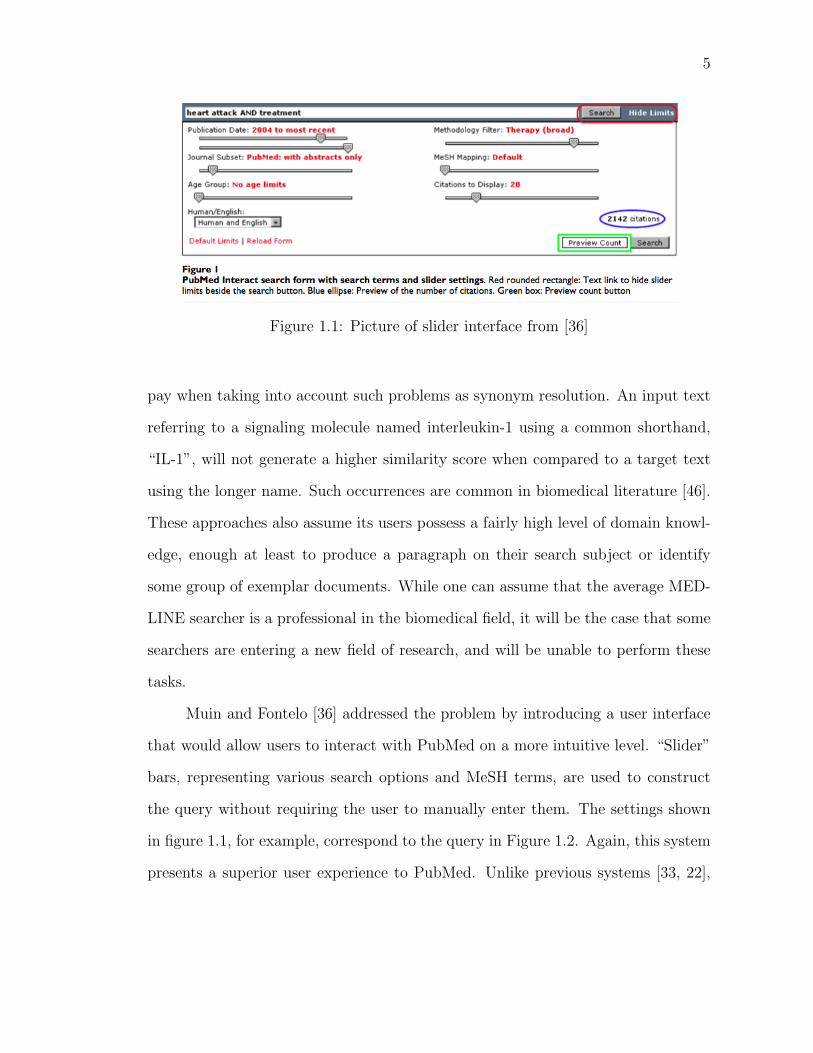
Figure 1.1: Picture of slider interface from [36]
pay when taking into account such problems as synonym resolution. An input text
referring to a signaling molecule named interleukin-1 using a common shorthand,
“IL-1”, will not generate a higher similarity score when compared to a target text
using the longer name. Such occurrences are common in biomedical literature [46].
These approaches also assume its users possess a fairly high level of domain knowl-
edge, enough at least to produce a paragraph on their search subject or identify
some group of exemplar documents. While one can assume that the average MED-
LINE searcher is a professional in the biomedical field, it will be the case that some
searchers are entering a new field of research, and will be unable to perform these
tasks.
Muin and Fontelo [36] addressed the problem by introducing a user interface
that would allow users to interact with PubMed on a more intuitive level. “Slider”
bars, representing various search options and MeSH terms, are used to construct
the query without requiring the user to manually enter them. The settings shown
in figure 1.1, for example, correspond to the query in Figure 1.2. Again, this system
presents a superior user experience to PubMed. Unlike previous systems [33, 22],

6
heart attack AND treatment AND ("2004"[PDAT]:"3000"[PDAT])
AND hasabstract AND (clinical trials[MeSH Terms] OR clinical
trial[Publication Type] OR random*[Title/Abstract] OR random
allocation[MeSH Terms] OR therapeutic use[MeSH Subheading]) AND
"humans"[MeSH Terms] AND English[Lang]
Figure 1.2: PubMed query produced by the settings in Figure 1.1, from the systemdescribed in [36]
the full power of PubMed’s search features are leveraged. Users are not required
to learn the MeSH terms that will allow them to search for differing age groups
or methodology types, and restricting results by date is quite intuitive. However,
users are presented with only a very narrow subset of the MeSH terms available
for search. Terms dealing with specific diseases, parts of the body, etc. are not
presented to the user. Furthermore, those terms that are presented are specifically
targeted towards papers dealing with human subjects. While this is certainly an
important avenue of research, the system is shutting out the not inconsequential
number of biomedical professionals conducting other types of research. As such, its
utility is limited.
Improvements to Results Presentation
Rather than attempting to improve PubMed at the retrieval stage, much work
has focused on improving the presentation of PubMed search results. This allows
researchers to leverage the power of PubMed’s retrieval refinements, allows seasoned
users to continue using search methods they’re already familiar with, and helps
mitigate the “boomerang” problem for both new and experienced users - since the
most relevant results are (theoretically) easily accessible, large retrieval sets are not
a problem.
Herskovic and Bernstam [27] used the PageRank algorithm [40] to rank results

7
by the number of citations to each result document, as well as the importance of
those citations, giving a ranking based on popularity and perceived authority of the
documents. Expanding on this idea, Plikus et al. [41] produced a suite of analytic
tools including a ranking scheme which used a statistical combination of the impact
factor of the journal in which the document was published, and the number of
forward citations to the document. This ranking scheme ensures that “important”
documents, those cited heavily and published in highly-regarded journals, will be
ranked above lesser-known works published in lower-impact journals. Lin et al.
[34] departed from the traditional ranking framework by first clustering similar
documents together, and then ranking documents in each cluster using citation
data. These clusters give users a more intuitive overview of their results than a
single ranked list can provide.
Each of these systems relies on citation-based ranking. While many searchers
will appreciate such a scheme, others may not; if a user’s information need can be
best satisfied by a less popular citation, that user will find such a ranking scheme
frustrating, and perhaps no better than no ranking at all.
Similar to the work done by Goetz and von der Lieth [22], Suomela and An-
drade [47] used a set of documents representing a certain area of interest to generate
a set of significant keywords, which were then used to score result documents for
relevance. Ranking in this way rewards documents similar to those used to generate
the keyword set and penalizes those which deviate. These methods share similar
drawbacks, in that they both require enough familiarity with the subject matter
to compile a set of exemplar documents. This potential failing may be addressed
by automatically generating the exemplar set; in Suomela and Andrade [47], the
authors generated an exemplar set of 81,416 documents by retrieving all PubMed

8
documents tagged with the MeSH term “stem cells”. While expedient, a ranking
generated in this manner will be too general to be of use when a more specific query
is presented. Furthermore, the authors show no evidence that their method works
well with a much smaller exemplar set, perhaps a few dozen or hundred documents.
1.2.1.2 Core Criticisms, and a Way Forward
The body of work presented in the previous section can be roughly divided into
two categories: systems which make assumptions of the users’ information needs,
and systems which require users to produce an exemplar before using the system.
The core issue with the former systems is that although those systems state the as-
sumptions they are making, and provide explanations for why those assumptions are
made, those systems will be of little to no use to users for whom those assumptions
do not stand. The core issue with the latter systems is the burden placed on the
users, both in terms of requisite domain knowledge and creation of the exemplar.
A reasonable middle ground must be struck in this tradeoff between assumption
and burden, providing users as much flexibility and freedom from assumption as
possible while requiring as little input as can be managed.
We here propose to achieve this middle ground by using machine learning
techniques to learn ranking functions from user feedback. This will be achieved by
using four existing technologies: information retrieval, feedback collection, support
vector machine (SVM) learning, and active learning. Information retrieval, in the
form of the PubMed search engine, will conduct the retrieval of documents based
on a user query. Feedback collection will allow us to collect information from the
user regarding the user’s preference on retrieved documents. SVM learning will
extrapolate a ranking function based on feedback collected, which will be used to

9
rank retrieved documents. Finally, active learning will provide a methodology to
minimize the amount of feedback needed to produce an accurate ranking function.
In Chapter 2, we present the foundations and work related to this thesis.
Chapter 3 presents the data sets used in simulation experiments on the system,
which is described in Chapter 4. The simulation experiments themselves are de-
scribed in Chapters 5 and 6. In Chapter 7, we describe a preliminary user study
designed to assess the viability of the proposed system in an online, ad-hoc search
environment. We offer concluding remarks in Chapter 8, along with future direc-
tions for the work presented in this thesis.

10
CHAPTER 2
FOUNDATIONS AND RELATED WORK
2.1 Information Retrieval
Document retrieval is a subfield of information retrieval dealing with the re-
trieval of text documents which contain information relevant to a user’s information
needs from a larger collection of documents. Use of a document retrieval system is
often an ad-hoc retrieval task; that is, users express their information needs as a
query to a search interface operating over the collection of documents they wish to
search. Results from this search are then presented to the user. Current document
retrieval systems often return these results to users sorted by their relevance to users
information needs, allowing users to quickly find the documents most relevant to
their searches.
2.1.1 Basic Retrieval and Sorting of Documents
Ad-hoc retrieval of documents in a collection based on a user query can be
done quite simply by finding documents which contain the same words contained
in the query, and returning them in a batch to the user. However, this method
fails to provide any measure of relevance these documents may have to the query
in question. Without this notion of relevance, users will be forced to sift through
these potentially large, unordered batches of documents to find the information they
require.
In order to conduct relevance-based retrieval, some method of comparison
between documents and queries must be employed. For this reason, documents and
queries in retrieval systems are expressed as vectors of the terms comprising the

11
collection over which the retrieval system operates. A document dj and query qk
can be expressed as vectors
dj = (t1,j, t2,j, t3,j, . . . , tN,j)
qk = (t1,k, t2,k, t3,k, . . . , tN,k)
of t features representing the N terms in the document collection [32]. The simplest
values these features can take on are binary values of one or zero, indicating the
presence or absence of a term. In this case, retrieval can be carried out by summing
the number of terms the document and query have in common with the following
similarity function [32].
sim(dj, qk) =N∑
i=1
ti,j × ti,k (2.1)
This similarity method, beyond simply finding documents relevant to the query, also
computes a score telling us how similar a document is to a query. This score can be
used to rank the documents in order of relevance, allowing the user to focus on highly
ranked documents instead of manually sorting through all retrieved documents to
find the ones most relevant to the user’s information needs.
Though simple, this binary retrieval scheme fails to acknowledge that certain
terms in a document may be more important than others. Weighting terms based
on some notion of the importance of the terms in the document and the collection
in general can greatly improve the effectiveness of the document retrieval system.
In this case, vectors are expressed as weights [32]
dj = (w1,j, w2,j, w3,j, . . . , wn,j)
qk = (w1,k, w2,k, w3,k, . . . , wn,k)
where a weight wi, j is the weight of term i in document j. This notation allows
us to represent the document collection as a term-by-document matrix, where the
columns of the matrix hold the documents and the rows hold the terms. Retrieval

12
can be conducted by finding the distance in vector space between a query and a
document via a vector dot product, yielding the following similarity function [32].
sim(dj, qk) = dj · qk =n∑
i=1
wi,j × wi,k (2.2)
2.1.2 Term Weighting
Term weighting refers to the process of assigning numerical significance to
words in a document in order to reflect the relative importance of those words in
reference to the rest of the document collection. Documents to be retrieved using
this similarity measure must have their terms weighted carefully in order to ensure
that retrieval is done correctly and efficiently. For example, terms could be weighted
by simply counting the number of occurrences of a term in a document (called term
frequency, or tf). More specifically, the tf of a term ti in a document dj can be
calculated as [2, 32]
tfi,j =ci,j∑
k∈djck,j
(2.3)
where ci,j indicates the count of occurrences of the term in the document. Simi-
larities computed from documents using this weighting scheme will be dominated
by longer documents, which will have large term weights, and thus produce higher
scores. These vectors can be converted into unit length vectors, or normalized, by
dividing each weight in a vector by the overall length of the vector, which is∑N
i=1w2i
for each document.
An additional factor in term weighting has to do with the number of documents
in which a term appears. A term appearing many times in a document may seem
to be important in describing the content of that document, but if many documents
in the collection also contain that term, then it cannot be considered to be a term
13
which discriminates the document from the rest of the collection. The tf of a term
can be scaled by this document frequency; since it is seen in the denominator of this
calculation, it is referred to as inverse document frequency (idf). It can be obtained
for a term ti in a collection D containing documents dj as follows [2, 32].
idfi = log|D|
|dj : ti ∈ dj|(2.4)
tf∗idf is a standard term weighting score for text retrieval systems. It provides
an accurate method to determine a term’s importance in a document relative to its
importance in a collection.
2.1.3 Stemming
Document representation for retrieval hinges on properly identifying the words
which make up the document’s content. Often, it is useful to reduce inflected forms
of words to their root form; for example, when trying to discover documents relating
how much money a business makes, we might like to lump the words earned, and
earnings together with their root earn. This process, called stemming, can greatly
increase retrieval performance by ensuring that terms are correctly weighted in a
document.
2.1.4 Relevance Feedback and Query Expansion
Performance of a document retrieval system can be improved by improving
user queries. Relevance feedback alters a query based on the distribution of terms
in documents relevant to the user’s information need. More specifically, given a
query qi returning a set of documents d with subsets r and s (where r ∪ s = d)
corresponding to the relevant and non-relevant documents respectively, the query
can be reformulated as [2, 32]

14
qi+1 = qi +β
|r|
|r|∑j=1
rj −γ
|s|
|s|∑k=1
sk (2.5)
where β and γ are scaling values between 0 and 1 where β + γ = 1. This new query
is then given to the document retrieval system. Relevance feedback can be repeated
on the new set of retrieved documents, or the set can be returned to the user.
Deciding which documents are relevant is a key element of relevance feedback.
In explicit relevance feedback, a set of documents is shown to the user, and the user
indicates which of these seem relevant [2]. In implicit relevance feedback, the system
records the user’s interaction with the system in order to determine relevance, e.g.,
by clicking on a link to a document, the system marks the document as relevant
[31]. In pseudo-relevance feedback, the user’s input is never requested; the system
simply assumes that some number of the top documents retrieved by the system
are relevant [2].
Another method of improving user queries is to expand them by adding terms
relevant to terms already in the query, before performing any retrieval. Resources
for expanding queries can include thesauri, taxonomies, and other controlled vocab-
ulary schemes. A thesaurus is a collection of lists of terms highly correlated to one
another, and is generally pre-computed by the document retrieval system [32]. It
can be based on a taxonomy or concept network, on the collection itself, or a com-
bination of these. Taxonomies arrange concepts in parent-child or super-subtype
relationships, as well as listing terms related to those concepts and synonyms for
those terms. They are generally created for a specific domain or text genre, though
more general taxonomies do exist, e.g., WordNet, a collection of 155,000 words
from English. Subject heading classification schemes, such as MeSH (see 1.2.1), can
utilize taxonomic arrangements while retaining thesaurus-like properties.

15
2.1.5 Evaluation of Information Retrieval Systems
When evaluating an information retrieval system, one must keep the primary
function of that system in mind; namely, to satisfy a user’s information need by
finding and providing pieces of information that fit that need. This must be done
both in an attempt to provide the best information possible, and to minimize the
time spent finding that information. Evaluation of this time component is appro-
priate for offline systems, as they have the luxury of spending minutes, hours, or
even days before returning a result. Online, ad-hoc systems, on the other hand,
must return results within the time of a web page loading to be useful; measuring
the exact amount of time taken beyond this is unnecessary. Therefore, we will focus
on measures for the effectiveness of the search.
2.1.5.1 Precision, Recall, and F-Score
Documents in a collection over which an information retrieval system operates
can be divided along two axes: documents which are relevant to a users need or
not, and documents which are retrieved by the users query or not [45]. Relevant
documents which are retrieved are called true positives (tp), and those not retrieved
are called false negatives (fn). Non-relevant documents which are retrieved are
called false positives (fp), and those not retrieved are called true negatives (tn).
One measure of the system’s performance, called precision, is the ratio of relevant
documents to total documents returned to the user. Another measure, recall, is the
ratio of relevant documents returned to total relevant documents in the set. These
measures are calculated as follows [45],
Precision =tp
tp+ fp(2.6)

16
Recall =tp
tp+ fn(2.7)
A high precision score indicates that the results returned to the user include
a low proportion of non-relevant documents, while a high recall score indicates that
the results include a large proportion of the available relevant documents.
Precision and recall usually exist in opposition to each other. By retrieving
more documents, a system is more likely to retrieve more relevant documents, in-
creasing its recall score; however, the results are likely to be diluted by non-relevant
documents, decreasing its precision. Similarly, by retrieving fewer documents, a
system is less likely to return non-relevant documents, increasing its precision at
the cost of recall. Individual system designers and users must decide whether their
needs are best met by systems focusing on one measure or the other, and tune
those systems accordingly. If both measures are equally important, a measure of
their harmonic mean can provide a single effectiveness number, called an F-score.
F-score is a standard measure used in information retrieval, and is calculated as
follows [32].
F =2× precision× recall
precision + recall(2.8)
2.1.5.2 Evaluating Ranked Lists
Precision and recall, as defined above, are calculated over the entire set of
retrieved documents. However, most information recall systems return documents
in sorted order. For a set of n retrieved documents, precision and recall numbers
can be calculated at positions one through n, showing how each measure changes
with respect to the other. The tradeoff between precision and recall can be shown
17
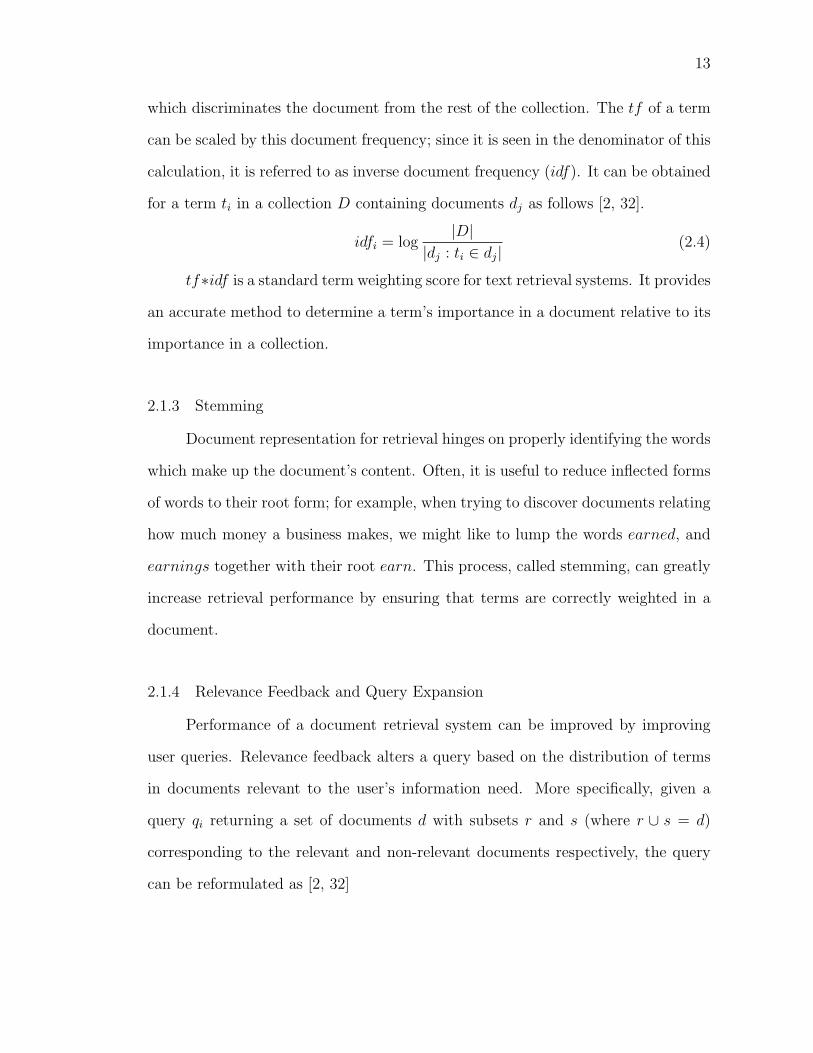
Doc. Position Relevant? Precision Recall
1 Yes 1.000 0.200
2 Yes 1.000 0.400
3 No 0.667 0.400
4 No 0.500 0.400
5 Yes 0.600 0.600
6 No 0.500 0.600
7 Yes 0.571 0.800
8 No 0.500 0.800
9 No 0.444 0.800
10 Yes 0.500 1.000
(a) (b)
Figure 2.1: Sample precision and recall curve
by plotting these values. Table 2.1a shows example precision and recall numbers for
a system retrieving ten documents, five of which are relevant. Figure 2.1b shows the
graph of precision vs. recall. In order to show the “best-case scenario” performance
of the system, an interpolated graph is also shown, computed by interpolating a
drop in precision as equal to the highest precision attained before the next drop
[45].
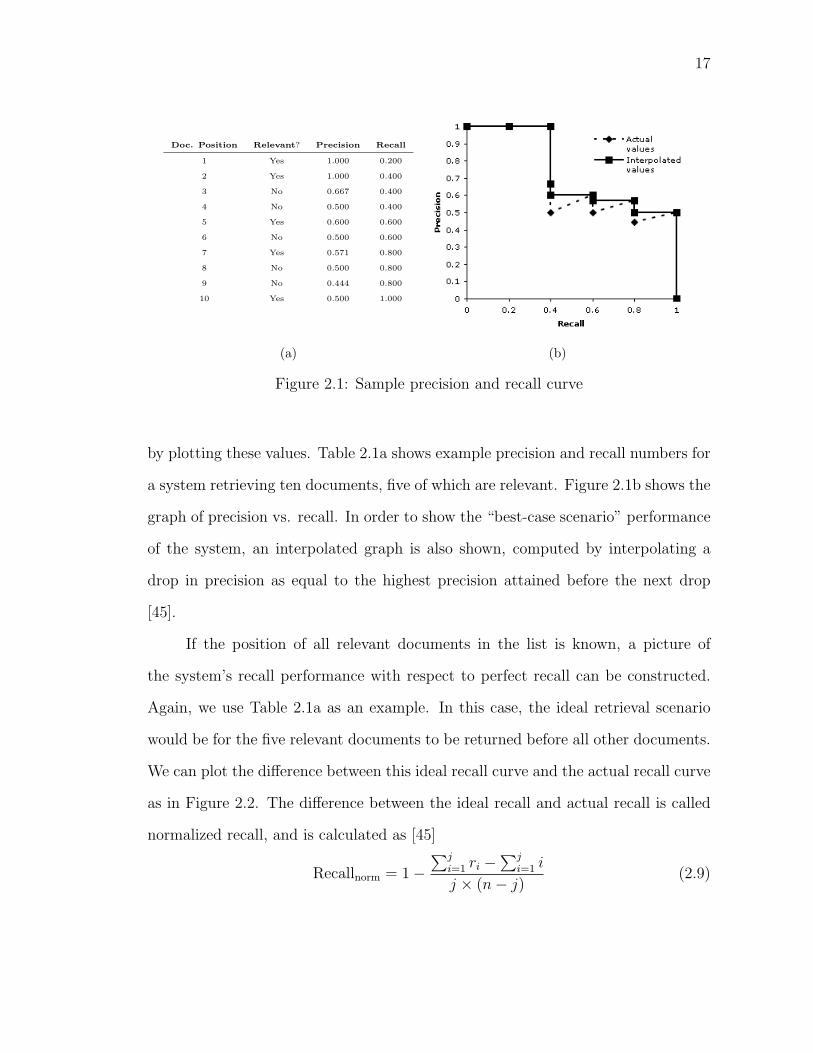
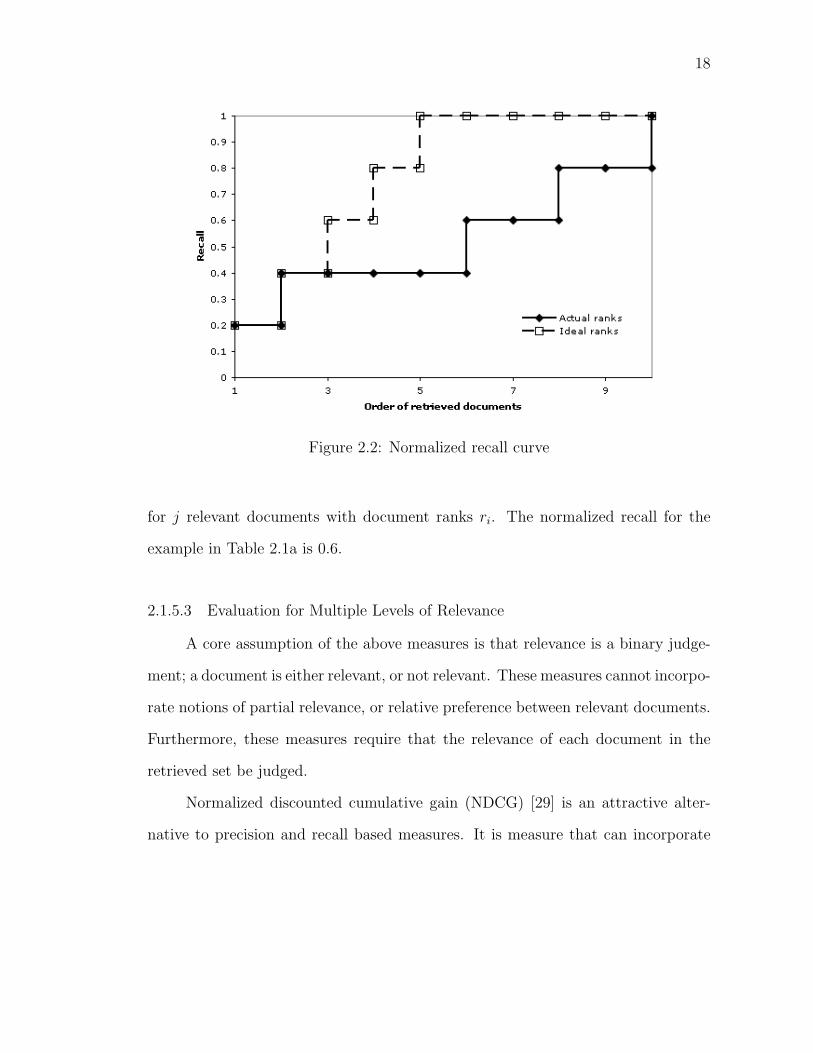
If the position of all relevant documents in the list is known, a picture of
the system’s recall performance with respect to perfect recall can be constructed.
Again, we use Table 2.1a as an example. In this case, the ideal retrieval scenario
would be for the five relevant documents to be returned before all other documents.
We can plot the difference between this ideal recall curve and the actual recall curve
as in Figure 2.2. The difference between the ideal recall and actual recall is called
normalized recall, and is calculated as [45]
Recallnorm = 1−∑j
i=1 ri −∑j
i=1 i
j × (n− j)(2.9)
18
Figure 2.2: Normalized recall curve
for j relevant documents with document ranks ri. The normalized recall for the
example in Table 2.1a is 0.6.
2.1.5.3 Evaluation for Multiple Levels of Relevance
A core assumption of the above measures is that relevance is a binary judge-
ment; a document is either relevant, or not relevant. These measures cannot incorpo-
rate notions of partial relevance, or relative preference between relevant documents.
Furthermore, these measures require that the relevance of each document in the
retrieved set be judged.
Normalized discounted cumulative gain (NDCG) [29] is an attractive alter-
native to precision and recall based measures. It is measure that can incorporate
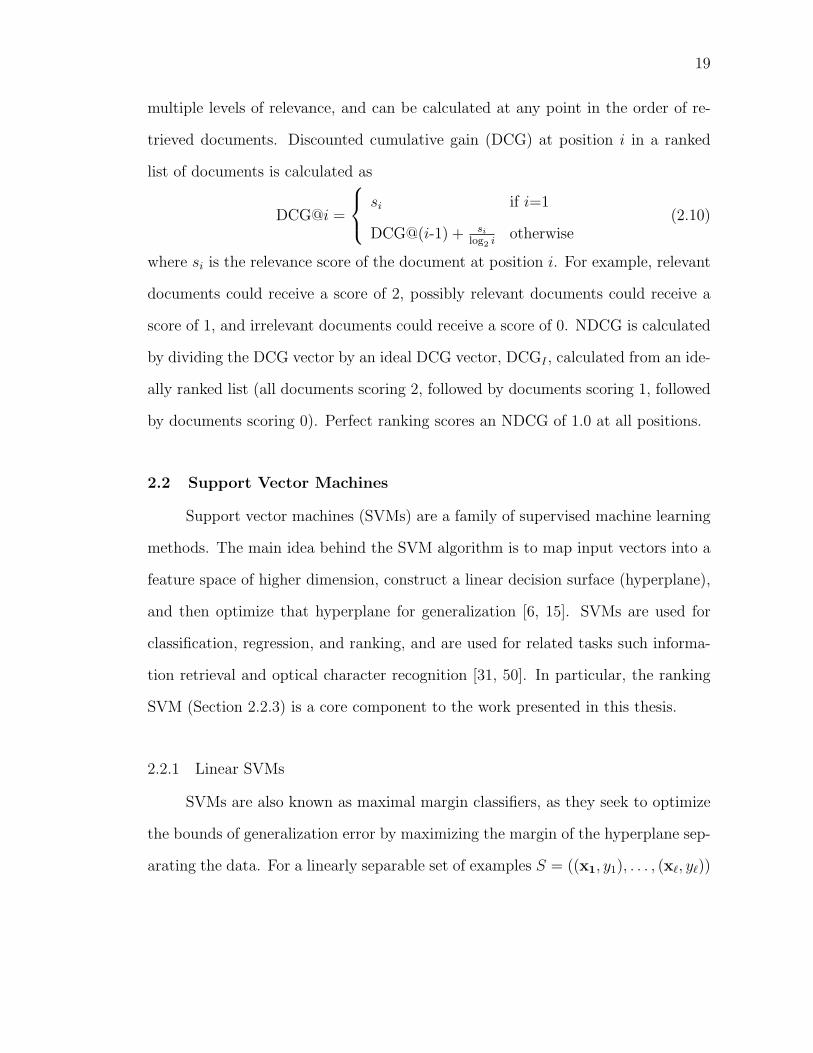
19
multiple levels of relevance, and can be calculated at any point in the order of re-
trieved documents. Discounted cumulative gain (DCG) at position i in a ranked
list of documents is calculated as
DCG@i =
si if i=1
DCG@(i-1) + si
log2 iotherwise
(2.10)
where si is the relevance score of the document at position i. For example, relevant
documents could receive a score of 2, possibly relevant documents could receive a
score of 1, and irrelevant documents could receive a score of 0. NDCG is calculated
by dividing the DCG vector by an ideal DCG vector, DCGI , calculated from an ide-
ally ranked list (all documents scoring 2, followed by documents scoring 1, followed
by documents scoring 0). Perfect ranking scores an NDCG of 1.0 at all positions.
2.2 Support Vector Machines
Support vector machines (SVMs) are a family of supervised machine learning
methods. The main idea behind the SVM algorithm is to map input vectors into a
feature space of higher dimension, construct a linear decision surface (hyperplane),
and then optimize that hyperplane for generalization [6, 15]. SVMs are used for
classification, regression, and ranking, and are used for related tasks such informa-
tion retrieval and optical character recognition [31, 50]. In particular, the ranking
SVM (Section 2.2.3) is a core component to the work presented in this thesis.
2.2.1 Linear SVMs
SVMs are also known as maximal margin classifiers, as they seek to optimize
the bounds of generalization error by maximizing the margin of the hyperplane sep-
arating the data. For a linearly separable set of examples S = ((x1, y1), . . . , (x`, y`))
20
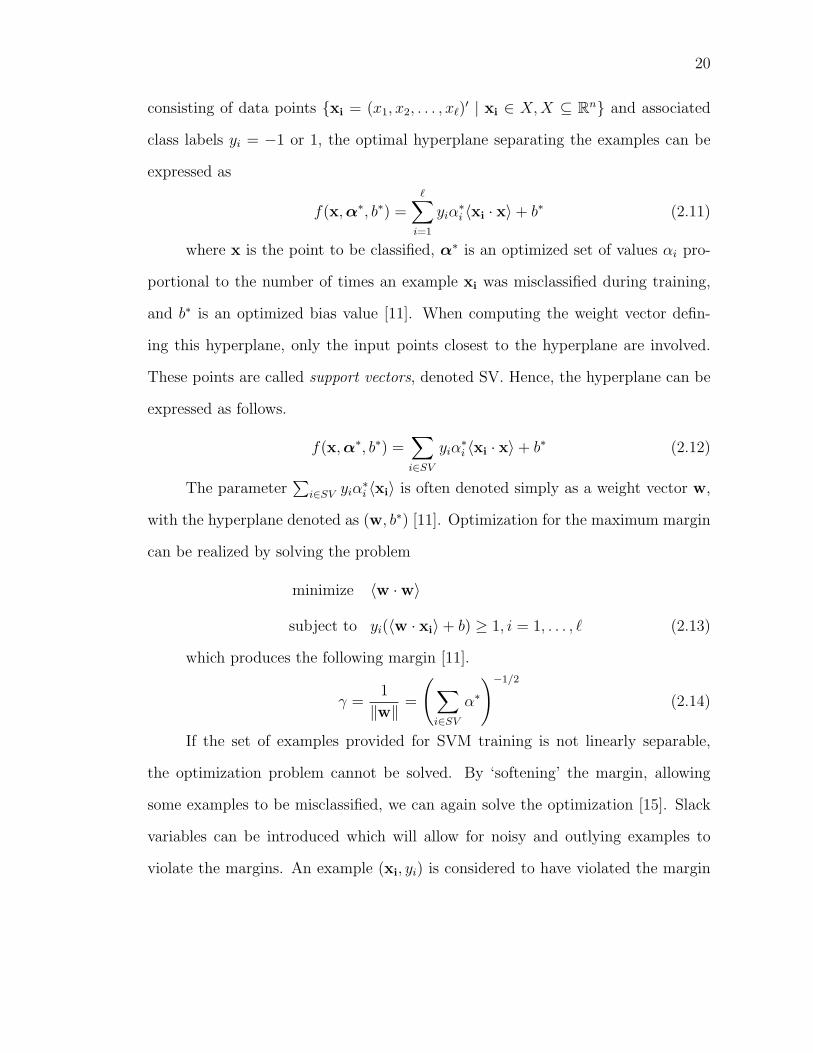
consisting of data points {xi = (x1, x2, . . . , x`)′ | xi ∈ X,X ⊆ Rn} and associated
class labels yi = −1 or 1, the optimal hyperplane separating the examples can be
expressed as
f(x,α∗, b∗) =∑i=1
yiα∗i 〈xi · x〉+ b∗ (2.11)
where x is the point to be classified, α∗ is an optimized set of values αi pro-
portional to the number of times an example xi was misclassified during training,
and b∗ is an optimized bias value [11]. When computing the weight vector defin-
ing this hyperplane, only the input points closest to the hyperplane are involved.
These points are called support vectors, denoted SV. Hence, the hyperplane can be
expressed as follows.
f(x,α∗, b∗) =∑i∈SV
yiα∗i 〈xi · x〉+ b∗ (2.12)
The parameter∑
i∈SV yiα∗i 〈xi〉 is often denoted simply as a weight vector w,
with the hyperplane denoted as (w, b∗) [11]. Optimization for the maximum margin
can be realized by solving the problem
minimize 〈w ·w〉
subject to yi(〈w · xi〉+ b) ≥ 1, i = 1, . . . , ` (2.13)
which produces the following margin [11].
γ =1
‖w‖=
(∑i∈SV
α∗
)−1/2
(2.14)
If the set of examples provided for SVM training is not linearly separable,
the optimization problem cannot be solved. By ‘softening’ the margin, allowing
some examples to be misclassified, we can again solve the optimization [15]. Slack
variables can be introduced which will allow for noisy and outlying examples to
violate the margins. An example (xi, yi) is considered to have violated the margin

21
when yif(xi) > γ. Hence, we define the slack variable for the example:
ξ((xi, yi), f, γ) = ξi = max(0, γ − yif(xi)) (2.15)
and the slack variable vector for the set S:
ξ = ξ(S, f, γ) = (ξ1, . . . , ξ`) (2.16)
We can now solve the optimization on data which is not linearly separable as
minimize 〈w ·w〉+ C∑i=1
ξi
subject to yi(〈w · xi〉+ b) ≥ 1− ξi, i = 1, . . . , `,
ξi ≥ 0, i = 1, . . . , ` (2.17)
where C is a parameter to be tuned during training [11].
2.2.2 Nonlinear SVMs
Real-world data sets are often not linearly separable, even when allowing for a
soft margin. In this case, we can map the input data points into another space via
a nonlinear mapping function φ : X → F , where X is the original data, or input,
space and F is known as the feature space [6, 11]. With this mapping in place, the
separating hyperplane can be represented as follows.
f(x,α∗, b∗) =∑i∈SV
yiα∗i 〈φ(xi) · φ(x)〉+ b∗ (2.18)
The inner product 〈φ(xi) · φ(x)〉 is known as a kernel function, written
K(xi,x). Kernels must be positive semi-definite transforms to be valid for use
as an SVM kernel [11]. As this work uses only linear SVMs, we will conclude our
discussion of kernelized SVMs here.
22
2.2.3 Ranking SVMs
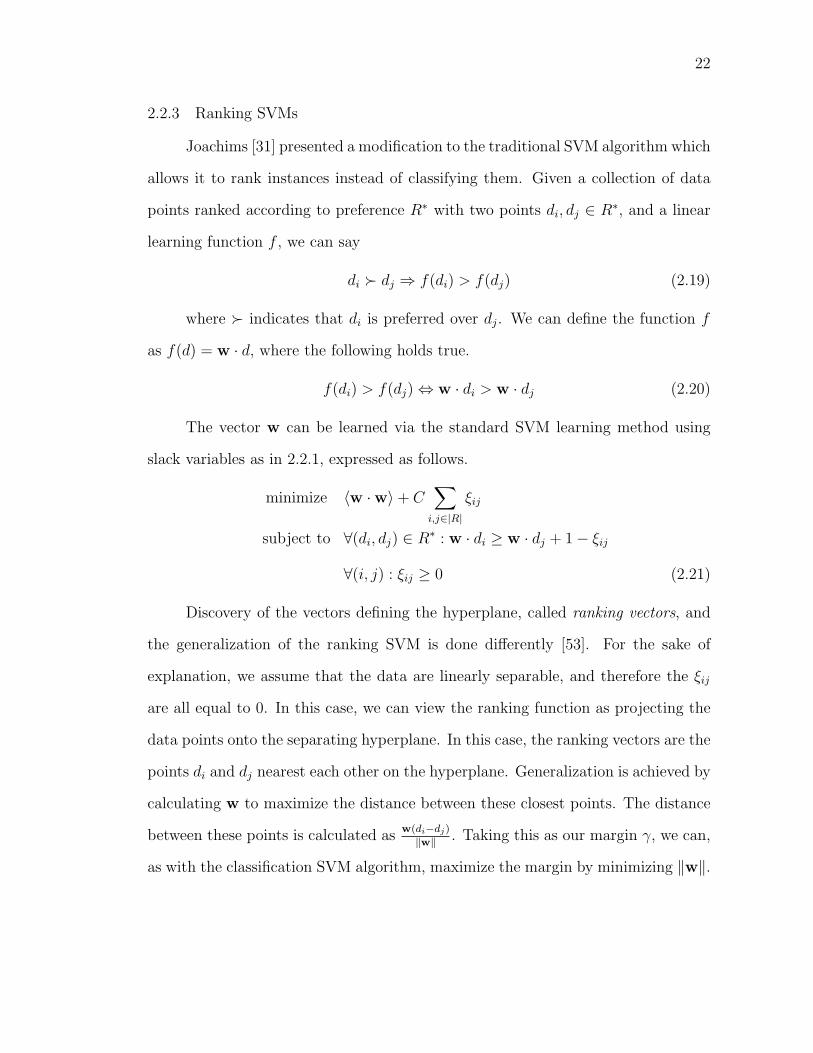
Joachims [31] presented a modification to the traditional SVM algorithm which
allows it to rank instances instead of classifying them. Given a collection of data
points ranked according to preference R∗ with two points di, dj ∈ R∗, and a linear
learning function f , we can say
di � dj ⇒ f(di) > f(dj) (2.19)
where � indicates that di is preferred over dj. We can define the function f
as f(d) = w · d, where the following holds true.
f(di) > f(dj)⇔ w · di > w · dj (2.20)
The vector w can be learned via the standard SVM learning method using
slack variables as in 2.2.1, expressed as follows.
minimize 〈w ·w〉+ C∑
i,j∈|R|
ξij
subject to ∀(di, dj) ∈ R∗ : w · di ≥ w · dj + 1− ξij
∀(i, j) : ξij ≥ 0 (2.21)
Discovery of the vectors defining the hyperplane, called ranking vectors, and
the generalization of the ranking SVM is done differently [53]. For the sake of
explanation, we assume that the data are linearly separable, and therefore the ξij
are all equal to 0. In this case, we can view the ranking function as projecting the
data points onto the separating hyperplane. In this case, the ranking vectors are the
points di and dj nearest each other on the hyperplane. Generalization is achieved by
calculating w to maximize the distance between these closest points. The distance
between these points is calculated asw(di−dj)
‖w‖ . Taking this as our margin γ, we can,
as with the classification SVM algorithm, maximize the margin by minimizing ‖w‖.

23
2.2.4 SVMs and Information Retrieval
SVMs have proven useful for information retrieval tasks similar to the one pro-
posed here. Drucker et al. [17] compared the use of SVMs for relevance feedback
to the Rocchio [44] and Ide [28] algorithms, and found that SVMs outperformed
both. Cao et al. [10] looked specifically at the problem of using SVMs for retrieval
and ranking of documents. One important finding of theirs relevant to this work is
that while an information retrieval system ought to be optimized for ranking the
most preferable documents, SVMs optimize generally for both high and low docu-
ment rankings. Ranking SVMs have also been used to learn ranking functions from
implicitly generated feedback [31, 42]. In [31], Joachims learned ranking functions
from search engine log files, using the clickthrough data from users as a way to im-
plicitly gather preference data. Results showed that models learned in this fashion
were effective at improving retrieval.
2.3 Active Learning
Active learning describes a learning method wherein the learning algorithm it-
self has some control over which examples are added to its training set. Specifically,
we need to ask a user to provide labels for some number of unlabeled examples. The
learner chooses these examples based on some measure of learning utility; for ex-
ample, choosing examples which will decrease the region of uncertainty in a learned
function [14]. Repeated rounds of active learning improve both the learned function
and the examples chosen for learning. Taking our previous measure as an example,
the reduction in the region of uncertainty produces a function with better general-
ization power; however, reducing the region of uncertainty has an added benefit of
24
leaving behind only examples which continue to contribute to uncertainty.
2.3.1 SVMs and Active Learning
Much of the literature on active learning for SVMs has focused on classifica-
tion, as opposed to ranking [19, 49]. Brinker [7] applied active learning to learning
ranking SVMs; however, this research focused on learning label ranking functions,
which is a fundamentally different task from document ranking. While document
ranking attempts to impose an ordering on a set of documents, label ranking at-
tempts to determine the preferred ordering of a fixed set of alternatives (labels)
for a given input instance. Tong and Chang [48] used pool-based active learning
for image retrieval. Their method of selecting examples for labeling was based on
the finding that by choosing examples which shrink the size of the version space in
which the optimal weight vector ~w can lie, the SVM learned from those examples
will approximate ~w. Therefore, examples are chosen which will most nearly bisect
the version space they occupy. This was achieved in practice by choosing examples
based on their proximity to the SVM boundary; examples close to the boundary are
likely to be more centrally located in the version space, and are thus more likely to
bisect it.
2.4 Learning to Rank from Preferences
Yu [53] constructed a system similar to the one to be presented here, operating
over real estate data, and noted that methods such those in [49] could not be
extended to learning ranking SVMs. As the ranking problem is more complex
than the classification problem, selective sampling for learning ranking SVMs was
conducted by selecting the most ambiguously ranked examples for labeling. This

25
was done by noting that ambiguity in ranking could be measured based on how
similarly the examples were ranked, with the closest pairs of examples being the
most ambiguous. This method for selection is directly analogous to that in [49],
even though it does not address reduction in version space; just as the support
vectors in a classifying SVM are those examples closest to the SVM boundary, the
support vectors in a ranking SVM are those examples that are most closely ranked.
You and Hwang [52] used a similar framework and data set to learn ranking in a
context-sensitive manner. Both of these works focused on general data retrieval,
however, as opposed to focusing on document retrieval.
Cohen, Schapire and Singer [13] modeled the ranking problem as a directed
graph G = (V,E) with instances as the graph’s vertices and the weight on an edge
between vertices Eu,v representing the strength of the preference of u over v. The
problem was split into two steps, i.e., learning the weights and then constructing
a ranking from the graph, and two methods for addressing this latter step were
introduced. Independent of ranking was the learning method, based on the Hedge
algorithm [21], which learned by updating weights based on expert input. The first
ranking algorithm was a greedy algorithm which computed the difference between
the total weight leaving a vertex and the total weight entering it, with larger values
indicating greater overall preference. The second ranking algorithm improved upon
the first by separating strongly connected vertices into separate ranking problems,
and combining the resulting rankings.
Burges et al. [9] used neural networks to rank using preferences by modeling
a probabilistic cost function for pairs of ranked instances. Cost in this case was
modeled as the cross-entropy cost between the known ranking of the pair and the
probability that the model will produce that ranking. The authors then showed how

26
these probabilities can be combined, allowing for computation of a cost function for
preference pairs. A neural network training algorithm was then implemented, using
the gradient of this function as an updating rule for the network’s weights.
Har-Peled et al. [24] formulated the problem in terms of constraint classifi-
cation using pairwise preferences. Specifically, given a set of instances and a set of
labels, the task is to find a function which will produce an ordering of the labels for
each instance. The authors achieve this by learning a binary classification model
Mi,j for each pair of labels yi, yj, with Mi,j predicting yi � yj. The output from
each classifier is tallied as a vote for the preferred label, and the labels are ranked
according to these votes.

27
CHAPTER 3
DATA COLLECTIONS
In this chapter, we give an overview of the data collections used in this thesis.
The biomedical data is used in the simulations found in Chapter 5 as well as the
user study in Chapter 7. The enterprise data set is used in the simulations found
in Chapter 6.
3.1 Biomedical Data Collections
3.1.1 MEDLINE
As stated in Section 1.2, MEDLINE is a database of bibliographic references
in biomedicine and health sciences, collected and curated by the NLM. Citations
are taken from approximately 5,200 sources (mostly journals) in 37 languages, with
the majority of journals selected for inclusion by a committee set up by the Na-
tional Institutes of Health (NIH). Other sources are included based on NLM or NIH
priorities (e.g., AIDS research). Dates covered range from 1949 to the present, with
some older material. The database currently contains over 16 million references,
with between two and four thousand added each week. 670,000 references were
added in 2007.
MEDLINE’s subject coverage is extensive. It covers areas ranging from public
heath policy to clinical care to bioengineering research, from humans to plants to
bacteria. The target audience for MEDLINE is the biomedical community at large,
including researchers, clinicians, educators, and amateurs. Most references include
full citation data, as well as the abstract for the reference. Many references also
contain links to the full article.
28
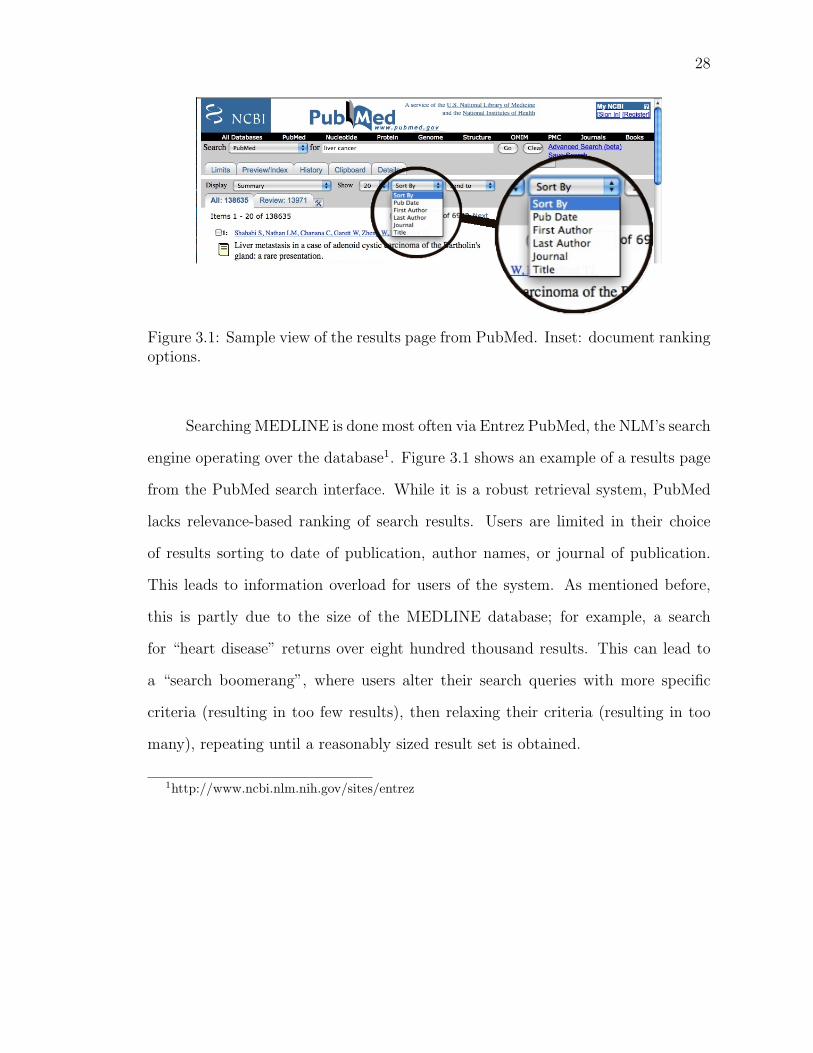
Figure 3.1: Sample view of the results page from PubMed. Inset: document rankingoptions.
Searching MEDLINE is done most often via Entrez PubMed, the NLM’s search
engine operating over the database1. Figure 3.1 shows an example of a results page
from the PubMed search interface. While it is a robust retrieval system, PubMed
lacks relevance-based ranking of search results. Users are limited in their choice
of results sorting to date of publication, author names, or journal of publication.
This leads to information overload for users of the system. As mentioned before,
this is partly due to the size of the MEDLINE database; for example, a search
for “heart disease” returns over eight hundred thousand results. This can lead to
a “search boomerang”, where users alter their search queries with more specific
criteria (resulting in too few results), then relaxing their criteria (resulting in too
many), repeating until a reasonably sized result set is obtained.
1http://www.ncbi.nlm.nih.gov/sites/entrez
29
3.1.1.1 MeSH Terms
To assist users in navigating through MEDLINE’s wealth of information, each
reference in the database is tagged with a number of MeSH terms. The preface to
[38] states that, “The Medical Subject Headings (MeSH) thesaurus is a controlled
vocabulary produced by the National Library of Medicine and used for indexing,
cataloging, and searching for biomedical and health-related information and doc-
uments.” The terms themselves are heterogeneous, and are of three types. De-
scriptors, or main headings, cover the content of the reference, as well as metadata
such as the publication type and components (e.g., clinical trial, editorial, historical
article, etc.) and the country of the reference’s origin. Qualifiers, or subheadings,
are used with descriptors to group together references dealing with a particular as-
pect of the descriptor; for example, pairing the qualifier “abnormalities” with the
descriptor “heart” would indicate that the reference in question is concerned with
congenital defects in the heart, as opposed to the heart itself. Finally, Supplemen-
tary Concept Records, or SCRs, catalogue specific drugs and chemicals referenced
in the article. Currently, there are 25,186 MeSH descriptors, with 83 qualifiers and
over 180,000 SCRs. References are manually tagged by human annotators.
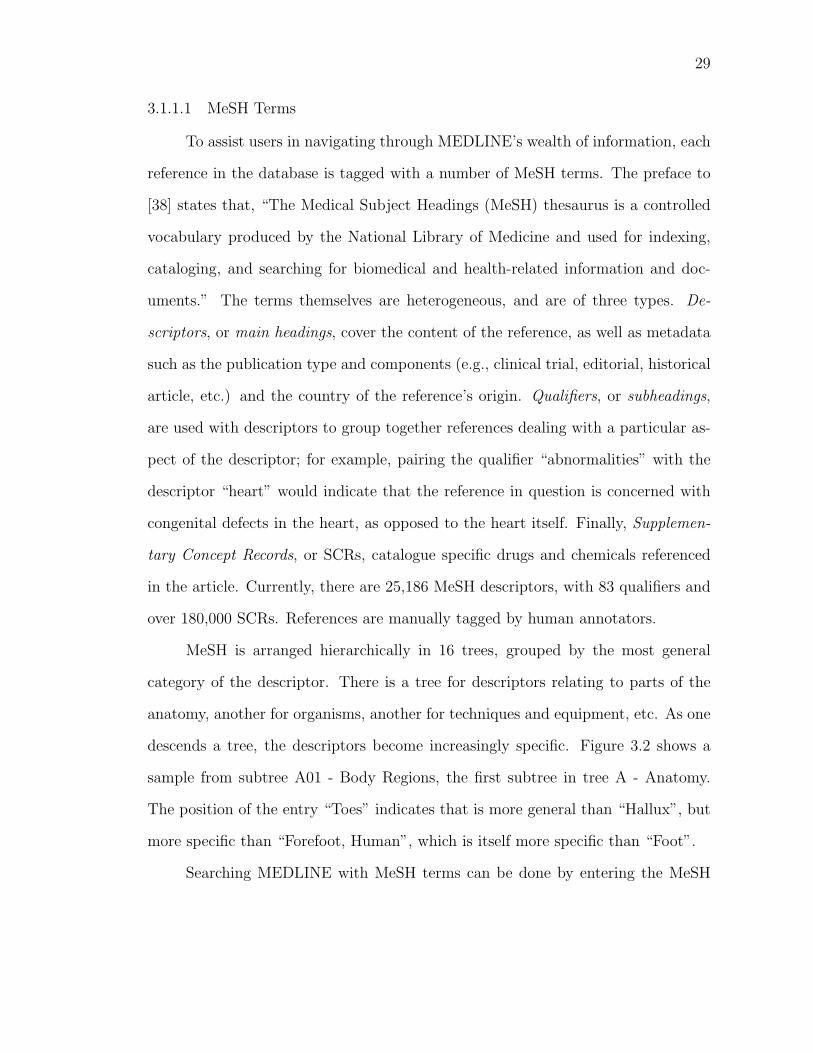
MeSH is arranged hierarchically in 16 trees, grouped by the most general
category of the descriptor. There is a tree for descriptors relating to parts of the
anatomy, another for organisms, another for techniques and equipment, etc. As one
descends a tree, the descriptors become increasingly specific. Figure 3.2 shows a
sample from subtree A01 - Body Regions, the first subtree in tree A - Anatomy.
The position of the entry “Toes” indicates that is more general than “Hallux”, but
more specific than “Forefoot, Human”, which is itself more specific than “Foot”.
Searching MEDLINE with MeSH terms can be done by entering the MeSH
30
Body Regions [A01]...Extremities [A01.378]
...Lower Extremity [A01.378.610]
Buttocks [A01.378.610.100]Foot [A01.378.610.250]
Ankle [A01.378.610.250.149]Forefoot, Human [A01.378.610.250.300]
Metatarsus [A01.378.610.250.300.480]Toes [A01.378.610.250.300.792]
Hallux [A01.378.610.250.300.792.380]Heel [A01.378.610.250.510]
Hip [A01.378.610.400]Knee [A01.378.610.450]Leg [A01.378.610.500]Thigh [A01.378.610.750]
Figure 3.2: Sample MeSH hierarchy
‘‘diabetes mellitus’’[MeSH Terms] OR
(‘‘diabetes’’[All Fields] AND ‘‘mellitus’’[All
Fields]) OR ‘‘diabetes mellitus’’[All Fields]
OR ‘‘diabetes’’[All Fields] OR ‘‘diabetes
insipidus’’[MeSH Terms] OR (‘‘diabetes’’[All
Fields] AND ‘‘insipidus’’[All Fields]) OR
‘‘diabetes insipidus’’[All Fields]
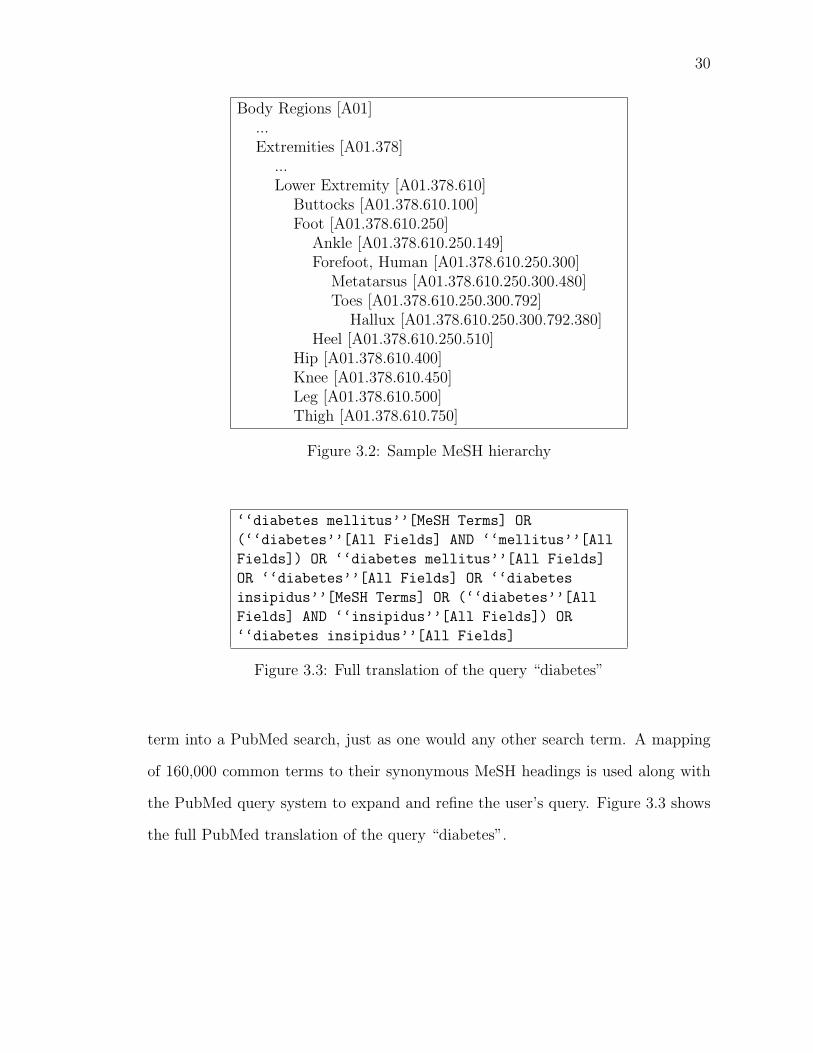
Figure 3.3: Full translation of the query “diabetes”
term into a PubMed search, just as one would any other search term. A mapping
of 160,000 common terms to their synonymous MeSH headings is used along with
the PubMed query system to expand and refine the user’s query. Figure 3.3 shows
the full PubMed translation of the query “diabetes”.

31
3.1.2 OHSUMED
OHSUMED is a collection of MEDLINE citations, created in order to carry
out information retrieval experiments on MEDLINE [26]. It is composed of the re-
sults of 106 queries run against a five-year span of MEDLINE documents. Queries
were generated from a questionnaire filled out by participants in the study, over
a ten-month period, filtering out duplicate topics and author searches, as well as
queries with inadequate information for replication by annotators. Eleven medical
librarians and eleven physicians, all familiar with searching MEDLINE, replicated
the searches and judged the retrieved references for relevance. Of 348,566 available
references from 270 medical journals, 16,140 query-document pairs were retrieved,
with the 12,565 unique pairs annotated for relevance. Pairs were classified as def-
initely, partially, or not relevant, with 69.3% annotated as not relevant, 16.3%
partially relevant, and 14.3% relevant. Five queries returned no citations judged
relevant by the annotators. Inter-annotator agreement, a measure of how closely
any two annotators agreed in their annotations, was calculated by having 11% of
the documents annotated by two people. A kappa statistic of 0.41 was calculated for
agreement, which the authors claim is comparable with other similar experiments.
Queries returned an average of 152.27 documents.
3.1.3 LETOR
LETOR is a benchmark dataset created for information retrieval rank learning
applications [35]. It consists of two parts; the first is based on the .gov dataset from
the 2003 and 2004 TREC Web Track [16], and the second is based on OHSUMED
(see section 3.1.2). We will limit our discussion to the OHSUMED section of
LETOR.
32
LETOR assigns a feature vector to each query-document pair in the OHSUMED
collection. These feature vectors are composed of classical and more recently devel-
oped measures. Both high and low-level features are calculated, where “[l]ow-level
features include term frequency (tf), inverse document frequency (idf), document
length, (dl) and their combinations” [35], and high-level features include measures
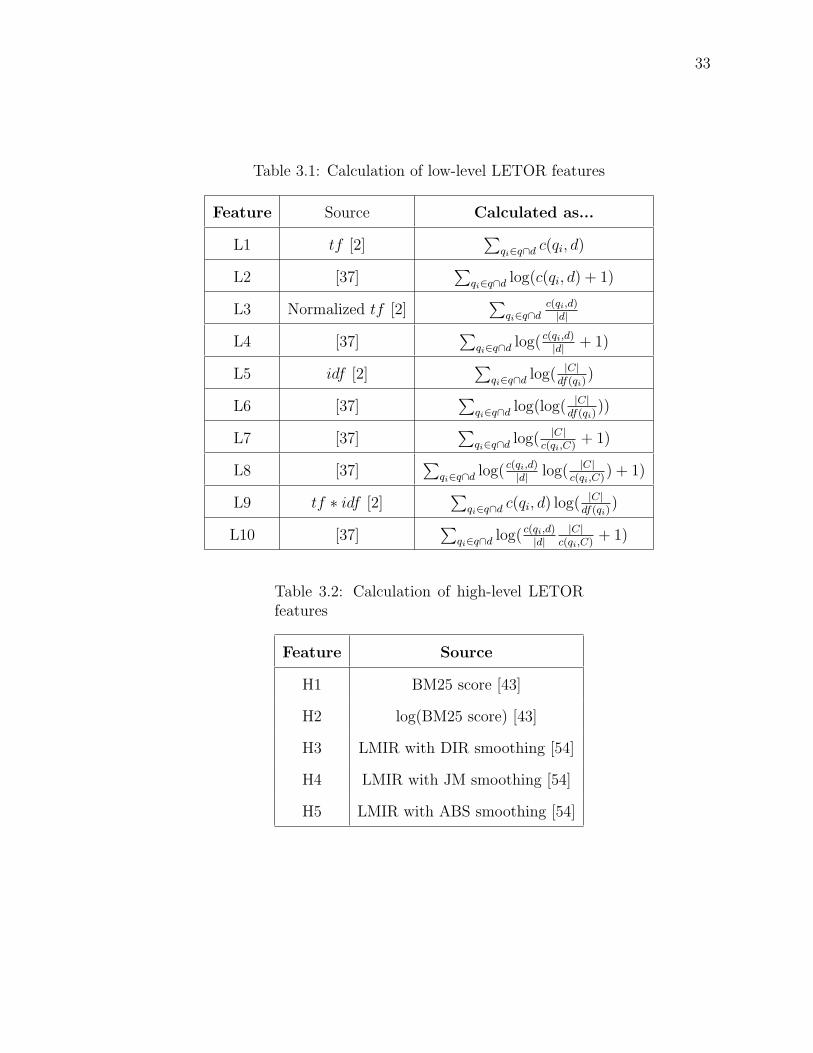
such as BM25 [43] and language models [54]. Vectors contain 25 features, 10 low-
level features (L1-L10 in Table 3.1) calculated from the title, the same 10 calculated
again from the abstract, and 5 (H1-H5 in Table 3.2) from combined title-abstract
text for each of the documents.
Benchmarks for ranking learning with LETOR over the OHSUMED data set
have been calculated using two learning methods, RankBoost and Ranking SVM,
achieving NDCG@10 of 0.436 and 0.441 respectively [35]. Ranking quality for the
individual LETOR features can also be calculated. Since each feature corresponds to
a relevance score for a particular query-document pair, a ranking over all documents
in that query can be constructed, and the quality of that ranking calculated using
the interquartile mean NDCG@10 over the 101 queries used (see Section 5.2.1 for
an explanation and motivation for using interquartile mean). Figure 5.5 shows the
ranking quality for each of the 25 LETOR features, with the best performance being
an NDCG@10 of 0.461 from feature 10.
3.2 Enterprise Data Collection
3.2.1 TREC Enterprise 2007
TREC, the Text Retrieval Conference, began in 1992. Co-sponsored by the
National Institute of Standards and Technology and the Department of Defense,
it purpose is “to support research within the information retrieval community by
33
Table 3.1: Calculation of low-level LETOR features
Feature Source Calculated as...
L1 tf [2]∑
qi∈q∩d c(qi, d)
L2 [37]∑
qi∈q∩d log(c(qi, d) + 1)
L3 Normalized tf [2]∑
qi∈q∩dc(qi,d)|d|
L4 [37]∑
qi∈q∩d log( c(qi,d)|d| + 1)
L5 idf [2]∑
qi∈q∩d log( |C|df(qi)
)
L6 [37]∑
qi∈q∩d log(log( |C|df(qi)
))
L7 [37]∑
qi∈q∩d log( |C|c(qi,C)
+ 1)
L8 [37]∑
qi∈q∩d log( c(qi,d)|d| log( |C|
c(qi,C)) + 1)
L9 tf ∗ idf [2]∑
qi∈q∩d c(qi, d) log( |C|df(qi)
)
L10 [37]∑
qi∈q∩d log( c(qi,d)|d|
|C|c(qi,C)
+ 1)
Table 3.2: Calculation of high-level LETORfeatures
Feature Source
H1 BM25 score [43]
H2 log(BM25 score) [43]
H3 LMIR with DIR smoothing [54]
H4 LMIR with JM smoothing [54]
H5 LMIR with ABS smoothing [54]
34
providing the infrastructure necessary for large-scale evaluation of text retrieval
methodologies.”2 Each year, the TREC program committee decides on a number
of areas, or tracks, for research, and defines a number of tasks for each track as
well as a collection of documents for each track. One of the tracks for 2007 was
an enterprise search track. “Enterprise” in this case refers to any large business
or similar organization, in this case the Australian Commonwealth Scientific and
Industrial Research Organization (CSIRO) [4]. There were two tasks for this track,
both based on the idea of providing resources to construct a “missing overview
page”, in which a user is tasked with creating an informative web page for an
existing past or present CSIRO research project. The first was a document search
task, requiring participants to find key documents explaining the given project. The
second was a staff search task, requiring participants to identify key CSIRO staff
members (specifically, their email addresses) for the given project. We will limit
our discussion to the document search task.
The projects for which these hypothetical overview pages would be constructed
were defined as a set of 50 topics, each consisting of a keyword-style query, a narra-
tive describing the topic, some URLs pointing to example web pages informative on
the topic, and the email addresses of some people involved in the topic. Participants
were allowed to use the query and narrative for their submitted retrieval runs if their
systems used no feedback; feedback-based systems were allowed to used queries and
the example web pages. The data collection for the TREC Enterprise 2007 track
was constructed from a crawl of the csiro.au website. This yielded a collection of
370,715 documents (4.2 gigabytes). Though largely composed of web pages, all
public documents including PDF files, videos, and even some geo-positioning data
2http://trec.nist.gov/overview.html

35
were harvested. Each document collected included header information, such as the
URL of the document, its date of collection, and the type of content represented
(e.g., ‘text/html’, ‘video/x-ms-asf’).
21,532 documents potentially relevant to the 50 topics were retrieved to create
a set of 33,813 topic-document pairs used to evaluate systems participating in the
track. Annotation was done by TREC Enterprise participants, classifying pairs as
definitely, partially, or not relevant, with 76.9% annotated as not relevant, 12%
partially relevant, and 11% relevant. Each pair was annotated by at least two
different annotators. A later study compared participant annotation with expert
annotation, reporting kappa statistics of 0.39 and 0.42 for relevant and not relevant
documents, respectively [3]. Partially relevant annotations achieved agreement of
0.19, indicating that these judgements may not be completely reliable. The queries
returned an average of 676.28 documents.
3.2.2 Dublin Core Metadata
Just as our biomedical data included metadata describing the documents in
the set, some of the CSIRO documents included metadata, adhering to the Dublin
Core (DC) metadata framework. The Dublin Core Metadata Initiative is “an open
organization engaged in the development of interoperable metadata standards that
support a broad range of purposes and business models,”3 and defined a set of fifteen
DC metadata elements in 1995. These elements are used to tag documents with
information such as the document’s creator, the date it was created, the language in
which it is written, etc. [18]. Certain non-core elements, such as keywords, are also
used in the CSIRO set. 4,738 documents comprising 6,029 topic-document pairs
3http://dublincore.org/

36
have at least one element of DC metadata.

37
CHAPTER 4
DESCRIPTION OF SYSTEM AND SIMULATION FRAMEWORK
Here, we present a domain-independent overview of our framework for learn-
ing a function to produce such a relevance ranking from feedback provided by the
user. As this is an online task, two factors beyond raw system performance must
be addressed. First, the system must perform well enough to provide the user a
reasonable search experience, both in terms of performance and in speed. Second,
the amount of feedback required for learning must be a reasonably small fraction of
the number of search results. If either of these factors are not well addressed, the
system will provide no benefit to users over traditional search engines. We choose
to employ ranking SVMs for rank function learning because of their performance in
this area [10, 31, 53]. SVMs also provide reasonable speed for learning and ranking;
empirical data supporting this claim is presented in Chapter 7. To ensure users will
have to provide as little feedback as possible, we employ active learning to choose
examples that will be most useful for learning [14].
The system works as follows (see Figure 4.1). A user with an information need
formulates that need as a query to an existing information retrieval source, which
may or may not return ranked results. A small number of results are shown to the
user, who indicates preference for or against those results. Those preference scores
are then used to create a small training set for a machine learning method which
produces a ranking function. That function then ranks the retrieved documents. A
quality measure is consulted to decide whether or not the process should finish. If
so, the ranked results are returned to the user. If not, another set of documents is
chosen and shown to the user for feedback, and the process repeats.

38
Figure 4.1: Illustration of learning ranking functions from user feedback

39
The framework consists of three variable components we wish to investigate
for their effects on ranking performance: how examples are chosen (Section 4.4),
the amount of feedback elicited (Section 4.5), and the criterion for stopping the
feedback-learning process (Section 4.6). These components will be the subject of
the experiments discussed in Chapters 5 and 6.
4.1 Initial Retrieval
We take initial retrieval as given. As our system is in essence a reranking
system, we assume that the input to the system is a set of documents which has ei-
ther been retrieved by an information retrieval system used as an industry standard
(such as PubMed, described in Section 1.2), or prepared as a testbed for information
retrieval systems (such as the TREC Enterprise 2007 data set, described in Section
3.2).
4.2 The Feedback Round
A feedback round is one iteration of choosing examples for feedback, requesting
feedback from the user, learning from the feedback, and checking the stopping
criterion. Future references will be made to this sequence of steps as a performance
measure, with number of feedback rounds used as one measure of how much overhead
the user has incurred using the system. The number of rounds multiplied by the
number of examples seen per round gives the total number of examples seen, which
is the other overhead measure used.
4.3 Ranking
We learn and rank using ranking SVMs with a linear kernel, as described
in Section 2.2.3. Features used for learning will be depend on the document set

40
over which retrieval is conducted, and are described in Sections 5.1 and 6.1. Data
collection for ranking SVM learning is done cumulatively; the user’s feedback on
the examples presented is added to feedback from previous rounds, with learning
done over the entire accumulated set of feedback. Default values for learning and
ranking (margin size, error weighting, etc.) are used1.
4.4 Choosing Examples
In order to learn a ranking function, we require a training set. This set will be
provided to us by the user in the form of explicit preference feedback on a subset of
the retrieved documents. To ensure that we are asking for user feedback on as few
examples as possible, we choose this subset via active learning (Section 2.3). Active
learning techniques employed will be the subject of experimentation, described in
their respective sections.
4.5 Eliciting Feedback
Feedback is elicited by asking the user to rate a document’s relevance to
his/her information need. We allow users to express preference on a neutral point
scale (“yes”, “maybe”, “no”), rather than using a forced-choice (“yes or no”)
method, as the former shows higher measurement reliability [12]. The number of
examples presented for feedback in each round may influence both how quickly the
ranking function is learned, and the quality of the ranking function. The amounts
of feedback elicited for individual experiments are described in their respective sec-
tions.
In Chapter 5, feedback is simulated using scores from the OHSUMED data
1See http://svmlight.joachims.org/

41
set (Sec. 3.1.2). In Chapter 6, feedback is simulated using scores from the TREC
Enterprise 2007 data set (Sec. 3.2.1). In Chapter 7, feedback is given by live users.
4.6 Convergence Threshold
At some point, feedback rounds must terminate. Rather than arbitrarily
choosing a number of rounds or amount of feedback required before termination,
feedback ends when the lists produced by the ranking function appear to be converg-
ing towards a stable list. Our convergence criterion is based on the Kendall tau rank
correlation coefficient, calculated between on the current and immediately previous
orderings produced by the ranking function. Once the correlation between these
rankings exceeds a certain threshold, feedback rounds terminate. Again, the ranges
of thresholds investigated in different experiments are detailed in their respective
sections.
4.6.1 The Kendall Tau Rank Correlation Coefficient
The Kendall tau rank correlation coefficient calculates the similarity between
two different rankings of one set of objects [1]. The two rankings, O1 andO2 will each
produce two sets of ordered pairs, P1 and P2. The Kendall’s tau measure seeks to
measure the difference between the rankings in terms of how many of these ordered
pairs are different, called the symmetric difference distance d∆(P1,P2). We wish to
normalize the concordance score between 1 for perfectly identical rankings, and -1
for perfectly reversed rankings. Each set of ordered pairs contains 12N(N − 1) pairs
(where N is the number of objects); hence, the maximum d∆(P1,P2) is N(N − 1),
and the minimum is 0. Therefore, we can calculate the correlation as follows [1]:
τ = 1− 2 ∗ d∆(P1,P2)
N(N − 1)(4.1)

42
For example, given a set of objects ranked as O1 = [a, b, c, d] and a second
ranking O2 = [a, b, d, c], the pairs of ranked objects are
P1 = {{a, b}, {a, c}, {a, d}, {b, c}, {b, d}, {c, d}}
P2 = {{a, b}, {a, d}, {a, c}, {b, d}, {b, c}, {d, c}}
for O1 and O2 respectively. The set of objects in one set of pairs and not the other
is {c, d}, {d, c}. The symmetric difference d∆(P1,P2) = 2, N = 4, so τ = 1− 2∗24(3)= 2
3
,
indicating a strong correlation.
43
CHAPTER 5
SIMULATIONS IN THE BIOMEDICAL DOMAIN
In this chapter, we test our framework experimentally via simulation, us-
ing the OHSUMED data set (described in Section 3.1.2). The five queries which
returned no relevant citations have been excluded from the simulations. All experi-
ments were run ten times per query, and the results averaged. We evaluate ranking
performance using normalized discounted cumulative gain (NDCG) as described in
Section 2.1.5.3. We compute NDCG@10 for our evaluation. NDCG is a commonly
used metric for these applications [4, 9, 10, 35]. Furthermore, a retrieval size of
10 is considered the “first page” of results from a search results, and is therefore a
reasonable position to measure ranking performance [20]. We evaluate user over-
head by counting the number of feedback rounds to produce a given ranking, as
well as the total number of documents used for feedback. The interquartile mean is
calculated for both metrics over the 101 queries (motivated in Section 5.2.1).
5.1 Adapting the General Framework to theBiomedical Domain
Adapting our general framework to simulation in the biomedical domain be-
gins with initial retrieval. PubMed, as described in Section 3.1.1 is an excellent
retrieval system, employing many recall-boosting strategies such as term expansion
and synonym matching, which we do not care to replicate. For our experiments, we
use the existing OHSUMED data set (described in Section 3.1.2) and perform no
retrieval on our own.
Two sets of features are used for learning. For the first set, we use the features
from LETOR (Section 3.1.3). We leave these features intact, with no modification.

44
These textual features model the content of the query-document pair. The sec-
ond set is built from the MeSH descriptors (Section 3.1.1.1) for the OHSUMED
documents. Each vector is composed of 25,186 binary features, with each feature
indicating inclusion of the MeSH descriptor. These features model the metadata
assigned to the documents by the MeSH annotators. It should be noted that MeSH
terms offer an improvement over the textual features, in that annotators assign-
ing MeSH terms to citations in MEDLINE have access to the entire article, while
LETOR features are limited to the title and abstract.
5.2 Simulations Using OHSUMED
Our initial simulation experiment is designed to explore the variable compo-
nents of the user preference feedback framework described in Chapter 4 operating
in the biomedical domain, as well as investigating the use of feature vectors built
from textual vs. metadata features as described in Section 5.1.
We employ two active learning methods for these simulations. We use ran-
dom sampling, simply choosing unseen examples at random, as a lower bound for
determining active learning effectiveness. The first active learning method is top
sampling. As discussed in [10], ranking functions should have their performance
optimized towards top-ranked documents. Therefore, top sampling chooses unseen
documents ranked highest by the current ranking function at each round for feed-
back. The other active learning method is mid sampling. Similar to Cohn et al. [14],
we wish to reduce uncertainty in our ranking function. A learned ranking function
will rank the best and worst documents with great confidence, but less so those
in the middle. These middle-ranked documents are, conceptually, the ones ranked
with the least confidence; therefore, learning from them should result in a stronger
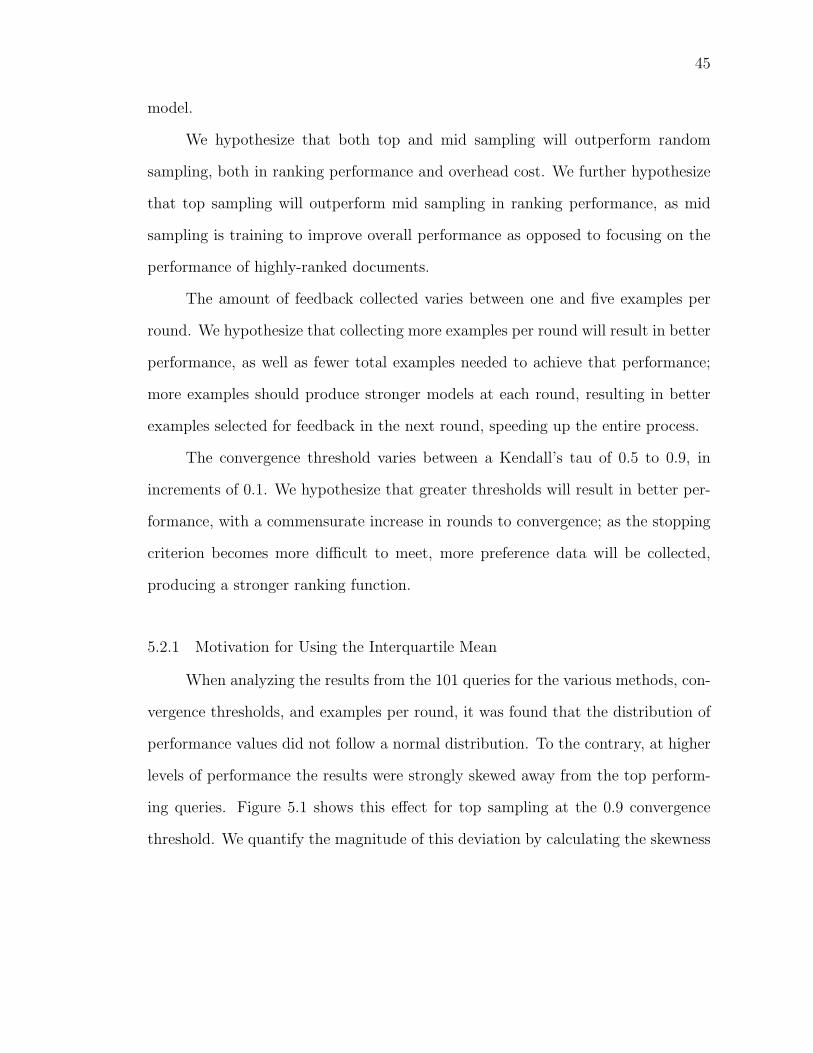
45
model.
We hypothesize that both top and mid sampling will outperform random
sampling, both in ranking performance and overhead cost. We further hypothesize
that top sampling will outperform mid sampling in ranking performance, as mid
sampling is training to improve overall performance as opposed to focusing on the
performance of highly-ranked documents.
The amount of feedback collected varies between one and five examples per
round. We hypothesize that collecting more examples per round will result in better
performance, as well as fewer total examples needed to achieve that performance;
more examples should produce stronger models at each round, resulting in better
examples selected for feedback in the next round, speeding up the entire process.
The convergence threshold varies between a Kendall’s tau of 0.5 to 0.9, in
increments of 0.1. We hypothesize that greater thresholds will result in better per-
formance, with a commensurate increase in rounds to convergence; as the stopping
criterion becomes more difficult to meet, more preference data will be collected,
producing a stronger ranking function.
5.2.1 Motivation for Using the Interquartile Mean
When analyzing the results from the 101 queries for the various methods, con-
vergence thresholds, and examples per round, it was found that the distribution of
performance values did not follow a normal distribution. To the contrary, at higher
levels of performance the results were strongly skewed away from the top perform-
ing queries. Figure 5.1 shows this effect for top sampling at the 0.9 convergence
threshold. We quantify the magnitude of this deviation by calculating the skewness
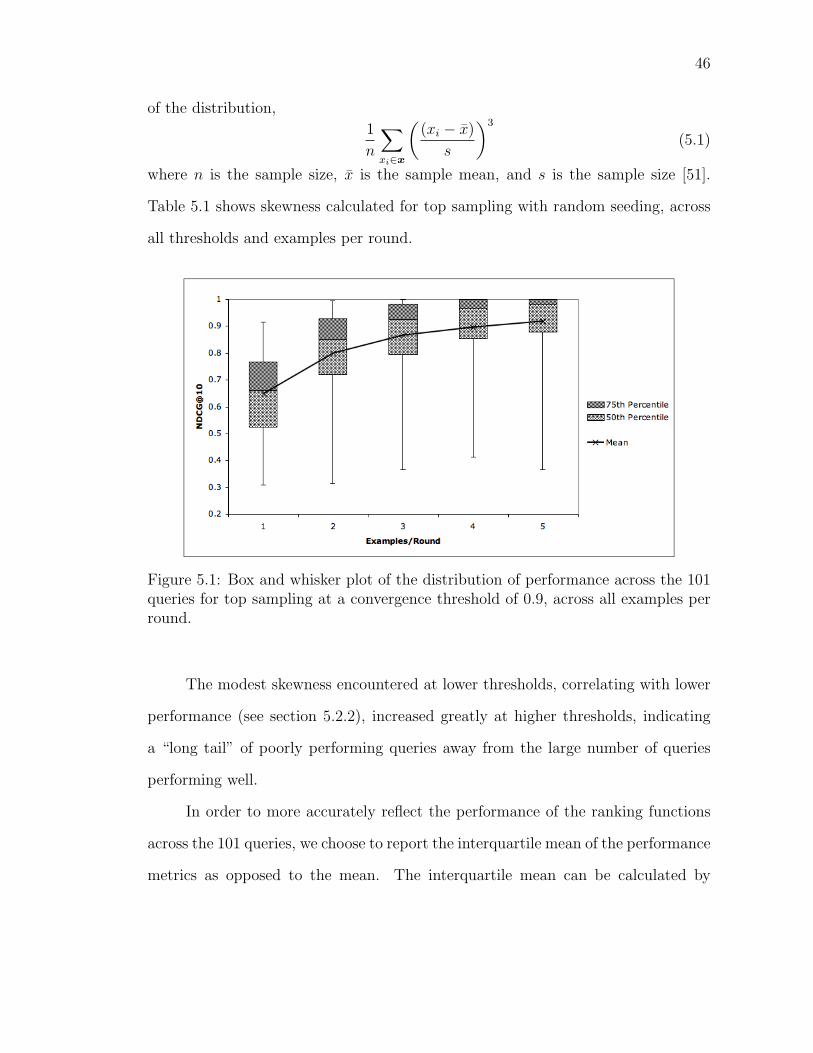
46
of the distribution,
1
n
∑xi∈x
((xi − x)
s
)3
(5.1)
where n is the sample size, x is the sample mean, and s is the sample size [51].
Table 5.1 shows skewness calculated for top sampling with random seeding, across
all thresholds and examples per round.
Figure 5.1: Box and whisker plot of the distribution of performance across the 101queries for top sampling at a convergence threshold of 0.9, across all examples perround.
The modest skewness encountered at lower thresholds, correlating with lower
performance (see section 5.2.2), increased greatly at higher thresholds, indicating
a “long tail” of poorly performing queries away from the large number of queries
performing well.
In order to more accurately reflect the performance of the ranking functions
across the 101 queries, we choose to report the interquartile mean of the performance
metrics as opposed to the mean. The interquartile mean can be calculated by

47
discounting the top and bottom quarter of the ranked scores, calculating the mean
of the inner quarters. Generally, this can be expressed as
2
n
3n/4∑i=(n/4)+1
xi (5.2)
Table 5.1: Skewness calculated across all thresh-olds and examples per round for top sampling
ThresholdExamples per round
1 2 3 4 5
0.5 0.567 0.393 0.303 0.092 -0.036
0.6 0.473 0.237 0.115 -0.196 -0.234
0.7 0.417 0.153 -0.057 -0.674 -0.919
0.8 0.335 -0.194 -0.786 -0.980 -1.466
0.9 -0.106 -1.116 -1.506 -1.838 -2.182
5.2.2 Results and Discussion
Table 5.2: NDCG calculated across all queries at positions 1 through 10 for rankingSVMs trained on all data available for a query.
@1 @2 @3 @4 @5 @6 @7 @8 @8 @10
MeSH 1.000 1.000 1.000 1.000 1.000 1.000 1.000 1.000 1.000 1.000
LETOR 0.748 0.679 0.640 0.620 0.600 0.600 0.585 0.586 0.591 0.589
Learning from MeSH features clearly outperformed learning from LETOR
features in ranking performance. An upper bound for performance comparison was
calculated by ranking documents for each OHSUMED query using a ranking SVM
learned from all documents in the query, for both MeSH and LETOR feature vectors.
Table 5.2 shows SVMs learned from MeSH terms yielded perfect interquartile mean
ranking performance, vastly outperforming SVMs learned from LETOR features.
48
A performance gain is to be expected, as the MeSH terms are tailored to this
data; however, we did not expect the gain to be this great. This trend continues
in the active learning experiments. As shown in Tables 5.3-5.5, across all sampling
methods, thresholds, and examples per round, ranking performance of SVMs learned
from MeSH features outperform their LETOR counterparts. For thresholds above
0.5, though LETOR SVMs consistently reached convergence before MeSH SVMs
(indicating a much lower overhead), the performance was consistently poor.
Overall, our results are encouraging. We have achieved an NDCG@10 ranking
performance of 0.970 after an average of 13.55 feedback rounds and 67.74 examples
seen, using top sampling with five examples per round and a convergence threshold
of 0.9 (Table 5.5).
Top sampling produced better ranking functions than the other two methods.
Curiously, mid sampling performed worse than random sampling. This may be
due to the fact that mid sampling is more likely to encounter documents ranked
as possibly relevant as opposed to definitely relevant or irrelevant than random
sampling. Mid sampling did incur less overhead than the other active learning
methods, but it appears as though it converged to a poor final ranking.
In all cases, a greater number of examples per round produced better ranking
performance. This is to be expected, as more examples per round yields a larger
set of training data (see Figure 5.3, Section 5.6). More examples per round also
decreased rounds to convergence; however, the decrease in the number of rounds
was never great enough to lead to a decrease in the total number of examples seen.
As expected, higher thresholds for convergence resulted in higher ranking per-
formance, at the cost of more feedback rounds. While performance climbed steadily,
there was a marked jump in overhead between thresholds of 0.8 and 0.9.

49
Table 5.3: Averaged performance for random sampling method, for all examples perround and thresholds. The top subtable reports NDCG@10, middle reports numberof rounds until the convergence threshold is met, bottom reports number of examplesseen until convergence.
Random Sampling
NDCG@10
ThresholdMeSH LETOR
1 2 3 4 5 1 2 3 4 5
0.5 0.426 0.472 0.511 0.544 0.560 0.359 0.369 0.384 0.393 0.405
0.6 0.442 0.482 0.519 0.552 0.592 0.358 0.373 0.388 0.401 0.411
0.7 0.455 0.484 0.554 0.585 0.592 0.361 0.372 0.392 0.407 0.425
0.8 0.467 0.525 0.604 0.653 0.693 0.358 0.376 0.405 0.412 0.422
0.9 0.502 0.611 0.673 0.739 0.783 0.370 0.384 0.419 0.440 0.456
Rounds to Convergence
ThresholdMeSH LETOR
1 2 3 4 5 1 2 3 4 5
0.5 5.607 3.781 3.145 2.951 2.840 7.329 4.823 3.804 3.386 3.088
0.6 5.634 4.007 3.547 3.359 3.318 7.461 4.533 3.858 3.540 3.190
0.7 6.245 4.719 4.363 4.147 4.075 7.672 4.788 4.223 3.736 3.601
0.8 7.169 5.871 5.816 5.889 5.931 7.760 5.284 4.612 4.326 4.144
0.9 10.29 9.494 10.02 10.97 11.20 9.205 7.073 6.681 6.640 6.618
Total Examples to Convergence
ThresholdMeSH LETOR
1 2 3 4 5 1 2 3 4 5
0.5 5.607 7.562 9.435 11.80 14.20 7.329 9.646 11.41 13.54 15.44
0.6 5.634 8.015 10.64 13.44 16.59 7.461 9.065 11.58 14.16 15.95
0.7 6.245 9.439 13.09 16.59 20.37 7.672 9.576 12.67 14.94 18.00
0.8 7.169 11.74 17.45 23.55 29.66 7.760 10.57 13.84 17.30 20.72
0.9 10.29 18.99 30.07 43.86 56.01 9.205 14.15 20.04 26.56 33.09
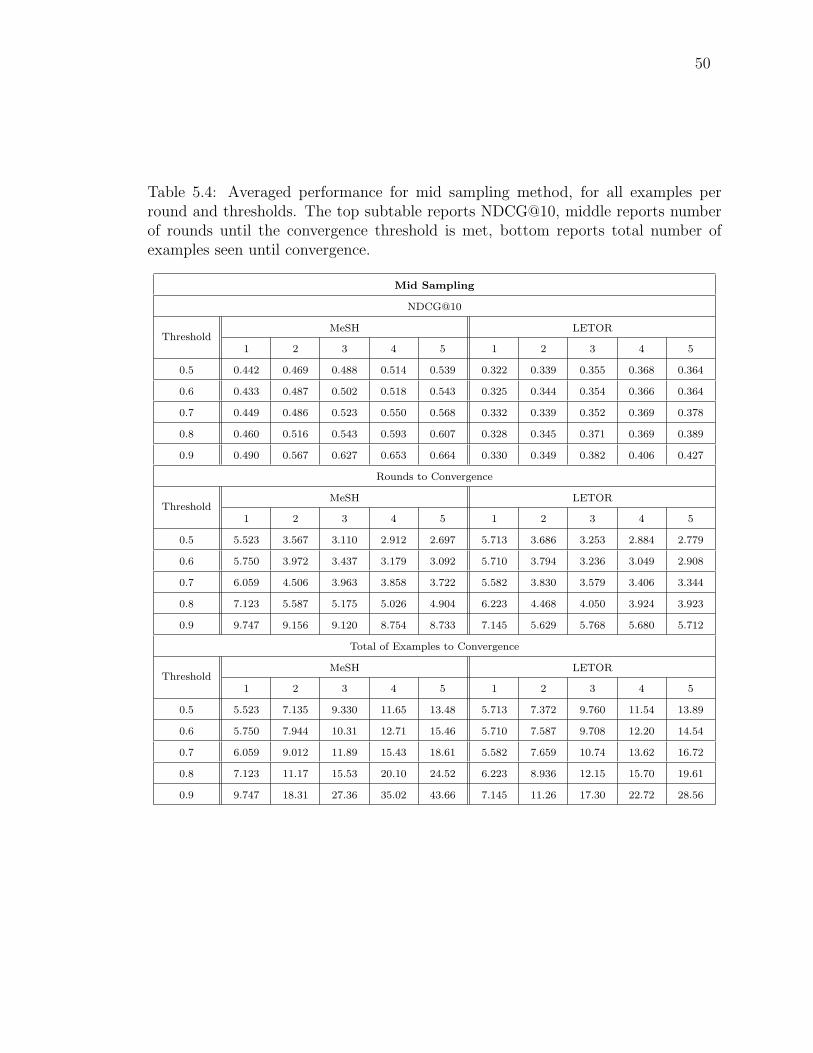
50
Table 5.4: Averaged performance for mid sampling method, for all examples perround and thresholds. The top subtable reports NDCG@10, middle reports numberof rounds until the convergence threshold is met, bottom reports total number ofexamples seen until convergence.
Mid Sampling
NDCG@10
ThresholdMeSH LETOR
1 2 3 4 5 1 2 3 4 5
0.5 0.442 0.469 0.488 0.514 0.539 0.322 0.339 0.355 0.368 0.364
0.6 0.433 0.487 0.502 0.518 0.543 0.325 0.344 0.354 0.366 0.364
0.7 0.449 0.486 0.523 0.550 0.568 0.332 0.339 0.352 0.369 0.378
0.8 0.460 0.516 0.543 0.593 0.607 0.328 0.345 0.371 0.369 0.389
0.9 0.490 0.567 0.627 0.653 0.664 0.330 0.349 0.382 0.406 0.427
Rounds to Convergence
ThresholdMeSH LETOR
1 2 3 4 5 1 2 3 4 5
0.5 5.523 3.567 3.110 2.912 2.697 5.713 3.686 3.253 2.884 2.779
0.6 5.750 3.972 3.437 3.179 3.092 5.710 3.794 3.236 3.049 2.908
0.7 6.059 4.506 3.963 3.858 3.722 5.582 3.830 3.579 3.406 3.344
0.8 7.123 5.587 5.175 5.026 4.904 6.223 4.468 4.050 3.924 3.923
0.9 9.747 9.156 9.120 8.754 8.733 7.145 5.629 5.768 5.680 5.712
Total of Examples to Convergence
ThresholdMeSH LETOR
1 2 3 4 5 1 2 3 4 5
0.5 5.523 7.135 9.330 11.65 13.48 5.713 7.372 9.760 11.54 13.89
0.6 5.750 7.944 10.31 12.71 15.46 5.710 7.587 9.708 12.20 14.54
0.7 6.059 9.012 11.89 15.43 18.61 5.582 7.659 10.74 13.62 16.72
0.8 7.123 11.17 15.53 20.10 24.52 6.223 8.936 12.15 15.70 19.61
0.9 9.747 18.31 27.36 35.02 43.66 7.145 11.26 17.30 22.72 28.56
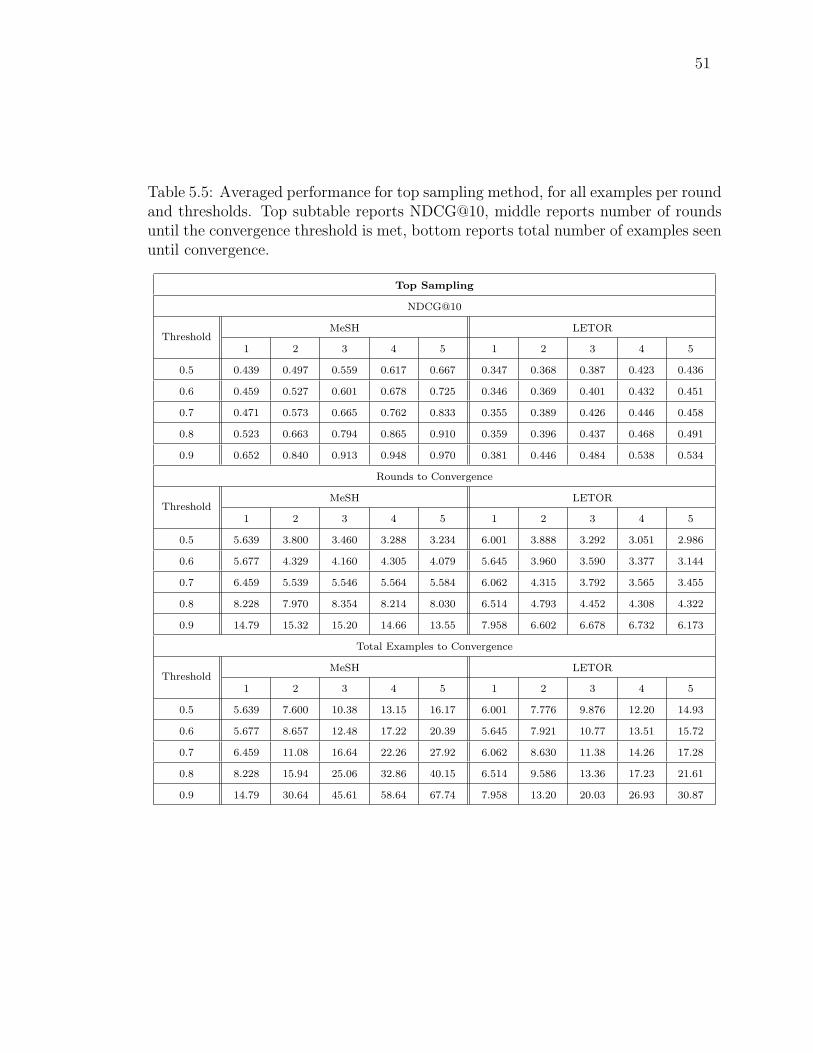
51
Table 5.5: Averaged performance for top sampling method, for all examples per roundand thresholds. Top subtable reports NDCG@10, middle reports number of roundsuntil the convergence threshold is met, bottom reports total number of examples seenuntil convergence.
Top Sampling
NDCG@10
ThresholdMeSH LETOR
1 2 3 4 5 1 2 3 4 5
0.5 0.439 0.497 0.559 0.617 0.667 0.347 0.368 0.387 0.423 0.436
0.6 0.459 0.527 0.601 0.678 0.725 0.346 0.369 0.401 0.432 0.451
0.7 0.471 0.573 0.665 0.762 0.833 0.355 0.389 0.426 0.446 0.458
0.8 0.523 0.663 0.794 0.865 0.910 0.359 0.396 0.437 0.468 0.491
0.9 0.652 0.840 0.913 0.948 0.970 0.381 0.446 0.484 0.538 0.534
Rounds to Convergence
ThresholdMeSH LETOR
1 2 3 4 5 1 2 3 4 5
0.5 5.639 3.800 3.460 3.288 3.234 6.001 3.888 3.292 3.051 2.986
0.6 5.677 4.329 4.160 4.305 4.079 5.645 3.960 3.590 3.377 3.144
0.7 6.459 5.539 5.546 5.564 5.584 6.062 4.315 3.792 3.565 3.455
0.8 8.228 7.970 8.354 8.214 8.030 6.514 4.793 4.452 4.308 4.322
0.9 14.79 15.32 15.20 14.66 13.55 7.958 6.602 6.678 6.732 6.173
Total Examples to Convergence
ThresholdMeSH LETOR
1 2 3 4 5 1 2 3 4 5
0.5 5.639 7.600 10.38 13.15 16.17 6.001 7.776 9.876 12.20 14.93
0.6 5.677 8.657 12.48 17.22 20.39 5.645 7.921 10.77 13.51 15.72
0.7 6.459 11.08 16.64 22.26 27.92 6.062 8.630 11.38 14.26 17.28
0.8 8.228 15.94 25.06 32.86 40.15 6.514 9.586 13.36 17.23 21.61
0.9 14.79 30.64 45.61 58.64 67.74 7.958 13.20 20.03 26.93 30.87
52
Experiments have shown that our hypotheses regarding ranking performance
regarding sampling methods, examples per round, and convergence threshold are
generally supported, with the exception of the performance of mid sampling. How-
ever, our assumptions regarding the overhead incurred to reach convergence as it
relates to examples per round and ranking performance seem to have been incorrect.
We had initially assumed that while seeing more examples per round would increase
performance, the total amount of overhead required to reach that performance would
decrease as seeing more examples per round would produce a more robust model
at each ranking round, thus allowing the sampling methods to choose better exam-
ples and reducing the total number of rounds to convergence significantly. While
rounds to convergence fell slightly as the number of examples per rounds increased,
the decline was not enough to decrease the total number of examples seen until
convergence as examples per round increased.
This led us to investigate whether the number of examples seen was the dom-
inant predictor of performance. As shown in Figure 5.2, however, the sampling
method used played a greater role in performance. Top sampling provided better
ranking performance than random or mid sampling independent of number of ex-
amples seen, in many cases requiring fewer than half the number of examples to
reach performance similar to the other active learning methods.
A note must be made regarding the convergence threshold. Since termination
is determined as a function of learning, it effectively falls to the active learning
technique to ensure that termination is not premature, as choosing uninformative
examples will cause little to no shift in the ranking function. If this were the case,
the learning process would not fulfill its potential, denied the chance to exhaust
its stock of “good” examples to learn from. The effect of this would be that an

53
Figure 5.2: Comparison of the total number of examples seen to NDCG@10 forall sampling methods, at thresholds 0.7, 0.8 and 0.9. Markers indicate number ofexamples per round, from one to five.

54
active learning method which could potentially perform as well as another method
would have worse performance and fewer total examples seen than a method which
did not end prematurely. Examples of this happening may be present in this work,
especially at high thresholds looking at 4 or 5 examples per round.
We argue that this effect is likely to be minimal. In Figure 5.2, it is clear that
the strict dominance of one active learning method over another is consistent over
all amounts of feedback greater than around 10 documents. If it is the case that
one sampling method would outperform another if both were allowed to continue
learning, it appears as though this would not occur until the amount of feedback
seen by both methods was in the hundreds.
The remainder of our analysis focuses on factors affecting top sampling. Some-
thing to note in Figure 5.2 is that performance gains began leveling off after reaching
an NDCG@10 of around 0.8, requiring increasingly more examples for smaller gains
in performance. Considering the OHSUMED queries returned 152.27 documents on
average, it may appear that decent performance requires feedback on an unreason-
able percentage of the returned data. Recall, however, that queries to MEDLINE
often result in thousands of results. Further investigation is required to see if queries
which return such large results sets require feedback on a similar percentage of doc-
uments, a similar number of documents, or something in between.
We see in Figure 5.3 that increasing examples per round increased the to-
tal number of examples seen before the convergence threshold was reached. This
ran counter to one of our hypotheses; we expected that seeing more examples in
each feedback round would reduce the total number of examples required to meet
the convergence threshold. Note also that higher convergence thresholds strictly
dominate the total number of examples seen as compared to lower thresholds for
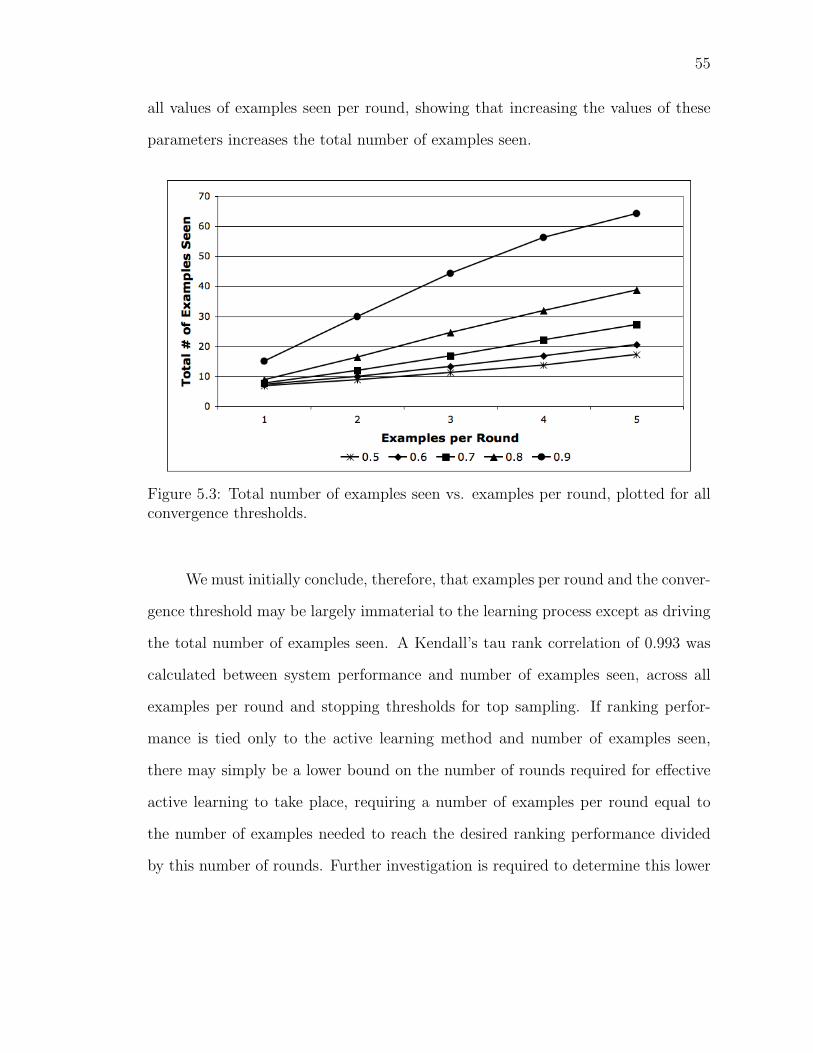
55
all values of examples seen per round, showing that increasing the values of these
parameters increases the total number of examples seen.
Figure 5.3: Total number of examples seen vs. examples per round, plotted for allconvergence thresholds.
We must initially conclude, therefore, that examples per round and the conver-
gence threshold may be largely immaterial to the learning process except as driving
the total number of examples seen. A Kendall’s tau rank correlation of 0.993 was
calculated between system performance and number of examples seen, across all
examples per round and stopping thresholds for top sampling. If ranking perfor-
mance is tied only to the active learning method and number of examples seen,
there may simply be a lower bound on the number of rounds required for effective
active learning to take place, requiring a number of examples per round equal to
the number of examples needed to reach the desired ranking performance divided
by this number of rounds. Further investigation is required to determine this lower
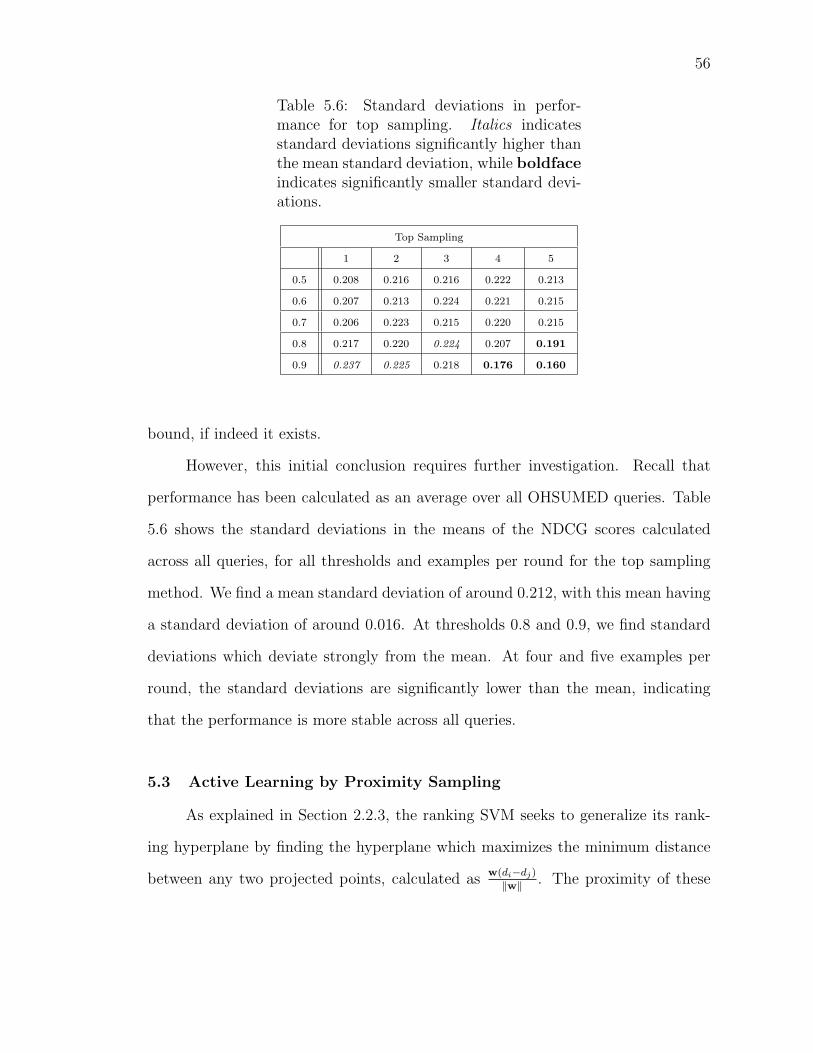
56
Table 5.6: Standard deviations in perfor-mance for top sampling. Italics indicatesstandard deviations significantly higher thanthe mean standard deviation, while boldfaceindicates significantly smaller standard devi-ations.
Top Sampling
1 2 3 4 5
0.5 0.208 0.216 0.216 0.222 0.213
0.6 0.207 0.213 0.224 0.221 0.215
0.7 0.206 0.223 0.215 0.220 0.215
0.8 0.217 0.220 0.224 0.207 0.191
0.9 0.237 0.225 0.218 0.176 0.160
bound, if indeed it exists.
However, this initial conclusion requires further investigation. Recall that
performance has been calculated as an average over all OHSUMED queries. Table
5.6 shows the standard deviations in the means of the NDCG scores calculated
across all queries, for all thresholds and examples per round for the top sampling
method. We find a mean standard deviation of around 0.212, with this mean having
a standard deviation of around 0.016. At thresholds 0.8 and 0.9, we find standard
deviations which deviate strongly from the mean. At four and five examples per
round, the standard deviations are significantly lower than the mean, indicating
that the performance is more stable across all queries.
5.3 Active Learning by Proximity Sampling
As explained in Section 2.2.3, the ranking SVM seeks to generalize its rank-
ing hyperplane by finding the hyperplane which maximizes the minimum distance
between any two projected points, calculated asw(di−dj)
‖w‖ . The proximity of these
57
points to each other indicates that the ranking function, mathematically, has the
least confidence regarding their pairwise preference order, and can therefore be
considered the most ambiguous in terms of ranking [53]. Sampling points in this
way is targeted at the the mechanism of SVM optimization, and should produce
high-quality ranking functions with little feedback.
This method of proximity sampling was implemented, and compared with
the best performing method from the first set of simulations, top sampling, and a
baseline, random sampling. Simulations are carried out using MeSH features, with
the convergence threshold and number of examples per round varying as in Section
5.2. We hypothesize that proximity sampling will outperform top sampling.
5.3.1 Results and Discussion
Top sampling strictly dominated the other two active sampling methods (fig.
5.4). Surprisingly, proximity sampling performed only marginally better than ran-
dom sampling. We believe this may be due to the fact that proximity sampling
seeks to optimize the ranking function over the entire ranking function, while top
sampling optimizes for the top-end documents. As we report NDCG at the tenth
position along the retrieved documents, a reasonable cutoff point for a retrieval
task, the top-end optimization produces the better result. The proximity sampling
method may prove more useful in future work (see Chapter 8).
5.4 Nonrandom Seeding of Feedback Rounds
Rather than seeding feedback rounds with random documents, we can seed
with documents that support the feedback process. Specifically, we can support
top sampling by seeding the first round with the highest ranked documents as

58
Figure 5.4: NDCG@10 vs. total examples seen until convergence for proximitysampling learning experiments. Values are for all sampling methods, thresholds,and examples per round.
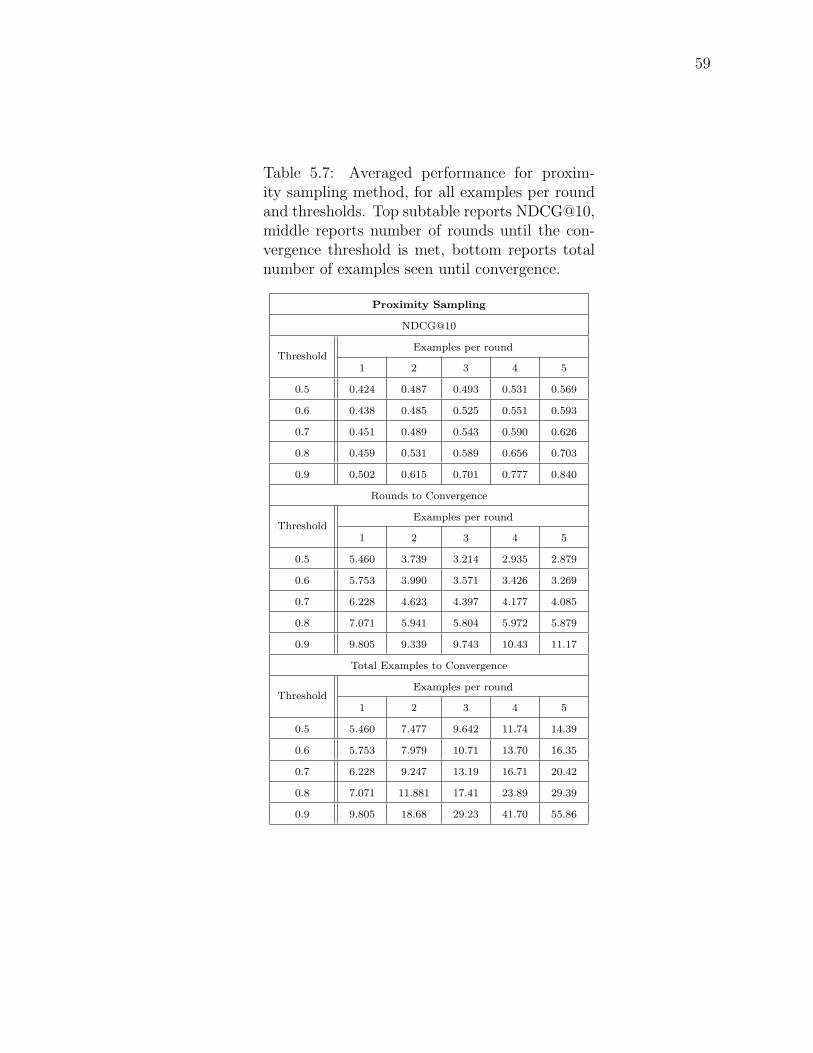
59
Table 5.7: Averaged performance for proxim-ity sampling method, for all examples per roundand thresholds. Top subtable reports NDCG@10,middle reports number of rounds until the con-vergence threshold is met, bottom reports totalnumber of examples seen until convergence.
Proximity Sampling
NDCG@10
ThresholdExamples per round
1 2 3 4 5
0.5 0.424 0.487 0.493 0.531 0.569
0.6 0.438 0.485 0.525 0.551 0.593
0.7 0.451 0.489 0.543 0.590 0.626
0.8 0.459 0.531 0.589 0.656 0.703
0.9 0.502 0.615 0.701 0.777 0.840
Rounds to Convergence
ThresholdExamples per round
1 2 3 4 5
0.5 5.460 3.739 3.214 2.935 2.879
0.6 5.753 3.990 3.571 3.426 3.269
0.7 6.228 4.623 4.397 4.177 4.085
0.8 7.071 5.941 5.804 5.972 5.879
0.9 9.805 9.339 9.743 10.43 11.17
Total Examples to Convergence
ThresholdExamples per round
1 2 3 4 5
0.5 5.460 7.477 9.642 11.74 14.39
0.6 5.753 7.979 10.71 13.70 16.35
0.7 6.228 9.247 13.19 16.71 20.42
0.8 7.071 11.881 17.41 23.89 29.39
0.9 9.805 18.68 29.23 41.70 55.86
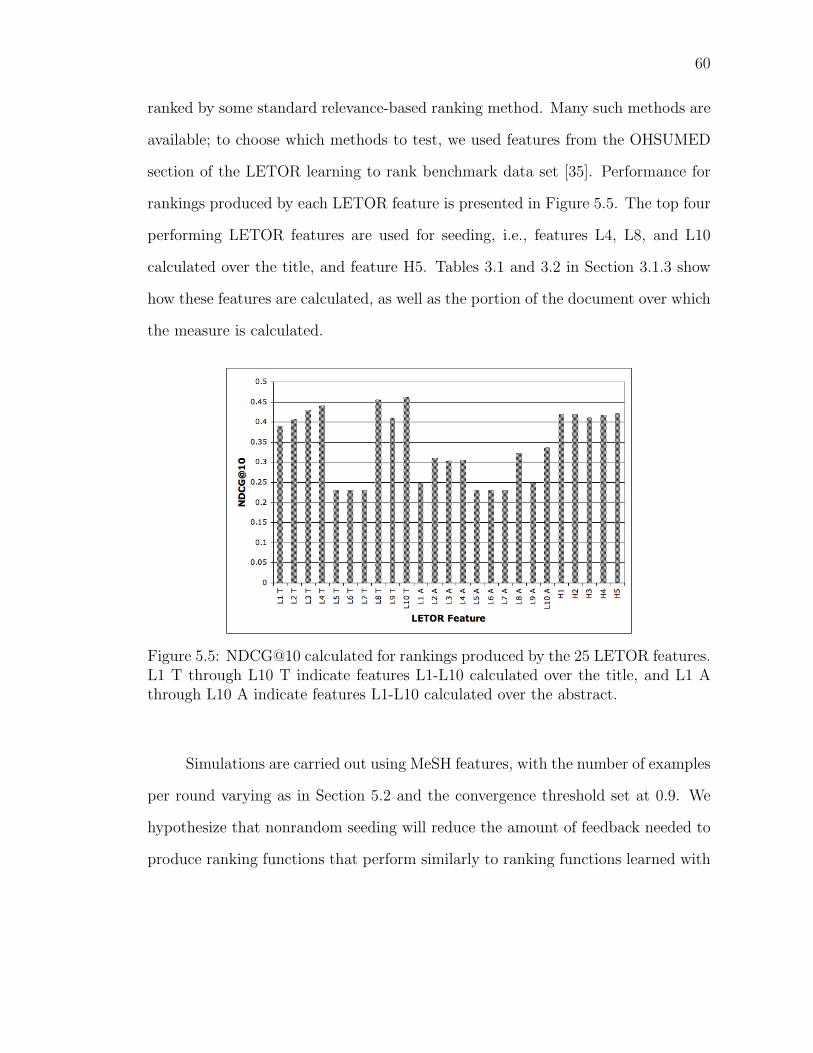
60
ranked by some standard relevance-based ranking method. Many such methods are
available; to choose which methods to test, we used features from the OHSUMED
section of the LETOR learning to rank benchmark data set [35]. Performance for
rankings produced by each LETOR feature is presented in Figure 5.5. The top four
performing LETOR features are used for seeding, i.e., features L4, L8, and L10
calculated over the title, and feature H5. Tables 3.1 and 3.2 in Section 3.1.3 show
how these features are calculated, as well as the portion of the document over which
the measure is calculated.
Figure 5.5: NDCG@10 calculated for rankings produced by the 25 LETOR features.L1 T through L10 T indicate features L1-L10 calculated over the title, and L1 Athrough L10 A indicate features L1-L10 calculated over the abstract.
Simulations are carried out using MeSH features, with the number of examples
per round varying as in Section 5.2 and the convergence threshold set at 0.9. We
hypothesize that nonrandom seeding will reduce the amount of feedback needed to
produce ranking functions that perform similarly to ranking functions learned with
61
random seeding. We do not expect to see an overall increase in performance. Top
sampling with random seeding was used as a baseline.
5.4.1 Results and Discussion
As shown in Table 5.8 and Figure 5.6, nonrandom seeding did indeed produce
functions that performed comparably to those produced by random seeding with
fewer examples. While no initial ranking method clearly dominated the others,
L25 produced the best top-end performance. There was also a modest increase in
top-end performance over random seeding for all nonrandom seeding methods.
Simulating the effect of a round of sampling by asking for initial feedback
on documents ranked by a relevance-based method was especially effective as per-
formance begins leveling off; while proportionally similar amounts of feedback are
required to increase performance for both random and nonrandom seeding methods,
the absolute amount of feedback required to reach this point is much less for the
nonrandom methods, reducing the overall burden for the user.
5.5 Simulation with a Gradient Oracle
OHSUMED judgments are used as an oracle, or perfect knowledge, source
for the simulations, as the judgments were made by a panel of professionals in
the biomedical field. While actual users of this system are likely to be biomedical
professionals as well, it is possible that due to simple human error they will not
provide feedback perfectly in line with their preferences. Furthermore, we would
like non-professionals to be able to use the system as well; their feedback may
include guesses as to the relevance of documents regarding subjects with which
they are uninformed. In order to explore the effects of incorrect feedback on system
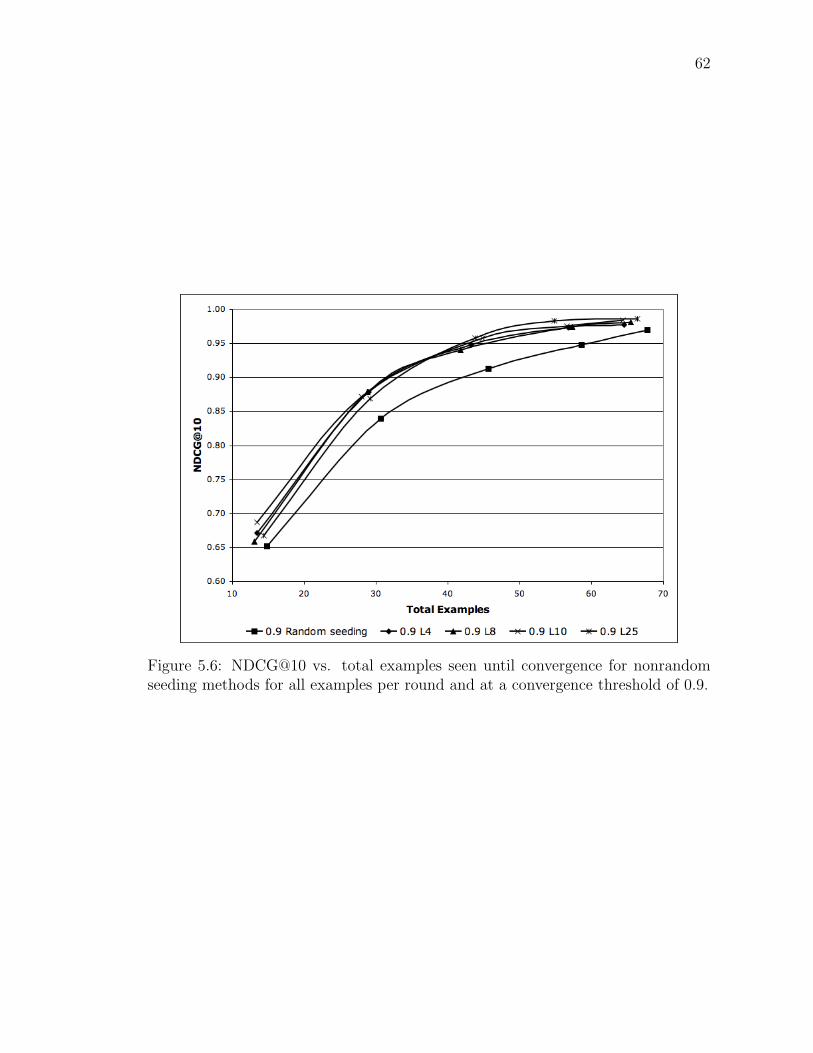
62
Figure 5.6: NDCG@10 vs. total examples seen until convergence for nonrandomseeding methods for all examples per round and at a convergence threshold of 0.9.
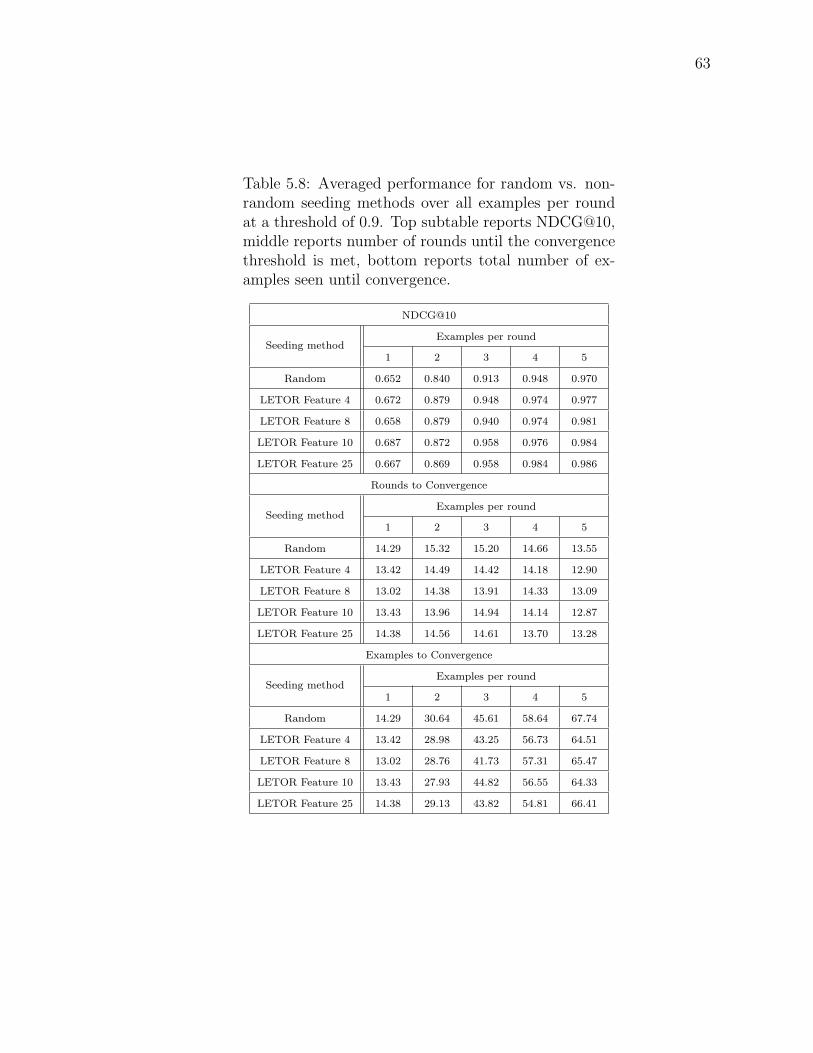
63
Table 5.8: Averaged performance for random vs. non-random seeding methods over all examples per roundat a threshold of 0.9. Top subtable reports NDCG@10,middle reports number of rounds until the convergencethreshold is met, bottom reports total number of ex-amples seen until convergence.
NDCG@10
Seeding methodExamples per round
1 2 3 4 5
Random 0.652 0.840 0.913 0.948 0.970
LETOR Feature 4 0.672 0.879 0.948 0.974 0.977
LETOR Feature 8 0.658 0.879 0.940 0.974 0.981
LETOR Feature 10 0.687 0.872 0.958 0.976 0.984
LETOR Feature 25 0.667 0.869 0.958 0.984 0.986
Rounds to Convergence
Seeding methodExamples per round
1 2 3 4 5
Random 14.29 15.32 15.20 14.66 13.55
LETOR Feature 4 13.42 14.49 14.42 14.18 12.90
LETOR Feature 8 13.02 14.38 13.91 14.33 13.09
LETOR Feature 10 13.43 13.96 14.94 14.14 12.87
LETOR Feature 25 14.38 14.56 14.61 13.70 13.28
Examples to Convergence
Seeding methodExamples per round
1 2 3 4 5
Random 14.29 30.64 45.61 58.64 67.74
LETOR Feature 4 13.42 28.98 43.25 56.73 64.51
LETOR Feature 8 13.02 28.76 41.73 57.31 65.47
LETOR Feature 10 13.43 27.93 44.82 56.55 64.33
LETOR Feature 25 14.38 29.13 43.82 54.81 66.41
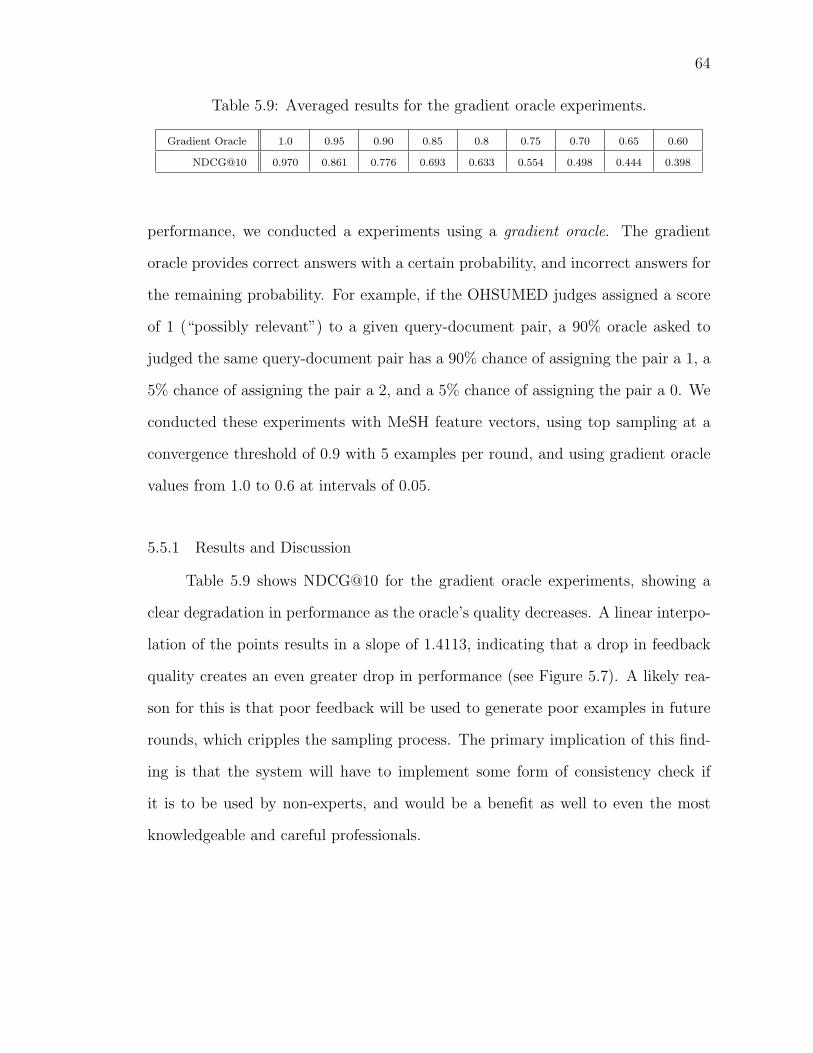
64
Table 5.9: Averaged results for the gradient oracle experiments.
Gradient Oracle 1.0 0.95 0.90 0.85 0.8 0.75 0.70 0.65 0.60
NDCG@10 0.970 0.861 0.776 0.693 0.633 0.554 0.498 0.444 0.398
performance, we conducted a experiments using a gradient oracle. The gradient
oracle provides correct answers with a certain probability, and incorrect answers for
the remaining probability. For example, if the OHSUMED judges assigned a score
of 1 (“possibly relevant”) to a given query-document pair, a 90% oracle asked to
judged the same query-document pair has a 90% chance of assigning the pair a 1, a
5% chance of assigning the pair a 2, and a 5% chance of assigning the pair a 0. We
conducted these experiments with MeSH feature vectors, using top sampling at a
convergence threshold of 0.9 with 5 examples per round, and using gradient oracle
values from 1.0 to 0.6 at intervals of 0.05.
5.5.1 Results and Discussion
Table 5.9 shows NDCG@10 for the gradient oracle experiments, showing a
clear degradation in performance as the oracle’s quality decreases. A linear interpo-
lation of the points results in a slope of 1.4113, indicating that a drop in feedback
quality creates an even greater drop in performance (see Figure 5.7). A likely rea-
son for this is that poor feedback will be used to generate poor examples in future
rounds, which cripples the sampling process. The primary implication of this find-
ing is that the system will have to implement some form of consistency check if
it is to be used by non-experts, and would be a benefit as well to even the most
knowledgeable and careful professionals.
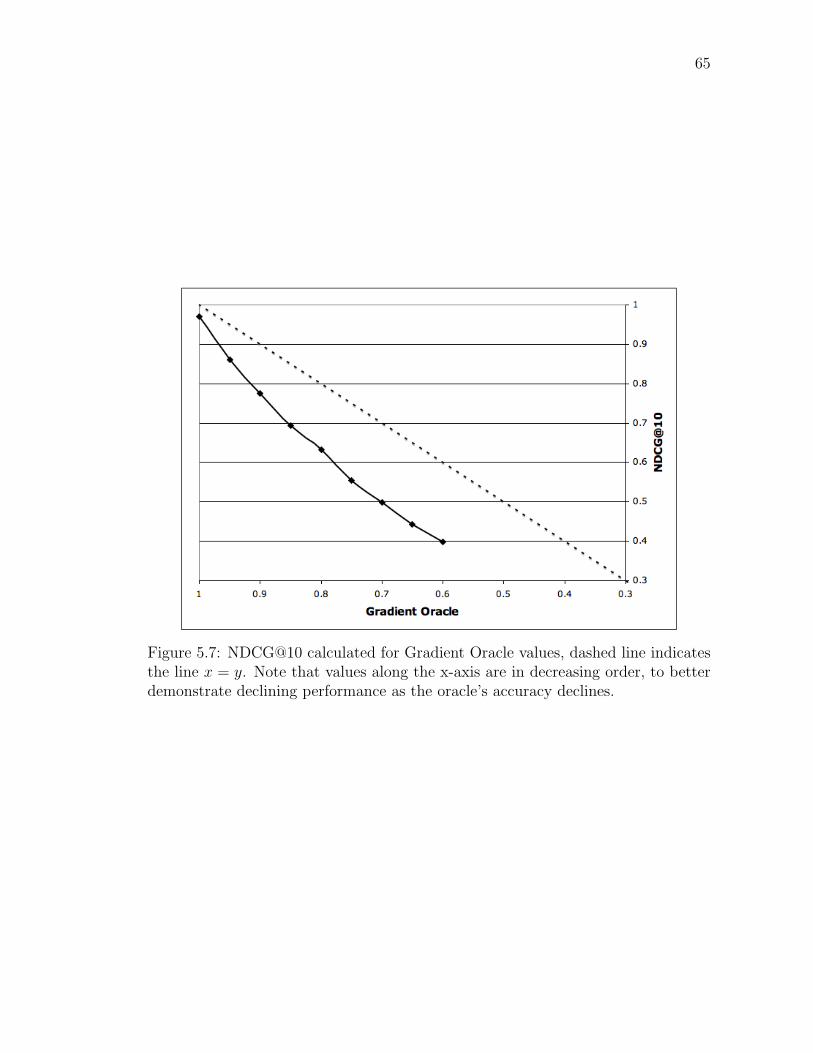
65
Figure 5.7: NDCG@10 calculated for Gradient Oracle values, dashed line indicatesthe line x = y. Note that values along the x-axis are in decreasing order, to betterdemonstrate declining performance as the oracle’s accuracy declines.
66
5.6 Conclusion
The experiments presented here show the framework presented for learning to
rank documents with SVMs via user feedback is effective in the biomedical domain.
Simulations show that ranking functions learned in this way perform at levels ap-
proaching perfect ranking with less than half of the available data, indicating that
the top sampling method of active learning is well suited to this task. Sampling
method was clearly shown to be the driving force behind system performance. The
other variable system components, number of examples per round and convergence
threshold, were found not to be directly related to the system’s performance, but
rather indirectly related as they drive the more important factor of total number of
examples seen.
Complex active learning methods for example selection may be unnecessary.
The proximity sampling method, while targeted at the mechanism of ranking SVM
optimization, failed to outperform top sampling, and in fact had performance closer
to random sampling. This is a helpful finding as this framework is designed to be
used in an online ad-hoc search environment, and simple sampling methods such
as top sampling clearly require fewer computing resources than methods such as
proximity sampling.
Seeding ranking rounds with examples ranked via some standard relevance-
based ranking methods provided a modest improvement in system performance.
Though no relevance measure was strictly dominant, all increased top-end perfor-
mance. More importantly, fewer examples were required to reach high-end perfor-
mance.
The findings of the gradient oracle simulations are quite important to the end
goal of an online tool to be used by biomedical professionals, as the framework has

67
been shown not to be robust to “wrong” or inconsistent feedback. Future work
must be done to strengthen the method against such occurrences, especially if the
system is to be used by domain neophytes. Section 8.1.4 expands upon this subject.
68
CHAPTER 6
SIMULATIONS IN THE ENTERPRISE DOMAIN
In order to show that the rank learning framework presented is generally ap-
plicable, as opposed to specifically designed for the biomedical domain, we present
simulations using the CSIRO data set from the TREC Enterprise 2007 track (Sec-
tion 3.2.1). This data set is larger than the MEDLINE data set, with many more
documents associated with each query. In this chapter, we show that the framework
can function successfully over this data set without modification. Furthermore, we
show that increase in the size of the data set and number of documents retrieved
per query do not pose an issue to system performance.
6.1 Adapting the General Framework to the En-terprise Domain
Again, we perform no live retrieval runs for our enterprise retrieval simulations,
preferring instead to use the CSIRO data set. Feature vectors use available DC
metadata (Section 3.2.2) as binary inclusion features, similar to MeSH terms in
the biomedical simulations (Section 5.1). While many types of DC metadata exist,
the only types in the set of judged documents were “keywords” and “format”.
Only 88 documents had format metadata, so feature vectors were built with the
keywords metadata alone. Since the majority of the documents are not annotated
with metadata, feature vectors also include tf ∗ idf term weighting calculations
for each term appearing in the document, as in [17]; i.e., terms are stemmed and
stopwords are removed.
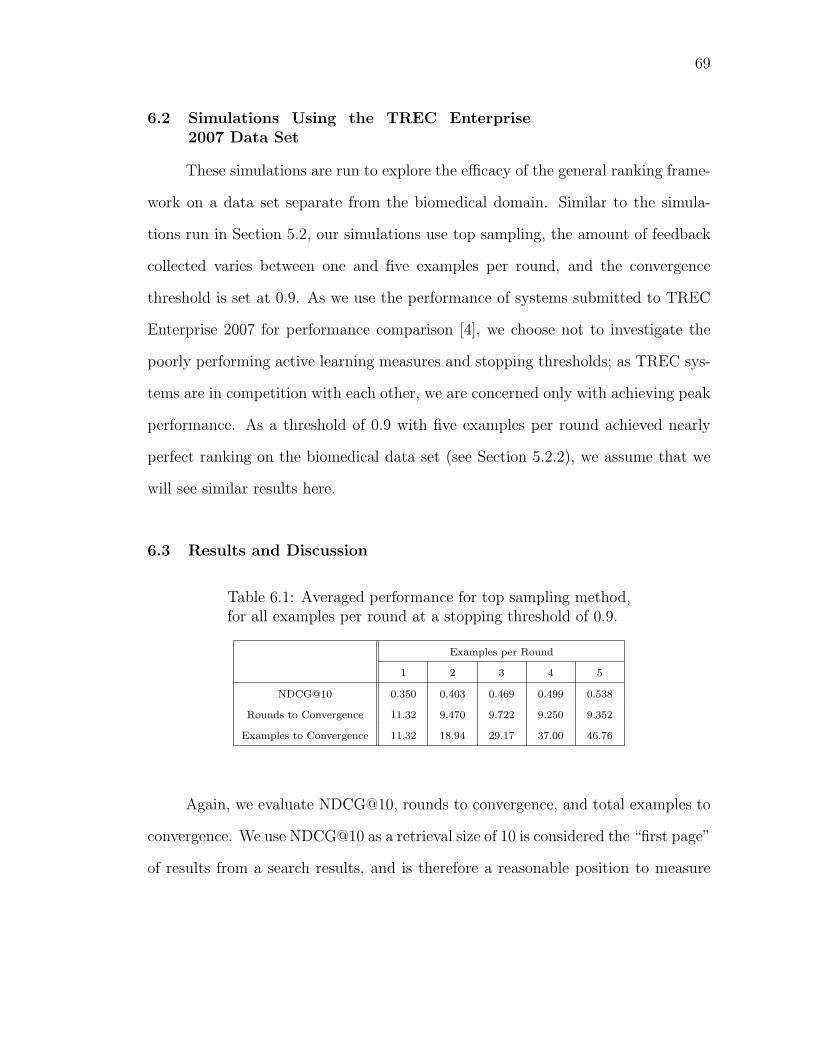
69
6.2 Simulations Using the TREC Enterprise2007 Data Set
These simulations are run to explore the efficacy of the general ranking frame-
work on a data set separate from the biomedical domain. Similar to the simula-
tions run in Section 5.2, our simulations use top sampling, the amount of feedback
collected varies between one and five examples per round, and the convergence
threshold is set at 0.9. As we use the performance of systems submitted to TREC
Enterprise 2007 for performance comparison [4], we choose not to investigate the
poorly performing active learning measures and stopping thresholds; as TREC sys-
tems are in competition with each other, we are concerned only with achieving peak
performance. As a threshold of 0.9 with five examples per round achieved nearly
perfect ranking on the biomedical data set (see Section 5.2.2), we assume that we
will see similar results here.
6.3 Results and Discussion
Table 6.1: Averaged performance for top sampling method,for all examples per round at a stopping threshold of 0.9.
Examples per Round
1 2 3 4 5
NDCG@10 0.350 0.403 0.469 0.499 0.538
Rounds to Convergence 11.32 9.470 9.722 9.250 9.352
Examples to Convergence 11.32 18.94 29.17 37.00 46.76
Again, we evaluate NDCG@10, rounds to convergence, and total examples to
convergence. We use NDCG@10 as a retrieval size of 10 is considered the “first page”
of results from a search results, and is therefore a reasonable position to measure

70
ranking performance [20]. Results indicate that our system does not outperform
the top TREC Enterprise systems [4], performing nearer to the lower performing
systems as shown in Figure 6.1. Our assumption regarding system performance was
shown to be incorrect; the enterprise system’s ranking performance was far below
the that of the biomedical system’s performance, achieving a maximum NDCG@10
of 0.538 as compared to the biomedical system’s best score of 0.970. There are a
number of potential explanations for this finding. First, TREC systems are highly
tuned to the task and data set, whereas our system replicated the design and pa-
rameters of the biomedical simulations. However, TREC systems do not benefit
from user feedback, offsetting this apparent advantage enjoyed by TREC systems.
Second, and most importantly, the excellent performance on the biomedical data set
was due in large part to the high quality of MeSH annotations; fewer than one-fifth
of the enterprise query-document pairs had any metadata of any kind.
Figure 6.1: Performance comparison with TREC Enterprise 2007 systems, our per-formance in grey.
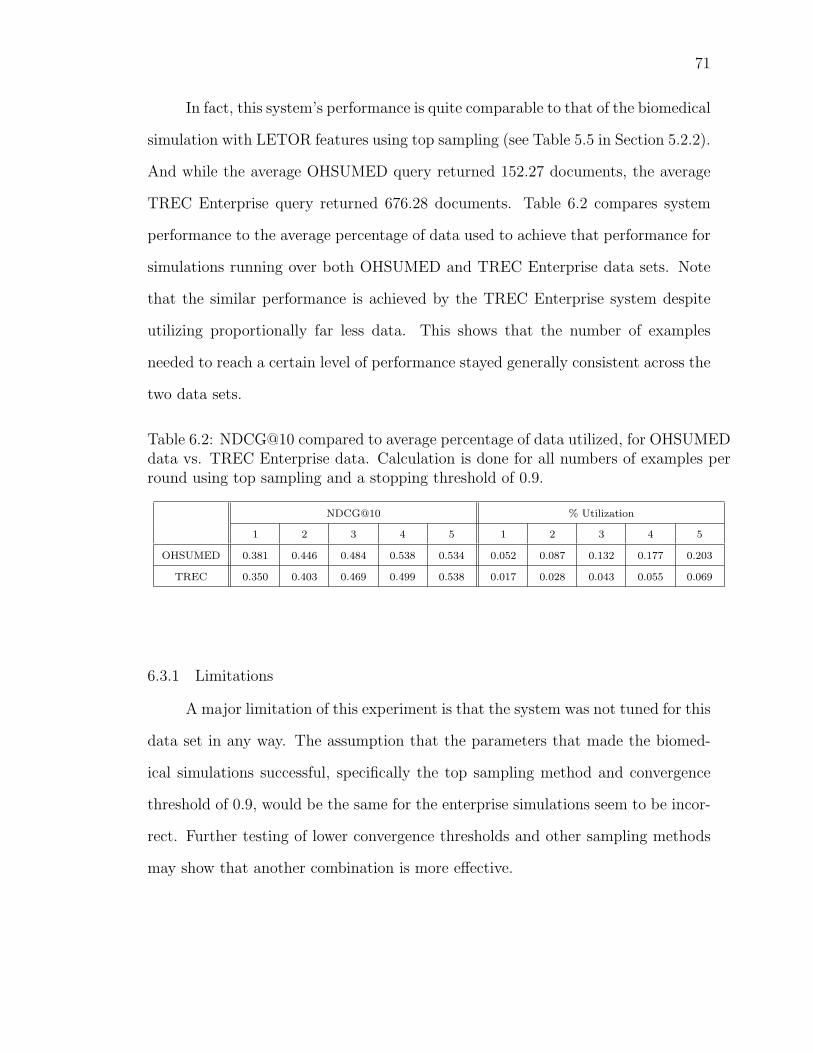
71
In fact, this system’s performance is quite comparable to that of the biomedical
simulation with LETOR features using top sampling (see Table 5.5 in Section 5.2.2).
And while the average OHSUMED query returned 152.27 documents, the average
TREC Enterprise query returned 676.28 documents. Table 6.2 compares system
performance to the average percentage of data used to achieve that performance for
simulations running over both OHSUMED and TREC Enterprise data sets. Note
that the similar performance is achieved by the TREC Enterprise system despite
utilizing proportionally far less data. This shows that the number of examples
needed to reach a certain level of performance stayed generally consistent across the
two data sets.
Table 6.2: NDCG@10 compared to average percentage of data utilized, for OHSUMEDdata vs. TREC Enterprise data. Calculation is done for all numbers of examples perround using top sampling and a stopping threshold of 0.9.
NDCG@10 % Utilization
1 2 3 4 5 1 2 3 4 5
OHSUMED 0.381 0.446 0.484 0.538 0.534 0.052 0.087 0.132 0.177 0.203
TREC 0.350 0.403 0.469 0.499 0.538 0.017 0.028 0.043 0.055 0.069
6.3.1 Limitations
A major limitation of this experiment is that the system was not tuned for this
data set in any way. The assumption that the parameters that made the biomed-
ical simulations successful, specifically the top sampling method and convergence
threshold of 0.9, would be the same for the enterprise simulations seem to be incor-
rect. Further testing of lower convergence thresholds and other sampling methods
may show that another combination is more effective.
72
6.4 Conclusion
Our system has been shown to be somewhat effective in the enterprise do-
main. System performance was below that of the majority of the TREC Enterprise
systems, and far below our best performance in the biomedical domain. In retro-
spect, we should have altered our hypothesis to reflect the fact that we had too little
metadata to perform ranking on par with the MeSH data, and instead hypothesized
that the system would perform comparatively to the LETOR data. While perfor-
mance was disappointing, an important result of the simulation was the finding that
proportionally more data was not required to achieve proportional performance for
differently sized retrieval sets.

73
CHAPTER 7
USER STUDY IN THE BIOMEDICAL DOMAIN
As the framework presented in this thesis is designed to be used as an online,
ad-hoc search system, its performance outside of simulation must be measured.
In this chapter, we present a preliminary user study to assess whether or not a
large-scale user study is warranted for this system. This study is conducted using
PubPref, an online implementation of the rank learning framework presented in
Chapter 4 operating over the MEDLINE dataset. We show that human users of the
live system report satisfaction with the system, and that good ranking performance
is achieved using relatively little feedback regardless of how many documents their
queries returned.
7.1 User Study
The objective of this study is to ascertain whether or not a full-scale user
study of a live, online, ad-hoc system implementing the framework described in this
thesis is reasonable. To show this, we intend to compare system performance in
simulations to performance in a live system with real users. Specifically, we recreate
the conditions of the simulation with MeSH feature vectors, using top sampling
with three feedback examples collected per round, and a convergence threshold of
0.7. These parameters were chosen somewhat arbitrarily in order to reproduce the
conditions under which our simulations provided a reasonable level of performance,
given a reasonable amount of feedback. Furthermore, we wish to determine if the
implementation is fast enough to be used in an online, ad-hoc environment. We
will consider the framework worthy of further study if we are able to achieve an
interquartile mean NDCG@10 of 0.665 with fewer than 17 feedback examples, and

74
an average satisfaction rating above 3.0 regarding system speed (see Section 7.1.2).
7.1.1 Participants
Nine non-remunerated participants engaged in the study, recruited through
colleagues of the author. Participants were asked to fill out a demographic survey,
as presented in Appendix A.3. The majority of users were between the ages of 26
and 40, and used systems similar to PubPref weekly or daily. The majority of users
also reported searching for items with which they had familiarity, but not complete
expertise. Demographic data is summarized in Figure 7.2.
7.1.2 Materials and Procedure
The study was conducted online. Participants were given login information
for the web-based implementation described in Section 7.1.2.1, along with a copy
of the training document described in Appendix A.1 instructing them in basic use
of the system. Participants used the system from their personal computers, at a
time of their choosing. Upon logging in for the first time, participants were asked
to digitally sign a consent form (see Appendix A.2). The study task was to perform
a search using the PubPref system, just as one would if searching PubMed. The
only guidance they received regarding how they should search was that “PubPref
works best with several hundred search results”. The intent of this instruction
was to encourage participants to submit queries that would return more than ten
documents, the minimum required for the PubPref system to function. The practical
effect of this instruction is that participants were likely to enter very broad, non-
specific queries. As we did not assign arbitrary search queries, participants were
allowed to search for documents on subjects they were familiar with.
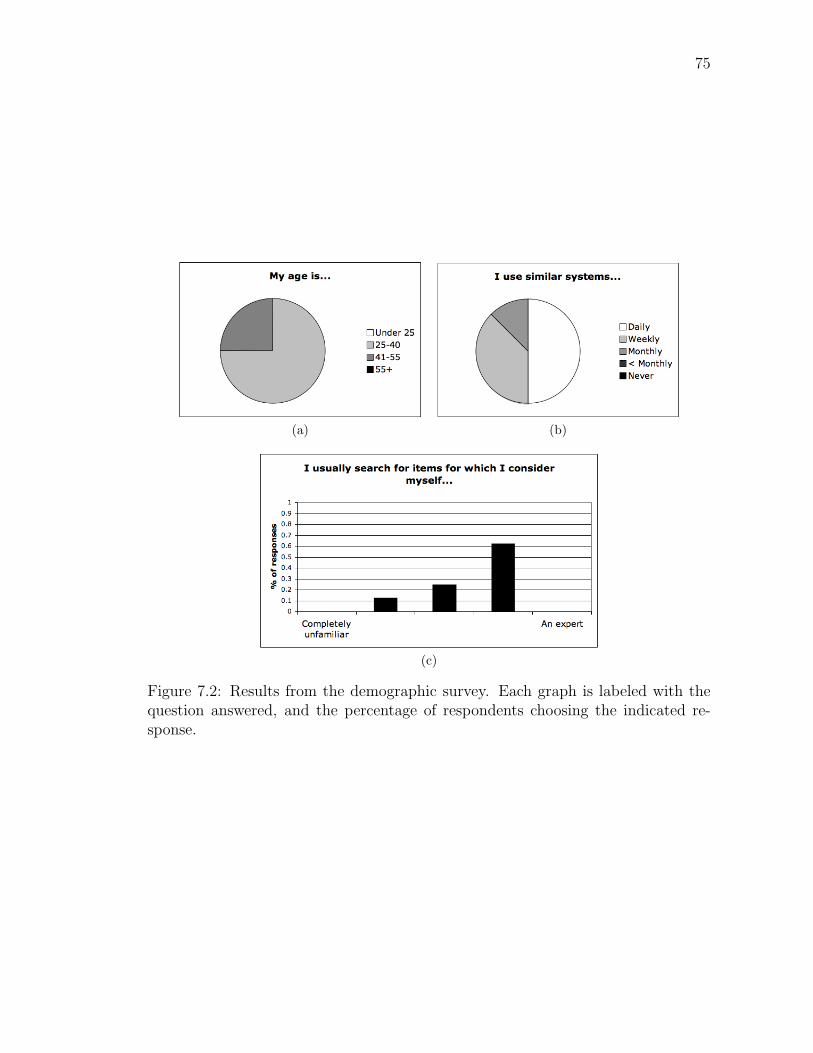
75
(a) (b)
(c)
Figure 7.2: Results from the demographic survey. Each graph is labeled with thequestion answered, and the percentage of respondents choosing the indicated re-sponse.

76
After entering their query, users are brought to the feedback page, where
feedback rounds begin. Rounds continue until the stopping criterion has been met,
or the user abandons the search. Abandoned searches are discounted from analysis.
Once feedback rounds terminate, results are displayed to the user. The user then
has the option of ranking another ten documents, allowing us to be sure that we
can calculate NDCG@10 for the final ranking. Finally, the users are asked to fill
out a survey regarding their satisfaction with the system, presented in Appendix
A.4. The most important facet of satisfaction for this experiment will be question
2, i.e., the user’s perception of system speed.
7.1.2.1 Web-Based Implementation of the GeneralFramework
The rank learning framework is implemented as a series of Python CGI scripts
supported by a PostgreSQL database backend. User searches are processed using
the Entrez eUtils1 which process the search just as if the user had searched at
the main PubMed site. Result identifiers are returned, as the abstracts and their
associated MeSH feature vectors are stored locally. SVM ranking and learning is
done with the SVMLight package [30]. Searches returning fewer than ten results
are not put through ranking rounds, as there is too little data to perform adequate
learning and ranking.
7.2 Results and Discussion
Nine participants made a total of twelve queries to the PubPref system. Here,
we report the results of the demographic survey administered to the participants, of
the use of the system itself, and of the satisfaction survey filled out by participants
1http://www.ncbi.nlm.nih.gov/entrez/query/static/eutils help.html
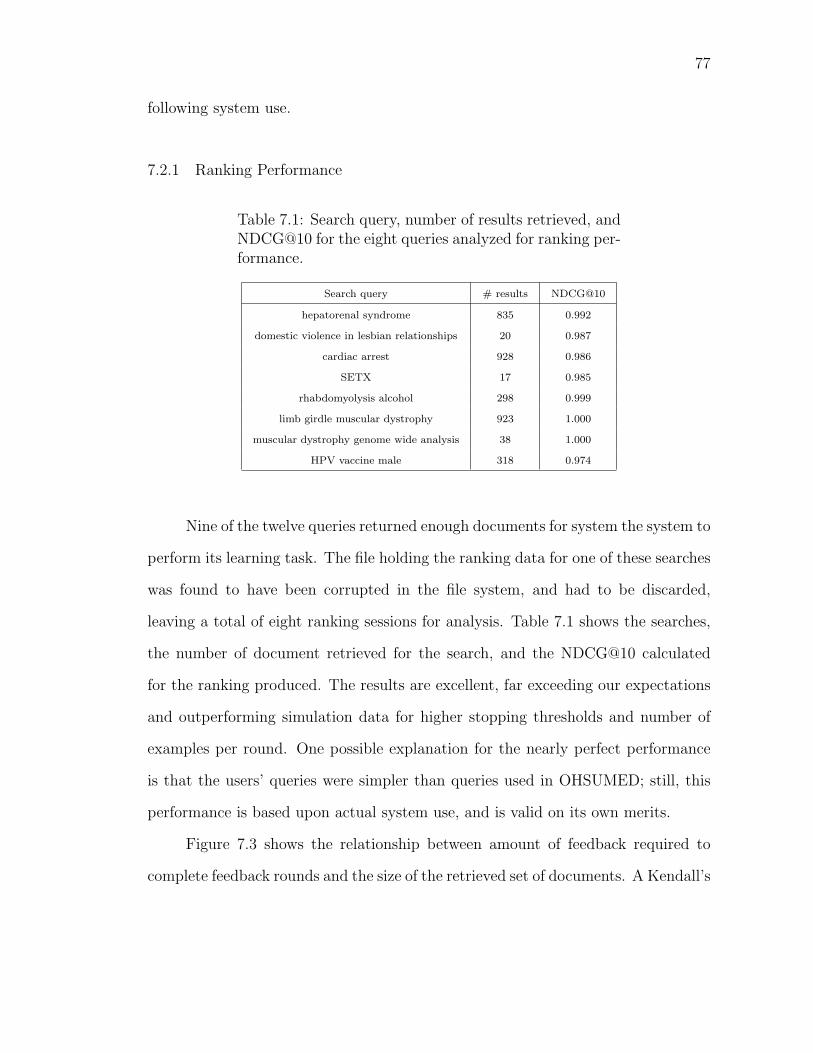
77
following system use.
7.2.1 Ranking Performance
Table 7.1: Search query, number of results retrieved, andNDCG@10 for the eight queries analyzed for ranking per-formance.
Search query # results NDCG@10
hepatorenal syndrome 835 0.992
domestic violence in lesbian relationships 20 0.987
cardiac arrest 928 0.986
SETX 17 0.985
rhabdomyolysis alcohol 298 0.999
limb girdle muscular dystrophy 923 1.000
muscular dystrophy genome wide analysis 38 1.000
HPV vaccine male 318 0.974
Nine of the twelve queries returned enough documents for system the system to
perform its learning task. The file holding the ranking data for one of these searches
was found to have been corrupted in the file system, and had to be discarded,
leaving a total of eight ranking sessions for analysis. Table 7.1 shows the searches,
the number of document retrieved for the search, and the NDCG@10 calculated
for the ranking produced. The results are excellent, far exceeding our expectations
and outperforming simulation data for higher stopping thresholds and number of
examples per round. One possible explanation for the nearly perfect performance
is that the users’ queries were simpler than queries used in OHSUMED; still, this
performance is based upon actual system use, and is valid on its own merits.
Figure 7.3 shows the relationship between amount of feedback required to
complete feedback rounds and the size of the retrieved set of documents. A Kendall’s
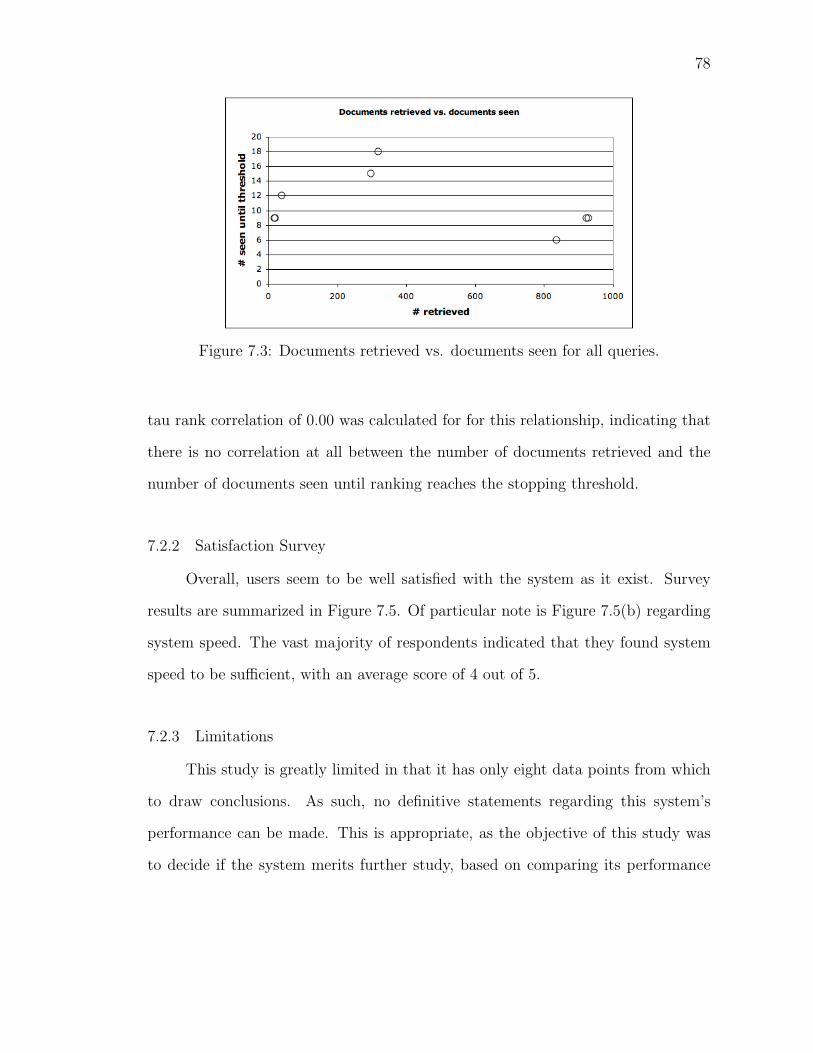
78
Figure 7.3: Documents retrieved vs. documents seen for all queries.
tau rank correlation of 0.00 was calculated for for this relationship, indicating that
there is no correlation at all between the number of documents retrieved and the
number of documents seen until ranking reaches the stopping threshold.
7.2.2 Satisfaction Survey
Overall, users seem to be well satisfied with the system as it exist. Survey
results are summarized in Figure 7.5. Of particular note is Figure 7.5(b) regarding
system speed. The vast majority of respondents indicated that they found system
speed to be sufficient, with an average score of 4 out of 5.
7.2.3 Limitations
This study is greatly limited in that it has only eight data points from which
to draw conclusions. As such, no definitive statements regarding this system’s
performance can be made. This is appropriate, as the objective of this study was
to decide if the system merits further study, based on comparing its performance
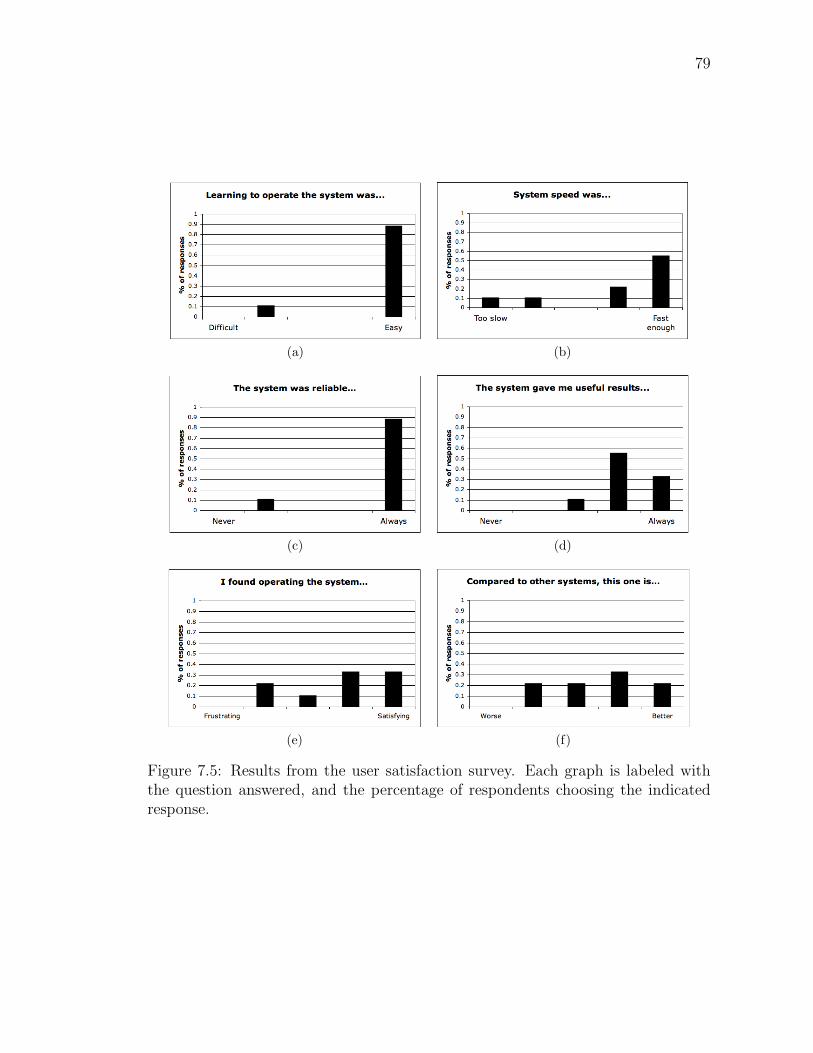
79
(a) (b)
(c) (d)
(e) (f)
Figure 7.5: Results from the user satisfaction survey. Each graph is labeled withthe question answered, and the percentage of respondents choosing the indicatedresponse.

80
to simulation. Any results we obtained from this study must be verified in a much
larger, full-scale study of the system. A second limitation is that we neglected to
compare performance of this system to a simple PubMed search ranked by date (the
default setting). Thus, we cannot at this point conclude whether or not this system
is superior to the existing PubMed search.
7.3 Conclusion
The user study showed that the system works well in an ad-hoc online envi-
ronment. Ranking data shows that excellent results were obtained with reasonable
amounts of feedback, often far less than the number of retrieved documents. We
are confident that these results indicate that a full-scale user study is warranted,
and that the system will prove useful to members of the biomedical community at
large.
81
CHAPTER 8
CONCLUSION AND FUTURE WORK
In this thesis, we have shown that ranking functions can be learned by support
vector machines via user feedback. Ranking functions produced in this way perform
well, and can be learned with a reasonable amount of user feedback when exam-
ples are chosen via active learning methods. In the biomedical domain, ranking
functions produced with a fraction of the available data approached perfect ranking
down to the tenth retrieved document, with examples for feedback chosen using the
simple top sampling method (Sec. 5.2.2). Seeding the ranking process with ranked
documents greatly reduced the amount of feedback required to produce high quality
rankings (Sec. 5.4.1). A limitation was found, however, as poor quality feedback
had a profound effect on ranking performance, limiting the system’s usefulness to
non-experts (Sec. 5.5.1). It was found that the general framework for rank learn-
ing with SVMs via feedback was also applicable to the enterprise domain, though
the untuned system was not found to be superior to existing systems (Sec. 6.4).
Finally, a user study to investigate the feasibility of implementing the framework
in an online ad-hoc search environment showed that the system performance was
comparable to our simulations, as well as showing that large sets of retrieved docu-
ments do not require proportionately large amounts of feedback to be ranked (Sec.

82
7.3).
8.1 Future Work
8.1.1 Full User Study
A natural extension of this work is to conduct a full user study of the online
system. A much larger user base would be tapped, and variables such as the con-
vergence threshold and number of feedback examples per round could be studied.
Furthermore, general issues such as how much feedback a user is willing to give
and user interface issues such as how feedback is provided by the user could be
investigated.
8.1.2 Expansion into Legal Discovery
The domain of legal discovery is an interesting one, and worthy of research
into whether or not the general rank learning framework is a reasonable solution
to problems in the domain. Legal discovery is the process of searching business
records for information pertinent to a legal case [5], and carries a number of inter-
esting challenges to information retrieval in general, and more specifically, learning
to rank. Search is done neither online, nor is it done in an ad-hoc manner; the
most common context for search in legal discovery involves a query that has been
constructed through negotiation between opposing legal teams. Furthermore, all
documents retrieved by the search must be judged for relevance, due to the con-
sequences involved in failing to produce relevant documents during the discovery
process. Compounding these factors and adding to the usual challenges in docu-
ment retrieval, the document sets over which discovery must be performed may be
heterogeneous, composed of many media types and domains.

83
Document ranking enters the scenario largely as a matter of economy. While
retrieval must be balanced towards recovery, precision can help limit time spent
reviewing documents not relevant to discovery. Personnel reviewing documents re-
trieved for discovery are usually paralegals, and cannot be expected to be experts in
the material contained in the documents being reviewed. While reviewers making
the final determination regarding a document’s relevance to discovery must obvi-
ously be well trained, less training is required to provide feedback to a system such as
the one proposed in this work. A small team of paralegals could be trained quickly
to provide feedback to a ranking system, focusing on documents highly likely not to
be relevant, limiting the chances of false negative annotation. The resulting ranking
function would allow reviewers to better target their efforts.
Another interesting facet of legal discovery is that, since each retrieved docu-
ment must be reviewed, it is prudent to perform evaluation over the entire retrieval
set. The success of the top sampling method in the work presented may not be
duplicated in such a task. Experimentation regarding the suitability of other active
learning methods, such as proximity sampling, should be repeated for this domain.
8.1.3 Active Learning Methods
This work does not present an exhaustive investigation of active learning meth-
ods which could be employed to learn ranking functions as part of the proposed
framework. As top sampling produces high quality rankings, future investigations
into alternate active learning methods should focus on reducing the amount of feed-
back required to achieve this level of performance. One potential method would be
to measure the similarity between the feature vectors of documents already seen for
ranking and those unseen. By choosing highly ranked but unseen examples with
84
feature vectors that do not resemble those already seen, the document space can be
more effectively searched.
Beyond investigating different active learning methods, techniques to increase
the speed of learning should also be investigated. As performance gains begin to
level off at an NDCG@10 of around 0.8, it may be possible to “jump start” learning
gains by changing how we sample. Relevant documents dissimilar to those already
seen and annotated for feedback may not be seen by top sampling, leading to per-
formance stagnation as documents the system is already ranking with confidence
reinforce the existing model without adding any new information. Sampling in a
different manner once a reasonable ranking has been achieved will at worst reinforce
the existing model, and at best add new information. A simple metric for deter-
mining when to change from top sampling could involve identifying when a user
gives feedback indicating that all documents submitted for relevance information
are relevant. Assuming the set of relevant documents has not been exhausted, this
should occur at some point if the ranking is of high quality; if not, new information
is presumably being learned.
8.1.4 Consistency Checking and Concept Drift
The gradient oracle experiment showed that poor quality feedback is a major
issue for the framework as presented; incorrect or inconsistent relevance judgements
result in a disproportionate degradation of system performance. For this reason,
it is critical to investigate methods of ensuring that feedback provided by users is
consistent with their information need.
A simple way to check for this consistency is to group, or “cluster”, feed-
back. Clustering is an unsupervised machine learning method which seeks to group
85
examples together based on some notion of similarity. If users’ feedback is con-
sistent with their information needs, their relevance judgements should eventually
cluster together, highly relevant documents clustering with other highly relevant
documents, etc. Feedback inconsistent with these clusters could be discarded, or
presented to the user again for relevance judgement.
A related topic for future work involves concept drift; as a user searches for
documents, the user’s information need may change as more is learned about the
topic. In this case, inconsistent feedback from early feedback rounds might be the
norm. While a fundamentally different task than document retrieval, the frame-
work presented could be adapted to data exploration, allowing the user to explore
retrieved documents with no stopping criterion, reranking documents and perhaps
retrieving new documents through a relevance feedback mechanism as the user’s
information need evolves.
8.1.5 Collaborative Filtering
The online tool described in Chapter 7 provides a platform for investigation
into collaborative filtering for biomedical professionals. Collaborative filtering in-
volves using data from a number of users in order to filter items in a large data set;
it was originally described as a way to filter email and Usenet messages [23], and has
been used more recently in recommender systems [25]. Preference data collected
from the PubPref user base could be employed to help recommend articles to other
users, as well as acting as an active learning method; if a new search is found to be
similar to some others done in the past, documents rated highly relevant by other
users on those similar searches could be shown to the new user for feedback.

86
APPENDIX A
USER STUDY MATERIALS
A.1 Training Document
The following text was sent to all study participants. A copy was also viewable
online.
PubPref Instructions & FAQ
* What is PubPref? PubPref is a system designed to provide relevance-based
ranking for PubMed queries, learned from user feedback. Its aim is to reduce the
amount of time spent sifting through search results by sorting those results based
on the user’s preferences.
* How do I access PubPref? PubPref can currently be found at
http://arens.cs.uiowa.edu/cgi-bin/ranking/login.py and is accessible with a user-
name and password. Contact us at [email protected] if you’re interested in par-
ticipating!
* How do I use PubPref? Use of PubPref begins at the search panel. Enter a
search just as you would at the PubMed interface. Feel free to make your queries
less specific than they might normally be; PubPref works best with several hundred
search results. The system is currently limited to a maximum of 1000 results, and
our pilot study document collection is current up to the year 2007. Search may take
up to ten seconds, please be patient.
Once the search returns, you will be instructed to begin the feedback process.
Three results from your search will be displayed, with title, abstract, and a link to
the result on PubMed. Feel free to click on this link, as it should open in a new
window. You are asked to rate each result based on how closely you feel it satisfies
87
your information need. Simply put, is this result the sort of thing you’re looking
for? Click the “Submit feedback” button at the bottom of the page to continue.
The learning process begins once feedback has been submitted. You will repeat
the feedback process a number of times, until a ranking for your search has been
learned that meets or exceeds our quality standards. If at any time you wish to
abandon the feedback process, click the “Abandon feedback” button at the bottom
of the page, and your search results will be displayed using the best ranking data
available. Please refrain from hitting the “back” button on your browser during the
learning process, as this may cause unexpected behavior in the system.
We consider learning to have been successful when our quality measure has
been satisfied. Once this happens, you will be invited to view your search results.
Links to the results in PubMed will open in new windows. Once you have finished
viewing your results, we ask that you complete our usage survey to let us know your
thoughts on the search experience.
* Further questions or comments? Feel free to email us: [email protected]
A.2 Consent Form
Following is the text of the consent document participants were required to
agree to before using the system.
We invite you to participate in a research study being conducted by inves-
tigators from The University of Iowa. The purpose of the study is to assess the
efficacy of a web-based search engine system using user feedback for the creation of
relevance-based ranking functions for search over high volume document sets.
If you agree to participate, we would like you to use the search system and
rate the relevance of search results shown to you over a number of feedback rounds.

88
After you provide this feedback, we ask that you fill out a short survey regarding
your use of the system. You are free to skip any questions that you prefer not to
answer. It will take approximately twenty minutes to a half hour to complete this
task.
We will not collect your name or any identifying information about you. We
will not record your computer’s IP address. Each search task you undertake will be
given a randomized ID, which will be unconnected to any other searches you have
undertaken in the past. It will not be possible to link you to your responses on the
survey.
Taking part in this research study is completely voluntary. If you do not wish
to participate in this study, simply refrain from logging in to the search website.
If you have questions about the rights of research subjects, please contact
the Human Subjects Office, 300 College of Medicine Administration Building, The
University of Iowa, Iowa City, IA 52242, (319) 335-6564, or e-mail [email protected].
Thank you very much for your consideration of this research study.
A.3 Demographic Survey
Figure A.1 is a screenshot of the demographic survey participants were asked
to fill out.
A.4 Satisfaction Survey
Figure A.2 is a screenshot of the satisfaction survey participants were asked
to fill out.

89
Figure A.1: Screenshot of the demographic survey

90
Figure A.2: Screenshot of the satisfaction survey
91
REFERENCES
[1] Abdi, H. The kendall rank correlation coefficient. In Encyclopedia of Mea-
surement and Statistics, N. J. Salkind, Ed. SAGE Publications, 2007.
[2] Baeza-Yates, R., and Ribeiro-Neto, B. Modern Information Retrieval.
Addison-Wesley, 1999.
[3] Bailey, P., Craswell, N., Soboroff, I., Thomas, P., de Vries, A. P.,
and Yilmaz, E. Relevance assessment: Are judges exchangeable and does it
matter? In Proc. ACM SIGIR Intl. Conf. on Information Retrieval (SIGIR
’08) (2008).
[4] Bailey, P., de Vries, A. P., Craswell, N., and Soboroff, I. Overview
of the TREC 2007 enterprise track. In Proc. Text Retrieval Conf. (TREC ’07)
(2007).
[5] Baron, J. R., Lewis, D. D., and Oard, D. W. TREC-2006 legal track
overview. In Proc. Text Retrieval Conf. (TREC ’06) (2006).
[6] Boser, B. E., Guyon, I. N., and Vapnik, V. N. A training algorithm for
optimal margin classifiers. In Conf. on Learning Theory (COLT ’92) (1992).
[7] Brinker, K. Active learning of label ranking functions. In Proc. Intl. Conf.
on Machine Learning (ICML 2004) (2004).

92
[8] Bronander, K. A., Goodman, P. H., Inman, T. F., and Veach, T. L.
Boolean search experience and abilities of medical students and practicing
physicians. Teaching and Learning in Medicine 16, 3 (Sep 2004), 284–9.
[9] Burges, C., Shaked, T., Renshaw, E., Lazier, A., Deeds, M., Hamil-
ton, N., and Hullender, G. Learning to rank using gradient descent. In
Proc. 22nd Intl. Conf. on Machine Learning (2005).
[10] Cao, Y., Xu, J., Liu, T.-Y., Li, H., Huang, Y., and Hon, H.-W.
Adapting ranking SVM to document retrieval. In Proc. ACM SIGIR Intl.
Conf. on Information Retrieval (SIGIR ’06) (2006).
[11] Christianini, N., and Shawe-Taylor, J. An Introduction to Support Vec-
tor Machines and Other Kernel-Based Learning Methods. Cambridge Univer-
sity Press, 2000.
[12] Churchill, G. A., and Peter, J. Research design effects on the reliability
of rating scales: A meta-analysis. Journal of Marketing Research 21, 4 (1984),
360–375.
[13] Cohen, W. W., Schapire, R. E., and Singer, Y. Learning to order
things. Journal of Artificial Intelligence Research, 10 (1999), 243–270.
[14] Cohn, D., Atlas, L., and Ladner, R. Improving generalization with
active learning. Machine Learning 15, 2 (May 1994), 201–221.
[15] Cortes, C., and Vapnik, V. N. Support-vector networks. Machine Learn-
ing 20, 3 (1995).

93
[16] Craswell, N., and Hawking, D. Overview of the TREC 2004 web track.
In Proc. Text Retrieval Conf. (TREC ’04) (2004).
[17] Drucker, H., Shahrary, B., and Gibbon, D. C. Support vector ma-
chines: Relevance feedback and information retrieval. Information Processing
and Management 38 (2002), 305–323.
[18] Dublin Core Metadata Initiative. Dublin core metadata element set,
version 1.1, 2009.
[19] Ertekin, S., Huang, J., Bottou, L., and Giles, C. L. Learning on the
border: Active learning in imbalanced data classification. In Proc. ACM Conf.
on Information and Knowledge Management (CIKM ’07) (2007).
[20] Fagin, R., Kumar, R., and Sivakumar, D. Comparing top-k lists. SIAM
Journal of Discrete Math 17, 1 (2003), 134–160.
[21] Freund, Y., and Schapire, R. E. A decision-theoretic generalization of on-
line learning and an application to boosting. Journal of Computer and System
Sciences (1997).
[22] Goetz, T., and von der Lieth, C.-W. PubFinder: a tool for improving
retrieval rate of relevant pubmed abstracts. Nucleic Acids Research 33, Web
Server issue (Jun 2005), W774–8.
[23] Goldberg, D., Nichols, D., Oki, B. M., and Terry, D. Using collabo-
rative filtering to weave an information tapestry. Communications of the ACM
35, 12 (1992).
94
[24] Har-Peled, S., Roth, D., and Zimak, D. Constraint classification: A new
apporach to multiclass classification. In Algorithmic Learning Theory. Springer
Berlin/Heidelberg, 2002.
[25] Herlocker, J. L., Konstan, J. A., Terveen, L. G., and Riedl, J. T.
Evaluating collaborative filtering recommender systems. ACM Transactions
on Information Systems 22, 1 (2004).
[26] Hersh, W., Buckley, C., Leone, T., and Hickam, D. OHSUMED: An
interactive retrieval evaluation and new large test collection for research. In
Proc. ACM SIGIR Intl. Conf. on Information Retrieval (SIGIR ’94) (1994).
[27] Herskovic, J. R., and Bernstam, E. V. Using incomplete citation data for
MEDLINE results ranking. In Proc. Ann. Symp. American Medical Informatics
Association (AMIA ’05) (2005), pp. 316–320.
[28] Ide, E. New experiments in relevance feedback. In The SMART Retrieval Sys-
tem - Experiments in Automatic Document Processing, G. Salton, Ed. Prentice
Hall, 1971.
[29] Jarvelin, K., and Kekalainen, J. Cumulated gain-based evaluation of IR
techniques. ACM Transactions on Information Systems 20, 4 (October 2002),
422–446.
[30] Joachims, T. Making large-scale SVM learning practical. In Advances in
Kernel Methods - Support Vector Learning, B. Scholkopf, C. Burges, and A. Smola,
Eds. MIT Press, 1999.
95
[31] Joachims, T. Optimizing search engines using clickthrough data. In Proc.
ACM SIGKDD Intl. Conf. on Knowledge Discovery and Data Mining (SIGKDD
’02) (2002), pp. 133–142.
[32] Jurafsky, D., and Martin, J. H. Speech and Language Processing. Prentice-
Hall, 2000.
[33] Lewis, J., Ossowski, S., Hicks, J., Errami, M., and Garner, H. R.
Text similarity: an alternative way to search MEDLINE. Bioinformatics 22,
18 (2006), 2298–2304.
[34] Lin, Y., Li, W., Chen, K., and Liu, Y. A document clustering and
ranking system for exploring MEDLINE citations. Journal of the American
Medical Informatics Assn. 14, 5 (2007), 651–661.
[35] Liu, T.-Y., Xu, J., Qin, T., Xiong, W., and Li, H. Letor: Benchmark
dataset for research on learning to rank for information retrieval. In Proc.
ACM SIGIR Intl. Conf. on Information Retrieval (SIGIR ’07) (2007).
[36] Muin, M., and Fontelo, P. Technical development of PubMed interact:
an improved interface for MEDLINE/PubMed searches. BMC Bioinformatics
6, 36 (2006).
[37] Nallapati, R. Discriminative models for information retrieval. In Proc. ACM
SIGIR Intl. Conf. on Information Retrieval (SIGIR ’04) (2004).
[38] National Library of Medicine. Introduction to MeSH.
http://www.nlm.nih.gov/mesh/introduction.html, June 2009.

96
[39] National Library of Medicine. MEDLINE fact sheet.
http://www.nlm.nih.gov/pubs/factsheets/medline.html, June 2009.
[40] Page, L., Brin, S., Motwani, R., and Winograd, T. The PageRank
citation ranking: Bringing order to the web [monograph], 1999.
[41] Plikus, M. V., Zhang, Z., and Chuong, C.-M. Pubfocus: Seman-
tic MEDLINE/PubMed citations analytics through integration of controlled
biomedical dictionaries and ranking algorithm. BMC Bioinformatics 7 (Oct
2006), 424.
[42] Radlinski, F., and Joachims, T. Query chains: Learning to rank from
implicit feedback. In Proc. ACM Intl. Conf. on Knowledge Discovery and
Data Mining (SIGKDD ’05) (2005).
[43] Robertson, S. Overview of the okapi projects. Journal of Documentation
53, 1 (1997).
[44] Rocchio, J. J. Relevance feedback in information retrieval. In The SMART
Retrieval System - Experiments in Automatic Document Processing, G. Salton,
Ed. Prentice Hall, 1971.
[45] Salton, G., and McGill, M. J. Introduction to Modern Information Re-
trieval. McGraw-Hill Inc., 1986.
[46] Shultz, M. Mapping of medical acronyms and initialisms to Medical Sub-
ject Headings (MeSH) across selected systems. Journal of the Medical Library
Association 94, 4 (2006).

97
[47] Suomela, B. P., and Andrade, M. A. Ranking the whole MEDLINE
database according to a large training set using text indexing. BMC Bioinfor-
matics 6 (Mar 2005), 75.
[48] Tong, S., and Chang, E. Support vector machine active learning for image
retrieval. In Proc. ACM Intl. Conf on Multimedia (MM ’01) (2001).
[49] Tong, S., and Koller, D. Support vector machine active learning with ap-
plications to text classification. Journal of Machine Learning Research (2001),
45–66.
[50] Vapnik, V. N. Statistical Learning Theory. Wiley, 1998.
[51] von Hippel, P. T. Mean, median, and skew: Correcting a textbook rule.
Journal of Statistics Education 13, 2 (2005).
[52] You, G., and Hwang, S. Personalized ranking: A contextual ranking ap-
proach. In Proc. ACM Symp. on Applied Computing (SAC ’07) (2007).
[53] Yu, H. SVM selective sampling for ranking with application to data retrieval.
In Proc. Intl. ACM SIGKDD Conf. on Knowledge Discovery and Data Mining
(SIGKDD ’05) (Jun 2005).
[54] Zhai, C., and Lafferty, J. A study of smoothing methods for language
models applied to ad hoc information retrieval. In Proc. ACM SIGIR Intl.
Conf. on Information Retrieval (SIGIR ’01) (2001).