Embed Size (px)
Citation preview

Department of Economics Working Paper Series
Learning the Ropes: General Experience, Task-Specific Experience, and the Output of Police Officers Gregory DeAngelo
Emily G. Owens
Working Paper No. 17-19
This paper can be found at the College of Business and Economics Working Paper Series homepage: http://business.wvu.edu/graduate-degrees/phd-economics/working-papers

Learning the Ropes: General Experience, Task-Specific Experience, and the Output of Police Officers
Gregory DeAngelo* Emily G. Owens†
July 2017‡
Abstract
We estimate the role that law enforcement officer experience has on the probability of
punishment, using a unique data set of tickets issued by the Idaho State Police linked to human
resource records. All else equal, officers issue fewer tickets earlier in their career than later in
their career. Quasi-exogenous shocks to an officer’s task-specific experience, generated by law
changes, cause a temporary reduction in the frequency with which a subset of troopers “use”
those laws, creating disparities in the likelihood that individual citizens are cited for law
violations. The reduction in ticketing in response to a law change is largest for newer troopers,
and law changes later in a trooper’s career have a smaller effect on his use of that law.
* Corresponding author: West Virginia University, Department of Economics, Morgantown, WV, 26506 (e-mail: [email protected]) † University of Pennsylvania, Department of Criminology, Philadelphia PA 19104 (e-mail: [email protected]) ‡ This paper has been greatly enriched by Dr. Owens’ time as a 2012-2013 research fellow at the Police Foundation. We thank Adam Cox, Steven Raphael, Ben Vollaard, Bryan McCannon, Richard Mansfield, and Michael Waldman for helpful comments. We thank Won-Ji Lee and Ji Won Park for excellent research assistance, as well as Janeena Wing of the Idaho State Police for providing us with the administrative records. We would also like to thank seminar participants at the University of Virginia, Temple University, the State University at Albany, the University of Bern, the University of Waterloo, West Virginia University, the Conference on Empirical Legal Studies, the National Bureau of Economic Research Summer Institute, the Latin American Workshop on Law and Economics, and the Southern Economic Association Annual Meetings. All errors are our own.
1
1. Introduction
Documenting and understanding the source of disparities in the application of laws,
particularly criminal laws, is a pressing social problem. Since the presence of an official criminal
record has negative consequences for employment, education, housing decisions, and eligibility
for government assistance programs, variation across equally criminal individuals in the
probability of arrest, conviction, and incarceration, is a major contributor to inequality.
A large literature in law and economics has identified the presence of criminal justice
disparities based on an individual’s racial or ethnic background, which can be exacerbated by the
race of the criminal justice agent (e.g. police officer, jury member, judge) making the decision
about criminal culpability or punishment. More recently, researchers have documented additional
sources of disparities in the justice system, including an officer’s perception of the expected cost
of issuing a ticket, the severity of prior cases tried in the same court, and the time until a judge’s
next meal.
In this paper, we identify disparities in the treatment of American motorists in the state of
Idaho. Drawing on recent theoretical and empirical advances in labor economics (e.g. Abowd
and Kramarz 1998, Gibbons and Waldman 2004, Bagger et al. 2014), we point out that
legislative changes in the Idaho State Criminal and Traffic code are likely to be differentially
enforced by different Idaho State Troopers in a predictable way. Specifically, we point out that in
a simple model of trooper decision making, more experienced troopers will, rationally, issue
more tickets than inexperienced troopers. In addition, accurately issuing tickets for different
Idaho State Statutes constitutes different tasks a trooper must perform; identifying citizens who
are driving too fast in a residential area is a different skill from identifying citizens who are
driving under the influence, which is also different from identifying people with improper towing
2
permits. Recent research on the importance of task-specific experience suggests that changes to a
law or legal code may involve a cost of temporarily reduced enforcement while troopers gain
experience with a new task.
Between 1997 and 2009, the Idaho State Legislature made a total of 90 amendments to 66 of
the 286 criminal and traffic laws that the Idaho State Police (ISP) regularly enforce.1 Using an
administrative data set of all tickets issued by the ISP between 2002 and 2009, we show that
when the Idaho state legislature revises a state statute and changes one of the tasks that troopers
must perform, certain troopers become temporarily less likely to issue tickets for the changed
statute.
By linking the ticketing data with human resources records, we estimate that, on average, a
trooper with one more semester of experience on the force will issue about 2.8 more tickets in
total, about 0.01 for each law on average. In comparison, a one semester increase in the length of
time a trooper has been enforcing a particular version of a law is associated with an imprecisely
estimated 0.004 fewer tickets for that specific law. This null effect masks substantial predictable
heterogeneity in the return to task-specificexperience. First, we find that controlling for the types
of laws that troopers enforce consistently results in a positive relationship between task-specific
experience and tickets, especially for troopers early in their careers. Second, after a law changes,
troopers with less general experience change the frequency with which they accuse people of
violating that particular law much more than experienced troopers. Third, we find that more
experienced “senior” troopers have flatter general and task-specific experience-ticketing profiles.
1 We limit our sample to laws for which at least 10 citations are issued during our sample period. This excludes 334 laws that are enforced, at some point, from our sample. In robustness tests, we will limit our sample to only laws used at least 200 times, and find similar results.

3
This could be due to decreasing returns to “ticketing capital”, variation in the work environment
for senior troopers, or sample attrition.
In a series of robustness checks, we show that the large response of younger troopers to law
changes is unlikely to be driven by differential attrition from trooper ranks. We observe this
effect regardless of the type of law change - increasing penalties, expanding or reducing the
number of things that are illegal – as all result in the same change in behavior on the part of
troopers, suggesting that this is driven by trooper, rather than citizen behavior. We also utilize a
non-parametric specification and are able to show that our results are driven by the data, rather
than any functional form assumptions.
In addition to complementing the existing research on task-based worker productivity, the
finding that a trooper’s experience, both overall and with a given law, affects the rate at which
individuals are accused of crimes has important implications for criminal justice policy, and in
particular the social cost of changing a law. These results suggest that the impact of any state or
city level policy change on individual behavior is, in part, determined by the experience of the
law enforcement troopers tasked with enforcing the law.
The paper proceeds as follows: in section two, we review the existing empirical evidence on
task-specific experience and output. We then provide some institutional background on the Idaho
State Police in section three, and present an intuitive theoretical framework for thinking about
the incentives faced by state troopers when enforcing the Idaho Statute in section four. In section
five, we describe our data, and we present our analytic framework and reduced form results in
section six, perform a number of robustness and specification checks in section seven, and
conclude with a brief discussion in section eight.
2. Related Literature

4
Documenting how workers adapt to changes in the particulars of their jobs is important for
our understanding of human capital and productivity, but the fact that we are studying the
behavior of state troopers means that our findings have particular relevance for law and
economics as well. State troopers are expected to enforce state laws, and the issuance of tickets is
a byproduct of their job duties; by observing citizen behavior and issuing citations when that
behavior falls outside of legal bounds, state troopers provide justice in society generally, and
produce roadway safety in particular (Bates et al. 2012).
Understanding the factors that affect the probability that someone is arrested, particularly
when those factors are not related to that person’s actual behavior, is of central importance in law
and economics. There is a growing body of evidence in empirical legal studies identifying extra-
legal factors which produce individual disparities in criminal justice outcomes. For example,
Makowsky and Stratmann (2009) found that police officers were more likely to issue tickets to
out of state drivers than people who appear to be local. DeAngelo et al. (2015) finds that
reporting districts immediately adjacent to locations that impose low-priority law mandates for
misdemeanor marijuana offenses experience significant increases in the probability of
misdemeanor marijuana arrests despite no change in legal code. Danziger et al. (2012) presented
evidence that Israeli judges who hear cases shortly after lunch tended to make rulings that were
more favorable to the defense. Schanzenbach and Tiller (2008) demonstrate that US federal court
judges tend to make decisions that reflect the sentencing regime under which they were
appointed, even if the regime has since changed. Bushway et al. (2012) found similar
“stickiness” of judicial opinion in response to changing sentencing guidelines US state courts.
A larger literature on racial profiling has found that a police officer’s race, or the average
racial makeup of the police force, affects the racial composition of people who are arrested

5
(Donohue and Levitt 2001, Antonovics and Knight 2009, Sanga 2014). Further along in the
process, the probability that a black defendant is convicted at trial appears to be a decreasing
function of the fraction of jurors who are black (Bayer et al. 2009). We provide an additional
piece of evidence documenting the role that individual characteristics of criminal justice agents
play in determining how criminal laws are enforced. To the best of our knowledge, we are the
first to identify police officer- level heterogeneity in response to a criminal justice event that,
unlike the race or residence of a citizen, is completely under a policy maker’s control – the
introduction, revision, or repeal of a law.
Economists have recognized the importance of experience, as distinct from innate skill, since
Mincer (1958). However, what is meant by experience and how it should be measured, is
somewhat ambiguous and has been driven in large part by data availability. Most population
surveys record when a person finished school, and so “experience” is often simply measured as
time in the labor force (Blau and Kahn 2013). Administrative records often report how long a
person has worked at a particular firm, allowing economists to track the relationship between
firm specific experience and wages (Abowd et. al 2004, Topel 1991), and some datasets even
track and individual’s occupation, allowing researchers to identify how much experience
someone has in a specific job (Neal 1995). However, comprehensive data on exactly what tasks a
worker preforms as part of their job are still not widely available.
Using a cross section of forecast analysts, Clement et al. (2007) estimate how a given
forecaster’s ability to predict a firm’s earnings after restructuring varies with their time at a firm,
the number of forecast the analyst has previously done, and the number of specific, post-
restructuring forecasts that the analyst has done for the firm. Analysts who have previously

6
studied firms undergoing a major organizational change are better at forecasting a given
company’s earnings after restructuring, but not any better at general forecasting tasks.
Gathmann and Schonberg (2010) build on Clement et al. (2007) by estimating the
relationship between task-specific experience and productivity using German social security
records. They find that a substantial amount of a persons’ wage growth over their lifetime is due
to task-specific experience, and that task-specific experience explains more of lifetime wage
growth for people with higher levels of education. Ost (2014) disentangles job and task-specific
experience using teachers who teach different grades at different points in time, with teacher
“productivity” measured using changes in student test scores. Ost (2014) finds that general
teaching experience raises test scores, but that experience with grade-specific math was also
important; the impact of grade-specific experience on math scores is between ½ the size or
equally as large as the impact of general experience on math scores. For reading scores, general
experience was consistently more important than grade-specific experience. Finally, Cook and
Mansfield (2014) use a more structural approach to identify the relationship between task and
firm specific capital among teachers who teach up to three subjects at a time. While most quality
differences are innate, they identify a steep increase in productivity, also measured using student
test scores, in the first three years of teaching, most of which is driven by increasing task-specific
experience.
Our analysis of the ISP builds on this literature in a number of ways. Similar to more recent
work, we observe individual workers over time, allowing us to minimize bias due to unobserved
time invariant differences in innate ability. We also observe a substantial component of an
individual worker’s output directly, rather than indirectly through wages or test scores. We also
observe workers engaged in many tasks at the same time, allowing us to more credibly separate

7
job from task-specific experience. Finally, our variation in task-specific experience is both
simpler, and plausibly more exogenous, than in Ost (2014) or Cook and Mansfield (2014).
Specifically, while teachers may return to a subject they used to teach, Troopers never “revisit” a
changed law, meaning that we do not have to model how “unused” task-specific human capital
deteriorates over time. In addition, law changes are not related to any given trooper’s
performance, as teacher classroom assignment may be.
3. Institutional Background
The largest law enforcement agency in Idaho is the Idaho State Police (ISP), which employed
282 commissioned troopers and 225 full time staff in 2010. The roughly 150 troopers employed
at any given time carry the largest burden in terms of enforcing the law, writing approximately
3,300 of the 4,600 tickets issued by the ISP each month. Turnover rates in the ISP are quite low
relative to other state agencies; in 2010 there was a 7.2% turnover rate and only a 1.9% voluntary
separation rate in the ISP, compared to a 12.8% turnover rate and 4.8% voluntary separation rate
in the state as a whole (IHR 2012).
There are two major institutional characteristics of the ISP that impact the feasibility of our
empirical analysis. First, we will describe how a trooper learns about the initial tasks assigned to
them, and to changes in the penal code that affect the tasks they must perform. Second, we will
summarize the specific incentives that an ISP trooper faces when enforcing the law.
In order to join ISP at the rank of trooper, an individual must complete training at the ISP
academy and go through some additional post-academy training. Academy training provides a
baseline level of knowledge that the trooper should have when enforcing the law, and the
academy training, in particular, is focused on the law as it exists when the trooper is being

8
trained. 2 Post-academy training comes in the form of, for example, gun training seminars that
the ISP offers at each staff office.
After a trooper joins the force, there are a number of mechanisms the ISP uses to ensure that
troopers are educated about changes that the Idaho legislature makes to state statutes. First, when
changes to the legal system result in major shifts in the way that troopers enforce the law, the ISP
will hold in-service training sessions whereby specialists are sent to the field in order to carry out
an educational program. In addition, troopers are required to complete DVD training at their field
station. For less complicated changes, the troopers are informed in team meetings and via email,
which contain information about changes in procedures that must be enacted but require little in
the way of additional training. Finally, trooper vehicles are equipped with an electronic version
of the Lexis-Nexis code for Idaho that is automatically updated to reflect the current state statute,
and carry a Post-Trooper Standardized Training Book (which troopers refer to as their “cheat
sheet”) that includes all tickets they should issue.
Accurate knowledge about the changes in the legal system is critical for our analysis, and an
equally important concern is the incentives that individual troopers have while enforcing the law.
It is quite common to hear that troopers or police officers face arrest quotas and/or that their job
depends upon raising revenues through fines. In Idaho, fines for traffic tickets do not end up
directly funding the state police. In fact, for a standard speeding traffic infraction, approximately
40% of the fine goes to a state general fund, 20% goes toward court costs, 6% goes to a county
justice fund, and 12% goes toward a law enforcement technology fund and emergency surcharge
2 Before exiting the trooper academy, troopers are required to pass a Peace Trooper Standards and Training exam that requires the trooper to know detailed information about the Federal and State Constitution and Statutes.

9
fee.3 It is therefore not obvious that troopers would believe that their supervisors view tickets as
a source of department revenue.
At the individual trooper level, it is also unclear that issuing more tickets will lead to pay
raises. The ISP, like most state departments in Idaho, pays their employees according to a pre-
determined and fixed pay scale, with compensation determined entirely by state legislature. In
FY 2011, ISP employees could earn an hourly wage of at least $16.59, and no more than $30.51.
On average, most ISP employees receive a $24.41 “policy” wage, based on the nationwide
average pay for similar types of jobs. The most direct incentive trooper’s face when issuing
tickets is, therefore, encouragement or reprimand by their supervisor.
4. Theoretical Foundation
With the exception of piece-rate work, measuring productivity across and within workers is
complicated, and typical measures, like wages or student test scores, are noisy measures of true
worker “output.”4 As law enforcement officers, troopers are charged with discerning illegal
activity on the part of the civilians, and a “task” in this context consists of issuing a ticket to
citizens who violate a particular law. In this section, we present an intuitive model of task- and
general experience to provide a framework for thinking about our reduced form model of tenure
and ticket issuing that captures key institutional features of the ISP.
Some mechanisms that relate tenure to the “production” of tickets apply to employees in any
industry; on-the-job training in time management will allow experienced workers to do more in a
given amount of time. In the particular context of law enforcement, after a trooper issues a ticket
3 See http://www.isc.idaho.gov/rules/iir9.txt for a breakdown of how a fine is distributed across agencies and programs in Idaho. 4 See Dynarski et al (2013) and Jackson (2013) for critiques of the validity of test scores as a measure of the impact of educational investments and teacher performance. Shaw and Lazear (2008) provide a comparison of output to wage growth, and show that initially, wages grow more slowly than output, but that output grows more slowly than wages for more experienced workers.

10
or makes an arrest, he or she must fill out paperwork recording the incident. Learning how to
process a citizen interaction takes time, and as a trooper gains experience writing reports, they
will have more time to patrol, and thus more time to issue tickets. To the extent that legislative
changes require police to write reports and process cases for behaviors that have never
previously been considered crimes, there will be an adjustment process as troopers learn these
new tasks. If changes in a particular statute make it more difficult to process violations of a
particular law, then it is possible that troopers of all experience levels may be hesitant to use it.
Other dimensions of output and productivity, as measured by total number of tickets issued,
are more specific to law enforcement.5 If troopers either issue tickets to civilians who have not
actually violated a law, or fail to issue tickets to civilians who do violate the law, they will
eventually be penalized by their supervisors. For the purposes of exposition, we will assume that
citizens choose an action, a, that lies somewhere on a one dimensional line, and each law, v, in
the Idaho statute establishes a legal threshold along that line, Rv. If Rv < a, then the behavior a is
illegal, and if Rv > a, then a is legal. For example, an action could be a driving speed; in a
commercial area, any speed less than or equal to 35 miles per hour is considered legal, and any
speed greater than 35 miles per hour is a violation of the commercial district speed limit.
When performing their on-the-job tasks, the trooper faces two sources of uncertainty that can
affect their incentive to write a ticket. First, the trooper must be able to accurately observe the
actions taken by the citizen, in order to identify where a falls on the spectrum of legality. Ability
to detect behavior is a general skill that the trooper needs to enforce all laws. For example, what
spots on the highway allow you to observe citizens driving past, but at the same time not be
5 Using tickets issued as a measure of productivity for law enforcement officers may not be first best from a social perspective, but in practice, tickets and arrests are readily available, low cost ways for sergeants to monitor the performance of the different officers they supervise. For more background on evaluating officer performance, see CALEA, 2003

11
readily seen yourself? What is the best way to use a radar gun? Both of these are general skills
that likely improve with overall tenure.
The second source of uncertainty facing a trooper has to do with the exact location of Rv;
even if they observe citizen behavior perfectly, does the trooper know how the behavior they
observe compares to the behavior outlawed by statute? For example, when the legal threshold of
blood alcohol content at which someone is Driving Under the Influence is lowered, (which
amendments to Idaho traffic statutes 18-8004(1)–C(3) did in 1997), the cues that a trooper might
look for as reference points, such as how quickly a person can count backwards from 97, will
change.
Because of these two sources of uncertainty, troopers do not observe the exact value of a, but
rather observe A=aσ/ f(ti,τiv), where σ~ N(0, 1) is a noise term that represents the citizens’ ability
to shade their own actions, and thus the trooper’s ability to match what the citizen is doing to the
particular law. This term can be either positive (meaning that the trooper perceives more
“illegality” than is true) or negative (the citizen’s actions appear “more legal” than they actually
are). The function f(ti,τiv) represents the trooper’s skill, which is a strictly positive, increasing
function of the trooper’s overall time working for the Idaho State Police (ti), and the amount of
time that the trooper has enforced the particular version of law, τiv. Intuitively f(ti,τiv) can
represent the trooper’s ability to collect the evidence required to make the ticket valid in court, or
their experience with the amount of resistance a citizen will pose after being accused of a
particular crime. In addition, as the trooper’s experience with the particulars of a given law
increases, they will be better able to accurately tell if a citizen’s behavior exceeds legal bounds.
We take no initial stance on the specific functional form that defines the relationship between the
two types of experience and ability of a trooper to issue tickets.
12
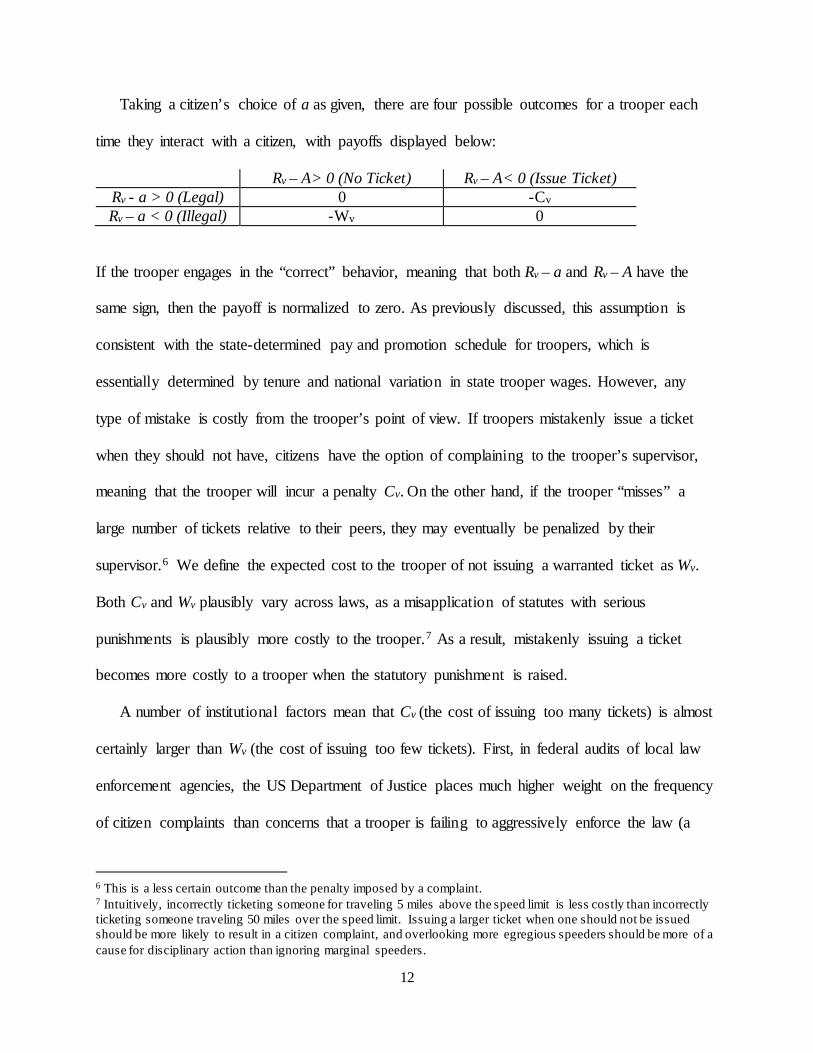
Taking a citizen’s choice of a as given, there are four possible outcomes for a trooper each
time they interact with a citizen, with payoffs displayed below:
Rv – A> 0 (No Ticket) Rv – A< 0 (Issue Ticket) Rv - a > 0 (Legal) 0 -Cv Rv – a < 0 (Illegal) -Wv 0
If the trooper engages in the “correct” behavior, meaning that both Rv – a and Rv – A have the
same sign, then the payoff is normalized to zero. As previously discussed, this assumption is
consistent with the state-determined pay and promotion schedule for troopers, which is
essentially determined by tenure and national variation in state trooper wages. However, any
type of mistake is costly from the trooper’s point of view. If troopers mistakenly issue a ticket
when they should not have, citizens have the option of complaining to the trooper’s supervisor,
meaning that the trooper will incur a penalty Cv. On the other hand, if the trooper “misses” a
large number of tickets relative to their peers, they may eventually be penalized by their
supervisor.6 We define the expected cost to the trooper of not issuing a warranted ticket as Wv.
Both Cv and Wv plausibly vary across laws, as a misapplication of statutes with serious
punishments is plausibly more costly to the trooper.7 As a result, mistakenly issuing a ticket
becomes more costly to a trooper when the statutory punishment is raised.
A number of institutional factors mean that Cv (the cost of issuing too many tickets) is almost
certainly larger than Wv (the cost of issuing too few tickets). First, in federal audits of local law
enforcement agencies, the US Department of Justice places much higher weight on the frequency
of citizen complaints than concerns that a trooper is failing to aggressively enforce the law (a
6 This is a less certain outcome than the penalty imposed by a complaint. 7 Intuitively, incorrectly ticketing someone for traveling 5 miles above the speed limit is less costly than incorrectly ticketing someone traveling 50 miles over the speed limit. Issuing a larger ticket when one should not be issued should be more likely to result in a citizen complaint, and overlooking more egregious speeders should be more of a cause for disciplinary action than ignoring marginal speeders.

13
phenomenon known as “de-policing”) (USDOJ 2012). If the Idaho state legislature increases the
penalties associated with a violation, the return to an individual challenging an unfairly issued
ticket is larger, thus increasing Cv. This is consistent with evidence that police issue more tickets
to out of town drivers who are less likely to appear in court to challenge the officer (Makowsky
and Stratmann 2009). Second, not only is the federal government more concerned about citizen
complaints than de-policing, but most local agencies also place more weight on them as well. At
the local level, in 2007 approximately 39% of law enforcement agencies used some sort of
computer-based “Early Intervention System” to monitor trooper behavior (USDOJ 2007).
Citizen complaints are a standard component of the trooper performance metrics used by these
systems, but tracking the number of arrests made by troopers is only recommended for
particularly comprehensive systems (Walker 2003).8 Finally, law enforcement agencies face
significant public scrutiny when allegations of arrest “quotas” are raised, limiting supervisor’s
ability to punish troopers for issuing too few tickets, even if they suspect de-policing on the part
of troopers.9
With this framework in mind, troopers will issue tickets in a way that minimizes the expected
cost of making a mistake. For a given trooper and law, there is a particular threshold value of
observed citizen behavior A that triggers the trooper’s decision to issue a ticket. If Rv = A then
troopers will mistakenly issue tickets to citizens who are behaving legally at the same rate as
they fail to issue tickets to lawbreakers. However, since the expected cost of issuing an incorrect
ticket is larger than the cost of not issuing a warranted ticket, the cost minimizing value of Rv-A
8 Additionally, heads of law enforcement agencies are moving in the direction of increased use of early-warning systems in light of citizen complaints, see Weitzer and Tuch (2004) 9For example, see news coverage of events in Arlington, VA, Logan, UT, and New York City http://www.wjla.com/articles/2012/03/arlington-county-police-quotas-memo-retracted-73982.html, http://news.hjnews.com/opinion/article_37325c38-4df9-11e1-bc81-001871e3ce6c.html , http://www.cbsnews.com/8301-201_162-57435418/judge-grants-class-action-status-to-suit-accusing-nypd-of-racial-bias-in-stop-and-frisk-policies/?tag=contentMain;contentBody

14
will be positive, and defined by [1- Ф(Rv – A)] / Ф(Rv – A) = Cv / Wv, where Ф(x) is a normal
CDF with a mean of zero and a standard deviation of 1/ f(ti,τiv).
Intuitively, if Cv>Wv, troopers will tolerate a lower level of risk in issuing a ticket than in not
issuing a ticket, and only issue tickets if the probability of observing such risky behavior,
conditional on legal behavior, is particularly low.10 As f(ti,τiv) increases, the optimal value of (Rv
– A) will approach zero as the variance of the distribution of (Rv – A) falls. In other words, as
general experience increases, the likelihood that actual citizen behavior is substantively different
from what the trooper perceives becomes increasingly rare.
In practice, we observe the Idaho state legislature making three types of changes in the Idaho
state code: positive or negative changes in the location of Rv, and increases in the severity of
punishment when Rv – A<0.11 When a law changes, troopers should face two different “shocks”
to their optimal use of a law. First, since troopers are notified of laws that change, this may serve
to increase their knowledge of the location of Rv, particularly if the changing law was not one
they used very often. Alternately, if troopers had a significant amount of experience issuing
tickets for a particular law, and f(ti,τiv) was very large, the law change may temporarily increase
the expected cost of issuing tickets.12
The total impact of a legal change on ticketing is a function of both citizen and trooper
response to a law. If Rv is lowered, making behavior that used to be legal now illegal, all
10 This behavior of regulators is consistent with Leaver (2009) and DeAngelo and McCannon (2015) who find that regulators will choose an enforcement policy so as to minimize “squawking” on the part of the regulated party. 11 All of the law changes in our sample, along with how we coded the change, are listed in appendix table A1. 12 Additional anecdotal evidence of the importance of task-specific experience can be seen in the response of the Washington, DC police to the Feb 26th, 2015 legalization of small amounts of marijuana. While officers had received a nine page description of this reduction in the scope of the law, the head of the officers’ union stated that “for now ... it is easier to take no action” in the enforcement of DC’s marijuana laws. http://www.washingtonpost.com/local/crime/first-day-of-legal-marijuana-in-district-goes-off-quietly/2015/02/26/af00b902-bdc8-11e4-b274-e5209a3bc9a9_story.html?tid=hpModule_99d5f542-86a2-11e2-9d71-f0feafdd1394&hpid=z12
15
troopers will issue more tickets, since Rv – A will be less than zero at lower levels of A, although
there may be fewer citizens who chose to engage in the now illegal behaviors than previously.13
At the same time, the likelihood that a trooper makes a mistake also increases, since the variance
of Rv – A will increase. When the state legislature raises Rv, all troopers will issue fewer tickets,
but mistakes are also more likely to occur as officers temporarily expect larger shocks to
σ/f(ti,τiv). Over time, as troopers gain more experience identifying a relative to the new value of
Rv, the variance of Rv – A will fall again. Finally, incorrectly accusing a citizen of violating a
more harshly punished law raises Cv , and the optimal ratio of [1- Ф(Rv – A)] / Ф(Rv – A). As a
result, troopers will optimally issue fewer tickets, particularly troopers with lower values of
f(ti,τiv). Part of the overall reduction should come from fewer citizens optimally choosing to
engage in the illegal behavior, sine the penalty is higher, but under the assumption that the
location of former-lawbreakers is not related to how much experience a trooper has, any
differential reduction in ticketing for less experienced troopers will be driven entirely by a
trooper’s response to the law.
5. Data
Through a research agreement, we obtained data on all tickets issued by the ISP between
January of 2002 and December of 2009. For each ticket, we know the most serious state statute
that a motorist was accused of violating, the date of the ticket, and the current rank and badge
number of the primary trooper who issued the ticket. We were able to link the trooper identifying
information with Human Resource records of the ISP, indicating the date that the trooper was
hired.
13 In the absence of a violation of IIA, lowering Rv should not change the behavior of a rational person who previously chose a> RvOld. There may be some individuals deterred by the legal penalties, meaning fewer will choose an a’ where RvOld> a’> RvNew than before the law change.

16
We then documented the history of all of the 286 laws that the troopers in our data referenced
more than ten times when citing citizens over this time period. We recorded every instance in
which the legislatively recommended penalty increased, increasing Cv, (49 times), and every
instance in which an amendment changed the scope of a law, moving the location of Rv (51
times). Of the changes in scope, 39 increased the scope of the law, e.g. by lowering the speed
limit in business districts, and the other twelve changes reduced the scope of the law, e.g. by
amending a ban on loaded firearms in vehicles to allow for hunting rifles. All amendments to the
Idaho statute go into effect on July 1st of each year.
After merging the ticket database with information on the history of the Idaho statutes, we
then calculated how many times each trooper issued a ticket for each individual law in each six-
month period, beginning January 2002. We then calculated two measures of experience for each
law in each half-year interval (semesters): Starting at one, how many semesters of experience did
the trooper have with the ISP? This is our measure of general human capital, which is trooper-
time specific. We also calculated a measure of task-specific experience: In each period, how
much experience has a given trooper had with the current vintage of each particular law? If a law
has not changed since the trooper was hired, their task-specific and general experience measures
are the same. When a law changes, the amount of task-specific experience a trooper has with that
law falls back to one, but their general experience continues to increase.14
We have a total of 536,690 trooper/law/semester observations in our final data set. On
average, each trooper uses a given law 0.596 times a semester, or just over one time per year.
Not surprisingly, the distribution is highly skewed with speeding laws in particular being “used”
frequently by a handful of troopers. Just over 14% of enforced laws will change in the future,
14 This is equivalent to τ dropping to one in the model.

17
and in 14% of our observations, troopers are enforcing a law that has substantively changed since
they started the job. On average, troopers have 7.25 years of experience with the ISP, but 6 years
of experience with a given law in its current form.
The overall distribution of general experience is bimodal - there are essentially two groups of
troopers; “senior” troopers with over 10 years of experience and are unlikely to acquire new
positions in the ISP, and “junior” troopers, who may be promoted to higher ranks within the ISP
during the course of their career. The difference between general experience and task-experience
is larger for older officers than for junior officers; on average we observe senior officers with 13
years of job experience and 10 years of task experience, and junior officers with 4.5 and 4 years,
respectively. As it is highly plausible that heterogeneity in unobserved characteristics across
these two types of troopers will affect their productivity and response to law changes, so in
addition to pooled specifications we will present results for these groups separately.
In Figure 1, we plot the average number of times a junior trooper uses a given law against
their experience as a trooper and against their experience with a given law.15 For the first two
years on the force, troopers issue more tickets each semester they are employed. After the end of
the second year, the number of tickets issued by each trooper slowly declines and a trooper with
10 years of experience uses each law about 30% less frequently than a second-year trooper.
While ticket issuing is not the only thing that troopers do, this concave growth in “output” is
strikingly similar to the pattern of output of auto-glass manufacturers (Shaw and Lazear 2008),
and wages of Danish workers (Bagger et al. 2014).
The cause of the decline in ticketing over time is plausibly attributed to a combination of two
factors. First, it is possible that the most highly “active” or skilled troopers are promoted to
15 For ease of comparison, we focus just on junior troopers, who we observe with similar levels of general and task-specific experience that can be easily plotted on the same axis.

18
higher non-trooper ranks, which is a common selection problem in work on experience and
performance; the number of troopers with more than 14 semesters of experience is only 11% of
the number of troopers with less than 14 semesters of experience.16 Second, as troopers gain
general experience, they are increasingly likely to be enforcing laws that have changed since
they were hired - meaning that their average task-specific experience is actually declining
relative to their general experience as general experience grows.
Plotting the average number of tickets issued by officers as task-specific experience increases
can shed light on these two productivity reducing mechanisms. If we only observed less active
troopers at high levels of task-specific experience, then we would see a similar decline in
ticketing as task-specific experience increases. However, if the relationship between general
experience and output fell because task-specific experience was falling, the task-output curve
should be flatter- and this is what we observe. Compared to the impact of general experience, the
number of times that a trooper uses a law hardly declines as task-specific experience increases,
implying that the reduction in output seen in the general experience measure is more likely to be
the result of more junior troopers responding to legal changes, as opposed to compositional
change in the quality of officers.
In Figures 2 and 3, we focus our attention on tickets issued for laws in the semesters leading
up to, and following, any 2002-2009 changes in the Idaho State Statute. We divide our sample
into junior (Figure 2) and senior (Figure 3) troopers. Comparing across figures, senior troopers
issue roughly 20% fewer tickets than junior troopers in the six semesters leading up to a law
change, likely a combination of both selection and variation in work conditions, although 95%
16 Alternatively, reputational concerns could matter for both younger and older officers. For example, younger officers could fear developing a reputation for improperly issuing citations or older officers might have already established a reputation of being tough on crime.

19
confidence intervals around the means do overlap. In each figure, semester to semester variation
in how frequently junior and senior officers issue citations for laws that will/will not change
roughly mirror each other, which is a necessary assumption for our difference- in-differences
approach. In fact, prior to the laws changing, junior officers in particular appear to issue tickets
for changing laws at similar rates as other laws (indicated by the shaded area). Senior officers
seem to systematically issue fewer tickers for laws that are rewritten by the state legislature,
which could reflect senior troopers being able to anticipate legislative changes roughly two years
before they happen, or it could reflect senior troopers being assigned to work in areas or times
where they are less likely to encounter people violating the types of laws that are rewritten.
In both figures, the first semester that a new version of a law goes into effect, there is a small
increase in the number of citations issued. This is consistent with troopers receiving additional
training or notification about the law, per Idaho regulations, and potentially noticing more people
potentially violating those statutes. However, in the year after the change, there is a sharp
reduction in the frequency with which troopers at both points in their careers use the “new” laws.
Over time, we observe that the number of times troopers use the “new” laws slowly converges
back towards the rate at which these same troopers are issuing tickets for other violations.
6. Analysis and Results
Based on Figure 1 it appears that, on average, troopers experience a steep “learning curve”
during the first two years of their career, and the average number of tickets is roughly stable
afterward, although it does decline over time. This decline is potentially driven by changes in the
tasks they must perform. When we look at the response of troopers to changes in their tasks, we
also see a clear learning curve overall, where tickets increase for a year but then level off quickly
and do not appear to decline over time. Figures 2 and 3 suggest that legal changes are reasonably

20
unanticipated, particularly for junior troopers, as there is no clear trend in the use of a particular
law in the semesters leading up to a change that we do not also see in the frequency with which
troopers use other laws.
Our baseline specification allows for general- and task-specific human capital to make
separate contributions to trooper i's use of law v in semester t as follows:
𝑇𝑇𝑇𝑇𝑇𝑇𝑇𝑇𝑇𝑇𝑇𝑇𝑇𝑇𝑖𝑖𝑖𝑖𝑖𝑖 =∝𝑖𝑖+ 𝑦𝑦𝑖𝑖 + 𝑇𝑇𝑖𝑖 + 𝛿𝛿𝑖𝑖𝑣𝑣 + 𝑇𝑇𝑇𝑇𝑇𝑇𝑇𝑇𝑇𝑇𝑇𝑇𝑖𝑖𝑖𝑖𝛽𝛽𝐺𝐺 + 𝐿𝐿𝐿𝐿𝐿𝐿𝑇𝑇𝑇𝑇𝑇𝑇𝑇𝑇𝑇𝑇𝑇𝑇𝑖𝑖𝑖𝑖𝑖𝑖𝛽𝛽𝑣𝑣𝐺𝐺 + 𝑋𝑋𝑖𝑖𝑖𝑖𝜃𝜃+ 𝜀𝜀𝑖𝑖𝑖𝑖𝑖𝑖
where Tenureit is the number of semesters that trooper i has worked for the ISP in semester t, and
LawTenureitv is the number of semesters that this same trooper has used the version of law v that
is in effect in semester t. If a law has not changed since the trooper was hired, both of these
variables are exactly the same. However, when a law is revised, the trooper will have less
experience enforcing that particular law than he has as a trooper more generally. Our trooper
fixed effects, αi, mean that we are looking at changes in the productivity of each individual
trooper over time, our season fixed effects st allow us to capture any behavior that is specific to
the beginning versus end of each year, with each year also getting’s its own fixed effect yt. We
also include a matrix 𝑋𝑋𝑖𝑖𝑖𝑖 of annual demographic characteristics of the Idaho region where trooper
i is assigned, specifically the natural log of the population, the fraction of the population that is
male and between 18 and 24, and the natural log of vehicle crashes.
We also include a “statute vintage” fixed effect, δvT, that identify each version of each law in
the Idaho State Statute. These statute vintage effects net out any behavioral change on the part of
Idaho citizens that should influence the number of tickets issued by all troopers for as long as
that version of the law is in effect. For example, one might expect that increasing the penalty
associated with drunk driving might deter some citizens from driving drunk. Similarly, if the
highway speed limit is lowered in business districts, then we might expect more speeding tickets

21
to be issued.17 Our identification of general- and task-specific human capital is based on the
assumption that, under equal application of the law, these first order effects of the law change
should create changes in ticketing that are common to all state troopers, and do not vary over the
pre- and post- periods around a legal change. We identify βTG off of variation in the range of
task-specific experience that troopers with different amounts of general experience have across
the 286 different laws they can enforce. When trooper i is hired, both Tenureit and LawTenureitv
are equal to one for all laws v, and as each semester t passes, all measures increase by 1. What
separately identifies βG and βTG are the passage of amendments to Idaho state law, at which point
LawTenureitv is reset back to 1 for that specific law, for all troopers. Because our identification is
based on variation within laws and within troopers, we will allow for arbitrary correlation in εivt
within laws and officers using the two-way clustering approach as described in Cameron et al.
(2011).18 In addition, since the low base citation rate may lead to unusual distributions of εivt, we
also present p-values based on 1000 permutation tests, where we “shuffle” the values of general
or task-specific experience within each trooper, and compare our point estimates to this
distribution of hypothetical effect sizes.
As shown in Table 2, we find that, on average, a trooper issues approximately 0.01 more
tickets per citation with each additional semester of experience, a total of 2.86 tickets overall.
This result is robust to the inclusion of separate trooper and law fixed effects (column 1) and law
by vintage fixed effects (column 2). The first order average impact of additional experience on
ticketing increases once we include trooper by law fixed effects (column 3), which allows each
trooper to, on average, issue a different number of tickets for each law. This suggests that not
17Troopers enforce both traffic and criminal law. In results, available on request, we find no difference in the responses of troopers to criminal versus traffic statutes. 18 Standard errors calculated in this way are only marginally different than conventional standard errors which assume independence across either of those two dimensions.

22
only do more experienced troopers issue more tickets, but that the types of laws that troopers
“use” varies with experience.
In columns 4 and 5 of Table 2, we separately identify the impact of general and task-specific
experience. First, we use all troopers and law by vintage fixed effects (column 4), which includes
changes that occurred prior to 2002, to identify the relationship between task-specific experience
and output, estimating that on average one additional semester of general experience increases
tickets by 0.01, although our permutation tests suggest this is not a statistically anomalous result
(p=0.597). One additional semester increase in experience with a specific vintage of a law leads
to a 0.004 decrease in its use, although this effect is imprecisely estimated, and 5.7% of our
falsified estimates are larger in magnitude.
Averaging across all state troopers, separately identifying general and task-specific
experience is muddied by simultaneous changes in the frequency with which older troopers
enforce a given law and changes in the types of laws that more junior and more senior troopers
enforce. When we include trooper by law fixed effects in our analysis (column 5), our estimates
now reflect how troopers choose to differentially enforce changing laws, holding each officer’s
propensity to use any particular law fixed. In practice, our task-specific experience effects are
now identified entirely off of the 62 legal changes that occurred during our sample period, as
opposed to laws that changed prior to our sample period but after an older trooper was hired.
When we include these effects, we find that a one semester increase in the amount of experience
that a trooper in general is associated with 0.0097 more tickets (2.77 more tickets overall), and
an additional semester of experience with a given law is associated with a 0.004 increase in the
number of times that particular law is used. Both our standard error estimates and permutation
tests imply that these results are statistically significant at conventional levels. Overall, when a

23
law changes and task-specific experience falls for that law relative to others, troopers become
less likely to enforce it on average, consistent with troopers facing a higher expected cost of
ticketing someone for a violation they are less familiar with.
In Table 3 we differentiate between three different types of law changes - changes that
increased the number of things that are illegal (lowering Rv), decreased the number of things that
are illegal (raising Rv), and changes that increased the statutory penalty for a violation (increasing
Cv). For conceptual simplicity, we initially only consider laws that either do not change, or
changed exactly once, so we are able to compare the response of troopers to one type of task
change. The relationship between general experience and productivity remains qualitatively
similar across these samples, as a one semester increase in general experience increases
productivity by roughly 0.005 to 0.01, or 1.4 to 2.9 additional tickets each semester.
Separating the data by type of law change provides suggestive evidence that law changes that
make previously legal actions illegal or increase the penalties for law violation have the biggest
impact of trooper behavior- changing these types of laws will reduce the number of tickets a
trooper issues by 0.0014 to 0.00186 tickets per semesters of officer experience. Recall that this
is over and above the expected reduction in ticketing we would observe if citizens were deterred
by a harsher law, and (in magnitude, although not in precision) we find essentially no change
when laws make fewer actions illegal.
As previously discussed, all troopers are simultaneously reminded about the particulars of a
law and each must readjust their use of the law after a legal change, but the magnitude of that
reduction in experience varies across officers with different levels of tenure. While this allows
for simultaneous estimation of trooper and citizen response to the law changes, it does mean that
differential attrition from our sample, due to the promotion or dismissal of troopers with different

24
propensities to issue tickets, will influence our estimates- we observe the largest reductions in
task-specific experience for troopers with the most general experience.19
In Table 4, we provide a sense of the importance of attrition on our estimates this by allowing
for heterogeneity in the impact of a law change on productivity in two ways. First (column 1),
we simply include a continuous interaction between general and task-specific experience,
allowing younger troopers to respond differently than older troopers. In this specification, we
find that the first order effects of both general and task-specific are positive and statistically
significant, consistent with the existing literature on experience and productivity. The coefficient
on the interaction between the two experience measures is negative and significantly different
from zero, suggesting that as troopers become more experienced generally, their productivity is
less dependent on their experience with the particulars of a given law. This is also consistent
with our basic theoretical formulation of general and task-specific experience, in which changes
in the threshold of culpability increase the likelihood that a trooper issues a costly mistaken
ticket. When we include trooper-by-law fixed effects (column 2) the interaction terms remain the
same size, confirming that trooper productivity is less affected by their experience with the
current vintage of a law as the trooper gains general experience. To put the estimates in context,
the marginal impact of one additional semester enforcing a particular law for a trooper with one
year of experience is 0.0137 tickets per semester enforcing that law. A trooper with two years of
experience will issue 0.0121 additional tickets for each semester of specific experience that they
have with each Idaho statute - an 11.7% reduction in the return to task-specific experience.
While not necessarily eliminated, for small differences in experience (e.g. two semesters
difference) there will be less problematic attrition, simply because we are looking at small
19 Idaho troopers can be promoted at any point in the year, whenever a vacancy becomes available.

25
changes where there is not that much time to be fired or promoted. However, for larger
differences in tenure, e.g. nine years difference, the assumption that underlying unobserved
productivity determinates are roughly similar across experience groups is even less likely to be
true.20 In the remaining columns of Table 4, we divide our sample into “junior” and “senior”
troopers, based on whether or not we observe this trooper with more than 10 years of general
experience. Within these two samples, the range of values of general experience is lower, thus
focusing more of the identification on changes in individual ticketing, rather than changes in who
is issuing tickets at different points in the distribution of experience.
Columns 3 - 6 of table 4 only look at junior troopers. We find that task-specific experience is
very important for this group, and that the importance of general experience in determining
output is driven by heterogeneity in the types of laws that troopers with different levels of
experience enforce (e.g. whether or not trooper by law fixed effects are included). When we
allow for heterogeneity in the impact of task-specific experience with respect to general
experience (columns 5 and 6), we find that the first order effect of both types of experience is
positive, but from a standpoint of statistical significance, general experience primarily influences
ticketing by reducing the marginal effect of task-specific experience on output.
We observe a somewhat different pattern when we focus on older troopers. Senior troopers
also issue more tickets as they continue to gain general experience; a 1 semester increase in
general experience is associated with 0.02 more citations. The smaller increase in productivity
(comparing, for example, columns 5 and 6 to 9 and 10) by senior troopers could be the result of
20 In Appendix Figure 1 we display a kernel density plot of the junior and senior fixed effects estimates that correspond with column 4 of Table 2. We conducted a Kolmogorov-Smirnov test of the equality of the distribution of fixed effects estimates, which yielded a maximum distance of 0.4483 and p-value of 0.00. Thus, we can reject the null hypothesis that the distributions of fixed effect estimates are identical across junior and senior officers.

26
older workers choosing to alter their work environment in a way that requires less “output,”
particularly if they are able to work in areas where fewer tickets need to be issued, like state fairs
or weekday afternoon shifts.21 When laws change, senior officers appear to increase their use of
the law, albeit by a small amount. Additionally, as senior officers continue gaining more
experience we find that their response to the law change also falls in magnitude, but this effect is
not precisely estimated.
When we focus on different types of law changes, it is clear that junior troopers are driving
the positive relationship between task-specific experience and productivity. As seen in Table 5,
each semester of experience increases ticketing by junior troopers by twice as much as it
increases for senior troopers. The positive coefficient associated with task-specific experience
implies that when laws change, junior troopers become significantly less likely to use those laws.
However, as junior troopers gain general experience, that negative response to enforcing a new
law diminishes by about 10% for each semester of tenure. Unlike when we pooled all officers
(table 3), the magnitude of the response to legal changes is roughly the same, regardless of the
direction of the law change, which limits the scope for citizen, rather than trooper, behavior
impacting the observed change in ticketing. The increased stability in the estimated relationship
between experience and output is further evidence that the types of laws troopers enforce
changes as they mature.
More experienced senior troopers issue more tickets on average, but the impact of task-
specific experience on productivity is negative, implying that when laws change senior troopers
increase their use of that law- potentially implying that the law changes are drawing senior
officer’s attention to the changing laws. The interaction effect between general and task-specific
21 This is likely to be the case if, for example, shift assignments are allocated on the basis of seniority.

27
experience for senior officers is positive, implying that as senior officers obtain more experience
as a trooper, they are less (negatively) responsive to law changes. Columns 3, 6 and 9 differ from
columns 2, 5, and 8 in that they include data on laws that change more than once during our
sample period. Doing so yields more precise estimates with slightly smaller point estimates, but
the sign of our main results remain the same.
7. Robustness Tests
7.1 Newly Hired Officers (“Rookies”) only.
As in previous research on experience and output, we find that the greatest growth in
productivity occurs in the first few years of employment, and in the first few years of experience
with a particular task. While our baseline specification includes officer fixed effects, the early
years of general experience are identified off of a different group of officers than the early years
of task-specific experience. This means that there is some scope for heterogeneity across
individuals to be driving the observed heterogeneity in the impact of task-specific experience on
output.
In order to address this concern, in Table 6 we report results for only officers who are hired
during our sample period (meaning we observe them for at most eight years), enforcing common
support across all possible values of general and task-specific experience. There are fewer
observations in this sample, but the estimated increase in output with experience in this group is
consistent with our previous results for junior troopers. If we ignore the role of task-specific
experience (column 1), a one semester increase in general experience is associated with a
roughly 0.03 citation increase per law for each trooper, and general experience appears to be an
order of magnitude more important than task-specific experience if we separately identify the
two (column 2). When we include controls for differences in the types of laws that different

28
troopers enforce, experience with each task become much more important (column 3). Allowing
for heterogeneity in the impact of task-specific experience with respect to general experience
(column 4), and simultaneously allowing for time invariant variation in the propensity of each
officer to use each law (column 5), suggests that the primary way that general experience
impacts output is through its moderating effect on task-specific experience.
7.2 Modeling Infrequent Events
Despite limiting our sample to laws that are used at least 10 times, the likelihood that a
trooper issues a citation in a six month period is low; in 93% of our observations the number of
citations issued is zero. This mass point at zero makes interpretation of our estimated marginal
effects potentially misleading. We examine the sensitivity of our results to modeling assumptions
about this low probability event in two ways. First, we replace our measure of the number of
citations issued with a simple binary variable equal to one if the officer issues any ticket for this
statute, and zero otherwise, transforming our basic equation into a linear probability model.
Second, we limit our sample only to the 71 laws that are used 200 times or more over the course
of our time frame. Of these laws, 30 are rewritten by the state legislature at some point after a
trooper in our sample is hired, similar to the overall fraction of laws that change in our full
sample.22 In this sample, 24% of our observations are non-zero.
In Table 7, we replicate Table 4 with these two modifications. Panel A presents our linear
probability estimates. Regardless of whether or not we control for variation across officers in the
types of laws that they use, on average, a one semester increase in general experience is
associated with 0.0014 more citations being issued for any law, and officers issue approximately
0.002 more citations per semester for laws that they have enforced “as is” for one more semester.
22 This further speaks to the exogeneity of the shocks to task-specific experience in our sample, as the probability that a law changes does not appear to be correlated with the frequency with which it is used.
29
Each additional semester increase in general experience increases this task-specific experience
effect by almost no citations. Dividing the sample into junior and senior troopers reveals roughly
the same relationship between general and task-specific experience that we observed in Table 4.
In panel B of Table 7, we limit our sample to laws that are used at least 200 times. The mean
of our dependent variable is roughly four times larger than in the full sample, and our point
estimates are all between 10 and 70 times larger in magnitude, and always the same sign as our
estimates in the full sample. This indicates that the observed effects in Table 4 are driven by
issuing tickets for common offenses, where troopers actually do gain experience issuing over
time, in a real sense.23
7.3 Changes in “Similar Laws”
Could legal changes to a specific law be “spilling over” to laws that are similar to the
changing law, but did not change themselves? For example, if a law change reduces the speed
limit within city limits, it might be the case that this draws officer’s attention to speeding in
general, resulting in the officer enforcing all speeding limits with more rigor than they did prior
to the change in the law.
To test for this possibility, we grouped laws by their “proximity” within the Idaho Statutes.
Specifically, laws were placed into the same group if the first five or six digits of the statute were
identical. This resulted in 179 groupings of the laws in our data, and we defined an officer’s task-
specific experience with each group of laws as the minimum amount of task-specific experience
for that group, so that the mean level of general experience that each officer has is 13.5
semesters, and the mean level of task-specific experience with each law group is 11.7 semesters.
23 We have also replicated these results with a set of laws that are used 1000 times or more, where 42% of our observations have a non-zero dependent variable, and observe the same pattern.
30
We then added up all tickets issued for all laws that fell into each of these groups for each officer
within a semester, and re-analyzed the specification in Table 4 at the group level.
The estimated relationships between general experience and ticketing are similar across
specifications to those reported in Table 4. Increases in task-specific experience also lead to
increases in the use of a specific law for junior officers and continue to display decreases in the
use of the law for senior officers. Finally, the interaction between general and task-specific
experience is negative for all officers, indicating that with more general experience, changes in
laws have less of an impact on their willingness to utilize laws that fall within this group.
The magnitudes of the estimates in this group sample do imply some positive spillover
effects of law changes; for example, when we focus on junior troopers, and allow for differences
across officers in their use of different laws and for general experience to affect the important of
task-specific experience (column 6), we estimate that one semester of general experience
increases ticketing by 0.059 tickets (versus 0.035 in table 4), and an additional semester of task-
specific experience increases tickets by 0.12 per group, minus 0.009 tickets for each semester of
general experience (versus a 0.077 – 0.0059 x general experience effect in table 4). Rather than
shifting their ticketing behavior from a changing law to a similar one that stayed constant, the
data are more consistent with a world in which troopers know that, for example, the legislature
has changed a law about drunk driving (i.e. that 18 8004 changed, rather than 18 8004(1)A
changed specifically). In response to this change, troopers temporarily issue fewer tickets for all
laws that may have changed.
7.4 Non Parametric analysis of Experience and Output
Our estimates of the relationship between general and task-specific experience have imposed
a linear, multiplicative, interactive effect between the two types of human capital. In order to

31
verify that the data, rather than our choice of functional form, is driving our finding that troopers
with more experience are less responsive to shifts in law, we replaced our continuous measures
of Tenureit and LawTenureitv with 386 dummy variables, DG,GT. Each of these dummies represent
a unique general (G) (ranging from 1 to 28 years) and task-specific (T) years (which can also
range from 1 to 28 years, but is always less than or equal to G) pair; e.g. three years of
experience as a trooper (G=3) and one year of experience with this vintage of the law (T=1).24
We exclude the dummy variable for a trooper’s first year of job and task-specific experience, and
so each estimated experience coefficient is simply the difference in the mean number of tickets
issued by troopers in each possible experience pair relative to a trooper’s first year on the job,
conditional on time, statute vintage, and officer fixed effects, as well as the coefficient matrix Xit,
as specified below:
𝑇𝑇𝑇𝑇𝑇𝑇𝑇𝑇𝑇𝑇𝑇𝑇𝑇𝑇𝑖𝑖𝑖𝑖𝑖𝑖 = ∝𝑖𝑖+ 𝑦𝑦𝑖𝑖 + 𝑇𝑇𝑖𝑖 + 𝛿𝛿𝑖𝑖𝑣𝑣 ∑ ∑ (𝑇𝑇𝑇𝑇𝑇𝑇𝑇𝑇𝑇𝑇𝑇𝑇𝑖𝑖𝑖𝑖 = 𝐺𝐺,𝑣𝑣≤𝐺𝐺 𝐿𝐿𝐿𝐿𝐿𝐿𝑇𝑇𝑇𝑇𝑇𝑇𝑇𝑇𝑇𝑇𝑇𝑇𝑖𝑖𝑖𝑖𝑖𝑖 = 𝑇𝑇)𝛽𝛽𝑣𝑣𝐺𝐺𝐺𝐺 + 𝑋𝑋𝑖𝑖𝑖𝑖𝜃𝜃+ 𝜀𝜀𝑖𝑖𝑖𝑖𝑖𝑖.
In order to summarize this gradient, we estimated a series of 27 regressions, one for each
possible year of experience as a trooper, of the following form:
𝛽𝛽𝑣𝑣𝐺𝐺 = 𝛼𝛼 + 𝑇𝑇𝜃𝜃𝐺𝐺 + 𝜀𝜀𝑣𝑣 ,∀𝐺𝐺 ∈ (2,28)
Here, T is simply a count variable that ranges from 1 (denoting the first year of experience
enforcing a law) to G. Note that there are, at most, 27 observations per regression, as troopers
can only have up to G years of experience with a particular law, and since each value of 𝛽𝛽𝑣𝑣𝐺𝐺 is an
average over groups of varying size, we weight each observation to reflect this. The 27 estimated
values of θi represent the average “task-specific experience gradient” for troopers at each level of
general experience. In Figure 4, we plot each estimated value of θi against the corresponding
24 We use years, rather than semesters, for tractability. We also exclude 19 general and task-specific experience pairs for which we have no observations, all of which involve general and task-specific experience values of over 20 years.

32
years of general experience. We also include a fitted regression line, also weighted by the total
number of officer- law-semesters that identified each estimate of θi. The data clearly indicate that
the “task-specific experience gradient” falls as general experience increases, confirming our
parametric analysis. The estimated slope of the regression line relating general experience to the
average effect of task-specific experience on output is -0.004, with a robust standard error of
0.001. In other words, each year of general experience reduces the return to task-specific
experience by 0.004 citations.
7.5 Day vs. Night Time Analysis
While junior and senior troopers are not assigned to significantly different locations25, it
could be the case that specific officers are assigned different shifts. For example, one could
imagine that working the night shift is a less desirable assignment than working the day shift.
Moreover, if seniority dictates which shift an officer works, then we might expect to see more
senior officers working day shifts. As laws change it is likely easier to enforce laws during day
time hours - see Grogger and Ridegway (2006) and Horace and Rohlin (2015). In order to test
this hypothesis, we replicated tables 2 – 7 twice, once examining only citations issued between 5
am and 9 pm, and once examining only citations issued between 9 pm and 5 am. These results
are presented in Appendix B.
By separating our data into day and night time citations, we find a few interesting insights.
First, the results are qualitatively identical to the results that have already been reported.
Citations during day time hours are approximately 3 times more likely to be issued across all
officers than night-time citations. The positive coefficient on general experience becomes a bit
less significant, however, for more commonly enforced laws at night. Specifically, junior officers
25 A comparison of the distribution of junior and senior officers fails to reject the hypothesis that these officers are assigned to the same locations.

33
enforcing laws that have been used more than 200 times experience a slow-down in productivity
during night time hours. Since laws that are issued more than 200 times are most likely traffic
related citations, this could be a product of changes in citizen behavior (e.g. not driving as
quickly during night time hours).
8. Conclusion
More experienced workers are, for the most part, more productive workers, and we present
evidence that the frequency with which a law enforcement officer accuses citizens of law
violations is a function of that officer’s experience. During their first years on the job, troopers
appear to gain productivity as they gain experience; the steep early learning curve that we
observe is very similar to the tenure-productivity relationship observed in manufacturing and
education. In addition to building on a growing literature in labor economics, the relationship
between tenure and output among law enforcement troopers is of particular relevance for
empirical law and economics, as enforcement of criminal law is typically assumed to be
independent of officer experience. To the best of our knowledge, this is the first study to
explicitly identify a source of within- and across- trooper variation in law enforcement.
Based on our analysis of Idaho state troopers, we conclude that as troopers gain general
experience, the importance of task-specific experience in determining output declines. This
pattern is evident for both junior and senior troopers, although on average older troopers actually
issue more tickets for the laws they have less specific experience with. We do not find much
evidence that there is an asymmetric response to law changes, in the sense that, once we allow
for variation in the types of laws different troopers enforce, law changes that decrease the scope
of the law appear to reduce tickets as much as changes which increase the number of actions that

34
are illegal. Legislative changes that increase the recommended penalties also temporarily reduce
trooper enforcement.
The reduction in citations when laws change has significant economic impact. Specifically,
when the legislature changes laws, approximately 0.047 fewer citations are issued by each junior
trooper in the following semester. To offer perspective on the impact of these legal changes, we
separately focus on traffic citations and felony arrests. During our sample, the Idaho State Police
enforced traffic laws 67 percent of time, felony and misdemeanor offenses not related to traffic
laws 12 percent of the time, while the remaining offenses were for administrative infractions
(e.g. fishing and hunting licenses). Focusing only on traffic related laws that changed between
2004 and 2009, we estimate that this resulted in 1,944 fewer traffic related citations than would
have been issued if ticketing had been independent of task-specific experience. Using estimates
of the effect of trooper presence on roadway safety from DeAngelo and Hansen (2014), this
reduction in traffic citations implies an estimated 0.85 percent increase in fatalities during our
sample. Focusing on changes in misdemeanor and felony charges and utilizing the estimates in
Mas (2006), the reduction in citations associated with legal changes results in a 0.82 percent
increase in crimes in the ISP’s jurisdiction.26 Thus, the transitory impacts of new legal changes
are not without cost.
In most countries, policies are written by legislatures, but enforced by government agents
who have different incentives, and so in practice policy changes may not be implemented
26 These numbers are calculated using estimates from column 6 of Table 4. Given that the impact of legal changes are significant and negative for junior officers, we focus on the reduction in ticket issuances from officers with 6 or fewer semesters. First, we calculated the counterfactual average number of citations for traffic citations and felony/misdemeanor laws separately. We then subtracted the counterfactual from the actual number of citations issued when the law changes and summed this difference for officers with 6 or fewer semesters of experience, which is 5,864 for traffic citations and 662 for felony/misdemeanor citations. The aggregated average of citations issued for all levels of experience is 343,296 traffic and 37,094 misdemeanor/felony citations, implying a 0.017 and 0.018 percent reduction for traffic and felony/misdemeanor laws, respectively.

35
uniformly. While persistent judicial discretion in the face of legal changes has been well
documented, to the best of our knowledge, we present some of the first evidence of systematic
patterns in the way police officers choose to enforce changes in legislation. We find that
predictable and easily quantifiable individual differences matter; police officers are less likely to
enforce laws they are less familiar with, regardless of whether the law has become more or less
punitive. Data on the identity or experience of police officers are rarely collected as part of
publicly available data sources, suggesting an important gap in our knowledge about the
administration of criminal justice systems.

36
References Abowd, John M. and Francis Kramarz, 1999. “The analysis of labor markets using matched
employer-employee data,” In [Eds] Orley C. Ashenfelter and David Card, Handbook of
Labor Economics, Volume 3 New York: Elsevier: 2629-2710.
Abowd, John M, John Haltiwanger, and Julia Lane. 2004. “Integrated Longitudinal Employer-
Employee Data for the United States” The American Economic Review Papers and
Proceedings 94(2):224-229.
Antonovics, Kate and Brian G Knight, 2009. "A New Look at Racial Profiling: Evidence from
the Boston Police Department," The Review of Economics and Statistics, 91(1):163-177.
Bagger, Jesper, Francois Fontaine, Fabien Postel-Vinay, and Jean-Marc Robin. 2014. “Tenure,
Experience, Human Capital and Wages: A Tractable Equilibrium Search Model of Wage
Dynamics” American Economic Review 104(6):1551-1596.
Bates, Lyndel, David Soole, and Barry Watson. 2012. “The effectiveness of traffic policing in
reducing car crashes”. In T. Prenzler [Ed], Policing and security in practice: Challenges and
Achievements New York: Palgrave Macmillan: 90-109.
Bushway, Shawn, Emily G. Owens, and Anne M. Piehl, 2012. “Sentencing Guidelines and
Judicial Discretion: Quasi-Experimental Evidence from Human Calculation Errors,” Journal
of Empirical Legal Studies 9(2):291-319.
Commission on Accreditation for Law Enforcement Agencies. 2003. “Measuring the
Performance of Law Enforcement Agencies – Part 1 of a 2-Part article,” CALEA Update
Magazine 83.
Cameron, A. Colin, Jonah B. Gelbach, and Douglass L. Miller. 2011. “Robust Inference with
Multiway Clustering,” Journal of Business and Economic Statistics. 29(2):238-249.

37
Clement, Michael B., Lisa Koonce, and Thomas J. Lopez, 2007. “The roles of task-specific
forecasting experience and innate ability in understanding analyst forecasting performance,”
Journal of Accounting and Economics, 44(3):378–398.
Cook, Jason B. and Richard K. Mansfield. 2014. “Task-Specific Experience and Task-Specific
Talent: Decomposing the Productivity of High School Teachers” Cornell University ILR
School working paper.
Danziger, Shai, Jonathan Levav, and Liora Avnaim-Pesso, 2012. “Extraneous Factors in Judicial
Decisions,” Proceedings of the National Academy of Sciences of the United States of
America, 108(17):1-4.
DeAngelo, Gregory and Benjamin Hansen. 2014. “Life and Death in the Fast Lane: Police
Enforcement and Traffic Fatalities,” American Economic Journal: Economic Policy,
6(2):231-257.
DeAngelo, Gregory and Bryan McCannon, 2015. “Public Outcry and Police Behavior,” BE
Journal of Economic Analysis and Policy, forthcoming.
DeAngelo, Gregory, Kaj Gittings, and Amanda Ross, 2015. “Police Bias in the Enforcement of
Drug Crimes: Evidence from Low Priority Laws,” Working Paper.
Donohue, John J. and Steven D. Levitt. 2001. “The Impact of Race on Policing and Arrests”
Journal of Law and Economics 44(2):367-394.
Dynarski, Susan, Joshua Hyman and Diane Schanzenbach. 2013. “Experimental Evidence on the
Effect of Childhood Investments on Postsecondary Attainment and Degree Completion,”
Journal of Policy Analysis and Management 32(4):692-717.
Gathmann, Christine and Uta Schonberg, 2010, “How General is Human Capital? A Task-Based
Approach,” Journal of Labor Economics, 28(1):1-50.

38
Gibbons, Robert and Michael Waldman, 2004. “Task-Specific Human Capital” American
Economic Review, 94(2):203-207.
Grogger, Jeffrey and Greg Ridgeway, 2006. “Testing for Racial Profiling in Traffic Stops from
Behind a Veil of Darkness” Journal of the American Statistical Association, 101(475): 878-
887.
Horrace, William and Shawn Rohlin, 2015. “How Dark is Dark? Bright Lights, Big City, Racial
Profiling” Review of Economics and Statistics, forthcoming.
Jackson, Kirabo C. 2013. “Teacher Quality at the High-School Level: The Importance of
Accounting for Tracks” NBER working paper 17722.
Leaver, Clare, 2009. "Bureaucratic Minimal Squawk Behavior: Theory and Evidence from
Regulatory Agencies." American Economic Review, 99(3): 572-607.
Makowsky, Michael D. and Thomas Stratmann, 2009. “Determinants of Traffic Tickets: Political
Economy at Any Speed,” American Economic Review, 99(1):509-527.
Mas, Alexandre. 2006. “Pay, Reference Points, and Police Performance,” Quarterly Journal of
Economics, 121(3):783-821.
Mincer, Jacob. 1958. “Investment in human capital and personal income distribution” Journal of
Political Economy 66(4):281-302.
Neal, Derek. 1995. “Industry-Specific Human Capital: Evidence from Displaced Workers”
Journal of Labor Economics 13(4):653-677.
Ost, Ben, 2014. “How do Teachers Improve? The Relative Importance of General and Specific
Human Capital," American Economic Journal – Applied Economics 6(2):127-151.
Sanga, Sarath. 2012. “Does Officer Race Matter?” American Law and Economics Review
16(2):403-432.

39
Shaw, Kathryn and Edward P. Lazear, 2008. "Tenure and output," Labour Economics,
15(4):704-723.
Schanzenbach, Max and Emerson Tiller, 2008. “Reviewing the Sentencing Guidelines: Judicial
Politics, Empirical Evidence, and Reform,” University of Chicago Law Review 75(2):715-
760.
Topel, Robert H., 1991, “Specific Capital, Mobility, and Wages: Wages Rise with Job Seniority”
Journal of Political Economy 99:145-176.
United States Department of Justice, Bureau of Justice Statistics, 2007. Law Enforcement
Management and Administrative Statistics (LEMAS). Ann Arbor, MI: Inter-university
Consortium for Political and Social Research. doi:10.3886/ICPSR31161.v1
Walker, Samuel, 2003. “Early intervention systems for law enforcement agencies: A planning
and management guide,” Washington, D.C.:U.S. Dept. of Justice.
Weitzer, Ronald and Steven A. Tuch, 2004. “Public Opinion on Reforms in Policing,” The
Police Chief Magazine, 71(12).
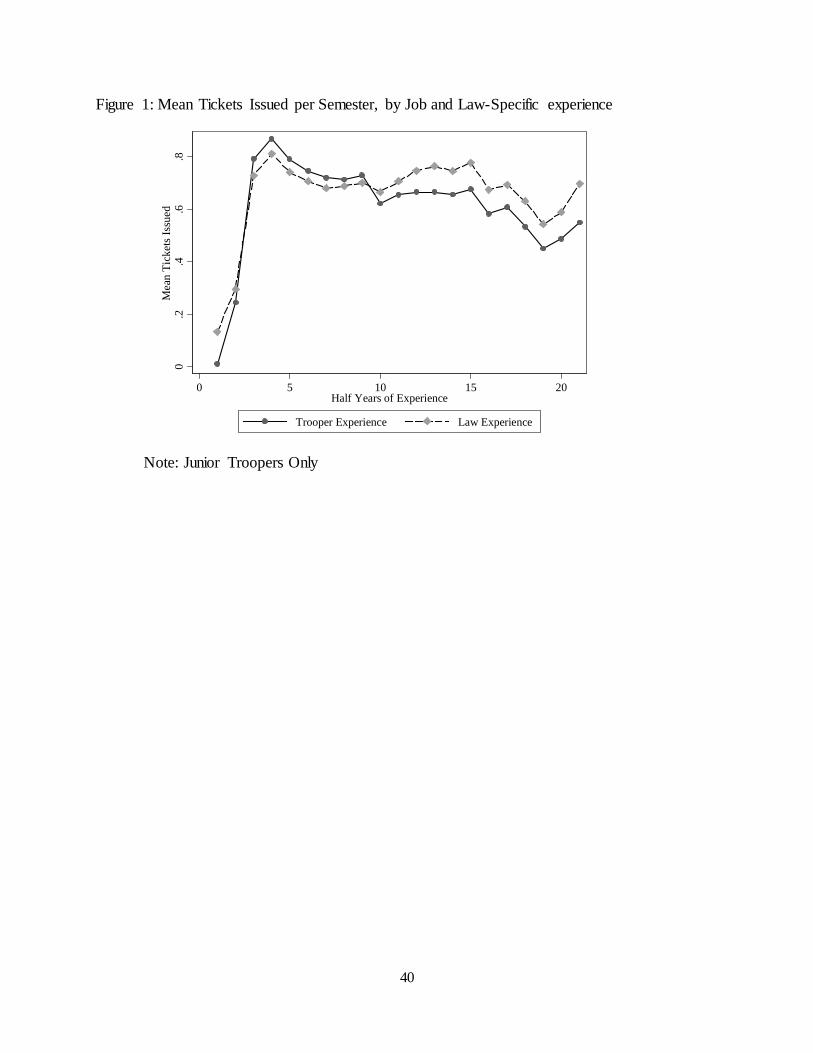
40
Figure 1: Mean Tickets Issued per Semester, by Job and Law-Specific experience
Note: Junior Troopers Only
0.2
.4.6
.8M
ean
Tick
ets I
ssue
d
0 5 10 15 20Half Years of Experience
Trooper Experience Law Experience

41
Figure 2: Mean Tickets Issued around Law Change, Junior Troopers
Note: Dashed lines indicate 95% confidence intervals around means. Shaded area represents 95% confidence interval for citations for non-changing laws, weighted to represent similar time periods, for junior troopers
.1.2
.3.4
.5M
ean
Tick
ets I
ssue
d
-5 0 5Half Years of Law Experience

42
Figure 3: Mean Tickets Issued around Law Change, Senior Troopers
Note: Dashed lines indicate 95% confidence intervals around means. Shaded area represents 95% confidence interval for citations for non-changing laws, weighted to represent similar time periods, for senior troopers.
.1.2
.3.4
Mea
n Ti
cket
s Iss
ued
-5 0 5Half Years of Law Experience

43
Figure 4: Non-Parametric Estimates of Ticketing, General Experience, and Law Experience, 2002-2009
Note: Average Return to Law Experience is based on non-parametric estimates of Table 4, Column 1. Average values, along with estimated slope, are weighted by the total number of observations in each Law-General experience pair.

44
Table 1: Tickets Issued by Idaho State Troopers, 2002-2009 All Troopers (n=537,680) Mean SD Min Max Tickets Issued 0.596 8.08 0 735 General Experience 14.5 12.0 1 55 Task-Specific Experience 12.1 10.5 1 55 Law will have More Deterrence
0.077 0 1
Law will have Larger Scope 0.033 0 1 Law will have Smaller Scope 0.032 0 1 Law has More Deterrence? 0.087 0 1 Law has Larger Scope? 0.044 0 1 Law has Smaller Scope? 0.009 0 1 Junior Troopers (n=350,064) Tickets Issued 0.633 8.64 0 735 General Experience 8.11 5.07 1 21 Task-Specific Experience 7.22 4.83 1 21 Law will have More Deterrence
0.082 0 1
Law will have Larger Scope 0.045 0 1 Law will have Smaller Scope 0.032 0 1 Law has more Deterrence? 0.082 0 1 Law has Larger Scope? 0.031 0 1 Law has Smaller Scope? 0.009 0 1 Senior Troopers (n=187,616) Tickets Issued 0.535 6.91 0 475 General Experience 26.6 12.0 7 55 Task-Specific Experience 21.1 12.3 1 55 Law will have More Deterrence 0.067 0 1 Law will have Larger Scope 0.010 0 1 Law will have Smaller Scope 0.032 0 1 Law has more Deterrence? 0.097 0 1 Law has Larger Scope? 0.066 0 1 Law has Smaller Scope? 0.010 0 1 Note: “Junior” and “Senior” troopers are defined by their maximum general experience in our sample. All Senior troopers are observed with more than 10 years of experience (21 semesters)

45
Table 2: Fixed Effect Estimates of General and Task-Specific Experience and Productivity for Idaho State Troopers, 2002-2009
(1) (2) (3) (4) (5)
Experience as Trooper
0.00792 0.00792 0.0137 0.0111 0.00968
[0.00525] (0.000)
[0.00389] (0.000)
[0.0116] (0.000)
[0.00695] (0.597)
[0.0111] (0.000)
Experience with Current Law
-0.00378 0.00401
[0.00545] (0.057)
[0.00181] (0.000)
R2 0.441 0.441 0.703 0.441 0.703 N 537680 537680 537680 537680 537680
Trooper Fixed Effects x x x
Law x Vintage Fixed Effects x x x x
Trooper x Law Fixed Effects x x
Standard errors in brackets allow for two-way clustering at Law (g = 286) and Trooper level (k = 152). Two-tailed p-values are calculated by performing a Monte Carlo permutation test with 1,000 iterations over each of the independent variables, which are reported in parenthesis. All regressions include controls for Ln(Region Population), the fraction of the population that are males between 18 and 24 years old, Ln(Vehicle Crashes), year and fall semester fixed effects.

46
Table 3: Fixed Effects Estimates of General and Task-Specific Experience and Productivity for Idaho State Troopers by Type of Law Change, 2002-2009
Increase Law Scope Decrease Law Scope Increase Penalties (1) (2) (3) (4) (5) (6) (7) (8) (9) (10) (11) (12)
Experience as Trooper
0.0515 0.0592 0.0109 0.0112 0.00688 0.00803 0.00698 0.0065 0.00572 0.00729 0.00552 0.00542 [0.0419] (0.000)
[0.0474] (0.000)
[0.0122] (0.000)
[0.0121] (0.000)
[0.00283] (0.000)
[0.00312] (0.121)
[0.00664] (0.000)
[0.00666] (0.000)
[0.00272] (0.000)
[0.00308] (0.036)
[0.00597] (0.000)
[0.00599] (0.000)
Experience with Current Law
-0.0434 -0.00512 0.00162 0.0014 -0.0000 -0.00121 -0.0004 0.0000 0.0006 -0.00108 0.00178 0.00186 [0.0411] (0.000)
[0.0467] (0.000)
[0.00105] (0.364)
[0.00112] (0.387)
[0.0006] (0.930)
[0.00121] (0.962)
[0.0002] (0.521)
[0.0004] (0.945)
[0.00109] (0.486)
[0.00170] (0.547)
[0.0009] (0.000)
[0.0010] (0.000)
R2 0.442 0.442 0.704 0.704 0.227 0.227 0.531 0.531 0.227 0.227 0.53 0.53
N 428640 428640 428640 432400 417360 417360 417360 419240 486920 486920 486920 490680 Trooper Fixed Effects x x x x x x Law x Vintage Fixed Effects x x x x x x x x x Trooper x Law Fixed Effects x x x x x x Standard errors in brackets allow for two-way clustering at Law (g = 286) and Trooper level (k = 152). Two-tailed p-values are calculated by performing a Monte Carlo permutation test with 1,000 iterations over each of the independent variables, which are reported in parenthesis. All regressions include controls for Ln(Region Population), the fraction of the population that are males between 18 and 24 years old, Ln(Vehicle Crashes), year and fall semester fixed effects. Columns 4, 8, and 12 differ from columns 3, 7, and 11 by including laws that change more than once during our sample period.

47
Table 4: Fixed Effects Estimates of General and Task-Specific Experience and Productivity for Idaho State Troopers by General Experience, 2002-2009
All Junior (n=350,064) Senior (n=187,616)
(1) (2) (3) (4) (5) (6) (7) (8) (9) (10)
Experience as Trooper
0.0157 0.00574 0.147 -0.0164 0.293 0.0349 0.184 0.018 0.163 0.0169 [0.0101] (0.951)
[0.00989] (0.000)
[0.189] (0.000)
[0.0146] (0.000)
[0.148] (0.000)
[0.0342] (1.000)
[0.100] (0.000)
[0.0137] (0.000)
[0.0812] (0.000)
[0.0140] (0.000)
Experience with Current Law
0.0226 0.0315 0.00532 0.0286 0.0837 0.0768 -0.0305 -0.00197 -0.0625 -0.00726 [0.0137] (0.000)
[0.0206] (0.000)
[0.00570] (0.018)
[0.0109] (0.000)
[0.0456] (0.000)
[0.0355] (0.000)
[0.0260] (0.000)
[0.00150] (0.000)
[0.0552] (0.000)
[0.0117] (0.012)
Experience as Trooper x Experience with Current Law
-0.0007 -0.0008 -0.00582 -0.00592 0.000628 0.000119
[0.0005] (0.000)
[0.0006] (0.000)
[0.00320] (0.000)
[0.00349] (0.000)
[0.000517]
(0.000) [0.000237]
(0.258)
R2 0.441 0.703 0.429 0.703 0.429 0.704 0.487 0.704 0.487 0.704
N 537680 537680 350064 350064 350064 350064 187616 187616 187616 187616
Trooper Fixed Effects x x x x x
Law x Vintage Fixed Effects x x x x x x x x x x
Trooper x Law Fixed Effects x x x x x
Columns 1 and 2 include all officers, while columns 3-6 examine junior officers a columns 7-10 examine senior officers. Standard errors in brackets allow for two-way clustering at Law (g = 286) and Trooper level (k = 152). Two-tailed p-values are calculated by performing a Monte Carlo permutation test with 1,000 iterations over each of the independent variables, which are reported in parenthesis. All regressions include controls for Ln(Region Population), the fraction of the population that are males between 18 and 24 years old, Ln(Vehicle Crashes), year and fall semester fixed effects. Columns 6 and 10 differ from columns 5 and 9 by including laws that change more than once during our sample period.

48
Table 5: Fixed Effects Estimates of General and Task-Specific Experience and Productivity for Idaho State Troopers by Experience and Type of Law Change, 2002-2009
Increase Law Scope Decrease Law Scope Increase Penalties
(1) (2) (3) (4) (5) (6) (7) (8) (9)
Panel A: Junior Troopers (n=350,064)
Experience as Trooper 0.347 0.0704 0.0564 0.315 0.0232 0.0232 0.294 0.0187 0.0171 [0.000] (0.000)
[0.0470] (0.000)
[0.0404] (0.000)
[0.171] (0.000)
[0.0122] (0.000)
[0.0111] (0.000)
[0.104] (0.000)
[0.0114] (0.000)
[0.0114] (0.000)
Experience with Current Law 0.0789 0.0500 0.0636 0.0297 0.0296 0.0295 0.0309 0.0319 0.0335 [0.0488] (0.021)
[0.0291] (0.000)
[0.0392] (0.000)
[0.00892] (0.038)
[0.00746] (0.000)
[0.00945] (0.000)
[0.00689] (0.000)
[0.00908] (0.000)
[0.00924] (0.000)
Experience as Trooper x Experience with Current Law
-0.00644 -0.00646 -0.00642 -0.00287 -0.00287 -0.00286 -0.00263 -0.00270 -0.00270 [0.00364] (0.000)
[0.00395] (0.000)
[0.00392] (0.000)
[0.000882] (0.469)
[0.000926] (0.000)
[0.000924] (0.000)
[0.000716] (0.000)
[0.000854] (0.000)
[0.000851] (0.000)
R2 0.43 0.704 0.704 0.243 0.542 0.542 0.243 0.541 0.54 N 279072 279072 281520 271728 271728 272952 317016 317016 319464 Panel B: Senior Troopers Senior (n=187,616)
Experience as Trooper 0.42 0.0153 0.0164 0.0623 0.0112 0.0102 0.0557 0.01 0.0104 [0.318] (0.000)
[0.0169] (0.000)
[0.0168] (0.000)
[0.000] (0.000)
[0.00957] (0.000)
[0.00947] (0.000)
[0.000] (0.000)
[0.00829] (0.000)
[0.00820] (0.000)
Experience with Current Law -0.288 -0.00774 -0.00871 -0.00618 -0.00965 -0.00874 -0.00769 -0.00795 -0.00836 [0.242] (0.000)
[0.0116] (0.036)
[0.0115] (0.000)
[0.0122] (0.191)
[0.0108] (0.000)
[0.0107] (0.000)
[0.00258] (0.000)
[0.0103] (0.134)
[0.0103] (0.000)
Experience as Trooper x Experience with Current Law
0.000567 0.000168 0.000166 0.000155 0.000154 0.000154 0.000155 0.00014 0.00014 [0.000400] (1.000)
[0.000260] (0.470)
[0.000259] (0.022)
[0.000211] (0.544)
[0.000219] (0.363)
[0.000218] (0.139)
[0.000032] (0.395)
[0.000207] (0.372)
[0.000206] (0.047)
R2 0.49 0.705 0.705 0.213 0.504 0.504 0.214 0.504 0.504
N 149568 149568 150880 145632 145632 146288 169904 169904 171216
Law x Vintage Fixed Effects x x x x x x x x x
Trooper x Law Fixed Effects x x x x x x Standard errors in brackets allow for two-way clustering at Law (g = 286) and Trooper level (k = 152). Two-tailed p-values are calculated by performing a Monte Carlo permutation test with 1,000 iterations over each of the independent variables, which are reported in parenthesis. All regressions include controls for Ln(Region Population), the fraction of the population that are males between 18 and 24 years old, Ln(Vehicle Crashes), year and fall semester fixed effects. Columns 3, 6 and 9 differ from columns 2, 5, and 8 by including laws that change more than once during our sample period

49
Table 6: Fixed Effects Estimates of General and Task-Specific Experience and Productivity for Idaho State Troopers, Hired Troopers only, 2002-2009 (1) (2) (3) (4) (5)
Experience as Trooper 0.0345 0.273 -0.0584 0.256 0.020 [0.0372]
(0.000) [.]
(0.000) [0.0316] (0.000)
[0.200] (1.000)
[0.0463] (1.000)
Experience with Current Statute 0.0399 0.0952 0.165 0.165
[0.0190] (0.000)
[0.0434] (0.000)
[0.090] (0.000)
[0.0786] (0.000)
Experience with Current Statute x Experience with Current Law
-0.014 -0.014
[0.0070]
(0.000) [0.0077] (0.000)
R2 0.683 0.40 0.683 0.401 0.683 N 217360 217360 217360 217360 217360
Law x Vintage Fixed Effects x x x x x Trooper x Law Fixed Effects x x x
Standard errors in brackets allow for two-way clustering at Law (g = 286) and Trooper level (k = 152). Two-tailed p-values are calculated by performing a Monte Carlo permutation test with 1,000 iterations over each of the independent variables, which are reported in parenthesis. All regressions include controls for Ln(Region Population), the fraction of the population that are males between 18 and 24 years old, Ln(Vehicle Crashes), year and fall semester fixed effects. Column 5 differs from column 4 by including laws that change more than once during our sample.

50
Table 7: Alternate Specifications of General and Task-Specific Experience and Productivity for Idaho State Troopers by General Experience, 2002-2009
All Junior (n=350,064) Senior (n=187,616)
Panel A: Linear Probability Model
(1) (2) (3) (4) (5) (6) (7) (8) (9) (10)
Experience as Trooper
0.00136 0.00247 0.020 -0.00166 0.0187 0.00295 0.0227 0.0030 0.0214 0.0028 [0.000138]
(0.000) [0.00071] (0.000)
[.] (0.000)
[0.00165] (0.000)
[.] (0.818)
[0.00156] (0.000)
[0.000986] (0.000)
[0.00094] (0.000)
[0.000877] (0.000)
[0.000823] (0.000)
Experience with Current Law
0.00221 0.00257 0.00123 0.00545 0.00828 0.00971 0.000146 -0.00087 -0.00179 -0.00254 [0.000272]
(0.000) [0.00122] (0.000)
[0.000428] (0.000)
[0.00161] (0.000)
[0.00092] (0.000)
[0.00212] (0.000)
[.] (0.000)
[0.00048] (0.000)
[.] (0.000)
[0.0041] (0.000)
Exp. as Trooper x Exp. with Current Law
-0.000045 -0.0000591 -0.00053 -0.00053 0.00000 0.00000 [0.000005]
(0.000) [0.000028]
(0.000) [0.0000053]
(0.000) [0.00010] (0.000)
[.] (0.000)
[0.00000] (0.000)
R2 0.293 0.457 0.302 0.468 0.304 0.47 0.29 0.44 0.29 0.44 N 537680 537680 350064 350064 350064 350064 187616 187616 187616 187616
Panel B: Laws used more than 200 times
Experience as Trooper
0.0513 0.0208 0.451 -0.0724 0.967 0.104 0.605 0.0681 0.535 0.0637 [0.0352] (0.000)
[0.0351] (0.000)
[0.664] (0.000)
[0.0551] (0.000)
[.] (0.000)
[0.120] (1.000)
[0.347] (0.000)
[0.0448] (0.000)
[0.286] (0.000)
[0.0463] (0.000)
Experience with Current Law
0.0815 0.113 0.0217 0.117 0.304 0.291 -0.101 -0.00882 -0.207 -0.0273 [0.050] (0.000)
[0.0737] (0.000)
[0.0179] (0.000)
[0.0429] (0.000)
[0.159] (0.000)
[0.131] (0.000)
[0.0836] (0.000)
[0.00579] (0.000)
[0.173] (0.000)
[0.0403] (0.000)
Exp. as Trooper x Exp. with Current Law
-0.00246 -0.00292 -0.0206 -0.0208 0.0021 0.00043 [0.00174] (0.000)
[0.00211] (0.000)
[0.011] (0.000)
[0.0124] (0.000)
[0.00163] (0.316)
[0.00081] (0.235)
R2 0.439 0.7 0.427 0.7 0.428 0.701 0.486 0.702 0.486 0.702 N 148520 148520 96696 96696 96696 96696 51824 51824 51824 51824 Law x Vintage Fixed Effects x x x x x x x x x x
Trooper x Law Fixed Effects x x x x x
Standard errors in brackets allow for two-way clustering at Law (g = 286) and Trooper level (k = 152). Two-tailed p-values are calculated by performing a Monte Carlo permutation test with 1,000 iterations over each of the independent variables, which are reported in parenthesis. All regressions include controls for Ln(Region Population), the fraction of the population that are males between 18 and 24 years old, Ln(Vehicle Crashes), year and fall semester fixed effects.

51
Table 8: Fixed Effects Estimates of General and Task-Specific Experience and Productivity for Idaho State Troopers by General Experience and Similar Laws, 2002-2009
All Junior (n=350,064) Senior (n=187,616)
(1) (2) (3) (4) (5) (6) (7) (8) (9) (10)
Experience as Trooper 0.0473 0.0125 0.129 -0.0954 0.356 0.0587 0.286 0.0447 0.583 0.028 [0.0388] (0.000)
[0.0159] (0.995)
[.] (0.000)
[0.0499] (0.000)
[.] (0.000)
[0.0478] (1.000)
[.] (0.000)
[0.0372] (0.000)
[0.390] (0.000)
[0.0233] (0.000)
Experience with Current Law
0.213 0.0457 0.114 0.124 0.221 0.120 -0.0404 -0.0404 0.303 -0.0117 [0.187] (0.000)
[0.0337] (0.035)
[0.0710] (0.000)
[0.0863] (0.000)
[0.129] (0.000)
[0.0649] (0.332)
[0.0361] (0.000)
[0.0364] (0.000)
[0.302] (0.000)
[0.0153] (0.000)
Experience as Trooper x Experience with Current Law
-0.00553 -0.00126 -0.00873 -0.00949 -0.00791 0.000172 [0.00498] (0.000)
[0.000924] (0.000)
[0.00499] (0.000)
[0.00568] (1.000)
[0.00764] (0.000)
[0.000353] (0.391)
R2 0.00716 0.706 0.00393 0.00107 0.00432 0.705 0.00529 0.0028 0.0195 0.708
N 336520 336520 219096 219096 219096 219096 117424 117424 117424 117424
Trooper Fixed Effects x x x x x Law x Vintage Fixed Effects x x x x x x x x x x
Trooper x Law Fixed Effects x x x x x
Standard errors in brackets allow for two-way clustering at Law (g = 286) and Trooper level (k = 152). Two-tailed p-values are calculated by performing a Monte Carlo permutation test with 1,000 iterations over each of the independent variables, which are reported in parenthesis. All regressions include controls for Ln(Region Population), the fraction of the population that are males between 18 and 24 years old, Ln(Vehicle Crashes), year and fall semester fixed effects. Columns 6 and 10 differ from columns 5 and 9 by including laws that change more than once during our sample period.

52
Appendix A
Table 1: Idaho Law Changes

53
Violation Description Amend Date Amendment Description Coded As
18 1501 Injury to children 2005 Willfully to be injure or failing to prevent injury to child Increase Scope
18 1501(3) Injury to children during transport 1997 Threshold BAC decreased from 0.10 to 0.08 Increase Deterrence
2001 Penalties for operating a vessel under influence Increase Scope
18 1801(1) Interruption of court proceedings and respect 2005 Increased max fine for misdemeanors from $500 ($300 for some cases) to $ 1000
Increase Deterrence
18 2407(1) Physical injury/property damage/ abusing position as a public servant/ taking a property exceed $1000 or taking check, credit cards name as Grand theft
2000 Stealing property with aggregate value over $50 for three or more incidents in a period of three days constitutes a grand theft
Increase Deterrence
2002 Now theft of ammonia to make methamphetamine drugs is a grand theft
Increase Deterrence
2002 Now include every type of cards widely used/checks/checking account numbers
Increase Scope
18 3302 Carrying concealed weapon without permit 2005 Increased max. fine for misdemeanors from $500 ($300 for some cases) to $1,000
Increase Deterrence
18 3302(9) Carrying concealed weapon in any motor vehicle 2005 Increased max. fine for misdemeanors from $500 ($300 for some cases) to $1,000
Increase Deterrence
18 3302B Carrying a concealed weapon under influence of alcohol or drugs
2005 Increased max. fine for misdemeanors from $500 ($300 for some cases) to $1,000
Increase Deterrence
18 4006(3)(C) Vehicular manslaughter-commission without gross negligence
2002 Killing of human embryo also a manslaughter Increase Scope
18 4116 Willfully and lewdly exposing genital in place where public and present another
2006 Max imprisonment for second offense increased from 5 years to 10 years
Increase Deterrence
18 4628 Transporting forest products without proof of ownership 2006 Increased max fine for misdemeanors from $500 ($300 for some cases) to $1,000
Increase Deterrence
18 6409 Disturbing the peace or quite of any family, person, or any funeral or memorial service
2005 Increased max. fine for misdemeanors from $500 ($300 for some cases) to $1,000
Increase Deterrence
18 7001 Damage on property owned by another or jointly owned 2005 Damaged caused by a common scheme or plan is now being included in the $ 1000 threshold
Increase Scope
18 7005 Damage to forage on public lands 2005 Increased max. fine for misdemeanors from $500 ($300 for some cases) to $1,000
Increase Deterrence
18 7031 Placing debris on public or private property 2006 Increased max fine from $300 to $1000 Increase Deterrence
18 8002 Refusing to submit or complete evidentiary alcohol testing 2006 Added $250 fine Increase Deterrence

54
18 8004 Driving under influence of alcohol or any other substance 1997 BAC lowered from 0.10 to 0.08 Increase Scope
1998 License suspension time excludes incarceration Increase Scope
2006 Any prior violations will stay on your record for ten years as of 2006.
Increase Scope
2009 After 45 days of driving suspension, restricted driving privilege may be granted
Reduce Scope
18 8004(1)(A) Driving a non-commercial vehicle under influence of alcohol
1997 BAC lowered from 0.10 to 0.08 Increase Scope
1998 License suspension time excludes incarceration Increase Scope
2006 Any prior violations will stay on your record for ten years as of 2006.
Increase Scope
2009 After 45 days of driving suspension, restricted driving privilege may be granted
Reduce Scope
18 8004(1)(D) Minors DUI (BAC 0.02-0.08) 1997 BAC lowered from 0.10 to 0.08 Increase Scope
1998 License suspension time excludes incarceration Increase Scope
2006 Any prior violations will stay on your record for ten years as of 2006.
Increase Scope
2009 After 45 days of driving suspension, restricted driving privilege may be granted
Reduce Scope
18 8004C DUI(Driving non-commercial vehicles when BAC>0.020) 1997 BAC lowered from 0.10 to 0.08 Increase Scope
1998 License suspension time excludes incarceration Increase Scope
2006 Any prior violations will stay on your record for ten years as of 2006.
Increase Scope
2009 After 45 days of driving suspension, restricted driving privilege may be granted
Reduce Scope
18 8004C(1) 1st offense-DUI(Driving non-commercial vehicles when BAC>0.20)
1997 BAC lowered from 0.10 to 0.08 Increase Scope
1998 License suspension time excludes incarceration Increase Scope
2006 Any prior violations will stay on your record for ten years as of 2006.
Increase Scope

55
2009 After 45 days of driving suspension, restricted driving privilege may be granted
Reduce Scope
18 8004C(3) Defines conditions under which court may grant a restricted driver's license.
1997 BAC lowered from 0.10 to 0.08 Increase Scope
1998 License suspension time excludes incarceration Increase Scope
2006 Any prior violations will stay on your record for ten years as of 2006.
Increase Scope
2009 After 45 days of driving suspension, restricted driving privilege may be granted
Reduce Scope
18 8005 Defines punishments for section 18 8004 1997 BAC lowered from 0.10 to 0.08, stricter definition of "actual physical control of vehicle"
Increase Scope
1998 License suspension time excludes incarceration Increase Scope
2006 Any prior violations will stay on your record for ten years as of 2006.
Increase Scope
2009 After 45 days of driving suspension, restricted driving privilege may be granted
Reduce Scope
18 8006 Aggravated driving while under influence of alcohol (BAC>0.8)
2000 Now max. imprisonment is 10 years Increase Deterrence
2006 Max imprisonment increased from 10 years to 15 years Increase Deterrence
18 901 Unlawful attempt to commit a violent injury, threat by word, act to do violence
2005 Increased max fine from $300 to $1,000 Increase Deterrence
18 903 willful and unlawful use of force or violence on another by all A,B,C of 18 903
2005 Increased max fine from $300 to $1,000 Increase Deterrence
18 915 Battery with intent to commit a serious felony upon judge, law enforcement agent, social worker, firemen or paramedic; assault or battery upon a former or present justice, judge or law enforcement officer
1999 Added Magistrates Increase Scope
2000 Added an agent of the state tax commission and employees at private correctional facilities
Increase Scope
2001 Now assaulting retired or off duty former judge/jailer is felony charge
Increase Deterrence
2008 Added misdemeanor probation officers Increase Scope
18 918(3) Committing a battery which does not result in traumatic injury
2004 Offense occurred outside Idaho now is counted as a subsequent violation
Increase Scope
18 918(5) Two further violations of 18 918 within 15yrs, is guilty of felony and punished by $10000 and 10yrs in jail
2004 Offense occurred outside Idaho now is counted as a subsequent violation
Increase Scope

56
18 920 Violation of no contact order 2008 Created enhanced penalty for the third violation Increase Deterrence
19 3901(A) Failure to appear on a misdemeanor citation 2005 Increased max. fine for misdemeanors from $500 ($300 for some cases) to $1,000
Increase Deterrence
19 3901A Failure to appear on a misdemeanor citation complied by a counsel
2005 Increased max. fine for misdemeanors from $500 ($300 for some cases) to $1,000
Increase Deterrence
19 3901A(B) Duty to appear at misdemeanor citation complied by appearance by a counsel
2005 Increased max. fine for misdemeanors from $500 ($300 for some cases) to $1,000
Increase Deterrence
23 1012(3) Beer can be sold only within a period allowed by law 2005 Increased max. fine for misdemeanors from $500 ($300 for some cases) to $1,000
Increase Deterrence
23 1023 Minors can possess beer in the course of employment or by the order of his parent
2005 Increased max. fine for misdemeanors from $500 ($300 for some cases) to $1,000
Increase Deterrence
23 603 Any adult over 18 selling or giving alcohol beverages to minor under 21
2004 Removed felony and increased fines for the 2nd and subsequent violation
Increase Deterrence
36 401 License required for hunting, trapping, and fishing 2006 Children with life-threatening medical conditions are exempt from required license purchase
Reduce Scope
2009 Military veterans are exempt from license requirement Reduce Scope
39 6312 Violates the provisions of a domestic violence protection order; a peace officer may arrest without a warrant
1999 Out-of-state court order may be presumed that the person against whom the order has been issued already has notice of the order
Increase Scope
392 16 Use of seatbelts required for commercial motor drivers 2003 Fine increased to $10 from $5. Enforceable only when the driver violated another law.
Increase Deterrence
40 511 Failing to stop at port of entry or checking station 2005 Increased max. fine for misdemeanors from $500 ($300 for some cases) to $1,000
Increase Deterrence
49 1010 Violation of vehicle size limit 2003 Created restrictions on lengths of truck tractors Increase Scope
2005 Added size limitation for vehicles transporting class 1 explosive materials
Increase Scope
49 1230 Cease to maintain the insurance shall immediately surrender registration card and license plates
2005 Increased max. fine for misdemeanors from $500 ($300 for some cases) to $1,000
Increase Deterrence
49 1301 Driver involved in an accident who does not make a stop at the scene of accident
2005 Specified, stops distance for minor accidents on highways, and freed motorists to move
Reduce Scope
49 1302 Driver, willfully fails to provide relevant/false information in an accident
2005 Increased max. fine for misdemeanors from $500 ($300 for some cases) to $1,000
Increase Deterrence
49 1304 Driver on highway, abandoning duty to stop and notify the owner of fixtures
2005 Increased max. fine for misdemeanors from $500 ($300 for some cases) to $1,001
Increase Deterrence
49 1308 Person filing false accident reports 2005 Double the fine from1st to 2nd offence and max. Penalties for repeated violation is 5 yrs
Increase Deterrence

57
49 1401(1) Reckless driving 2005 Double the fine from1st to 2nd offence and max. penalties for repeated violation is 5 yr
Increase Deterrence
2006 New fines are $1000 instead $500 and $2000 instead $1000
Increase Deterrence
49 1401(3) Inattentive driving (inattentive, careless or imprudent driving)
2005 Created penalties for inattentive driving Increase Deterrence
49 1403 Direction to operate the vehicle on a highway by contrary to law
2005 Increased max. fine for misdemeanors from $500 ($300 for some cases) to $1,000
Increase Deterrence
49 1404(1) fleeing or attempting to elude a peace officer 2005 Increased max. fine for misdemeanors from $500 ($300 for some cases) to $1,000
Increase Deterrence
49 1419 Fails to comply with traffic direction by peace officer/fireman/adult school crossing guard
2005 Increased max. fine for misdemeanors from $500 ($300 for some cases) to $1,000
Increase Deterrence
49 1421 Driving over dividing space on highway or onto controlled access highway
2005 Increased max. fine for misdemeanors from $500 ($300 for some cases) to $1,000
Increase Deterrence
49 1421(2) Driving onto/from any controlled access highway except at entrances and exits
2005 Increased max. fine for misdemeanors from $500 ($300 for some cases) to $1,001
Increase Deterrence
49 1424(1) Racing on public highways 2005 Increased max. fine for misdemeanors from $500 ($300 for some cases) to $1,001
Increase Deterrence
49 1426 Having alcohol/drugs, Pedestrians shall not walk or be upon a highway except on a sidewalk
2005 Increased max. fine for misdemeanors from $500 ($300 for some cases) to $1,002
Increase Deterrence
49 1627 Rules on using dealer and manufacturer license plate 2005 Increased max. fine for misdemeanors from $500 ($300 for some cases) to $1,001
Increase Deterrence
49 1627(2)(C) Dealer plates can't use on laden vehicles transporting cargo
2005 Increased max. fine for misdemeanors from $500 ($300 for some cases) to $1,000
Increase Deterrence
49 1801(1) Prohibits vehicle abandonment upon any highway 2005 Increased max. fine for misdemeanors from $500 ($300 for some cases) to $1,000
Increase Deterrence
49 227 Prohibits operating vehicle without owner's consent 2005 Person who causes $1,000 or more damage is charged as a felony
Increase Deterrence
49 2446 Prohibits producing, selling fake ID card 2005 Increased max. fine for misdemeanors from $500 ($300 for some cases) to $1,000
Increase Deterrence
49 301 Prohibits driving motor vehicles without a valid license 2001 Add terms stating "a violation of this section is a misdemeanor"
Increase Scope
2005 Now maximum fine for misdemeanors is $1000 Increase Deterrence
49 301(1) Prohibits driving motor vehicle on a highway without a license
2002 Allowing persons with driving permit to drive upon a highway with restrictions
Reduce Scope
2005 Now maximum fine for misdemeanors is $1000 Increase Deterrence

58
49 301(2) Prohibits driving a motorcycle upon a highway without a valid license
2005 Increased max. fine for misdemeanors from $500 ($300 for some cases) to $1,000
Increase Deterrence
2006 Now commercial motor vehicles on highway is allowed Reduce Scope
49 304(5) Prohibits operation of Motorcycle without "M" license on highway
2002 Section created, as a part of 49-304(3) Increase Scope
2008 Separate section of 49-304(5) Increase Scope
49 320 License holders should keep a current address on file with the department
2000 Subsection (3) was added, defining violation of this section is an infraction
Increase Scope
49 654(2) No driving past the assigned speed limit 1997 Substituted "business or" for "neighborhood of any" preceding "urban district", substituted "on state highways" for "in other locations" and created subdivision (2)(e) by transferring "in other location
Increase Scope

59
0.2
.4.6
Den
sity
-3 -2 -1 0 1 2Parameter estimate
Junior Senior
kernel = epanechnikov, bandwidth = 0.3373
Appendix Figure 1: Junior & Senior Fixed Effects Distribution

60
APPENDIX B – Day vs. Night Time Hours
Table B2a: Fixed Effect Estimates of General and Task-Specific Experience and Productivity for Idaho State Troopers During Day Time Hours, 2002-2009
(1) (2) (3) (4) (5)
Experience as Trooper
0.00174 0.00174 0.00174 0.00452 0.00153
[0.000654] [0.000373] [0.000373] [0.000360] [0.000411]
Experience with Current Law
0.000255 0.000726
[0.000196] [0.000168]
R2 0.46 0.46 0.46 0.641 0.46
N 537680 537680 537680 537680 537680
Trooper Fixed Effects x x x x x
Semester Fixed Effects x x x x x
Law Fixed Effects x x x x x
Law x Vintage Fixed Effects x x x x
Trooper x Law Fixed Effects x x
Standard errors in brackets allow for two-way clustering at Law (g = 286) and Trooper level (k = 152). All regressions include controls for Ln(Region Population), the fraction of the population that are males between 18 and 24 years old, and Ln(Vehicle Crashes)
Table B2b: Fixed Effect Estimates of General and Task-Specific Experience and Productivity for Idaho State Troopers During Night Time Hours, 2002-2009
(1) (2) (3) (4) (5) Experience as Trooper 5.77E-05 5.77E-05 5.77E-05 0.00111 -0.0003

61
[0.000283] [0.000151] [0.000152] [0.000181] [0.000190]
Experience with Current Law
0.000426 0.000420
[0.000132] [0.0000892] R2 0.351 0.351 0.352 0.55 0.352
N 537680 537680 537680 537680 537680
Trooper Fixed Effects x x x x x
Semester Fixed Effects x x x x x
Law Fixed Effects x x x x x
Law x Vintage Fixed Effects x x x x
Trooper x Law Fixed Effects x x
Standard errors in brackets allow for two-way clustering at Law (g = 286) and Trooper level (k = 152). All regressions include controls for Ln(Region Population), the fraction of the population that are males between 18 and 24 years old, and Ln(Vehicle Crashes)
Table B3a: Fixed Effects Estimates of General and Task-Specific Experience and Productivity for Idaho State Troopers by Type of Law Change During Day Time Hours, 2002-2009
Increase Law Scope Decrease Law Scope Increase Penalties (1) (2) (3) (4) (5) (6) (7) (8) (9) (10) (11) (12)
Experience as Trooper
0.00271 0.00299 0.0040 0.0043 0.00185 0.00171 0.0040 0.0038 0.0014 0.0016 0.0032 0.0032
[0.00114] [0.00126] [0.00044] [0.00052] [0.00071] [0.00077] [0.00094] [0.00057] [0.00037] [0.000373] [0.000364] [0.000368]
Experience with Current Law
-0.00085 -0.00114 0.000317 0.000104 1.57E-05 0.000158 -0.00037 -0.00017 0.00038 0.000207 0.00051 0.00053
[0.00105] [0.00118] [0.00014] [0.00031] [0.00059] [0.00067] [0.00087] [0.00045] [0.00012] [0.000152] [0.000188] [0.000196]
R2 0.471 0.471 0.65 0.649 0.341 0.341 0.561 0.561 0.338 0.339 0.558 0.557
N 428640 428640 428640 432400 417360 417360 417360 419240 486920 486920 486920 490680 Trooper Fixed Effects x x x x x x x x x x x x
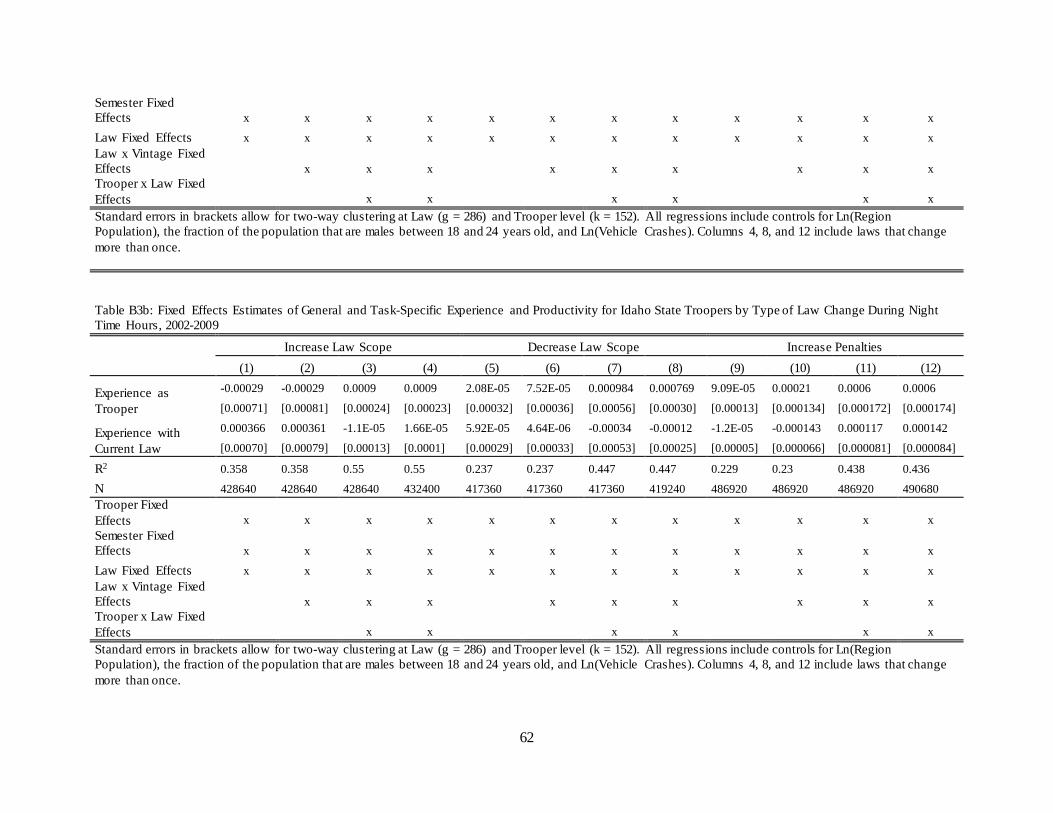
62
Semester Fixed Effects x x x x x x x x x x x x
Law Fixed Effects x x x x x x x x x x x x Law x Vintage Fixed Effects x x x x x x x x x Trooper x Law Fixed Effects x x x x x x Standard errors in brackets allow for two-way clustering at Law (g = 286) and Trooper level (k = 152). All regressions include controls for Ln(Region Population), the fraction of the population that are males between 18 and 24 years old, and Ln(Vehicle Crashes). Columns 4, 8, and 12 include laws that change more than once. Table B3b: Fixed Effects Estimates of General and Task-Specific Experience and Productivity for Idaho State Troopers by Type of Law Change During Night Time Hours, 2002-2009
Increase Law Scope Decrease Law Scope Increase Penalties (1) (2) (3) (4) (5) (6) (7) (8) (9) (10) (11) (12)
Experience as Trooper
-0.00029 -0.00029 0.0009 0.0009 2.08E-05 7.52E-05 0.000984 0.000769 9.09E-05 0.00021 0.0006 0.0006
[0.00071] [0.00081] [0.00024] [0.00023] [0.00032] [0.00036] [0.00056] [0.00030] [0.00013] [0.000134] [0.000172] [0.000174]
Experience with Current Law
0.000366 0.000361 -1.1E-05 1.66E-05 5.92E-05 4.64E-06 -0.00034 -0.00012 -1.2E-05 -0.000143 0.000117 0.000142
[0.00070] [0.00079] [0.00013] [0.0001] [0.00029] [0.00033] [0.00053] [0.00025] [0.00005] [0.000066] [0.000081] [0.000084]
R2 0.358 0.358 0.55 0.55 0.237 0.237 0.447 0.447 0.229 0.23 0.438 0.436
N 428640 428640 428640 432400 417360 417360 417360 419240 486920 486920 486920 490680 Trooper Fixed Effects x x x x x x x x x x x x Semester Fixed Effects x x x x x x x x x x x x
Law Fixed Effects x x x x x x x x x x x x Law x Vintage Fixed Effects x x x x x x x x x Trooper x Law Fixed Effects x x x x x x Standard errors in brackets allow for two-way clustering at Law (g = 286) and Trooper level (k = 152). All regressions include controls for Ln(Region Population), the fraction of the population that are males between 18 and 24 years old, and Ln(Vehicle Crashes). Columns 4, 8, and 12 include laws that change more than once.

63
Table B4a: Fixed Effects Estimates of General and Task-Specific Experience and Productivity for Idaho State Troopers by General Experience During Day Time Hours, 2002-2009
All Junior (n=350,064) Senior (n=187,616)
(1) (2) (3) (4) (5) (6) (7) (8) (9) (10)
Experience as Trooper
0.00196 0.00343 0.0275 -0.00199 0.0436 0.00361 0.0343 0.00654 0.0328 0.00617
[0.000414] [0.000396] [0.0160] [0.000701] [0.0161] [0.000734] [0.00516] [0.000684] [0.00510] [0.000694]
Experience with Current Law
0.00272 0.00344 0.00131 0.00586 0.00994 0.0112 -0.00033 -0.00076 -0.00272 -0.0025
[0.000300] [0.000289] [0.000501] [0.000586] [0.000569] [0.000635] [0.000436] [0.000272] [0.000896] [0.000544] Experience as Trooper x Experience with Current Law
-0.0001 -0.0001 -0.0006 -0.0007 0.00005 0.00004
[0.0000068] [0.0000072]
[0.0000282] [0.0000296]
[0.0000130] [0.0000107]
R2 0.461 0.641 0.463 0.644 0.464 0.645 0.47 0.637 0.47 0.637
N 537680 537680 350064 350064 350064 350064 187616 187616 187616 187616
Trooper Fixed Effects x x x x x x x x x x
Semester Fixed Effects x x x x x x x x x x
Law Fixed Effects x x x x x x x x x x Law x Vintage Fixed Effects x x x x x x x x x x
Trooper x Law Fixed Effects x x x x x
Standard errors in brackets allow for two-way clustering at Law (g = 286) and Trooper level (k = 152). All regressions include controls for Ln(Region Population), the fraction of the population that are males between 18 and 24 years old, and Ln(Vehicle Crashes). Columns 1 and 2 have all troopers. Columns -6 have Junior troopers only. Columns 7-10 have Senior troopers only.

64
Table B4b: Fixed Effects Estimates of General and Task-Specific Experience and Productivity for Idaho State Troopers by General Experience During Night Time Hours, 2002-2009
All Junior (n=350,064) Senior (n=187,616)
(1) (2) (3) (4) (5) (6) (7) (8) (9) (10)
Experience as Trooper
-0.00016 0.000579 0.0159 -0.0023 0.0225 -7.5E-05 -0.00525 0.00157 -0.0060 0.00131
[0.000194] [0.000202] [0.00876] [0.000558] [0.00878] [0.000570] [0.00172] [0.000293] [0.00177] [0.000300]
Experience with Current Law
0.00123 0.00126 0.000786 0.00345 0.00433 0.00555 0.000187 -0.00034 -0.00103 -0.0016
[0.000183] [0.000155] [0.000391] [0.000517] [0.000393] [0.000529] [0.000293] [0.000116] [0.000563] [0.000274] Experience as Trooper x Experience with Current Law
-0.000021 -0.00003 -0.00002 -0.00003 0.000024 0.00003
[0.00000369] [0.0000037]
[0.0000037] [0.0000037]
[0.0000073] [0.0000056]
R2 0.352 0.55 0.363 0.562 0.364 0.563 0.343 0.521 0.343 0.521
N 537680 537680 350064 350064 350064 350064 187616 187616 187616 187616
Trooper Fixed Effects x x x x x x x x x x
Semester Fixed Effects x x x x x x x x x x
Law Fixed Effects x x x x x x x x x x Law x Vintage Fixed Effects x x x x x x x x x x
Trooper x Law Fixed Effects x x x x x
Standard errors in brackets allow for two-way clustering at Law (g = 286) and Trooper level (k = 152). All regressions include controls for Ln(Region Population), the fraction of the population that are males between 18 and 24 years old, and Ln(Vehicle Crashes). Columns 1 and 2 have all troopers. Columns 3-6 have Junior troopers only. Columns 7-10 have Senior troopers only.

65
Table B5a: Fixed Effects Estimates of General and Task-Specific Experience and Productivity for Idaho State Troopers by Experience and Type of Law Change During Day Time Hours, 2002-2009
Increase Law Scope Decrease Law Scope Increase Penalties
(1) (2) (3) (4) (5) (6) (7) (8) (9)
Panel A: Junior Troopers (n=350,064)
Experience as Trooper 0.0459 0.0084 0.0066 0.0448 0.00757 0.0073 0.0429 0.0044 0.0039
[0.0178] [0.00127] [0.00129] [0.0175] [0.00464] [0.00209] [0.0160] [0.000698] [0.000723]
Experience with Current Law 0.0089 0.0068 0.0085 0.00615 0.0053 0.00558 0.0080 0.0080 0.0086
[0.000748] [0.00116] [0.00121] [0.00248] [0.00462] [0.00206] [0.000511] [0.000595] [0.000621]
Experience as Trooper x Experience with Current Law
-0.0007 -0.0007 -0.0007 -0.0006 -0.0006 -0.0006 -0.0005 -0.0006 -0.0006
[0.000030] [0.000032] [0.000032] [0.000025] [0.000027] [0.000027] [0.000024] [0.000025] [0.000025] R2 0.475 0.655 0.654 0.358 0.573 0.573 0.354 0.568 0.567 N 279072 279072 281520 271728 271728 272952 317016 317016 319464 Panel B: Senior Troopers (n=187,616)
Experience as Trooper 0.0371 0.0054 0.0060 0.0320 0.00725 0.00604 0.0285 0.0051 0.0054
[0.00619] [0.000815] [0.000934] [0.00552] [0.00157] [0.000973] [0.00468] [0.000608] [0.000615]
Experience with Current Law -0.00512 -0.0022 -0.0028 -0.00253 -0.00448 -0.00330 -0.0022 -0.0023 -0.0025
[0.00299] [0.000559] [0.000712] [0.00132] [0.00153] [0.000931] [0.000557] [0.000561] [0.000566]
Experience as Trooper x Experience with Current Law
0.0001 0.0001 0.0001 0.00004 0.00004 0.00004 0.00004 0.00004 0.00004
[0.000014] [0.000012] [0.000012] [0.000011] [0.000011] [0.000011] [0.000010] [0.000011] [0.000011] R2 0.0371 0.0054 0.0060 0.0320 0.00725 0.00604 0.0285 0.00514 0.00537 N [0.00619] [0.000815] [0.000934] [0.00552] [0.00157] [0.000973] [0.00468] [0.000608] [0.000615]
Law x Vintage Fixed Effects x x x x x x x x x
Trooper x Law Fixed Effects x x x x x x Standard errors in brackets allow for two-way clustering at Law (g = 286) and Trooper level (k = 152). All regressions include controls for Ln(Region Population), the fraction of the population that are males between 18 and 24 years old, and Ln(Vehicle Crashes), along with trooper, law, and semester fixed effects. Columns 3, 6, and 9 include laws that change more than once.

66
Table B5b: Fixed Effects Estimates of General and Task-Specific Experience and Productivity for Idaho State Troopers by Experience and Type of Law Change During Night Time Hours, 2002-2009
Increase Law Scope Decrease Law Scope Increase Penalties
(1) (2) (3) (4) (5) (6) (7) (8) (9)
Panel A: Junior Troopers (n=350,064)
Experience as Trooper 0.0266 0.0033 0.0027 0.0242 -0.00139 0.000487 0.0211 0.0016 0.0013
[0.00856] [0.000905] [0.000721] [0.00808] [0.00243] [0.00103] [0.00700] [0.000356] [0.000364]
Experience with Current Law 0.0026 0.00189 0.0025 0.00302 0.00553 0.0037 0.0021 0.0024 0.0027
[0.000437] [0.000867] [0.000681] [0.00136] [0.00243] [0.00101] [0.000259] [0.000307] [0.000315]
Experience as Trooper x Experience with Current Law
-0.0003 -0.0003 -0.0003 -0.0002 -0.0002 -0.0002 -0.0002 -0.0002 -0.0002
[0.000015] [0.000016] [0.000015] [0.000013] [0.000013] [0.000013] [0.000012] [0.000012] [0.000012] R2 0.37 0.561 0.561 0.255 0.465 0.465 0.248 0.456 0.454 N 279072 279072 281520 271728 271728 272952 317016 317016 319464 Panel B: Senior Troopers (n=187,616)
Experience as Trooper -0.00673 0.000831 0.000764 -0.0079 -0.00065 -2.7E-05 -0.0060 0.00073 0.00081
[0.00263] [0.000409] [0.000380] [0.00228] [0.00121] [0.000650] [0.00178] [0.000263] [0.000266]
Experience with Current Law -0.00155 -0.0018 -0.0017 -0.0006 -0.00046 -0.00108 -0.0017 -0.0017 -0.0018
[0.00200] [0.000364] [0.000331] [0.00109] [0.00122] [0.000664] [0.000263] [0.000270] [0.000272]
Experience as Trooper x Experience with Current Law
0.00004 0.00004 0.00004 0.00003 0.00003 0.00003 0.00003 0.00003 0.00003
[0.00000750] [0.00000595] [0.00000592] [0.00000549] [0.00000567] [0.00000566] [0.00000507] [0.00000534] [0.00000533] R2 0.349 0.525 0.525 0.214 0.401 0.401 0.208 0.393 0.39 N 149568 149568 150880 145632 145632 146288 169904 169904 171216
Law x Vintage Fixed Effects x x x x x x x x x
Trooper x Law Fixed Effects x x x x x x Standard errors in brackets allow for two-way clustering at Law (g = 286) and Trooper level (k = 152). All regressions include controls for Ln(Region Population), the fraction of the population that are males between 18 and 24 years old, and Ln(Vehicle Crashes), along with trooper, law, and semester fixed effects. Columns 3, 6, and 9 include laws that change more than once.

67
Table B6a: Fixed Effects Estimates of General and Task-Specific Experience and Productivity for Idaho State Troopers, Hired Troopers only During Day Time Hours, 2002-2009 (1) (2) (3) (4) (5)
Experience as Trooper 0.0369 0.00293 0.0352 -0.0101 0.0328
[0.0198] [0.000668] [0.0199] [0.00203] [0.0198]
Ln(Experience with Current Statute) 0.0017 0.0134 0.0173 0.0222 [0.00108] [0.00202] [0.00120] [0.00205]
Ln(Experience with Current Statute) x Experience with Current Law
-0.00175 -0.00176 [0.0000728] [0.0000774]
R2 0.459 0.642 0.459 0.643 0.462 N 217360 217360 217360 217360 217360 Law x Vintage Fixed Effects x x x x x Trooper x Law Fixed Effects x x x Standard errors in brackets allow for two-way clustering at Law (g = 286) and Trooper level (k = 82). All regressions include controls for Ln(Region Population), the fraction of the population that are males between 18 and 24 years old, and Ln(Vehicle Crashes), along with trooper, law, and semester fixed effects. = p 0.10 , = p < 0.05 , = p < 0.01
Table B6b: Fixed Effects Estimates of General and Task-Specific Experience and Productivity for Idaho State Troopers, Hired Troopers only During Night Time Hours, 2002-2009 (1) (2) (3) (4) (5)
Experience as Trooper 0.0318 0.000648 0.0292 -0.00913 0.0280
[0.0106] [0.000352] [0.0106] [0.00156] [0.0106]
Ln(Experience with Current Statute) 0.00262 0.0100 0.0102 0.0144 [0.000858] [0.00162] [0.000916] [0.00164]
Ln(Experience with Current Statute) x Experience with Current Law
-0.000851 -0.000861 [0.0000395] [0.0000419]
R2 0.37 0.562 0.37 0.562 0.372 N 217360 217360 217360 217360 217360 Law x Vintage Fixed Effects x x x x x Trooper x Law Fixed Effects x x x

68
Standard errors in brackets allow for two-way clustering at Law (g = 286) and Trooper level (k = 82). All regressions include controls for Ln(Region Population), the fraction of the population that are males between 18 and 24 years old, and Ln(Vehicle Crashes), along with trooper, law, and semester fixed effects.

69
Table B7a: Alternate Specifications of General and Task-Specific Experience and Productivity for Idaho State Troopers by General Experience During Day Time Hours, 2002-2009
All Junior (n=350,064) Senior (n=187,616)
Panel A: Linear Probability Model
(1) (2) (3) (4) (5) (6) (7) (8) (9) (10)
Experience as Trooper
0.00291 0.00816 0.0381 -0.0081 0.0724 0.00354 0.0687 0.0176 0.0653 0.0166
[0.000849] [0.000987] [0.0371] [0.00227] [0.0371] [0.00230] [0.00932] [0.00164] [0.00930] [0.00166]
Experience with Current Law
0.00627 0.00789 0.00366 0.0175 0.0225 0.0290 -0.00022 -0.00327 -0.0054 -0.0076
[0.000582] [0.000819] [0.00118] [0.00213] [0.00132] [0.00218] [0.000633] [0.00106] [0.00118] [0.00140] Ln(Exp. as Trooper) x Ln(Exp. with Current Law)
-0.0001 -0.0002 -0.0014 -0.0014 -0.0014 -0.0014
[0.0000134] [0.0000148]
[0.0000529] [0.0000555]
[0.0000529] [0.0000555] R2 0.272 0.434 0.273 0.437 0.281 0.444 0.287 0.435 0.288 0.436 N 148520 148520 96696 96696 96696 96696 51824 51824 51824 51824
Panel B: Laws used more than 200 times
Experience as Trooper
0.00526 0.0116 0.0591 -0.0096 0.113 0.00854 0.0997 0.0231 0.0947 0.0218
[0.00139] [0.00152] [0.0566] [0.00287] [0.0566] [0.00294] [0.0164] [0.00254] [0.0163] [0.00259]
Experience with Current Law
0.00915 0.0120 0.00495 0.0235 0.0343 0.0415 -0.00151 -0.00347 -0.00911 -0.00902
[0.00106] [0.00118] [0.00178] [0.00252] [0.00206] [0.00266] [0.00136] [0.00133] [0.00289] [0.00207] Ln(Exp. as Trooper) x Ln(Exp. with Current Law)
-0.0002 -0.0003 -0.002 -0.002 0.00015 0.00013
[0.0000236] [0.0000257]
[0.0000978] [0.000103]
[0.0000433] [0.0000370] R2 0.453 0.631 0.45 0.629 0.455 0.634 0.476 0.638 0.476 0.638 N 148520 148520 96696 96696 96696 96696 51824 51824 51824 51824 Law x Vintage Fixed Effects x x x x x x x x x x
Trooper x Law Fixed Effects x x x x x
Standard errors in brackets allow for two-way clustering at Law (g = 286) and Trooper level (k = 152). All regressions include controls for Ln(Region Population), the fraction of the population that are males between 18 and 24 years old, and Ln(Vehicle Crashes) along with trooper, law, and semester fixed effects. = p 0.10 , = p < 0.05 , = p < 0.01

70
Table B7b: Alternate Specifications of General and Task-Specific Experience and Productivity for Idaho State Troopers by General Experience During Night Time Hours, 2002-2009
All Junior (n=350,064) Senior (n=187,616)
Panel A: Linear Probability Model
(1) (2) (3) (4) (5) (6) (7) (8) (9) (10)
Experience as Trooper
-5.1E-05 0.00238 0.0576 -0.0072 0.0748 -0.00144 -0.0053 0.00540 -0.00737 0.00471
[0.000539] [0.000672] [0.0263] [0.00186] [0.0263] [0.00189] [0.00486] [0.00104] [0.00489] [0.00107]
Experience with Current Law
0.00326 0.00395 0.00261 0.0115 0.0121 0.0172 0.000355 -0.00140 -0.00277 -0.0043
[0.000422] [0.000544] [0.000941] [0.00178] [0.00102] [0.00181] [0.000512] [0.000644] [0.000937] [0.000888] Ln(Exp. as Trooper) x Ln(Exp. with Current Law)
-0.0001 -0.0001 -0.0001 -0.0001 -0.0001 -0.0001
[0.0000092] [0.0000097]
[0.0000092] [0.0000097]
[0.0000092] [0.0000097] R2 0.247 0.398 0.254 0.41 0.258 0.413 0.244 0.375 0.244 0.375 N 148520 148520 96696 96696 96696 96696 51824 51824 51824 51824
Panel B: Laws used more than 200 times
Experience as Trooper
-0.00057 0.00173 0.0519 -0.0100 0.0738 -0.00275 -0.0160 0.00552 -0.0185 0.00459
[0.000665] [0.000778] [0.0305] [0.00238] [0.0306] [0.00242] [0.00569] [0.00109] [0.00582] [0.00112]
Experience with Current Law
0.00432 0.00472 0.00334 0.0141 0.0154 0.0212 0.000546 -0.00131 -0.00333 -0.0052
[0.000645] [0.000631] [0.00141] [0.00226] [0.00144] [0.00230] [0.000915] [0.000527] [0.00180] [0.000996] Ln(Exp. as Trooper) x Ln(Exp. with Current Law)
-0.00008 -0.0001 -0.0001 -0.0001 -0.0001 -0.0001
[0.0000128] [0.0000133]
[0.0000128] [0.0000133]
[0.0000128] [0.0000133] R2 0.358 0.548 0.367 0.557 0.37 0.56 0.352 0.525 0.353 0.526 N 148520 148520 96696 96696 96696 96696 51824 51824 51824 51824 Law x Vintage Fixed Effects x x x x x x x x x x
Trooper x Law Fixed Effects x x x x x
Standard errors in brackets allow for two-way clustering at Law (g = 286) and Trooper level (k = 152). All regressions include controls for Ln(Region Population), the fraction of the population that are males between 18 and 24 years old, and Ln(Vehicle Crashes) along with trooper, law, and semester fixed effects. = p 0.10 , = p < 0.05 , = p < 0.01