Embed Size (px)
Citation preview
Learning in Cycles
SCOTT F. ROCKART
KRISTIN WILSON*
Kenan-Flagler Business School
University of North Carolina at Chapel Hill
McColl 4605
Chapel Hill, NC 27599
[email protected], [email protected]
Abstract
Organizations face a key learning challenge in dynamic environments: the contexts in which experience is gained will not always match the contexts in which experience must be applied. This challenge has been investigated largely in terms of its effect on firm performance in progressive environments, or environments where change increasingly invalidates the lessons gleaned from prior experience. A great deal of environmental dynamism, however, involves cyclical change where firms not only are at risk of misapplying lessons from dissimilar contexts but also have an opportunity to reapply behavior learned previously in similar contexts. We argue that the ability of organizations to match prior learned behaviors to current context may be heavily influenced by the particular cyclical patterns in which experience was accumulated. Some patterns of cyclical change provide firms with a greater awareness of context, contextual change and the context-specificity of learned behaviors. In this paper, we look at how the frequency with which contexts change, the length of time spent in specific contexts, and the intensity of activity in different contexts influences the ability of organizations to match the lessons of experience to the demands of their current environment. We test this theory in the context of cyclical real estate lending performance at commercial banks using a panel of data over nearly 40 years of local real estate cycles.
DRAFT – PLEASE DO NOT CITE OR CIRCULATE WITHOUT PERMISSION
… organizational action is driven by matching appropriate behavior to situations…. -
March J, Simon H. 1958
Introduction Organizations face a key learning challenge in dynamic environments: the contexts in which experience is gained will not always match the contexts in which experience must be applied. This challenge has been investigated largely in terms of its effect on firm performance in progressive environments, environments where change increasingly invalidates the lessons gleaned from prior experience. A great deal of environmental dynamism, however, involves cyclical change where firms not only are at risk of misapplying lessons from dissimilar contexts but also have an opportunity to reapply behavior learned previously in similar contexts. We argue that the ability of organizations to match prior learned behaviors to current context may be heavily influenced by the particular cyclical patterns in which experience was accumulated. Some patterns of cyclical change provide firms with a greater awareness of context, contextual change and the context-specificity of learned behaviors. In this paper, we look at how the frequency with which contexts change, the length of time spent in specific contexts, and the intensity of activity in different contexts influences the ability of organizations to match the lessons of experience to the demands of their current environment.
Experience can be tremendously beneficial to organizations. Early studies documented the dramatic improvements that firms make in productivity as they gain experience (Wright, 1936). Recognition of the importance of improvements associated with learning led to a rich stream of studies identifying contextual factors and organizational properties that accelerate or extend the learning process and a host of studies exploring the managerial and strategic implications of learning from experience (Argote, 2012; Fudenberg & Tirole, 1983; Lieberman, 1987).
The lessons from experience, however, are often context specific in ways that are not apparent to the learner as the changes in context may be rare, hidden, or have effects that are subtle and complex (Henderson, 1993; Oliva & Sterman, 2001). While prior studies have shown ample evidence of failure by experienced firms in response to environmental change, we know far less about when and how organizations develop the ability to match learned behaviors with the needs of the current situation successfully.
In this paper, we argue that one key to understanding when organizational abilities to match behavior to context will develop is to recognize that contextual change often occurs in cycles. By cycles we refer to environmental changes that involve transitions among a limited set of environmental conditions. While scholars have focused on identifying the risks of misapplying experience after a progressive environmental change, little has been done to understand when and how organizations learn to reapply experience successfully when contexts repeat. Unlike purely progressive change, where changes involve
new conditions never before encountered, change that occurs in cycles provides firms with an opportunity to call on behaviors developed in earlier similar conditions (Dosi, 1982).
While some implications of cycles are independent of the pattern of the cycle (i.e., that prior experience in similar contexts is more valuable than prior experience in dissimilar contexts) other implications require a more careful look at the timing and other elements of the patterns that these cycles take. Cycles vary (are patterned) along many dimensions. In this paper, we begin an exploration of these patterns focusing on a few dimensions closely aligned to prior research on factors affecting both individual and organizational learning, specifically: the frequency of changes across contexts; the length of time spent in each context; and the intensity of activity within each context. While these dimensions do not represent all possible ways of looking at patterns, they do provide a partition of organizational experience that leverages prior research in a particularly precise way as the total experience in each context is the product of the average time spent in that context when it appears, the intensity of activity during that time, and the number of times the context has been encountered.
Without arguing that other patterns may not be worth exploration, prior research on individual and organizational learning suggests that these specific temporal patterns of change as likely to substantially influence the development of an organization’s ability to develop, retain, and accurately match behaviors learned through experience to the demands of a changing context. We draw on prior lessons about the role of variety and the temporal patterns over which variety occurs to develop specific predictions and a broader theory about learning in cycles in which the frequency of change across contexts, the length time spent within each context, and the intensity of activity in a context all affect the ability of the organization to match behaviors with contexts.
We test predictions from the theory using data on real-estate construction lending, a setting where both national and local economic conditions cause contextual changes that are substantial enough that we find experience leads to higher performance in subsequent similar phases (upturns and downturns in real estate demand) and lower performance in subsequent dissimilar phases. Looking more carefully at the patterns of cycles and subsequent patterns of experience, we find little evidence that the length of time spent within one context has an effect on organizational performance in subsequent dissimilar contexts. Instead, we find that more intense activity in a context leads to lower performance in subsequent dissimilar contexts while more frequent changes across contexts leads to higher subsequent performance. The theory and findings contribute to our understanding of factors influencing organizations’ abilities to match behaviors to context and deepen our understanding of when learning from experience is both most beneficial and most risky.
Cyclical patterns While the processes and effects of experiential learning have been studied extensively in settings where the context is stable, often due to short study periods or organizational buffering of core processes from environmental change, over the long term all organizations operate in dynamic environments (Thompson, 1967; Wright, 1936). Some of the dynamics of environments involve progressive changes, such as changes driven by scientific advances, which make the present increasingly unlike any prior environment challenging firms to reject old behaviors and develop new ones (Dosi, 1982; Henderson & Clark, 1990). Other environmental dynamics are cyclical, where a change away from current conditions involves a
return to prior conditions. Unlike progressive environments, cyclical environments allow organizations to change by recycling behaviors that were learned in similar prior periods (Hannan & Freeman, 1977b).
We argue that the success of this recycling process, where prior learned behaviors are called on meet current demands as conditions recur, may depend on the pattern through which experience is gained. The nature of patterned change may best be illustrated with businesses such as bars and restaurants. The amount and nature of activity at many restaurants changes dramatically over the course of a week as both the number of patrons and their behavior (e.g., length of stay, consumption of alcohol relative to food, and the timing of arrivals and departures) varies with the day of the week. Changes in the amount and nature of the activity between weekdays and weekends (to oversimplify for the sake of brevity) lead to changes in demands on staffing levels, staffing composition, and rewards to specific behaviors engaged in by staff members (e.g., the value of service speed relative to personal interaction with patrons). The pattern of this cycle picks up on dimensions such as clarity as which context is dominant (the timing of these changes is relatively predictable due to clear calendar cues), differences in period length with weekday contexts lasting longer than weekend contexts, differences in period intensity with weekends involving (for most establishments) considerably greater activity, and change frequency with rapid (intra-weekly) transitions between contexts.
While the weekly cycle of activity for restaurants may provide one convenient illustration of the patterns, the existence of cycles is certainly widespread. Many industries are influenced by idiosyncratic cycles such as the cycles in tastes that influence the fashion industry. All sectors of the economy are subject to the influence of economic cycles, the most commonly discussed of which is the rise and fall of activity over the course of the business cycle, with upstream and durable goods sectors most profoundly affected. Although the nominal products and services that firms supply to the market may remain the same across market upturns and downturns, shifts between these phases are often accompanied by a host of broader changes in the determinants of market success, including changes in production costs, competitive intensity, market power, key activities, and financial risks (Mascarenhas & Aaker, 1989). For example, as demand increases during upturns, firms often face supply shortages and operational capacity constraints that they rarely encounter during downturns. Managing these upturn-specific constraints may require skills and routines that emphasize supplier relationship management and strategic expansion of capacity. In contrast, during downturns, firms often face intensified competition for customers, underutilized resources, and greater exposure to credit risk. Managing these downturn-specific constraints may require skills and routines that emphasize customer retention, disciplined investment decisions, cost-cutting and risk management. In short, in order to succeed in both upturn and downturn phases of a market, cyclical markets demand that organizations acquire distinct sets of skills, knowledge, technology, and organizational properties to operate in either
We argue that the effects of these cycles have always been latent in prior research on learning. Specifically, the core classical experience model treats all experience as identical with performance depending on total accumulated productive experience .1 For example, input costs (e.g., labor, materials, cost, time) per unit, , at any given period in time, , depends on accumulated experience
1 Many refinements have been made to this model over the years to understand how different kinds of experience affect the rate of learning, but it continues to provide the basic underpinning of learning studies.
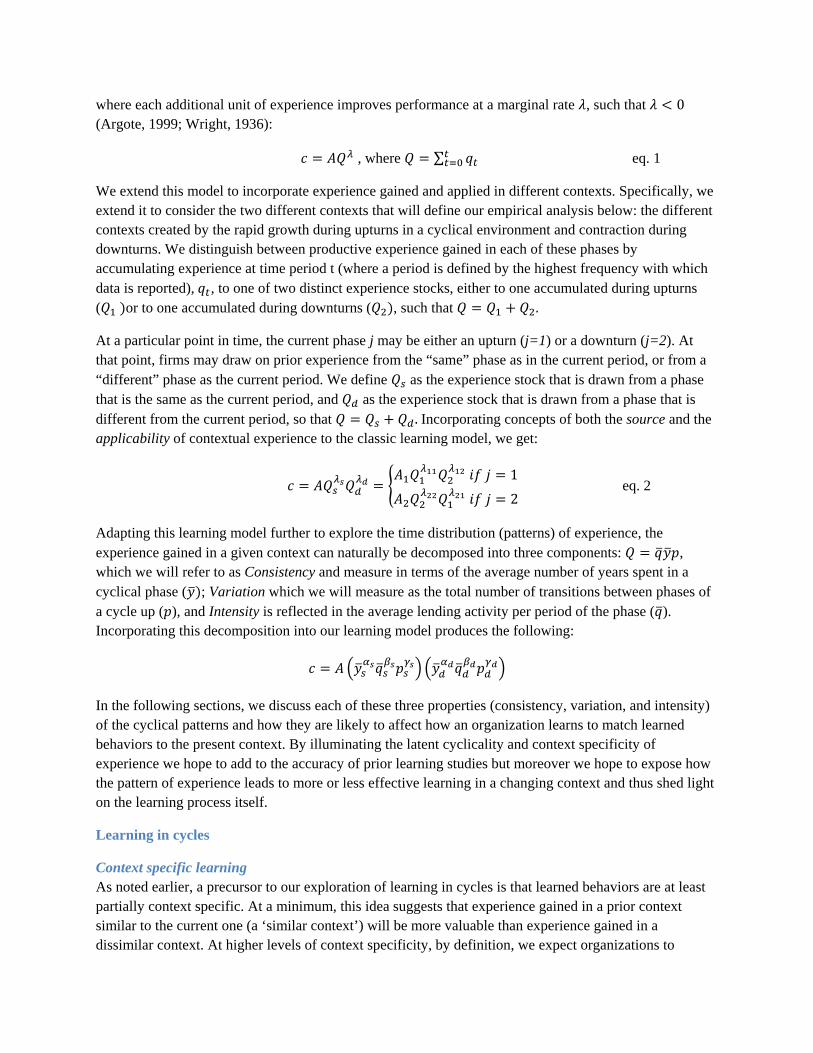
where each additional unit of experience improves performance at a marginal rate , such that 0 (Argote, 1999; Wright, 1936):
, where ∑ eq. 1
We extend this model to incorporate experience gained and applied in different contexts. Specifically, we extend it to consider the two different contexts that will define our empirical analysis below: the different contexts created by the rapid growth during upturns in a cyclical environment and contraction during downturns. We distinguish between productive experience gained in each of these phases by accumulating experience at time period t (where a period is defined by the highest frequency with which data is reported), , to one of two distinct experience stocks, either to one accumulated during upturns ( or to one accumulated during downturns ( , such that .
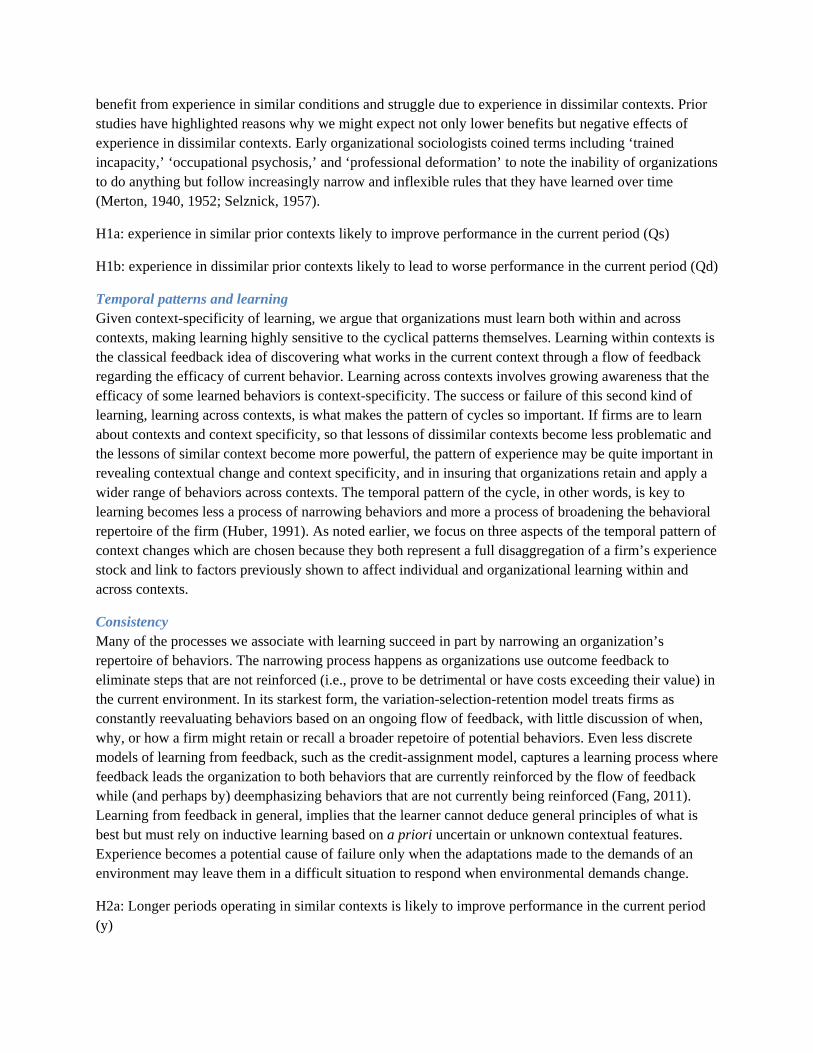
At a particular point in time, the current phase j may be either an upturn (j=1) or a downturn (j=2). At that point, firms may draw on prior experience from the “same” phase as in the current period, or from a “different” phase as the current period. We define as the experience stock that is drawn from a phase that is the same as the current period, and as the experience stock that is drawn from a phase that is different from the current period, so that .Incorporating concepts of both the source and the applicability of contextual experience to the classic learning model, we get:
1
2 eq. 2
Adapting this learning model further to explore the time distribution (patterns) of experience, the experience gained in a given context can naturally be decomposed into three components: , which we will refer to as Consistency and measure in terms of the average number of years spent in a cyclical phase ( ; Variation which we will measure as the total number of transitions between phases of a cycle up ( ), and Intensity is reflected in the average lending activity per period of the phase ( ). Incorporating this decomposition into our learning model produces the following:
In the following sections, we discuss each of these three properties (consistency, variation, and intensity) of the cyclical patterns and how they are likely to affect how an organization learns to match learned behaviors to the present context. By illuminating the latent cyclicality and context specificity of experience we hope to add to the accuracy of prior learning studies but moreover we hope to expose how the pattern of experience leads to more or less effective learning in a changing context and thus shed light on the learning process itself.
Learning in cycles
Context specific learning As noted earlier, a precursor to our exploration of learning in cycles is that learned behaviors are at least partially context specific. At a minimum, this idea suggests that experience gained in a prior context similar to the current one (a ‘similar context’) will be more valuable than experience gained in a dissimilar context. At higher levels of context specificity, by definition, we expect organizations to
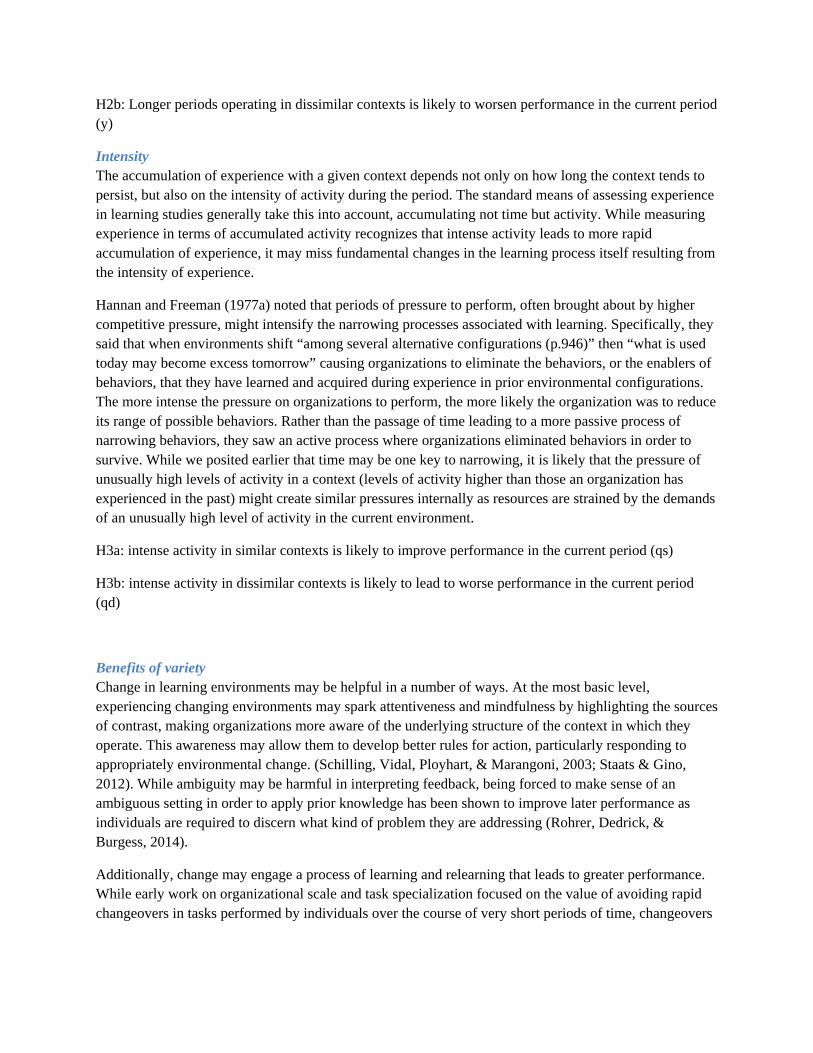
benefit from experience in similar conditions and struggle due to experience in dissimilar contexts. Prior studies have highlighted reasons why we might expect not only lower benefits but negative effects of experience in dissimilar contexts. Early organizational sociologists coined terms including ‘trained incapacity,’ ‘occupational psychosis,’ and ‘professional deformation’ to note the inability of organizations to do anything but follow increasingly narrow and inflexible rules that they have learned over time (Merton, 1940, 1952; Selznick, 1957).
H1a: experience in similar prior contexts likely to improve performance in the current period (Qs)
H1b: experience in dissimilar prior contexts likely to lead to worse performance in the current period (Qd)
Temporal patterns and learning Given context-specificity of learning, we argue that organizations must learn both within and across contexts, making learning highly sensitive to the cyclical patterns themselves. Learning within contexts is the classical feedback idea of discovering what works in the current context through a flow of feedback regarding the efficacy of current behavior. Learning across contexts involves growing awareness that the efficacy of some learned behaviors is context-specificity. The success or failure of this second kind of learning, learning across contexts, is what makes the pattern of cycles so important. If firms are to learn about contexts and context specificity, so that lessons of dissimilar contexts become less problematic and the lessons of similar context become more powerful, the pattern of experience may be quite important in revealing contextual change and context specificity, and in insuring that organizations retain and apply a wider range of behaviors across contexts. The temporal pattern of the cycle, in other words, is key to learning becomes less a process of narrowing behaviors and more a process of broadening the behavioral repertoire of the firm (Huber, 1991). As noted earlier, we focus on three aspects of the temporal pattern of context changes which are chosen because they both represent a full disaggregation of a firm’s experience stock and link to factors previously shown to affect individual and organizational learning within and across contexts.
Consistency Many of the processes we associate with learning succeed in part by narrowing an organization’s repertoire of behaviors. The narrowing process happens as organizations use outcome feedback to eliminate steps that are not reinforced (i.e., prove to be detrimental or have costs exceeding their value) in the current environment. In its starkest form, the variation-selection-retention model treats firms as constantly reevaluating behaviors based on an ongoing flow of feedback, with little discussion of when, why, or how a firm might retain or recall a broader repetoire of potential behaviors. Even less discrete models of learning from feedback, such as the credit-assignment model, captures a learning process where feedback leads the organization to both behaviors that are currently reinforced by the flow of feedback while (and perhaps by) deemphasizing behaviors that are not currently being reinforced (Fang, 2011). Learning from feedback in general, implies that the learner cannot deduce general principles of what is best but must rely on inductive learning based on a priori uncertain or unknown contextual features. Experience becomes a potential cause of failure only when the adaptations made to the demands of an environment may leave them in a difficult situation to respond when environmental demands change.
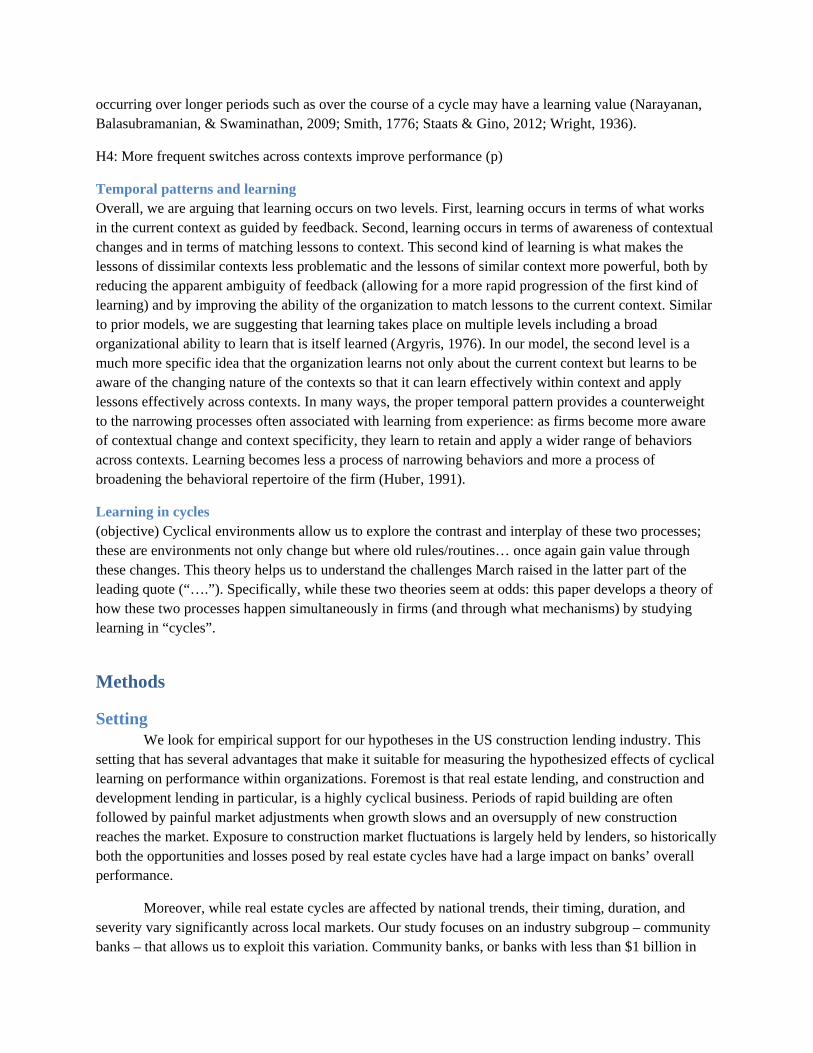
H2a: Longer periods operating in similar contexts is likely to improve performance in the current period (y)
H2b: Longer periods operating in dissimilar contexts is likely to worsen performance in the current period (y)
Intensity The accumulation of experience with a given context depends not only on how long the context tends to persist, but also on the intensity of activity during the period. The standard means of assessing experience in learning studies generally take this into account, accumulating not time but activity. While measuring experience in terms of accumulated activity recognizes that intense activity leads to more rapid accumulation of experience, it may miss fundamental changes in the learning process itself resulting from the intensity of experience.
Hannan and Freeman (1977a) noted that periods of pressure to perform, often brought about by higher competitive pressure, might intensify the narrowing processes associated with learning. Specifically, they said that when environments shift “among several alternative configurations (p.946)” then “what is used today may become excess tomorrow” causing organizations to eliminate the behaviors, or the enablers of behaviors, that they have learned and acquired during experience in prior environmental configurations. The more intense the pressure on organizations to perform, the more likely the organization was to reduce its range of possible behaviors. Rather than the passage of time leading to a more passive process of narrowing behaviors, they saw an active process where organizations eliminated behaviors in order to survive. While we posited earlier that time may be one key to narrowing, it is likely that the pressure of unusually high levels of activity in a context (levels of activity higher than those an organization has experienced in the past) might create similar pressures internally as resources are strained by the demands of an unusually high level of activity in the current environment.
H3a: intense activity in similar contexts is likely to improve performance in the current period (qs)
H3b: intense activity in dissimilar contexts is likely to lead to worse performance in the current period (qd)
Benefits of variety Change in learning environments may be helpful in a number of ways. At the most basic level, experiencing changing environments may spark attentiveness and mindfulness by highlighting the sources of contrast, making organizations more aware of the underlying structure of the context in which they operate. This awareness may allow them to develop better rules for action, particularly responding to appropriately environmental change. (Schilling, Vidal, Ployhart, & Marangoni, 2003; Staats & Gino, 2012). While ambiguity may be harmful in interpreting feedback, being forced to make sense of an ambiguous setting in order to apply prior knowledge has been shown to improve later performance as individuals are required to discern what kind of problem they are addressing (Rohrer, Dedrick, & Burgess, 2014).
Additionally, change may engage a process of learning and relearning that leads to greater performance. While early work on organizational scale and task specialization focused on the value of avoiding rapid changeovers in tasks performed by individuals over the course of very short periods of time, changeovers
occurring over longer periods such as over the course of a cycle may have a learning value (Narayanan, Balasubramanian, & Swaminathan, 2009; Smith, 1776; Staats & Gino, 2012; Wright, 1936).
H4: More frequent switches across contexts improve performance (p)
Temporal patterns and learning Overall, we are arguing that learning occurs on two levels. First, learning occurs in terms of what works in the current context as guided by feedback. Second, learning occurs in terms of awareness of contextual changes and in terms of matching lessons to context. This second kind of learning is what makes the lessons of dissimilar contexts less problematic and the lessons of similar context more powerful, both by reducing the apparent ambiguity of feedback (allowing for a more rapid progression of the first kind of learning) and by improving the ability of the organization to match lessons to the current context. Similar to prior models, we are suggesting that learning takes place on multiple levels including a broad organizational ability to learn that is itself learned (Argyris, 1976). In our model, the second level is a much more specific idea that the organization learns not only about the current context but learns to be aware of the changing nature of the contexts so that it can learn effectively within context and apply lessons effectively across contexts. In many ways, the proper temporal pattern provides a counterweight to the narrowing processes often associated with learning from experience: as firms become more aware of contextual change and context specificity, they learn to retain and apply a wider range of behaviors across contexts. Learning becomes less a process of narrowing behaviors and more a process of broadening the behavioral repertoire of the firm (Huber, 1991).
Learning in cycles (objective) Cyclical environments allow us to explore the contrast and interplay of these two processes; these are environments not only change but where old rules/routines… once again gain value through these changes. This theory helps us to understand the challenges March raised in the latter part of the leading quote (“….”). Specifically, while these two theories seem at odds: this paper develops a theory of how these two processes happen simultaneously in firms (and through what mechanisms) by studying learning in “cycles”.
Methods
Setting We look for empirical support for our hypotheses in the US construction lending industry. This
setting that has several advantages that make it suitable for measuring the hypothesized effects of cyclical learning on performance within organizations. Foremost is that real estate lending, and construction and development lending in particular, is a highly cyclical business. Periods of rapid building are often followed by painful market adjustments when growth slows and an oversupply of new construction reaches the market. Exposure to construction market fluctuations is largely held by lenders, so historically both the opportunities and losses posed by real estate cycles have had a large impact on banks’ overall performance.
Moreover, while real estate cycles are affected by national trends, their timing, duration, and severity vary significantly across local markets. Our study focuses on an industry subgroup – community banks – that allows us to exploit this variation. Community banks, or banks with less than $1 billion in
assets, have traditionally capitalized on a comparative advantage in rich local knowledge and close project oversight by concentrating their activities within a single metropolitan area. This exposure to geographic variation in cycles allows us to explore performance differences among lenders that have accumulated distinct historical experiences in the construction market over time. At the same time, community banks are not systemically important enough to drive the cycles themselves, so we can interpret future shifts in the market to be exogenous to individual banks’ lending behavior. We should note that we benefit significantly from our panel data structure.
Construction loans as a product are particularly well-suited for analysis, as they present a relatively clean measure of banks’ most important productive task – the ability to asses and manage risk exposure. Construction loans are short-term– less than five years and generally much shorter –so performance feedback is rapid. They also typically require a balloon payment when the loan is called due, so performance outcomes are clearly reflected in their portfolio of delinquent (unpaid for at least 90 days) loans at the end of the loan term. These delinquent construction loans are a highly salient performance measure, because the underlying assets have little salvage value and short-term losses caused by write-offs can pose major liquidity problems for banks. From a measurement perspective, we also benefit from the fact that construction loans small and highly idiosyncratic so they remain unsyndicated, unsecuritized, and unhedged.
This study investigates whether experience helps banks reduce their volume of delinquent construction loans across both peaks and troughs of real estate cycles. Construction loans are complex, individualized project loans, so they require an immense amount of contextual, procedural knowledge about both the lending process and local market conditions. Banks with more experience have the potential to reduce loan delinquencies by identifying risks up front and by improving oversight over the life of a loan project. Experience may affect decision-making by individual loan officers, who have a deep knowledge of local real estate market conditions, exercise judgment in project underwriting and management, and maintain ongoing relationships with contractors, municipal decision-makers and customers. Experience may also affect organizational policies and procedures that shape the credit allocation process, underwriting requirements, and the structure of loan contracts.
More importantly, we expect that the nature of work required to build and manage a construction loan portfolio varies dramatically with cyclical upturns and downturns. In times of market expansion, excess demand and rapid growth increases the opacity surrounding the quality of building projects, particularly lenders’ ability to evaluate the complex set of project inputs such as contractors, materials and labor, so success depends largely on lenders’ ability to accurately anticipate the wide range of operational issues borrowers may face. These risks are numerous and may include failure of the contractor or a subcontractor to complete construction or complete to specifications; cost overruns due to unforeseen site conditions, weather, or input shortages; or even fraudulent draws on the line of credit (OCC, 2007). Success in upturns depends heavily on the detailed market knowledge, project management skills and external relationships that banks accumulate over time. Similarly, in times of market contraction, excess supply makes it difficult for borrowers to meet their contractual obligations, to roll over financing, or to find a buyer for their property, putting the bank at risk of significant losses. Downturns also degrade the value of the underlying land (collateral), increasing banks’ losses from failed loans, and making it more difficult to identify new profitable lending opportunities. Success in downturns depends largely on lenders’ ability to identify and resolve problems quickly, identify market-level risks, and cope with the
legal and administrative aspects of delinquent borrowers and distressed land sales. In sum, in line with our theoretical predictions, in the construction lending industry it is likely that lenders accumulate distinctly valuable context-specific abilities across different phases of the cycle.
Data Our database covers the entire population of banks engaged in construction lending from 1976
through the end of our sample in 2012, covering nearly 40 years and five US recessions as well as diverse dynamics in local real estate markets. This is a long window with which to estimate the role of accumulated experience with cycles on lending performance, and allows us to exploit the panel data structure to estimate within-firm learning rates and reduce concerns about firm-specific unobservables. Data on lending activity and market conditions were obtained from public U.S. government sources, including the FFIEC Call Reports (FDIC and Federal Reserve), the Building Permits Survey (Census), Local Area Unemployment Statistics (BLS).
To compose our sample, we identify “community banks” as all banks with less than $1 billion in assets.2 We drop credit card banks, agricultural banks, and banks located outside Metropolitan Statistical Areas (MSAs). Data on delinquent construction loans are available from 1991 onward, so our outcome sample covers banks’ annual delinquency rates between 1991 and 2012, based on lending experience accumulated as far back as 1976. While we cannot tie banks’ lending to their location directly, over 95% of the banks in our sample do not have a branch outside their MSA, so we assume banks’ headquarters and lending location is the same. All banks in our final sample have at least five years of data, at least one historical construction loan, and non-zero lending in the current period. Our final sample draws on data from 5,882 unique institutions, with an average size of $295 million in assets and about 6% of assets in construction lending. Over our time period, due to a number of regulatory and technological changes, the number of firms operating in the industry decreases by more than half while average asset size more than doubles.
Estimation To test our model of learning in cycles in the context of the US banking industry, we use a log
transformation of the learning model above:
, ∑ , , ,
In this model, , is the firm-specific construction loan delinquency rate in period t, and , is our
measure of firm-specific experience stocks from the relevant phases of the market (“same” or “different” from the current phase, drawn from “upturn” or “downturn” markets). To separate our experience measure from our performance outcome, this experience stock is measured five years prior to the current period in which loan performance is observed. , is a matrix of time-varying firm and market influences
on loan performance. We include firm-phase fixed effects to control for initial stocks of experience in each phase prior to 1976 and other unobserved time-invariant firm characteristics. We include year fixed effects for period-specific shocks that are common across firms. The construction of each of these variables is described below.
2 All nominal data series are converted to 2009 dollars using the BEA chain-weighted GDP deflator.
Performance. Our measure of loan performance , is the construction loan delinquency rate,
defined as the total stock of construction loans that have not been paid in over 90 days, divided by the stock of total construction loans. Delinquency rates are the most salient measure of loan performance reported by banks, and delinquencies tend to be particularly costly for construction lenders because aborted development projects are costly to resolve and have little salvage value. Delinquencies are a balance sheet measure, so we must account for existing stocks of delinquent loans , as an
independent variable as well.3 The year-over-year correlation in construction loan delinquency rates is 0.44 in our data. We do not log delinquency rates in our analysis because this there is a large number of (meaningful) zeroes on the left hand side.
Experience. , is the accumulated sum of annual construction loan balances from 1976 to the
present. Since the loan amounts reported on banks’ balance sheets may represent the same loan over multiple years, , is best interpreted as the cumulative annual experience managing a loan portfolio of
size q, rather than cumulative annual new loan commitments. This measure is consistent with both the labor involved in monitoring ongoing construction projects. Note that loans from all years are converted to 2009 dollars using the BEA’s GDP deflator.
One feature of lending markets is that although construction loans are relatively short-term, there is a lag between the period in which banks decide to extend a loan and the period in which a loan may be reported as delinquent. For construction loans, this can be up to five years, although it is generally one to two years, which requires us to account for a separation between the period through which experience is measured and the period in which performance is observed. To be conservative, we estimate the performance impact of stocks from 1976 up to period t-5 on period t. This ensures that our measures of performance and experience are separate, and that as firms transition between cyclical phases (from upturn to downturn and vice versa), our measure of experience is independent from the phase in which performance is measured.
Finally, note that we do not discount prior experience due to the decomposition techniques used below. In general estimation of discount rates improves model fit so our estimates are likely conservative. We discuss organizational forgetting in more detail below.
Context-specific experience measures. To test our hypotheses, we must first identify when banks’ lending context changes. We do this with a dichotomous indicator, Downturn, defined as a sudden negative shock to construction market demand: we take the worst 25% of declines in state-level construction permits from the Census Bureau4 relative to the size of the accumulated new permit stock over the prior ten years.5 Figure 1 shows the percent of the sample indicating a Downturn at any point in time between 1976 and 2012. Although there is very little variation in the ten year run-up to the Great Recession between 1996 and 2006, cyclical experience prior to 1996 varies significantly across
3 Due to the long time period and high turnover rate of delinquent loan stocks we do not anticipate problematic correlation between our lagged dependent variable and firm fixed effects, an issue discussed more explicitly below. See also: (Nickell, S., J. 1981. Biases in Dynamic Models with Fixed Effects. Econometrica, 49: 1417-1426.) 4 The Census Bureau’s Building Permits Survey collects the data on new residential housing construction authorized by local authorities. These numbers at the state level from 1965. http://www.census.gov/construction/bps/ 5 We identify this measure using a panel analysis of construction loan delinquency rates. We found that this measure and this breakpoint along its distribution (25%) is the best dichotomous measure of construction market performance among several candidate measures of construction market demand.

geographies for banks in our sample. Some banks have no experience in at least one of phase of the cycle, either because the market as a whole has not experienced such a phase, or because banks enter the market without such experience. Two percent of banks in the sample have had no lending experience during an upturn period while a third do not have lending experience during a downturn. When experience stocks are equal to zero, we set the log stocks equal to zero and include a dummy variable term for those zero stocks in the regression. Using this method of distinguish Downturn phases in a cyclical environment, we separate aggregate lending experience into experience accumulated during upturn periods, , and
experience accumulated during downturn periods, , such that . We log this measure, although our results are robust to a linear specification as well (see Table 4).
Table 1 summarizes experience stocks across upturns and downturns. Average construction lending experience at any point in time is $126 million per bank, on a base of $16 million per bank per year. Of this, the average bank has an experience stock of $103 million accumulated during upturns and $23 million accumulated during downturns. These differences reflect both lower lending demand during downturns and the fact that downturns, as defined above, make up only the worst 25% of periods.6 The logged values of these series, used in our empirical estimates, are reported on the right side of the table to aid in interpretation of our coefficients.
Our hypotheses about context specificity and negative transfer require us to make a distinction between the phase in which experience is acquired and the phase in which it is applied. To do so, we define:
0 1
1 0
So, for example, when current period t is an upturn, prior experience is drawn from upturn phases,
and prior experience is drawn from downturn phases. Since firms may learn at different rates during different cyclical phases (i.e., “same” experience gained during upturns may differ from “same” experience gained during downturns), we also present and discuss results showing the effect of and
on performance during upturns and vice versa.
We also expect the time distribution of experience to impact delinquency rates. Our learning model argues that the learning process in cycles can be modeled using a decomposition of experience, Q into the average length of time spent in a phase, ( average intensity of activity in that phase ( , and the
number of transitions (p across phases. In log form, this decomposition of in a particular phase is equal to:
Consistent with the approach outlined above, we define , , , according to the
relationship between the phase in which experience stocks are acquired and the conditions in the market in which they are applied. One general point is that because Hypothesis 4 (Variety) concerns the overall number of transitions between phases, rather than the marginal effects of transitions between different
6 If lending occurred at an even pace during high and low periods, the accumulation would be at a ratio of three to one rather than the observed ratio of four to one.

types of phases, we do not measure effects for each phase separately, and instead test the effect of total
transitions on performance ( + ).7 A second general point is that the variance we rely on is changes in cycle length and scale within firms and within phases (as is generally the case in learning studies), so our results on phase averages are driven by firms that experience changes in the average length of cyclical phase or average intensity within a phase.
Table 1 reports that average construction loan stocks per phase are both lower and more volatile during downturn phases. The average time spent in upturn phases is about 8 years, but ranges from 0 (no experience with upturns) to 32 years. The average time spent in downturn phases is around 3 years, but ranges from 0 to 9 years. Over our sample, the average bank has experienced about 3 switches between upturns and downturns, though some have experienced no switches and others as many as 9 switches (approximately one every 4 years).
Control variables. We use several additional controls to account for bank characteristics and market conditions that might affect loan performance. Bank-level controls include total bank assets (lnAssets), age (lnAge), and Tier 1 capital ratio (Capital Ratio), a measure of time-varying bank risk propensity. These metrics are derived from FFIEC Call Reports. A higher Tier 1 capital ratio represents lower risk. Market-level controls include changes in building permit authorizations (Building Permits change) from state-level Census data, and changes in unemployment (Unemployment rate) from county-level BLS data. Our measure of building permits change is the same used to construct our indicator of economic downturn: annual permit requests over the ten year rolling average of prior permits.
We also include but do not report the size of banks’ construction loan balances in each year in year t through t-4, which we call “vintage loan controls”. Loan stocks reported in period t (Construction loans t ) are associated with lower delinquency rates because they increase the total loan pool without increasing the delinquent pool, while loan stocks reported in periods t-1 through t-4 (Construction loans t-1… ) are associated with higher delinquency rates (conditional on period t levels) because these are the vintage that is reported as delinquent.
Table 2 provides summary statistics and partial correlations across these variables. Correlations among variables are small and in the expected direction. Banks’ average delinquency rates on construction loans are around 3% over this sample, although annual average rates fluctuate from less than 1% in the during the best times, such as the early 2000s in most American cities, to as high as 10% during the worst times which were the Great Recession of 2008-10. The average community bank has around a quarter of a billion dollars in assets, about $16 million dollars in construction loans outstanding, about ten percent Tier 1 capital (regulatory requirements consider banks well-capitalized over six percent), and is about 40 years old. Note that the amount of construction loans a bank has outstanding at a given time is correlated with their cumulative lending, and banks’ stocks of lending in upturns and downturns is positively correlated, indicating that banks who participate in this line of business do so systematically. Bank size on average is a good predictor of construction lending.
7 It is worth noting that the interpretation of the coefficient on each of these included in the regression separately would be correctly interpreted as the marginal effect of an increase in conditional on . Since, by construction, is bounded between -1 and 1, including these terms separately will not give us a meaningful estimate of how exposure to multiple phases impacts performance.
Results Table 3 provides our basic model of construction loan delinquency rates at banks. Models 1 and 2
are pooled OLS models, while the following models include firm or firm-phase fixed effects. Keeping in mind that positive coefficients represent higher delinquency rates, an detrimental outcome for firms, coefficient estimates for the control variables are as we would expect and generally consistent across models. Prior year delinquency rates predict higher current delinquency rates, reflecting the partial carryover of performing and delinquent loans from one period to the next. 8 A larger base of total assets and are associated with lower delinquency rates, consistent with a degree of scale advantages in loan evaluation and management. In pooled models, age does not have a large effect on loan delinquencies, and is weakly negative. In firm fixed effects Model 3, conditional on the quantity of construction lending experience, increasing age is associated with higher delinquency rates, although the economic significance is relatively small due to the small changes in average age for firms during the period. Firms holding more Tier 1 capital generally have a lower delinquency rate, reflecting a more cautious approach to lending. Finally, as expected, delinquency rates are lower when building permit authorizations increase, reflecting strong real estate market demand, and are higher when unemployment rises.
Our logged measure of aggregate construction lending experience, is introduced in Model 2, and Model 3 shifts the estimation from a pooled model to a fixed-effects (within-bank) specification. Model 2 suggest that aggregate experience is associated with higher delinquency rates across banks overall, but Model 3 shows that this positive association is better explained by experience differences between firms with higher delinquency rates, rather than a causal effect of accumulated experience. After controlling for unobserved differences across banks, experience has no clear effect on delinquency rates. This result may be due to the fact that our sample includes primarily established banks for which the “universal” value of learning from lending has saturated, but it may also reflect a broader need for a more refined evaluation of context-dependent experience in cyclical markets.
Models 4 and 5 begin to offer just such an evaluation by distinguishing between the quantity of experience that firms have acquired under similar market conditions, , and the quantity of
experience that firms have acquired under contrasting market conditions, . Models 4 and 5 also include firm-phase specific fixed effects, so coefficients in these columns are interpreted as the marginal value of an increase in experience within either phase. Note that our adjusted R-squared (within) for this model is substantially lower after including firm-phase fixed effects, due to the fact that time-varying factors such as unemployment explain a good deal of the variation between upturn and downturn phases within firm more efficiently than fixed effects. However, because this model allows for different firm-specific starting points and unobserved time invariant firm-specific capabilities, we get better estimates of the impact of phase-specific experience stocks on delinquency rates.
Model 4 allows us to directly test Hypotheses 1a and 1b. In support of Hypothesis 1a, within a particular firm, experience accumulated under similar market conditions to those in which the experience is applied contributes to significant performance improvements. In support of Hypothesis 1b, experience accumulated under contrasting market conditions to those in which the experience is applied is
8Importantly, the coefficient estimate on the lagged dependent variable shows almost no change from the pooled to the fixed effects models. This confirms that, as a result of the relatively long time series in this panel, any effect of dynamic model bias is negligible.
detrimental to performance. These effects are economically significant; a firm that has accumulated an experience stock that is one standard deviation higher (about 1.75 in log values) is likely to lower within-phase delinquency rates by about 0.5 percent in a subsequent downturn (a substantial drop considering that average delinquency rates are less than 3 percent). On the other hand, the same unit of experience acquired in a different market phase is likely to increase delinquency rates by a similar amount, leading to the net zero effect of experience on average.
Model 5 provides more insight into how the process by which experience is acquired over time affects performance. In support of Hypothesis 2a, we find that longer time periods spent in similar phases improve performance, although time spent in contrasting phases does not hurt performance (Hypothesis 2b). In support of Hypothesis 3a, the intensity of activity in similar phases, conditional on the time spent in those phases, helps improve performance. In support of Hypothesis 3b, the volume of activity performed during contrasting phases is detrimental to performance, with a coefficient nearly twice the size of the effect of similar experience. An increase of one standard deviation in the average annual quantity of lending leads to a lower delinquency rate by approximately 0.25 in future years if that experience is applied in a similar phase, but a higher delinquency rate of 0.5 in future years of that experience is applied in a contrasting phase. Finally, in support of Hypothesis 4, conditional on the volume and length of activity, transitioning between cyclical phases is quite beneficial to firms. A firm with 3 prior cyclical transitions has an average of 1 percent lower delinquency rates, while a firm with 8 prior transitions has an average of 2 percent lower delinquency rates.
Robustness The results in Table 3 are consistent with each of our hypotheses about the value of context-
specific experience and the risk of negative transfer across cyclical phases. In this section, we consider the robustness of our results to our specification choices, measures, and sample attributes. Table 4 presents some alternative specifications.
Phase symmetry. First, we consider whether learning rates are symmetric across upturn and downturn phases. There are two reasons this might be the case, one empirical and one theoretical. From a measurement perspective, loan delinquency rates are a one-tailed measure of lending performance, as lenders only receive feedback about non-payment, so the quality of feedback banks receive may be higher in phases (downturns) where delinquency rates are higher. From a behavioral perspective, there is also a reason to believe firms learn differently from the failures associated with downturns than the successes associated with upturns (Sitkin, 1992).
To explore this issue we report the effect of upturn and downturn stocks separately in Table 4. Model 1 shows that, absent knowledge the context in which this experience is applied, simply attributing experience to stocks acquired during Upturn and Downturn phases does not explain variance in delinquency rates over time. Model 2 illustrates this clearly: we show the value of experience in both upturns and downturns are valuable when applied in similar contexts, but detrimental when applied in a contrasting context. The direction of the coefficients across the two stocks is consistent, although a t-test on the value of the coefficients shows that downturn experience is more beneficial on average than upturn experience, and upturn experience is significantly more problematic in downturn periods. We elaborate on the broader implications for these estimates in the discussion section below.
Zero values for experience. Because there is a significant number of firm-year observations for which we do not observe any lending history during a particular phase, our regressions include a shift
parameter for experience stocks equal to zero, while is set equal to zero for those values. This large number of zeros could result in biased estimate of the marginal effect of experience if the effect of an increase over zero is appreciably different from the effect of the average unit increase of experience. Model 3 excludes observations for which firms have zero experience in one of the market phases. The results show that our estimates are larger and more precise when we exclude banks with no existing experience in one of the phases. Thus, including these zeros in our estimates is conservative in the sense that it leads us to underestimate the value of non-zero experience.
A different approach to improve our estimates of the effect of zero history is to use a linear
specification for experience stocks. Our model assumes that learning rates decrease with Q but
are undefined at zero. The alternative exponential model ( assumes a constant learning rate with each additional unit of production, and may be appropriate for settings, like ours, where initial stocks are not observed (Levy, 1965). We test an exponential (linearized) specification in Model 4, and the results are similar in significance, direction and magnitude to the results reported in Model 2. Ultimately, we use the log form as our primary specification because this allows for an easy “decomposition” of the learning rates into their constituent parts.
Unobserved differences in outcomes. A different concern with our estimates may be the large number of (meaningful) zero values in our dependent variable. Zero values for delinquency rates may be problematic because we cannot observe the underlying repayment risk associated with non-delinquent loans, despite the fact that these loans may be of varying quality. One way to assess the magnitude of this problem is to treat the underlying probability of a loan “performing” as continuous but truncated at zero. If this is the case, fixed-effects Tobit estimation is more appropriate than a linear model (Honoré, 1992). Model 5 shows that if we treat zero-values as truncated, our baseline Model 2 actually dramatically underestimates the effect of experience on learning rates, particularly in upturn periods where we are less likely to observe true variance in delinquency rates. Again, this suggests that our baseline estimates are quite conservative. However, a caveat for relying on these much larger estimates is that it is not clear that this non-linear estimation model relies on the correct assumptions about the generating process for our data either. Bank managers are certainly aware that loans only become a problem if non-payment risk crosses a particular threshold, and with the added moral hazard of deposit insurance, banks may actually be indifferent about making or allocating resources toward loans of varying quality that as long as those loans are still “performing”. Thus, we believe he true coefficient estimates are likely larger than those presented in Model 2 and smaller than those presented in Model 5.
Forgetting. The learning literature has a rich history of exploring the dynamics of knowledge stocks over time, and most models in this tradition either assume or estimates rates of depreciation associated with experience stocks. We do not depreciate our experience stocks in our primary model for reasons that are discussed in more detail below, but Models 6, 7 and 8 show that our results are robust, if less precisely estimated, to annual depreciation rates of 5%, 10% and 25%. It is reassuring to see that the results get weaker with higher depreciation rates, as it implies that the long historical loan experience between 1976 and 1996, which includes much of the interesting variance in our sample, is likely driving our results, rather than more recent lending levels.
Sample attrition. A final concern is that our results may be influenced by sample attrition. Indeed, exit is significant in our sample as there are only half as many firms in 2012 as in 1991. Attrition may be particularly problematic for our estimates of the effect of cyclical transitions p on performance because average cycle length and loan scale are not likely to vary systematically with sample exit, but if some underlying characteristic makes firms both less likely to exit and have higher delinquency rates, we may spuriously attribute this unobserved quality to experience with market transitions p.
To test whether sample attrition bias affects our results more formally, we perform a test suggested by Wooldridge (2010) which involves the inclusion of a selection dummy in our primary equation that is equal to one period(s) prior to exit. This analysis indicates that future exit is not associated with significantly higher delinquency levels, which indicates that attrition bias is not a problem in our sample. This could be because construction lending is not most banks’ primary line of business (90% of banks limit construction exposure to than 10% of assets), so the factors influencing sample exit in this industry more likely technological and regulatory changes rather than performance in the construction lending business specifically.
Discussion Evidence from the construction loan industry supports the idea that cycles result in learning that
is context dependent and subject to negative transfer from unrelated experience over time. These findings are similar to conventional wisdom about experience in progressive markets: experience is most valuable when it is applied in similar market environments, and can be harmful otherwise (Table 3). This phase-contingent value of experience is primarily explained by the intensity with which firms pursue an activity within a phase, rather than the amount of time spent in that phase (Table 3). While the value of similar learning rises with longer stretches of similar time periods, it does not appear to harm performance in contrasting periods. Further, the detrimental effects of experience from different contexts are particularly obvious when upturn experience is applied in downturn markets (Table 4). Despite the contextualized nature of learning, the variety provided by cyclical transitions is extremely beneficial to firms: firms that have experienced more transitions between market phases are likely to perform better in both up and down periods of the cycle. This may indicate that while similarity of experiential and applied context is important for organizational performance, organizations, like individual learners, appear to benefit from distributed learning over time, allowing for periods of forgetting and relearning. It may also indicate that a key to becoming temporal generalists is frequent exposure to contrasting contexts, offsetting the negative transfer that otherwise occurs across settings.
Our research setting, construction lending by community banks, has key advantages for our study, including the fact that construction lending is a highly cyclical activity, that community banks operate locally, and that there is substantial variation in the timing and frequency of cyclical upturns and downturns across local markets over a long panel of data. As with any study our findings are shaped by the features of cyclical environments we choose to emphasize or omit, and by features of our empirical setting. It is worth mentioning how several features of our setting also limit how broadly we can interpret our findings.
First, one important feature of our setting is that we observe the impact of cyclical experience on performance in a market in which oscillation is essentially exogenous. This is beneficial from the
perspective of identification, but it does not help us understand the strategies firms may employ to manage their exposure to cyclical environments, or the contingencies that affect firm-specific performance. At least with respect to cyclical duration and transition, we are essentially measuring a market-level phenomenon. Further studies may examine how firms with substantial market power influence cyclical dynamics through learning.
Another important feature of our setting is that regulatory oversight (or managerial prudence) limits excessive exposure to construction lending within banks’ overall portfolios – ninety percent of banks have less than ten percent of their assets devoted to construction lending. This has important implications for our study. First, unlike the population dynamics predicted by organizational ecologists (Hannan & Freeman, 1977b), firms in our sample survive across cyclical booms and busts, and thus have the potential to learn from their environment. As discussed above, survival rates are not predicted by construction market performance. One conclusion to draw from this feature of our setting is that survival-enhancing strategies such as diversification may be a pre-condition for learning in cyclical markets.
Our measure of performance, delinquency rates, also has a substantial impact on our findings. Broadly, delinquency rates are best interpreted as a measure of productive efficiency, and measure banks’ success within a single line of business. They do not speak to banks’ abilities to identify and pursue value-creating opportunities either in the construction lending business or in related markets. Future research in a different setting may explore whether the efficiencies that accompany repeated cyclical transitions is associated with a shift in the way firms approach the value that they provide their customers.
Finally, our theory leads us to operationalize experience stocks as discrete, exclusive episodes of learning about the demands of each market phase. While this approach allows us to estimate a relatively simple and intuitive model, it masks the potential importance of several other features of cycles. For example, we do not observe or attempt to estimate the value of knowledge that is universal across market phases, rather than context-specific. Our dichotomous measure also does not allow us to estimate how the slope (or severity) of change in the cyclical environments impacts firms’ ability to learn, nor how quickly firms are able to adapt within phases. These are all interesting areas for future research.
One important question that we do not explore explicitly in this paper is the role of “forgetting” in cycles. While it is almost certainly true that experience lending 20 years in the past is not as salient as experience lending in the prior year, we also believe that there is likely to be interesting variation in the nature of forgetting across phases of a cycle that go are not well captured by a geometric depreciation rate and are simply beyond the scope of this paper to explore and estimate. For example, we could imagine that an attention-based theory would predict that the devastating blow of downturn experience is less likely to be forgotten, but a behavioral theory would predict that the “animal spirits” of upturn experience would cause these experiences to be more persistent. It is possible that the interaction between the two stocks is relevant to organizational memory and context-specific experience “crowds out” experience from prior phases. Moreover, the results from our decomposition strategy suggest that there may be differences in the content of organizations’ memory of cycles that is not well described by aggregate experience stocks. We think it is likely that the average intensity of firms’ lending activity , the duration of market spells , and breakpoints (p) are all preserved differently within in organizational memory.
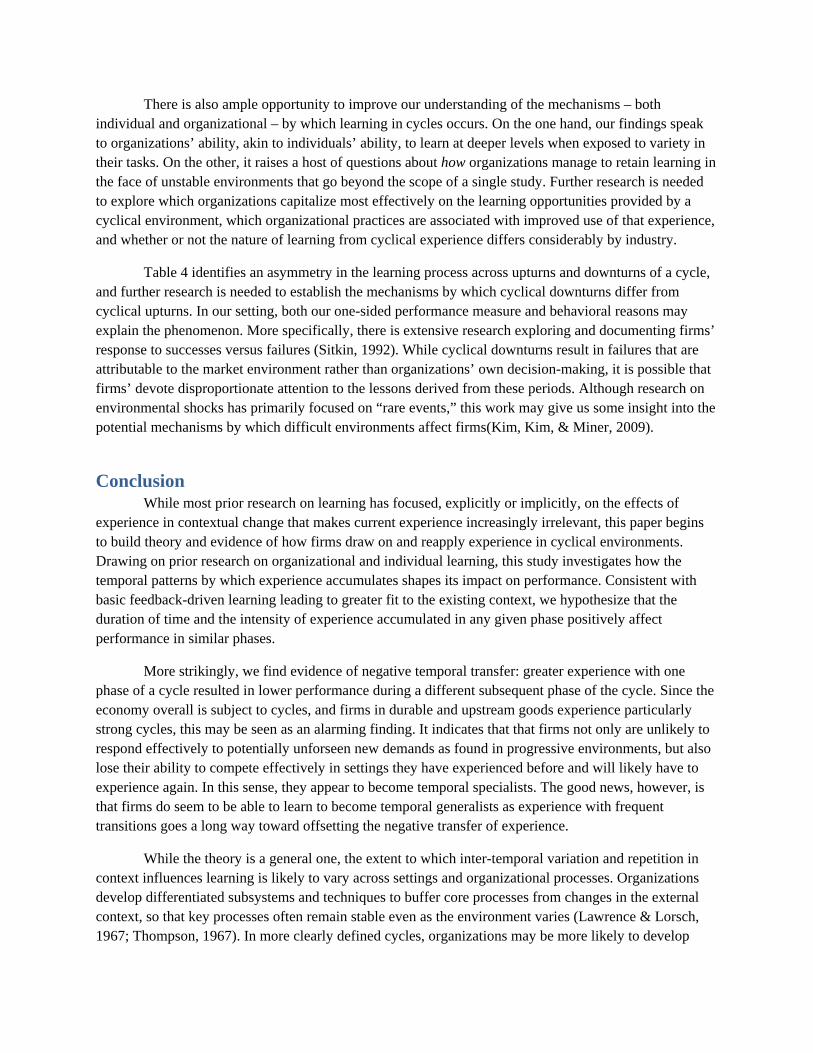
There is also ample opportunity to improve our understanding of the mechanisms – both individual and organizational – by which learning in cycles occurs. On the one hand, our findings speak to organizations’ ability, akin to individuals’ ability, to learn at deeper levels when exposed to variety in their tasks. On the other, it raises a host of questions about how organizations manage to retain learning in the face of unstable environments that go beyond the scope of a single study. Further research is needed to explore which organizations capitalize most effectively on the learning opportunities provided by a cyclical environment, which organizational practices are associated with improved use of that experience, and whether or not the nature of learning from cyclical experience differs considerably by industry.
Table 4 identifies an asymmetry in the learning process across upturns and downturns of a cycle, and further research is needed to establish the mechanisms by which cyclical downturns differ from cyclical upturns. In our setting, both our one-sided performance measure and behavioral reasons may explain the phenomenon. More specifically, there is extensive research exploring and documenting firms’ response to successes versus failures (Sitkin, 1992). While cyclical downturns result in failures that are attributable to the market environment rather than organizations’ own decision-making, it is possible that firms’ devote disproportionate attention to the lessons derived from these periods. Although research on environmental shocks has primarily focused on “rare events,” this work may give us some insight into the potential mechanisms by which difficult environments affect firms(Kim, Kim, & Miner, 2009).
Conclusion While most prior research on learning has focused, explicitly or implicitly, on the effects of
experience in contextual change that makes current experience increasingly irrelevant, this paper begins to build theory and evidence of how firms draw on and reapply experience in cyclical environments. Drawing on prior research on organizational and individual learning, this study investigates how the temporal patterns by which experience accumulates shapes its impact on performance. Consistent with basic feedback-driven learning leading to greater fit to the existing context, we hypothesize that the duration of time and the intensity of experience accumulated in any given phase positively affect performance in similar phases.
More strikingly, we find evidence of negative temporal transfer: greater experience with one phase of a cycle resulted in lower performance during a different subsequent phase of the cycle. Since the economy overall is subject to cycles, and firms in durable and upstream goods experience particularly strong cycles, this may be seen as an alarming finding. It indicates that that firms not only are unlikely to respond effectively to potentially unforseen new demands as found in progressive environments, but also lose their ability to compete effectively in settings they have experienced before and will likely have to experience again. In this sense, they appear to become temporal specialists. The good news, however, is that firms do seem to be able to learn to become temporal generalists as experience with frequent transitions goes a long way toward offsetting the negative transfer of experience.
While the theory is a general one, the extent to which inter-temporal variation and repetition in context influences learning is likely to vary across settings and organizational processes. Organizations develop differentiated subsystems and techniques to buffer core processes from changes in the external context, so that key processes often remain stable even as the environment varies (Lawrence & Lorsch, 1967; Thompson, 1967). In more clearly defined cycles, organizations may be more likely to develop

distinct repositories of knowledge and a suite of alternative routines that allow them to matched their actions to current context within a cycle (March & Simon, 1958). Overall, to the extent that organizations develop contextualized knowledge and routines through experience, match differentiated knowledge bases and routines to current context, develop routines suited to a wide variety of contexts, and buffer units from environmental variation, across phases of a cycle may mimic learning in stable environments, where more even exposure to contrasting phases improves performance by improving (generalist) organizations set of routines.
Works Cited
Argote, L. 1999. Organizational Learning, Creating, Retaining, and Transferring Knowledge: Kluwer Academic Publishers, Norwell, Ma.
Argote, L. 2012. Organizational Learning: Creating, Retaining and Transferring Knowledge (2nd ed.): Springer.
Argyris, C. 1976. Single-Loop and Double-Loop Models in Research on Decision Making. Administrative Science Quarterly, 21(3): 363-375.
Dosi, G. 1982. Technological paradigms and technological trajectories. Research Policy, 11: 147-162. Fang, C. 2011. Organizational Learning as Credit Assignment: A Model and Two Experiments.
Organization Science, 23(6): 1717-1732. Fudenberg, D., & Tirole, J. 1983. Learning-by-Doing and Market Performance. Bell Journal of
Economics, 14: 522-530. Hannan, M., & Freeman, J. 1977a. The population ecology of organizations. American Journal of
Sociology, 82(5): 929-964. Hannan, M. T., & Freeman, J. 1977b. The population ecology of organizations. American journal of
sociology: 929-964. Henderson, R. 1993. Underinvestment and Incompetence as Responses to Radical Innovation: Evidence
from the Semiconductor Photolithographic Alignment Equipment Industry. Rand Journal of Eonomics, 24(2 Summer): 248-270.
Henderson, R., & Clark, K. 1990. Architectural Innovation: The Reconfiguration of Existing Product Technologies and the Failures of Established Firms. Administrative Science Quarterly, 35: 9-30.
Honoré, B. E. 1992. Trimmed LAD and least squares estimation of truncated and censored regression models with fixed effects. Econometrica: journal of the Econometric Society: 533-565.
Huber, G. P. 1991. Organizational Learning: The Contributing Processes and the Literatures. Organization Science, 2(1): 88-115.
Kim, J.-Y., Kim, J.-Y., & Miner, A. S. 2009. Organizational Learning from Extreme Performance Experience: The Impact of Success and Recovery Experience. Organization Science, 20(6): 958-978.
Lawrence, P., & Lorsch, J. 1967. Differentiation and Integration in Complex Organizations. Administrative Sciences Quarterly, 12: 1-47.
Levy, F. K. 1965. Adaptation in the production process. Management Science, 11(6): B-136-B-154. Lieberman, M. B. 1987. The Learning Curve, Diffusion, and Competitive Strategy. SMJ, 8: 441-452. March, J., & Simon, H. 1958. Organizations. New York: John Wiley and Sons. Mascarenhas, B., & Aaker, D. A. 1989. Strategy over the business cycle. Strategic Management Journal,
10(3): 199-210. Merton, R. K. 1940. Bureaucratic structure and personality. Social Forces, 18(4): 560-568. Merton, R. K. 1952. Reader in Bureaucracy. Glencoe, IL: Free Press. Narayanan, S., Balasubramanian, S., & Swaminathan, J. M. 2009. A Matter of Balance: Specialization,
Task Variety, and Individual Learning in a Software Maintenance Environment. Management Science, 55(11): 1861-1876.
Nickell, S., J. 1981. Biases in Dynamic Models with Fixed Effects. Econometrica, 49: 1417-1426. Oliva, R., & Sterman, J. D. 2001. Cutting corners and working overtime: Quality erosion in the service
industry. Management Science, 47(7): 894. Rohrer, D., Dedrick, R. F., & Burgess, K. 2014. The benefit of interleaved mathematics practice is not
limited to superficially similar kinds of problems. Psychonomic Society, 21: 1323-1330. Schilling, M. A., Vidal, P., Ployhart, R. E., & Marangoni, A. 2003. Learning by Doing Something Else:
Variation, Relatedness, and the Learning Curve. Management Science, 49(1): 39-56. Selznick, P. 1957. Leadership in Administration: A Sociological Interpretation. Berkeley: University of
California Press.

Sitkin, S. B. 1992. Learning through failure: The strategy of small losses. Research in Organizational Behavior, 14: 231-266.
Smith, A. 1776. An Inquiry into the Nature and Causes of the Wealth of Nations. Staats, B. R., & Gino, F. 2012. Specialization and Variety in Repetitive Tasks: Evidence from a Japanese
Bank. Management Science, 58(6): 1141-1159. Thompson, J. D. 1967. Organizations in Action. New York: McGraw-Hill. Wooldridge, J. M. 2010. Econometric analysis of cross section and panel data: MIT press. Wright, T. P. 1936. Factors affecting the cost of airplanes. Journal of the Aeronautical Sciences, 3: 122-
128.
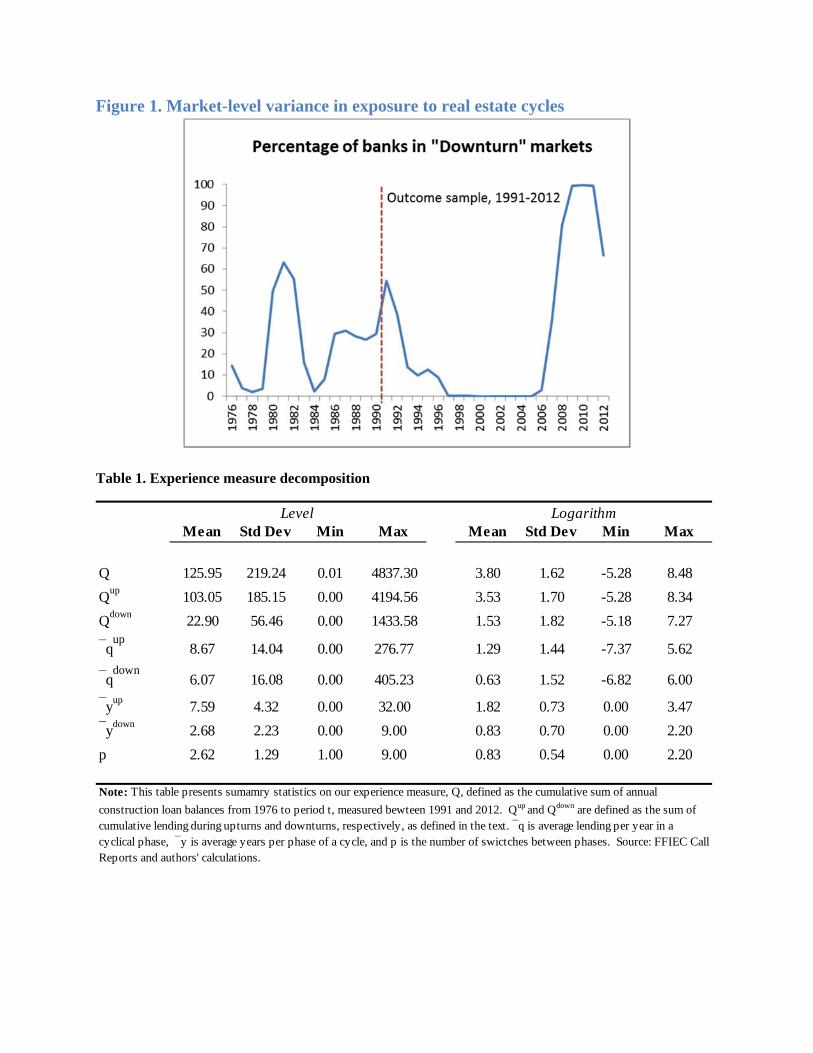
Figure 1. Market-level variance in exposure to real estate cycles
Table 1. Experience measure decomposition
Mean Std Dev Min Max Mean Std Dev Min Max
Q 125.95 219.24 0.01 4837.30 3.80 1.62 -5.28 8.48
Qup
103.05 185.15 0.00 4194.56 3.53 1.70 -5.28 8.34
Qdown
22.90 56.46 0.00 1433.58 1.53 1.82 -5.18 7.27
qup
8.67 14.04 0.00 276.77 1.29 1.44 -7.37 5.62
qdown
6.07 16.08 0.00 405.23 0.63 1.52 -6.82 6.00
yup
7.59 4.32 0.00 32.00 1.82 0.73 0.00 3.47
ydown
2.68 2.23 0.00 9.00 0.83 0.70 0.00 2.20
p 2.62 1.29 1.00 9.00 0.83 0.54 0.00 2.20
Level Logarithm
Note: This table presents sumamry statistics on our experience measure, Q, defined as the cumulative sum of annual
construction loan balances from 1976 to period t, measured bewteen 1991 and 2012. Qup and Qdown are defined as the sum of cumulative lending during upturns and downturns, respectively, as defined in the text. q is average lending per year in a cyclical phase, y is average years per phase of a cycle, and p is the number of swictches between phases. Source: FFIEC Call Reports and authors' calculations.
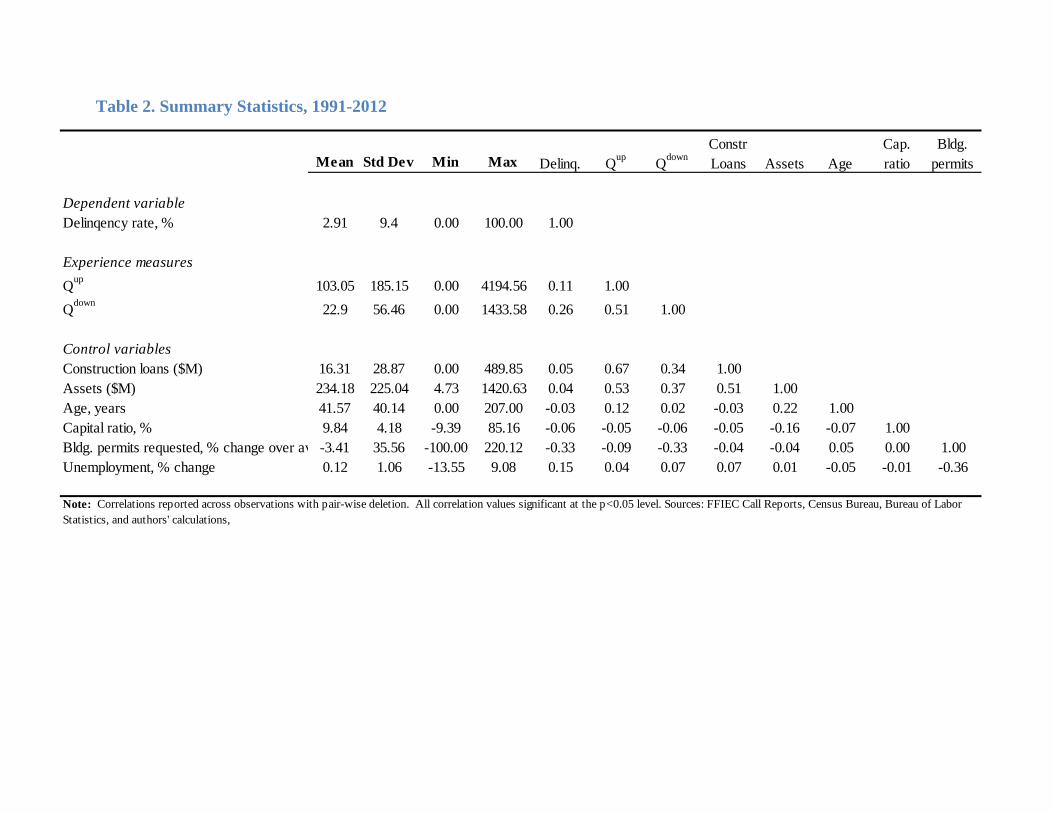
Table 2. Summary Statistics, 1991-2012
Mean Std Dev Min Max Delinq. Qup
Qdown
Constr Loans Assets Age
Cap. ratio
Bldg. permits
Dependent variableDelinqency rate, % 2.91 9.4 0.00 100.00 1.00
Experience measures
Qup
103.05 185.15 0.00 4194.56 0.11 1.00
Qdown
22.9 56.46 0.00 1433.58 0.26 0.51 1.00
Control variablesConstruction loans ($M) 16.31 28.87 0.00 489.85 0.05 0.67 0.34 1.00Assets ($M) 234.18 225.04 4.73 1420.63 0.04 0.53 0.37 0.51 1.00Age, years 41.57 40.14 0.00 207.00 -0.03 0.12 0.02 -0.03 0.22 1.00Capital ratio, % 9.84 4.18 -9.39 85.16 -0.06 -0.05 -0.06 -0.05 -0.16 -0.07 1.00Bldg. permits requested, % change over av -3.41 35.56 -100.00 220.12 -0.33 -0.09 -0.33 -0.04 -0.04 0.05 0.00 1.00Unemployment, % change 0.12 1.06 -13.55 9.08 0.15 0.04 0.07 0.07 0.01 -0.05 -0.01 -0.36
Note: Correlations reported across observations with pair-wise deletion. All correlation values significant at the p<0.05 level. Sources: FFIEC Call Reports, Census Bureau, Bureau of Labor Statistics, and authors' calculations,
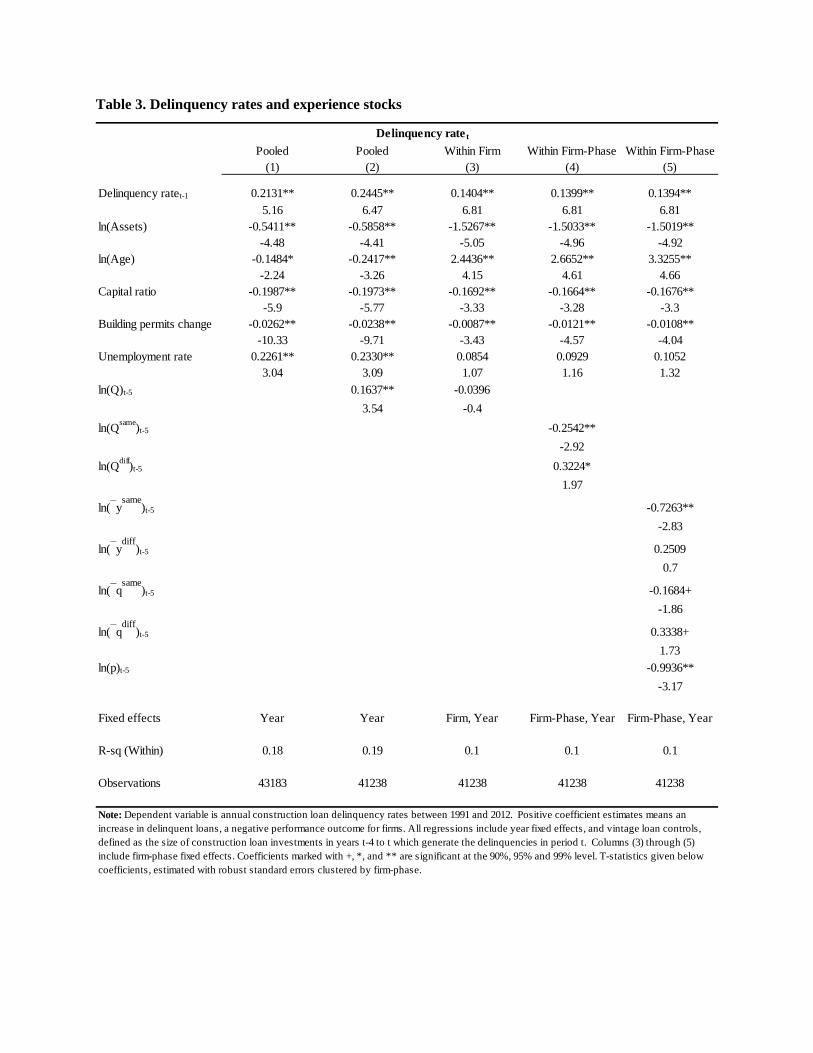
Table 3. Delinquency rates and experience stocks
Pooled Pooled Within Firm Within Firm-Phase Within Firm-Phase(1) (2) (3) (4) (5)
Delinquency ratet-1 0.2131** 0.2445** 0.1404** 0.1399** 0.1394**
5.16 6.47 6.81 6.81 6.81ln(Assets) -0.5411** -0.5858** -1.5267** -1.5033** -1.5019**
-4.48 -4.41 -5.05 -4.96 -4.92ln(Age) -0.1484* -0.2417** 2.4436** 2.6652** 3.3255**
-2.24 -3.26 4.15 4.61 4.66Capital ratio -0.1987** -0.1973** -0.1692** -0.1664** -0.1676**
-5.9 -5.77 -3.33 -3.28 -3.3Building permits change -0.0262** -0.0238** -0.0087** -0.0121** -0.0108**
-10.33 -9.71 -3.43 -4.57 -4.04Unemployment rate 0.2261** 0.2330** 0.0854 0.0929 0.1052
3.04 3.09 1.07 1.16 1.32
ln(Q)t-5 0.1637** -0.0396
3.54 -0.4
ln(Qsame
)t-5 -0.2542**
-2.92
ln(Qdiff
)t-5 0.3224*
1.97
ln(ysame
)t-5 -0.7263**
-2.83
ln(ydiff
)t-5 0.2509
0.7
ln(qsame
)t-5 -0.1684+
-1.86
ln(qdiff
)t-5 0.3338+
1.73
ln(p)t-5 -0.9936**
-3.17
Fixed effects Year Year Firm, Year Firm-Phase, Year Firm-Phase, Year
R-sq (Within) 0.18 0.19 0.1 0.1 0.1
Observations 43183 41238 41238 41238 41238
Delinquency ratet
Note: Dependent variable is annual construction loan delinquency rates between 1991 and 2012. Positive coefficient estimates means an increase in delinquent loans, a negative performance outcome for firms. All regressions include year fixed effects, and vintage loan controls, defined as the size of construction loan investments in years t-4 to t which generate the delinquencies in period t. Columns (3) through (5) include firm-phase fixed effects. Coefficients marked with +, *, and ** are significant at the 90%, 95% and 99% level. T-statistics given below coefficients, estimated with robust standard errors clustered by firm-phase.
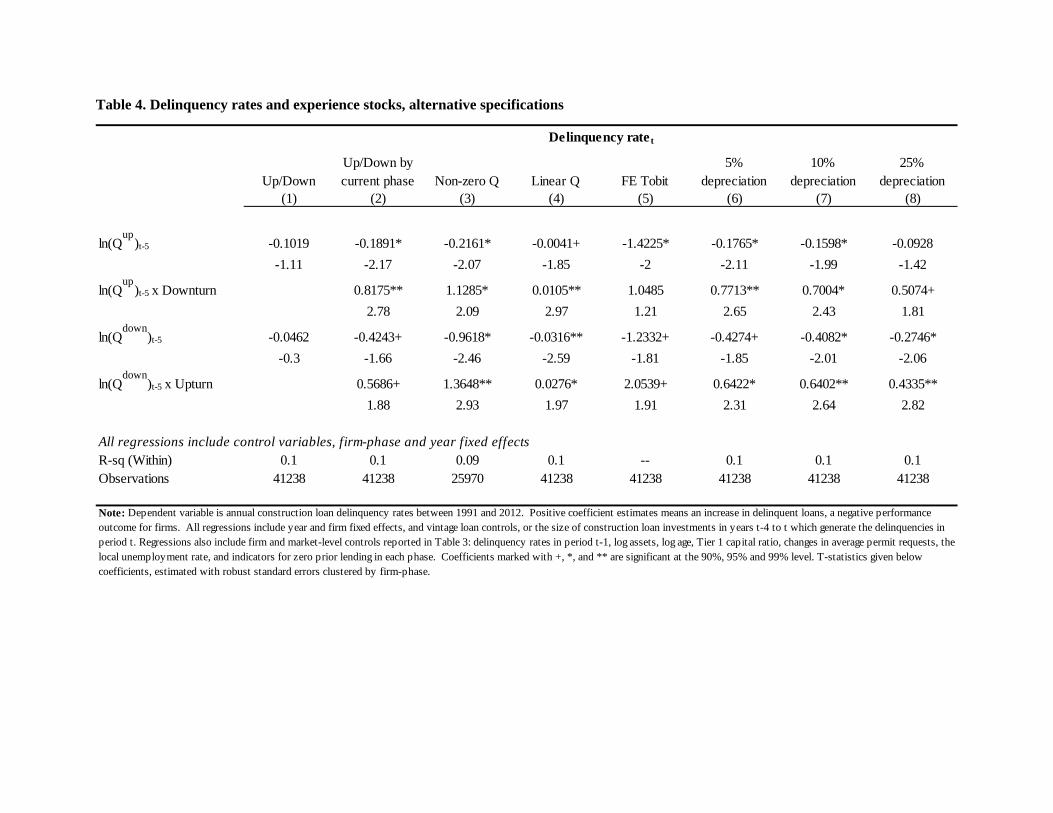
Table 4. Delinquency rates and experience stocks, alternative specifications
Up/DownUp/Down by current phase Non-zero Q Linear Q FE Tobit
5% depreciation
10% depreciation
25% depreciation
(1) (2) (3) (4) (5) (6) (7) (8)
ln(Qup
)t-5 -0.1019 -0.1891* -0.2161* -0.0041+ -1.4225* -0.1765* -0.1598* -0.0928
-1.11 -2.17 -2.07 -1.85 -2 -2.11 -1.99 -1.42
ln(Qup
)t-5 x Downturn 0.8175** 1.1285* 0.0105** 1.0485 0.7713** 0.7004* 0.5074+
2.78 2.09 2.97 1.21 2.65 2.43 1.81
ln(Qdown
)t-5 -0.0462 -0.4243+ -0.9618* -0.0316** -1.2332+ -0.4274+ -0.4082* -0.2746*
-0.3 -1.66 -2.46 -2.59 -1.81 -1.85 -2.01 -2.06
ln(Qdown
)t-5 x Upturn 0.5686+ 1.3648** 0.0276* 2.0539+ 0.6422* 0.6402** 0.4335**
1.88 2.93 1.97 1.91 2.31 2.64 2.82
All regressions include control variables, firm-phase and year fixed effectsR-sq (Within) 0.1 0.1 0.09 0.1 -- 0.1 0.1 0.1Observations 41238 41238 25970 41238 41238 41238 41238 41238
Delinquency ratet
Note: Dependent variable is annual construction loan delinquency rates between 1991 and 2012. Positive coefficient estimates means an increase in delinquent loans, a negative performance outcome for firms. All regressions include year and firm fixed effects, and vintage loan controls, or the size of construction loan investments in years t-4 to t which generate the delinquencies in period t. Regressions also include firm and market-level controls reported in Table 3: delinquency rates in period t-1, log assets, log age, Tier 1 capital ratio, changes in average permit requests, the local unemployment rate, and indicators for zero prior lending in each phase. Coefficients marked with +, *, and ** are significant at the 90%, 95% and 99% level. T-statistics given below coefficients, estimated with robust standard errors clustered by firm-phase.