Embed Size (px)
Citation preview
June 2013 www. .com
60 comminution
There is a currently a strong interest in reducing energy consumption in mining and milling. Thus it is
interesting to look at how energy use in milling processes has changed over the past 40 years.
In a 1985 study, Bassarear summarised operating data for 75 mills. Most data was reported in 1972, while three mills in Arizona reported data in 1975. Sixty-seven of the mills included design tonnage and copper grade, and design power ratings for crushing, grinding and flotation.
Energy usage of those 67 mills is analysed and summarised here. For comparison, data from the original installation and the first three expansions
at Escondida copper mine in Chile are also considered using data from Kilbourn’s 1995 study.
1970s EnErgy consumptionOf the 67 mills surveyed in the 1970s, most used two- or three-stage crushing. Almost half used rod mills and almost all used ball mills. Autogenous grinding (AG) mills were just being introduced, and no semi-autogenous grinding (SAG) mill usage was reported. Table 1 shows the numbers of mills using various unit operations. The 67 mills varied widely in size and feed characteristics. Design capacities ranged from 682t/d* to 98,182t/d and design head grades ranged from 0.19% to 6.0%.
The allocation of energy usage in the 1970s mills among crushing, grinding and flotation was approximately 12%, 65% and 18% respectively, based on 24h continuous operation of all equipment. The values in Figure 1 are calculated on the basis of tons of copper in the feed, and do not account for varying recoveries.
consumption at EscondidaThe original Escondida mill started in 1990 and processed 35,000t/d. Subsequent expansions were designed for 46,000t/d (phase 1), 55,000t/d
(phase 2) and 115,000t/d (phase 3). Table 2 summarises Kilbourn’s
description of the milling equipment installed at Escondida during this time; note that power ratings for thickeners and filters are not shown as they were not included by Kilbourn.
Several changes are notable in the Escondida equipment suite. First, only one stage of crushing is used; secondary and tertiary crushers, along with rod mills, have been replaced with SAG mills. Second, flotation cleaning is done with columns instead of mechanical cells.
Two significant things appear in these average values. First, grinding was the biggest energy user in these mills, and second, flotation used more energy than
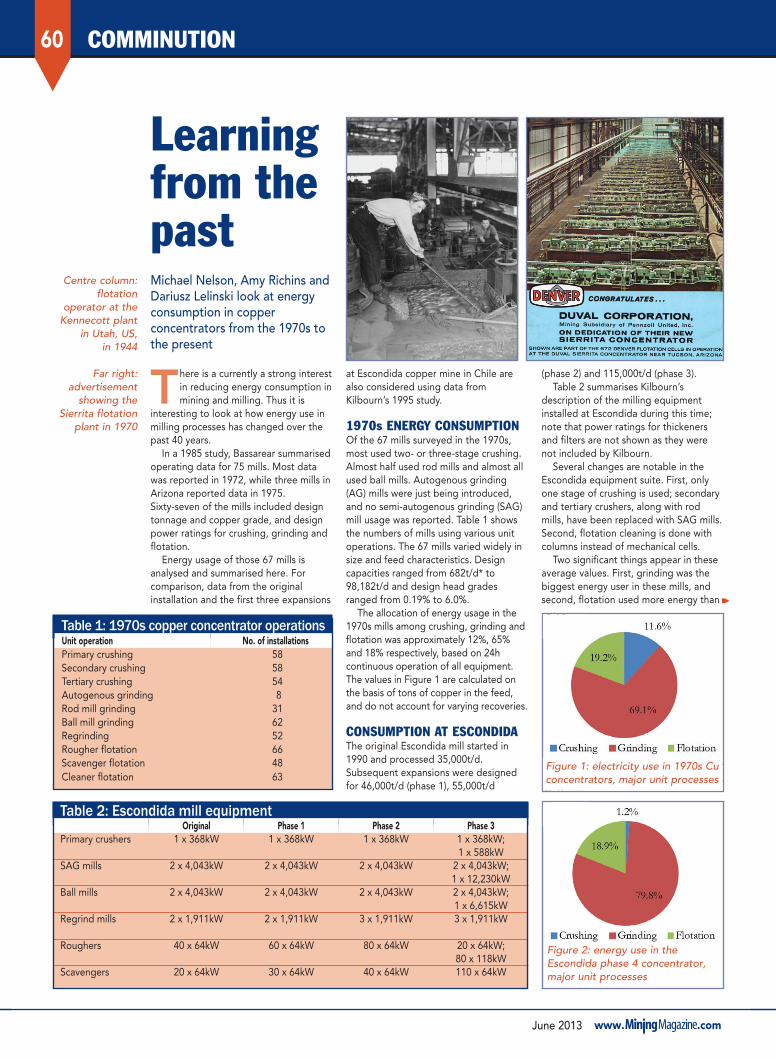
Learning from the past
Centre column: flotation
operator at the Kennecott plant
in Utah, US, in 1944
Far right: advertisement
showing the Sierrita flotation
plant in 1970
Michael Nelson, Amy Richins and Dariusz Lelinski look at energy consumption in copper concentrators from the 1970s to the present
Table 1: 1970s copper concentrator operationsUnit operation No. of installationsPrimary crushing 58Secondary crushing 58Tertiary crushing 54Autogenous grinding 8Rod mill grinding 31Ball mill grinding 62Regrinding 52Rougher flotation 66Scavenger flotation 48Cleaner flotation 63
Table 2: Escondida mill equipment Original Phase 1 Phase 2 Phase 3Primary crushers 1 x 368kW 1 x 368kW 1 x 368kW 1 x 368kW;
1 x 588kWSAG mills 2 x 4,043kW 2 x 4,043kW 2 x 4,043kW 2 x 4,043kW;
1 x 12,230kWBall mills 2 x 4,043kW 2 x 4,043kW 2 x 4,043kW 2 x 4,043kW;
1 x 6,615kWRegrind mills 2 x 1,911kW 2 x 1,911kW 3 x 1,911kW 3 x 1,911kW
Roughers 40 x 64kW 60 x 64kW 80 x 64kW 20 x 64kW; 80 x 118kW
Scavengers 20 x 64kW 30 x 64kW 40 x 64kW 110 x 64kW
Figure 2: energy use in the Escondida phase 4 concentrator, major unit processes
Figure 1: electricity use in 1970s Cu concentrators, major unit processes
62 comminution
crushing. It is also interesting that the wide variations in feed rate and ore grade among the 67 mills almost disappear in the average percentages for the three stages of the process.
Figure 2 shows energy use in Escondida’s phase 4 mill; for a single mill design, these values will be the same per day, per ton of ore or per ton of copper. Comparing Figure 1 with Figure 2, the most important change is the large decrease in the energy used by crushing that resulted from the introduction of SAG mills.
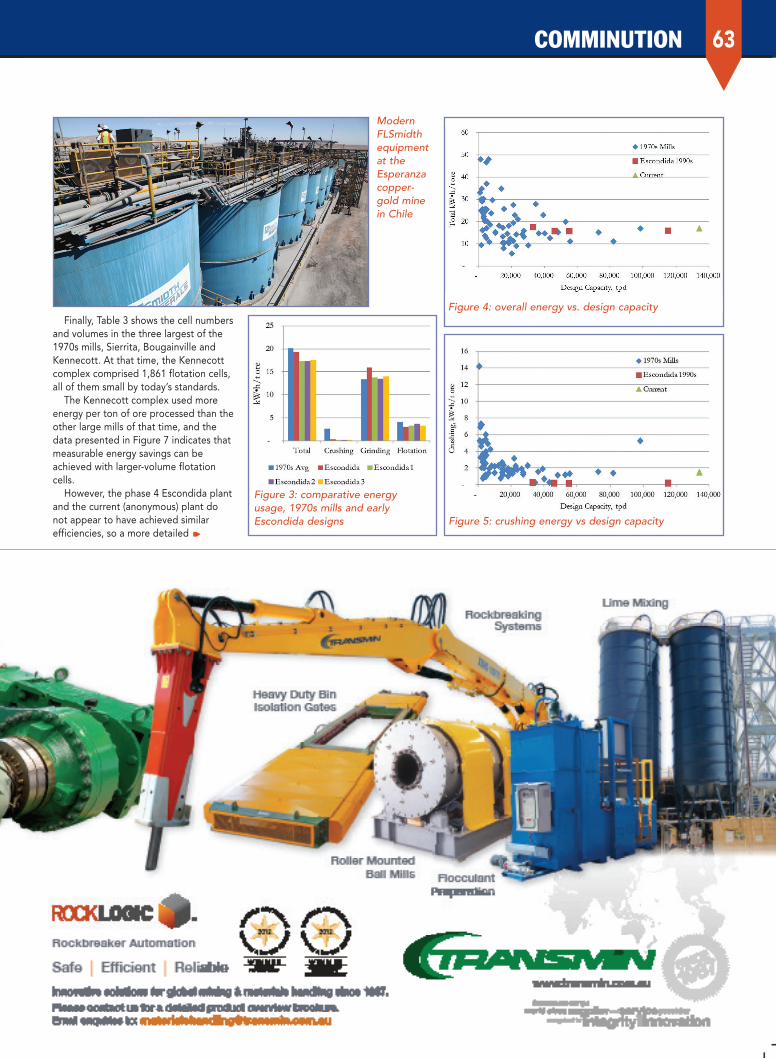
Figure 3 shows energy use for the
1970s mills and for the four designs at Escondida.
comparisonsIt is common wisdom that as mills increase in size, their energy efficiency increases. The information analysed here provides an opportunity to examine that theory in some detail. The following figures show energy consumption as a function of plant capacity for the 1970s mills, the Escondida mills of the 1990s and a large copper mill that is in current operation.
Figure 4 shows that energy consump-tion for crushing, grinding and flotation
has indeed decreased as design capacity has increased.
The five largest 1970s mills in the figure are Cyprus Pima (52,727t/d), Morenci (55,455t/d), Sierrita (72,727t/d), Bougainville (81,818t/d) and Kennecott (98,182t/d). The Kennecott figure includes the Bonneville, Arthur and Magna plants. The data for crushing efficiency is shown in Figure 5. Note the high energy consumption at the Kennecott complex, where AG mills were not in use. This was not the case for grinding energy at Kennecott, as shown in Figure 6.
Kennecott Arthur float plant in
Utah at an unknown date
Described as “the world’s most
modern copper concentrator”
when completed in 1964, Butte
mine, Montana, had 1,296
Galigher Agitair flotation cells
63comminution
Finally, Table 3 shows the cell numbers and volumes in the three largest of the 1970s mills, Sierrita, Bougainville and Kennecott. At that time, the Kennecott complex comprised 1,861 flotation cells, all of them small by today’s standards.
The Kennecott complex used more energy per ton of ore processed than the other large mills of that time, and the data presented in Figure 7 indicates that measurable energy savings can be achieved with larger-volume flotation cells.
However, the phase 4 Escondida plant and the current (anonymous) plant do not appear to have achieved similar efficiencies, so a more detailed
Figure 3: comparative energy usage, 1970s mills and early Escondida designs Figure 5: crushing energy vs design capacity
Figure 4: overall energy vs. design capacity
Modern FLSmidth equipment at the Esperanza copper-gold mine in Chile
June 2013 www. .com
64 comminution
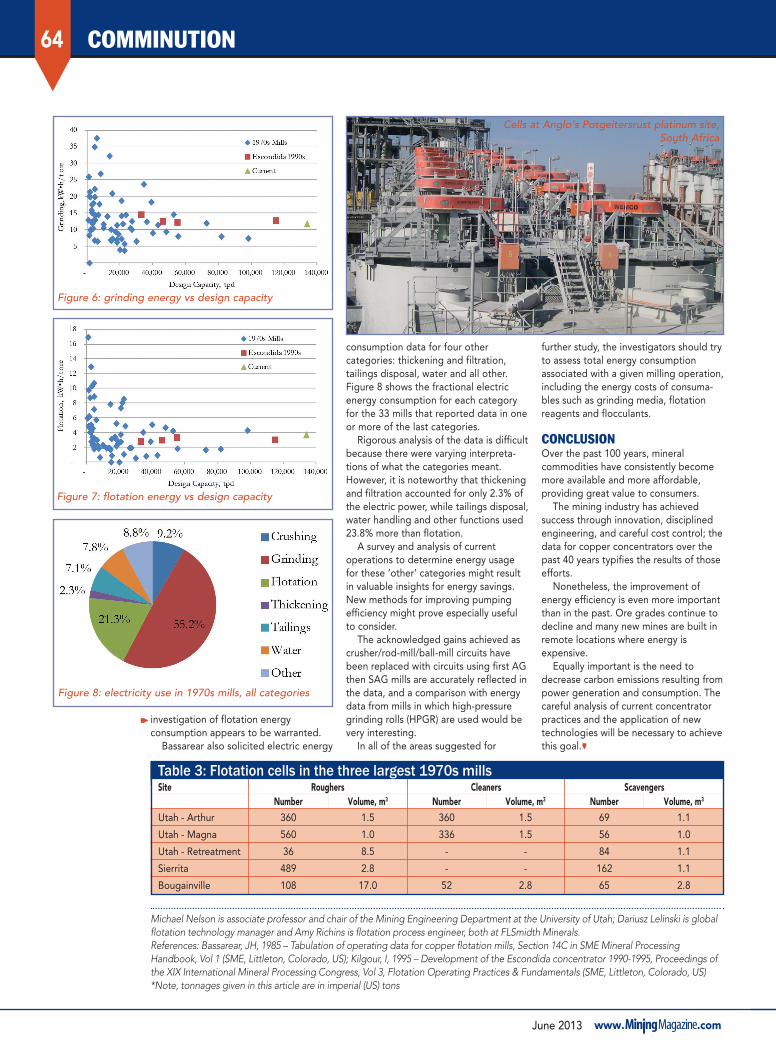
investigation of flotation energy consumption appears to be warranted.
Bassarear also solicited electric energy
consumption data for four other categories: thickening and filtration, tailings disposal, water and all other. Figure 8 shows the fractional electric energy consumption for each category for the 33 mills that reported data in one or more of the last categories.
Rigorous analysis of the data is difficult because there were varying interpreta-tions of what the categories meant. However, it is noteworthy that thickening and filtration accounted for only 2.3% of the electric power, while tailings disposal, water handling and other functions used 23.8% more than flotation.
A survey and analysis of current operations to determine energy usage for these ‘other’ categories might result in valuable insights for energy savings. New methods for improving pumping efficiency might prove especially useful to consider.
The acknowledged gains achieved as crusher/rod-mill/ball-mill circuits have been replaced with circuits using first AG then SAG mills are accurately reflected in the data, and a comparison with energy data from mills in which high-pressure grinding rolls (HPGR) are used would be very interesting.
In all of the areas suggested for
further study, the investigators should try to assess total energy consumption associated with a given milling operation, including the energy costs of consuma-bles such as grinding media, flotation reagents and flocculants.
concLusionOver the past 100 years, mineral commodities have consistently become more available and more affordable, providing great value to consumers.
The mining industry has achieved success through innovation, disciplined engineering, and careful cost control; the data for copper concentrators over the past 40 years typifies the results of those efforts.
Nonetheless, the improvement of energy efficiency is even more important than in the past. Ore grades continue to decline and many new mines are built in remote locations where energy is expensive.
Equally important is the need to decrease carbon emissions resulting from power generation and consumption. The careful analysis of current concentrator practices and the application of new technologies will be necessary to achieve this goal.
Michael Nelson is associate professor and chair of the Mining Engineering Department at the University of Utah; Dariusz Lelinski is global flotation technology manager and Amy Richins is flotation process engineer, both at FLSmidth Minerals. References: Bassarear, JH, 1985 – Tabulation of operating data for copper flotation mills, Section 14C in SME Mineral Processing Handbook, Vol 1 (SME, Littleton, Colorado, US); Kilgour, I, 1995 – Development of the Escondida concentrator 1990-1995, Proceedings of the XIX International Mineral Processing Congress, Vol 3, Flotation Operating Practices & Fundamentals (SME, Littleton, Colorado, US) *Note, tonnages given in this article are in imperial (US) tons
Cells at Anglo’s Potgeitersrust platinum site, South Africa
Figure 6: grinding energy vs design capacity
Figure 7: flotation energy vs design capacity
Figure 8: electricity use in 1970s mills, all categories
Table 3: Flotation cells in the three largest 1970s millsSite Roughers Cleaners Scavengers Number Volume, m3 Number Volume, m3 Number Volume, m3
Utah - Arthur 360 1.5 360 1.5 69 1.1
Utah - Magna 560 1.0 336 1.5 56 1.0
Utah - Retreatment 36 8.5 - - 84 1.1
Sierrita 489 2.8 - - 162 1.1
Bougainville 108 17.0 52 2.8 65 2.8