Embed Size (px)
Citation preview

12018 Global Cities ReportView online: bit.ly/2018-Global-Cities
Learning from the East—Insights from China’s Urban Success2018 Global Cities Report
A.T. Kearney’s eighth Global Cities report highlights regional trends revealed over the past decade and examines what defines the world’s most influential cities.

12018 Global Cities ReportView online: bit.ly/2018-Global-Cities
There are reasons that cities such as New York, London, Paris, and Singapore routinely attract the best companies, the top talent, and the most investment dollars. Influential cities such as these possess the right mix of factors such as business activity, human capital, information exchange, political engagement, and cultural experiences that help organizations and people to thrive.
The A.T. Kearney 2018 Global Cities report examines which global cities are improving in their competitiveness and what factors are driving that success. In an era of increased localization, challenges to trade, and a rise in populist sentiments around the world, the results of this report go beyond simply ranking cities. Instead, this analysis reveals which global cities are primed for urban transformation and growth—and those that are falling behind.
Cities such as New York, London, Paris, and Singapore possess a mix of factors such as business activity, human capital, information exchange, political engagement, and cultural experiences that help organizations and people to thrive.
Even more, the 2018 report shows how commitments to key areas such as innovation, trans-parency, and information exchange will define the next generation of the world’s most influ-ential cities. In the US, you need only look at the headlines surrounding Amazon’s search for its second headquarters to intuit the importance of understanding why some seem to grow, thrive, and attract continued investment while others miss out.
This year, the report includes information on some of the expected top cities—places such as New York and San Francisco. But it also chronicles the remarkable rise of China’s super cities and how a comprehensive approach to urbanization is paying off in spades for the global powerhouse.
Highlights from the 2018 Global Cities Report• Seven new cities have been added to the Index and the Outlook: In the US, Seattle joins the
rankings for the first time, and in China, six cities have emerged in the rankings (Changsha, Foshan, Ningbo, Tangshan, Wuxi, and Yantai).
• New York maintains first place in the Global Cities Index driven by its strong performance in business activity and human capital.
• San Francisco holds on to first place in the Global Cities Outlook driven by its continued strength in innovation.
• The theoretical “perfect” city, one whose composite score across all Index metrics is 100, is composed of 15 cities. New York claims the top spot in five of the 27 metrics and Brussels in four. This reinforces that no city has a lock on all aspects that make a global city.

22018 Global Cities ReportView online: bit.ly/2018-Global-Cities
• The theoretical “fastest” city, one whose composite score across all Outlook metrics is 100, is composed of nine cities. Melbourne and Sydney claim top spots in three of the 13 metrics, Moscow and London in two. The race for being the most global city in the future is wide open.
• The cities that have climbed the most in the Global Cities Index rankings since last year have made marked improvements in the areas of business activity and information exchange.
• In the Global Cities Outlook, cities that improved their economics and governance made the biggest leap in the rankings.
• China’s key cities have experienced greater progress than cities in the other regions of the world during the 10 years of A.T. Kearney’s Global Cities research; business activity remains the dominant factor, but human capital and cultural experience are also significant drivers of growth.
A Decade of Global Cities Data Established in 2008, A.T. Kearney’s Global Cities was one of the first to rank cities based on their global standing, and it remains highly regarded for its holistic assessment of city capabilities and potential. Designed by top academics and business advisors, the analysis is based on facts and publicly available data. We develop the report annually, updating the underlying information and reviewing whether new cities meet the criteria for inclusion. Since its inception, the report added the Global Cities Outlook and it increases the number of cities it assesses nearly every year.
The 2018 report includes the Global Cities Index, which examines cities’ performance, and the Global Cities Outlook, which evaluates their potential (see sidebar: 135 Cities, Six Global Regions, One Powerful Report). Over the past 10 years, the report has evolved to better reflect the factors that impact the success of cities. The first Global Cities Index examined the comparative strengths of 60 cities; this report compiles data on 135 different metropolitan areas. Together, the Index and Outlook present a unique tool for assessing the world’s most influential and attractive cities—and determining what makes them so. The information is
135 Cities, Six Global Regions, One Powerful Report
The Global Cities Index examines the current performance of cities based on 27 metrics spanning five dimensions: business activity, human capital, information exchange, cultural experience, and political engagement. The Index provides insights into the global reach, performance, and level of development of the world’s largest cities. It also allows for the comparison
of diverse cities and the identification of core strengths and distinctive differences.
The Global Cities Outlook evaluates a city’s potential based on the rate of change for 13 metrics across four dimensions: personal well-being, economics, innovation, and governance. These metrics help evaluate long-term investment and
success by assessing elements such as environmental performance, infrastructure, and innovation capacity. The Outlook brings a forward-looking perspective to city-level policies and practices that shape future competitiveness, identifying growing cities that are likely to become the world’s most prominent cities.

32018 Global Cities ReportView online: bit.ly/2018-Global-Cities
especially valuable for business leaders as they assess new locations or consider expanding internationally.
2018 Index and Outlook Performance
The Index: business activity gives global cities a boost
The Big Apple stays on top
The 2018 Global Cities Index finds New York City to be the world’s most influential city. New York overtook London in 2017, after falling behind in 2016, and has consolidated its leading position in 2018. Figure 1 on page 4 presents the top 25 cities in the Global Cities Index for 2018. Complete rankings and more detail about the metrics and their weightings within each dimension are provided in the appendix.
New York has shown strong improvements in business activity, while also leading the global scores in human capital. Of course, the Big Apple remains a hub for numerous industries including finance, media, and fashion. But it’s also increasingly becoming a center of start-up activity and venture-backed tech companies. New York City also received its highest ever score in cultural experience.
While there has been no change in the leading cities for each of the dimensions that the Index considers, it’s worth noting that the overall leaders in each category represent a mix of cities from across all development levels and world regions.
London, meanwhile, witnessed less improvement and some declines in measured areas, particularly in political engagement. The latter may simply reflect a political exhaustion after the record turnout and dramatic fallout of the 2016 Brexit vote. London and New York scored highly in the human capital metric, a sign of the continued appeal of the cities to talent from around the world. They each saw slightly less improvement in information exchange compared to the previous year.
Paris, Tokyo, and Hong Kong rank third, fourth, and fifth, respectively—unchanged from last year. Elsewhere in the top 10, Los Angeles has overtaken Singapore and Chicago to land in sixth place. Of the cities in the top 50 that moved up the most over the year, increases in business activity and improvements in information exchange spurred their rise. Munich, San Francisco, and Atlanta each showed signs of rapid improvement in these areas.
42018 Global Cities ReportView online: bit.ly/2018-Global-Cities
59.5
66.0
60.5
65.9
65.4
58.2
60.5
53.9
56.8
56.9
57.8
56.1
57.2
55.7
55.1
55.5
54.3
54.5
55.4
56.0
54.6
55.8
53.5
52.9
53.5
2017 rank 2018 Outlook City12345867911
101213181714151619232022242126
234
145430
51547222445492019181012
641
256
408
60
New YorkLondonParisTokyoHong KongLos AngelesSingaporeChicagoBeijingBrusselsWashington, D.C.SeoulMadridMoscowSydneyBerlinMelbourneTorontoShanghaiSan FranciscoViennaAmsterdamBarcelonaBostonBuenos Aires
Global Cities Outlook, rank and score
Global Cities Index, rank and score
Scoring breakdown
Personal well-being (25%)
Economics (25%)
Innovation (25%)
Governance (25%)
Scoring breakdown
Business activity (30%)
Human capital (30%)
Information exchange (15%)
Cultural experience (15%)
Political engagement (10%)
Note: Bold city names indicate top 25 in both Index and Outlook.
Source: A.T. Kearney 2018 Global Cities Report
2018 rank123456789
10111213141516171819
202122232425
2017 rank 2018 Index City1
2
4
3
11
16
7
5
8
6
9
20
12
23
15
14
24
18
13
10
32
28
21
19
29
20
1
2
3
7
22
32
24
41
17
39
18
33
4
8
36
37
16
15
14
27
10
42
11
21
San FranciscoNew YorkLondonParisSingaporeAmsterdamMunich
BostonHouston
MelbourneStockholm
TorontoZurich
TokyoChicagoGeneva
Vancouver
BerlinSydneyMoscowMontreal
BrusselsCopenhagen
Washington, D.C.Vienna
2018 rank123456789
10111213141516171819
202122232425
27.8
28.4
29.3
28.2
31.2
31.7
31.9
29.6
29.5
32.1
44.947.2
36.3
37.838.3
53.2
60.162.0
32.5
33.6
32.7
33.2
34.2
34.3
35.4
Figure 1 The top 25 cities on the Index and the Outlook
52018 Global Cities ReportView online: bit.ly/2018-Global-Cities
Emerging urban hubs elevate their game
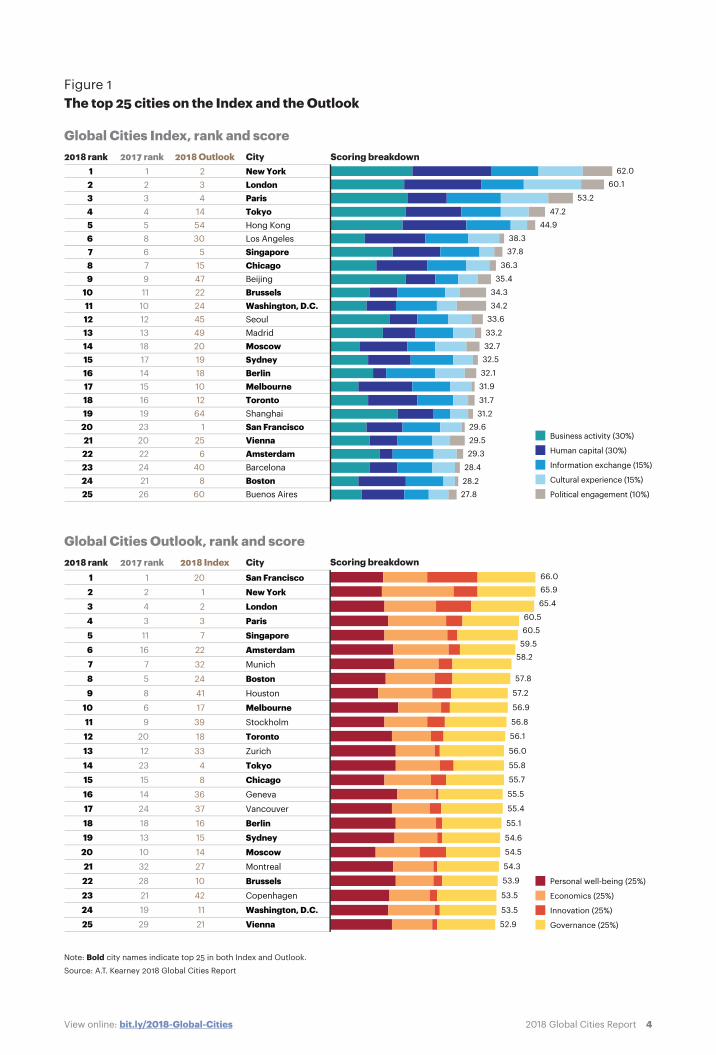
Despite the lack of movement in the Index’s top 10, looking at the performance of cities within individual metrics makes it clear that even the most established global cities face significant competition from emerging urban hubs (see figure 2). While there has been no change in the leading cities for each of the five dimensions that the Index considers, it’s worth noting that the overall leaders in each category represent a broad mix of cities from across all development levels and world regions. For instance, Melbourne achieved the highest ranking in international student population, while within the business activity metric Hong Kong claims the top spot in the number of global services firms.
Global Cities Index leaders
Global Cities Index leaders by metric
Businessactivity
Foreign-born populationNew York
Top universitiesBoston
Population with tertiary degreesTokyo
International studentpopulationMelbourne*
Number of international schoolsHong Kong
Embassies and consulatesBrussels
Think tanksWashington, D.C.
International organizationsGeneva
PoliticalconferencesBrussels
Local institutions with global reachNew York
Humancapital
Informationexchange
Culturalexperience
Politicalengagement
New York New York Paris London Washington, D.C.
Note: ICCA is the International Congress and Convention Association.
*Indicates new leaders in 2018
Source: A.T. Kearney 2018 Global Cities Report
Figure 2 The perfect city
Fortune 500Beijing
Top global services firmsHong Kong*
Capital marketsNew York
Air freightHong Kong
Sea freightShanghai
ICCA conferencesParis
Access to TV newsGeneva, Brussels
News agency bureausLondon
Broadband subscribersGeneva, Zurich
Freedom of expressionBrussels,Amsterdam,Stockholm
Online presenceSingapore
MuseumsMoscow
Visual and performing artsNew York*
Sporting eventsLondon
International travelersLondon
Culinary o�eringsNew York
Sister citiesSt. Petersburg
In search of the “perfect” city
It takes 15 cities to yield the theoretical “perfect city” across all 27 metrics from the Index—one whose composite score is 100. We’ve yet to find the perfect city in real life. That said, New York is considered “perfect” in five metrics, including culinary offerings and local institutions with a global reach. Not far behind, Brussels is considered “perfect” in four metrics including freedom of expression and political conferences.
62018 Global Cities ReportView online: bit.ly/2018-Global-Cities
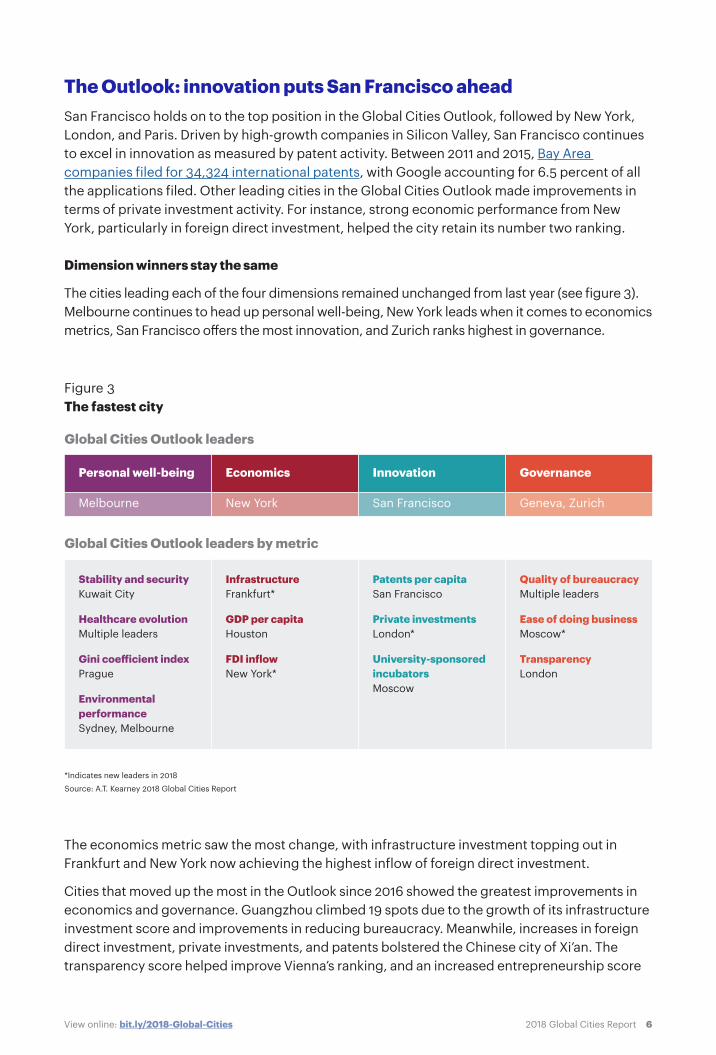
The Outlook: innovation puts San Francisco aheadSan Francisco holds on to the top position in the Global Cities Outlook, followed by New York, London, and Paris. Driven by high-growth companies in Silicon Valley, San Francisco continues to excel in innovation as measured by patent activity. Between 2011 and 2015, Bay Area companies filed for 34,324 international patents, with Google accounting for 6.5 percent of all the applications filed. Other leading cities in the Global Cities Outlook made improvements in terms of private investment activity. For instance, strong economic performance from New York, particularly in foreign direct investment, helped the city retain its number two ranking.
Dimension winners stay the same
The cities leading each of the four dimensions remained unchanged from last year (see figure 3). Melbourne continues to head up personal well-being, New York leads when it comes to economics metrics, San Francisco offers the most innovation, and Zurich ranks highest in governance.
Figure 3 The fastest city
Global Cities Outlook leaders
Global Cities Outlook leaders by metric
Personal well-being
InfrastructureFrankfurt*
GDP per capitaHouston
FDI inflowNew York*
Stability and securityKuwait City
Healthcare evolutionMultiple leaders
Gini coe�icient indexPrague
EnvironmentalperformanceSydney, Melbourne
Patents per capitaSan Francisco
Private investmentsLondon*
University-sponsoredincubatorsMoscow
Quality of bureaucracyMultiple leaders
Ease of doing businessMoscow*
TransparencyLondon
Economics Innovation Governance
Melbourne New York San Francisco Geneva, Zurich
*Indicates new leaders in 2018
Source: A.T. Kearney 2018 Global Cities Report
The economics metric saw the most change, with infrastructure investment topping out in Frankfurt and New York now achieving the highest inflow of foreign direct investment.
Cities that moved up the most in the Outlook since 2016 showed the greatest improvements in economics and governance. Guangzhou climbed 19 spots due to the growth of its infrastructure investment score and improvements in reducing bureaucracy. Meanwhile, increases in foreign direct investment, private investments, and patents bolstered the Chinese city of Xi’an. The transparency score helped improve Vienna’s ranking, and an increased entrepreneurship score
72018 Global Cities ReportView online: bit.ly/2018-Global-Cities
helped Moscow move up in the Outlook. It’s worth noting that the cities that improved spanned the world, reflecting the continued expansion of the global economy.
Finding the fastest city
The theoretical “fastest” city, one whose composite score across all Outlook metrics is 100, is composed of nine cities. Melbourne and Sydney claim top spots in three of the 13 metrics, Moscow and London in two. The race for being the most global city in the future is wide open.
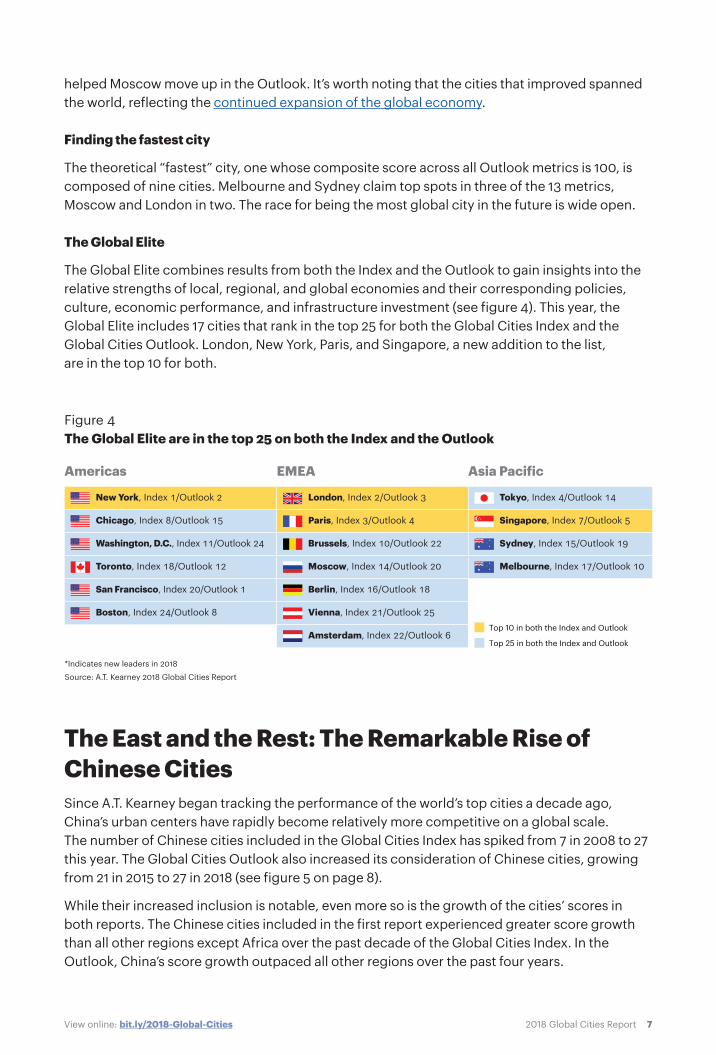
The Global Elite
The Global Elite combines results from both the Index and the Outlook to gain insights into the relative strengths of local, regional, and global economies and their corresponding policies, culture, economic performance, and infrastructure investment (see figure 4). This year, the Global Elite includes 17 cities that rank in the top 25 for both the Global Cities Index and the Global Cities Outlook. London, New York, Paris, and Singapore, a new addition to the list, are in the top 10 for both.
Figure 4 The Global Elite are in the top 25 on both the Index and the Outlook
*Indicates new leaders in 2018
Source: A.T. Kearney 2018 Global Cities Report
Americas EMEA Asia Pacific
New York, Index 1/Outlook 2
Chicago, Index 8/Outlook 15
Washington, D.C., Index 11/Outlook 24
Toronto, Index 18/Outlook 12
San Francisco, Index 20/Outlook 1
Boston, Index 24/Outlook 8
London, Index 2/Outlook 3
Paris, Index 3/Outlook 4
Brussels, Index 10/Outlook 22
Moscow, Index 14/Outlook 20
Berlin, Index 16/Outlook 18
Vienna, Index 21/Outlook 25
Amsterdam, Index 22/Outlook 6
Tokyo, Index 4/Outlook 14
Singapore, Index 7/Outlook 5
Sydney, Index 15/Outlook 19
Melbourne, Index 17/Outlook 10
Top 10 in both the Index and Outlook
Top 25 in both the Index and Outlook
The East and the Rest: The Remarkable Rise of Chinese CitiesSince A.T. Kearney began tracking the performance of the world’s top cities a decade ago, China’s urban centers have rapidly become relatively more competitive on a global scale. The number of Chinese cities included in the Global Cities Index has spiked from 7 in 2008 to 27 this year. The Global Cities Outlook also increased its consideration of Chinese cities, growing from 21 in 2015 to 27 in 2018 (see figure 5 on page 8).
While their increased inclusion is notable, even more so is the growth of the cities’ scores in both reports. The Chinese cities included in the first report experienced greater score growth than all other regions except Africa over the past decade of the Global Cities Index. In the Outlook, China’s score growth outpaced all other regions over the past four years.

82018 Global Cities ReportView online: bit.ly/2018-Global-Cities
The marked improvement begs the questions: What is China doing right, and what can we learn? The short answer—this evolution of China’s cities reflects intentional efforts by national, regional, and local entities to improve the country’s competitiveness. The initiatives have focused on business, governmental, and cultural activities, providing improvements that boost the quality of life for residents, increase the ease of doing business, and attract more investment and attention from global companies.
The evolution of China’s cities reflects intentional efforts by national, regional, and local entities to improve the country’s competitiveness.
Enviable performance and potentialThe scores of the original seven Chinese cities included in the first Global Cities Index have grown at a higher annual rate—1.8 percent—than every region except Africa. In comparison, the scores of North American cities increased by 0.6 percent annually over the past decade, and the scores of the 60 original cities evaluated grew by 1.2 percent. The GCI scores consider factors such as business activity, human capital, information exchange, cultural experience, and political engagement.
Figure 5 Regional growth rates
1 AAGR is average annual growth rate.
Source: A.T. Kearney 2018 Global Cities Report
Global Cities Index score
North America
AAGR1(2008–2018)
0.6%
1.3%
1.2%
1.8%
1.3%
Ave
rage
by
regi
on o
f ori
gina
l 60
citie
s
2010 20142008 2016
34
24
26
20
0
30
28
2018
22
32
18
2012
36
Global Cities Outlook score AAGR1(2015–2018)
1.1%
1.4%
1.2%2.3%
1.4%
Ave
rage
by
regi
on o
f ori
gina
l 60
citie
s20162015 2017
55
0
45
40
2018
50
35
60
Europe All original cities China Asia Pacific (excluding China)
92018 Global Cities ReportView online: bit.ly/2018-Global-Cities
In the Global Cities Outlook, which measures a city’s potential, Chinese cities have also fared well. The scores of the 21 original Chinese cities in our Outlook experienced a 2.3 percent annual increase, more than any other region covered by the report. The scores consider growth in metrics of personal well-being of city residents, economics, local innovation, and governance.
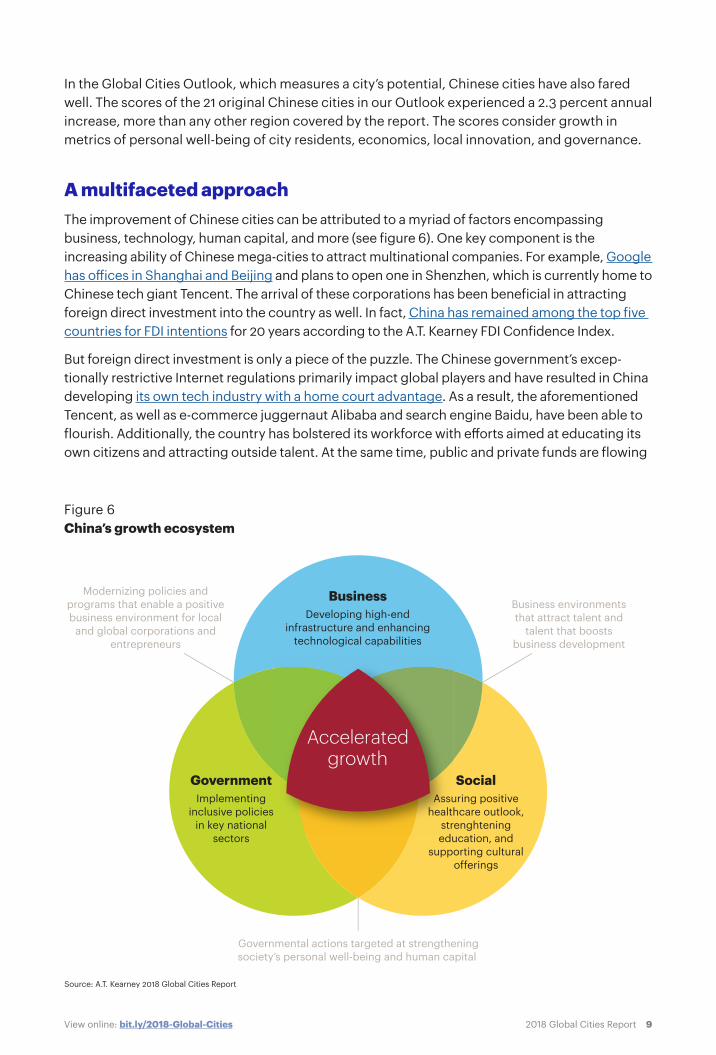
A multifaceted approach The improvement of Chinese cities can be attributed to a myriad of factors encompassing business, technology, human capital, and more (see figure 6). One key component is the increasing ability of Chinese mega-cities to attract multinational companies. For example, Google has offices in Shanghai and Beijing and plans to open one in Shenzhen, which is currently home to Chinese tech giant Tencent. The arrival of these corporations has been beneficial in attracting foreign direct investment into the country as well. In fact, China has remained among the top five countries for FDI intentions for 20 years according to the A.T. Kearney FDI Confidence Index.
But foreign direct investment is only a piece of the puzzle. The Chinese government’s excep-tionally restrictive Internet regulations primarily impact global players and have resulted in China developing its own tech industry with a home court advantage. As a result, the aforementioned Tencent, as well as e-commerce juggernaut Alibaba and search engine Baidu, have been able to flourish. Additionally, the country has bolstered its workforce with efforts aimed at educating its own citizens and attracting outside talent. At the same time, public and private funds are flowing
Figure 6 China’s growth ecosystem
Source: A.T. Kearney 2018 Global Cities Report
GovernmentImplementing
inclusive policiesin key national
sectors
SocialAssuring positive
healthcare outlook,strenghteningeducation, and
supporting culturalofferings
BusinessDeveloping high-end
infrastructure and enhancingtechnological capabilities
Modernizing policies andprograms that enable a positivebusiness environment for local
and global corporations andentrepreneurs
Business environmentsthat attract talent and
talent that boostsbusiness development
Governmental actions targeted at strengtheningsociety’s personal well-being and human capital
Acceleratedgrowth

102018 Global Cities ReportView online: bit.ly/2018-Global-Cities
into the start-up ecosystems in these top-tier cities, making entrepreneurship a new and viable career path while teeing up the next generation of Chinese business success stories.
An urban synergy These efforts and many more come into play when examining how Chinese cities have sustained such phenomenal performance since 2008. But the takeaway for other cities is that these changes aren’t made in a vacuum. Instead, the evolution of these places provides a playbook for how business, government, and social policy can work together at a national, regional, and local level to accelerate growth.
The Chinese cities noted in our report have all benefited from local economic development efforts that were supported and complemented by regional and national initiatives.
For example, while business activity was a dominant driver of the Chinese cities’ GCI score growth, that activity wouldn’t have happened without initiatives that also developed human capital and cultural experiences. The scores for those two areas increased by 5.5 percent and 4.1 percent annually. The initiatives have run the gamut from encouraging the development of new museums to supporting Chinese students studying abroad. Other notable efforts involve reducing the time it takes to start a business in Beijing, decreasing air pollution in many major metro areas, and improving the public transportation systems of multiple cities.
The effect of all these initiatives is synergistic—cities prioritize becoming more livable, enjoyable places, the government makes it easier to do business, and the education system ensures that the talent pool is ready and able to contribute.
Economic development done rightWith the national and regional governments working together on what amounts to an end-to-end urban development program, these top-performing cities have significantly increased their potential for economic success.
So how can other global cities or countries emulate these Chinese municipalities, perhaps with fewer financial or governmental resources?
The first step is to empower municipalities. This seems to be key for spurring multiple efforts. The Chinese cities noted in our report have all benefited from local economic development efforts that were supported and complemented by regional and national initiatives. In an example from Shenzhen, the mayor initiated a project to transition all the city’s buses to electric. The federal government then offered the city a subsidy that made purchasing the new buses possible.
112018 Global Cities ReportView online: bit.ly/2018-Global-Cities
The second key lesson is to take a holistic approach. The Global Cities Index and Outlook account for numerous factors that go far beyond the nuts and bolts of doing business. The Chinese cities that are primed to thrive have addressed numerous aspects that make living and working there appealing, from protecting outdoor spaces to supporting education pathways that provide for promising careers.
A comprehensive strategy to urban development is paying off for China. By focusing on the multiple aspects that make cities great, the country is creating urban hubs that will continue to draw business, talent, and culture from inside—and outside—the country.
Smarter Business Leads to Better Cities The past 10 years have demonstrated the immense power of consistently executing against a comprehensive strategy that advances economics, talent, and cultural factors. Success requires coordination across businesses, governments, and cultural enterprises, but this coordination requires a catalyst. Businesses are best positioned to be this catalyst. By using the insights from Global Cities, businesses can create a competitive advantage for themselves and the cities where they have key operational hubs. This creates a virtuous cycle for those businesses bold enough to be a catalyst and those cities progressive enough to take up the challenge to invest and compete.
Authors
Mike Hales, partner, Chicago [email protected]
Andrés Mendoza Peña, partner, Chicago [email protected]
Erik Peterson, partner, Washington, D.C. [email protected]
Nicole Dessibourg-Freer, consultant, Chicago [email protected]
The authors wish to thank Bernardo Gomez, Victoria Pisini, Courtney McCaffrey, Jefferson Wang, Jessica Mahre, and Hyeong Sun Cho for their contributions to the 2018 Global Cities report.

122018 Global Cities ReportView online: bit.ly/2018-Global-Cities
Appendix
1 In the few cases where city-level data is unavailable, country-level data has been used or sources have been changed to continue to measure thesame sub-metric.
Source: A.T. Kearney 2018 Global Cities Report
Global Cities methodology
• Measures 27 metrics across five dimensions — Business activity (30%): capital flow, market dynamics, and major companies present — Human capital (30%): education levels — Information exchange (15%): access to information through Internet and other media sources — Cultural experience (15%): access to major sporting events, museums, and other expos — Political engagement (10%): political events, think tanks, and embassies• Rank and score are determined by totaling the weighted averages of each dimension to yield a score on a scale of 0 to 100 (100=perfect)• Sources are derived from publicly available city-level data1
Global Cities Index—current performance
• Measures 13 indicators across four dimensions — Personal well-being (25%): safety, healthcare, inequality, and environmental performance — Economics (25%): long-term investments and GDP — Innovation (25%): entrepreneurship through patents, private investments, and incubators — Governance (25%): proxy for long-term stability through transparency, quality of bureaucracy, and ease of doing business• Rank and score are determined by averaging rate of change across each metric using the past five years’ data, then projecting out to 2028. Weighted averages applied to each dimension to yield a score on a scale of 0 to 100 (100=perfect)• Sources are derived from publicly available city-level data1
Global Cities Outlook—future potential
Note: Bold cities were added this year.
Source: A.T. Kearney 2018 Global Cities Report
The 2018 Global Cities analyzes 135 cities
AtlantaBostonChicagoDallasHoustonLos AngelesMiamiMontreal
New YorkPhiladelphiaPhoenixSan FranciscoSeattleTorontoVancouverWashington, D.C.
North America
AmsterdamBarcelonaBerlinBrusselsBudapestCopenhagenDublinDüsseldorfFrankfurtGenevaIstanbulLondon
MadridMilanMoscow MunichParisPragueRomeStockholmSt. PetersburgViennaWarsawZurich
DohaDubaiJeddah
Kuwait CityManamaMuscat
Europe
Belo HorizonteBogotáBuenos AiresCaracasGuadalajaraLimaMexico CityMonterrey
Porto AlegrePueblaRecifeRio de JaneiroSalvadorSantiagoSão Paulo
Latin America
AbidjanAccraAddis AbabaAlexandriaCape TownCasablancaJohannesburg
KhartoumKinshasaLagos
Luanda
Nairobi
Tunis
Africa
Middle East
AhmedabadBandungBangaloreBangkokBeijingChangshaChengduChennaiChongqingDalianDhakaDongguanFoshanGuangzhou
HangzhouHarbinHo Chi Minh Hong KongHyderabadJakartaKarachiKolkataKuala LumpurLahoreManilaMelbourneMumbaiNagoya
Asia Pacific
NanjingNew DelhiNingboOsakaPuneQingdaoQuanzhouSeoulShanghaiShenyangShenzhenSingaporeSurabayaSurat
RiyadhTehranTel Aviv
SuzhouSydneyTaipeiTangshanTianjinTokyoWuhanWuxiXi'anYangon YantaiZhengzhou
Abu DhabiAnkaraBaghdadCairo
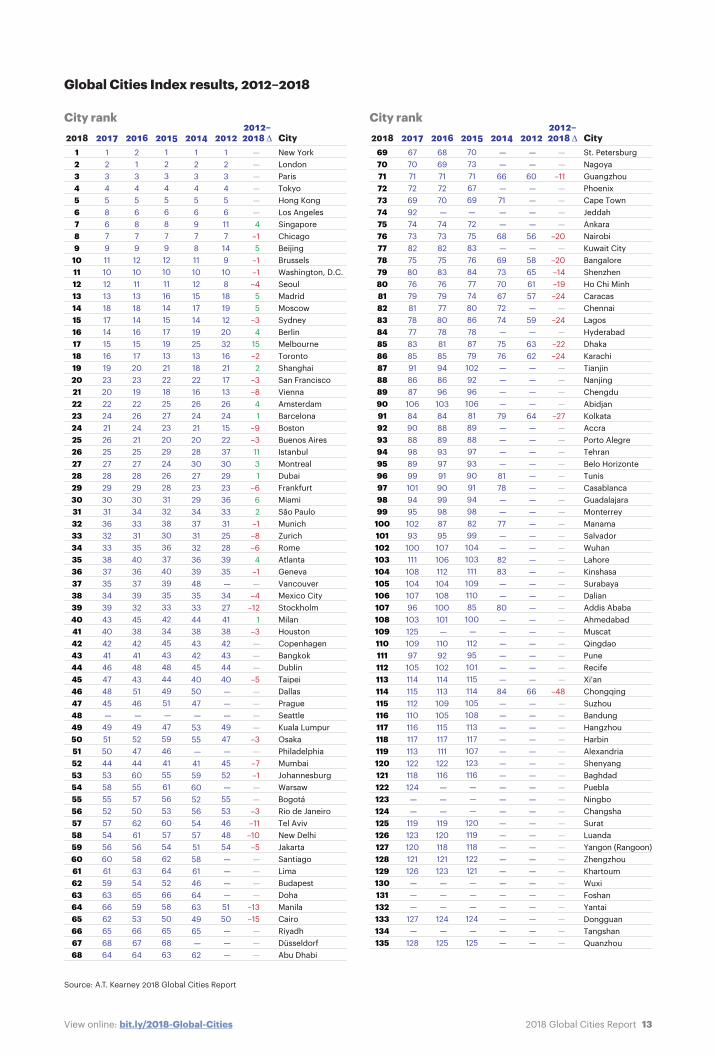
132018 Global Cities ReportView online: bit.ly/2018-Global-Cities
City rank
Global Cities Index results, 2012–2018
Source: A.T. Kearney 2018 Global Cities Report
City rank2018
69707172737475767778798081828384858687888990919293949596979899
100101102103104105106107108109110111112113114115116117118119120121122123124125126127128129130131132133134135
20166869717270 —7473827583767977807881859486961038488899397919099988795107106112104108100101 —11092102114113109105115117111122116 — — —119120118121123 — — —124 —125
20152017677071726992747382758076798178778385918687
106849088988999101949510293
1001111081041079610312510997105114115112110116117113122118124 — —119123120121126 — — —127 —128
7073716769 — 7275837684777480867887791029296106818988979390919498829910410311110911085
100 —11295101115114105108113117107123116 — — —120119118122121 — — —124 —125
CitySt. PetersburgNagoyaGuangzhouPhoenixCape TownJeddahAnkaraNairobiKuwait CityBangaloreShenzhenHo Chi MinhCaracasChennaiLagosHyderabadDhakaKarachiTianjinNanjingChengduAbidjanKolkataAccraPorto AlegreTehranBelo HorizonteTunisCasablancaGuadalajaraMonterreyManamaSalvadorWuhanLahoreKinshasaSurabayaDalianAddis AbabaAhmedabadMuscatQingdaoPuneRecifeXi'anChongqingSuzhouBandungHangzhouHarbinAlexandriaShenyangBaghdadPueblaNingboChangshaSuratLuandaYangon (Rangoon)ZhengzhouKhartoumWuxiFoshanYantaiDongguanTangshanQuanzhou
2014 — —66 —71 — —68 —697370677274 —7576 — — — —79 — — — —8178 — —77 — —8283 — —80 — — — — — —84 — — — — — — — — — — — — — — — — — — — — —
2012 — —60 — — — —56 —58656157 —59 —6362 — — — —64 — — — — — — — — — — — — — — — — — — — — — —66 — — — — — — — — — — — — — — — — — — — — —
2012–2018 ∆
——
–11————
–20—
–20–14–19–24
—–24
—–22–24
————
–27——————————————————————
–48—————————————————————
2018123456789
1011121314151617181920212223242526272829303132333435363738394041424344454647484950515253545556575859606162636465666768
20162134568791210111318141615172023192226242125272829303433313540363739324538424148435146 —4952474460555750626156586354655953666764
201520171234586791110121318171415161923202224212625272829303136323338373534394340424146474845 —4951504453585552575456606159636662656864
1234568791210111614151719132122182527232029242628313238303637403935334234454348444951 —4759464155615653605754626452665850656863
CityNew YorkLondonParisTokyoHong KongLos AngelesSingaporeChicagoBeijingBrusselsWashington, D.C.SeoulMadridMoscowSydneyBerlinMelbourneTorontoShanghaiSan FranciscoViennaAmsterdamBarcelonaBostonBuenos AiresIstanbulMontrealDubaiFrankfurtMiamiSão PauloMunichZurichRomeAtlantaGenevaVancouverMexico CityStockholmMilanHoustonCopenhagenBangkokDublinTaipeiDallasPragueSeattleKuala LumpurOsakaPhiladelphiaMumbaiJohannesburgWarsawBogotáRio de JaneiroTel AvivNew DelhiJakartaSantiagoLimaBudapestDohaManilaCairoRiyadhDüsseldorfAbu Dhabi
20141234569781110121517141925131822162624212028302723293437313236394835334438434245405047 —5355 —415960525654575158614664634965 —62
2012123456117149108181912203216211713262415223730292336333125283935 —3427413842434440 — — —4947 —4552 —5553464854 — — — —5150 — — —
2012–2018 ∆
——————4
–15
–1–1–4
55
–34
15–22
–3–841
–9–31131
–662
–1–8–64
–1—–4
–121
–3———–5————–3—–7–1——–3–11
–10–5————
–13–15
———

142018 Global Cities ReportView online: bit.ly/2018-Global-Cities
City rank
Global Cities Outlook results, 2016–2018
Source: A.T. Kearney 2018 Global Cities Report
City rank2018
123456789
1011121314151617181920212223242526272829303132333435363738394041424344454647484950515253545556575859606162636465666768
20161241317893515718101911162514123531222427416
3038402120 —284729373923333443264844324542494651365053575960 —58785554 —62636185 —56
20171243111675869
2012231514241813103228211929172227302526 —404233343144413736464339383545494852504751545762 —58565553— 65616482— 59
CitySan FranciscoNew YorkLondonParisSingaporeAmsterdamMunichBostonHoustonMelbourneStockholmTorontoZurichTokyoChicagoGenevaVancouverBerlinSydneyMoscowMontrealBrusselsCopenhagenWashington, D.C.ViennaAtlantaDüsseldorfPragueFrankfurtLos AngelesDallasSeattleDublinNagoyaMilanPhoenixWarsawTaipeiOsakaBarcelonaPhiladelphiaDubaiTel AvivMiamiSeoulSt. PetersburgBeijingRomeMadridAbu DhabiSantiagoShenzhenBudapestHong KongSuzhouNanjingWuxiKuwait CityGuangzhouBuenos AiresKuala LumpurNingboDohaShanghaiTianjinXi'anChangshaMexico City
2016–2018 ∆——19
1222
–5–4
5–46
–35
–4—8
–4–71510—13
16–20
31011
–9–11—–513–6
12
–15–6–6
2–16
5—
–13–1–5
1–3
1–15–2—344
——19–5–7—–1–1–419—
–12
201869707172737475767778798081828384858687888990919293949596979899
100101102103104105106107108109110111112113114115116117118119120121122123124125126127128129130131132133134135
2016—
696877 —79 —7571526581828997847464 —9066927287707376806791 —83868810494103 —969810293
1001151081101051111061139510910111211811610711911499120117121123122125124
2017—606770 —72—7771636978848374857576948968926680739079888187
10691989610595102939997
10410086108107109101111113114103110115112118116119122120117121123124126125128127
CityFoshanHangzhouWuhanQuanzhouYantaiDalianTangshanChengduShenyangBogotáLimaHarbinDongguanBangkokHo Chi MinhZhengzhouManilaGuadalajaraJeddahChongqingRio de JaneiroQingdaoRiyadhMumbaiSão PauloBangaloreNew DelhiIstanbulMonterreyHyderabadMuscatManamaAnkaraBelo HorizonteCasablancaAhmedabadPunePueblaPorto AlegreChennaiJohannesburgRecifeKolkataYangon (Rangoon)Cape TownJakartaSuratBandungAbidjanTunisSalvadorSurabayaNairobiCairoTehranAlexandriaAccraBaghdadLahoreKarachiKinshasaCaracasAddis AbabaLuandaLagosKhartoumDhaka
2016–2018 ∆—–1–3
5—5
—–1–6
–26–14
117
14—
–11–22
—2
–232
–19–5
–23–21–19–16
–30–7—
–17–15–14
1–10–2—
–11–10
–7–17–11
3–5–4
–10–5–11–5
–24–11
–20–10–5–8
–18–7
–13–29
–9–13–10–9–11–9–11
A.T. Kearney Korea LLC is a separate and independent legal entity operating under the A.T. Kearney name in Korea.
A.T. Kearney operates in India as A.T. Kearney Limited (Branch Office), a branch office of A.T. Kearney Limited, a company organized under the laws of England and Wales.
© 2018, A.T. Kearney, Inc. All rights reserved.
For more information, permission to reprint or translate this work, and all other correspondence, please email: [email protected].
The signature of our namesake and founder, Andrew Thomas Kearney, on the cover of this document represents our pledge to live the values he instilled in our firm and uphold his commitment to ensuring “essential rightness” in all that we do.
A.T. Kearney is a leading global management consulting firm with offices in more than 40 countries. Since 1926, we have been trusted advisors to the world’s foremost organizations. A.T. Kearney is a partner-owned firm, committed to helping clients achieve immediate impact and growing advantage on their most mission-critical issues. For more information, visit www.atkearney.com.
Americas
Asia Pacific
Europe
Middle East and Africa
AtlantaBogotáBostonCalgary Chicago
DallasDetroitHoustonMexico CityNew York
San FranciscoSão PauloTorontoWashington, D.C.
BangkokBeijingBrisbaneHong KongJakarta
Kuala LumpurMelbourneMumbaiNew DelhiPerth
SeoulShanghaiSingaporeSydneyTokyo
Abu DhabiDoha
DubaiIstanbul
JohannesburgRiyadh
AmsterdamBerlinBrusselsBucharestCopenhagenDüsseldorfLisbon
LjubljanaLondonMadridMilanMoscowMunichOslo
ParisPragueRomeStockholmViennaWarsawZurich