Embed Size (px)
Citation preview

Learn to Use Bayesian Inference in
SPSS With Data From the National
Child Measurement Programme
(2016–2017)
© 2019 SAGE Publications Ltd. All Rights Reserved.
This PDF has been generated from SAGE Research Methods Datasets.

Learn to Use Bayesian Inference in
SPSS With Data From the National
Child Measurement Programme
(2016–2017)
Student Guide
Introduction
This example dataset introduces Bayesian Inference. Bayesian statistics (the
general name for all Bayesian-related topics, including inference) has become
increasingly popular in recent years, due predominantly to the growth of evermore
powerful and sophisticated statistical software. However, Bayesian statistics grew
from the ideas of an English mathematician, Thomas Bayes, who lived and
worked in the first half of the 18th century and have been refined and adapted by
statisticians and mathematicians ever since. Despite its longevity, the Bayesian
approach did not become mainstream: the Frequentist approach was and remains
the dominant means to conduct statistical analysis. However, there is a renewed
interest in Bayesian statistics, part prompted by software development and part
by a growing critique of the limitations of the null hypothesis significance testing
which dominates the Frequentist approach. This renewed interest can be seen in
the incorporation of Bayesian analysis into mainstream statistical software, such
as, IBM® SPSS® and in many major statistics text books.
Bayesian Inference is at the heart of Bayesian statistics and is different from
Frequentist approaches due to how it views probability. In the Frequentist
approach, probability is the product of the frequency of random events occurring
SAGE
2019 SAGE Publications, Ltd. All Rights Reserved.
SAGE Research Methods Datasets Part
2
Page 2 of 19 Learn to Use Bayesian Inference in SPSS With Data From the National
Child Measurement Programme (2016–2017)

over a long series of repeated trials/experiments. For example, if we want to
calculate the probability of seeing tails in a coin toss, the Frequentist approach
posits that the more times we toss a coin, the proportion of times we get tails
will tend towards the “true” probability of the coin coming up tails. Crucially, the
researcher does not incorporate prior knowledge (e.g., the coin’s composition
or prior coin toss experiments) into the test. In contrast, Bayesian Inference
incorporates prior knowledge. For example, we may have a hunch that the coin
used in the test is flawed and may favour one side over another or we may find
that in the first series of tosses, the same side always comes up.
This prior belief about the fairness of the coin is taken into account when we
review the final result: Let’s say out of 1,000 flips, we got 800 tails, the coin
is biased. In the Bayesian approach, we would modify our final view of the
coin (the posterior belief) on the basis of our earlier (prior belief) observations.
Thus, Bayesian Inference allows for the incorporation of prior knowledge, whether
from other studies, observations, or even subjective experience. The Frequentist
approach, built on the null hypothesis, assumes no prior knowledge; Bayesian
Inference does not use null hypotheses.
Bayesian Inference can be applied to a range of statistical tests and analyses;
Bayesian statistics can be complex, and this Guide provides only an introductory
review. This Guide will outline Bayesian Inference generally and will then provide
a specific example of how to conduct Bayesian Inference in an Independent
Samples t test. An Independent Samples t test examines whether the mean of
a continuous (e.g., age, height, weight) variable differs across the two levels or
categories of a dichotomous categorical (e.g., male/female or rich/poor) variable.
This example describes an Independent Samples t test using Bayesian Inference,
discusses the assumptions underlying it, and shows how to compute and interpret
it. We illustrate an Independent Samples t test using Bayesian Inference using
a subset of data from the 2016–2017 National Child Measurement Programme
SAGE
2019 SAGE Publications, Ltd. All Rights Reserved.
SAGE Research Methods Datasets Part
2
Page 3 of 19 Learn to Use Bayesian Inference in SPSS With Data From the National
Child Measurement Programme (2016–2017)
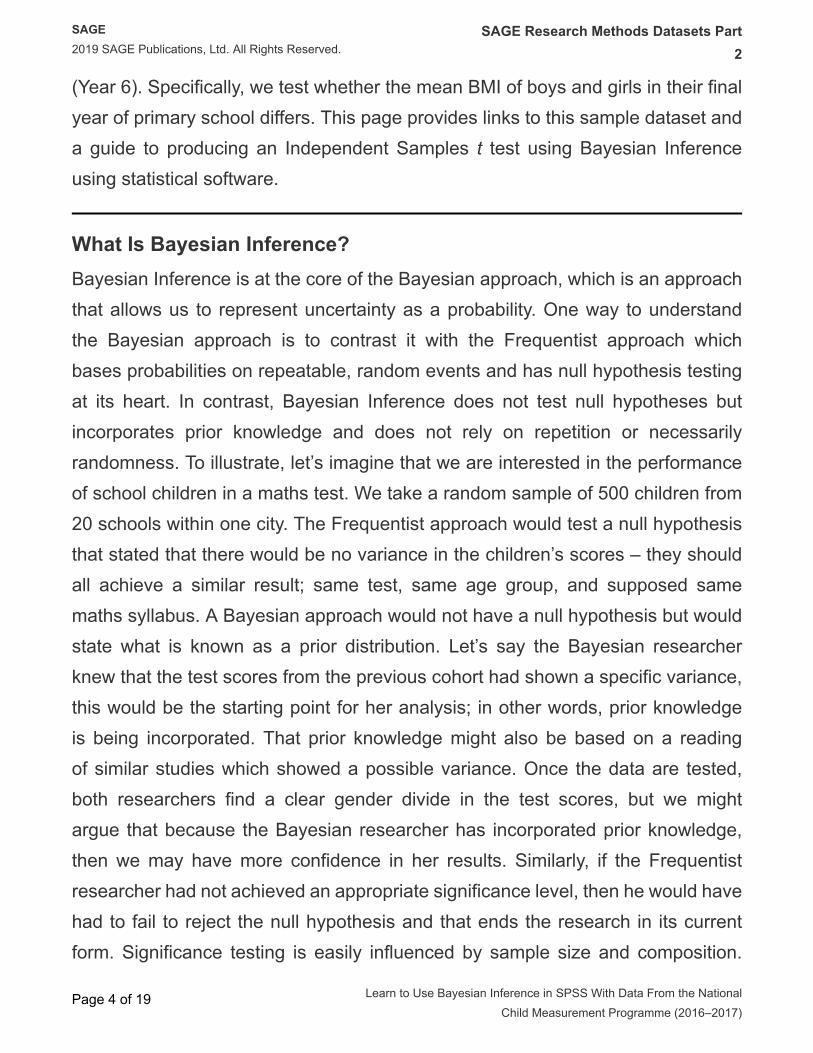
(Year 6). Specifically, we test whether the mean BMI of boys and girls in their final
year of primary school differs. This page provides links to this sample dataset and
a guide to producing an Independent Samples t test using Bayesian Inference
using statistical software.
What Is Bayesian Inference?
Bayesian Inference is at the core of the Bayesian approach, which is an approach
that allows us to represent uncertainty as a probability. One way to understand
the Bayesian approach is to contrast it with the Frequentist approach which
bases probabilities on repeatable, random events and has null hypothesis testing
at its heart. In contrast, Bayesian Inference does not test null hypotheses but
incorporates prior knowledge and does not rely on repetition or necessarily
randomness. To illustrate, let’s imagine that we are interested in the performance
of school children in a maths test. We take a random sample of 500 children from
20 schools within one city. The Frequentist approach would test a null hypothesis
that stated that there would be no variance in the children’s scores – they should
all achieve a similar result; same test, same age group, and supposed same
maths syllabus. A Bayesian approach would not have a null hypothesis but would
state what is known as a prior distribution. Let’s say the Bayesian researcher
knew that the test scores from the previous cohort had shown a specific variance,
this would be the starting point for her analysis; in other words, prior knowledge
is being incorporated. That prior knowledge might also be based on a reading
of similar studies which showed a possible variance. Once the data are tested,
both researchers find a clear gender divide in the test scores, but we might
argue that because the Bayesian researcher has incorporated prior knowledge,
then we may have more confidence in her results. Similarly, if the Frequentist
researcher had not achieved an appropriate significance level, then he would have
had to fail to reject the null hypothesis and that ends the research in its current
form. Significance testing is easily influenced by sample size and composition.
SAGE
2019 SAGE Publications, Ltd. All Rights Reserved.
SAGE Research Methods Datasets Part
2
Page 4 of 19 Learn to Use Bayesian Inference in SPSS With Data From the National
Child Measurement Programme (2016–2017)

In contrast, the Bayesian researcher could continue to collect and analyse data,
incorporating new findings into her probability calculation, for example, as her
research expands, the gender difference may decline and she may start to find
that household income or syllabus becomes more prominent, thus, this approach
is more flexible and in a sense intuitive. In simple terms, a Frequentist researcher
would calculate the betting odds of a horse race as equal across all the horses,
whereas the Bayesian researcher would incorporate prior racing form into the
calculation.
Calculating Bayesian Inference
Bayes’ Theorem
At the heart of Bayesian Inference is Bayes’ Theorem, Equation 1 below:
P(A \ B) =P (B \ A)P(A)
P(B)
where:
• P(A\B) = probability of A given B
• P(B\A) = probability of B given A
• P(A) = probability of A
• P(B) = probability of B
P(A\B) and P(B\A) are known as conditional probabilities, which is the
probability of one event (A or B) occurring given another event (A or B) has
already occurred. To illustrate, let’s imagine that you work all day in a windowless
lab, and as the end of your working day nears, you wonder what’s the chance it is
raining? You wonder this because you forgot to wear a raincoat today. You quickly
calculate the probability of rain in the city where you live based on meteorological
data for your home town, which is 0.16. This is a low probability, and so you feel
SAGE
2019 SAGE Publications, Ltd. All Rights Reserved.
SAGE Research Methods Datasets Part
2
Page 5 of 19 Learn to Use Bayesian Inference in SPSS With Data From the National
Child Measurement Programme (2016–2017)

less worried about the missing raincoat. As you walk towards the exit, your boss
appears; as it has been sunny recently, your boss has been very grumpy as he
hates the sun, so you quickly calculate that the probability of him being happy is
0.3. However, he is smiling and laughing, which makes you wonder again whether
it is raining, as his mood is affected greatly by the weather; he especially likes
rain. Let’s say that the probability that he’s happy because it is raining is 0.95. You
now wonder whether you should have brought your raincoat, so you use Bayes’
Theorem to calculate the probability that it is raining given that your boss is happy.
P(A \ B) =0.95 × 0.16
0.3= 0.507
where:
• P(A\B) = probability that it is raining because your boss is happy = 0.507
• P(B\A) = probability that your boss is happy given that it is raining = 0.95
• P(A) = probability that it is raining = 0.16
• P(B) = probability that your boss is happy = 0.3
The probability of it raining because your boss is happy is 0.507 or 50.7%;
therefore, it is more likely to be raining outside than not raining, shame that you
don’t have your raincoat.
Conducting Bayesian Analysis: Prior and Posterior Distributions
Bayesian analysis uses different terminology to Frequentist, so it is useful to
review it alongside the key steps in a Bayesian approach.
Prior Distributions
The first step in a Bayesian analysis is to specify what is known as the Prior
Distribution. As noted previously, one of the core differences in Bayesian
Inference is that existing knowledge can be incorporated into the calculation of
SAGE
2019 SAGE Publications, Ltd. All Rights Reserved.
SAGE Research Methods Datasets Part
2
Page 6 of 19 Learn to Use Bayesian Inference in SPSS With Data From the National
Child Measurement Programme (2016–2017)

probabilities and the wider statistical model. This prior knowledge is known as
Prior Distributions or Priors. In all Bayesian analysis, you have to specify Prior
Distributions for all parameters in the model (e.g., means, regression coefficients,
etc.). These Prior Distributions are based on our existing knowledge of the
parameters before observing our data; they may be based on previous studies
and/or existing literature. Prior Distributions take the shape of different probability
distributions, for example, a normal distribution. There are two types of Prior
Distributions:
• Non-informative distributions. This type is used when we have no clear
reason to expect one value over another and ranges from 0 to +/− infinity.
This distribution is rectangular in shape (see Figure 1), although it will look
like a straight line in most graphs that don’t go to +/− infinity. We use this
type of Prior when we do not want to specify any prior knowledge.
• Informative distributions. This type is used when we want to take into
account prior knowledge. Often these distributions will take the shape of
a normal distribution and vary by mean and variance (see Figure 2). The
variance will vary by how certain you are that the parameter value will fall
close to the estimate; low variance means high certainty and high variance
means low certainty.
Figure 1: A Non-Informative Distribution.
Figure 2: An Informative Distribution.
SAGE
2019 SAGE Publications, Ltd. All Rights Reserved.
SAGE Research Methods Datasets Part
2
Page 7 of 19 Learn to Use Bayesian Inference in SPSS With Data From the National
Child Measurement Programme (2016–2017)

In Bayesian statistics, the variance of our Prior Distribution is usually referred
to as precision; the higher the precision, the more confident we are that the
Prior mean reflects the population mean. Distributions with higher precision will
be more peaked, with a smaller variance and vice versa. Figure 2 shows a flatter
distribution suggesting a larger variance and lower precision.
Observed Data
Once the Prior Distribution is established, you can then conduct your analysis
on your observed data. Here, we would look at the observed evidence for the
parameters (e.g., mean, variance) in the actual data. These parameters are
calculated using a likelihood function, which tells us the most likely values for the
unknown parameters given our data.
Posterior Distributions
The final step in a Bayesian analysis is to obtain what is known as the Posterior
Distribution using Bayes’ Theorem (see Equation 1). Our Prior Distribution
(essentially our prior knowledge) is updated/modified by our observed data
analysis, and from this, we can specify our Posterior Distribution (essentially our
updated knowledge). The Posterior Distribution is usually obtained by Markov
Chain Monte Carlo Methods via statistical software.
Figure 3: Non-Informative Prior Distribution, Distribution of Observed
Data, and Posterior Distribution.
SAGE
2019 SAGE Publications, Ltd. All Rights Reserved.
SAGE Research Methods Datasets Part
2
Page 8 of 19 Learn to Use Bayesian Inference in SPSS With Data From the National
Child Measurement Programme (2016–2017)

Figure 3 demonstrates the contrast between the three steps of Bayesian analysis
if the Prior is a non-informative distribution. We can see that the Prior distribution is
rectangular, the observed data distribution (the middle histogram) is approximately
normal, as is the Posterior distribution (bottom histogram). Typically, when the
Prior is non-informative, the Posterior distribution and the observed distribution will
be similar. Contrast this with Figure 4, where an informative Prior has been set.
Figure 4: Informative Prior Distribution, Distribution of Observed
Data, and Posterior Distribution.
SAGE
2019 SAGE Publications, Ltd. All Rights Reserved.
SAGE Research Methods Datasets Part
2
Page 9 of 19 Learn to Use Bayesian Inference in SPSS With Data From the National
Child Measurement Programme (2016–2017)

We have used an informative Prior distribution in Figure 4, based on data from a
previous study, with a mean of 17. The distribution of the observed data is slightly
different from the Prior but still approximately normal; the Posterior distribution,
modified by the previous distributions, provides us with a mean of 17.4.
To summarise the relationship between the Prior distribution, observed data, and
Posterior distribution in terms of updating or modifying our knowledge:
• If we had little or no knowledge to begin with (i.e., a non-informative Prior),
whatever we learnt from our observed data would typically update our
knowledge (i.e., our Posterior distribution).
• If we had some knowledge to begin with (i.e., an informative Prior) and
the observed data confirmed this, then we would be more confident about
our initial knowledge. In a sense, the more knowledge we start with that
is then confirmed by the data, then the greater our confidence about this
knowledge.
SAGE
2019 SAGE Publications, Ltd. All Rights Reserved.
SAGE Research Methods Datasets Part
2
Page 10 of 19 Learn to Use Bayesian Inference in SPSS With Data From the National
Child Measurement Programme (2016–2017)

• If we started with some knowledge but our observed data went against
it, then our updated knowledge would be somewhere between the other
positions, depending on how confident we were in that initial knowledge.
Credible Intervals (CIs)
In Frequentist approaches, confidence intervals are used as one of a series of
elements to assess our findings. Bayesian statistics does not use confidence
intervals but something called credible intervals. The 95% CI is the central 95%
of the Posterior Distribution, the range in which we think that it is 95% likely that
the true figure lies, based on our Prior and observed data. To illustrate, the data in
Figure 4 had a Posterior Mean of 17.373 and a CI of 17.01–17.73, suggesting we
can be 95% confident in the Posterior Mean.
Illustrative Example: Is There a Difference in Mean BMI Between Boys
and Girls?
This example presents an Independent Samples t test using Bayesian Inference.
This example uses three variables from the 2016–2017 National Child
Measurement Programme (Year 6). Specifically, we are interested in whether
there is a difference in mean BMI between boys and girls in their final year (Year 6)
at primary school. Thus, this example addresses the following research question:
Is there a statistically significant gender difference in mean BMI amongst
school children?
As noted earlier, Bayesian Inference is becoming increasingly popular and can be
used in a range of statistical analyses/tests. Our example of Bayesian Inference is
in the context of an Independent Samples t test.
The Data
SAGE
2019 SAGE Publications, Ltd. All Rights Reserved.
SAGE Research Methods Datasets Part
2
Page 11 of 19 Learn to Use Bayesian Inference in SPSS With Data From the National
Child Measurement Programme (2016–2017)

This example uses a subset of data from the 2016–2017 National Child
Measurement Programme (Year 6). It should be noted that these data have been
cleaned and have fewer variables than the original data source. This extract
includes 65,394 children. The two variables we examine are:
• Child’s BMI (BMI)
• Child’s gender (Gender)
The first variable (BMI) is continuous, and child’s gender (Gender) is coded 1 if a
respondent reports male and 2 if female.
Analysing the Data
Univariate Analysis
Prior to conducting any statistical tests, it is useful to examine each variable in
isolation. Table 1 presents the frequency distribution for Gender.
Table 1: Frequency Distribution of Gender.
Frequency Valid percent Cumulative percent
Male 33,021 50.5 50.5
Female 32,373 49.5 100.0
Total 65,394 100.0 100.0
We can see that there is an almost equal number of males and females
(50.5%/49.5%); we should also note that there are no missing cases. Table 2
shows the frequency distribution for BMI.
Table 2: Frequency Distribution of BMI.
BMI
SAGE
2019 SAGE Publications, Ltd. All Rights Reserved.
SAGE Research Methods Datasets Part
2
Page 12 of 19 Learn to Use Bayesian Inference in SPSS With Data From the National
Child Measurement Programme (2016–2017)

N
Valid 65,394
Missing 0
Mean 19.55296374733664
Median 18.63742715415400
Standard deviation 3.983687225063199
Variance 15.870
Range 28.483360670392
Minimum 11.901718772352
Maximum 40.385079442744
The mean BMI is 19.55, which is deemed a healthy BMI for the 11–12 age group.
The standard deviation is small suggesting, if the data is normally distributed, that
the majority of children’s BMI’s fall between 15.57 and 23.53. The range is large
suggesting that the distribution is possibly skewed, which is confirmed by review
of the histogram in Figure 5.
Figure 5: Histogram of BMI.
SAGE
2019 SAGE Publications, Ltd. All Rights Reserved.
SAGE Research Methods Datasets Part
2
Page 13 of 19 Learn to Use Bayesian Inference in SPSS With Data From the National
Child Measurement Programme (2016–2017)

Frequentist Approach to an Independent Samples t Test
Earlier, this Guide discussed the difference between Frequentist and Bayesian
approaches. It is useful to contrast the two. We will start by testing our data the
Frequentist way, which starts with the formulation of a null hypothesis:
H0 = There is no difference between males and females and mean BMI
H1 = There is a difference between males and females and mean BMI
Our data, within the Frequentist approach, have to be randomly collected with
independence of observations; it meets this criteria. In addition, to conduct an
Independent Samples t test, our data should also meet the assumptions of the
Linear model: normality and homogeneity, which again it does. We can then run
SAGE
2019 SAGE Publications, Ltd. All Rights Reserved.
SAGE Research Methods Datasets Part
2
Page 14 of 19 Learn to Use Bayesian Inference in SPSS With Data From the National
Child Measurement Programme (2016–2017)

our test using statistical software. Table 3 shows the basic descriptive statistics for
our data.
Table 3: Frequency Distribution of Gender and BMI.
Frequency Mean Standard deviation
Male 33,021 19.36893950598726 3.957284256993408
Female 32,373 19.74067154314095 4.001791739872280
Table 3 shows that the male mean BMI (19.36) is slightly less than the female
(19.74), but this difference is not great, which may suggest no significant
difference between the two. Table 4 shows the results of the Independent Samples
t test.
Table 4: Independent Samples t Test.
95% credible interval
t df Sig. Mean difference Lower Upper
Child’s BMI equal variances
assumed −11.944 65,392 0.000 −.371732037153691 −.432735394730461 −.310728679576922
We can see that p = .00, mean difference is −371, and CIs −432 to −310, so in a
Frequentist approach, we would reject the null of no difference in the mean BMIs.
The probability of finding a difference of this or larger magnitude is 0%. The CIs
tell us that 95% of the time the true mean difference will fall in this range.
Bayesian Inference Using an Independent Samples t Test
In the Bayesian approach, we do not need a null hypothesis. Given that we have
probably read other research studies that show a gender difference in mean BMI
and that our own univariate analysis showed a gender difference in mean BMI, we
can pose the following questions:
SAGE
2019 SAGE Publications, Ltd. All Rights Reserved.
SAGE Research Methods Datasets Part
2
Page 15 of 19 Learn to Use Bayesian Inference in SPSS With Data From the National
Child Measurement Programme (2016–2017)

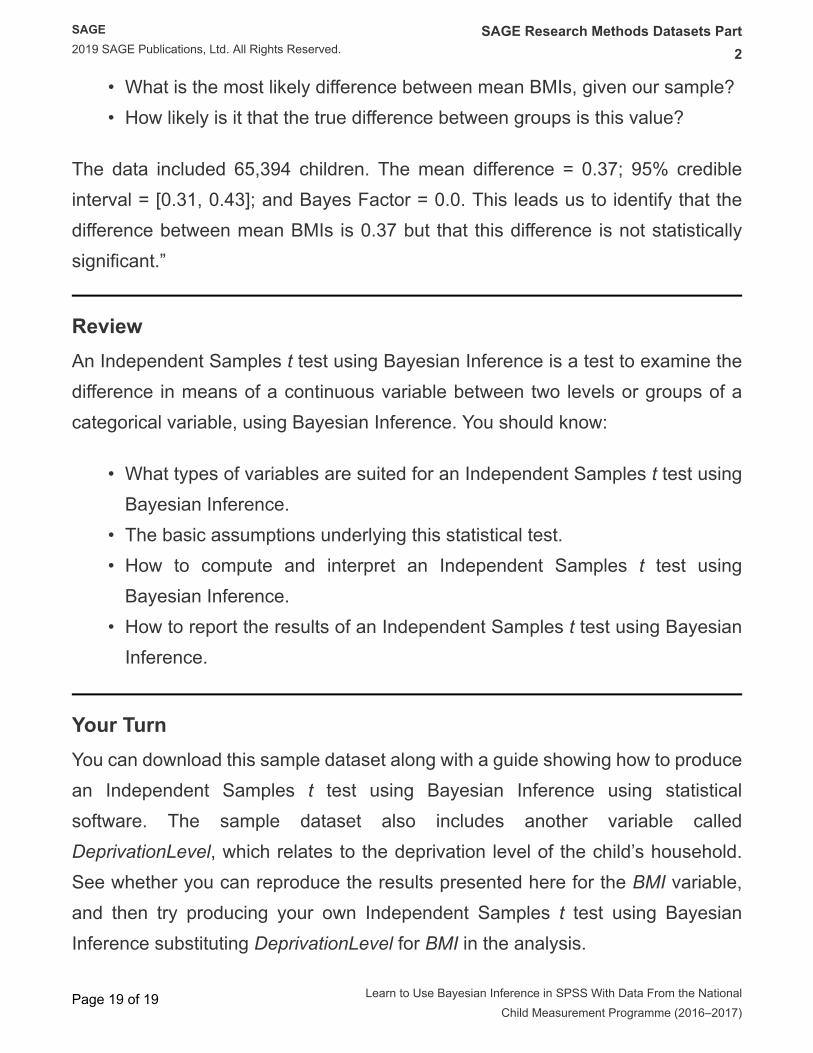
• What is the most likely difference between mean BMIs, given our sample?
• How likely is it that the true difference between groups is this value?
The first step is to establish a Prior Distribution. In our example, we will use a non-
informative Prior for the mean and variance. Tables 5, 6, and 7 and Figure 6 show
the results of our analysis.
Table 5: Group Statistics.
Group statistics
Frequency Mean Standard deviation
Male 33,021 19.36893950598747 3.957284256993265
Female 32,373 19.74067154314118 4.001791739872188
Table 6: Bayes Factor Independent Sample Test.
Bayes factor independent sample test (method = Rouder)
Mean difference Pooled standard error difference Bayes factor t df Sig.
BMI .37173203715372 .031124167709225 .000 11.944 65,392 0.000
Table 7: Posterior Distribution.
Posterior distribution characterisation for independent sample mean
Posterior 95% credible interval
Mode Mean Variance Lower bound Upper bound
BMI .37173203715372 .37173203715372 .001 .31072098480391 .43274308950352
As you will note, the outputs for the Bayesian Independent Samples t test looks
very similar in many ways to the Frequentist approach to the test. Table 5 provides
us with the same descriptive statistics as Table 3. In Tables 6 and 7, we can
see that the mean difference is the same as in Table 4. However, we can see
differences in the outputs. In Table 7, we get the 95% CI which tells us that
SAGE
2019 SAGE Publications, Ltd. All Rights Reserved.
SAGE Research Methods Datasets Part
2
Page 16 of 19 Learn to Use Bayesian Inference in SPSS With Data From the National
Child Measurement Programme (2016–2017)

we are 95% certain that the mean difference in BMI is between 0.31 and 0.43;
as our mean difference is 0.37, we can be confident that this difference is an
accurate reflection of the population. In Table 6, we have the Bayes Factor (BF
= 0) which is the measure of the relative likelihood between two hypotheses. For
example, a Bayes Factor of 10 means that the observed data is ten times more
likely under the alternate hypothesis than the null. Bayes Factors range from 0 to
infinity; values less than 1 support the null hypothesis as being more likely than
the alternate hypothesis. Values between 1 and 3 are considered still more likely
to support the null hypothesis, while values greater than 10 are stronger evidence
for the alternate hypothesis. Figure 6 shows the histograms of the distributions
generated from the analysis; because we used a non-informative Prior, the Log
Likelihood and Posterior distributions look similar.
Figure 6: Histograms for Bayesian Independent Samples t Test.
SAGE
2019 SAGE Publications, Ltd. All Rights Reserved.
SAGE Research Methods Datasets Part
2
Page 17 of 19 Learn to Use Bayesian Inference in SPSS With Data From the National
Child Measurement Programme (2016–2017)

To summarise, we can state that following our Bayesian analysis, the most likely
difference between mean BMIs is 0.37; however, our BF = 0.0, which tells us that
the null is a more probable explanation for the data than the alternate. In other
words, the difference in mean BMI between boys and girls is not significant.
Presenting Results
An Independent Samples t test using Bayesian Inference can be reported as
follows:
“We used a subset of data from the 2016–2017 National Child Measurement
Programme (Year 6) to examine whether there was a statistically significant
difference in mean BMI between boys and girls aged 11. Thus, we tested the
following questions:
SAGE
2019 SAGE Publications, Ltd. All Rights Reserved.
SAGE Research Methods Datasets Part
2
Page 18 of 19 Learn to Use Bayesian Inference in SPSS With Data From the National
Child Measurement Programme (2016–2017)
• What is the most likely difference between mean BMIs, given our sample?
• How likely is it that the true difference between groups is this value?
The data included 65,394 children. The mean difference = 0.37; 95% credible
interval = [0.31, 0.43]; and Bayes Factor = 0.0. This leads us to identify that the
difference between mean BMIs is 0.37 but that this difference is not statistically
significant.”
Review
An Independent Samples t test using Bayesian Inference is a test to examine the
difference in means of a continuous variable between two levels or groups of a
categorical variable, using Bayesian Inference. You should know:
• What types of variables are suited for an Independent Samples t test using
Bayesian Inference.
• The basic assumptions underlying this statistical test.
• How to compute and interpret an Independent Samples t test using
Bayesian Inference.
• How to report the results of an Independent Samples t test using Bayesian
Inference.
Your Turn
You can download this sample dataset along with a guide showing how to produce
an Independent Samples t test using Bayesian Inference using statistical
software. The sample dataset also includes another variable called
DeprivationLevel, which relates to the deprivation level of the child’s household.
See whether you can reproduce the results presented here for the BMI variable,
and then try producing your own Independent Samples t test using Bayesian
Inference substituting DeprivationLevel for BMI in the analysis.
SAGE
2019 SAGE Publications, Ltd. All Rights Reserved.
SAGE Research Methods Datasets Part
2
Page 19 of 19 Learn to Use Bayesian Inference in SPSS With Data From the National
Child Measurement Programme (2016–2017)