Embed Size (px)
Citation preview

DIPARTIMENTO DI INGEGNERIA DELL’ENERGIA DEI SISTEMI, DEL TERRITORIO E DELLE COSTRUZIONI
RELAZIONE PER IL CONSEGUIMENTO DELLA
LAUREA MAGISTRALE IN INGEGNERIA GESTIONALE
Lean Kitting A study about waste elimination and improvement
opportunities in low-volume/high-variety kitting processes
RELATORI IL CANDIDATO Prof. Ing. Gino Dini Marta Lupi
Dipartimento di Ingegneria Civile e Industriale [email protected]
Dott. Peter Ball
Academic Supervisor, Cranfield University
Dott. Andrew Carroll
Head of the AIT department, Airbus Defence and Space
Sessione di Laurea del 24/09/2014
Anno Accademico 2013/2014 Consultazione NON consentita
Lean Kitting Marta Lupi
ii
Marta Lupi
Sommario
Abstract
The kitting process is a practice used by all kinds of companies to drive the assembly operations. Wastes
and inefficiencies can slow down the pace of this process, causing quality and productivity issues, and the
understanding of this problem is the starting point for the application of the lean concepts and creation of a
leaner kitting process. However, while the literature has always focused on studying the best practices for
the improvement of high-volume/low-variety environments, little attention have been paid to how the lean
features may fit in different types of environments. This represents the challenge faced by the research
and the gap where the creation of a methodology to evaluate and address the most common kitting issues
fits as the main objective. In order to gain a deep understanding of the lean kitting process, an industrial
case study was used to support the development and test the research. The methodology created
incorporates the research of the best practice and a bottom-up problem analysis. Furthermore, the
definition of the kitting requirements and possible industrial constraints has been essential steps for the
creation of an ideal and a realistic solution proposal. This research project derives from the Individual
Project that was developed at Cranfield University in the period May/September 2014.
Il processo di kitting rappresenta una pratica utilizzata da ogni tipo di azienda per guidare le operazioni di
assemblaggio. Potenziali sprechi e inefficienze che possono rallentare il ritmo di questo processo multi-
livello, causando problemi di produttività e qualità, sono il punto di partenza per l'applicazione dei concetti
di lean manufacturing e riflessione sul concetto di lean kitting. Tuttavia, mentre la letteratura si è sempre
concentrata sul miglioramento della produzione di massa, poca attenzione è stata prestata ad ambienti
lavorativi diversi. Questa rappresenta la sfida affrontata dal progetto di tesi e il gap dove si inserisce l’
obiettivo di creare di una metodologia per affrontare e risolvere i problemi più comuni del processo di
kitting. La necessità di risultati di valore ha innescato l'utilizzo di un caso di studio industriale, che ha
contribuito a costruire il quadro generale del processo di kitting e ottenere una più profonda comprensione
del tema lean kitting. La metodologia creata spazia dalla ricerca delle best practices alla proposta di
soluzioni ideali e realistiche, includendo un’analisi dei problemi con approccio bottom-up, la comprensione
dei requisiti ed eventuali vincoli industriali del processo stesso. Questo lavoro di ricerca deriva
dell’Individual Project svolto presso Cranfield University nel periodo Maggio/Settembre 2014.

Lean Kitting Marta Lupi
iii
Acknowledgments
This thesis would not have been possible without the guidance and helpful
contribution of several individuals.
First and foremost, I would like to express my sincere thanks to prof. Gino Dini,
Professor of my Master Degree in Industrial Engineering at the Universita’ degli Studi
di Pisa. He allowed me to join the Double degree program, which has been agreed
between Cranfield University and Pisa.
Furthermore, I am also extremely grateful to my academic supervisor, Dr. Peter Ball,
for his availability, effective guidance and valuable feedback. He helped me to do my
very best and surpass the expectations set and he has been a source of constant
encouragement throughout the entire project.
In addition, I take this opportunity to thank my industrial supervisor, Mr. Andrew
Carroll, who courageously accepted the project challenges and has always been
supportive and present throughout my period of stay in the Airbus D&S site. Also, I
would like to thank all the managers, the production controllers, the operators and all
the other people that made this project possible and accepted me as part of the
Airbus family.
A special thank to Dr. Patrick Mclaughlin, who generously shared his knowledge,
technical expertise and industrial experience with me and all the Academic Staff for
being helpful and supportive throughout the entire year.
Most importantly, I would especially like to direct my deepest gratitude and thank my
family, my boyfriend and all my friends for their continuous and unconditional support
and encouragements. Even though many of them have been far away from me, I
never felt lonely. Thanks.
Lean Kitting Marta Lupi
iv
TABLE OF CONTENTS
SOMMARIO .................................................................................................................................... II
ABSTRACT .................................................................................................................................... II
ACKNOWLEDGMENTS ................................................................................................................ III
LIST OF FIGURES ....................................................................................................................... VII
LIST OF TABLES ...........................................................................................................................X
LIST OF EQUATIONS ...................................................................................................................XI
LIST OF ABBREVIATIONS .......................................................................................................... XII
1 INTRODUCTION....................................................................................................................... 1
1.1 BACKGROUND ...................................................................................................................... 1
1.2 RESEARCH PROBLEM ............................................................................................................ 2
1.3 AIMS AND OBJECTIVES ......................................................................................................... 4
2 STATE OF THE ART ................................................................................................................ 5
2.1 THE CONCEPT OF LEAN ........................................................................................................ 5
2.1.1 Lean Framework .......................................................................................................... 5
2.1.2 Relevant Tools ........................................................................................................... 10
2.2 KITTING PROCESS .............................................................................................................. 12
2.3 LEAN KITTING ..................................................................................................................... 18
2.4 KEY FINDINGS .................................................................................................................... 22
2.5 RESEARCH GAP ................................................................................................................. 23
3 BEST PRACTICES FROM INDUSTRY .................................................................................. 24
4 RESEARCH METHODOLOGY ............................................................................................... 29
4.1 METHOD ............................................................................................................................ 29
4.2 INDUSTRIAL CASE STUDY .................................................................................................... 35
5 PROBLEM ANALYSIS ........................................................................................................... 40
5.1 RELEVANT AREAS OF THE KITTING PROCESS ....................................................................... 41
5.2 ANALYSIS AT THE SHOP FLOOR LEVEL ........................................................................... 42
5.2.1 Results of Interviews .................................................................................................. 43
5.2.2 Results of Observations ............................................................................................. 45
5.2.2.1 Example of Practical Case Studies ...................................................................................................... 45

Lean Kitting Marta Lupi
v
5.2.2.2 Wastes Identification ............................................................................................................................ 47
5.2.3 Pareto Analysis .......................................................................................................... 49
5.2.4 Further Analysis ......................................................................................................... 51
5.2.4.1 Incomplete Kit ...................................................................................................................................... 52
5.2.4.2 SOP Issues .......................................................................................................................................... 53
5.3 ANALYSIS AT THE AREA MANAGER LEVEL ...................................................................... 54
5.4 ANALISYS AT THE STORE LEVEL ...................................................................................... 55
5.5 ANALYSIS AT THE PRODUCTION CONTROLLER LEVEL.................................................. 56
5.6 ANALYSIS AT THE MANUFACTURING ENGINEERING LEVEL .......................................... 61
5.7 ANALYSIS AT THE SCHEDULING LEVEL ........................................................................... 63
5.8 ADDITIONAL CONSIDERATIONS ............................................................................................ 64
5.9 DATA COLLECTION CONSTRAINTS ....................................................................................... 66
5.10 GENERAL METHOD ........................................................................................................... 67
6 PROPOSED SOLUTIONS ...................................................................................................... 68
6.1 KITTING REQUIREMENTS ..................................................................................................... 68
6.2 CONSTRAINTS .................................................................................................................... 70
6.3 REFLECTIONS .................................................................................................................... 71
6.4 IDEAL SOLUTION ................................................................................................................. 73
6.4.1 Ideal Changes ............................................................................................................ 73
6.4.2 Summary of the Ideal Changes .................................................................................. 77
6.5 REALISTIC SOLUTION .......................................................................................................... 78
6.5.1 Short Term (ST) Implementation Plan ........................................................................ 78
6.5.1.1 Suggested Improvements .................................................................................................................... 79
6.5.1.1.1 Shop Floor .................................................................................................................................... 79
6.5.1.1.2 Store ............................................................................................................................................. 91
6.5.1.1.3 Production Controller .................................................................................................................... 93
6.5.1.2 Impact of Changes ............................................................................................................................... 95
6.5.2 Medium Term (MT) Implementation Plan.................................................................... 97
6.5.2.1 Suggested Improvements .................................................................................................................... 97
6.5.2.1.1 Shop floor ..................................................................................................................................... 97
6.5.2.1.2 Store and Production Controller ................................................................................................. 100
6.5.2.1.3 Area Manager ............................................................................................................................. 101
6.5.2.1.4 Manufacturing Engineer.............................................................................................................. 102
6.5.2.1.5 Scheduling .................................................................................................................................. 102
6.5.2.1.6 Management ............................................................................................................................... 103
6.5.2.2 Impact of Changes ............................................................................................................................. 104
6.6 GENERAL METHOD ........................................................................................................... 105
7 DISCUSSION ........................................................................................................................ 106
8 CONCLUSIONS AND RECOMMENDATIONS ..................................................................... 110
Lean Kitting Marta Lupi
vi
8.1 FINAL METHODOLOGY ...................................................................................................... 110
8.2 PROJECT VALUE .............................................................................................................. 112
8.3 SUGGESTION FOR FURTHER ANALYSIS .............................................................................. 113
8.3.1 Academic Research ................................................................................................. 113
8.3.2 Industrial Case Study ............................................................................................... 114
9 REFERENCES ..................................................................................................................... 116
10 APPENDIX I – STATE OF THE ART .................................................................................... 121
11 APPENDIX II - PROBLEM ANALYSIS ................................................................................. 123
12 APPENDIX III - PROPOSED SOLUTIONS ........................................................................... 126
Lean Kitting Marta Lupi
vii
List of Figures
Figure 1 - Kitting Process Overview ............................................................................ 2
Figure 2 - Product/Process Matrix(Quizlet LLC) .......................................................... 3
Figure 3 - Mura/Muri/Muda wastes(Leanisrael,2012) .................................................. 7
Figure 4 - 7 Ohno's wastes(Prateek,2011) .................................................................. 7
Figure 5 - 5 Lean Principles(Cardiff University) ........................................................... 8
Figure 6 - The House of Lean ...................................................................................... 9
Figure 7 - 5S(Dorsett,2012) ....................................................................................... 11
Figure 8 - Example of a kit(MID,2014) ....................................................................... 12
Figure 9 - Central Store Kitting Method ..................................................................... 14
Figure 10 - Logic of the Kitting Process ..................................................................... 14
Figure 11- Traditional Approach before SPS(Lean Enterprise Institute,1997) ........... 20
Figure 12 - SPS Approach(Lean Enterprise Institute,1997)....................................... 21
Figure 13 - Comparison traditional/SPS(Lean Enterprise Institute,1997) .................. 21
Figure 14 - Lean Key Concepts(LeanCor,2014) ........................................................ 22
Figure 15 - Bomford Logo.......................................................................................... 25
Figure 16 - Cerulean Logo......................................................................................... 25
Figure 17 - Change in the Layout .............................................................................. 25
Figure 18 - Initial Supply Chain Configuration ........................................................... 26
Figure 19 - Modified Supply Chain Configuration ...................................................... 27
Figure 20 - Change Management Cycle(NHS,2000) ................................................. 28

Lean Kitting Marta Lupi
viii
Figure 21 - Areas Involved in the Kit Preparation(Airbus,2014)................................. 34
Figure 22 - Air View of the Site in Stevenage ............................................................ 35
Figure 23 - Airbus Defence and Space Logo ............................................................ 35
Figure 24 - Telecommunication Satellite(Airbus D&S, 2014) ..................................... 35
Figure 25 - Decomposition of a Satellite .................................................................... 36
Figure 26 - Research Methodology ........................................................................... 39
Figure 27 - Relevant Areas of the Kitting Process ..................................................... 41
Figure 28 - Steps of the Kit Use ................................................................................ 42
Figure 29 - Issues Identified with Interviews .............................................................. 43
Figure 30 - Issues Identified with Observations ......................................................... 49
Figure 31 - Pareto Analysis ....................................................................................... 49
Figure 32 - Fishbone Diagram-Incomplete Kit ........................................................... 52
Figure 33 - Fishbone Diagram-SOP Issues ............................................................... 53
Figure 34 - Steps of the PC Job ................................................................................ 59
Figure 35 - P6 Software(Oracle,2014) ....................................................................... 63
Figure 36 - Common Issues ...................................................................................... 65
Figure 37 - Logic Behind the Creation of the Proposed Solutions ............................. 68
Figure 38 - Kitting Process Requirements ................................................................. 69
Figure 39 - Airbus D&S Key Constraints ................................................................... 72
Figure 40 - Over-the-wall Approach(Entrepreneurness,2010) ................................... 72
Figure 41 - Simple Example of Visual Management .................................................. 79
Figure 42 - Window for the Mix Request-Shop Floor ................................................. 85

Lean Kitting Marta Lupi
ix
Figure 43 - Window for the Mix Request-Lab ............................................................ 86
Figure 44 - Re-Organisation of the Boxes ................................................................. 87
Figure 45 - 5S Posters .............................................................................................. 89
Figure 46 - SOP Label ............................................................................................... 90
Figure 47 - Additional Bags ....................................................................................... 91
Figure 48 - Segmented Boxes ................................................................................... 92
Figure 49 - Digital Process Flow ................................................................................ 98
Figure 50 - Overall Final Methodology .................................................................... 111
Figure 51 - Potential Connection P6/SAP ............................................................... 115

Lean Kitting Marta Lupi
x
List of Tables
Table 1- Kit Preparation Methods(Adapter from Vujosevic,2008) .............................. 13
Table 2 - Most common kitting wastes(Adapted from Hanson,2012) ........................ 17
Table 3 - Kit Creation Guidelines ............................................................................... 19
Table 4 - SPS Benefits and Drawbacks .................................................................... 20
Table 5 - Methodology ............................................................................................... 30
Table 6 - Satellite Components Legend .................................................................... 36
Table 7 - Size of the Analysis .................................................................................... 42
Table 8 - Example of Case Studies ........................................................................... 46
Table 9 - Excel Spreadsheet ..................................................................................... 51
Table 10 - PC Walking Time Estimation .................................................................... 60
Table 11 - WI Creation .............................................................................................. 61
Table 12 - Ideal Changes .......................................................................................... 77
Table 13 - Original Excel Spreadsheet ...................................................................... 80
Table 14 - Modified Excel Spreadsheet ..................................................................... 80
Table 15 - IT Requirements-Visual Management ...................................................... 81
Table 16 - Visual Management: Cost/Benefit ........................................................... 83
Table 17 - IT Requirements-Mix ................................................................................ 85
Table 18 - Mix: Cost/Benefit ...................................................................................... 86
Table 19 - Visual Order: Cost/Benefit ........................................................................ 19
Table 20 - Paperwork: Cost/Benefit ........................................................................... 91

Lean Kitting Marta Lupi
xi
Table 21 - ST Store Changes: Cost/Benefit .............................................................. 93
Table 22 - ST PC Relocation: Cost/Benefit ............................................................... 94
Table 23 - ST Suggested Changes ......................................................................... 196
Table 24 - MT Digital System:Cost/Benefit .............................................................. 199
Table 25 - MT Area Manager Relocation: Cost/Benefit ........................................... 101
Table 26 - MT Suggested Changes ......................................................................... 104
Table 27 - Key Findings-Academic Research ......................................................... 109
Table 28 - Key Findings-Case Study ....................................................................... 109
List of Equations
Equation 1 - Calculation of the Issues’s Frequency ................................................... 50
Equation 2 - Savings Formula ................................................................................... 94

Lean Kitting Marta Lupi
xii
List of Abbreviations
AIT- Assembly Integration and Test
AM- Area Manager
BOM- Bill of Materials
CPS- Combined Propulsion System
ERP- Enterprise Resource Planning
IT- Information Technology
JIT- Just In Time
ME- Manufacturing Engineer
MT- Medium Term
NCR- Non Conformance Report
PC- Production Controller
PR- Purchase Requisition
RC- Routing Card
SAP- Software used by the company
SOP- Shop Order Pack (WI+ RC)
ST- Short Term
TPS- Toyota Production System
WC- Work Centre
WI- Work Instruction
WIP- Work in Progress
WO- Work Order

Lean Kitting Marta Lupi
xiii
This page was left intentionally blank

Lean Kitting Marta Lupi
1
1 Introduction
This section aims to provide an extended explanation of the research background
together with a clarification of the research problem that will be addressed.
1.1 Background
This research is based on the idea of merging and analysing two key concepts: lean
manufacturing and the kitting process. As the manufacturing world is generally
struggling because of a period of crisis (Alcorta, 2011) that has been lasting for many
years, many manufacturing organizations have realised over time the importance of
practicing lean techniques.
According to the Lean Enterprise Institute (1997) “Lean is a set of concepts,
principles and tools used to create and deliver the most value from the customers’
perspective while consuming the fewest resources and fully utilising the skills and
knowledge of those who do the work”. Lean is the concept that derives from Toyota
Production System (TPS) and it is applied to many industrial environments through
the use of techniques and tools, which have different features, but all the same
objective of improvement: waste elimination and process flow (Tapping, 2002).
Kitting is the name for the practice of feeding components and subassemblies to the
assembly area in predetermined quantities that are placed together in specific
containers (Corakci, 2008), to simplify the material handling and reduce the time
spent on fetching parts. A kit can be used in a variety of industrial environments and
can fit with both automatic assembly lines (i.e. automotive industry) and manual
assembly operations (i.e. Airbus D&S)(Hanson and Mebdo, 2010). What may change
is the size of the kit and the components/parts/tools that it contains. From a logical
point of view, the generic kitting process comes before the assembly process, while
other processes precede and enable the preparation of the kit, as shown in the
simple example of Figure 1.

Lean Kitting Marta Lupi
2
Figure 1- Kitting Process Overview
Even though each organisation may adapt the features of the kitting process to its
working environment, there are some guidelines to follow regarding the design of a
kitting process that would allow efficiency, quality and flexibility (Fong-Yuen, 1990).
When kitting is not the common practice for the operations, the so-called method of
continuous supply, where each component is presented separately in a container on
the shop floor, can be used. The principle of kitting is often discussed, as it has been
stated to offer a number of advantages over the more traditional principle of
continuous supply. However, even though kitting has been used in industry for years,
relatively little research has examined its impact more specifically.
1.2 Research problem
Companies tend to consider the kitting process an essential step in the whole
workflow, as kits are usually used transversally by the shop floor (Bozer and Mc
Ginnis, 1992). So, being inefficient in the kitting process means creating a knock-on
effect to the assembly operations and this is what generally wants to be avoided and
prevented. Usually, there are many departments, organisational levels and people
involved in this process: managerial, operational and support roles. However, the
importance of the operator on the shop floor that manually assembles the product
and works directly with the kit should be always highlighted. Since it is the shop floor
work that creates the value (Bicheno, 2009), the priority is to help and facilitate the
operator, understanding which is the best way to deliver the kit.
Design Purchasing Kitting Assembly

Lean Kitting Marta Lupi
3
As the starting point for the improvement of the current state is always the
understanding of the real situation, the research required the complete study of the
kitting process, including all the relevant areas. According to Hanson and Mebdo
(2010), kitting can be used in any type of company, but the literature extensively
documents only how to include the lean methodology into a high-volume/low-variety
environment.
However, there are many other companies operating in a low-volume/high-variety
environment (PROJECT section in Figure 2), receiving almost unique orders from the
customer and then organising the processes to satisfy the customer’s requirements.
For these reasons, the challenge faced by this research is related to the application
of those lean concepts that have originally been analysed and introduced in
assembly lines as well as continuous process in an opposite type of environment.
In order to develop a methodology that would make the kitting process leaner, all the
relevant areas were considered in terms of waste and issues, to identify possible
improvements that would fit with the operative conditions of a low-volume/high-
variety environment.
Figure 2-Product/Process Matrix (Quizlet LLC)

Lean Kitting Marta Lupi
4
The best way to evaluate and assess both the issues and the possible improvements
is to work closely with an industrial company that becomes an essential source for
the data collection and the validation of the proposed ideas. Consequently, an
industrial case study was included in the research to test the methodology for the
kitting improvement.
1.3 Aims and Objectives
The aim of the research is to apply the lean thinking to the kitting processes to
improve the flow throughout the process, considering a low-volume/high-variety
environment of companies.
A set of objectives was defined to support the achievement of this aim:
Identify the existing Best Practices for the kitting process in literature, which
would contribute to the understanding of the ideal framework for the kit
preparation and the lean kitting concept;
Find and assess evidence of potential inefficiencies and wastes affecting the
process, considering the relevant areas involved. The focus is on the
development of the key steps to follow in a generic kitting process analysis;
Develop and validate a generic methodology for the solution of the common
issues of the kitting process, which can be applied to different companies
operating in a similar environment, taking into consideration a realistic industrial
environment.

Lean Kitting Marta Lupi
5
2 State of the Art
This section aims to investigate and explain the main concepts that create the basis
for the research. According to the aim and the objectives, the literature research was
focused on three main areas:
The concept of lean;
The kitting process;
The concept of Lean Kitting.
After reviewing the literature, it was possible to identify some key findings and most
important the research gaps that are currently affecting these topics. Then, a
glossary of terms regarding the lean manufacturing has been introduced in Appendix
I, to facilitate the understanding about Lean.
2.1 The Concept of Lean
2.1.1 Lean Framework
Lean means reducing wastes, optimising cost and quality. Regarding the
terminology, the word lean was first used in the 1990s in the book “The machine that
changed the world” by Womack and Jones (1996) and the concept derived from the
Toyota Production System (TPS), developed by Toyota (Tinoco, 2004). The term
lean manufacturing is synonymous with different names, such as agile, just-in-time
(JIT), synchronous and world-class manufacturing.
In other words, lean manufacturing is a management philosophy that is based on an
integrated set of principles, practices, tools and techniques designed to address the
root causes of operational underperformance. However, it is essential to highlight the
fact that lean is definitely more than just tools.
Indeed, the two main pillars of lean are (Larman and Vodde, 2009):
Continuous Improvement: change everything and always embrace the
change;
Respect for people: invest in all the people involved (employees, supply
partners, customer etc).

Lean Kitting Marta Lupi
6
This philosophy is based on the active engagement and commitment of the
management, which is required to involve the whole enterprise in the everyday
learning and improvement.
It involves a systematic approach to eliminating the sources of loss, optimising cost,
quality and efficiency, while improving safety. In order to meet these objectives, it
aims to increase the value-added activities by eliminating wastes and reducing
unnecessary work (Drew et al., 2004). The waste elimination is related to the need of
a process to flow without interruptions that can prevent the smooth sequence of
activities. So, flow is the key word for the lean production.
To deeply understand what lean production means, it is important to highlight the key
concepts and features of this philosophy.
Lean is based on the definition of value added and non-value added activities and
this distinction can be explained with regard to the manufacturing processes. Indeed,
the process of transforming raw materials into finished goods is the objective of any
manufacturing company (Dudley, 2005). The processes that make that
transformation possible are the result of two different activities: those that add value
and those that do not.
Value-added activities are considered the actions and the process elements that
accomplish those transformations and add value to the product from the perspective
of the customer.
Non-value-added activities are those process tasks that do not add value to the
product from the perspective of the customer and have to be eliminated or optimised.
There are three types of wastes: MURI, MURA, MUDA derived from the Japanese
language (Bicheno, 2009):
Muri represents all the unreasonable work that management imposes on
workers and machines because of poor organisation;
Mura is related to the unevenness or irregularities in the production;
Muda means waste and it refers to a wide range of non-value-adding
activities.

Lean Kitting Marta Lupi
7
A graphical explanation can be found in Figure 3.
Taiichi Ohno (1988) defined 7 types of Muda and these are illustrated in Figure 4.
Figure 4 - 7 Ohno’s wastes (Prateek, 2011)
Figure 3 - Muri/ Mura/Muda Wastes (Leanisrael, 2012)

Lean Kitting Marta Lupi
8
There are 5 principles that are central to the lean thinking, illustrated in Figure 5
(Womack and Jones, 1996):
Customer value: specify value from the customer point of view is the first
principle, because it is important to produce what the customer wants;
Value stream: identification of the value stream is the process of
understanding all the activities that are performed across the areas, to be able to
propose improvements;
Flow: create the flow means that the product or service flows through all the
value adding steps in the most effective and efficient way possible;
Pull: understand what the customer wants and organise the processes and
the whole enterprise to meet that demand with a short-term response;
Perfection: pursuing perfection does not mean defect free, but being able to
deliver exactly what the customer wants, when it is required, at a fair price and
with minimum waste.
Figure 5 - 5 Lean Principles (Cardiff University)

Lean Kitting Marta Lupi
9
This philosophy with the principles and techniques embedded are conceptualized in
the “House of Lean” model derived from the TPS (Tinoco, 2004). The house is shown
in Figure 6.
As the “House of Lean” model suggests, lean is a conceptual and physical system,
therefore it is not a toolbox. Lean practitioners who consider lean as a toolbox and
become familiar with only one or few tools and try to implement them in their
organization do not capture the real essence of lean (Liker, 2004).
It is based upon a foundation of standard and stable processes and works together
with the other pillar Jidoka or Built in Quality (additional details and definitions can be
found in Appendix I). Typically, organisations want the benefits of JIT, but often
reduce inventory to a level lower than their processes are capable of supporting. This
can result in missed schedules, customer service problems and higher costs. For this
reason it is called “Just about in Time” or “Almost in Time” and has a bad, almost
negative, connotation to it. In fact JIT can be very powerful in driving quick response
to problems by making problems visible and urgent. However, it is needed to have
some pre-requisites in place first including stable and standard processes and a
Figure 6 - The House of Lean

Lean Kitting Marta Lupi
10
human response system capable of responding to problems as they arise and putting
counter measures in place before running out of materials (Norval, 2011).
It is important to keep in mind that it takes time to become a lean organisation and
the change process can be compared to a journey, as the book “Journey to lean” by
Drew et al. (2004) suggests. It states that only with the commitment of all the teams
and the willingness to change the final objective is achievable.
2.1.2 Relevant Tools
It has previously been stated that lean manufacturing is not only about tools, but
there are plenty of them that are currently used to apply the lean philosophy. The
main tools associated to lean manufacturing that are considered relevant to the
research are in the visual management category: kanban and 5S. Only these tools
are presented because in literature they have been used to solve many of the issues
that are expected to be experienced in the kitting process, as it will be fully explained
in the section 2.2.
Visual Management: it is a clear and simple way to organise and present
information. It affects the so-called visibility and is a key theme of the lean
manufacturing (Williamson, 2009). Not having immediate, apparent and up-to-date
schedules or problem solving process is a symptom that the operations are far off
lean (Bicheno et al., 2009). Visual management is a generic expression and concept
that is spread across the whole shop floor and can be applied in many ways. It may
affect machines, people and the physical work area as well. A few examples are:
transparent covers for the machines, light to indicate a status, a skill matrix that
indicates the experience of the operators etc. The impact that visuals can have on
productivity, cost, quality, on-time delivery, inventory and equipment reliability is truly
enormous.
Kanban: it is a system that helps programming, controlling and regulating the work in
an extremely simplified way and apply JIT to the working environment. Kanban is the
name for a card (physical or electronic) that accompanies the single container of
materials or parts. The information contained in a kanban refers to what to produce

Lean Kitting Marta Lupi
11
or handle and generally indicates: name of the part, the design number, the amount
and the name of the final product (Santillo, 2008).
The first rule of the kanban is that nothing can be produced without an available card
authorization; departments upstream should, therefore, produce only the parts that
have been consumed by the downstream stages with the eventuality of stopping the
operations when there are no kanban to authorise production. Another rule than
needs to be strictly respected is that the downstream departments can request
upstream only those components/parts that are needed in the necessary quantity
and when needed (at the moment of consumption).
5S: the method of 5S is an attempt to always get the order and cleanliness in the
workplace of each operator, as prerequisites for quality, reliability and efficient
production. Each S (described in Figure 7) represents a Japanese word that have
been translated according to the meaning:
Using this method can be very beneficial for the workplace as there are numerous
advantages for the elimination of superfluous material: operational staff, for example,
will be able to move more freely on the shop floor without walking between obstacles.
Then, they will not have to spend time searching to find some tools to use or wasting
time in releasing the benches occupied by unnecessary materials. Moreover, the
working environment will result in a safer place to work. Also, keep unnecessary
items involves a "maintenance costs" and, in the case of stocks of products, even of
Figure 7 - 5S (Dorsett, 2012)

Lean Kitting Marta Lupi
12
"borrowing costs". Remove all unnecessary items from the work area means
therefore saving money (Santillo, 2008).
2.2 Kitting process
The assembly process plays an important role in the production environment. Indeed,
there are a lot of strategies for modelling the assembly systems (Yu et al., 2003) and
for the design of assembly systems for which expert systems have been developed
(Sanders et al., 2009). Nevertheless, another important subject related to the
assembly process is the assembly operation feeding systems. The two main
common methods (Hua and Johnson, 2010) are: kitting and continuous supply.
Bozer and McGinnis (1992) define a kit as “a specific collection of components
and/or subassemblies that together (i.e. in the same container) support one or more
assembly operations for a given product or shop order.” Simple examples of a kit is
shown in Figure 8.
The kit may contain not only physical components, but also documentation that the
shop floor needs, for instance work instructions, the routing card describing the
operations required by the specific component etc. Generally, plastic boxes are used
to present the kit and this may be segmented or not, depending on the purpose and
the materials involved. The quantity and the need for the paperwork vary a lot
according to the requirements of the end product and components, as well as the
features of the organisation (Ramachandran and Delen, 2005).
Figure 8 - Example of a Kit (MID, 2014)

Lean Kitting Marta Lupi
13
The kitting process, that is the name for the process that creates the kit, is usually
compared to the continuous supply method, where each part number is generally
presented in a separate container directly on the shop floor.
According to literature (Vujosevic, 2008), there are several methods associated to the
preparation of the kit (Table 1) and each of them affects the physical layout of the
company.
Method Description
Central Stock Room
The information for the preparation of the
kit and the whole process is derived from
an Information Technology system (i.e.
ERP).
The storage location may be located
directly on the shop floor close to the
assembly area. The kit may be prepared
in the stock room or in a separate area.
Shop Floor Supermarket
Fed by:
Supplier directly (no central stock
room, so it requires integration with
the supplier)
Central stock room (kanban are
used to replenish the
supermarket).
The operator in the assembly area
creates the kit and is responsible for the
material management.
Outsourcing
The kitting process is externalised. The
supplier delivers the complete kit on the
shop floor.
The lead-time may increase and it
requires supply chain management skills.
Table 1- Kit Preparation Methods (Adapted from Vujosevic, 2008)

Lean Kitting Marta Lupi
14
Each method explained previously has pros and cons and what the literature does
not state is which is the best one, the so-called best practice. However, the preferred
method and by far the most used is the one that involves the presence of a central
store (Baudin, 2004), even though it may be not the best method.
Figure 9 illustrates a simple example of the first kitting method, where the kit is
prepared according to the parts stored in the central warehouse and it is then
delivered to the assembly area. The picture shows the assembly line, but this method
can also be used with manual assembly operations (Dudley, 2005).
The kit preparation is an intermediate step in the whole process that leads to the
creation of the final product (Bozer and McGinnis, 1992). As it is shown in Figure 10,
the kit is prepared with components that may be raw materials (nuts, bolts etc.) or
subassemblies, which has been previously assembled. Regardless of what is in the
kit, each assembly operation requires one of them to deliver the final product to the
customer.
Figure 9 - Central Store Kitting Method
Figure 10 - Logic of the Kitting Process

Lean Kitting Marta Lupi
15
Especially in assembly lines there may be different starting points for the part
production that would be then included in the kit (Hanson et al., 2012):
Pulled by part: the kit is empty and the parts to refill the kit are taken from an
intermediate storage. Whenever a part container is empty, that triggers the
production for the specific component. This is usually the most commonly used
method, as it allows a faster process and more flexibility;
Pulled by kit: when the kit is empty the production is triggered and the
components will be included in the kit when ready. The kit will be complete only
when all the parts have been manufactured.
Furthermore, the kitting process can be classified according to the type of material
fetching: picker-to-part, when the picker is travelling to the picking locations to collect
the kit or part-to-picker, where the materials are brought to the picker for the use. The
choice of the system configuration has a big impact on the travel time and distances,
however there is not a right or wrong decision (Brynzer and Johansson, 1995). It
depends on the company and the specific features.
According to Johansson (2006), the reasons for implementing the kitting system
usually involve parallelised assembly systems, product structures with many part
numbers, quality assurance of the assembly and high value components, but this is
only a guideline.
Compared to continuous supply, where the material is delivered directly to the shop
floor, kitting has been associated with a number of potential advantages
(Christmansson et al., 2002):
Space-efficient parts presentation that means saving space in the work
stations when the materials are supplied in containers (i.e. tote pans, with
numerous identical components in the same container, this would have resulted
in an enormous plant) (Hua and Johnson 2010; Bozer and McGinnis 1992);
Improved assembly quality due to reduced part damage because of excess
handling. Indeed, high value components can be secured in kitting packages
(Hanson, 2012) and it also allows an early identification of low quality
components (Bozer and McGinnis 1992; Johansson 1991);

Lean Kitting Marta Lupi
16
Reduced and better controls over the WIP, as the parts of existing kits
provide immediate information regarding the WIP level (indeed each kit consists
of a predetermined quantity of parts) (Anonymous, 1997; Applied Industrial
Technologies, 2014);
The assembly areas could become more flexible and free from leftover
components. Moreover, it can bring an improved control and better visibility of
the flow of components on the shop floor (Bozer and Mc Ginnis, 1992);
Less time spent by the assembler looking for parts that are supplied all in the
same kit, so it increases productivity (Hua and Johnson 2010; Johansson 1996).
On the other hand, kitting is also associated with certain drawbacks (Hanson and
Melbo, 2010):
The kits need to be prepared in advance, which requires space and
additional handling (Hua and Johnson 2010; Bozer and McGinnis 1992);
Preparing the kits requires some time and effort which is a non value adding
activity (waste) (Bozer & McGinnis, 1992);
Additional transportation may also be necessary if kits are prepared in a
separate area that is not linked to either storage or assembly. Furthermore, an
increased number of handling occasions increases the probability of damaging
the components, therefore not all components are suitable for kitting (Johansson
and Johansson, 2006);
Additional planning is required (Bozer and McGinnis 1992);
Missing, defective or wrong parts in the kit negatively effect the assembly
operations. Components that may fail during the assembly process will require
special consideration or exceptions (Bozer and McGinnis 1992).
Each of these issues may trigger other issues with an overall increase in downtime,
manpower costs (unproductivity costs money) and lead times.
It has been argued that the main difference between kitting and continuous supply is
that the non-value-added activities are moved from the assembly to the kitting area,
but this has never been confirmed. What it is true is that both methods have
advantages and disadvantages and that there is not set of rules stating which is the
best solution to implement (Baudin, 2004).

Lean Kitting Marta Lupi
17
It is important to highlight that kitting can also be used together with the continuous
supply, according to the type of component needed. Indeed, bulk and commodity/low
value items should be directly supplied to the shop floor, without being kitted (Baudin,
2004).
Taken into consideration both pros and cons, it has also been stated that kitting is
preferable in a low-volume/high-variety environment, while the continuous supply fits
better in an opposite type of organisation (Hua and Johnson 2010), however this is
only a rule of thumb.
As this research aims to apply the lean thinking to the kitting process, it is considered
relevant to summarise the most common issues that may affect the kitting process
identified through literature research and link them to the 7 Ohno’s wastes. For this
purpose, Table 2 has been created. Data refers to literature research and also
include personal judgment and understanding.
Waste Common Kitting Wastes
Overproduction More parts in the kit than required
Waiting Kit waiting on the shop floor or
operator waiting for the kit
Transportation Kit prepared far from the shop floor
Overprocessing Operations in the kitting process
repeated more than once
Inventory Higher level of inventory than
required (store or shop floor)
Movement Unnecessary movements in the
whole kitting process
Defects Defective parts in the kit
Table 2- Most Common Kitting Wastes (Adapted from Hanson, 2012)

Lean Kitting Marta Lupi
18
2.3 Lean kitting
In a lean world, kitting is considered a waste. Indeed, following Toyota’s lean
thoughts of the past, the organisation should provide component storage racks,
replenished using kanban signals, alongside assembly lines and let the operators
pick the parts to set up the job when appropriate (Bozer and McGinnis, 1992).
However, there are two aspects to highlight: the focus is always on the high-
volume/low-variety environment, as that is the environment that requires the
assembly lines and also eliminating the kitting process may not be the solution to
completely eliminate wastes, because other types of wastes may be created in other
areas that might more damage the company in terms of time and quality (Vujosevic,
2008). This means that currently there is not one right answer to the question: What
does lean kitting mean? What is important, however, is a deep and careful
evaluation of the existing constraints prior to a possible kitting elimination.
If elimination is not the right answer or it takes a long period of time to be
implemented and it is postponed in a future timeframe, there are some principles that
helps making the kitting process lean (Henderson et al. 1993):
Eliminate waste related to downtime caused by invalid kitting;
Kit right first time;
Eliminate waste in kitting.
According to Fong-Yuen and Puvitharan (1990), there are a few guidelines that are
expected to help the design of a JIT kitting process and they involve 3 key aspects
(described in Table 3):
Part size;
Lot size;
Kit size.

Lean Kitting Marta Lupi
19
Part size
Influence
Material handling methods
Choice of kit containers
NB: Bulky parts may not be introduced in the kit,
but pulled separately with kanban.
Lot size
Part production
Pulled by kits: kit empty triggers the
production
Pulled by parts: kit refilled by parts stored in
an intermediate storage (most used)
Kit size
(Number of sets of parts in
the kit)
Storage container should be compatible with the kit
size because if the n. of units in a container of a
part is < kit size container useless for the kit
Table 3-Kit Creation Guidelines
Kanban is good tool to use to create a lean environment, however the practical
implementation requires a behavioural change together with the physical one, and
also the collaboration of the parts that are working together.
There are some case studies in literature developed to explain the concept of lean
kitting, but many of them describe a high-volume/low-variety environment (Kilic et al.,
2012). Indeed, a study conducted in an electronic company (similar type of
environment) (Vujosevic, 2008) suggests that replacing the central store with
supermarkets on the shop floor fed by daily deliveries from the supplier can be
extremely beneficial. In this case, the kitting process was not removed, but the
responsibility for the preparation was shift to the shop floor and kanban used to
control the supermarket.
Another example of lean kitting process comes from Toyota, that started using kitting
in some of its plants for high volume assembly operations (Lean Enterprise Institute,
1997). Toyota implemented a new kitting process, called Set Pallet System (SPS), in
its new production facility in San Antonio (USA). This new approach is mainly based
on the removal of line-side storage racks, so that operators no longer walk from their

Lean Kitting Marta Lupi
20
assembly stations to get parts. Instead, electronic signals to tell the material handlers
what parts to select from bins separated from the line, to then select and place them
on pallets traveling with the engines being assembled (Lean Enterprise Institute,
1997).
There are several benefits associated to this concept, but at the same time there are
some drawbacks to take into consideration. Table 4 summarises the SPS main
aspects.
Benefits Drawbacks
More value added time by the operators/
Easier training Increased Manpower
Cleaner work areas with visual control Takt-time Changes
Fewer part selection errors Best suited to automated lines, rather
than cells.
Table 4 - SPS Benefits and Drawbacks
Figure 11- Traditional Approach Before SPS (Lean Enterprise Institute, 1997)
Figure 11-Traditional Approach before SPS (Lean Enterprise, 1997)

Lean Kitting Marta Lupi
21
Figures 11 and 12 are presented to visually show what changed from the traditional
assembly line concept and the new SPS method. Operators on the traditional
assembly line at Toyota spent non value-adding time walking to the racks to select
parts, while with the new configuration the time spent on fetching parts and walking is
dramatically reduced (Figure 13). This brings an increase in the productivity and
efficiency.
Figure 12 - SPS Approach (Lean Enterprise Institute, 1997)
Figure 13 - Comparison traditional/SPS (Lean Enterprise Institute, 1997)
Figure 12 – SPS Approach(Lean Enterprise, 1997)

Lean Kitting Marta Lupi
22
2.4 Key findings
After collecting information and creating the conceptual framework, it was essential to
summarise and identify the main key learning points that were then addressed by this
research, that are visually represented in Figure 14.
The lean philosophy is based on the 7 wastes investigation (8th waste related to
people knowledge may be included as a separate category) and the main aim is to
remove them from the activities, to obtain the flow with only value-adding tasks. This
is what the research focused on with the kitting problems identification and analysis.
Kitting means organising the needed parts and components to be easily used by the
operators and this is considered a waste in the lean environment, but the elimination
may not always be the right decision and trigger other issues. The research
addressed the ideal way of performing kitting process, evaluating the possibility of a
future elimination.
Figure 14 - Lean Key Concepts (LeanCor, 2014)

Lean Kitting Marta Lupi
23
2.5 Research Gap
Best practices for the kitting systems have rarely been described in the literature and
many uncertainties regarding the performance and design options of these systems
exist, leading to assembly systems providing kitting sometimes being rejected.
The literature is mainly focused on the comparison between the continuous supply
and the kitting methods choice, investigating the pros and cons. Moreover, attention
is primarily paid to the study of how high-volume/low-variety environments may be
improved, but a little time is spent discussing about how lean concepts may fit
opposite types of environment.
Indeed, traditional lean manufacturing is set up for relatively high-volume/low-mix
operations, in which the workflow can be balanced. This really does not apply to most
job shops. In fact, high-mix causes variations in loading the production operation
(Dick Kallage, principal of KDC & Associates, Barrington)
Furthermore, the concept of lean kitting has not been fully cleared and different
researchers may consider kitting a waste or a value-adding activity, in the way it
helps the flexibility and the cleanness of the workplace.
This is the context where this research is insert, aiming to contribute to the
understanding of the kitting process best practices and also whether kitting is more a
waste or a value-adding activity.

Lean Kitting Marta Lupi
24
3 Best Practices from Industry
Creating the state of the art and building the understanding about the best practices
existing in literature is always the starting point for a study. However, there are not
many case studies in literature, as explained in the Research Gap, to take into
consideration representing the so-called best practices. Furthermore, the low-
volume/high-variety environment has never been extensively documented.
For this reason, investigating about industrial best practices to understand how other
companies are dealing with the kitting process is considered an essential step to use
as a basis for this research. This type of information is not available in literature (this
is way this data has not been introduced in the State of the Art section) and the main
sources of information are interviews with the person who was personally involved in
the following case studies (McLaughlin, 2014). These two case studies have been
labelled best practices because of the idea that the kitting is considered a waste in
lean manufacturing. Indeed, both the companies cited completely removed the
kitting process and the store, with benefits in terms of productivity, people’s
motivation and inventory reduction.
However, it would be meaningful to investigate more collecting additional case
studies about kitting best practices in a low-volume/high-variety environment, as
these two case studies can be considered as ultimate solution for the kitting process
since the whole process is removed.
These two case studies from industry are presented to build the understanding
around possible radical changes that may be exploited and become the future key to
the success of the companies’ operations; as previously mentioned, they are both
based on the idea, stated in the State of the Art, that kitting can be considered a
waste in lean manufacturing. The aim of this section is not to give a decisive answer
for the lean kitting definition, but to create space for reflection.
However, it is always essential to keep in mind that every company has specific
constraints to take into account.

Lean Kitting Marta Lupi
25
Case Studies
Figure 15 - Bomford Logo
Figure 16 - Cerulean Logo
Bomford (Figure 15) is a company that produces vegetation control machinery, while
Cerulean (Figure 16) supplies process control instrumentation, test and measuring
equipment. The former produces about 50-60 types of products and 2-3 is the
maximum quantity for each of them. The same products may not be repeated for
weeks or months. The latter is characterised by less product variants, but still low
quantities for each of them. Even though they operate in a completely different area,
they both belong to the class “low-volume/high-variety”.
They were similar also in the fact that the initial layout was functional, so organised
according to work centres. Furthermore, they both had many problems with
shortages and inventory management as well.
The very first change that was introduced in their facilities was a change in the
layout. Indeed, cells replaced the initial functional layout (see Figure 17). This was
done because the cellular layout allows more independence and gives additional
responsibilities to the operators that are likely to feel more motivated and involved in
the work.
WC 1
WC 2
WC 3
CELLS
Figure 17 - Change in the Layout

Lean Kitting Marta Lupi
26
Following the modification of the layout, the existing central store was dismissed and
the cells used that amount of free space.
Moreover, a kanban system was introduced to control and regulate the internal flow
of the materials moving around between the cells. So, it is the downstream request
that is pulling the whole process.
The other important change was organisational; in fact, the management and the cell
team agrees in week 1 it what to produce in week 3 and that triggers all the steps of
the manufacturing process, according to each operation’s lead times.
A big change also addresses the operators. Indeed, they are now in charge of the
quality inspection, task that was previously performed by the store. Currently, the
shop floor is much more involved in every aspect of the business, as it participates
through the team leaders to the design phase as well as the scheduling and the
manufacturing and this is a big incentive to have the right thing done correctly the
first time.
An additional change that was beneficial for the companies was related to the
material management area. Indeed, both companies performed a rationalisation of
the suppliers, keeping only the so-called consolidator suppliers. Bomford reduced the
number of vendors from about 250 vendors to less than 100, while Cerulean cut the
number down to roughly 50 (from the initial 250 suppliers). The idea is the have a
change in the whole supply chain, going from the configuration shown in Figure 18 to
that in Figure 19.
Company
S1 S2 S3 S4 S5 S6 S7 etc
Figure 18 - Initial Supply Chain Configuration
Lean Kitting Marta Lupi
27
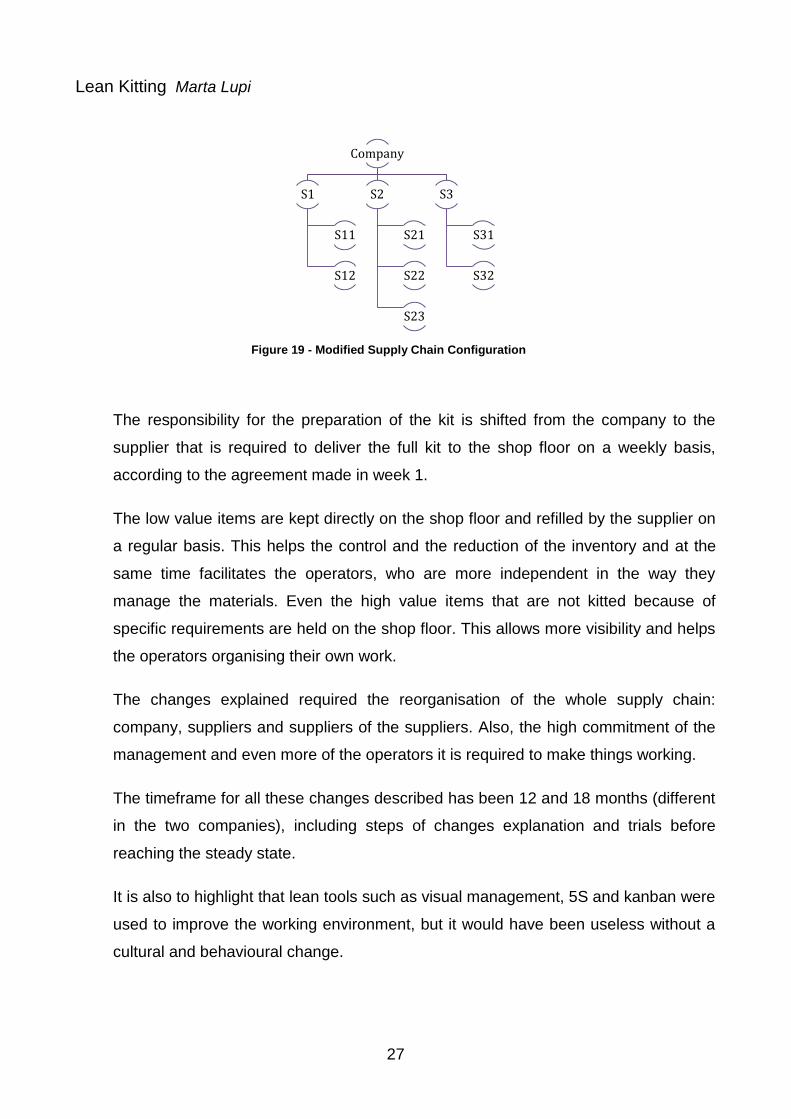
The responsibility for the preparation of the kit is shifted from the company to the
supplier that is required to deliver the full kit to the shop floor on a weekly basis,
according to the agreement made in week 1.
The low value items are kept directly on the shop floor and refilled by the supplier on
a regular basis. This helps the control and the reduction of the inventory and at the
same time facilitates the operators, who are more independent in the way they
manage the materials. Even the high value items that are not kitted because of
specific requirements are held on the shop floor. This allows more visibility and helps
the operators organising their own work.
The changes explained required the reorganisation of the whole supply chain:
company, suppliers and suppliers of the suppliers. Also, the high commitment of the
management and even more of the operators it is required to make things working.
The timeframe for all these changes described has been 12 and 18 months (different
in the two companies), including steps of changes explanation and trials before
reaching the steady state.
It is also to highlight that lean tools such as visual management, 5S and kanban were
used to improve the working environment, but it would have been useless without a
cultural and behavioural change.
Company
S1
S11
S12
S2
S21
S22
S23
S3
S31
S32
Figure 19 - Modified Supply Chain Configuration

Lean Kitting Marta Lupi
28
Positive Outcomes of the Changes
Operators felt more responsible for their own work and more involved in all
the production process;
Inventory levels and shortages were reduced;
Free space was reorganised;
The kits are now prepared outside the company and delivered ready-to-use,
saving time and costs;
Value-adding activities are kept inside the company, while the non-value
adding externalised.
Problem of Change Management
At the beginning of the change process operators were sceptical and most of them
could not believe in a system without a store and especially without shortages.
Indeed, shortages had always been part of the everyday life in the two companies.
Furthermore, even the management was obstructing the changes implementation,
mainly because it was not fully ready for a radical behavioural and organisational
change.
It is true that people are all different, but the change management path has been
proved to be real (Chapman, 2005). Fear for something new is innate and is a natural
feeling at the beginning, but than the feelings change, as illustrated in Figure 20. To
allow the change, a lot of time was spent, in the case studies, on the shop floor
working closely to the operators.
Figure 20 - Change Management Cycle (NHS, 2000)

Lean Kitting Marta Lupi
29
The incentive for the change is what can make the process flow. Indeed, the
management should be extremely careful about encouraging the change, without
pushing the operators against his/her will that may have the contrary effect. What
was used in both cases is external help, because people feel less threatened and
more open to the change when the top-level management is not directly involved in
the process (Kotter, 2002).
4 Research Methodology
The best method to develop a research starts from building the framework through
the analysis of what exists in literature. To increase the value added by the research,
an industrial case study has been identified and involved as an essential element for
the whole research development. This allowed detailed understanding of kitting in
addition to the literature, in order to build a generic methodology, which can identify
and address process waste. Furthermore, because there are some gaps in literature
that did not allow the complete picture of the best practices for the kitting process to
be established, this research included two industrial case studies that represent the
industrial best practices for the kit preparation.
At the end of the section a scheme that summarise the whole methodology, including
the use of the case study, will be presented.
4.1 Method
The whole methodology used to develop the research has been summarised in Table
5 in terms of steps and aim of each of them. The method described in Table 5
includes the work developed in a timeframe of 4 months.
Follows then the detailed description of each step.

Lean Kitting Marta Lupi
30
Step Aim
State of the Art
Build the framework and the context of the project at
Cranfield University (lean manufacturing, kitting methods
etc.).
Tools: Literature Research
Best Practices from
Industry
Identification of the industrial best practices for the kitting
process.
Tools: Interviews at Cranfield University
Problem Analysis
Build a deep understanding about the generic steps of the
kitting process and the relevant areas involved.
Identify the main issues of the process to evaluate the
source of potential improvement.
Tools: Documentation, Interviews and Observations (based
on Questionnaires and Checklists)
Additional Tools: Pareto Analysis was used as a tool to
prioritise the problems identified and Fishbone Diagram for
a deeper analysis
Proposed Solutions
Propose an ideal and realistic implementation plan for the
issues identified.
Ideal solution: based on the two best practices industrial
case studies, literature research and problem analysis.
Realistic Solution: additional interviews were considered
vital to evaluate the feasibility of the proposed changes.
Tools: Interviews, Observations and Literature Research
Table 5- Methodology

Lean Kitting Marta Lupi
31
State of the Art
A review of more than 50 papers was performed and it has been essential in order to
build the extensive context of the research. The literature was accessed with the
support of academic databases to investigate the concepts of lean manufacturing,
kitting process and lean kitting. However, the outcome has not been completely
exhaustive and some gaps in the literature were identified.
Best Practices from Industry
While the State of the Art represents a collection of data from the literature, this step
aimed to collect data from the industrial environment, which is not available in
literature. The identification of the best practices from literature for the kitting process
is considered a good starting point, and because the outcomes of the literature
review were not satisfactory, the need for deeper investigation about industrial best
practices arose. For this reason, this step was introduced and presented prior to the
problem analysis and additional industrial case studies were collected with the
collaboration of experts from Cranfield University.
Problem Analysis
Two sub categories representing the two aims listed in Table 5 are included in this
phase: data collection and problem identification.
The data collection involved spending time in an aerospace company used as a case
study. It included the study of the company documentation, interviews (structured or
less structured, including formal and informal meetings) and direct observations of
the work (shadowing) of the people involved in the case study. Checklists and
questionnaires were used as a basis for interviews and observations, in order to
rapidly capture the essence of people’s work and are attached in Appendix II.
The reason for the method used (combination of interviews and observation) is to
assure as much objectivity as possible and consider both the internal and the
external points of view.
The data collection allowed the broad understanding of the kitting process in terms of
the organisational areas involved, their logical relationship and how each of them

Lean Kitting Marta Lupi
32
affects the others, so that it was possible to include all the relevant areas in the
analysis.
Also, it acted as the main source of understanding for the following step: the problem
identification. In this step the data collected were deeply analysed to identify the main
issues of the kitting process. For this reason, these two sub categories will be
described together in the Problem Analysis section.
The additional tools used in the Problem Analysis step were the Pareto Analysis and
Fishbone Diagrams. These were used for a problem prioritisation and a deeper
analysis of selected issues. Indeed, the more it is known about the problems, the
more it is likely to find a satisfactory solution that fits with the real feature of the
problem.
Proposed Solutions
The step coming after the Problem Analysis is the Proposed Solutions. This
represents the step that aimed to develop a solution plan for the issues identified
previously. Indeed, it is related to the objective of developing a generic methodology
that could be applied to address the issues identified with the case study in other
similar companies. The use of the company case study has been extremely useful
even in this phase because it was involved in the validation of the methodology.
The main ideal is to present an ideal state for the kitting process and then focus the
attention on the creation of a ready-to-use solution (realistic) that would help in the
elimination of the wastes. To do that, a fundamental step regards the identification of
how the AS IS kitting process differs from the ideal TO BE, going through the
identification and the understanding of possible constraints.
Each problem identified has been addressed and ideas generated for the
improvement. Then some ideas have been labelled as unfeasible or not
implementable in a short period of time, whereas others have been deeply
investigated and proved to be feasible with the collaboration of the people involved in
the area addressed by the change; additional interviews and observations have been
then used at this stage for this purpose. Even the realistic solutions have been

Lean Kitting Marta Lupi
33
organised in terms of time, as some ideas are easily applicable in a short period of
time, while others would required more time, according to estimations.
Interviews and observations have been used throughout the project, with some parts
that have been more involved at an early stage and some others taken more into
consideration in the final evaluation of the proposed solution.
The case study has been a vital source of information in all the research phases and,
with the use of interviews and observations, the proposed methodology to address
the kitting issues has been validated (Validation Method).
To summarise and give an idea of the size and the extension of the analysis, the
diagram shown in Figure 21 illustrates in more details all the common steps of the kit
preparation that are under the responsibility of various organisational parts. Some of
them have been deeply considered and studied as considered more relevant
according to a prioritisation related to the objective of the project.
2
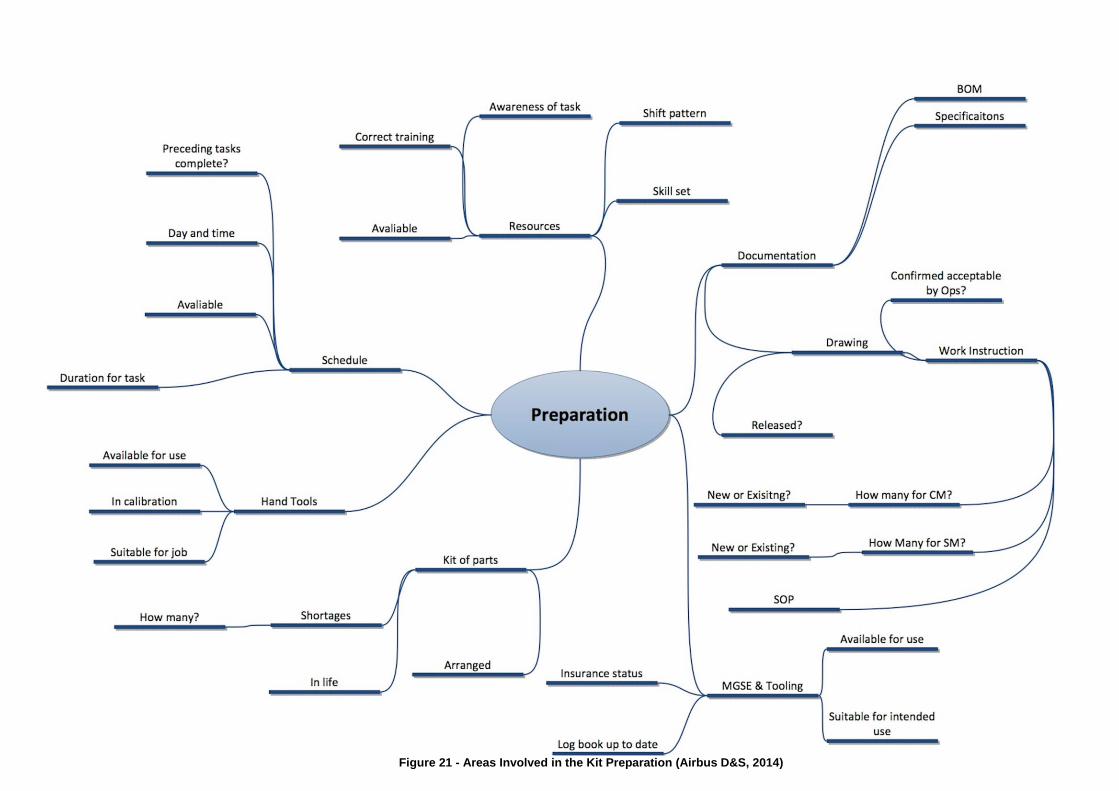
Lean Kitting Marta Lupi
34
Figure 21 - Areas Involved in the Kit Preparation (Airbus D&S, 2014)

Lean Kitting Marta Lupi
35
4.2 Industrial Case Study
The company used as the case study for the research was Airbus Defence and
Space (formerly Astrium) based in Stevenage (UK) (Figure 22), where roughly 1300
people are employed.
Airbus D&S (Figure 23) is an aerospace company primarily responsible for the
production of telecommunication and scientific satellites. Figure 24 shows an
example of telecommunication satellite.
Figure 22 - Air View of the Site in Stevenage Figure 23 - Airbus Defence and Space Logo
Figure 24 - Telecommunication Satellite (Airbus D&S, 2014)
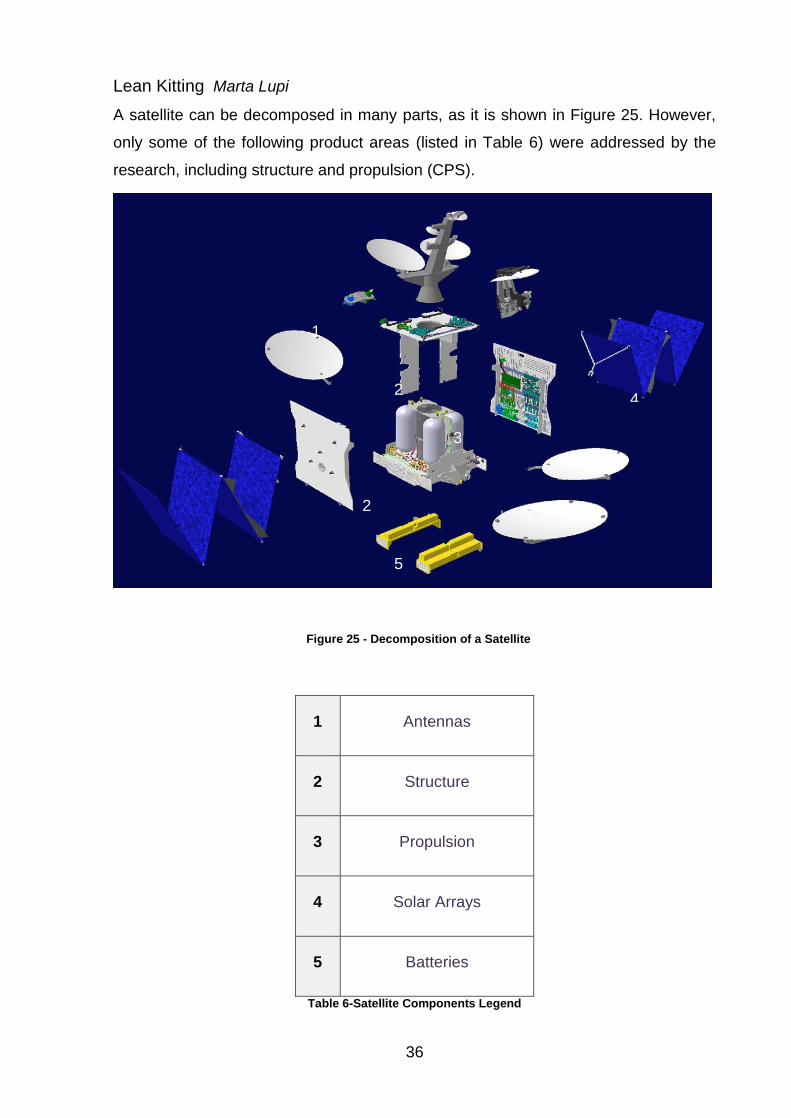
Lean Kitting Marta Lupi
36
A satellite can be decomposed in many parts, as it is shown in Figure 25. However,
only some of the following product areas (listed in Table 6) were addressed by the
research, including structure and propulsion (CPS).
Table 6-Satellite Components Legend
1 Antennas
2 Structure
3 Propulsion
4 Solar Arrays
5 Batteries
1
2
2
3
4
5
Figure 25 - Decomposition of a Satellite

Lean Kitting Marta Lupi
37
The company is involved in many almost unique projects over the year, receiving
orders from national and international customers, so it operates according to
projects, in a low-volume/high-variety environment.
Kitting literally means organising items into boxes, but Airbus D&S associates a more
extensive meaning to it. In fact, kitting represents the whole process that stretches
from the production planning and scheduling to the shop floor where the operators
use the kit. Therefore, both managerial and operative areas contribute to the Airbus
D&S kitting process and many organisational levels are involved (i.e. production
controller, store etc.).
The process is considered critical by the company because each job performed at
Airbus D&S requires a different kit. Every kit is supplied to the front line by the
production control area using a plastic box of the required size, together with the
relevant documentation that supports the specific job (mainly RC, drawings, WI and
Appendices to complete). Each of them may vary in terms of complexity of the
paperwork and quantity as well as size of items included and the quality of the kit has
a great impact on the next steps: assembly and consequently the delivery to the final
customer.
What it is not supplied with the kit are different types of tools and the so-called
consumables (i.e. adhesive tapes, gloves, hats etc.), that are stored directly on the
shop floor or in other areas (i.e. store).
For this reason, the company is seeking to streamline their kitting process that
marshals parts, tooling, documentation, etc. ready to be used for assembly in the
numerous clean rooms on site and make the process flow. A clean room is namely
the area of the shop floor where the operations are physically carried out (each clean
room has a different aim and is in charge of specific product areas i.e. panels, CPS,
structure etc.).
For the specific industrial case study, the research aimed to find the best way to
apply the lean thinking to the kitting process, focusing the attention on a group of
products, called mechanical platforms, and more specifically on three main areas:
Panels (blanks and assembly), Combined Propulsion System (CPS) subassembly
and Structure assembly. The department involved in the project was the Assembly,

Lean Kitting Marta Lupi
38
Integration and Test (AIT) and all organisational levels included in that area. Also, the
aim was also to provide an improvement plan that Airbus D&S may apply across the
whole AIT department not only at Stevenage.
Figure 26 summarises the whole methodology, including the use of the Airbus case
study.

Lean Kitting Marta Lupi
39
Figure 26 – Research Methodology
CA
SE
ST
UD
Y
DA
TA
CO
LLE
CT
ION
Shop Floor Store Manuf.
Engineer
Prod.
Controller
Area
Manager Scheduling IT
State of the Art Lean Concepts
Kitting Lean Kitting
Research Gap
Study of Documentation Structure of Satellites
Goods Reception and Inspection Production Control Process
Processes and Procedures in Store
WI and SOP
Interviews Observations Relevant areas
Problem Identification Kit issues to be solved Kitting process wastes
Chances for improvement
Proposed Solutions
Ideal Realistic
Pareto Analysis Fishbone Diagram
Operational Managerial Support
Case Study Relevant Areas
Industrial Best Practices

Lean Kitting Marta Lupi
40
5 Problem Analysis
This section aims to build a deep understanding of the kitting framework and the
main issues experienced in the kitting process, with the objective of developing the
key steps to follow in a generic kitting process analysis. Data Collection and Problem
Identification have been incorporated in this section, where the analysis is organised
according to organisational levels.
In general, what comes before the detailed analysis, to understand the focus of the
analysis, is the process mapping. Indeed, without the mapping the analysis does
not have basis to be supported. In fact, the identification of the relevant areas to
involve in the research was made possible by the kitting process mapping;
afterwards, data regarding problems and/or inefficiencies were collected in each area
of the process identified and involved. The different points of view were mainly used
to identify possible improvements that would benefit the whole process. The relevant
areas have been mainly identified through the documentation analysis. Later, the
analysis was conducted with the approach BOTTOM-UP, so moving upstream in the
kitting process because that was considered the best way to approach the issues.
Indeed, starting from shop floor is meaningful in terms of point of view. It has been
stated that the operator creates the real value, so finding a way to improve what
happens on the shop floor without being influenced by the managerial level is
considered a priority and so the decision about the approach followed. Each level of
the analysis, starting from the shop floor, includes the following three aspects:
Specific contribution/role in the kitting process (Source: Documentation,
Interviews and Observations);
Issues recognised from an internal point of view (Source: Interviews
Outcomes);
Issues recognised from an external point of view (Source: Observations
Outcomes).

Lean Kitting Marta Lupi
41
5.1 Relevant Areas of the Kitting Process
Mapping has been identified as the first step and the specific information to create
the map may come from different sources. In the case study, the documentation
provided by the company allowed the understanding of how the relevant areas
involved in the kitting process are interrelated, which is essential for the
understanding of the process flow. Consequently, it is considered useful to show
which is the relationship between the areas that contribute to the kitting process and
that have been involved in the data collection step. Figure 27 shows the map of the
relevant areas with their interconnections.
The main links dedicated to the communication between the areas are represented in
red, whereas the colour repreenting the precedence logic that affects the process is
purple. Design is where the whole process starts. Therefore, the work of the
manufacturing engineer (ME) is mainly triggered by design; then the ME triggers the
PC and later the store is involved with the creation of the kit and the shop floor. The
SHOP FLOOR
DESIGN
MANUFACTURING
ENGINEER
PRODUCTION
CONTROLLER
STORE
SCHEDULING
Area Manager
Team Leaders
LAB
Figure 27 - Relevant Areas of the Kitting Process
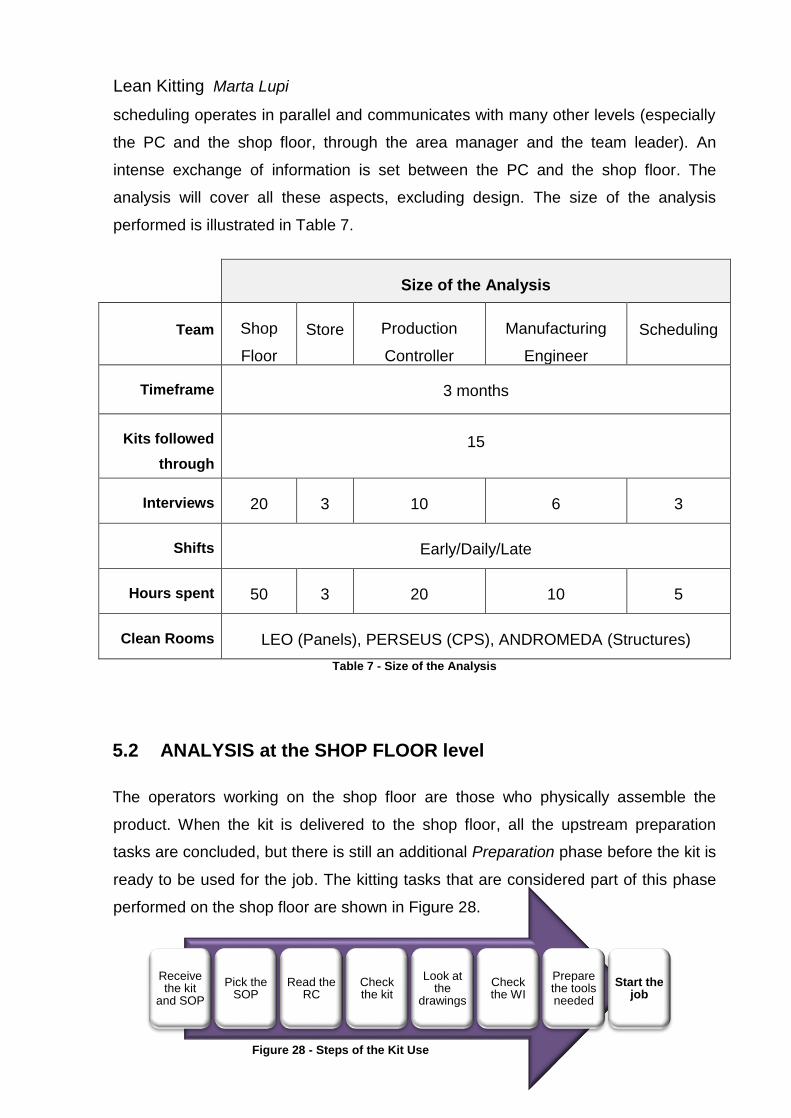
Lean Kitting Marta Lupi
42
scheduling operates in parallel and communicates with many other levels (especially
the PC and the shop floor, through the area manager and the team leader). An
intense exchange of information is set between the PC and the shop floor. The
analysis will cover all these aspects, excluding design. The size of the analysis
performed is illustrated in Table 7.
Size of the Analysis
Team Shop
Floor
Store Production
Controller
Manufacturing
Engineer
Scheduling
Timeframe 3 months
Kits followed
through
15
Interviews 20 3 10 6 3
Shifts Early/Daily/Late
-
-
-
-
Hours spent 50 3 20 10 5
Clean Rooms LEO (Panels), PERSEUS (CPS), ANDROMEDA (Structures)
Table 7 - Size of the Analysis
5.2 ANALYSIS at the SHOP FLOOR level
The operators working on the shop floor are those who physically assemble the
product. When the kit is delivered to the shop floor, all the upstream preparation
tasks are concluded, but there is still an additional Preparation phase before the kit is
ready to be used for the job. The kitting tasks that are considered part of this phase
performed on the shop floor are shown in Figure 28.
Receive the kit
and SOP
Pick the SOP
Read the RC
Check the kit
Look at the
drawings
Check the WI
Prepare the tools needed
Start the job
Figure 28 - Steps of the Kit Use
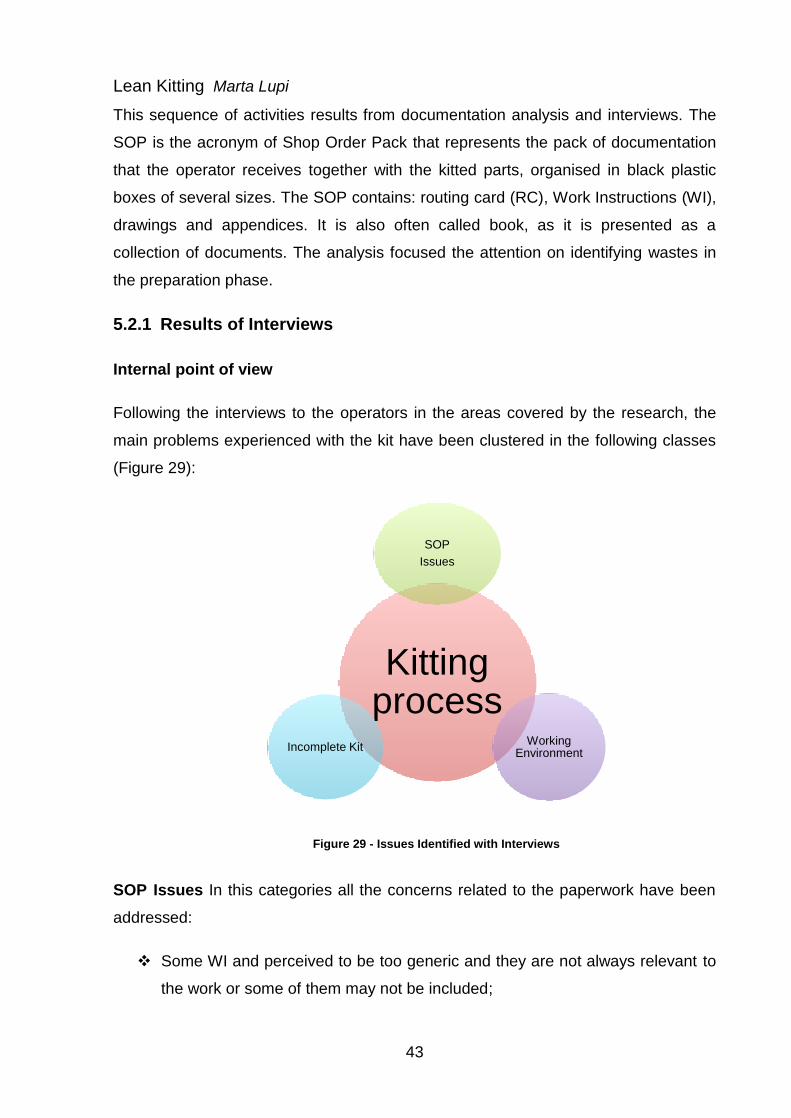
Lean Kitting Marta Lupi
43
This sequence of activities results from documentation analysis and interviews. The
SOP is the acronym of Shop Order Pack that represents the pack of documentation
that the operator receives together with the kitted parts, organised in black plastic
boxes of several sizes. The SOP contains: routing card (RC), Work Instructions (WI),
drawings and appendices. It is also often called book, as it is presented as a
collection of documents. The analysis focused the attention on identifying wastes in
the preparation phase.
5.2.1 Results of Interviews
Internal point of view
Following the interviews to the operators in the areas covered by the research, the
main problems experienced with the kit have been clustered in the following classes
(Figure 29):
SOP Issues In this categories all the concerns related to the paperwork have been
addressed:
Some WI and perceived to be too generic and they are not always relevant to
the work or some of them may not be included;
Kitting process
SOP
Issues
Working Environment
Incomplete Kit
Figure 29 - Issues Identified with Interviews

Lean Kitting Marta Lupi
44
WI may include a different terminology to indicate the same component/item
and this creates confusion;
WI may be difficult to understand and sometimes lack graphical
representations;
Very different WI for similar components, that does not simplify the read;
Drawings may be not updated or wrong and the operator may realise this
problems while already working;
Drawings are missing from the SOP, or those in the paperwork are not always
clear;
Lack of updates in the paperwork;
Appendices to be completed may lack important information;
Formal documents are not completed as they should be;
BOM is not clear and it requires cross-referencing with the labels of the items
(many BOMs in the same SOP and the operators do not understand the
difference between all of them).
Incomplete Kit Parts missing in the kit are a real source of concern for the operators
and these are the most common situations:
Parts are not in the kit and this is highlighted on the BOM;
Parts are marked and should be in there, but they are not;
Shortage reports are either not included in the SOP or not clear for the
operator.
Working Environment An untidy and disorganised working environment is likely to
negatively affect the way operators work:
Some parts do not have any spare stock on the shop floor, while others are
stored in abundance;
People spend too much time searching the kit and the relative SOP;
Consumables are not meeting the shop floor needs.
Even though this list represents the most common problems, different operators have
different and variable opinions about how the paperwork, the WI and the drawings
should be. This includes also the idea of the perfect way of delivering the kit.

Lean Kitting Marta Lupi
45
NB: Some of these comments and opinions have been then proved to be true while
observing the operator on the shop floor. Indeed, the real focus of the observation was
the understanding of what really happens in between the kit is delivered to the shop
floor by the PC and the operator is ready to work on that job (Preparation phase). As
previously explained, this mainly involves the reading of the paperwork, WI and
organising the tools.
5.2.2 Results of Observations
External point of view
The steps described in Figure 28 represent the standard sequence, but this may
slightly change according to each individual operator, who may spend more or less
time on each of them. Generally all of them are performed prior to the use of the kit
on the shop floor, but the most experienced operators may sometimes skip the
reading of the WI, because of the familiarity with the task.
5.2.2.1 Example of Practical Case Studies
To explain the outcomes of the observations and describe what actually happens on
the shop floor, Table 8 has been created. It reports the clean room involved in the
analysis, the time spent by the operator to go through all the Preparation tasks
(Figure 28) and the main issue experienced. This only describes a sample of a few
observations performed and all of them consider what happened in the preparation
phase. What have not been taken into consideration to create this summary table are
those kits that have not been intentionally delivered to the shop floor because of
missing parts that would have prevented the operator from performing even the most
simple preparation tasks. The most severe issues may result in an increase of overall
production lead-time of weeks or even months.

Lean Kitting Marta Lupi
46
Clean Room Time spent Main Issues
Perseus
1 h and 14 minutes
Mix not available/ stamps
on the document missing
44 minutes SOP not clear
17 minutes WI not clear
Leo
6 minutes -
5 days
One item awaiting inward
inspection (after delivery
from supplier)
Andromeda More than 3 weeks One item awaiting quality
inspection
Table 8 - Example of Case Studies
The time spent varies according to the complexity of the job, the familiarity of the
operator with the task and the amount of issues experienced, as well as the severity.
Also, the number of people involved in the task affects that time (one or more
operators, quality inspector etc.).
Generally, Leo and Andromeda clean rooms have fewer problems with the kit
compared to Perseus, because of the different criticality of the operations.
Nevertheless, issues affecting the flow are spread throughout the product areas and
only a small percentage of kit has no issues.
Lean Kitting Marta Lupi
47
5.2.2.2 Wastes Identification
From the observations, the main sources of wastes were identified and categorised,
when possible, according to the Ohno’s wastes. Three main categories resulting from
the analysis are: overprocessing, waiting and movement.
OVERPROCESSING: The operator always double checks the kit once it has been
delivered to the shop floor, even though they are not supposed to. Indeed, the store
men have already done the check. This is a complete waste of time that varies
according to the complexity and the size of the kit.
WAITING:
The operators do not always complete the paperwork, which is compulsory, and
this delays the operators in charge of the step afterwards. Indeed, this causes a
knock-on effect of delays, as the operator, before starting the work, is required
to look for the person in charge of the previous step, to make sure the product is
safe and the previous operation has been successfully completed (See SOP
Issues);
It happens that the WI or the RC is not correct and this has a negative impact on
the operator. It also may happen that WI and appendices are missing from the
SOP. However, depending on the level of experience, it may take a
considerable amount of time to realise the problem and solve it. Moreover, other
operators may be involved in solving the problem, causing a waste of time not
only for one person, but also for ¾ people depending on the complexity of the
problem (See SOP Issues);
Incomplete kits lead to a waiting type of waste. However, it happens that the kit
can still be used for some preparation work. This is a source of concern for
almost all the operators. It may happen that the kit is ready to be used, but there
is an NCR that forces the operators to wait for the quality problem to be solved
by the engineers. In addition, an item may require a quality inspection from
specialised operator and, according to the workload, this operation may wait for
days. (See Incomplete Kit).

Lean Kitting Marta Lupi
48
MOVEMENT:
The mixes that are necessary for the job are not available in the clean room or
delivered with the kit. In fact, they have to be requested by the operators and
collected from a laboratory based on site. The operator prepares a paper
request that is taken to the lab and then goes back to work waiting for the call to
go back to the lab and collect the mix. This causes unnecessary movements
(classified in Mix Problem). Nevertheless, this is not recognised as an issue by
the operators, as it is considered as a chance for a break or a stop on the way
to the bar. So, in this case is a change in people’s behaviour that is required;
Generally, the working area is not highly clean and tidy, especially in one of the
areas studied (CPS). The concept of 5S, which is one of the major tools used in
lean manufacturing described above, is not well introduced as part of the
everyday practice, even though there are signboards on the wall at the main
entrance of every clean room describing each S. This issue negatively affects
the shop floor because:
o People waste time looking for books or kits that do not have a specific
place on the racks of the shop floor. Indeed, it is common to see people
walking from one side of the site to the other looking for something.
Usually, several operators work on the same paperwork at the same time
and may be interested in the same drawing and this contributes to creating
confusion. However, the operators never try to maintain the order to
facilitate their and other people’s job;
o The kits delivered to the shop floor for the first time do not have an
allocated location on the racks. Moreover, the racks are often moved to
follow the projects, creating even more confusion;
o Not all the books have a label on the front cover and on the side, and this
leads to additional wasted time.
NB: What is not causing any issues is the position of the hand tools. In fact, in this
case the operators are extremely organised: each of them has a personal toolbox and
they are placed at a manageable distance from the working space.

Lean Kitting Marta Lupi
49
To visualise the identification of the wastes, the following diagram (Figure 30) has been
created, according to three classes of wastes, recognised as the most common.
5.2.3 Pareto Analysis
After interviewing, observing the operators and identifying the main issues, it was
important to show the frequency of the problems, to evaluate the size of the impact on
the way people work. In order to identify which problems have a higher frequency rate
and which are less important the Pareto Analysis was used.
Figure 31 - Pareto Analysis
0%
10%
20%
30%
40%
50%
60%
70%
80%
90%
100%
0
1
2
3
4
5
6
7
8
9
SOP Issues Incomplete Kit Mix Problem
Issues
Pareto Analysis
Relative Frequency
Cumulative Frequency
Overprocessing
Double-check kit
Waiting
Incomplete Kit
Items to be inspected
NCR to be solved
Paperwork issues
Documents not completed
Movement
Mix not ready
Work environment not organised
Figure 30 - Issues Identified with Observations

Lean Kitting Marta Lupi
50
The data used as inputs for the analysis (Figure 31) came from the operators’
interviews and personal observations on the shop floor. The main issues analysed
previously has been introduced on the x-axis, while the two y-axes represent the
cumulative and relative frequency.
The time frame used for the analysis is approximately 2 months and the weight given
to the operator’s opinion and the personal observations was the same (50%), in order
to represent the actual state from two points of view: internal (operators) and external
(personal).
The categories of problems used for the analysis were those identified following the
interviews, because even the wastes addressed by the observations could be included
in those classes. However, the working environment issues were not included in the
analysis, as they always negatively impact the way people work and this problem is
recognised by both the employees and confirmed by direct observations on site.
Furthermore, the amount of time spent on double-checking the kit has not been
considered for the analysis, as that happens 100% of the times. Moreover, a category
of problems that has been identified by observations that was not recognised as an
issue by the operators has been introduced in the analysis with the label “Mix
Problem”. This represents the lack of specific tools delivered together with the kit and
requested at a later stage by the operators.
So, the main categories taken into account for the analysis were: SOP Issues,
Incomplete Kit and Mix Problem. It is clear from Figure 31 that the first two categories
represent a real problem for the operators and a further analysis was considered
necessary.
The formula used to calculate the numerical figures shown in Figure 31 is the
following:
𝑛𝑂𝑝𝐼𝑁𝑇𝐸𝑖 ∗1
2+ 𝑛𝑂𝑝𝑂𝐵𝑆𝑖 ∗
1
2
i= issue;
Equation 1 – Calculation of the Issues’ Frequency

Lean Kitting Marta Lupi
51
nOpINTE= number of operators interviewed that recognised the considered issue to
be a problem affecting the kitting process;
nOpOBS= number of operators observed that were involved in the considered issue.
The formula has been calculated for every issue and used to populate the graph.
SOP issues 7*0,5 +10*0,5= 8,5
Incomplete Kit 5*0,5 + 8*0,5= 6,5
Mix Problem 2*0,5=1
The excel spreadsheet has driven the whole analysis and it is reported in Table 9.
Table 9 - Excel Spreadsheet
5.2.4 Further Analysis
Going to the root cause of the problems is one of the key principles of lean
manufacturing (Hubbard, 2010). For this reason, some of the issues were further
analysed using the so-called Fishbone diagram. Two main classes of problems,
according to the outcome of Pareto, have been deeper investigated: Incomplete Kit
and SOP Issues. The information used to populate the diagrams came from both
interviews and observations. However, the analysis was interrupted at the second
level of causes, as it was not possible to investigate deeper for all the areas, due to
some constraints: some areas, such as design or purchasing, have not been
included in the scope of the research and it was not possible to find a point of contact
to extend the analysis. Therefore, there are still opportunities for further research.

Lean Kitting Marta Lupi
52
5.2.4.1 Incomplete Kit
The analysis mainly takes into consideration the problem of a kit released on the
shop floor with items missing inside. Indeed, regardless of the shortages, the PC may
decide to release it to the operators, based on personal judgment and experience to
allow some preparation work. The diagram shown in Figure 32 includes the potential
causes of an incomplete kit. It is organised according to the organisational levels that
are believed to be involved in the issue.
Alternatives: when the PC prepares the SOP, there are possible alternatives
for items that can be used suggested by SAP if there is a shortage for a
specific item. This means that if an item is not available, there may be another
one that can be used as a replacement. This message is often ignored by the
PC and brings to the lack of the original item in the kit;
Figure 32 – Fishbone Diagram- Incomplete Kit
INCOMPLETE
KIT
Purchasing
Design
PC
Forget send PR
Shop Floor
Lose items
BOM wrong
SAP
Manual Mistakes
Store
Lose items
Alternatives missed Vendor
Delays/Mistakes
Other Delays
Inspection Delays
Forget to kit/Check not
correct
System Problems
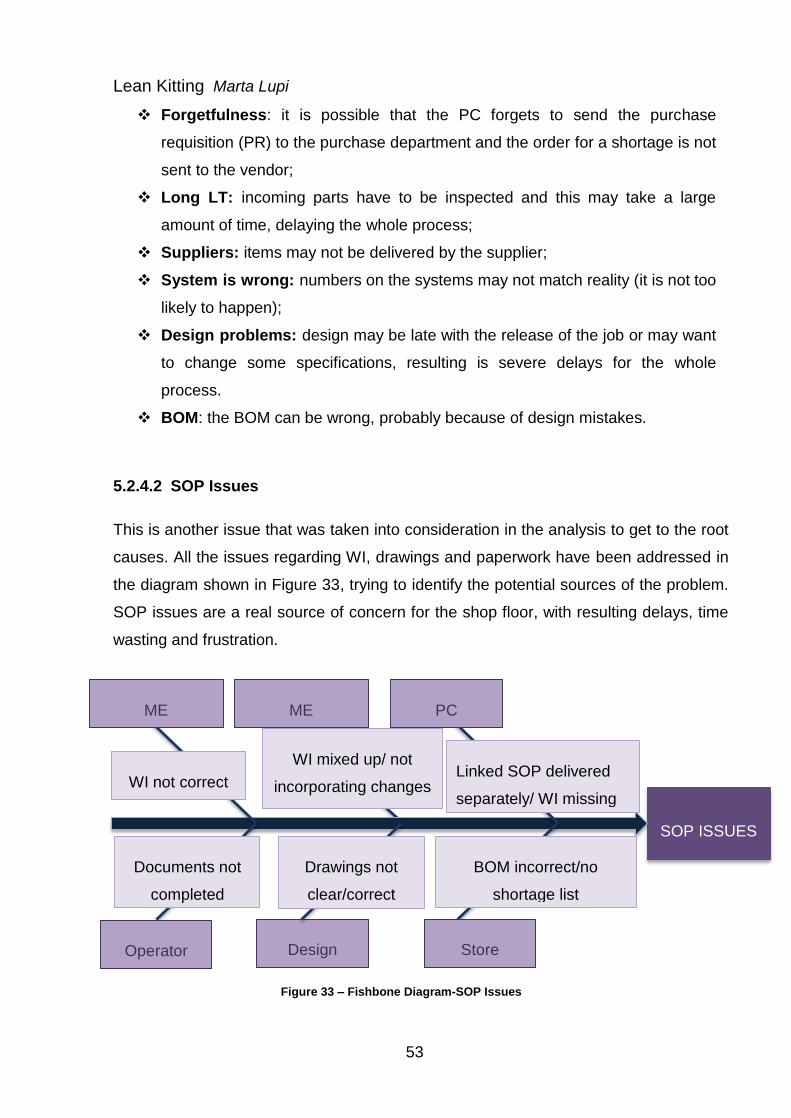
Lean Kitting Marta Lupi
53
Forgetfulness: it is possible that the PC forgets to send the purchase
requisition (PR) to the purchase department and the order for a shortage is not
sent to the vendor;
Long LT: incoming parts have to be inspected and this may take a large
amount of time, delaying the whole process;
Suppliers: items may not be delivered by the supplier;
System is wrong: numbers on the systems may not match reality (it is not too
likely to happen);
Design problems: design may be late with the release of the job or may want
to change some specifications, resulting is severe delays for the whole
process.
BOM: the BOM can be wrong, probably because of design mistakes.
5.2.4.2 SOP Issues
This is another issue that was taken into consideration in the analysis to get to the root
causes. All the issues regarding WI, drawings and paperwork have been addressed in
the diagram shown in Figure 33, trying to identify the potential sources of the problem.
SOP issues are a real source of concern for the shop floor, with resulting delays, time
wasting and frustration.
Figure 33 – Fishbone Diagram-SOP Issues
SOP ISSUES
ME
Design
WI not correct
PC
Documents not
completed
Drawings not
clear/correct
ME
WI mixed up/ not
incorporating changes
Store
BOM incorrect/no
shortage list
Linked SOP delivered
separately/ WI missing
Operator

Lean Kitting Marta Lupi
54
The possible causes have been classified according to the area of responsibility, and
the main focus was on categorising the list of issues presented as a result of the
interviews, to prepare the path for the deeper analysis of the root causes. Moreover,
this analysis was considered extremely useful to understand on which category it is
worthy to focus more attention with the proposed solutions.
After the analysis of the shop floor, the focus was on the other organisational levels.
5.3 ANALYSIS at the AREA MANAGER level
The area manager (AM) represents the main link between the scheduling team and
the team leaders on the shop floor.
The AM is supposed to receive the weekly scheduling that is then translated in a to-
do list of tasks for the week. They are also responsible for the weekly resource
scheduling. The AM can also push the team leaders to organise their team to focus
on a specific task, as they know, because of the scheduling, which jobs are more
critical and which can wait. Generally, the AM has a three-week visibility ahead, as
they received this piece of information together with the weekly scheduling.
Internal point of view
The AM often complaints about the fact that the kit is not ready when needed, so
they cannot do their job and organise the weekly tasks of their resources. A late kit or
incomplete kits than cannot be used on the shop floor have the same impact on the
performance.
Furthermore, some of the consumables (low-value items such as tapes) in selected
clean rooms are organised in “kanban” and there are no real concerns, while other
consumables cannot be stored in the clean room because of their size and this
creates issues in terms of shortages.
Moreover, they often criticise the long response time required to receive an answer
from the engineers about Non Conformance Report (NCR), which forces the
unproductively operators to stop their job.
Lean Kitting Marta Lupi
55
External point of view
Not all the area managers are based on the shop floor, so their visibility in terms of
issues and time to react to a problem is completely different.
Furthermore, the kanban system used in the company is not the one that is explained
in the State Of The Art: indeed, the shelves with the items are checked once a week
and refilled if required. No cards or other proper kanban systems are used.
5.4 ANALISYS at the STORE level
The store is the place where the kit is physically assembled. The workload for the
store men (no more than 2) is reported on a spreadsheet that is compiled by the PC.
It says which kit has to be prepared, the date required and all the paperwork
information. What the PC delivers to the store, to trigger the preparation, is the
complete SOP.
The work of the operator starts with SAP, where the list of parts to be kitted can be
found, associated to the WO and the part number.
The parts to be kitted are then selected one at a time and the operator can see the
quantity required and the batches of the product which are available in the carousels
(namely the stock location). The logic used is FIFO, so the oldest batches are those
used first. The operators update the system with number of the items required and
pick the same component from different batches if only one is not sufficient in terms
of quantity available. This is done for all the components of the kit. The labels are
printed out and the operator than physically use the plastic bags, the labels and the
items withdrawn from the carousel to assemble the kit.
The bags are placed in the kit without a specific order. Moreover, the operators count
the items manually, but they can use a scale if needed (used mainly when the
quantity is large).
If the part number comes from different batches, they use different bags, to keep the
traceability, but then they don’t put them in a bigger bag to facilitate the shop floor.

Lean Kitting Marta Lupi
56
When the kit is ready, the last thing to do is to print the BOM reporting the batch
number of each item that have been kitted and the comparison between the quantity
withdrawn and the requirements. The conclusive step is the update of a spreadsheet,
stating that the kit is ready and who has prepared it.
Two people are involved at this stage:
1 does the kit;
1 checks the kit (quantity and correct batch).
Internal point of view
It does not seem to be any issues for the people working in the store.
External point of view
The store is only a pick up point, so it does not deliver anywhere. People also
erroneously think that the store is located in the middle of the plant and when people
walk or take a break can stop there to collect what they need. This is the wrong
message to send; indeed it implies time wasted in walking.
Furthermore, people are human beings and they make mistakes and this does not
help the flow of the process. However, the positive aspect is that a new device
(comparator) has been introduced to help matching the label on the item and the item
in the carousel; this is a good example of poka-yoke and the use should be
encouraged.
There are computers on each carousel that may be used to be connected with SAP,
but are not used at the moment.
5.5 ANALYSIS at the PRODUCTION CONTROLLER level
The production controller (PC) is in charge of the SOP creation, collecting the WI and
the RC from the manufacturing engineering, and SAP updates in terms of items,
state of the order and project etc. Furthermore, the PC is the person that makes the
“Make or Buy” decision about the production of a component specifically related to

Lean Kitting Marta Lupi
57
the project (commodity items are not in their area of interest). As part of their role, the
PC delivers the SOP to the store and once it is ready, he/she takes it to the shop
floor.
Kits may be delivered on the shop floor:
Complete: it may be used as soon as it gets to the shop floor or wait for a
week or more, depending on the workload of the operators. The PC
sometimes pushes for the kit to be ready or subassemblies to be prepared
even though these are not required from the shop floor, but only to keep
people busy. (WAITING issues)
Incomplete: the kit may be considered to be usable for some preparation work
even though there are some items missing. If there is a shortage the kit, the
PC may:
o Send a RFQ to the purchasing department;
o Transfer on SAP some items associated to another project to the
project that needs them;
o Look for alternatives (as explained in section 5.2.4.1).
The production controller is also in charge of sending the purchase requisition for a
specific item, which is a purchase request sent to the purchase department. This
then sends the quote received from the vendor back to the production controller that
decides what to do.
Which are the inputs for the PC workload? There are several sources pushing and
asking the PC to work on a specific piece of work: meetings or emails received from
the scheduling team or the project management and also according to the
information stored on SAP. However, each PC, according to the area of interest, acts
differently from the others, so it is not easy to generalise to describe the same job
related to different areas.
Internal point of view
The main issue for the PC is related to the lack of communication between the areas
and the lack of power that they experience. Indeed, there is no real communication

Lean Kitting Marta Lupi
58
and understanding of what it is happening upstream, especially with design and this
creates a state of confusion.
External point of view
Organisational Issues: PCs of different areas have a different visibility ahead of time,
regarding the kits that will be released. Indeed, the PCs in the CPS area do not have
any visibility over the kit that will be kitted ahead, therefore they mainly do what they
are told to, whereas those in the panel area receive the scheduling for three weeks
ahead and they have more power about requesting the kits. However, there are other
problems in the panel area. Indeed, the PC spends time translating the high-level
scheduling generated by P6 (software used by the scheduling) into part numbers
used by SAP and this is a complete waste of time.
Communication Issues: there is not a rule associated to the communication between
the store and the PC. Indeed, sometimes the store man is asked to send a notice
when the kit is ready and sometimes they put the finished kit on the rack and the PC
goes to check whether the kit is ready or not. There is a spreadsheet (mentioned in
section 5.4) that the PC can use to check whether the kit is ready or not, but this is
rarely used.
Kit request: sometimes the PC request some tasks to be performed only to fill in
some spaces in the operators’ working time and to avoid wasting time, but this
creates WIP that have more value, increases the cost of the stock for the
subassemblies and created kits that are not required by the shop floor. This is far
from the JIT philosophy (do what it is needed when it is needed).
Kit delivery: the kit is delivered on the rack dedicated to a specific project, but
because the racks are moved sometimes it may be difficult to find the right one. In
addition, there is no logic used for each specific kit, just filling the spare places. In
fact, as part of the PC workload is based on SAP, what may happen, especially in
CPS, is that:

Lean Kitting Marta Lupi
59
Kits are released too early, only because the design is ready (stated on SAP)
and the PC feel more safe about the idea of having the kit on the shop floor,
even though it might stay in there for months;
Kits are late because of problems with the design etc.
Extra Movement: taking into consideration the position of the PC in the areas
considered, the following analysis has been developed to show how much time every
day is spent on walking (Figure 34). The main problem is that this is not recognised
as an issue by the people working in the company, but it is one of the 7 wastes:
MOVEMENT.
Table 10 aims to translate in numbers the movements addressed in Figure 34,
reporting an estimation of the average figures for the time spent by the PC walking
(the three areas are considered in the analysis). At the end of the analysis,
estimations about the severe impact of this waste are stated.
Figure 34 - Steps of the PC Job
If problems arise on the shop floor, the PC is supposed
to go there to solve them (Additional walking)
PC Computer
Printer
Store
Shop Floor
Each movement is
repeated twice

Lean Kitting Marta Lupi
60
Computer – Printer – Computer
Approx. 30/35 sec
May be repeated for the same
SOP more than once:
Drawings
Main Body of the SOP
Etc.
Computer – Store – Computer Approx. 4 minutes
Computer – Store – Shop floor –Computer
Approx. 7 minutes
NB: the check of the kit and the
SOP before delivering the shop
floor may take an additional 1/2
minutes
This time is reduced for Panels
because the PC is physically
based on the shop floor.
TOTAL Approx. 12 minutes per SOP
Table 10 - PC Walking Time Estimation
To give an estimated idea of the amount of time literally wasted walking every year,
some numerical figures are presented:
Approx. 12 minutes each SOP (Assumption: 1 SOP for 1 PC, no overlapping)
Average of 1100 SOP/ Project
Average of 4 Projects/ Year
Value of one hour work £50
TOTAL TIME WASTED every year:
52800 minutes= 880 hours* £50= £44000 wasted

Lean Kitting Marta Lupi
61
5.6 ANALYSIS at the MANUFACTURING ENGINEERING level
The manufacturing engineer (ME) is considered the point of contact between the
shop floor and design. Indeed, the ME is in charge of creating the WI and the RC that
are included in the SOP. Their workload is organised according to the AIT project
manager that prioritise the work and he/she is mainly driven by the design needs and
times. The ME has no real visibility on the scheduling.
The process of creating the WI involves the decision of the type of WI to use. Indeed,
according to the complexity of the job, different solutions are used (Table 11):
Method
Explanation
Standard planning
Only the RC is delivered with the kit and
the WI are available on the shop floor
(used for standard tasks)
Work masters
Template to use that can be modified to
fit with the specific job (it is been
previously approved)
New WI
Write the WI from scratch, which is used
only in case of something that has never
been produced before
New WI based on an existing WI
Copy/paste from existing WI (this is the
most used option)
Table 11 - WI Creation
The ME usually checks if in the system there is a WI for a part number that may be
similar in terms of features and context of application even belonging to another
project. If so, they work to adapt the WI to the new part number. Additionally, the
engineer checks when the WI was used for the last time and checks all the eventual
changes that were annotated by pen before the closure of that project. This is a good
practice to take into account the comments coming from the shop floor, but most of
the times the paperwork does not reflect the real state.

Lean Kitting Marta Lupi
62
A family tree can be used, when existing, to understand the relationship between the
part numbers.
It may happen that a WI is modified according to the changes required by the
operator on the shop floor, but this is not always a priority. This is related to the
complaint that the WI sometimes is wrong.
Why the WI may not be the correct one when first generated?
Theoretical VS practical knowledge;
No direct feedback received from the shop floor to improve it;
Different people with different opinions.
Internal point of view
They are not allocated to a specific project so that they know exactly which WI is
required next, and they mainly prepare the WI for what they are allocated to. They
lack the bigger picture.
Furthermore, the operators have different ideas about how the WI should be and this
does not simplify the ME work, that will never be able to please the shop floor
completely.
External point of view
A family tree may exist, but sometimes it is not made available to every ME. Indeed,
it is available for the CPS area, but it does not seem the same for panels. The lack of
this documentation seems to represent a big issue that can actually affect the
creation of the kits and the work on the shop floor. This refers to the fact that
sometimes kits and paperwork for a job are released at different times, while the
operator would like to have them all together to start working. This is a consequence
of the logic used for the creation of the WI.

Lean Kitting Marta Lupi
63
5.7 ANALYSIS at the SCHEDULING level
Scheduling works to prepare the working plan in a multi-project environment. This
means that the scheduling team split the work according to product areas and not to
individual projects. What happens is that the scheduling for a specific project is
broken down into areas and assigned to a member of the scheduling team.
What the scheduler does is the check of available resources (machines, people etc.)
to create the weekly to-do list for the various product areas (panel blank, equipping,
assembling etc.), which is then delivered to the area manager, so that even each
team leader of the area is aware of the workload. Accordingly, the area manager and
the team leader create the shifts.
The scheduling is done on Primavera P6 (shown in Figure 35), which is a software
operating at a high level compared to SAP, based on description and not on part
numbers. However, P6 and SAP do not communicate one with each other.
Internal point of view
They realise that the lack of communication with the other areas is affecting the
quality of the work of the whole company. This can be considered a good first step
toward the achievement of positive improvements.
Figure 35 - P6 Software (Oracle, 2014)

Lean Kitting Marta Lupi
64
External point of view
Communication Issues: the communication of the weekly scheduling works in a
completely different way in the various areas, even though in theory should be the
same.
Panel:
o Area manager: receive the scheduling and organise the work for the
week;
o PC: receive the scheduling for the week and the weeks ahead, so then
it is their responsibility to get the kit prepared for the shop floor when
needed.
CPS:
o Area manager: receive the weekly scheduling and talks to the team
leaders to organise the workload;
o PC: the process is exactly the same, but they do not use the scheduling
received, they work and react based on what SAP says.
Different Perspectives: the PC releases the kits based on SAP, but SAP is not talking
to P6, that knows what is urgent and what is not too critical. The PC is used to work
with the part numbers, while the scheduler can only offer the part description.
Example of LACK OF COMMUNICATION between organisational levels, related to
the lack of systems’ integration.
5.8 Additional Considerations
The following considerations can be considered a summary of the data collection and
problem identification. These are considered as the issues that are spread across the
organisation that has negative consequences on the kitting process as well and that
should be address in a prospective of a leaner process.
There is a lack of communication, especially between the shop floor and the
engineers. Indeed, the observation sheet that should be used by the shop
floor to comment about problems or aspects that may be improved is rarely

Lean Kitting Marta Lupi
65
used and sometimes what the shop floor says goes lost. Contrary information
received by different levels confirms the lack of communication. The lack of
common understanding between the parts is the result of this situation (for
example, people on the shop floor do not understand what the documentation
means, while each symbol has a specific meaning);
There is a lack of trust amongst the parts involved in the process, especially
between the store and the shop floor and for this reason the operator does an
additional check on the kit that should not be of his/her concern;
Lack of integration between the systems creates many issues;
Lack of collaboration between design and production. Design and production
should start working together;
People often change their minds and different people would like to receive the
kit and the paperwork in a different way. This increases the complexity of
finding a solution that fits the majority of the people (Comment about the guys
of the shop floor from the engineers point of view);
Lack of the ability to change as things have always been done in the same
way;
People as human beings make mistakes and this are inevitable, but some
poka-yoke devices may be introduced to simplify the operator’s life.
The issues described above are graphically summarised in Figure 36. They have
been organised in three levels, according to personal judgment, placing at the basis
of the diagram the three major issues that are considered the starting point for all the
other issues identified.
Figure 36 - Common Issues
Lack of the
Ability to change
Lack of
Collaboration Variable Ideas
Lack of
Communication
Lack of
Integration Lack of Trust

Lean Kitting Marta Lupi
66
5.9 Data Collection Constraints
The idea at the beginning of the research was to fully use the bottom-up approach. It
means that the collection of the data would have started on the shop floor moving
upstream in the process with the passing of time. However, the amount of work on
the shop floor was not regular and for periods of time there were no kits to evaluate
and analyse. For these reasons, the data collection has not been smooth as planned,
and there has been an overlapping between the several operational levels.
Nevertheless, this has not affected the quality of the data collected.
Moreover, initially the idea was to interview both experienced ad inexperienced
operator to evaluate the difference between these two categories, however the
majority of the operators have loads of experience, as the manpower turnover is
really low and what may change is only the familiarity with a certain type of job.
Another aspect to highlight is the concern related to opposite information received by
various people regarding the same topic during interviews. In fact, two sources were
often in contrast with each other, so a third part was involved to answer the question
asked with more objectivity. When that was not possible, that information was
excluded from the data collection.
Furthermore, it was difficult to generalise some of the data collected, as the several
departmental areas of the case study have different features, so it was necessary to
treat each of them separately, increasing the level of difficulty in terms of possible
solutions.

Lean Kitting Marta Lupi
67
5.10 General Method
The Airbus D&S case study has been a valuable source for the data collection and
the whole problem analysis. Most of the issues and wastes identified with the
analysis had been labelled by the literature as possible drawbacks of the kitting
process, but there are some company-specific issues that did not exist in literature.
Therefore, this research has confirmed that the major drawbacks of the kitting
(section 2.2) really exist in practice, no matter the size or the environment of the
company. Therefore, it is expected that even other similar companies would have the
same source of concern regarding the kit preparation. On the other hand, there are
other problems that have been highlighted by this research for the first time, as
specifically related to the case study. So, these are expected to change taking into
consideration different types of environments and companies. To get to this
conclusion, the research was based on the identification of the relevant areas of the
kitting process to be included in the interview and observation plan. Tools such as
Pareto and Fishbone Diagrams were used to quantify and visualise the outcomes of
the problem analysis. As stated at the beginning of the problem analysis, following
the definition of the research objectives, the focus of the section was on the
development of key steps to follow for the generic kitting process analysis, which can
also be used by other companies to identify their AS IS state. These can be
explained as follows:
Identification of the best practice (if existing) from literature and the most
common problems that may affect the kitting process;
Process mapping to understand the relevant areas of the process;
Data collection (observation, interview) from all the relevant areas;
Comparison of the different points of view (if possible);
Prioritisation of the issues identified, using tools such as Pareto, to understand
which are the issues to be addressed first;
If possible, identification of the root causes, that would help the process of
proposing a solution plan;
Composition of the big picture of the process and the issues with the data
collected to make sure all the various aspects analysed are included.

Lean Kitting Marta Lupi
68
NB: These steps will be then included in the overall final methodology for the solution
of the kitting process issues.
6 Proposed Solutions
This section aims to provide possible solutions to the problems analysed previously
and it is built above the best practices awareness. This will be done through the
development of a generic methodology to address those issues. The generic process
that has been followed to obtain the solution plan is shown in Figure 37. The three
Grey rectangles can be considered as inputs for the process, especially the state of
the art and the problem analysis outcomes. Then the process flows and both ideal
and realistic solutions can be considered as outputs. In the diagram they are
presented in parallel, however it is common practice to start with the ideal and end
with the realistic proposal. Lilac is the colour for the proposed solutions steps.
6.1 Kitting Requirements
Defining the requirements for the kitting process is considered the first step, as it
represents the basis for the proposal of an ideal and a realistic solution. Indeed, the
understanding of the end point (represented by the requirements) can be the key for
a valuable implementation plan. The scheme below (Figure 38) reports those
requirements, which have been stated considering the literature review and the
possible elimination of all the most common wastes that have been identified in the
problem analysis. These are not company specific, so they can be then applied to
Figure 37 - Logic Behind the Creation of the Proposed Solutions
Industrial Best Practices State of the Art Problem Analysis
Kitting Process Requirements
Constraint Definition
Ideal Solution Realistic Solution

Lean Kitting Marta Lupi
69
each specific case. The requirements do not take into consideration the best
practices from industry for two main reasons:
The best practices identified in section 3 incorporate a radical solution that
would require the kitting process to be removed from the company, so it
cannot be considered a best practice to improve the current kitting process;
Additional studies are needed for the extensive definition of specific kitting
best practices.
According to the requirements and using the knowledge acquired through the study
of literature and best practices, it was possible to prepare the proposal for an ideal
state for the kitting process, followed by a more realistic approach to the problems
identified of the case study. The ideal solution aims to provide suggestions about the
Kit
• All the correct parts in the kit
• Parts logically organised inside the box
• Kit delivered when required by the shop floor to avoid waiting and overfull racks
• All the necessary tools available with the kit
Paperwork
• Assure the quality checks are respected
• Complete the required paperwork
• Organise the kit and the paperwork together
• Paperwork correctly labelled for quick identification/use of colours may help
WI and Drawings
• Documents with the current up-issue and correct the first time
• Deliver all the jobs and paperwork together to the shopfloor, to allow the flow
• Customised WI for each specific job
WorkingEnvironment
• Rack organised and close to the working space (easily accessible)
• Paperwork delivered on shelves organised with a specific logic
• Paperwork kept on shelves when not used
• Bulky boxes placed at the bottom of the rack
Store ME PC
• Production controller aware of the scheduling/close to shop floor
• Manufacturing engineer aware of the family tree/ more contact with shop floor
• Items in store touched once and correct the first time
Figure 38 - Kitting Process Requirements

Lean Kitting Marta Lupi
70
best way to organise the work, including considerations for radical changes in a
future prospective. However, the aim is also to suggest some ideas that fit with the
industrial constraints and are feasible to be implemented in a Short/Medium term.
Therefore, prior to the creation of the ideal and realistic solution, the company
constraints have to be clearly defined. Both the ideal and the realistic solution are
considered essential steps in the methodology, because it is believed that both can
trigger reflection about the AS IS and TO BE state. Some of the above requirements
will be fulfilled with practical ideas in the realistic solution; others will only become
part of an ideal kitting process.
6.2 Constraints
The industrial best practices that have been presented in section 3 allowed and
triggered reflection about what can or could be achieved by companies. What is
important to highlight is the fact that there are some constraints that need to be
addressed to obtain valuable results. These may vary considerably according to each
specific working environment and also change over time. The definition of the
constraints is essential, as they define the boundaries of an ideal solution, limiting the
implementation of ideas in the real world. This step cannot be skipped and may take
a considerable amount of time in a company, according to the level of general
knowledge and understanding spread across the organisation. To clarify the concept
of Constraints Definition, the following diagram (Figure 39) shows the key constraints
for Airbus D&S.
Kanban
Lo
w-V
alu
e I
tem
s
Cellu
lar
Layou
t
Tra
ceabili
ty
Qu
alit
y
Airbus is responsible for the traceability of all the components that are installed in the spacecraft, due to the complexity of product and the customer requirements. This is a number one priority. A “kanban” system on the shop floor would not allow complete traceability. Indeed, the operators will be fully responsible for those components and mistakes due to the association component-spacecraft may cause serious problems.
Some of the items that may be considered low value in all companies may not considered the same in Airbus. Even simple items can become high-value components for several specifications. The company operates in a very regulated working environment and the quality area is involved in all the decisions regarding the materials management. Only the items with a low probability of failure are allowed on the shop floor.
To be able to introduce a real kanban system, the company should reorganise the way it works. Indeed, kanban is felt more appropriate for well-defined material flows, but the company might want to designate only certain items as kanban items.
The change in the layout can be considered a constraint at first, as it requires a reorganisation of the whole enterprise, but this analysis may be transformed in a future opportunity for improvements.
Quality is another priority for the company, so inspection is a critical task that cannot be removed.
Figure 39 - Airbus D&S Key Constraints

Lean Kitting Marta Lupi
71
6.3 Reflections
These reflections follow the definition of the best practices, the requirements and the
constraints and give an overview of the big picture of the case company, also
identifying possible priorities for the future.
A highly regulated environment is a big constraint for changes. However,
improvements can and have to be always taken into consideration in a business
moving forward. The best practices presented prove that radical changes can be
introduced in a low-volume/high-variety environment in a reasonable timeframe.
What the case study company and all the other similar companies can evaluate in a
future time is the opportunity of external suppliers creating the kit, delivering what is
required and when is required (JIT principle). This practice could save time in the
Preparation phase on the shop floor especially for the electrical items, whose
preparation phase prior to assembly can take up to 2 weeks, depending on the size
of the job. This change is expected to bring a reorganisation in the operator’s
workload and responsibilities, increasing the productive time. This may also bring
savings in terms of time spent in extra movement by the production controller. In this
case, the relationship with the supplier and the ability to schedule the workload plays
an important role and this is a good starting point for reflection.
Another aspect that deserves consideration regards the low-value/low-risk items that
may be stored on the shop floor. Traceability, possible loss of control and SAP issues
are all sources of concern, but additional studies on the candidates to store on the
shop floor is recommended, in order to assure the best working condition for the
employees. Indeed, if the problem of control over the items is a managerial
responsibility, the issue of waiting for the items on the shop floor causes a loss in the
amount of working hours because of the wait.
Linked to this problem, there is the people aspect. Workers are essential, as they are
closer to the customer in a bottom-up approach. In an ideal world, operators should
be involved in the planning phases of the manufacturing processes. Indeed,
communication and collaboration between different areas is central to success as it
helps sharing ideas and prevent problems from happening. This represents the ideal
state and literature supports this point of view. Design, manufacturing managers and

Lean Kitting Marta Lupi
72
shop floor are required to cooperate to Design for manufacturing (DFM) and
Design for Assembly (DFA). The goal is to design a product that is easily and
economically manufactured. The importance of designing for manufacturing is
underlined by the fact that about 70% of manufacturing costs of a product (cost of
materials, processing, and assembly) are determined by design decisions, with
production decisions (such as process planning or machine tool selection)
responsible for only 20% (Boothroyd and Dewhurst, 1989).
The use of the so-called Concurrent Engineering (CE) is also connected to DFM
and DFA, as it aims to facilitate the operator’s work, to experience fewer problems
that slow down the process. In fact, it is a method of designing and developing
products, in which the different stages run simultaneously, rather than consecutively.
It decreases product development time and also the time to market, leading to
improved productivity and reduced costs. A process involving CE already exists in
the company, but it is probably not set up properly, as there are still many problems
coming from the approach over-the-wall (Figure 40) (when each part acts as a silos
and then “throw” the outcomes to the other side without considering the potential
consequences.
Systems’ integration can also be the key to success. Information systems have been
created to facilitate and simplify the way people communicate and organise the
process, but if the existing systems are not integrated, this is likely to cause more
problems than those solved. This is represented by the fact that P6 and SAP are not
communicating with each other, which might be addressed in a future time, to ensure
a good understanding between the areas and the same communication language.
Figure 40 - Over-the-wall Approach (Entrepreneurness, 2010)

Lean Kitting Marta Lupi
73
It is important to remember that priorities can change over time, and so the
constraints.
6.4 Ideal Solution
6.4.1 Ideal Changes
After the reflection on ideal future conditions and priorities, the identification of the
constraints and the possible idea of removing of the kitting process as part of the
best practices, some ideal changes that include many of the aspects already quoted
are proposed and described below. This section aims to provide an ideal solution that
gives another meaning to the lean kitting concept, stating that a lean kitting process
is a process where all the wastes identifies are removed (instead of removing the
whole process). In fact, this can be described as another possible interpretation of
the lean kitting concept and it is presented to contribute to the interpretation of the
lean kitting concept, whose definition has not been clarified yet. Some of these ideas
will never be implemented according to the constraints already mentioned, but may
be considered in other environments; in addition, ideas may be evaluated for further
studies and application.
1. The mix that is prepared in the lab does not add any value to the kitting
process. Indeed, it acts only like a store, where operators deliver the request,
wait and collect the item after a period of time. No delivery is done to the shop
floor because of the manpower constraint. Two solutions can be considered
ideal: have the mix prepared by the operators themselves or delivered by the
PC with the kit. The former is ideal in a ST/MT but may be evaluated in a long-
term point of view, whereas the latter is not applicable, because of the
perishability of the mix.
Creating the mix on the shop floor involves the existence of chemical
competencies and machines. The operator in the lab uses software that tells
the exact quantity of materials required for the mix, so the competences
required do not seem a constraint and may be feasible to be acquired. The
total amount of mixes created in the lab is roughly 20 and many of them
involve only two materials. There is only one person working in the lab every

Lean Kitting Marta Lupi
74
shift and the workload is dictated by the requests coming from the shop floor.
To evaluate this solution, an additional future study is required to identify:
o The type and quantity of mix used in each clean room;
o The investment required to purchase machines needed in each clean
room and competencies required by the operator to prepare the mix
[decide who is going to prepare it] VS Cost savings associated to the
time for the transportation avoided.
The option involving the PC in delivering the mix together with the kit has the
prerequisite related to the request sent by the PC to the lab before the kit is
released on the shop floor. This cannot really be done in practice, because the
shelf life of the mix is really short (20-30 minutes). It is important to highlight
the fact that delivering the tool with the kit implies that the operator start
working almost immediately when receiving the kit, otherwise the mix can lose
the original consistency;
2. The number of items stored on the shop floor should be increased, but,
because of the constraint described above, the decision process is extremely
complex; the production controllers are still trying to find suitable items to
place on the shop floor;
3. The team leaders are responsible for the check of the consumables on the
shop floor and they then send an email to the store asking for the refill.
Sometimes another person is delegated to looks after the “kanban” in the
area. However, the store is only a pick up point and never delivers. The best
idea would be to have the store, whose personnel is less expensive, looking
after the consumables and the “kanban” and delivering the required amount of
items on a regular basis; it would free the time of the operators and the team
leaders. This seems to be unfeasible because of manpower constraints;
4. The operators always consider the WI an issue, but they have different
opinions regarding how they would like to receive them. As the team leaders
are able to collect ideas and complaints of the operators, meetings between
the ME and the relevant team leaders prior to the release of every WI could
facilitate the WI clearness and please the operators. However, the required
amount of time spent on talking and comparing ideas for every WI makes this
suggestion far from reality, also because there are about 1100 SOP in every
project;

Lean Kitting Marta Lupi
75
5. A more active collaboration between manufacturing and design would speed
up the whole process. So the idea of including team leaders in the design of
the product seems reasonable. Why team leaders? Because they have
experience on the shop floor and they can act as the representatives of the
other operators. But because time is vital and costs money, this is not
practicable, as the team leader would spend almost the whole day dealing
with problems in the design department, instead of productively working on the
shop floor. Even increasing the number of team leaders is not applicable,
because it means increasing the number of teams, spending more money;
6. The preparation of the kit is done manually and for this reason a fast speed
rate and effective mistake prevention systems are more difficult to be
integrated in the system. The ideal solution would take into consideration an
automatic picking machine, where the carousel is able to search, count and
label the items, placing them in the right box. However this is not realistic for
the working environment of the company and also in terms of investment
required. Moreover, as explained in the case studies from industry, companies
should consider the idea of removing the store;
7. From the point of view of electronic resources in the store, there are
computers on the carousels that are not currently used. The idea is to have
logical connection between SAP and the carousel, that automatically gives the
instruction to find the correct item and allows a certain amount of time for the
operator to collect it before moving to the consecutive part. This may not be
completely feasible because of the layout of the store and the number of
carousels (5 in total), in addition to the stress caused to the operator.
Moreover, to have the computers on each carousel talking to the store’s
computers there are some prerequisites. Indeed:
o Carousel’s computers should be upgraded;
o SAP should be installed on those computers.
Furthermore, apart from the initial cost that this may cause (about thousands
of pounds especially for the upgrade), the expected benefits do not seem to
make the investment worth. Indeed, the store man is still involved in picking
the item and the situation becomes more complicated when there is more than
one person working on the same carousel (common practice). So, in this case
the implementation does not seem a good idea;

Lean Kitting Marta Lupi
76
8. The integration between information systems (more specifically between P6
and SAP) is an essential step for improvement. This is not happening at the
moment because of the logic established in the MRP (Material Resource
Planning). Because of a lack of firmed planning, there are issues related to
indexes changing at every run of the MRP (every night and a big run on
Sunday night) that does not allow a stable connection between the systems.
To be able to connect the two systems, a change in the way the planning is
done is necessary. This is not impossible, but it may require additional future
studies and at the moment it is not a priority for the company.
Table 12 described in section 6.4.2 summarised all the changes proposed in this
section.

Lean Kitting Marta Lupi
77
6.4.2 Summary of the Ideal Changes
Area Involved Change Unfeasibility Reason
Shop floor More consumables on
the shop floor
No Short Term feasibility
but Additional Future
Studies
Lab
Mix delivered by the PC Shelf life too short
Mix created on the shop
floor
No Short Term feasibility
but Additional Future
Studies
Store
Delivery to the clean
rooms Manpower constraints
Automatic picking
system Budget constraints
Connection SAP/
Carousel Not enough benefits
ME Customised WI Time constraints
Manufacturing/Design Team leaders involved
with design in every job Time constraints
Manufacturing/Scheduling
Integration SAP/P6 Current MPR Working
logic does not allow the
connection but Additional
Future Studies
Table 12 - Ideal Changes

Lean Kitting Marta Lupi
78
6.5 Realistic Solution
What has been identified with the ideal solution and also with the industrial best
practices is a starting point for reflection about what cannot be done because of
existing constraints, but also potential changes (even radical i.e. kitting removal) for
the future. However, apart from considering what may happen in the future, it is
important to evaluate and try to solve all the problems that can be addressed
immediately, considering both a Short Term and Medium Term implementation to
create a realistic picture. Both implementation plans include consideration in terms of
Cost/Benefit Analysis.
Assumptions for the Cost/Benefits Analysis
The value of one-hour work is £50;
240 working days/year, 48 weeks and 8 hours/day;
75 is the average number of operators in the three areas covered by the
research;
4 is the average number of projects every year (each has 1100 SOP).
6.5.1 Short Term (ST) Implementation Plan
In a ST realistic solution the kit and the paperwork are kept in the same format and
the idea is to improve the current state, eliminating the most visible wastes that
prevent the kitting process from running smoothly. The driving force is the focus on
the operators’ needs in order to present the kit in the best possible way for them.
Indeed, delivering the kit with the correct amount of parts and paperwork when it is
needed simplifies the job of the operator and reduces the amount of time spent on
searching and fetching parts, with a consequent reduction of wastes.
The lean philosophy aims to eliminate stock and waiting times to allow the flow.
Consequently, the task should be done correctly the first time. For this reason, it is
essential that all the areas do their job effectively. When the kit is released to the
shop floor, it should be immediately picked by the operators to start working.

Lean Kitting Marta Lupi
79
The suggested improvements are described with the logic bottom-up, starting from
the shop floor and moving upstream in the process. The ST ranges from days to a
few weeks.
6.5.1.1 Suggested Improvements
6.5.1.1.1 Shop Floor
The changes suggested have been organised into categories and will be presented
as follows: visual management, mix, visual order and paperwork. These changes,
once implemented, will have a great impact on the shop floor (this is the reason why
they will be explained in this section), but it is important to highlight that they also
involve changes and the collaboration of the other organisational levels. So, all the
changes proposed involve and require the commitment of the whole company.
Visual Management
Currently, the shop floor is affected by a state of confusion regarding the kits and a
general disorder. To facilitate and simplify the work, a visual management system
(explained in section 2.1.2) can be the solution. The idea is to introduce a board
indicating which kits are on the shop floor and consequently which is the status of
each job, in order to help the general understanding and visibility of the organisation.
This addresses the problem of uncertainty about what it is on the shop floor and what
it is not, especially if kits are delivered when the team leader is not around. To gain
benefits from the implementation, this would involve the collaboration of the PC and
the team leaders.
A simple example of a board, to explain the concept, is shown in Figure 41. Each
colour has a specific meaning: RED represents the upcoming workload in terms of kit
to de delivered. Delivering the kit on the shop floor will cause the change the state
from RED to YELLOW. Both RED and YELLOW represent one of the most
dangerous states in terms of waste: WAITING. The team leader will be then in
charge updating it to GREEN when the kit is picked for work.

Lean Kitting Marta Lupi
80
The simple example can be then translated in reality. Currently, there are three bar
codes labelled on each kit that store information about the project number, the WO
and the part number. However, these are not used, but they can be the input to run
the visual management system.
The idea is to introduce scanners on the shop floor to read the bar code. Only one
code or a combination of codes is scanned and then, with the use of an application, a
link between the kit and an existing spreadsheet containing the other relevant
information (shown in Table 13) is established. The data scanned is sent to the
computer that already stores the spreadsheet in the system. The spreadsheet keeps
track of the kits whose documentation has been printed by the PC when preparing
the SOP, so it is automatically updated. There is no need to prepare an additional
one.
Once a job has been closed, a date should be included in the list and the job
removed from the list, without modifying the original spreadsheet in the system.
The drawbacks of the existing spreadsheet are the following:
Part Number 1
Part Number 2
Part Number 3
Kit being used
Kit delivered/waiting
Kit not delivered
Figure 41 - Simple Example of Visual Management
Table 13 - Original Excel Spreadsheet

Lean Kitting Marta Lupi
81
The horizon of visibility that the spreadsheet allows on the shop floor: the
document states the date when the PC prints the SOP, which is then delivered
to the store for kitting. This may happen in a variable amount of time, but
approximately a few days before the kit is delivered to the shop floor.
Therefore, the spreadsheet has the information about which kit will be
delivered (RED) only a few days before the event. A broader view would
require an additional spreadsheet compiled by the PC according to the
schedule and what has been released by design. It might be feasible with a
few man-hours, but at the same time is not likely to represent the reality.
The homogeneity of the data: there are some rows in the spreadsheet that are
not aligned with the linked field and this represents a problem when
programming the application. However, this is a solvable problem and there
are engineers working on this improvement that will be implemented before
the end of July.
Extension of the spreadsheet: the existing spreadsheet stores the information
from 2008 regarding all kinds of kit, without any distinctions. This is not what is
needed to allow a simple spreadsheet projected in the different clean rooms.
An idea to solve this issue is the introduction of filters in terms of time and
area. Indeed, each area can be uniquely identified with the PC field (each of
responsible for a specific product area) and the older data can be removed or
hidden (keep only data in a time frame of approx. a month)
To summarise, the colours change according to the state of the kit. When the kit is
used, the associated state changes and so the colour (Table 14). The default colour
is RED, according to the kit whose documentation has been printed, but not delivered
on the shop floor. Only the scan of the bar code on the kit will update the
spreadsheet. The first time is the PC than scans and it gets YELLOW; the second
time is the team leader. It can be projected on the screen at the entrance of the
clean rooms that are already placed.
How is the spreadsheet organised and look in reality?
Table 14 - Modified Spreadsheet

Lean Kitting Marta Lupi
82
For the implementation of this solution, as previously mentioned, an application is
required. Two options were evaluated:
Purchase the application;
In-house programming.
Because it was not possible to find a suitable package on the market that would allow
exactly the functionalities required, it was decided to chose the option of the in-house
programming and for this reason IT requirements have been prepared and shown in
Table 15.
IT Requirements
Who prepares it? The spreadsheet already exists and it is
stored in the system
When is it updated? Every time the documentation (SOP) for
a kit is released
Which data?
Project name and number, WO, Part
number, PC and date/time. 3 colours
(Red default, yellow and green following
the scan)
How will it be displayed? Shop floor at the entrance, projected on
the existing screen
When are the colours updated? Kit delivered to the shop floor (PC)
Kit picked for work (Team leader)
Table 15 – IT Requirements-Visual Management
Total investment required and financial benefits for the visual management systems
are described in Table 16.

Lean Kitting Marta Lupi
83
Visual Management: Cost / Benefit
Investment Required Financial Benefit
Scanner: According to the number of
team leaders and the size of the clean
rooms, approx. 2 scanners in each
clean room, cost: £100 or less/each =
£200 for each clean room, so for the 3
clean rooms considered= £600
Time saved searching
Approx. 20 minutes/week per operator
spent in searching and understanding
whether the kit is on the shop floor.
Every year: 20/60 *48 = 16 hours per
each operator. Considering almost 75
operators in the three clean rooms, the
annual time saved can be up to= 16*75=
1200 hours saved every year
Financial Savings: £50 * 1200h=
£60000
Programming: Approx. 1 week for one
person to write the code (more/less time
depending on the filters needed) 8 hours
/ day, £50 per hour, 1 employee =
£2000
TOT: £2600 TOT: £60000/year
Table 16- Visual Management: Cost/Benefit
Mix
Another problem that can be solved is the extra movement that is now caused by the
paper request for each specific mix created in the lab. This is considered a waste, as
the operator interrupts their productive work to request and collect the tool. It
happened during the analysis that almost 1 hour was required to have the mix ready,
as the lab was busy. Moreover, the operator spent about 10 minutes in total walking
from/to the shop floor twice and the rest of the time waiting. There are several
possible solutions for this issue:
To facilitate the communication and speed up the request, the phone could be
used, so that the operators communicate with the lab requesting a specific
mix. However, for traceability reasons, additional paper documentation is
required (maybe sent by fax or email) to keep track of the WO, project number

Lean Kitting Marta Lupi
84
etc, and being able to print the label. Therefore, it does not make too much
sense to implement this solution.
Instead of using paper, the computer may be used to establish the
communication with the lab. Emails may be the fastest way of communicating
between the shop floor and the lab, but the mailbox of the operator in the lab
should be always open and connected to the system, otherwise the response
may not be as fast as it should be. This is something that may be quickly
implemented. However, there is a constraint in terms of people, as not all of
them want or have access to the computer.
Another method that can be used to deal with the mix request involves the use
of an application that creates a window on the screen of the shop floor
computer, where the operators can write the “order” for the lab, introducing
information regarding:
o Type of mix required;
o Project number/name;
o Date/ time needed;
o Area requesting the mix (i.e. CPS).
This would allow sending a fast request to the lab without physically walking
there. The same issue for the implementation of this solution may be related to
the lack of computers on the shop floor, but this is the same issue that affects
the email system.
Considerations about the use of computers and re use of existing resources are
explained in Appendix III.
The IT requirements that would allow the realisation of this idea are shown in Table
17.

Lean Kitting Marta Lupi
85
IT Requirements
What? Create a window to be compiled by the
operator on the shop floor (Figure 41)
Who uses it? Operators send the request on the shop
floor and the lab receives the request
What does the lab sees?
Three possible types of messages:
Pop us window (fastest and
reduce errors) (Chosen Method
Figure 42)
Window to manually check
requests (it requires the operator in
the lab to constantly check if there
are open requests)
Text list of requests (not effective)
Table 17 – IT Requirements-Mix
Figure 42 shows what the operator is required to compile on the shop floor. On the
other hand, Figure 43 shows what would appear as a receipt to the lab.
Figure 42 – Window for the Mix Request- Shop Floor

Lean Kitting Marta Lupi
86
This represents the option of the pop-up window that appears on the screen on the
lab and it is auto-refreshing.
Total investment required and financial benefits for the mix are described in Table 18.
Mix: Cost / Benefit
Investment Required Financial Benefit
(Pop-up Window Option)
Programming: this depends on the
option chosen for message sent to the
lab. Indeed the first option is the most
complicated in terms of writing the code.
Approx. 25 hours needed = £1250
Training session and Implementation:
People would require a training session
for the explanation of the new system,
and at the same time the system can be
physically installed. Approx. 8 hours in
total= £400
Time saved walking
Approx.10 minutes saved for every
operator and every mix moving from/to
lab (Each mix associated to only one
operator). Assuming that on operator on
average may go to the lab 5 times (1 mix
each time) per week: 10/60 *5 *48= 40
hours a year spent for every mix.
Assuming that 1/3 of the operator request
mixes to the lab: 40* 75/3 = 1000 hours
saved every year.
Financial Savings: £50*1000h=£50000
TOT: £ 1650 TOT: £50000/year
Table 18 - MIX: Cost/Benefit
Figure 43 - Window for the Mix Request-Lab
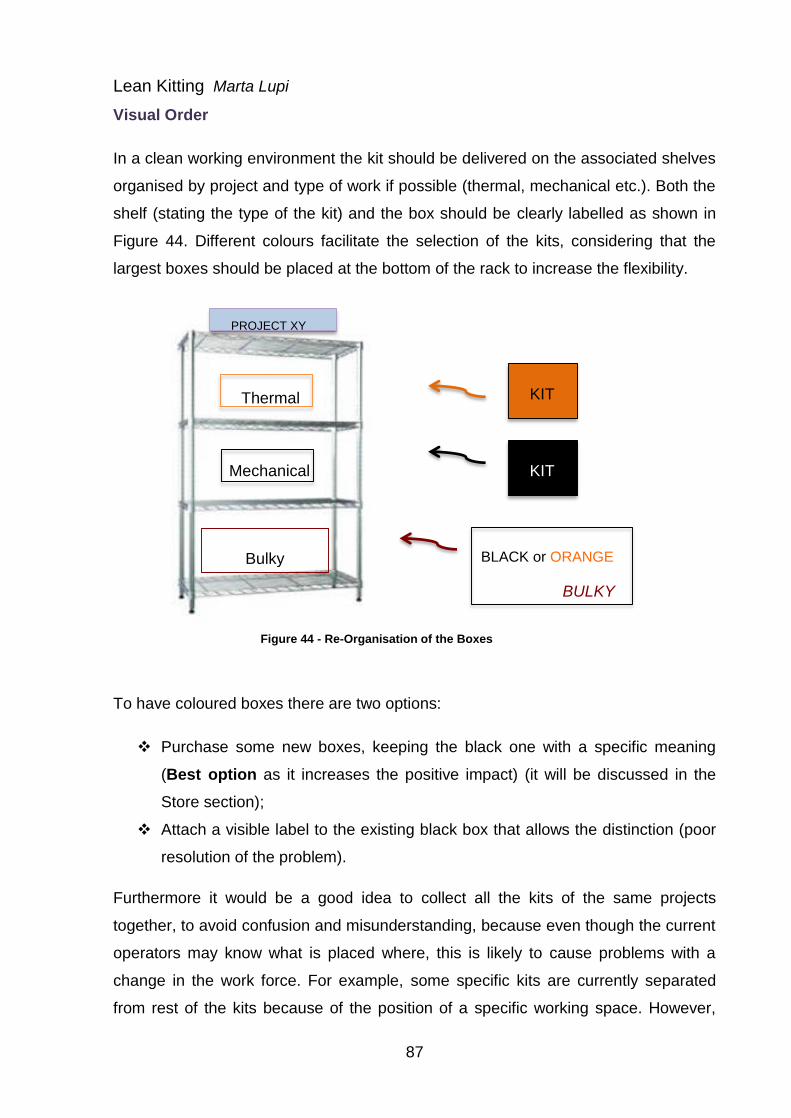
Lean Kitting Marta Lupi
87
Visual Order
In a clean working environment the kit should be delivered on the associated shelves
organised by project and type of work if possible (thermal, mechanical etc.). Both the
shelf (stating the type of the kit) and the box should be clearly labelled as shown in
Figure 44. Different colours facilitate the selection of the kits, considering that the
largest boxes should be placed at the bottom of the rack to increase the flexibility.
To have coloured boxes there are two options:
Purchase some new boxes, keeping the black one with a specific meaning
(Best option as it increases the positive impact) (it will be discussed in the
Store section);
Attach a visible label to the existing black box that allows the distinction (poor
resolution of the problem).
Furthermore it would be a good idea to collect all the kits of the same projects
together, to avoid confusion and misunderstanding, because even though the current
operators may know what is placed where, this is likely to cause problems with a
change in the work force. For example, some specific kits are currently separated
from rest of the kits because of the position of a specific working space. However,
Bulky
KIT
KIT
PROJECT XY
BULKY
BLACK or ORANGE
Thermal
Mechanical
Figure 44 - Re-Organisation of the Boxes
Lean Kitting Marta Lupi
88
this is not the best configuration. A change in the position of the whole rack may be
considered, to find a location that is almost equidistant to the several stations
involved in the same project. The production controller should be the one responsible
for the reorganisation of the boxes on the rack, with the the help of the team leader
and the operators that should contribute to keep the environent clean and tidy.
A key point of the visual order is the concept of 5S. This concept is fully explained in
section 2.1.2 and it is also mentioned on the shop floor, even though it could be
performed better. There are some features on the 5S that have already been
introduced on the shop floor (i.e. pictures showing the content of lockers), but the
general outcome can definitely be improved. The organisation should make sure that
everything that is placed on the shop floor is useful and used; otherwise it is a waste
of space and flexibility. Moreover, the boxes and the paperwork used is never placed
again in the same place, the operators may lose the SOP, wasting time searching
etc. This problem could be solved making the operator aware of the importance of
5S. The shop floor clean up is one of the key tasks included in the 5S (Tinoco, 2004)
and creates a specific place for everything as well, but this cannot be achieved
without the collaboration of the operators. The 5S practice should be applied urgently
and will help keeping the environment clean and safe. For example, it is common to
come across tools that have not been used for a period of time and will never be
used again, that are still kept on the shop floor amongst the other tools. This is
harmful for the organisation.
What may be required is additional training addressing the team leaders to improve
the awareness and new impressive posters to replace those already existing. Why
the team leaders? Because it is important from a lean point of view to increase the
awareness and the responsibilities of the front line, as the operators are essential for
the organisation. It is expected that giving more importance to the team leaders will
have a positive consequence on the operators on the shop floor as well (Drew at al.,
2011). The management is involved in the lean journey, but because in a TPS vision
all value-added activities start on the shop floor, the job of managers is to support the
team members (Convis, president of Toyota, Kentucky).
These posters shown in Figure 45 are only an example, but many can be used inside
and at the entrance of every clean room.

Lean Kitting Marta Lupi
89
Total investment required and financial benefits for the visual order are described in
Table 19.
Visual Order: Cost / Benefit
Investment Required Financial Benefit
Reorganise boxes on the rack: Approx.
2 man hours for each clean room=
£50*6= £300
Time saved searching
Estimated approx. 30 min saved every
week for each operator, assuming 48
weeks in a year = 24 h/ year per operator.
For the total number of operators: 24*
75=1800 hours every year saved.
Financial Savings: £50*1800=£90000
Posters: 2 in each clean room (1 before
the entrance and 1 at the entrance for
each clean room)= £15 each = £90
TOT: £390 TOT: £90000/year
Figure 45 - 5S Posters
Table 19 - Visual Order: Cost/Benefit

Lean Kitting Marta Lupi
90
Paperwork
SOP: in terms of paperwork, the SOP delivered with the kit should stay with the kit. It
is not necessary to purchase new racks or change the configuration of the physical
kit, but the SOP must be stored in the rack besides the kit and never being
separated. This is an important task given to the operator, as they are those picking
and moving the kit/paperwork. However, the label on the cover page and on the side
of the SOP should always be placed properly and also clearly state the colours of the
project and the type of kit, in addition to the existing colour of the project. A possible
suggestion is shown in Figure 46.
Furthermore, the PC could generate a clear shortage list to be placed in the SOP,
stating clearly what is missing in the kit, to avoid double-checking the kit on the shop
floor. Currently, there is a shortage list in the SOP, but this is not clear for the
employees, so at the end is not useful. Moreover, because the BOM creates a lot of
confusion, improvements should aim to increase the clarity. Indeed, the blank BOM
produced before the kitting is left in the SOP as a point of reference even after the
updated BOM with the batch numbers is produced. This confuses people on the shop
floor. The suggestion is to keep only the BOM completed by the store that contains
information regarding the kitted items, commodities etc. and remove the blank one
before delivering the SOP to the shop floor.
Resource scheduling: the up-to-date resource scheduling for the human resources
should be displayed on the shop floor for anyone to access and area manager is
responsible for this. This will help the operators first and as well as other people
interested, who will be aware of who is working on the shop floor and is in charge of
what project. If this is not available, it may be difficult to understand who is
responsible for what and may create a waste of time if someone is looking for a
specific operator.
Green: Project XY
Black: Mechanical Kit
Figure 46 - SOP Label

Lean Kitting Marta Lupi
91
Total investment required and financial benefits for the paperwork are described in
Table 20.
Paperwork: Cost / Benefit
Investment Required Benefit
Irrelevant
All the proposed changes aim to simplify
the work of the operators and increase
the level of awareness of the operators.
Indeed, reducing the level of confusion
on the shop floor, increasing the level of
understanding of the operator are
essential steps for a decrease in the time
wasted and possible mistakes.
Table 20 - Paperwork: Cost/Benefit
6.5.1.1.2 Store
The store has five carousels and the kit preparation area is likely to remain the same
because of manpower costs and space constraints, even though it would be better to
have the kit prepared closed to the assembly area, to save time in the delivery
(transport waste). Nevertheless, the space in the store is not a constraint and this
gives flexibility in the preparation. Though, a few changes can speed up the process
enormously. It happens that there are two plastic bags of the same items belonging
to different batches for traceability; however, they are not placed in a bigger plastic
that would still keep them divided, but together (see Figure 47). The implementation
of this simple idea will clearly facilitates the use of the kit, keeping the traceability
(Hanson, 2012), without involving high costs (existing bigger plastic bags could be
used).
G0000001
BAG 1
BATCH 01
BAG 2
BATCH 02
Figure 47 - Additional Bags

Lean Kitting Marta Lupi
92
This is related to the organisation of a single item, but what about the overall order
within the kit?
The current kit is prepared without logic to place the items, but a segmented box
could save the time of the operators (Dudley, 2005). The segments should be
removal to allow even more flexibility. There are a few ways according to which the
kit can be organised:
BOM item number (simple example shown in Figure 48);
Type of part (nuts, bolts, washers etc.).
Each operator would be happy to have the kit organised differently, however what is
essential is to define a common logic. The main investment would involve the
purchase of new coloured boxes with removable segments that are supposed to be
used according to the needs of the specific kit. Old black boxes can still be used with
the new segments purchased.
The purchase of new coloured segmented boxed involves also the shop floor,
indeed the final aim is to facilitate the shop floor.
To facilitate the communication between the PC and the store, an automatic
message could be sent to the PC once the kit is ready, to speed up the process and
avoid the waiting time of the kit. This may help the understanding and avoid
communication issues. It is also extremely important that the PC check the
spreadsheet that reports whether the kit is ready or not.
Figure 48 - Segmented Boxes
It 01-15 It 20-35 It 40-55
Segment
Range of items

Lean Kitting Marta Lupi
93
Total investment required and financial benefits for the store are described in Table
21.
ST Store Changes: Cost / Benefit
Investment Required Financial Benefit
New coloured boxes and removable
segments: In a project there are about
1100 boxes to be used, but not all of
them are required to be used together
at the same time. Every year there are
about 3/4 projects, so in total 4400
boxes. In the worst case all of them will
be purchased brand new, but from the
same vendor, so a discount on the
quantity it is expected: £5 on average
different sizes. For about 1100 boxes
purchased: £1100*£5= £5500 (reuse of
some old boxes is expected)
Time saved in checking the kit
Approx. 5 minutes saved on checking
and opening every kit, for an individual
operator, so considering the total number
of SOP in a project (1100)= 5*1100=
5500 min/60= 92 hours for project.
Considering 4 projects on average every
year, the annual time saved is: 92 *4=
368 hours per year saved.
Financial Savings: £ 50*368h= £18400
TOT: £ 5500 TOT: £18400/year
Table 21 – ST Store Changes: Cost/ Benefit
6.5.1.1.3 Production Controller
Walking distances are considered a problem, so the PC should put together several
SOP to request the kits, when going to the store, to reduce time wasted. This is not
always possible as it is related to the workload of the PC. However, to be closer to
the problems and address them immediately, the PC may be relocated on the shop
floor. This already happens in the panel area, so this may work and facilitate the
operations in other areas as well. This would avoid the need for extra walking
between the shop floor and the mezzanine floor and a more direct contact between
the areas. Moreover, the operators appreciate the management presence on the
shop floor, but only if they see that we are there to help them doing their jobs
(Convis, president of Toyota, Kentucky). Furthermore, the PC should be encouraged

Lean Kitting Marta Lupi
94
to use the spreadsheet created by the store to evaluate which kits are ready, to
reduce the need of walking to the store. Total investment required and financial
benefits for the PC changes are described in Table 22.
ST PC Relocation: Cost / Benefit
Investment Required Financial Benefit
Relocation: Clean the area and find a
suitable place. Then reorganise the
physical resources to allow the PC to
operate close to the clean room area,
that would take a few man hours: about
16 hours work (only CPS that needs
this) £50*16= £800
Time saved walking
About 1/3 of the time spent in movement
(refer to the analysis Table 10) can be
considered saved for each PC, so
approx. 4 minutes for each SOP and PC.
4/60*1100=73h saved for each project.
Considering 4 projects on average every
year: 73*4=292h per year saved.
Financial Savings: £50*292h=£14600
TOT: £800 TOT: £14600/year
Table 22 – ST PC Relocation: Cost/Benefit
Suggestion for the ME: the family tree showing the relationship between the part
numbers is available when it has been released by design. It is important that
whether the ME feels the need for the family tree, it is made available on the system.
A summary of all the changes described in this section has been prepared and
illustrated in Table 24 and the total savings are calculated with the following formula:
𝐴𝑣𝑁𝑢𝑚𝑂𝑝 ∗ 𝑆𝑎𝑣𝑂𝑝 + 𝐴𝑣𝑁𝑢𝑚𝑃𝑟𝑜𝑗 ∗ 𝑆𝑎𝑣𝑃𝑟𝑜𝑗
AvNumOp: average number of operators working in the three clean rooms
(Andromeda, Leo and Perseus) (75) / SavOP: estimated savings for each operator (if
applicable) (Table 18) / AvNumProj: average number of project every year (3,5) /
SavProj: estimated savings for each project (if applicable) (Table 23)
Equation 2- Savings Formula
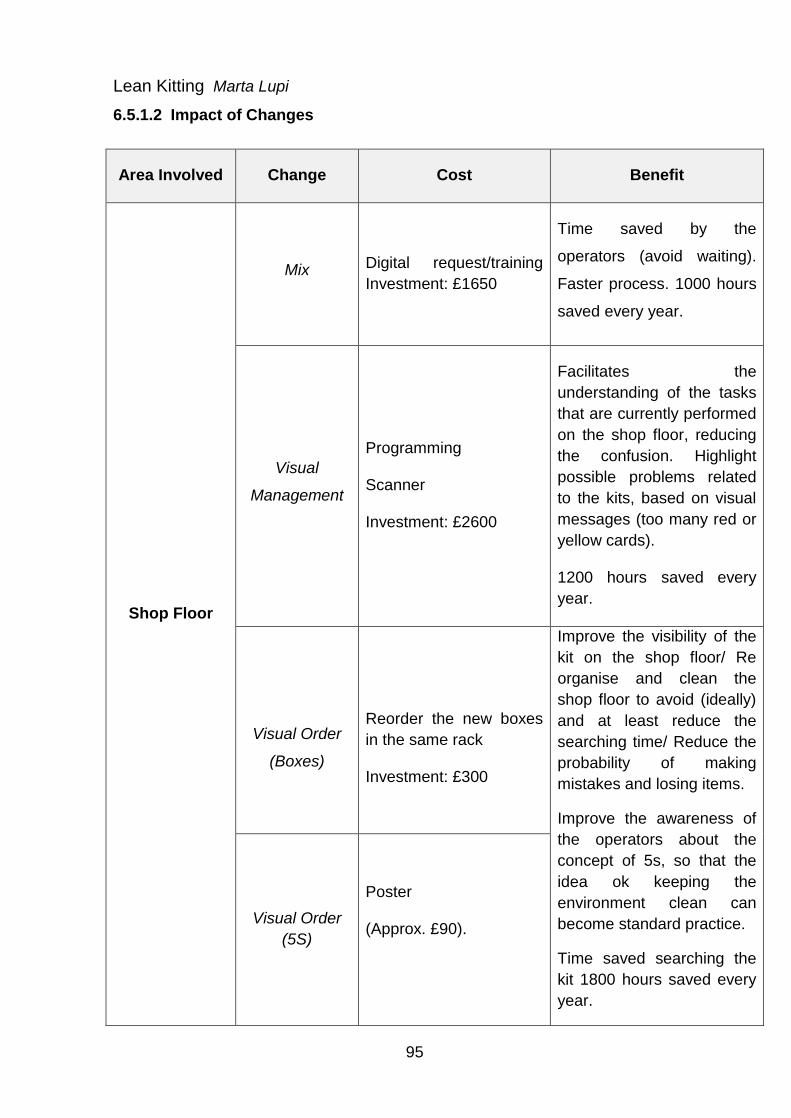
Lean Kitting Marta Lupi
95
6.5.1.2 Impact of Changes
Area Involved Change Cost Benefit
Shop Floor
Mix Digital request/training
Investment: £1650
Time saved by the
operators (avoid waiting).
Faster process. 1000 hours
saved every year.
Visual
Management
Programming
Scanner
Investment: £2600
Facilitates the
understanding of the tasks
that are currently performed
on the shop floor, reducing
the confusion. Highlight
possible problems related
to the kits, based on visual
messages (too many red or
yellow cards).
1200 hours saved every
year.
Visual Order
(Boxes)
Reorder the new boxes
in the same rack
Investment: £300
Improve the visibility of the
kit on the shop floor/ Re
organise and clean the
shop floor to avoid (ideally)
and at least reduce the
searching time/ Reduce the
probability of making
mistakes and losing items.
Improve the awareness of
the operators about the
concept of 5s, so that the
idea ok keeping the
environment clean can
become standard practice.
Time saved searching the
kit 1800 hours saved every
year.
Visual Order
(5S)
Poster
(Approx. £90).

Lean Kitting Marta Lupi
96
Shop Floor
Paperwork
SOP
Irrelevant
Increase the responsibility
of the operators.
Contributes to a clean
working environment, with
reduction of mistakes and
time spent searching.
Resource Scheduling
Irrelevant
Increase the visibility and
clarity on the shop floor.
Store
New
Segmented/
Coloured
Boxes
Investment: £5500
Kit clear and organised,
less time spent checking
the kit.
368 hours per years saved.
Additional
Bags
Irrelevant
Kit clear and organised.
PC Relocation
Reorganisation of the
working place
Investment: £800
Act promptly when
problems arise. Save time
walking from/to shop floor.
292 hours per year saved.
TOTAL Investment
(£)
£10940 -
Savings
(hours/year)
- 4660
Savings
(£/year)
- £233000
Table 23 - ST Suggested Changes

Lean Kitting Marta Lupi
97
6.5.2 Medium Term (MT) Implementation Plan
With the short-term proposed solution, the aim was to establish a cleaner working
environment and a clearer organisation of the shop floor. The main target set was to
educate the operators to eliminate the most visible wastes directly on the front line.
Nevertheless, changes upstream in the process are necessary to improve the kitting
process and these will bring a change in the shop floor as a consequence. Some
changes have already been suggested and other ideas will be proposed in this
section. The main idea for the medium term is to create a digital system that allows a
connection between the kit and the computer on the shop floor, to reduce paperwork
and the problems connected. This is supposed to be implemented before the
introduction in the company of the new electronic system called IPS (INTEGRATED
PRODUCTION SYSTEM) that will bring a change in the way the WI are written and
delivered to the shop floor, in addition to a change in the way the whole process is
controlled. The digital system proposed by the research is considered an opportunity
to add complementary functionalities to the new electronic system. The timeframe of
the MT considered in this context goes from roughly 1 month to 6 months. The
changes are described with the bottom-up approach, considering the organisational
levels. What has been stated for the ST regarding the commitment of the whole
company and the collaboration of all the organisational levels in every change is still
valid.
6.5.2.1 Suggested Improvements
6.5.2.1.1 Shop floor
Collaboration with Design: ideally, as previously discussed, the communication
and the engagement of the team leaders in the design is vital (Design for
Manufacturing). It has been stated that this cannot be done for every single job, but
the recommendation regards a possible study about the more critical job that caused
or are likely to cause the major number of issues on the shop floor. This study can be
considered as a good starting point for the decision about which job to be supported
by the shop floor. Indeed, the collaboration could be strictly focused on those jobs to
prevent possible mistakes from happening.

Lean Kitting Marta Lupi
98
SOP: the paperwork is a source of concern, but a change in the way the WI is written
will be introduced with the implementation of the previously mentioned electronic
system (IPS). However, to facilitate the shift from paper to digital while finalising the
introduction of that system and address many of the issues associated to paperwork,
it is considered beneficial to provide the WI and the related appendices (App.)
digitally to the shop floor, so that the employee can access the information directly on
the computer. The whole digital process, including the changes already suggested in
the short term, is described in Figure 49.
Process flow
Aspects to consider for the implementation of the digital system:
Training: operators are not used to work digitally, and this is an aspect that should
not be underestimated. Indeed, a change management programme is required when
introducing a change in the system that affects the way people work.
Creation of the application: there is the need for internal programming to write the
code for the application to would link the kit to the system to find the correct WI (that
corresponds to that specific part number of the WO). It is expected to require less
than a week of work (40 hours).
Figure 49 - Digital Process Flow
Compile App. digitally
Print Bar Code on Kit
Scan Bar Code
Access WI and App. on the
computer
Update Spreadsheet

Lean Kitting Marta Lupi
99
Accessibility of the documents: the WI is created with a .doc template, but this is not
the best way to deliver the WI, as it does not stop unauthorised people from
modifying them. Therefore, .PDF may be used as the format to keep the WI safe
from modifications.
Documents electronically compiled: the appendices are created to allow the
completion of essential technical data. However, a digital signature may replace the
physical stamp, to keep the same traceability of the person in charge.
Total investment required and financial benefits for the MT shop floor changes are
described in Table 24.
MT Digital System: Cost / Benefit
Investment Required Financial Benefit
Programming: Approx. 1 week of
work= £50* 40= £2000
Training session and Implementation:
Estimated a working day (8 hours):
approx. £400 for the organisation
Computers: Evaluate the need for
additional computers. For the moment
with the relocation of resources the shop
floor can be covered (Appendix III)
Paper: Printed paper (assuming
£0.10/page, there are on average 100
pages in a SOP, so it costs about £10 to
print the A4 pages and A3 drawings. This
figure is to be multiplied by the number of
SOP produced: £10*1100= £11000
saved per each project. Considering 4
projects on average every year, the
annual savings are: £11000*4=
£44000/year saved.
Extra Movement: Time saved for the
delivery of the SOP to the store and the
way back and to the printer, Approx. 5
minutes for each SOP = 5/60*1100= 92
hours/project. Considering 4 projects on
average every year: 92*4= 368h/y saved
Financial Savings: £50* 368h= £18400
TOT: £2400 TOT: £62400/year
Table 24 - MT Digital System: Cost/Benefit

Lean Kitting Marta Lupi
100
Consumables: finding a way to place consumables on the shop floor is not easy
because of the strict constraints of the company. However, not all the areas are using
the same “kanban” method to facilitate the replenishment from the store. Moreover,
there are “kanban” shelves that are currently not used in one of the clean rooms. This
happens because people working in the area are reluctant to the idea of introducing
“kanban” and they always tend to have more stock on the shop floor. Furthermore,
the operators complain about the fact that the material manager does no understand
the need for the material on the shop floor. To solve part of these issues, regular
meetings between the shop floor and the material manager should be organised to
have a more frequent exchange of ideas and improve the current state.
6.5.2.1.2 Store and Production Controller
The introduction of the label comparators is a good poka-yoke solution to prevent
mistakes from happening and the operators should be encouraged to use them.
Moreover, the store men are conscious of the fact that the manager records the use
of the comparator, so this is an incentive for the use. This is something that should
continue over time.
Another aspect to stress is the communication. Currently, the PC delivers the SOP to
the store and that triggers the preparation of the kit. The concept of digital
communication brings significant changes in the way the paperwork is sent amongst
the relevant teams: digitally. Therefore, only the BOM may be necessary to be sent
to the store, to allow the preparation of the kit.
What is really important on the PC side is that the kit is requested when actually
needed and this requires the close collaboration with the scheduling and the project
managers. Meetings (as previously suggested), shared spreadsheet, scheduling
visibility and regular communication upstream (ME, design team, materials) will
definitely help the process understanding and reducing the amount of time wasted.
Even though an increase in the frequency of meeting has been also suggested for
the short term, the whole change is more behavioural than just organisational.
Indeed, there are many people involved, some of them may be more reluctant than
others and the whole process would require time to get to the steady state.

Lean Kitting Marta Lupi
101
6.5.2.1.3 Area Manager
It is a good idea to provide a desk on the shop floor for the area manager as well
following the proposal that has been made for the PC in the ST plan. This would
allow a faster communication and speed up the problem-solving process. This
solution is already in place in some areas, but not in all of them (such as the CPS,
which should be the first considered).
Total investment required and financial benefits for the area manager changes are
described in Table 25.
MT Area Manager Relocation: Cost / Benefit
Investment Required Financial Benefit
Relocation: The investment required
has been calculated in section 6.5.2.1.3,
but in this case only half of the
investment is assumed applicable, as
there is only one area manager
compared to at least 2 production
controllers: Cost: £400 (considering the
area the extremely needs it: CPS).
Time spent walking
Considering that the area manager visits
the shop floor on average 5 times per
day and it takes about 6 minutes to go
and come back to the desk and wear the
required equipment, a relocation would
save almost 30 minutes per day. In total,
every year the time that can be saved,
only for CPS is: 0,5*240= 120 hours per
year saved.
Financial Savings: £50*120=£6000
TOT: £400 TOT: £6000/year
Table 25 - MT Area Manager Relocation: Cost/ Benefit

Lean Kitting Marta Lupi
102
6.5.2.1.4 Manufacturing Engineer
Communication is an issue within the company, so increasing the exchange of
opinions between the shop floor and the engineering level is a good starting point to
bring engineers and operators to a common level of understanding. It has already
been explained that this is considered a MT action not because of the physical task,
but because of the behavioural change required.
The operator often complaints about the lack of documented changes in the WI, but
at the same time the existing sheet “ Incidents and Observations” in the SOP is rarely
filled in. The lack of feedback is not going to be addressed with a shift to a digital
documentation. Therefore, the operators should be encouraged to report problems
and issues upstream, to facilitate the common understanding and work together to
find a trade off. Regular meetings may be organised between team leaders, ME and
area managers to keep all the areas updated. In fact, the team leaders allow a good
connection between the store and the engineers and discussion about how a WI
should be written before the actual creation would be a great achievement. In the
ideal solution a continuous exchange of ideas is suggested, but in a more realistic
environment more engagement may be required when dealing with the most critical
jobs, which may create more issues on the shop floor.
6.5.2.1.5 Scheduling
It is difficult to generalise about the problems related to the scheduling, as for
example the CPS and the Panel areas work in a complete different way as explained
in section 5.7. A good idea would be to adopt in the CPS the same method used by
the panels. Considering more meetings between the PC, area manager and the
scheduling team to increase the communication and the understanding may be the
first step to solve part of the issues. Nevertheless, one of the main concerns that still
keep the areas separated from each other is the lack of communication between P6
and SAP. The potential connection is a field where future studies can find a proper
solution.

Lean Kitting Marta Lupi
103
6.5.2.1.6 Management
What may help the atmosphere of the whole working environment is the introduction
of a “Box for ideas”. The idea is to encourage all the employees to give feedback, as
people are the main source of new ideas. This could be organised placing boxes in
the common areas or using on the intranet of the company. It could help overcoming
the frustration of the employees and it is based on the fact that the employees can
generate the most brilliant ideas. These should be seriously taken into consideration.
It can facilitate the relationships inside the company, but it will be completely useless
or counterproductive if people realise that nothing is going to change. It is correct to
consider this step as an approach for continuous improvement that will benefit the
company enormously.

Lean Kitting Marta Lupi
104
6.5.2.2 Impact of Changes
Area Involved Change Cost Benefit
Shop Floor Digital System
Relocation
Computers
Programming
Training Session
Investment: £2400
Faster communication
and part of the paperwork
issues solved.
Printed-paper £44000
saved every year.
Time of the PC walking
368 hours saved every
year.
Store and PC
Use spreadsheet
Send automatic
message when kit
ready
Irrelevant
Increased communication
and awareness and void
time wasted walking.
Area Manager Relocation Investment: £400
Improved communication.
Time saved walking 120
hours/year.
ME Exchange of ideas Irrelevant Improved communication.
Scheduling
Additional
Meetings
Irrelevant
Increase in the
communication and
understanding. Better
planning process.
Management Box for ideas Irrelevant Improved communication.
TOTAL Investment £2800 -
Savings
(hours/year)
488
Savings (£/year) - £68400
Table 26 - MT Suggested Changes

Lean Kitting Marta Lupi
105
6.6 General Method
The objective stated prior to the beginning of the research was related to the creation
of an overall methodology to find a solution for the most common kitting issues, that
companies like Airbus D&S may experience. Indeed, other companies may have
issues in common with the case study or completely different problems, but the
methodology created can help each individual case study finding the right solution for
each specific issue.
The steps that have been included in the overall methodology regarding the creation
of a generic solution plan, in addition to the steps developed for the process analysis
(section 5.10), are:
Identification of the industrial best practices for the specific process, if any;
Definition and understanding of the requirements for the process resulting
from the literature research and the identification of the problems that are
likely to happen in the whole kitting process, derived from the problem
analysis (include the best practices in the requirements, if possible);
Evaluation of possible constraints (if any) that would not allow the application
of the best practices or the requirements; define if these constraints will still
exist in a future period of time;
Evaluation of the ideal state of the process, considering also a future state
related to the implementation of radical changes and modifications in the
business model;
Identification of the framework for the so-called realistic solution. It means
understanding what can be done in practice to improve the actual state of the
process, based on a GAP ANALYSIS (AS IS vs. TO BE) following the
requirements defined. If possible, organise the implementation plan according
to a feasible timeframe (i.e. Short term and Medium Term). Involve the people
responsible of the area addressed by the change to understand the needs, the
impact of the proposed change and more important evaluate the feasibility of
the idea.
Lean Kitting Marta Lupi
106
NB: a programme of change management should always be organised when some
changes are expected to take place, to prepare the employees and give them the
right “tools” to manage the change.
7 Discussion
Kitting is a process used by different types of companies and it is described in
literature as one of the existing method to deliver the necessary items to the
assembly area. It has been highlighted that there are many pros and cons associated
to that process. On the positive side, the kitting can save time in handling the items
and assure a higher level of quality for the assembly process, giving flexibility to the
company. On the other side, some drawbacks can affect the process, slowing down
the shop floor if items in the kit are missing or defective components are introduced
in the physical box etc. Also, there are many organisational levels involved in the
process and this increases the level of complexity to be managed. Lean
manufacturing can be the key to allow the process flow and assure that the possible
wastes identified are removed from the process.
In this context, the concept of lean kitting, which is central to this research, was
developed. This research contributed to the discussion about lean kitting presenting
two contrary points of view of lean kitting. The former regards the two industrial case
studies that completely removed the kitting process and the store, while the latter is
supported by the description of specific requirements and an ideal lean kitting
process were all the wastes identified have been removed. The literature does not
clearly label what a lean kitting process is and it may be argued that one solution is
leaner that another. The debate about the real meaning of lean kitting can still be
considered open and for this reason, there is still space for additional research on
this topic.
Nevertheless, the company case study used in the research context has been
extremely helpful as it allowed the understanding of the process, the study of the
issues in the process and the validation of the ideas generated for the solution.
What has been extremely value adding regards the sources of information and the
approach taken. Indeed, all the relevant areas have been included in the research for

Lean Kitting Marta Lupi
107
potential wastes, starting at the bottom of the process with the operators and then
moving forward to the managerial level (bottom-up approach).
The main issues experienced by the case study confirmed that the predominant
drawbacks of the process recognised by the literature and described in the State of
the Art really exist. Therefore, it is believed that even other companies, especially
working in the same environment as Airbus D&S (low-volume/high-variety), can find
themselves in the same situation. However, there are other issues, so-called
company specific that cannot be found in literature as specifically linked to the
working environment considered, which have been highlighted for the first time by
this research (i.e. the mix problem).
Generally, missing items in the kit, paperwork not clear, cumulative process delays
and lack of communication between the areas are the problems experienced. The
main question, which drove the problem identification, was “Is this really necessary?”
When the answer was no, it meant that something could have been done better. It is
not important to blame one part, but what is important is the identification of the
problem source. In fact, it is helpful in the way it allows the understanding of the big
picture and the identification of the most effective and efficient solution for the issues.
Though, it is not the specific solution for the problem that matters. Indeed, what it is
more valuable is the whole methodology behind, which drives the process analysis
and the consequent identification of the right solution. It reflects the steps that have
been followed with the case study and includes the key steps developed for the
generic process analysis (section 5.10) and problem solution (section 6.6). This can
be considered the most valuable rese arch outcome, as it can really help other
companies working in different environments dealing with their kitting processes.
The initial creation of the framework for the ideal kitting process, which triggered the
more realistic solution plan based on industrial constraints, has been an essential
step. Indeed, it is important to understand what the TO BE state may look in the
future because this helps broadening the horizon of the company and gives an
incentive to look forward. However, it is also necessary to give a realistic answer to
the existing needs and address those problems that are negatively affecting the
working place and the process in general. In this framework, some ideas have been

Lean Kitting Marta Lupi
108
recognised as reasonably easy and fast to apply, while others would require more
time to fit a real working environment.
For instance, visual management, shop floor cleanliness and increase in the
communication have been considered priorities to address the existing problems,
according to literature researches and the participation of the case study to the
research project. Simple changes, such as the introduction of colours or light to
increase the visibility and the awareness on the shop floor can make the difference in
a workplace where there are many people sharing the same space. Moreover, IT has
been recognised as a valuable tool to translates ideas into reality, but it can also be
an obstacle if not designed correctly. Indeed, electronic systems that are not
integrated can become a source of waste and inefficiencies. All the ideas that have
been suggested are associated to an investment required and a tangible/intangible
benefit, which have been estimated in to allow a direct comparison. As a result, it is
noticeable that even with a limited investment required, major savings can be
achieved (even thousands of pounds every year). Savings have been expressed
mainly in terms of time and translated when possible in financial terms.
Regardless of the proposed solution, what a generic company must not lack are the
commitment and the communication. At every organisational level there should be
people working to reach a specific objectives included in the bigger picture, which is
the company objective. The isolation is not a positive attitude and it is important to
avoid the idea of throwing the piece of work over the wall. This is summarised by the
concepts design for manufacturing and concurrent engineering. Recognising the
existence of the lack of communication is the first step toward the problem solution
and this is exactly what it is happening in the case company. As many of the issues
are related to the lack of communication between design and manufacturing, the
management is realising how important is the engagement of these areas at an
earlier stage. However, this requires not only an organisational change, but also a
change in the company’s business model and that the level of commitment of all the
areas is extremely high. The proposed implementation plan has taken this issue into
consideration, conscious of the fact that concurrent engineering is not only a nice
expression, but also a philosophy that can highly help companies.

Lean Kitting Marta Lupi
109
The commitment of the management is essential, and so those of the operators. The
most common statement throughout the company is: “It has always been like this” or
“Changes do no stay”. This describes the feeling of the employees, but it does not
have to be used as an excuse to avoid future changes. Change management is the
key for the change in every case and the size of the programme may vary a lot
according to the change plan and the size of the organisation.
The main key findings of this research are summarised in the Table 27 and 28 and
are organised according to the academic research and the Airbus D&S case study.
Table 27 - Key Findings- Academic Research
Airbus D&S Case Study
The company is now aware of their main
issues
The company understands that there are
many issues that have never been
solved because of people inactivity
Design and manufacturing should work
closely together and the commitment of
the top management is essential
The shop floor cleanness should
become a priority for the company,
applying the proposed ideas (i.e. visual
management etc.)
Academic Research
The debate about the lean kitting
concept is still open
The best practices identified are a
starting point for reflection about future
radical changes in similar companies
The main issues identified reflect the
drawbacks described in literature, but
there are other company-specific
issues that cannot be found in literature
The methodology created can help
other companies to identify and
address their kitting issues
Table 28 - Key Findings - Case Study

Lean Kitting Marta Lupi
110
8 Conclusions and Recommendations
This research focused the attention on the gap created by the literature about the
low-volume/high-variety environment and proposed a methodology to identify and
address the main issues of the kitting process. It contributed to the understanding of
the kitting framework and the ideal state of the process, considering the application of
the lean concepts, which have always been applied to an opposite type of
environment. The research involved the use of a company case study to gain deeper
understanding of the process and assure the availability of valuable and meaningful
data.
8.1 Final Methodology
All the objectives that had been defined for the research have been achieved.
Nevertheless, the biggest achievement of the research is the creation of a generic
methodology for the analysis and improvement of the kitting process. It was
developed through the use of a case study (Airbus D&S), but it is also applicable in
other working environments, and other companies can benefit from this.
The methodology created to address the issues of the kitting process is built above
the study of State of the Art and the identification of potential industrial best practices
to create an ideal guideline to follow for the kitting process. Indeed, the literature
review may not be exhaustive to build the big picture. Mapping the process in order
to understand how it is performed in the specific environment is the first essential
step. In fact, it allows the identification of the relevant areas to take into consideration
for the analysis. After that, the step of the multi-level data collection (and subsequent
prioritisation of the problem) with a bottom-up approach and the problem
identifications (together with the previous knowledge gathered) allows the definition
of the requirements for the generic kitting process. The purpose of this is the creation
of an additional guideline for the proposed solutions. As the methodology aims to
include both an ideal and a realistic solution, the consequent evaluation of the
company-specific constraint is important to be aware of what can or cannot be done.
It helps in tracing the line and defining the boundaries between the two proposed
solution plans. It is recommended to organise the realistic solutions according to a
time frame, as it simplifies the improvement plan. Last but not least comes the

Lean Kitting Marta Lupi
111
identification of future work that can be done in the company, as an incentive to
always move forward. The whole methodology has been validated through the use of
interviews, conversations with the management of the case study, observations and
literature analysis.
The diagram shown in Figure 50 represents the overall final methodology.
Figure 50 - Overall Final Methodology
State of the Art/Identifica
tion of Industrial
Best Practices
Process mapping/ Relevant
Areas Identification
Multi level data
collection/ Issues
Prioritisation
Requirements
Definition
Constraints
Evaluation
Realistic/Ideal
Solutions
Future Steps

Lean Kitting Marta Lupi
112
8.2 Project Value
This research has created value for both the academic and the case company side.
Indeed, it handled a research problem, using a real industrial company as part of the
research methodology, as this was considered the best choice to collect data and
validate the methodology developed.
On the academic side, the research contributed to the debate the and interpretation
of the lean kitting concept, presenting two contrasting views: the first related to the
idea that the kitting process is considered a waste and the second that shows an
ideal state for the process without all the waste identifies. The former is supported by
two industrial case studies used as best practices, while the latter is based on the
definition of kitting requirements, coming from literature and the case study problem
analysis. Furthermore, the research successfully contributed to the understanding of
the kitting process framework, especially in terms of relevant areas involved and the
common relationship between them. Moreover, an essential step that fulfils the
objectives set for the project is the creation of the methodology fully explained in
section 8.1, which aims to evaluate and solve all the potential wastes.
From the case study point of view, the research gave the company an objective
overview of the problems/wastes which are slowing the whole process down and
which areas may be more responsible for the inefficiencies. Moreover, a realistic
implementation plan organised according to different timeframes has been created to
suggest ways of improving the existing issues. This contributed to generating
knowledge and understanding in the company that may then decide to implement all
or part of the ideas generated. Moreover, the ideal solution created can be
considered as good starting point for reflections about future radical changes that
would completely change the way the company works.
Based on the achievements of the research, there are some recommendations for
future studies on both the academic side and the case study that are presented in the
following section.

Lean Kitting Marta Lupi
113
8.3 Suggestion For Further Analysis
8.3.1 Academic Research
There is still space for additional academic research, as previously mentioned,
especially in three main areas: industrial best practices, lean kitting concept and root
causes.
Industrial best practices: the two case studies have been presented and labelled
as best practices, because of what lean manufacturing thinks about the general
kitting process. It has been meaningful to present them because the two companies
are operating in the specific type of environment where the literature does not pay
attention to the best practices. What I would suggest is to focus the attention on
further researches about best practices, taking into consideration, if possible, other
industrial case studies that would allow a deeper analysis and comparison with the
cases presented above. Indeed, what is missing in literature is the description of the
best practices for the kitting process that would allow the proper definition of the
kitting requirements. Indeed the elimination of kitting is an ultimate solution that does
not advice about how to improve the current state of the process. This is the starting
point for the research of the best practices, paying specific attention to the kitting
process in a low-volume/high-variety environment. This would be of help to provide
ideal guidelines for companies to follow. Furthermore, it would be good to have
additional industrial case studies for the high-volume/low-variety environment to
complement those that can be found in literature, to evaluate even more deeply the
similarities and the differences in the generic kitting process.
Lean kitting: the research, as previously mentioned, contributed to increasing the
understanding around the meaning of lean kitting, and a significant step has been
represented by the presentation of the two case studies that removed the kitting
process. Also the proposal of an ideal state for the kit where all the issues had been
removed from the process has been significant.
Researchers could argue that one option is leaner than the other (the kitting removal
for instance). This states the need for further research to investigate the real meaning
of lean kitting. The identification of additional case studies from industry, which has
been mentioned before, is the key point for the further understanding regarding the

Lean Kitting Marta Lupi
114
lean kitting process; indeed it would be possible to evaluate whether eliminating the
kit is a good practice or whether there are some drawbacks that have not been
considered or properly highlighted in the two case studies.
Therefore, the next step would be the investigation and the creation of a unique
definition of lean kitting, so that misunderstanding and further discussions can be
avoided. This aims to create the common knowledge of this topic that is partially
missing at this point in time only with the case studies currently available for
consultation. This is the direction to move forward in the research.
Root Causes: creating the Fishbone Diagram was an essential step for the
research. However, it was not possible to progress further and get to the root cause
of each problem because there were some areas that were not included in the scope
of the research. For this reason, it has been highlighted that there is still space for a
deep research about the root causes of the issues previously identified. The
suggestion is to broad the analysis that has been done in this research, removing the
boundaries that stopped the research initially and move forward.
8.3.2 Industrial Case Study
Additional recommendations can follow this research on the waste identification and
proposed solution. Indeed it was possible to highlight the areas that requires
additional studies, by talking to the relevant areas involved, which is thought to be
beneficial for the future of Airbus D&S. All the following topics have been discussed
and highlighted in the main body of the research; some of them have been
introduced in the ideal solution.
The main areas to be addressed are:
Collaboration shop floor/ME: a closer collaboration could be established for the
most critical jobs, as previously mentioned. This requires a study regarding the most
critical jobs, to identify the most suitable.
Consumables: this is considered a critical topic by the operators, team leaders and
the production controller, as there are many quality constraints and opposite needs

Lean Kitting Marta Lupi
115
involved in this area. The suggestion is to keep looking for new items to be
introduced on the shop floor, to facilitate the operators and reduce the amount of
items to be kitted, reducing the probability of making mistakes.
Design: as design has not been considered part of the research scope, it would be
beneficial to compare the ideas generated with the existing constraints on that side,
to be able to address the whole picture.
Mix: the idea of removing the lab has been introduced as well as the need for the
analysis of the possible production of the mix on the shop floor.
Outsourcing: according to what has been presented in the ideal state of the kitting
and the industrial best practices, the idea for a potential outsourcing of the process or
at least of the most critical jobs should be taken into consideration. This is the
starting point for additional studies.
SAP/P6: the ideal state includes having the information systems communication with
each other. However, this is not happening. Since there will be another electronic
system introduced shortly (IPS) that will talk to both SAP and P6, the suggestion is to
evaluate how all the systems talk to each other first (Figure 51).
IPS
SAP
P6
Possible Link
Figure 51 - Potential Connection P6/SAP

Lean Kitting Marta Lupi
116
9 References
Alcorta, L. (2011), The Global Financial Crisis and the Developing World: Impact
on and Implications for the Manufacturing Sector, United Nations Industrial
Development Organization.
Anonymous (1997), Parts kitting trays optimize assembly process, Modern
Material Handling, vol. 52 no. 11 pp. 63.
Applied Industrial Technologies (2014), Kitting Can Optimize Inventory
Management and Performance, available at: www.applied.com. last accessed July
2014.
Baudin, M. (2004), Lean Logistics: The Nuts and Bolts of delivering Materials and
Goods, Productivity Press, NY.
Bicheno, J. and Holweg, M. (2009), The Lean Toolbox. 4th ed. Buckingham,
England: Picsie Books.
Boothroyd G. and Dewhurst P., Inc. (1989) Marcell Dekker, Inc. (1994), Product
Design for Manufacture and Assembly.
Bozer, A. and McGinnis, F. (1992), Kitting versus line stocking: A conceptual
framework and a descriptive model, International Journal of Production Economics,
vol. 28 pp. 1-19.
Brynzer,H. and Johansson, M. (1995), Design and performance of kitting and
order picking systems, Int. J. Production Economics, vol. 41 pp. 115-125.
Cardiff University, available at: http://www.cardiff.ac.uk/lean/about/index.html last
accessed July 2014.
Corakci, M. (2008), An Evaluation of Kitting Systems in Lean Production,
University of Boras, School of Engineering.
Chapman, A. (2005), Change Management, available at
http://www.businessballs.com/changemanagement.htm. Last accessed July 2014.

Lean Kitting Marta Lupi
117
Christmansson,M. et al. (2002), A case study of a principally new way of materials
kitting-an evaluation of time consumption and physical workload, International
Journal of Industrial Ergonomics, vol. 30 pp. 49-65.
Convis, G. (2014), Role of Management in a Lean Manufacturing
Environment available at:
http://www.sae.org/manufacturing/lean/column/leanjul01.htm. last accessed July
2014.
Dorsett, D. (2012) available at: http://www.goleansixsigma.com/how-to-easily-
apply-5s-to-your-work-station/ last accessed July 2014.
Drew et al. (2004), Journey to Lean, 1st ed. London: Palgrave Macmillan.
Dudley, N. (2005), The Application of Lean Manufacturing Principles in a High Mix
Low Volume Environment, Massachusetts Institute of Technology.
Entrepreneurness (2010), available at:
http://entrepreneurness.blogspot.co.uk/2010/05/basics-of-product-design.html last
accessed July 2014.
Fong-Yuen, D. and Puvitharan, B. (1990), Kitting in Just-in-time production,
Production and Inventory Management Journal, vol. 31 no. 4 pp. 25.
Hanson, R. (2012), In-plant materials supply: Supporting the choice between
kitting and continuous supply. Thesis For The Degree Of Doctor Of Philosophy,
Department of Technology Management and Economics, CHALMERS UNIVERSITY
OF TECHNOLOGY.
Hanson, R. et al. (2012). Assembly station design: a quantitative comparison of
the effects of kitting and continuous supply, Journal of Manufacturing Technology
Management, vol. 23 no. 3 pp. 315-327.
Hanson, R. and Mebdo, L. (2010), Kitting and time efficiency in manual assembly,
International Journal of Production Research, vol. 8 no. 2 pp. 1-22.
Henderson, R. et al. (1993), Kitting elimination supports just-in-time
principles. Industrial Engineering, vol. 25 no. 3 pp. 46.

Lean Kitting Marta Lupi
118
Hua, W. and Johnson, D.J. (2010), “Research Issues on factors influencing the
choice of kitting versus line stocking”, International Journal of Production Research,
vol. 48 no. 3 pp. 779-800.
Hubbard, B. (2010), Root Cause Analysis (Overview), available at:
http://bobsleanlearning.wordpress.com/2010/09/16/root-cause-analysis-overview/
last accessed July 2014.
Johansson E. and Johansson M.I. (2006), Materials Supply Systems Design in
Product Development Projects, International Journal of Operation and Product
Management, vol. 26, no. 4, pp. 371-393.
Kilic, H.S. et al. (2012), Design of kitting systems in lean-based assembly lines,
Assembly Automation, vol. 32 no. 3 pp. 226-234.
Kotter, J. (2002), The heart of change, New York: Harvard Business School
Publishing.
Larman, C. and Vodde, B. (2009), LEAN PRIMER, version 1.5 available at:
www.leanprimer.com.
Lean Enterprise Institute (1997), “Toyota’s New Material-Handling System Shows
TPS’s Flexibility” available at:
http://leaninstituut.nl/publications/1106/ToyotaNewMaterialHandlingSystem.pdf last
accessed July 2014
Leanisrael (2012), available at: http://blog.leanisrael.co.il/2012/08/muda-mura-
muri.html last accessed July 2014.
Liker, J. K. (2004), The Toyota way: 14 management principles from the world's
greatest manufacturer, New York: McGraw-Hill.
LeanCor (2014), available at: http://www.leancor.com/blog/my-lean-journey-
continuous-home-improvement/ last accessed July 2014.
McLaughlin, P. (2014), Cranfield University, Oral Reference.

Lean Kitting Marta Lupi
119
MID (2014), available at:
http://www.midwestintermodaldistribution.com/services/kitting/ last accessed July
2014.
NHS, Connecting for health (2000), available at:
http://www.connectingforhealth.nhs.uk/systemsandservices/icd/informspec/careerpla
n/phi/personal/learningweb/leadership/change last accessed July 2014.
Norval, A. (2011), Back to Basics available at:
http://blog.leansystems.org/2011_11_01_archive.html last accessed July 2014.
Ohno, T. (1988), Toyota production system: Beyond large-scale production.
Cambridge, MA: Productivity Press.
Prateek (2011), available at: http://prateekshukla.blogspot.co.uk/ last accessed
July 2014.
Ramachandran, S. and Delen, D. (2005), Performance analysis of a kitting
process in stochastic assembly systems, Computers & Operations Research, vol. 32
pp. 449–463.
Sanders, D. and Tewkesbury, G.E. (2009), “An expert system for automatic
design-for-assembly”, Assembly Automation, Vol. 29 No. 4, pp. 378-88.
Santillo, L.C. (2008-09), Lean Production. Corso di Gestione della Produzione
Industriale, available at: http://143.225.72.117/unina/didattica/appunti_lean.pdf last
accessed July 2014.
Scherer, Contenitore in Plastica Newbox available at:
http://www.scherer.it/it/prodotti/contenitori-in-plastica-equipment/newbox.12.html last
accessed August 2014.
Socepi, Pettini Divisori, available at: http://www.socepi.it/Home/tabid/39/p/Pettini-
divisori-linea-DELTA-MEC/ProductID/237/CategoryID/108/Default.aspx last
accessed August 2014.
Quizlet LLC (2014), available at: http://quizlet.com/2100663/lom-3320-processes-
and-facilities-flash-cards/ last accessed July 2014.

Lean Kitting Marta Lupi
120
Tapping, D., Luyster, T., and Shuker, T. (2002), Value stream management: Eight
steps toplanning, mapping, and sustaining lean improvements. New York, NY:
Productivity Press.
Tinoco, C. (2004), Implementation Of Lean Manufacturing, The Graduate College
University of Wisconsin-Stout, available at:
http://www2.uwstout.edu/content/lib/thesis/2004/2004tinocoj.pdf last accessed July
2014.
Yu, J., Yin, Y. and Sheng, X. (2003), “Modelling strategies for reconfigurable
assembly systems”, Assembly Automation, vol.23 no.3 pp. 266-72.
Williamson, G. (2009), Case Study–Implementing visual management. Available:
http://w3.unisa.edu.au/. Last accessed July 2014.
Womack, J. and Jones, D. (1996), Lean thinking: Banish waste and create wealth
in your corporation. New York, NY: Simon & Schuster.
Womack and Jones (1996), The Machine that Changed the World: The Story of
Lean Production. MIT Press.
Vujosevic, R. (2008), Lean Kitting: A Case Study, The University of Texas at
Austin Department of Mechanical Engineering.

Lean Kitting Marta Lupi
121
10 APPENDIX I – STATE OF THE ART
This glossary is thought to be useful in order to understand some words that have not
been explained or fully explained in the text.
Glossary of Terms
Andon: A system that alerts people (from floor members to management) of an
abnormal situation (production line down, behind schedule). It is usually a light or an
electronic board.
FIFO (First In, First Out): Products are consumed in the order they were produced or
received. The first product in the building is the first product to be used.
Fluctuation Stock: A set amount of stock that is introduced or removed as required
to maintain level production volumes.
Heijunka (Load Smoothing Production): A system designed to balance production
requirements through kanban control to ensure the same number of pieces are
produced each day and/or shift. Fluctuation stocks are then used to absorb the
variation.
Jidoka: A machines ability to detect abnormalities and stop the process. Operators
have the same authority.
Just in time: This term refers to the production or conveyance of parts or material
only when they are needed and in the quantity required.
Kanban: An instruction for production or conveyance. The most common form of a
kanban is a hand-sized signboard.
Kaizen (Continuous Improvement): One of the key terms in the lean vocabulary, this
refers to the need to continuously improve upon current processes. Continuous
Improvement does not stop until all waste is eliminated.
Non-Value-Added: Any work within the company that does not add value to the end
product. Much of the office work within an organization, although necessary, would
be considered non-value added.

Lean Kitting Marta Lupi
122
Poka Yoke: This Japanese term refers to mistake proofing devices. These devices
are often built into or interlocked with machinery to prevent missing an operation.
Pull System: Each process pulls product from a previous process. The pull of
product is the signal for the preceeding process to replenish the parts that were
pulled. This is also referred to as a replenishment system.
Standard-in-process stock: The amount of product kept between
operations/stations/processes in order to maintain proper process flow.
Standardized Work: A carefully documented and balanced work process that must
be adhered to by each operator to ensure consistency.
TPS (Toyota Production System): A production system developed by Toyota to
facilitate small lot production in an economically feasible manner. It focuses on
continuous improvement of processes, elimination of waste, level production and
quality built into the process (among other principles). It is the basis for lean
manufacturing.
Value-Added: A common term in the lean vocabulary referring to any necessary
work that adds value to a product. Most production work would be considered value-
added work as it contributes directly to the finished product.
Visual Control: This term refers to management by sight. 5S is a type of visual
control - a place for everything and everything in it's place.

Lean Kitting Marta Lupi
123
11 Appendix II - PROBLEM ANALYSIS
STANDARD FORM FOR THE OBSERVATIONS
JOB START TIME JOB END TIME
JOB NAME/ PART
NUMBER
AREA
JOB POSITION
PEOPLE INVOLVED
MAIN VISIBLE ISSUES
CONSEQUENCES ON
THE JOB
V
WASTE CATEGORY
UNPRODUCTIVE
ACTIONS
LEVEL OF EXPERIENCE

Lean Kitting Marta Lupi
124
EXAMPLE OF QUESTIONNAIRE
HOW LONG HAVE YOU BEEN WORKING for ASTRIUM?
HOW LONG HAVE YOU BEEN WORKING IN THIS AREA?
WHICH ARE THE RESPONSIBILITIES OF YOUR JOB?
WHICH IS YOUR ROLE IN THE KITTING PROCESS?
WHICH ARE THE MAIN ISSUES YOU PERSONALLY HAVE WITH THE KIT?
CAN YOU DESCRIBE A TIME WHEN THAT ISSUE HAPPENED? (Time, people
involved, what happened, how it was solved etc.)

Lean Kitting Marta Lupi
125
WAS THE WORKING ENVIRONMENT DIFFERENT IN THE PAST?
DO YOU HAVE SUGGESTION TO IMPROVE THE PROCESS?
HOW OFTEN DO YOU EXPERIENCE THIS ISSUE?
WHICH ARE THE CONSEQUENCES ON YOUR WORK?
WHICH IS IN YOUR OPINION THE CAUSE OF THE PROBLEM?

Lean Kitting Marta Lupi
126
12 Appendix III - PROPOSED SOLUTIONS
Computers
Considerations related to the computers in the various clean rooms analysed and the
central store:
LEO (PANELS)
Currently, there are about 15 computers in the clean room, placed at the sides of the
room and some of them are dedicated to a specific task (for example, laser machine
or the Cartesian robot used to flatten the surface of the panel).
PERSEUS (CPS)
In this clean room there are 9 computers allocated in the free space on the sides of
the area. From observations, it seems that these computers are far more used
compared to the panel area’s computers.
STORE
In the central store there are 5 computers. However, there are only 2 people working
with the kit, so there are 3 computers that are potentially unused and may be moved
and replaced in different areas if needed.
The main question is: Are the resources enough to cover the current need? Are the
current resources well balanced and distributed amongst the facility?
In the proposed solution, a suggestion regarding the digital use of WI as well as the
digital request for the mix is proposed.
The feasibility of these ideas is connected to the availability of resources on the shop
floor. It may be easier to relocate a few unused resources than purchasing additional
computers. Indeed, the store has an over capacity, while the Perseus has not
enough resources.
The purchase of computers or the relocation of existing resources is not a constraints
that can stop from the realisation, however the space and the position of the
computers on the shop floor may be a constraint to evaluate.

Lean Kitting Marta Lupi
127