Embed Size (px)
Citation preview
1
Leading inhibition to neural oscillation is important for time domain processing in the
auditory midbrain
Alexander V. Galazyuk*, Wenyu Lin, Daniel Llano, and Albert S. Feng
Department of Molecular and Integrative Physiology and Beckman Institute, University of Illinois,
Urbana, IL 61801
Corresponding author (*present address):
Dr. Alexander V. Galazyuk
Northeastern Ohio University College of Medicine
4209 State Route 44
Rootstown, OH 44272
Tel: 330-325-6640; Fax: 330-325-5916
Email: [email protected]
Keywords: Bat, frog, inferior colliculus, paradoxical latency shift, neural oscillation
Articles in PresS. J Neurophysiol (March 16, 2005). doi:10.1152/jn.00056.2005
Copyright © 2005 by the American Physiological Society.
2
Abstract:
A number of central auditory neurons exhibit paradoxical latency shift (PLS), a response
characterized by longer response latencies at higher sound levels. PLS neurons are known to
play a role in target ranging for echolocating bats that emit frequency-modulated sounds. We
recently reported that early inhibition of unit’s oscillatory discharges is critical for PLS in the
inferior colliculus (IC) of little brown bats. The goal of this study was to determine in
echolocating bats and in non-echolocating animals (frogs): 1) the detailed characteristics of PLS
and whether PLS was dependent on sound level, frequency and duration, 2) the time course of
inhibition underlying PLS using paired pulse paradigm. We found that 22% of IC neurons in bats
and 15% in frogs exhibited periodic discharge patterns in response to tone pulses at high sound
levels. The firing periodicity was unit specific and independent of sound level and duration.
Other IC neurons (28% in bats; 14% in frogs) exhibited PLS. These PLS neurons shared
several response characteristics: 1) PLS was largely independent of sound frequency, 2) the
magnitude of shift in first-spike latency was either duration-dependent or duration-tolerant. For
PLS neurons, application of bicuculline abolished PLS and unmasked the unit’s periodical firing
pattern that served as the building block for PLS. In response to paired sound pulses, PLS
neurons exhibited delay-dependent response suppression confirming that high threshold
leading inhibition was responsible for PLS. Results also revealed the timing of excitatory and
inhibitory inputs underlying PLS and its role in time domain processing.
3
Introduction
Animals that echolocate, such as bats and dolphins, utilize a sonar system to orient in
3D space and to detect and track moving prey. For this, they must assess the static and
dynamic characteristics of each target in their surroundings, such as the target range, size,
shape, azimuth, elevation, direction and speed of target movement. Target ranging is especially
important for tracking a moving prey, and has been extensively studied behaviorally and
physiologically. Physiological studies have shown that central auditory neurons of echolocating
bats are tuned to echo delay, showing response facilitation to pulse-echo pairs at particular
echo delays (Feng et al., 1978; O'Neill and Suga, 1979; Sullivan, 1982 a, b; Mittmann and
Wenstrup, 1995; O'Neill, 1995). Although delay-tuned response characteristics have been
described in detail, the underlying mechanisms are not well understood.
In the auditory cortex of little brown bats, a species that uses frequency modulated (FM)
ultrasonic pulses for echolocation, Sullivan (1982a,b) proposed that delay-tuned responses are
attributed to a coincidence detection mechanism. For this, the input neurons must show a
delayed response to a loud sonar signal such that this response can align temporally with the
units' response to a weak and late arriving echo. Neurons exhibiting paradoxical latency shift
(PLS), i.e., longer response latencies for intense sounds than for weaker sounds, are therefore
well suited for construction of delay-tuned responses. There are two lines of evidence
suggesting that PLS plays a role in target ranging. First, behavioral experiments in bats
suggested that neurons exhibiting PLS may be involved in target ranging (Denzinger and
Schnitzler, 1994). Second, Sullivan (1982b), and later Berkowitz and Suga (1989), found that for
the majority of neurons showing PLS in the little brown bat auditory cortex, the magnitude of the
latency shift for each neuron corresponded to the unit’s best echo delay to which this neuron is
tuned.
Sullivan proposed two models which may account for the PLS in the cortex of little brown
bats (the Delay Line model and the Timed Inhibitory model), but neither of these models was
4
experimentally validated. Galazyuk and Feng recently (2001) reported that, for the inferior
colliculus in the same species, PLS can be created by high-threshold early inhibition of neural
oscillatory discharges. Their result provides support for the Timed Inhibitory model of Sullivan.
Early inhibition (which shall be referred to as “leading inhibition”) that precedes an excitatory
response therefore, represents a key building block for the PLS. At this time, our understanding
of the basic characteristics of leading inhibition and its role in PLS is limited. The goal of the
present study is to fill this knowledge gap. Given that the inferior colliculus is the first station
along the central auditory pathway where PLS neurons are found (Berkowitz and Suga, 1989;
Klug et al., 2000), our study was focused there. Additionally, because PLS appears to be a
common phenomenon among animals (cats, Rose et al., 1963; gerbils, Klug et al., 2000; and
insects, Krahe et al., 2002), the present study will investigate PLS phenomena in the IC of the
little brown bats (an echolocating species for which PLS is known to have a role in delay-tuned
response and target ranging) and the northern leopard frog (a non-echolocating vertebrate).
METHODS
Surgical and Recording Procedures
Bats - Experimental subjects comprised 23 little brown bats, Myotis lucifugus. Details of
experimental methods are given in Galazyuk and Feng (2001). For surgery, the animal was
anesthetized via halothane inhalation (4% halothane administered by a precision vaporizer).
After incision of the skin and clearing of the tissues above the skull, a small metal rod was glued
to the skull using glass ionomer cement. Following the surgery, animals were allowed to recover
for 2-4 days in individual holding cages.
Recordings were made from awake bats. During the recording session the animal was
placed inside a sound attenuating chamber. The metal rod on the bat’s head was secured to a
small holder for restraining the animal's head atraumatically, leaving the ears unobstructed for
free-field acoustic stimulation. A small hole (~ 50 µm) was then made in the skull overlying the

5
IC through which a recording electrode was inserted to reach the IC. Throughout the recording
session, the animal was offered drinking water periodically and monitored for signs of
discomfort. After a recording session of 6-8 hours, the exposed skull was covered with sterile
bonewax, and the animal was returned to its holding cage. Such experiments proceeded every
2-3 days for a maximum of 3 weeks.
Extracellular single-unit recordings were made with glass micropipettes (10-20 MΩ, 2-3
µm tip) filled with horseradish peroxidase (5% in 0.2 M tris buffer). Such electrodes produce
stable single-unit recordings over long durations, and thus are preferred over other types of
recording electrodes. The electrode was positioned above the IC by means of a precision (1
µm) digital micromanipulator and lowered to the dorsal brain surface. The relative position of
each electrode was monitored from the readouts of digital micrometers using a common
reference on the skull. Vertical advancement of the electrode was made by a precision
piezoelectric microdrive from outside the sound attenuating chamber. Recorded action
potentials were amplified (Dagan 2400 preamplifier), monitored audiovisually, and stored on the
computer hard-drive, and processed off-line (100 µs bin width) using data acquisition
software/hardware from RC Electronics.
Frogs - Experimental methods generally adhered to those described in Lin and Feng (2003).
Briefly, 32 Northern leopard frogs (Rana pipiens), weighing 12-32 g, were used in this study. For
surgery, the animals were anesthetized by immersion in tricaine methanesulfonate (MS-222),
and immobilized with an intra-muscular injection of d-tubocurarine chloride (10 µg/g body
weight). The animal was placed on a Styrofoam board and wrapped in moist gauze to facilitate
cutaneous respiration. The board was contoured such that the frog’s head was raised slightly
above the body in order to approximate its natural sitting position. Under anesthesia, a skin flap
was incised on the dorsal surface of the head, and a small opening was made in the skull above
the left optic tectum. Lidocaine (4%) was applied topically to the wound area. The dural,
6
arachnoid, and pial membranes were removed to expose the surface of the tectum. After the
surgery, the animal was placed in a sound attenuated chamber and allowed to recover from
anesthesia. Immobilization was maintained during the recording session by periodic injections of
d-tubocurarine chloride.
Extracellular recordings were made from single neurons in the left torus semicircularis (a
homolog of mammalian inferior colliculus, IC) using the same type of electrode described for
bats. The electrode was attached to a precision piezoelectric microdrive and positioned
stereotactically onto the dorsal surface of the left optic tectum. The action potentials were
amplified and monitored using similar audiovisual devices, and stored on a computer hard drive
but processed using Tucker Davis data acquisition software (Brain-Ware).
Our experimental protocols for bats and frogs are in compliance with the "Guide for the
Care and Use of Laboratory Animals" publication No. 86-23 of the National Institutes of Health
and with the Animal Welfare Act of 1966 and its amendments of 1970 and 1976. These were
reviewed and approved by the University of Illinois Lab Animal Use and Care Committee.
Acoustic Stimulation
Bats - Acoustic stimuli, comprising tone pulses at the unit’s characteristic frequency (CF), were
delivered to the bat via a free field ultrasonic loudspeaker located 60 cm in front of the bat. Tone
pulses had a constant rise-fall time of 0.5 ms. The duration of tone pulses ranged from 2 to 8
ms. Sound pulses of a wide range of sound levels, from 10 to 90 dB SPL, were presented at a
rate of 1 per second in increments of 2-4 dB. The range of sound level was extended to lower
values if unit’s response threshold was below 10 dB SPL. The absolute sound pressure level
(dB re: 20 µPa) was measured with a 1/4-inch microphone (Brüel and Kjaer 4135) situated near
the concha of the ear opposite to the recording side. Typically we presented 10-20 tone pulses
at each sound level.
7
Frogs - Acoustic stimuli comprising tone bursts at the unit’s CF having a rise-fall time of 5 ms
and duration of 20 - 80 ms, were presented once every 2.5 sec. The stimulus parameters were
controlled by a PC-based Tucker Davis System-2 hardware and software. Frog was stimulated
via a free field loudspeaker (ADS 200 LC) located 55 cm on the frog’s right side (90˚ from the
frog’s longitudinal axis which corresponds to the best azimuth of most IC units). The absolute
sound pressure level (dB re: 20 µPa) was calibrated at the location of the frog’s left tympanum
using a free-field condenser microphone (Brüel and Kjaer 4165). Ten tone bursts were
presented at each sound level; the sound level ranged from 20 to 80 dB SPL.
Data analysis
Dot raster histograms were used to depict a unit’s temporal discharge pattern for each epoch at
each level. Each dot in a raster histogram indicated a spike at the relative time instant with
respect to the stimulus onset. Dot raster histograms from different sound levels were combined
to create a unit’s composite dot histogram for visualization of how the response latency and the
firing pattern changed globally with sound level. To quantify the response latency, we
determined the average and the standard deviation of latency of the first spike of a unit’s
responses to 10-20 epochs within the “response window” (defined as the window wherein the
spike count and/or firing rate is > 25% above the background spontaneous firing). The
spontaneous firing rate was the average response over a 50 ms window prior to each stimulus
epoch.
Iontophoretic drug injection
For a number of neurons in the bat and frog IC showing PLS, we applied bicuculline (i.e.,
a GABAa receptor blocker) iontophoretically in order to assess the role of GABAergic inhibition
in unit’s temporal firing pattern and/or PLS. For this, the glass micropipette that was used for
extracellular single-unit recording was piggy-backed to a 5-barrel glass pipette with a tip
diameter of ~10 µm (Havey and Caspary, 1980) - the tip of the former protruded about 20 µm
8
beyond the tip of the latter. Two of the 5 barrels were filled with bicuculline methiodide (or BIC,
10 mM, pH 3.0; Sigma), a GABAa receptor blocker. The central barrel was filled with 0.64%
sodium chloride (pH 7.4) for maintaining electrical balance. The 5-barrel pipette was connected
to a six-channel iontophoresis current generator (Dagan 6400). A retaining current of -15 nA (or
–20 nA) was used to prevent drug leakage at all times except during drug injection. To apply
bicuculline, we used a current of +5 to +20 nA. A unit's response was evaluated before, during,
and after drug application.
RESULTS
Extracellular responses were obtained from 186 neurons in the IC of M. lucifugus and
202 neurons in the IC of Rana pipiens pipiens. Data from the bat IC will be described first,
followed by data from the frog IC. Results from a smaller sample in the bat IC have been
described briefly in a short report (Galazyuk and Feng, 2001).
In agreement with previous reports (Condon et al. 1994; Galazyuk et al. 2000), IC
neurons in little brown bats had CFs ranging from 7 to 80 kHz. Thresholds at CF ranged from 2
to 68 dB SPL, with a modal value of 49 dB SPL. Units with low CFs were represented in the
dorsal aspect of the IC and higher frequencies progressively more ventrally in the IC.
For the majority of IC neurons (132 units, or 71%), an increase in sound level elicited a
monotonic increase in spike count and a concomitant decrease in the first spike latency. The
increase in spike count and the decrease in latency shift were most pronounced at low sound
levels, within 20 dB of the threshold at the unit’s CF; the spike count and the latency did not
change appreciably with a further increase in sound level. Similar level-dependent latency
changes have been described by others (Park and Pollak, 1993; Heil and Irvine, 1997).
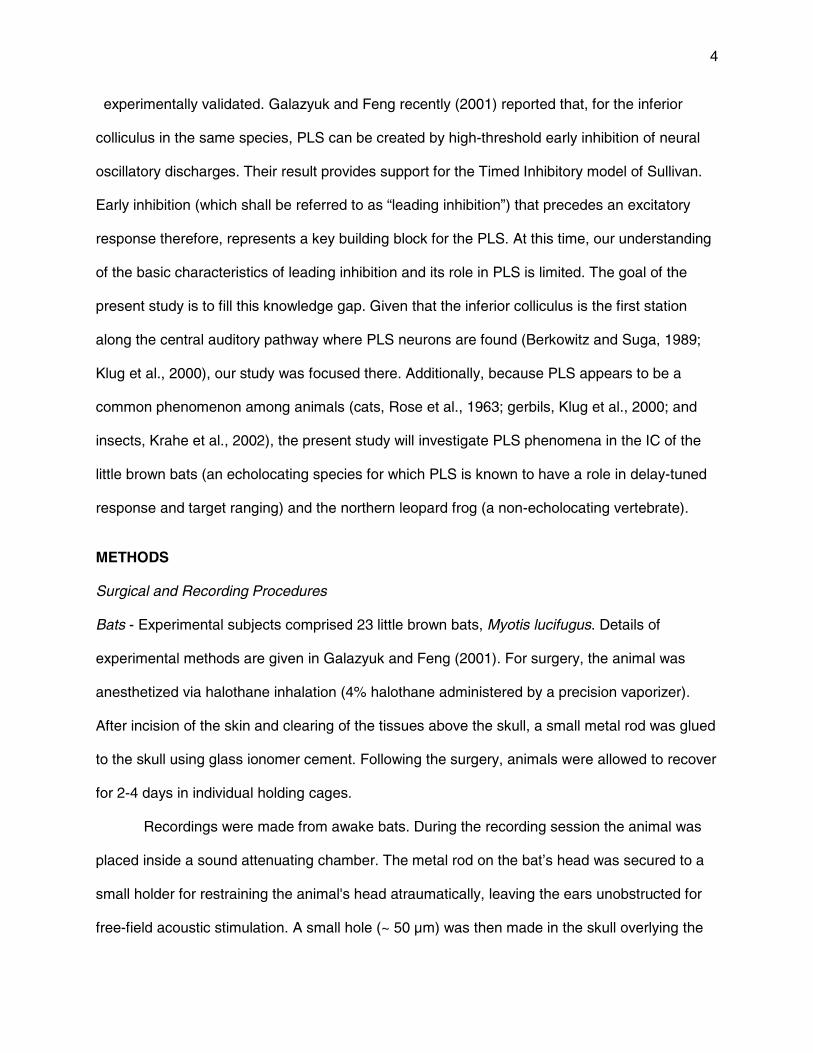
A subset of the total population (40 units, or 22%) exhibited periodic discharge patterns
at high sound levels. An increase in sound levels prolonged the firing duration of these neurons,
due to the addition of later spikes at a fixed period. A notable feature was the constancy of their

9
firing periodicity. Responses of two representative neurons exhibiting periodic discharge
patterns are shown in Figure 1. Unit GGF6 in Figure 1A fired on average 1-2 spikes at 10-20 dB
SPL, and it consistently fired 4-5 spikes at regular firing intervals from 24 to 90 dB SPL. The
firing periodicity of this neuron was level independent and remained constant at 1.9 ms at 24-90
dB SPL, as evidenced by the tight distribution of the inter-spike interval histogram (Fig. 1B). Unit
GK12 in Figure 1C fired 1 cycle at 10-30 dB SPL, and this grew to 2 firing cycles at 34-60 dB
SPL. Further increase in sound level led to a progressive increase in the number of firing cycles
ending up with 4 at 80-90 dB SPL. Its firing periodicity remained the same (~4.8 ms) over a wide
range of sound levels (Fig. 1D). The firing periodicity was unit specific, ranging from 1.3 to 8.4
ms (Fig. 1E). Figure 1E shows that the firing periodicity was not evenly distributed within this
range; the majority of 40 units had firing periodicities in the range from 1 to 3 ms.
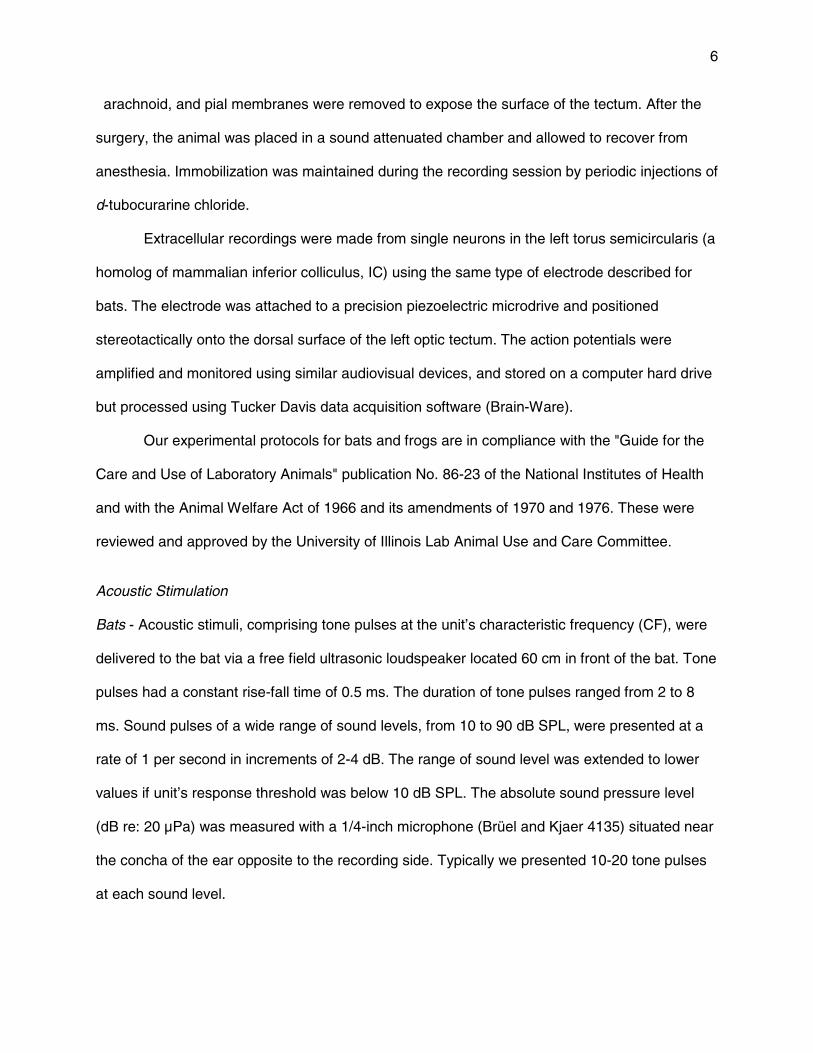
For 26 neurons exhibiting periodic discharges, we evaluated whether the unit’s firing
periodicity depended on sound duration ranging from 1 to 8 ms. We did not use longer sound
durations for this test because the majority of IC neurons did not respond to tone bursts having
longer sound durations. For 25 of 26 units, a change in sound duration did not change the unit’s
firing periodicity. Although the unit’s firing periodicity was unchanged, the firing duration was in
some cases (12 of 25) was dependent on stimulus duration (Fig. 2C), and in other cases (13 of
25) independent of the stimulus duration (Fig. 2A). Unit GGY4 in Figure 2A discharged one
spike at low sound levels (<34 dB SPL) but gave three spikes at higher sound levels at a
constant inter-spike interval (~1.7 ms) for tone pulses with 1 to 8 ms duration, as shown by
inter-spike interval histograms at different sound durations (Fig. 2B). The above neuron was
therefore duration-independent, both in terms of its firing periodicity and duration. In contrast, for
unit GGT9 (Fig. 2C), its firing periodicity also remained constant but its response duration
increased progressively with an increase in stimulus duration (Fig. 2D).
Paradoxical latency shift (PLS)
10
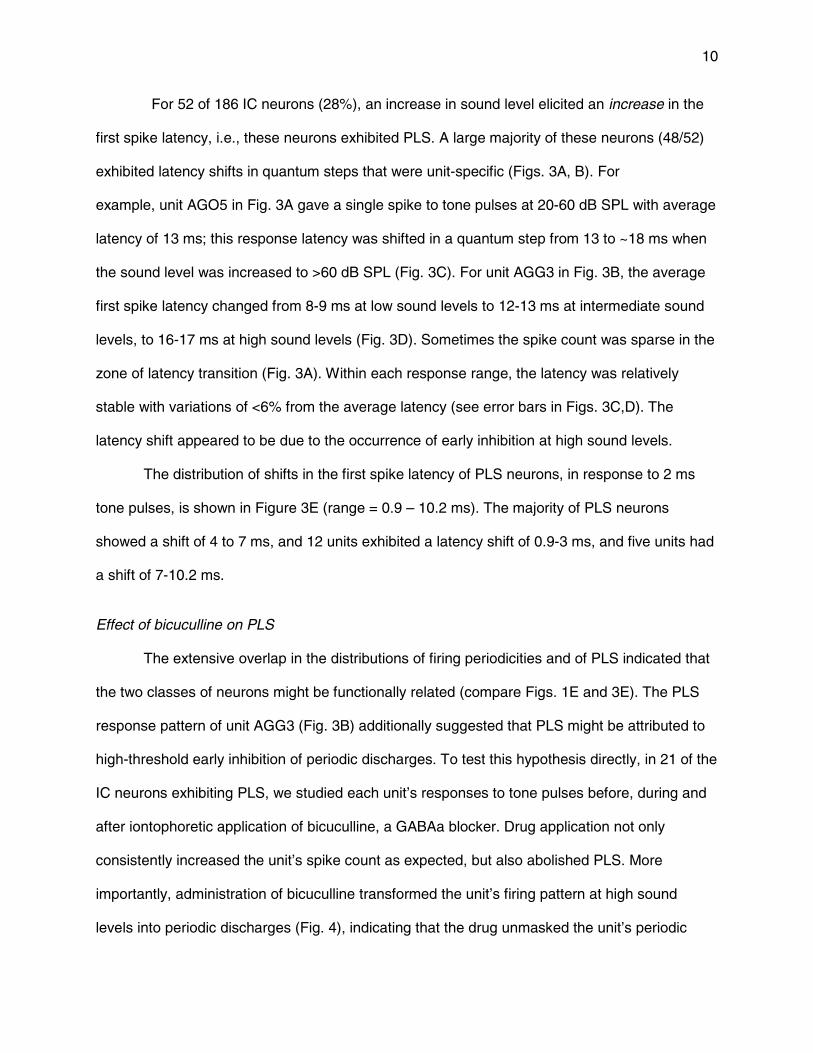
For 52 of 186 IC neurons (28%), an increase in sound level elicited an increase in the
first spike latency, i.e., these neurons exhibited PLS. A large majority of these neurons (48/52)
exhibited latency shifts in quantum steps that were unit-specific (Figs. 3A, B). For
example, unit AGO5 in Fig. 3A gave a single spike to tone pulses at 20-60 dB SPL with average
latency of 13 ms; this response latency was shifted in a quantum step from 13 to ~18 ms when
the sound level was increased to >60 dB SPL (Fig. 3C). For unit AGG3 in Fig. 3B, the average
first spike latency changed from 8-9 ms at low sound levels to 12-13 ms at intermediate sound
levels, to 16-17 ms at high sound levels (Fig. 3D). Sometimes the spike count was sparse in the
zone of latency transition (Fig. 3A). Within each response range, the latency was relatively
stable with variations of <6% from the average latency (see error bars in Figs. 3C,D). The
latency shift appeared to be due to the occurrence of early inhibition at high sound levels.
The distribution of shifts in the first spike latency of PLS neurons, in response to 2 ms
tone pulses, is shown in Figure 3E (range = 0.9 – 10.2 ms). The majority of PLS neurons
showed a shift of 4 to 7 ms, and 12 units exhibited a latency shift of 0.9-3 ms, and five units had
a shift of 7-10.2 ms.
Effect of bicuculline on PLS
The extensive overlap in the distributions of firing periodicities and of PLS indicated that
the two classes of neurons might be functionally related (compare Figs. 1E and 3E). The PLS
response pattern of unit AGG3 (Fig. 3B) additionally suggested that PLS might be attributed to
high-threshold early inhibition of periodic discharges. To test this hypothesis directly, in 21 of the
IC neurons exhibiting PLS, we studied each unit’s responses to tone pulses before, during and
after iontophoretic application of bicuculline, a GABAa blocker. Drug application not only
consistently increased the unit’s spike count as expected, but also abolished PLS. More
importantly, administration of bicuculline transformed the unit’s firing pattern at high sound
levels into periodic discharges (Fig. 4), indicating that the drug unmasked the unit’s periodic

11
firing pattern. Prior to drug application, the first spike latency of unit GK10 (Fig. 4A, top panel)
showed a shift from 12.6 to 19.5 ms in quantal steps of ~2.3 ms (see arrow heads in top panel)
when the sound level was raised to >48 dB SPL. Similarly, prior to drug application unit GL26
(Fig. 4B, top panel) also showed a level-dependent shift of 5.3 ms in its first spike latency.
Under bicuculline, these units responded to tone pulses over a broad range of sound levels
with evidence of periodic discharges having multiple firing cycles (middle panels of Figs. 4A and
B). After recovery both neurons once again showed a distinct PLS (bottom panels of Figs. 4A
and B).
For the 21 PLS neurons tested, the average firing periodicity observed during drug
application approximated the average quantal shift in first spike latency during the pre-drug
period (Fig. 4 C). These two values were tightly correlated (correlation coefficient = 0.93).
Effect of sound frequency on PLS
In our pilot study (Galazyuk and Feng, 2001), based on a sample of 4 units, we reported
that the magnitude of the PLS seemed to be independent of sound frequency. The more
extended study on 17 units confirmed this finding. When sound frequency was varied within
10% of a unit’s CF, the amount of the latency shift showed little or no change, as shown by a
representative example in Figure 5. This unit exhibited PLS in response to tone pulses at the
unit’s CF, namely, 48 kHz (middle panel of Fig. 5A). PLS was also evidenced at 49 and 47 kHz,
and the magnitude of latency shift was unchanged. When sound frequency was further shifted
to higher or lower frequencies (to 50 and 46 kHz), PLS was still evidenced in spite of the fact
that the spike count was much weaker. Importantly, the magnitude of latency shift was stable for
these sound frequencies, as shown by the dashed lines across the composite PST histograms
in Figure 5B.
Effect of sound duration on PLS
12
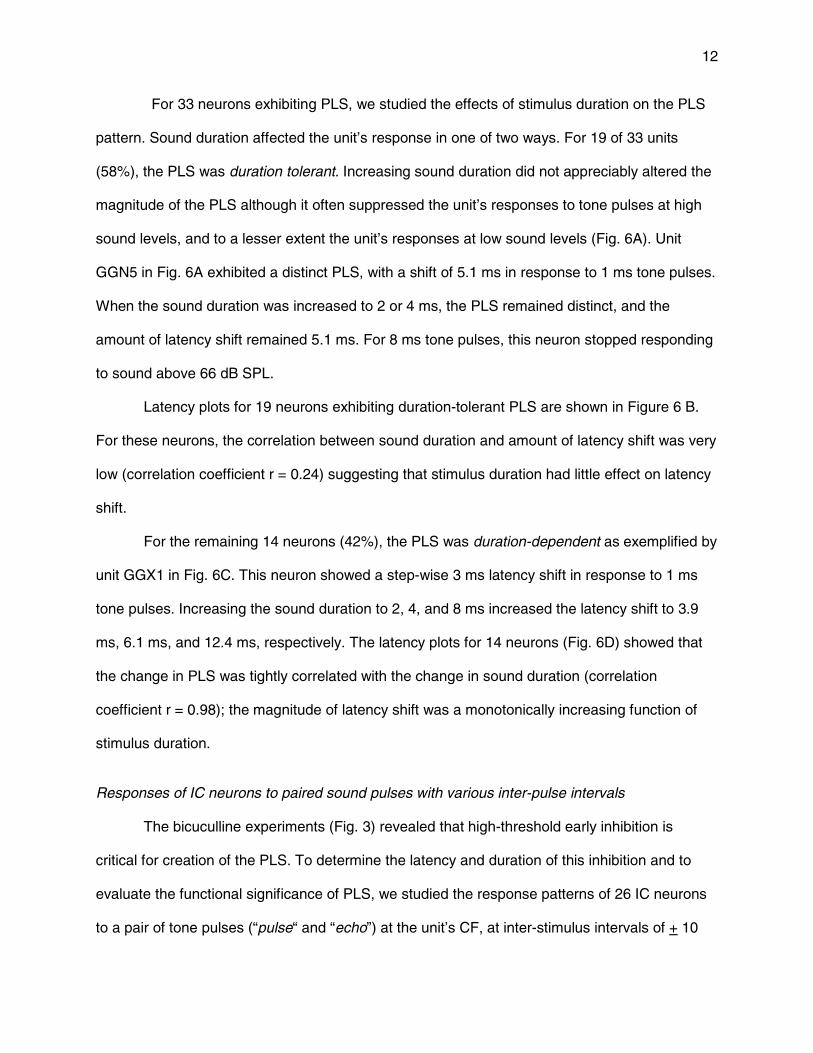
For 33 neurons exhibiting PLS, we studied the effects of stimulus duration on the PLS
pattern. Sound duration affected the unit’s response in one of two ways. For 19 of 33 units
(58%), the PLS was duration tolerant. Increasing sound duration did not appreciably altered the
magnitude of the PLS although it often suppressed the unit’s responses to tone pulses at high
sound levels, and to a lesser extent the unit’s responses at low sound levels (Fig. 6A). Unit
GGN5 in Fig. 6A exhibited a distinct PLS, with a shift of 5.1 ms in response to 1 ms tone pulses.
When the sound duration was increased to 2 or 4 ms, the PLS remained distinct, and the
amount of latency shift remained 5.1 ms. For 8 ms tone pulses, this neuron stopped responding
to sound above 66 dB SPL.
Latency plots for 19 neurons exhibiting duration-tolerant PLS are shown in Figure 6 B.
For these neurons, the correlation between sound duration and amount of latency shift was very
low (correlation coefficient r = 0.24) suggesting that stimulus duration had little effect on latency
shift.
For the remaining 14 neurons (42%), the PLS was duration-dependent as exemplified by
unit GGX1 in Fig. 6C. This neuron showed a step-wise 3 ms latency shift in response to 1 ms
tone pulses. Increasing the sound duration to 2, 4, and 8 ms increased the latency shift to 3.9
ms, 6.1 ms, and 12.4 ms, respectively. The latency plots for 14 neurons (Fig. 6D) showed that
the change in PLS was tightly correlated with the change in sound duration (correlation
coefficient r = 0.98); the magnitude of latency shift was a monotonically increasing function of
stimulus duration.
Responses of IC neurons to paired sound pulses with various inter-pulse intervals
The bicuculline experiments (Fig. 3) revealed that high-threshold early inhibition is
critical for creation of the PLS. To determine the latency and duration of this inhibition and to
evaluate the functional significance of PLS, we studied the response patterns of 26 IC neurons
to a pair of tone pulses (“pulse“ and “echo”) at the unit’s CF, at inter-stimulus intervals of + 10
13
ms (in 1 ms steps). Of the 26 neurons tested, 19 were PLS neurons and 7 were control
neurons. Faure et al. (2003) recently utilized a similar stimulus paradigm and analytical method
to successfully elucidate the timing of synaptic inhibition underlying duration tuning.
Because a unit’s response to high-level sound (the pulse) was often complex,
characterized by early inhibition followed by excitation, whereas a unit’s response to low-level
sound (the echo) was strictly excitatory, we used a unit’s response to the echo to determine the
timing of pulse-induced inhibition. Unit’s responses to the echo (in terms of spike counts) were
measured for different pulse-echo intervals, and unit’s responses to the pulse were ignored.
Spike count to the echo was measured over a time window during which this response was
>50% above the unit’s spontaneous rate.
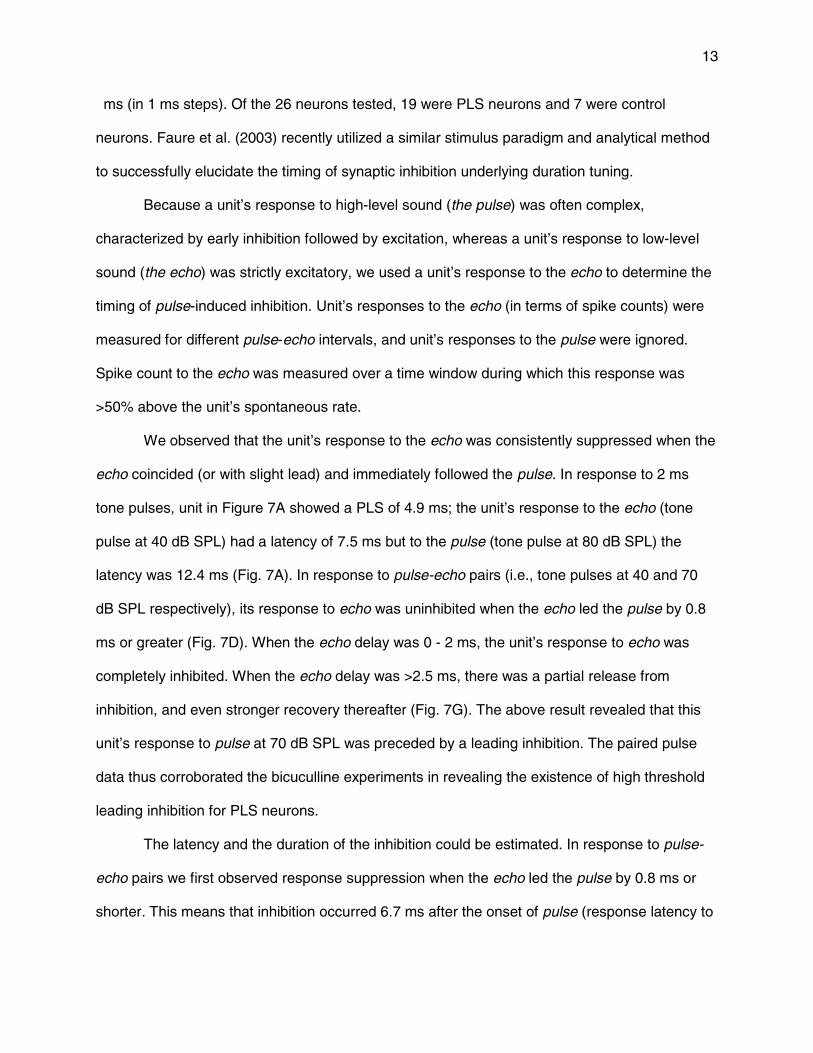
We observed that the unit’s response to the echo was consistently suppressed when the
echo coincided (or with slight lead) and immediately followed the pulse. In response to 2 ms
tone pulses, unit in Figure 7A showed a PLS of 4.9 ms; the unit’s response to the echo (tone
pulse at 40 dB SPL) had a latency of 7.5 ms but to the pulse (tone pulse at 80 dB SPL) the
latency was 12.4 ms (Fig. 7A). In response to pulse-echo pairs (i.e., tone pulses at 40 and 70
dB SPL respectively), its response to echo was uninhibited when the echo led the pulse by 0.8
ms or greater (Fig. 7D). When the echo delay was 0 - 2 ms, the unit’s response to echo was
completely inhibited. When the echo delay was >2.5 ms, there was a partial release from
inhibition, and even stronger recovery thereafter (Fig. 7G). The above result revealed that this
unit’s response to pulse at 70 dB SPL was preceded by a leading inhibition. The paired pulse
data thus corroborated the bicuculline experiments in revealing the existence of high threshold
leading inhibition for PLS neurons.
The latency and the duration of the inhibition could be estimated. In response to pulse-
echo pairs we first observed response suppression when the echo led the pulse by 0.8 ms or
shorter. This means that inhibition occurred 6.7 ms after the onset of pulse (response latency to

14
echo 7.5 ms minus 0.8 ms, the inter-pulse interval when we first observed suppression). This
suppression lasted 3.4 ms, as indicated by dashed vertical lines in Fig. 7G.
For seven control neurons showing short (Fig. 7B) or long (Fig. 7C) burst of spikes to
sound pulses at the unit’s CF throughout 10-90 dB SPL without evidence of PLS, we also
studied their responses to paired tone pulses. Since their responses to CF at 40 and 70 dB SPL
(or 50 and 80 dB SPL) were similar, both pulse and echo were presented at the same intensity
(70 dB SPL). We found that a subgroup of control neurons (N=4) displayed post-excitatory
inhibition, which was evidenced only from their paired-pulse responses, as exemplified by unit
AGN2 in Fig. 7E. This unit showed scattered responses to single tone pulses below 34 dB SPL,
but for tone pulses at 34 to 90 dB SPL it gave periodic discharges over a duration of ~3 ms that
was level independent (Fig. 7B). In response to paired tone pulses, when the echo delay was 3
ms or longer, its echo response was severely inhibited (Fig. 7E), suggesting the existence of a
post excitatory inhibition. Post-excitatory inhibition occurred 2.3 ms after response on-set as
indicated by vertical dashed line in Fig. 7H.
Three of the control neurons showed progressively longer periodic discharges with an
increase in the sound level (Fig. 7C). In response to paired tone pulses at 70 dB SPL, this
neuron gave a more or less constant spike count, independent of the inter-pulse interval (Fig.
7F). Such IC neurons showed no evidence of inhibition, in their responses to single or paired
tone pulses (Fig. 7I).
Frog Inferior Colliculus
Recordings in the frog IC were made primarily from the magnocellular nucleus and the
lateral region of the principal nucleus (Feng and Lin 1991; Endepols et al. 2000). Unit CF
ranged from 200 to 1700 Hz and distributed around three clusters: 300-700 Hz (low-frequency),
900-1300 Hz (mid-frequency), and 1400-1600 Hz (high-frequency). Unit thresholds at CF
ranged from 21 to 47 dB SPL.
15
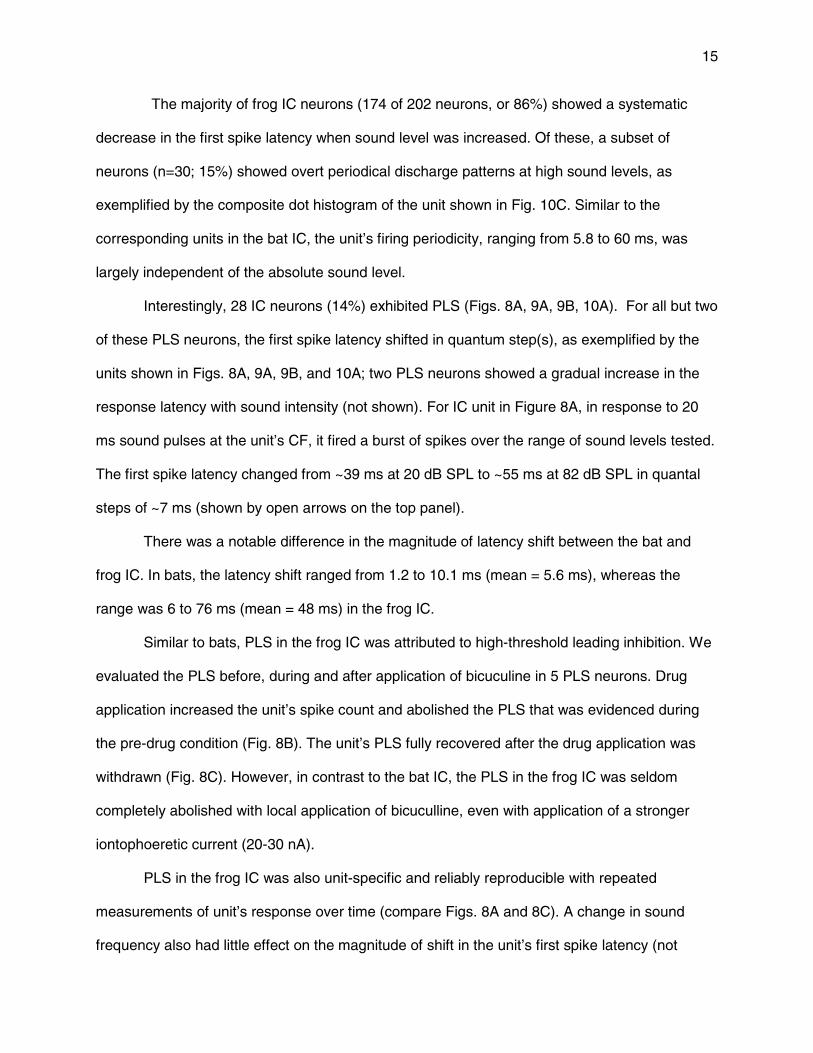
The majority of frog IC neurons (174 of 202 neurons, or 86%) showed a systematic
decrease in the first spike latency when sound level was increased. Of these, a subset of
neurons (n=30; 15%) showed overt periodical discharge patterns at high sound levels, as
exemplified by the composite dot histogram of the unit shown in Fig. 10C. Similar to the
corresponding units in the bat IC, the unit’s firing periodicity, ranging from 5.8 to 60 ms, was
largely independent of the absolute sound level.
Interestingly, 28 IC neurons (14%) exhibited PLS (Figs. 8A, 9A, 9B, 10A). For all but two
of these PLS neurons, the first spike latency shifted in quantum step(s), as exemplified by the
units shown in Figs. 8A, 9A, 9B, and 10A; two PLS neurons showed a gradual increase in the
response latency with sound intensity (not shown). For IC unit in Figure 8A, in response to 20
ms sound pulses at the unit’s CF, it fired a burst of spikes over the range of sound levels tested.
The first spike latency changed from ~39 ms at 20 dB SPL to ~55 ms at 82 dB SPL in quantal
steps of ~7 ms (shown by open arrows on the top panel).
There was a notable difference in the magnitude of latency shift between the bat and
frog IC. In bats, the latency shift ranged from 1.2 to 10.1 ms (mean = 5.6 ms), whereas the
range was 6 to 76 ms (mean = 48 ms) in the frog IC.
Similar to bats, PLS in the frog IC was attributed to high-threshold leading inhibition. We
evaluated the PLS before, during and after application of bicuculine in 5 PLS neurons. Drug
application increased the unit’s spike count and abolished the PLS that was evidenced during
the pre-drug condition (Fig. 8B). The unit’s PLS fully recovered after the drug application was
withdrawn (Fig. 8C). However, in contrast to the bat IC, the PLS in the frog IC was seldom
completely abolished with local application of bicuculline, even with application of a stronger
iontophoeretic current (20-30 nA).
PLS in the frog IC was also unit-specific and reliably reproducible with repeated
measurements of unit’s response over time (compare Figs. 8A and 8C). A change in sound
frequency also had little effect on the magnitude of shift in the unit’s first spike latency (not

16
shown). When tone frequency was moved away from the unit’s CF by up to 10%, PLS neurons
showed the same PLS pattern and amount of latency shift as they did in response to tone bursts
at the unit’s CF.
Similar to the bat IC, a change in stimulus duration had two different consequences. For
eleven of PLS neurons (39%), the magnitude of the latency shift was duration-independent. For
example, unit 7/16-7 in Figure 9A showed a distinct PLS in response to 10 ms tone bursts (top
panel); its phasic response at lower sound levels was delayed by ~46 ms when the sound level
was raised to >80 dB SPL. For 20 and 40 ms tone pulses (second and third panels in Fig. 9A),
the unit’s PLS remained unchanged, and there was a latency shift of ~48 ms when sound level
reached beyond 84 dB SPL. At 80 ms, the unit’s response to tone pulses at >82 dB SPL was
completely abolished and so was the unit’s PLS (bottom panel, Fig. 9A).
Seventeen PLS neurons (61%) in the frog IC showed duration-dependent PLS. As
shown for unit W751 in Figure 9B, increasing the stimulus duration from 10 ms to 20, 40, and 80
ms increased the latency shift progressively from 25 ms to 50, 81, and 98 ms, respectively. The
magnitude of the latency shift was roughly proportional to the change in stimulus duration.
For 33 IC neurons (25 PLS neurons and 8 non-PLS neurons), we studied their
responses to paired tone pulses at the unit’s CF with inter-pulse intervals of from 0 to +100 ms
(in 10 ms steps). We found that PLS neurons and non-PLS neurons behaved similarly to the
corresponding neurons in the bat IC (see Fig. 7 for comparison). The PLS neuron in Fig. 10A
was stimulated with a pair of sound pulses (pulse @ 70 dB SPL; echo @ 40 dB SPL). This
neuron showed inhibitory interactions suggesting the presence of leading inhibition (Fig. 10D); it
exhibited response suppression to echo when the pulse-echo interval was -20 ms to 45 ms (Fig.
10G). Thus, with the unit’s response latency to echo of 32 ms (Fig.10A), using simple
calculations (32-20=12; 20+45=65), we deduced that inhibition must have begun 20 ms after the
pulse onset and lasted 65 ms.

17
Non-PLS neurons in the frog IC similarly showed two different response patterns (Figs.
10B, E, H and Figs. 10C, F, I), as did non-PLS neurons in the bat IC. For 3 of 8 non-PLS
neurons, there was evidence of post-excitatory inhibition, as exemplified by the unit in Fig. 10B.
This unit showed tonic discharges in response to 20 ms tone bursts (Fig. 10B). Unlike the PLS
unit in Figure 10A, this unit’s discharge terminated rather abruptly, with little or no delay
response following the initial burst (Fig. 10B). In response to paired tone pulses at 70 dB SPL,
there was a marked response suppression to echo for pulse-echo interval of 20 - 100 ms (Fig.
10E, H). As before, since unit’s response latency to echo had a latency 26 ms, we estimated
that this unit’s post-excitatory inhibitory period must have begun 13 ms after the response
onset, as indicated by the vertical dashed line on the bottom panel of Fig. 10B.
For 5 of 8 non-PLS neurons, there was no evidence of inhibitory interaction over the
entire range of inter-pulse intervals, as exemplified by the paired-pulse responses of a
representative unit in Figure 10C. This unit gave tonic and periodic discharges in response to
tone pulses presented at all sound levels, followed by a delayed non-periodic firing (Fig. 10C).
In response to paired pulses at 70 dB SPL, there was no sign of inhibition across all inter-pulse
intervals (Fig. 10F, I).
Discussion
Oscillatory discharges
A sizable number of IC neurons in frogs (N=30; 15%) and bats (N=40; 22%) show
evidence of oscillatory discharges in response to tone pulses at the unit’s CF at high sound
levels. The firing periodicity is essentially constant, unit-specific, and independent of stimulus
intensity, frequency or duration (Figs. 1, 2, 10C). Whereas the firing periodicity is invariable with
a change in stimulus duration, a unit’s firing duration can be independent (Fig. 2B) or dependent
(Fig. 2D) of the stimulus duration. In all cases, the duration of periodic firing is prolonged with an
elevation of sound level (Figs. 1, 2). Together, these results suggest that periodical firing is likely

18
due to an endogenous origin, e.g., intrinsic oscillation, and that such oscillation is damped over
time.
Additionally, pharmacological results from 21 PLS neurons in the bat IC and 5 PLS
neurons in the frog IC show that the periodic discharge at high sound levels is often masked,
and evidenced only when GABAergic inhibition is suppressed, i.e., when bicuculline is
administered (Figs. 4, 8). As before, after the oscillatory discharge is unmasked, its periodicity is
independent of sound intensity, and its firing duration is longer at higher sound levels - these
again suggest that its origin is endogenous and the intrinsic oscillation is damped. In patch
clamp recordings from the IC of the big brown bat, Covey et al. (1996) have observed damped
oscillatory potentials in neurons having different CFs, across a wide range of stimulus
amplitudes; membrane oscillations occur after sound offset, as observed in the present study.
The rate of oscillations reported by these authors is lower than what we observed in the little
brown bat but longer than that in the leopard frog, however.
The maximum firing duration of bat IC neurons exhibiting periodic discharge patterns
could be as long as 26 ms, which was an order of magnitude longer than the stimulus duration
of 2 ms. Therefore, these neurons differ from that of chopper cells in the brainstem auditory
nuclei in a fundamental way (Rhode and Greenberg, 1992) - the chopper firing pattern in the
cochlear nucleus is usually observed within the period of stimulation. However, it is noted that
studies of chopper cells typically employed long tone bursts at low supra-threshold levels. It is
not clear whether or not chopper cells would elicit prolonged periodic firings in response to short
tone pulses at high supra-threshold levels.
Level-dependent latency change and occurrence of PLS
The response latency of sensory neurons generally shortens with an increase in
stimulus intensity, a phenomenon commonly known as “level-dependent latency change”.
Because many auditory functions depend critically on precise timing of neural inputs (reviewed
19
by Covey and Casseday, 1999; Oertel, 1999), one would expect that level-dependent latency
change would have an especially significant impact on auditory processing. In the auditory
system, level-dependent latency change has been observed at every level investigated,
including the cochlea (guinea pig, Deatherage et al., 1959), cochlear nucleus (cat, Goldberg and
Brownell, 1973; Kitzes et al., 1978; rat, Miller, 1975), superior olivary complex (gerbil, Sanes
and Rubel, 1988), lateral lemniscus (cat, Aitkin et al., 1970; bat, Haplea et al., 1994), inferior
colliculus (cat, Hind et al., 1963; Irvine and Gago, 1990; bat, Bodenhamer and Pollak, 1981;
Haplea et al., 1994), medial geniculate body (cat, Aitkin and Dunlop, 1968), and auditory cortex
(cat, Brugge et al., 1969).
The mechanisms underlying level-dependent latency change in the auditory system are
not completely understood. The extensive studies by Heil and Irvine (Heil, 1997a,b, 1998; Heil
and Irvine, 1996, 1997, 1998) show that the average level-dependent latency shift is essentially
the same at the auditory nerve and at the auditory cortex, thus suggesting that the effect is
established at the periphery. These studies also show that the first spike latency depends more
on the maximum acceleration of peak pressure during the rise time than on the steady-state
peak pressure per se (Heil, 1997a; Heil and Irvine, 1997).
PLS, as observed in the present and previous studies, is characterized by a level-
dependent increase (instead of a decrease) in response latency. In contrast to the common
level-dependent latency change, PLS appears to have a central origin (see below on
mechanisms of PLS). A series of studies have revealed that PLS is more prevalent and overt at
the level of the midbrain and above, especially in bats (Berkowitz and Suga, 1989; Rose et al.,
1959; Suga, 1970; Sullivan, 1982b; Aitkin et al., 1970; Covey, 1993; Klug et al., 2000).
Among vertebrates other than bats, PLS neurons have been observed in the auditory
system of cats (Rose et al., 1963) and gerbils (Klug et al., 2000). The finding that some frog IC
neurons also exhibited PLS suggests that the occurrence of this response characteristic is not
limited to mammals, or to animals that echolocate. Because frogs and mammals evolve along
20
two separate lines of evolution, this feature must have evolved independently.
Neural mechanisms underlying PLS
On the basis of a preliminary study, we previously hypothesized a possible neural
mechanism for construction of PLS (Galazyuk and Feng, 2001). In this hypothesis, we assume
that IC neurons showing unit-specific oscillatory discharges are the basic building blocks for
PLS. When a unit’s oscillatory discharge is subjected to high-threshold leading inhibition, the
inhibition suppresses the early response components of unit’s oscillatory discharge at high
sound levels, one at a time, thereby delaying the unit’s response in quantum steps; quantum
PLS would have been difficult to create without oscillatory discharge as a building block. The
results from a more extended study herein support this hypothesis as one of the mechanisms
for creation of PLS, i.e., duration-independent PLS (see below). We found that about one-half of
PLS neurons in the bat and frog IC exhibit duration-independent PLS (Figs. 6, 9A) for which a
change in sound duration does not change the unit’s PLS. Because application of bicuculline
abolishes PLS and unmasks the unit’s oscillatory discharge of these neurons (Figs. 4, 8), we
conclude that the underlying mechanism for duration-independent PLS is high-threshold
inhibition of unit’s oscillatory discharge.
The other half of PLS neurons, however, exhibit duration-dependent PLS. These
neurons exhibit a greater shift in the first spike latency with an increase in sound duration (Figs.
6, 9B). We believe duration-dependent PLS must be attributed to a different neuronal
mechanism. One possible mechanism involves simple switching of the unit’s firing pattern, e.g.,
responding to stimulus onset at low sound levels, and to stimulus offset at high levels, and as
such, an increase in stimulus duration would produce a delayed offset response. A response
switch at low versus high sound levels has been observed in intracellular recordings from the
cat auditory cortex (Volkov and Galazyuk, 1991) and extracellular recordings from the guinea
pig auditory thalamus (He, 2002). However, whether or not response switch is responsible for

21
duration-dependent PLS in the IC requires direct empirical validation. An alternative
mechanism is having an inhibition whose duration lengthens with the stimulus.
Interplay of excitation and inhibition in processing of time-varying information
The paired pulse experiments reported here allow us to quantify the time course of
inhibition without involving drug application or intracellular recordings. Our results show that the
majority of IC neurons in both groups of animals receive both excitatory and inhibitory inputs.
The timing of these inputs can be used to generate various paired-pulse response functions. For
example, when an IC neuron receives an excitation that is followed by inhibition a few
milliseconds later, it produces a short-lasting firing activity (Figs. 7B, 10B). Such neurons show
suppressed paired-pulse responses at long echo delays. In contrast, as described previously,
high threshold leading inhibition of periodic excitatory discharge can create PLS. PLS neurons
exhibit suppressed paired-pulse responses at short echo delays (including short echo leads).
For units that do not show evidence of inhibition, their paired-pulse responses are characterized
by simple summation of responses to the individual pulses (Figs. 7C, 10C).
As noted above, temporal combination of excitatory and inhibitory inputs has also been
previously shown to be responsible for sound duration tuning in the IC of big brown bats
(Casseday et al., 1994). Interestingly, during whole-cell patch-clamp recordings (Covey et al.,
1996), other combinations of excitatory and inhibitory effects have been observed but their
functional significances are not clarified. For example, sound-evoked excitatory post-synaptic
currents are often preceded, or followed, by an inhibitory post-synaptic current, or both. Our
present studies suggest that such combinations are useful for construction of PLS as well as
non-PLS with short-burst firing pattern, which in turn produce distinct suppression patterns in
paired-pulse responses.

22
Inferior colliculus versus auditory cortex
In the auditory cortex of the little brown bat, Sullivan (1982b) and later Berkowitz and
Suga (1989) reported that one-half of PLS neurons in the cortex show delay-tuned responses
and that the magnitude of a unit’s PLS is correlated with the unit’s best delay. Surprisingly,
although it was not a major aim of our research, in response to paired tone pulses, PLS neurons
in the bat IC do not exhibit delay-dependent facilitation. Instead, PLS neurons in the IC exhibit
paired-pulse inhibition almost exclusively (Figs. 7A, 10A). There are several plausible
explanations for the disparity in experimental results between the IC and auditory cortex. Fist of
all, there are some differences in the experimental paradigms between the various studies.
Paired pulse stimuli in our experiments involved pure tone pulses presented at unit’s CF,
whereas the earlier studies utilized frequency-modulated (FM) sweeps from 80 to 20 kHz. FM
sounds include both unit’s CF and a wide spectrum of non-CF frequencies. It is possible that
side band inhibition (that has been shown to be evoked by non-CF tones) may be influential
shaping a unit’s pulse-echo response pattern. Future research that compares pulse-echo
response patterns of PLS neurons to CF and FM sounds might clarify this point. Second,
paired-pulse processing in the IC can be basically different from that in the auditory cortex. It is
possible that PLS is first created in the IC to generate delay-dependent inhibition - this can in
theory be used to create delay-dependent facilitation at the levels of the auditory thalamus and
cortex, e.g., by means of disinhibition. In the mustached bat, Portfors and Wenstrup (2001)
showed that the organization of delay-tuned neurons in the IC is different from that in the
auditory cortex. Delay-tuned neurons are topographically organized in the auditory cortex but
not in the IC. These authors suggested that the creation and organization of delay-tuned
neurons occur at different stages in the ascending auditory system.
Behavioral significance of PLS
23
In echolocating bats, the existing evidence suggests that PLS neurons are important for target
ranging. Behaviorally, ranging has been shown to involve analysis of the elapsed time between
bat’s ultrasonic emission and its echo, or echo delay (Simmons, 1973). PLS neurons showing
delay-dependent facilitation (or delay-tuned response), i.e., showing maximal response to a best
delay, are therefore well suited for determining target range (Feng et al., 1978). Indeed, as
described above, one-half of PLS neurons in the auditory cortex give delay-tuned responses
with the unit’s best delay matching the magnitude of a unit’s PLS (Sullivan, 1982b; Berkowitz
and Suga, 1989). To evaluate the role of PLS neurons behaviorally, Denzinger and Schnitzler
(1994) studied the ranging performance of big brown bats at different relative sound levels of
echoes with a fixed difference in target range. They reasoned that if PLS underlies ranging, the
bat’s performance in target ranging would be compromised when the echo level approaches the
sound level of bat’s emitted signal. This is exactly what these authors observed – this result is
consistent with the involvement of PLS in target ranging, although other explanations cannot be
ruled out.
That PLS occurs widely in vertebrates suggests that it must have general relevance for
processing sounds. Indeed, PLS neurons in the IC of bats and frogs display delay-dependent
inhibition in response to pulse-echo pairs. Such inhibition can be used to suppress weak
echoes, allowing animals to extract sound with minimal interference. In bats, delay-dependent
inhibition in the IC may be used to create delay-dependent facilitation in the cortex for the
purpose of target ranging as well as processing of communication sounds (Esser et al., 1997).
In contrast, delay-dependent inhibition may be the final product of signal processing in frogs and
non-echolocating mammals such as gerbils and cats.
In the insect auditory system, Krahe et al. (2002) proposed that PLS neurons might be
involved in transmitting the information on onset steepness, a sound attribute that is important
for sexual recognition. The empirical evidence in support of this hypothesis, however, is lacking.
Nonetheless, the result of this study suggests that the auditory system may utilize PLS for yet a

24
different listening task. Clearly, further studies are necessary to determine the actual functional
significance of PLS for the various non-echolocating animals.
Functional significances of duration-dependent and duration-independent PLS in bats
During echolocation when a bat approaches a target, it systematically adjusts many
different parameters of its ultrasonic cries; it increases the emission rate, and concomitantly
decreases the duration and intensity of its ultrasonic pulses, most notably during the final
approach to an insect prey (Griffin et al., 1960; Schnitzler et al., 1987; Kalko and Schnitzler
1989; Kalko 1995). In the auditory cortex of the little brown bats and mustache bats, there are
two types of delay-sensitive neurons (O’Neill and Suga 1979; 1982; Wong et al., 1992; Tanaka
et al., 1992; Chittajallu et al., 1995;). The first, the more common type (so-called delay-tuned
neurons), is sharply tuned to specific echo delays regardless of the repetition rate and duration
of the stimuli. The second type (so-called tracking neurons) shows changing best delays
according to the repetition rate and duration of sound pulses. With increasing pulse repetition
rate or decreasing sound duration, these neurons shift their best delays to smaller values. It has
been hypothesized that delay-tuned neurons presumably respond only to echoes when the
target is at a particular target distance (corresponding to the best delay), and are thus activated
over a limited period during a target pursuit, with different neurons activated during different
periods. In contrast, “tracking neurons” would be activated during the entire period of target
pursuit, regardless of the target distance (O’Neill and Suga 1979).
The present findings from the bat IC provide additional support for the above hypothesis.
In response to sounds having different durations we found two different populations of PLS
neurons. Over one-half of PLS neurons (58%) show duration-independent PLS and the
remainder of PLS neurons (42%) exhibit a greater shift with an increase in sound duration.
Neurons exhibiting duration-independent PLS are useful for constructing delay-tuned
25
responses, neurons showing duration-dependent PLS can be used to construct tracking
neurons.
Acknowledgments:
We thank Jeffrey Wenstrup and two anonymous referees for their valuable comments on earlier
versions of this manuscript. This work was supported by a grant R01DC04998 from the
National Institute on Deafness and Other Communication Disorders of the NIH.

26
References
Aitkin LM and Dunlop CW. Interplay of excitation and inhibition in the cat medial geniculate
body. J Neurophysiol 31: 44-61, 1968.
Aitkin LM, Anderson DJ, and Brugge JF. Tonotopic organization and discharge characteristics
of single neurons in nuclei of the lateral lemniscus of the cat. J Neurophysiol 33, 421-440,
1970.
Berkowitz A and Suga N. Neural mechanisms of ranging are different in two species of bats.
Hear Res 41: 255-264, 1989.
Bodenhamer RD and Pollak GD. Time and frequency domain processing in the inferior
colliculus of echolocating bats. Hear Res 5: 317-335, 1981.
Brugge JF, Dubrovsky NA, Aitkin LM, and Anderson DJ. Sensitivity of single neurons in auditory
cortex of cat to binaural tonal stimulation; effects of varying interaural time and intensity. J
Neurophysiol 32: 1005-1024, 1969.
Casseday JH, Ehrlich D, and Covey E. Neural tuning for sound duration: role of inhibitory
mechanisms in the inferior colliculus. Science 264: 847-850, 1994.
Chittajallu SK, Palakal MJ, and Wong D. Analysis and classification of delay-sensitive cortical
neurons based on response to temporal parameters in echolocation signals. Hear Res
84:157-166, 1995.
Condon CJ, White KR, and Feng AS. Processing of amplitude-modulated signals that mimic
echoes from fluttering targets in the inferior colliculus of the little brown bat, Myotis lucifugus.
J Neurophysiol 71: 768-84, 1994.
Covey E. Response properties of single units in the dorsal nucleus of the lateral lemniscus and
paralemniscal zone of an echolocating bat. J Neurophysiol 69: 842-859, 1993.
Covey E, Kauer JA, and Casseday JH. Whole-cell patch-clamp recording reveals subthreshold
sound-evoked postsynaptic currents in the inferior colliculus of awake bats. J Neurosci 16:
3009-3018, 1996.

27
Covey E and Casseday JH. Timing in the auditory system of the bat. Annu Rev Physiol 61:
457-476, 1999.
Deatherage BH, Eldredge DH, and Davis H. Latency of action potentials in the cochlea of the
guinea pig. J Acoust Soc Am 31: 479-486, 1959.
Denzinger A and Schnitzler HU. Echo SPL influences the ranging performance of the big brown
bat, Eptesicus fuscus. J Comp Physiol [A] 175: 563-571, 1994.
Endepols H, Walkowiak W, and Luksch H. Chemoarchitecture of the anuran auditory midbrain.
Brain Res Rev 33: 179-198, 2000.
Esser KH, Condon CJ, Suga N, Kanwal JS. Syntax processing by auditory cortical neurons in
the FM-FM area of the mustached bat Pteronotus parnellii. Proc Natl Acad Sci 94: 14019-
14024, 1997.
Faure PA, Fremouw T, Casseday JH, and Covey E. Temporal masking reveals properties of
sound-evoked inhibition in duration-tuned neurons of the inferior colliculus. J Neurosci 23:
3052-3065, 2003.
Feng AS, Simmons JA, and Kick SA. Echo detection and target-ranging neurons in the auditory
system of the bat Eptesicus fuscus. Science 202: 645-648, 1978.
Feng AS and Lin WY. Differential innervation patterns of three divisions of frog auditory
midbrain (torus semicircularis). J Comp Neurol 306: 613-30, 1991.
Fitzpatrick DC, Kanwal JS, Butman JA, Suga N. Combination-sensitive neurons in the primary
auditory cortex of the mustached bat. J Neurosci 13: 931-940, 1993.
Galazyuk AV, Llano D, and Feng AS. Temporal dynamics of acoustic stimuli enhance
amplitude tuning of inferior collicular neurons. J Neurophysiol 83: 128-138, 2000.
Galazyuk AV and Feng AS. Oscillation may play a role in time domain central auditory
processing. J Neurosci 21: RC147, 2001.
Goldberg JM and Brownell WE. Discharge characteristics of neurons in anteroventral and dorsal
cochlear nuclei of cat. Brain Res 64: 35-54, 1973.

28
Griffin DR , Webster FA , and Michael CR. The echolocation of flying insects by bats. Anim
Behav 8: 141-154, 1960.
Haplea S, Covey E, and Casseday JH. Frequency tuning and response latencies at three levels
in the brainstem of the echolocating bat, Eptesicus fuscus. J Comp Physiol A 174: 671-683,
1994.
Havey DC and Caspary DM. A simple technique for constructing `piggy-back' multibarrel
microelectrodes. Electroencephalogr Clin Neurophysiol 48: 249-251, 1980.
He J. OFF responses in the auditory thalamus of the guinea pig. J Neurophysiol 88: 2377-2386,
2002.
Heil P. Auditory cortical onset responses revisited. I. First spike timing. J Neurophysiol 77: 2616-
2641, 1997a.
Heil P. Auditory cortical onset responses revisited. II. Response strength. J Neurophysiol 77:
2642-2660, 1997b.
Heil P. Further observations on the threshold model of latency for auditory neurons [comment].
Behav Brain Res 95: 233-236, 1998.
Heil P and Irvine DR. On determinants of first-spike latency in auditory cortex. NeuroReport 7:
3073-3076, 1996.
Heil P and Irvine DR. First-spike timing of auditory-nerve fibers and comparison with auditory
cortex. J Neurophysiol 78: 2438-2454, 1997.
Heil P and Irvine DR. The posterior field P of cat auditory cortex: coding of envelope transients.
Cereb Cortex 8: 125-141, 1998.
Hind JE, Goldberg JM, Greenwood DD, and Rose JE. Some discharge characteristics of single
neurons in the inferior colliculus of the cat. II. Timing of the discharges and observations on
binaural stimulation. J Neurophysiol 26: 321-341, 1963.

29
Irvine DR and Gago G. Binaural interaction in high-frequency neurons in inferior colliculus of
the cat: effects of variations in sound pressure level on sensitivity to interaural intensity
differences. J Neurophysiol 63: 570-591, 1990.
Kalko E. Insect pursuit, prey capture, and echolocation in pipistrelle bats. Anim Behav 50: 861-
880, 1995.
Kalko EV and Schnitzler H-U. The echolocation and hunting behavior of Daubenton's bat,
Myotis daubentoni. Behav Ecol Sociobiol 24: 225-238, 1989.
Kitzes LM, Gibson MM, Rose JE, and Hind JE. Initial discharge latency and threshold
considerations for some neurons in cochlear nuclear complex of the cat. J Neurophysiol 41:
1165-1182, 1978.
Klug A, Khan A, Burger RM, Bauer EE, Hurley LM, Yang L, Grothe B, Halvorsen MB, and Park
TJ. Latency as a function of intensity in auditory neurons: influences of central processing.
Hear Res 148: 107-123, 2000.
Krahe R, Budinger E, and Ronacher B. Coding of a sexually dimorphic song feature by auditory
interneurons of grasshoppers: the role of leading inhibition. J Comp Physiol A 187: 977-985,
2002.
Lin WY and Feng AS. GABA is involved in spatial unmasking in the frog auditory midbrain. J
Neurosci 23: 8143-8151, 2003.
Miller AR. Latency of unit responses in cochlear nucleus determined in two different ways. J
Neurophysiol 38: 812-821, 1975.
Mittmann DH and Wenstrup JJ. Combination-sensitive neurons in the inferior colliculus. Hear
Res 90: 185-191, 1995.
Oertel D.The role of timing in the brain stem auditory nuclei of vertebrates. Annu Rev Physiol
61: 497-519, 1999.
O'Neill WE. The bat auditory cortex. In: Hearing by bats, edited by Popper AN, Fay RR, pp 416-
498. New York: Springer, 1995.

30
O'Neill WE and Suga N. Target range-sensitive neurons in the auditory cortex of the mustache
bat. Science 203: 69-73, 1979.
O'Neill WE and Suga N. Encoding of target range and its representation in the auditory cortex of
the mustached bat. J Neurosci 2: 17-31, 1982.
Olsen JF and Suga N. Combination-sensitive neurons in the medial geniculate body of the
mustached bat: encoding of relative velocity information. J Neurophysiol 65: 1254-1274,
1991a.
Olsen JF and Suga N. Combination-sensitive neurons in the medial geniculate body of the
mustached bat: encoding of target range information. J Neurophysiol 65: 1275-1296,
1991b.
Park TJ and Pollak G. GABA shapes a topographic organization of response latency in the
mustache bat's inferior colliculus. J Neurosci 13: 5172-5187, 1993.
Portfors CV and Wenstrup JJ. Topographical distribution of delay-tuned responses in the
mustached bat inferior colliculus. Hear Res 151: 95-105, 2001.
Rhode WS and Greenberg S. Physiology of the cochlear nuclei. In: The mammalian auditory
pathway: neurophysiology, edited by Popper AN, Fay RR, pp 94-152. New York: Springer,
1992.
Rose JE, Galambos R, and Hughes JR. Microelectrode studies of the cochlear nuclei of the cat.
Bull Johns Hopkins Hosp 104: 211-251, 1959.
Rose JE, Greenwood DD, Goldberg JM, and Hind JE. Some discharge characteristics of single
neurons in the inferior colliculus of the cat. I. Tonotopical organization, relation of spike-
counts to tone intensity, and firing patterns of single elements. J Neurophysiol 26: 294-320,
1963.
Sanes DH and Rubel EW. The ontogeny of inhibition and excitation in the gerbil lateral superior
olive. J Neurosci 8: 682-700, 1988.

31
Schnitzler HU, Kalko E, Miller L, and Surlykke A. The echolocation and hunting behavior of the
bat, Pipistrellus kuhli. J Comp Physiol A 161: 267-274, 1987.
Simmons JA. The resolution of target range by echolocating bats. J Acoust Soc Am 54:157-173,
1973.
Suga N. Echo-ranging neurons in the inferior colliculus of bats. Science 170: 449-452, 1970.
Suga N, O'Neill WE, Kujirai K, Manabe T. Specificity of combination-sensitive neurons for
processing of complex biosonar signals in auditory cortex of the mustached bat. J
Neurophysiol 49: 1573-1626, 1983.
Sullivan WE. Neural representation of target distance in auditory cortex of the echolocating bat
Myotis lucifugus. J Neurophysiol 48: 1011-1032, 1982a.
Sullivan WE. Possible neural mechanisms of target distance coding in auditory system of the
echolocating bat, Myotis lucifugus. J Neurophysiol 48: 1033-1047, 1982b.
Tanaka H, Wong D, and Taniguchi I. The influence of stimulus duration on the delay tuning of
cortical neurons in the FM bat, Myotis lucifugus. J Comp Physiol A 171: 29-40, 1992.
Volkov IO and Galazjuk AV. Formation of spike response to sound tones in cat auditory cortex
neurons: interaction of excitatory and inhibitory effects. Neuroscience 43: 307-321, 1991.
Wong D, Maekawa M, and Tanaka H. The effect of pulse repetition rate on the delay sensitivity
of neurons in the auditory cortex of the FM bat, Myotis lucifugus. J Comp Physiol A 170:
393-402, 1992.

32
Figure 1.
0 2 4 6 8 10
0
20S
pike
s/B
in
Inter-Spike Interval (ms)
Median =4.8 ms
Median =1.9 ms
0
250
Spi
kes/
Bin
unit# GGF6
unit#GK12
(A)
10
90
• ••• •• •• •• •••• ••• • •• • •••••••• •• •••• •••••• •••• •••• ••••••••••
•• •••••• ••••• •••• •• ••• •• ••• ••• ••• ••• •• •• ••• •• •• •• •• •• •• •• •• •• •• •• •• ••• • ••• • ••• •• ••• •• ••• •• •• •• • •• •• •• •• •• ••• •••• ••••• •• •• •• •• •••• ••• ••• • •• • •••• •••• • •• •• ••• •••• • •• •• •• • •• •••• • •• •• • •• • •• •• • • •• • •• •• •• •• • •• •• •• •• •• •• •• • •• • •• •• • • •• •• •• • • • •• • •• • • •• • • • •• •• • • •• ••• • •• •• • • •• • •• • •• •• • • •• • • •• • •• •• •• ••
0 10 20 30
dB S
PL
Time (ms)
0 2 4 6 8 10 120
14
# of
Uni
ts
Median of Inter-Spike Interval (ms)
• • • • •• •• • •• •• • ••• •• ••• •• •• • • •• • ••• •• • •• • • •• • • • •• • • •• • •• • • •• • • • •• • • •• • • •• • •• • •• • • • • •• • • • •• • • •• • • • •• • • •• • • •• • • •• • • •• • •• • •• • • •• • • •• • • • •• • •• • • •• • • • •• • • •• • •• • • •• • • • •• • • • •• • • • •• • • • •• • • •• • • •• • • •• • • •• • • • •• • • • •• • • •• • • •• • • •• • • •• • • • •• • • •• • • •• • • •• • • •• • • • • •• • • • •• • • •• • • • •• • • • •• • • •• • • •• • •• • • •• • • •• • • • •• • • • •• • • • •• • • •• • • •• • • •• • • •• • • •• • • •• • • •• • • • •• • • •• • • • •• • • •• • • • •• • • •• • • • •• • • • •• • • •• • • • •• • • • •• • • •• • • • •• • • • •• •• • • •• • • •• • • •• • • •• • • •• • • • •• • • •• • • •• • • •• • • •• • • •• • • •• • • •• • • •• • • •• • • • •• • • • •• • • •• • • •• • • • •• • • • •• • • •• • • • •• • • •• • • •• • • • •• • • • •• • • •• • • •• • • •• • • • •• • • •• • • • •• • • • •• • • • •• • • • •• • • • •• • • •• • • •• • • • • • •• • • • •• • • • •• • • •• • • • • •• • • • •• • • • •• • •• • • • •• • • •• • • • •• • • • •• • • • •• • • • •• • • •• • • •• • • • •• • • • •• • • • •• • • • ••• • • • •• • • • •• • • • •• • • • •• • • • •• • • • •• • • • •• • • • • •• • • • •• • • • • •• • • • • •• • • • • •• • • • •• • • • •• • • • •• • • • •• • • • •• • • • •• • • • •• • • • • •• • • • •• • • • •• • • • • •• • • • •• • • • •• • • • •
dB S
PL
10
90
(B)
(C) (D)
(E)

33
Figure 2.
0 2 4 6 8 100
150
Inter-Spike Interval (ms)
0
150
unit# GGGY4
••••••••••••••••••••••• •• •• • •• •• •• •• •• ••• •• • •• •• • •• • •• • •• • ••• • •• •• •• • •• • • •• • •• • •• • •• • •• •• •• •• • •• • •• • •• • •• •• • •• • •• • •• • •• • •• • •• • •• • •• • •• • •• • •• • •• •• •• •• •• • •• • •• •• • •• • •• • •• •• • •• • •• • •• • •• •• • •• • •• • •• •• • •• • •• • •• •• •• •• •• • •• • •• • •• • •• • •• • •• • •• • •• •• • •• •• • •• • •• • •• •• •• •• • •• • •• •• • •• • •• • •• • •• •• • •• •• •• •• • •• • •• •• • •• •• •• •• •• •• • •• • •• • •• • •• •• •• •• • •• •• •• • •• • •• • •• •• •• • •• • •• •• •• •• •• • •• •• • •• • •• •• •• •
dB S
PL
•••••••••••• •• •• •••• •• •• •• •• •• •• ••••• ••• •• ••• •• • •• •• •• ••• • •• •• •• •• • •• • •• • • •• • •• • • •• • •• • •• • •• • •• •• • •• • •• • •• • •• •• •• •• •• • •• •• • •• •• • •• •• • •• • •• • •• •• •• •• •• •• •• • •• • •• •• •• • •• • •• • •• •• • •• • •• • •• • •• •• • •• • •• • •• •• •• • •• •• •• • •• • •• • •• •• • •• •• • •• • •• •• • •• • •• • •• •• •• •• • •• • •• •• •• •• •• • •• •• • •• • •• •• • •• • •• • •• • •• •• •• •• • •• •• •• • •• •• • •• • •• •• • •• •• • •• • •• •• •• •• • •• • •• • •• •• • •• • •• • •• •• • •• • •• • •• •• •
0 10 20 30
Time (ms)
•
••••
•••
••••••
••••••••••••••
•••••••••••••••••••••••••
•••
•••••
••••••••••••••••••••••
•
•
•
•••••••••
••••••
•••••••••••
•
••••••
•
••
••
•
•••••
••
•
••••••
•
••••
••
•
••
•••
•••
••
•
•••••••
••••••••••••••
•
••••••••••••••••••••••••
•••••••••••••••••
•
••
•
•••
•
•••••••••••••••
•••
•
•
••••••
••
••
•••
•
•
•
••
•
••
•
••
•
•
•
•
•
••
•
•••
•••••••••
•
•
•
••
•
•
•••••
•
•••••
••
••
•••
•
•••
0
150
•••
•
••••
••••••••••
••••
•
•
•••••••
••••••••••••••
•
••••••••••••••••••••••••••
••••••••••••••••••••••
•••
•••
••••••••
•••
••••
••
•
••••••
•
•••••••
••
•
•
••
•••••••••
•
•
•••••
•
•••••••••••••••••••••
•
•
•••
•••••
•••••••
••
••••
••••••••••
•••••••••••
•
••••••••••••••••••••
••••••••••••••••••
•
••
•
•
•
•
•
•••
•
••••
•••
••
•
•
•
•
••
•
•
••
•
•
••••
••••••
•
•
••••
••••
•
•••
••••••
•••
•
••
•
••••••••
••
•
••
•
(A)
0
150
Spi
kes/
Bin
10
90
10
90
10
90
10
90
0 2 4 6 8 100
700
Inter-Spike Interval (ms)
0
700
unit# GGG19
• ••• ••• • •• • • •• • • •• • •• • • • • • •• • • • •• • • •• •• • • • •• •• • • • • •• • • • • •• • • •• • • • •• • • •• • • • •• • • •• • • • • •• • • • • •• • • •• • • •• •• • • •• • • • •• • • • • • •• • • • • • •• • • • • • •• • • • • •• • • • • •• • • • • • •• • • • • •• • • • • • • •• • • • • • • •• • • • • • • •• • • • • • • • •• • • • • • • •• • • • • • • •• • • • • • • • • •• • • • • • • •• • • • • • •• • • • • • • •• • • • • • • •• • • • • • • •• • • • • • • • •• • • • • • • • •• • • • • • • •• • • • • • •• • • • • • • •• • • • • • • •• • • • • •• • • • • • • •• • • • • • • •• • • • • • • • •• • • • • • • • •• • • • • • • • •• • • • • • • • •• • • • • • • • •• • • • • • • • •• • • • • • • • •• • • • • • • • • •• • • • • • • •• • • • • • • • •• • • • • • • • •• • • • • • • • •• • • • • • • •• • • • • • • • •• • • • • • • • •• • • • • • • •• • • • • • • • •• • • • • • • •• • • • • • • •• • • • • • • • • • •• • • • • • • • •• • • • • • • • • • •• • • • • • • • • •• • • • • • • • • •• • • • • • • • • •• • • • • • • • • • •• • • • • • • • • • •• • • • • • • • •• • • • • • • • •• • • • • • • • •• • • • • • • • • • • •• • • • • • • • • •• • • • • • • • • •• • • • • • • • • •• • • • • • • • • • •• • • • • • • • • • •• • • • • • • • • •• • • • • • • • • • • •• • • • • • • • • •• • • • • • • • •• • • • • • • • • • • •• • • • • • • • • •• • • • • • • • • • •• • • • • • • • • •• • • • • • • • • •• • • • • • • • • •• • • • • • • • • •• • • • • • • • • • •• • • • • • • • • • •• • • • • • • • •• • • • • • • • •• • • • • • • • • • •• • • • • • • • • •• • • • • • • • • •• • • • • • • • • •• • • • • • • • • •• • • • • • • • •• • • • • • • • • •• • • • • • • • • • •• • • • • • • • •• • • • • • • • • •• • • • • • • • • • •• • • • • • • • • •• • • • • • • • • •• • • • • • • • • •• • • • • • • • • •• • • • • • • • • •• • • • • • • • • •• • • • • • • • •• • • • • • • • •• • • • • • • • • • •• • • • • • • • • • •• • • • • • • • •• • • • • • • • • •• • • • • • • • •• • • • • • • • • • •• • • • • • • • • • • •• • • • • • • • • •• • • • • • • • • •• • • • • • • • • • •• • • • • • • • • • •• • • • • • • • • • •• • • • • • • • • •• • • • • • • • • • • •• • • • • • • • • •• • • • • • • • • •• • • • • • • • •• • • • • • • • • •• • • • • • • • • • • •• • • • • • • • • • •• • • • • • • • • • •• • • • • • • • • •• • • • • • • • • • • •• • • • • • • • • •• • • • • • • • • •• • • • • • • • • • • •• • • • • • • • • • •• • • • • • • • • • • •• • • • • • • • • •• • • • • • • • • •• • • • • • • • • • • •• • • • • • • • • • •• • • • • • • • • •• • • • • • • • • • •• • • • • • • • • • • •• • • • • • • • • • •• • • • • • • • • • •• • • • • • • • • • •• • • • • • • • • • •• • • • • • • • • • •• • • • • • • • • • •• • • • • • • • • • •• • • • • • • • • •• • • • • • • • • • •• • • • • • • • • •• • • • • • • • • • •• • • • • • • • • •• • • • • • • • • • •• • • • • • • • • •• • • • • • • • • • •• • • • • • • • • •• • • • • • • • • • •• • • • • • • • • • •• • • • • • • • • • •• • • • • • • • • • •• • • • • • • • • • •• • • • • • • • • • •• • • • • • • • • • •• • • • • • • • • • • • •• • • • • • • • • • •• • • • • • • • • • •• • • • • • • • • • • •• • • • • • • • • •• • • • • • • • • • •• • • • • • • • • • •• • • • • • • • • • • •• • • • • • • • • •• • • • • • • • • •• • • • • • • • • • • •• • • • • • • • • • • •
dB S
PL
•• • •• • • • • •••• • • •• • ••• • • •• • • • • • •• • • • • • •• • • • • • • •• • • • • • • • •• • • • • • • •• • • • •• • • • •• • • • • •• • • • • • • •• • • • • • • •• • • •• • • • • • • •• • • • • • • •• • • • • • • •• • • • • •• • • • • • • • •• • • • •• • • • •• • • • • • • •• • • • • • • •• • • • • • • • • •• • • • • • • • • •• • • • • • • •• • • • • • • •• • • • • • •• • • • • • •• • • • • • • •• • • • • • • •• • • • • • • • • •• • • • • • • •• • • • • • • • •• • • • • • • • •• • • • • • • • •• • • • • • • • • •• • • • • • • • •• • • • • • • • •• • • • • • • • •• • • • • • • • •• • • • • • • • •• • • • • • • •• • • • • • • • •• • • • • • • • •• • • • • • • • • •• • • • • • • • •• • • • • • • • •• • • • • • • • •• • • • • • • • • •• • • • • • • • •• • • • • • • • • • • •• • • • • • • •• • • • • • • • •• • • • • • • • •• • • • • • • • •• • • • • • • • • • • •• • • • • • • • •• • • • • • • • •• • • • • • • • • •• • • • • • • • •• • • • • • • • •• • • • • • • • • •• • • • • • • • • •• • • • • • • • • •• • • • • • • • • •• • • • • • • • • • • •• • • • • • • • • •• • • • • • • • • • •• • • • • • • • • • •• • • • • • • • • •• • • • • • • • • • •• • • • • • • • • • •• • • • • • • • • •• • • • • • • • • • • •• • • • • • • • • • •• • • • • • • • • • •• • • • • • • • • •• • • • • • • • •• • • • • • • • • • •• • • • • • • • • •• • • • • • • • • • •• • • • • • • • • • •• • • • • • • • • •• • • • • • • • • • • •• • • • • • • • • • •• • • • • • • • • •• • • • • • • • • • •• • • • • • • • • • •• • • • • • • • • • •• • • • • • • • • • •• • • • • • • • • • •• • • • • • • • • • •• • • • • • • • • • • •• • • • • • • • • • •• • • • • • • • • • •• • • • • • • • • • •• • • • • • • • • •• • • • • • • • • • • •• • • • • • • • • • • •• • • • • • • • • • •• • • • • • • • • • •• • • • • • • • • • • • •• • • • • • • • • • •• • • • • • • • • • •• • • • • • • • • • •• • • • • • • • • •• • • • • • • • • • •• • • • • • • • • • • •• • • • • • • • • • • •• • • • • • • • • • •• • • • • • • • • • •• • • • • • • • • • •• • • • • • • • • • • •• • • • • • • • • • •• • • • • • • • • • • • •• • • • • • • • • • • •• • • • • • • • • • •• • • • • • • • • • •• • • • • • • • • • •• • • • • • • • • • •• • • • • • • • • • •• • • • • • • • • • •• • • • • • • • • • •• • • • • • • • • • • •• • • • • • • • • • •• • • • • • • • • • • •• • • • • • • • • • • •• • • • • • • • • • •• • • • • • • • • •• • • • • • • • • • •• • • • • • • • • • •• • • • • • • • • • • •• • • • • • • • • • • •• • • • • • • • • • • •• • • • • • • • • • • • • •• • • • • • • • • • •• • • • • • • • • • • •• • • • • • • • • • •• • • • • • • • • • • •• • • • • • • • • • •• • • • • • • • • • • •• • • • • • • • • • •• • • • • • • • • • •• • • • • • • • • •• • • • • • • • • • •• • • • • • • • • • • • •• • • • • • • • • • •• • • • • • • • • • • •• • • • • • • • • • • •• • • • • • • • • • • •• • • • • • • • • • • •• • • • • • • • • • •• • • • • • • • • • •• • • • • • • • • • • •• • • • • • • • • • •• • • • • • • • • • • • •• • • • • • • • • • • •• • • • • • • • • • • •• • • • • • • • • • • •• • • • • • • • • • • •• • • • • • • • • • • •• • • • • • • • • • •• • • • • • • • • • • •• • • • • • • • • • • •• • • • • • • • • • •• • • • • • • • • • • •• • • • • • • • • • •• • • • • • • • • • • •• • • • • • • • • • • • •• • • • • • • • • • • •• • • • • • • • • • • •• • • • • • • • • • •• • • • • • • • • • •• • • • • • • • • • •• • • • • • • • • • • •• • • • • • • • • • • •• • • • • • • • • • • •• • • • • • • • • • • •• • • • • • • • • • • • •• • • • • • • • • • •• • • • • • • • • • •• • • • • • • • • • •• • • • • • • • • • •• • • • • • • • • • • • •• • • • • • • • • • • • •• • • • • • • • • • • •• • • • • • • • • •• • • • • • • • • • • • •• • • • • • • • • • • •• • • • • • • • • • • • •• • • • • • • • • • • •• • • • • • • • • • •
0 10 20 30
Time (ms)
•• •• ••• • • • • • • ••• •• ••• • •• • •• • ••• • •• • • •• • •• •• • •• • • •• • • • •• • • •• • • • • • • •• • •• • • •• • • •• • •• • • • •• • • • •• • • • •• • • • • •• • • • • •• • • • •• • • • • • •• • • • •• • • • •• • • •• • • • • • •• • • •• • • • • • •• • • • • •• • • • • •• • • • • •• • • • • •• • • • •• • • • • •• • • • • •• • • • • • • • •• • • •• • • • •• • • • • • •• • • • • • •• • • • • •• • • • • • •• • • • • •• • • • • •• • • • • •• • • • • • •• • •• • • • • •• • • • • • •• • • • • • •• • • • • • • •• • • • • •• • • • • •• • • • • • • • • •• • • • • • •• • • • • • •• • • • • •• • • • • • •• • • • • •• • • • • • • •• • • • • • • •• • • • • • •• • • • • • •• • • • • • •• • • • • • •• • • • • • • •• • • • • • •• • • • • •• • • • • • • •• • • • • • •• • • • • • • •• • • • • • •• • • • • • • • •• • • • • • • •• • • • • • • • •• • • • • • •• • • • • •• • • • • • •• • • • • • • •• • • • •• • • • • • • •• • • • • • •• • • • • • •• • • • • • •• • • • • • • •• • • • • • • • •• • • • • • • •• • • • • • • •• • • • • • •• • • • • • • •• • • • • • •• • • • • • • • •• • • • • • • • •• • • • • • • •• • • • • • • • •• • • • • • • • •• • • • • • • • •• • • • • • •• • • • • • • • •• • • • • • • •• • • • • • • • •• • • • • • • • •• • • • • • •• • • • • • •• • • • • • •• • • • • • •• • • • • • •• • • • • • •• • • • • • • •• • • • • • • • •• • • • • • •• • • • • • • • •• • • • • • • • •• • • • • • • •• • • • • • • • •• • • • • • • • •• • • • • • • • • •• • • • • • • • •• • • • • • • • • •• • • • • • • • • •• • • • • • • •• • • • • • • • •• • • • • • • • •• • • • • • • • •• • • • • • • • •• • • • • • • •• • • • • • • • • • •• • • • • • • •• • • • • • • •• • • • • • •• • • • • • • •• • • • • • • •• • • • • • • • •• • • • • • • •• • • • • • • • •• • • • • • • • •• • • • • • • • •• • • • • • • •• • • • • • • •• • • • • • • •• • • • • • •• • • • • • • •• • • • • • • • •• • • • • • • • •• • • • • • • • • • •• • • • • • • •• • • • • • • • •• • • • • • • • •• • • • • • • • •• • • • • • •• • • • • • • • •• • • • • • • • •• • • • • • • •• • • • • • • • • • •• • • • • • • •• • • • • • • • •• • • • • • • • • •• • • • • • • • •• • • • • • • •• • • • • • • • •• • • • • • • • • •• • • • • • • • • •• • • • • • • •• • • • • • • • •• • • • • • • • •• • • • • • • • •• • • • • • •• • • • • • • • • •• • • • • • • • •• • • • • • • • •• • • • • • • • •• • • • • • • •• • • • • • • • •• • • • • • • •• • • • • • • •
0
700
• •• •• • •• •• • • • • •• •• • • • •• • • • •• • • •• • • • • • •• • • •• • • • • •• • • • • •• • • •• • • • • •• • • •• • • • •• • •• • • • •• • • • •• • • • •• • •• • • •• • • • • • •• • • •• • •• • • • •• • • • • • •• • • • • •• • • • • •• • • • •• • • • •• • • • • •• • • • • •• • • • •• • • • • • •• • • • • • •• • • • • • •• • • • • •• • • • • • •• • • • • • • •• • • • • • • •• • • • • •• • • • • •• • • • • • • •• • • • • • •• • • • • •• • • • • •• • • • • • •• • • • • •• • • • • • •• • • • • • •• • • • •• • • • • • • •• • • • • • • •• • • • • • •• • • • • • •• • • • • • • •• • • • • •• • • • • • •• • • • • • •• • • • • • • •• • • • • • • •• • • • • • •• • • • • • •• • • • • • •• • • • • • •• • • • • • • • •• • • • • • • •• • • • • • •• • • • • • •• • • • • • •• • • • • • • •• • • • • • • • • •• • • • • • • •• • • • • • • •• • • • • • • •• • • • • • • •• • • • • • • • •• • • • • • • • •• • • • • • • •• • • • • • • • •• • • • • • • • •• • • • • • • •• • • • • • • • •• • • • • • • • •• • • • • • • • •• • • • • • • • •• • • • • • • • •• • • • • • • • •• • • • • • • • •• • • • • • • • •• • • • • • • • •• • • • • • • • •• • • • • • • •• • • • • • • • •• • • • • • • • • •• • • • • • • • • •• • • • • • • • •• • • • • • • • •• • • • • • • • •• • • • • • • • •• • • • • • • • •• • • • • • • •• • • • • • • • • •• • • • • • • • •• • • • • • • • •• • • • • • • •• • • • • • • • •• • • • • • • • •• • • • • • • • • •• • • • • • • • • •• • • • • • • • • •• • • • • • • • •• • • • • • • •• • • • • • • • • •• • • • • • • • •• • • • • • • • • •• • • • • • • •• • • • • • • •• • • • • • • •• • • • • • • • •• • • • • • • • •• • • • • • • • •• • • • • • • • •• • • • • • • • •• • • • • • • • •• • • • • • • • •• • • • • • • • •• • • • • • • • •• • • • • • • • •• • • • • • • • • •• • • • • • • • •• • • • • • • • • •• • • • • • • • • •• • • • • • • •• • • • • • • • • • •• • • • • • • • • •• • • • • • • • • •• • • • • • • • •• • • • • • • • •• • • • • • • • •• • • • • • • • • •• • • • • • • •• • • • • • • • •• • • • • • • • • •• • • • • • • • •• • • • • • • • • •• • • • • • • • • •• • • • • • • • • •• • • • • • • • •• • • • • • • • •• • • • • • • • • • •• • • • • • • • •• • • • • • • • •• • • • • • • • • •• • • • • • • • •• • • • • • • • • •• • • • • • • • • •• • • • • • • • • • •• • • • • • • • • •• • • • • • • • • •• • • • • • • • • •• • • • • • • • • •• • • • • • • • •• • • • • • • • • •• • • • • • • • •• • • • • • • • • •• • • • • • • • • •• • • • • • • • •• • • • • • • • •• • • • • • • • • • •• • • • • • • • •• • • • • • • • • •• • • • • • • • •• • • • • • • • • •• • • • • • • • • • •• • • • • • • • • • •• • • • • • • • • •• • • • • • • • • •• • • • • • • • • • •• • • • • • • • • •• • • • • • • • • •• • • • • • • • • • •• • • • • • • • • •• • • • • • • • • •• • • • • • • • • • •• • • • • • • • • • •• • • • • • • • • •• • • • • • • • • • •• • • • • • • • •• • • • • • • • • •• • • • • • • • • • • •• • • • • • • • • • •
0
700
Spi
kes/
Bin
10
90
10
90
10
90
10
90
(C) (D)(B)
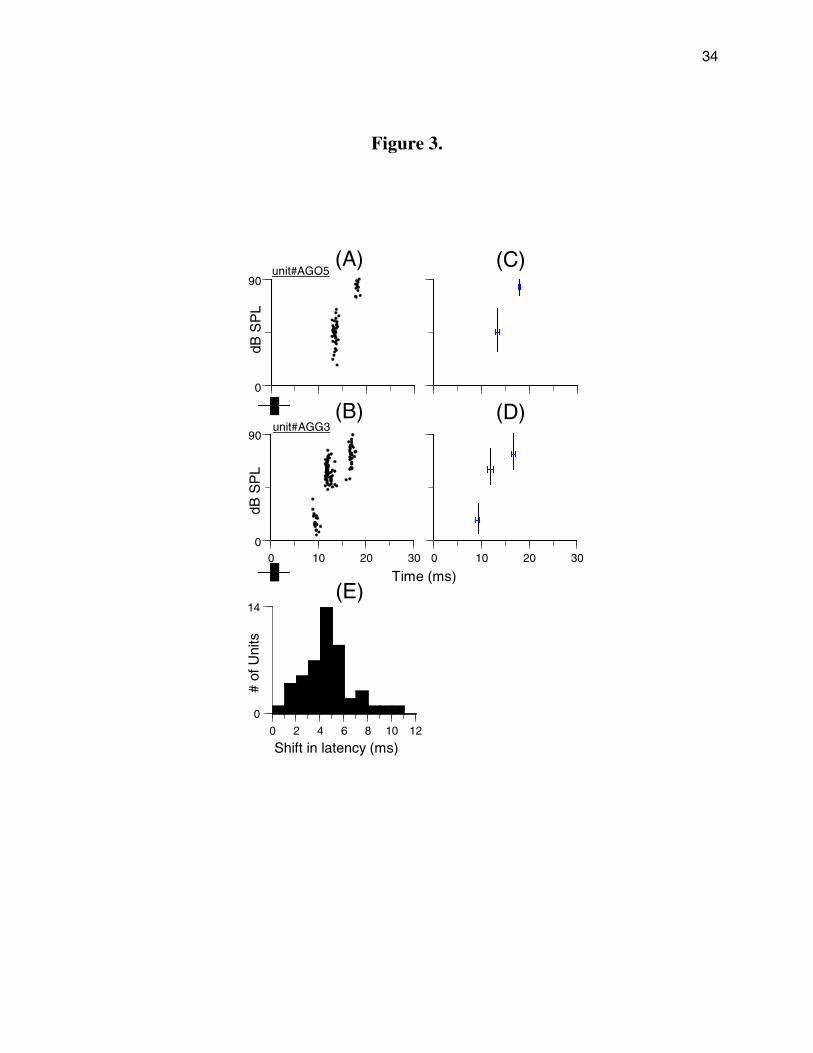
34
Figure 3.
(C)(A)
(B)
0
90unit#AGG3
unit#AGO5
(D)
0 2 4 6 8 10 12
0
14
# of
Uni
ts
Shift in latency (ms)
(E)
0 10 20 30
dB S
PL
Time (ms)
dB S
PL
0 10 20 30
0
90
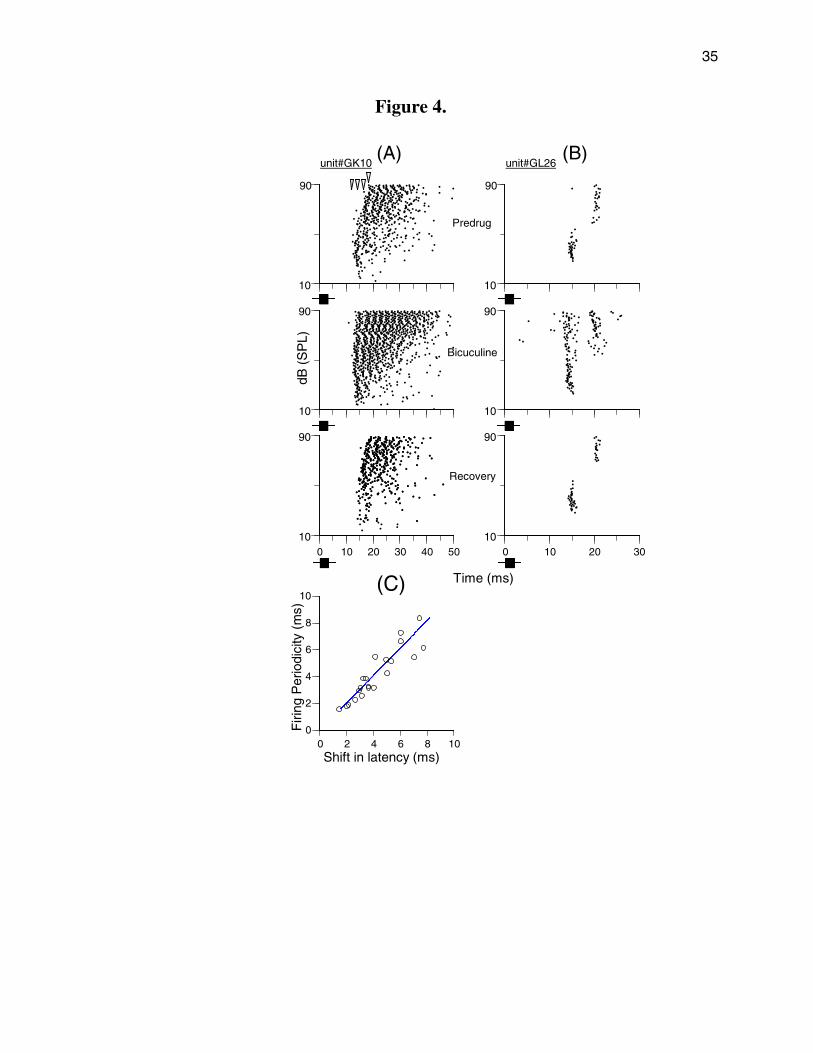
35
Figure 4.
Predrug
Bicuculine
Recovery
unit#GK10
•• •• •••• •••• ••• • • •• • •• •• • • •• • • •••• ••• •• • •• • ••• ••• •• •• • ••• • •• • •• • •• • •• • •• •• • ••• • • •• • •• •• • • •• •• • •• •• • •• •• • •• • • • •• • • •• • • •• • •• • • •• • • •• • •• • • •• • • •• • • • •• • • • • •• • • •• •• • • • • •• • • • •• • • •• • • •• • • •• • • • •• • •• • • • • •• • • • • • •• • • •• •• • • • • •• • • • • •• • • • • •• • • • • •• • • • •• • • • •• • • • •• • • • • •• • • • • • •• • • • • •• • • • • •• • • • • • •• • • • •• • • • • • •• • • • • • •• • • • • •• • • • • • • •• • • • • • •• • • • • • •• • • • • •• • • • • • • •• • • • • •• • • • • •• • • •• • • • • • •• • • • • • •• • • • • •• • • • • • •• • • • • • • • •• • • • • • •• • • • • • •• • • • • •• • • • • • •• • • • • • • •• • • • • • •• • • • • • •• • • • • • • • • •• • • • • • • • •• • • • • • • • •• • • • • • • • •• • • • • • •• • • • • •• • • • • • •• • • • • • •• • • • • • • •• • • • • • •• • • • • • • •• • • • • • • • •• • • • • • • • •• • • • • • • •• • • • • • • • •• • • • • • •• • • • • • • • • • •• • • • • • • •• • • • • • • • •• • • • • • • • • •• • • • • • • • • • • •• • • • • • • • •• • • • • • • • • •• • • • • • • • • •• • • • • • • • • •• • • • • • • • • • •• • • • • • • • •• • • • • • • • • •• • • • • • • •• • • • • • • • •• • • • • • • • • • •• • • • • • • • • •• • • • • • • • • •• • • • • • • • • • •• • • • • • • • • •• • • • • • • • • • •• • • • • • • • • •• • • • • • • • •• • • • • • • • • • •• • • • • • • • • •• • • • • • • • • • • •• • • • • • • • • •• • • • • • • • • • •• • • • • • • • • •• • • • • • • • • • •• • • • • • • • • •• • • • • • • • • •• • • • • • • • • •• • • • • • • • • • •• • • • • • • • • • • •• • • • • • • • • • •• • • • • • • • • • • •• • • • • • • • • • • •• • • • • • • • • • •• • • • • • • • • • •• • • • • • • • • • •• • • • • • • • • • •• • • • • • • • • • • •• • • • • • • • • • • •• • • • • • • • • • •
dB (
SP
L)
••• •• ••••••••
•• •••• •• • ••• • ••••••• •• •• • • •• •• •• • ••• • • •• • • • • •• •• ••• •• •• • • •• • •• • • • •• • • •• • • • •• •• •• •• • •• • • •• • •• •• •• • •• • •• • • • •• • • • •• ••• • • • • •• • • •• • • • •• • • • •• • •• • •• • •• • • • ••• •• • •• •• • • • •• • • •• • ••• •• • •• • • •• • • •• • • • •• • •• • •• • • • • •• • • • •• • • •• • • • •• • •• • • • • • •• • • • • • •• • • • • •• • •• • • • •• • • • •• • • •• • •• • • •• • •• • • • •• • • • • •• • • • •• • • • • •• • • • •• • • • • • • • •• • • • •• • • • • •• • • • •• • • •• • • • • •• • • • •• • • • • •• • • • •• • • • •• • • • •• • • • •• • • • • •• • • • • •• • • • •• • • • •• • • • •• • • • • •• • • • • •• • • • • •• • • • •• • • • • •• • • • • •• • • • • •• • • • • •• • • • •• • • • •• • • •• • • • •• • • • • •• • • • • •• • • • • • •• • • • • •• • • • • •• • • • • •• • • •• • • • •• • • • • •• • • • • •• • • • • •• • • • • • •• • • • •• • • • • •• • • • • •• • • • • •• • • • •• • • • • • •
• • •• • •••• • •••• •••••
•• ••••• ••• • • ••• • •• • •• •• • •• •• •• •• • •• • •• •• •• • •• • •• • •• •• ••• • • •• •• • •• • •• • •• • •• • •• •• • •• • • •• • •• • •• • •• •• • • • •• •• •• •• •• • ••• • • • •• •• •• • •• • •• •• • •• • • •• • •• • • •• • • • •• • •• • • • •• • • •• • •• • •• • •• • • • •• • • •• • • •• • • •• • •• •• • •• • • •• • •• • • •• • • • •• • • •• • • • •• • • •• • • •• • • •• • • • • •• • • •• • • •• • • •• • • • •• • • •• • • •• • • • • • •• • • • •• • • •• • • •• • •• • • • •• • • •• • • • •• • • • • •• • • • • •• • • • •• • • • •• • • •• • • • •• • • • •• • • •• • • • •• • • • • • •• • •• • • • •• • • • •• • • •• • • • •• • •• • • • •• • • • •• • • • • • •• • • •• • • •
• •••• •••••
•• ••••• ••• • • ••• • •• • •• •• • •• •• •• •• • •• • •• •• •• • •• • •• • •• •• ••• • • •• •• • •• • •• • •• • •• • •• •• • •• • • •• • •• • •• • •• •• • • • •• •• •• •• •• • ••• • • • •• •• •• • •• • •• •• • •• • • •• • •• • • •• • • • •• • •• • • • •• • • •• • •• • •• • •• • • • •• • • •• • • •• • • •• • •• •• • •• • • •• • •• • • •• • • • •• • • •• • • • •• • • •• • • •• • • •• • • • • •• • • •• • • •• • • •• • • • •• • • •• • • •• • • • • • •• • • • •• • • •• • • •• • •• • • • •• • • •• • • • •• • • • • •• • • • • •• • • • •• • • • •• • • •• • • • •• • • • •• • • •• • • • •• • • • • • •• • •• • • • •• • • • •• • • •• • • • •• • •• • • • •• • • • •• • • • • • •• • • •• • • •
0 10 20 30 40 50
Time (ms)
10
90
(A)
0
2
4
6
8
10
0 2 4 6 8 10
Firi
ng P
erio
dici
ty (
ms)
Shift in latency (ms)
(C)
10
90
10
90
unit#GL26
• •
•
• •
••
•••
••
••••
•
••
•
•
•
•
•
••
••
•
•
••
•
•
•
•
••
••
•
•
•
•
•••••••
•
•
•
•
•
•
••••
••
••
•
••
••
•
•
•
•
••
•
•
•
•
•
••
•
•
••
••
••
•
•
•
•••
•
•
••
•
•
•
•
•••
•
•••
••
•••
•
•••
•
•••••
•
•
•••
•
•
•
•••
•
•••••••
••••
•
•
•
•
•
•
•••
•
•
•••
•••••
••••••••••••••••••••••• •••• •• ••••••
•••• ••••••••••• ••••••••• ••
•••• •••••••••••• •••••••••••••••••••
••••••••••••••••••
•
0 10 20 3010
90
(B)
10
90
10
90
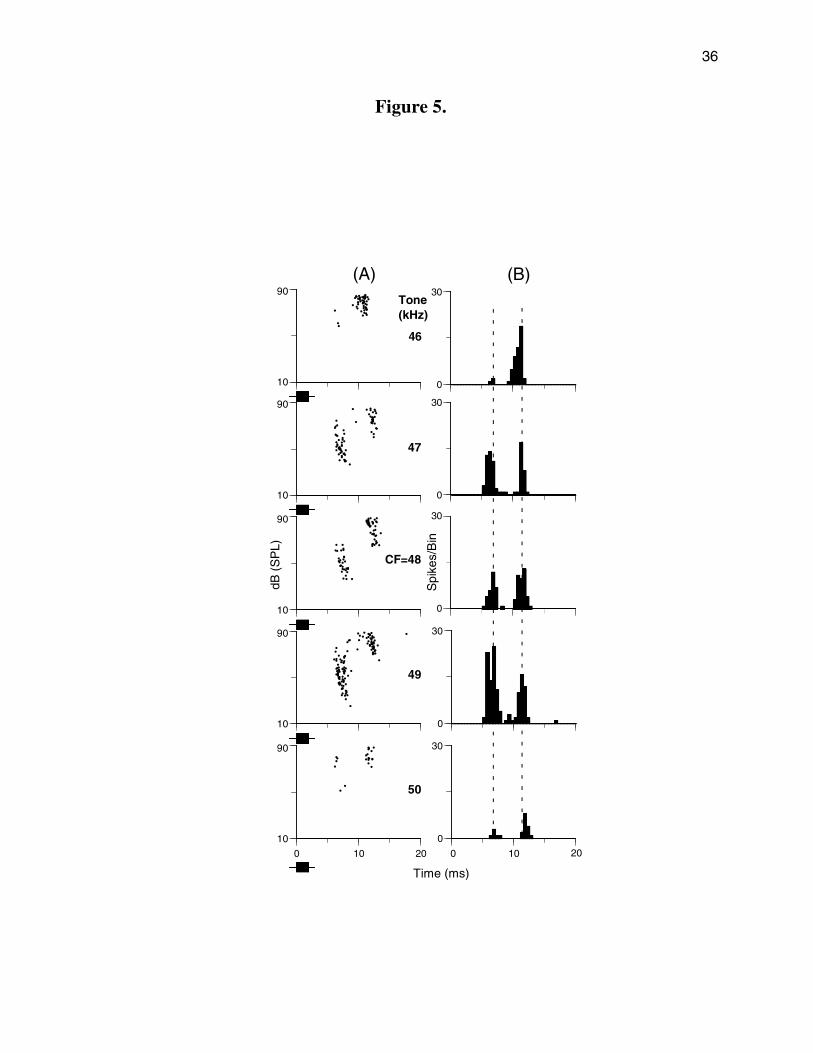
36
Figure 5.
•••
• ••• •••••••••• ••••• ••••••• ••••• ••••• •• ••• •• • •••• ••• •••• •• ••••• • •• •• •••• •••••• • •••• ••• •••••• ••••• •••• •••• •• • ••• •••• •• •••• •• ••
dB (
SP
L)
• ••••• ••• ••••••
•• •••••••
•• •••• •• • •••••••••••• ••••
• •••••• ••••• •••• •••• •• ••
••
•• •• •• ••• ••• •••••• •
0 10 20
Time (ms)
10
90
•••• •••••• •••••• ••••••••••• •• •••• ••
•••• •• •• •••••••••• ••• •••••••••• ••••• •• •
••• ••••• ••••• •••• •• •• •••• •• •• •••• •• •• •• •• •• •• •• •• ••
0
30
0
30
Spi
kes/
Bin
0
30
0
30
0
30
Tone(kHz)
CF=48
46
47
49
50
0 10 20
(A) (B)
10
90
10
90
10
90
10
90
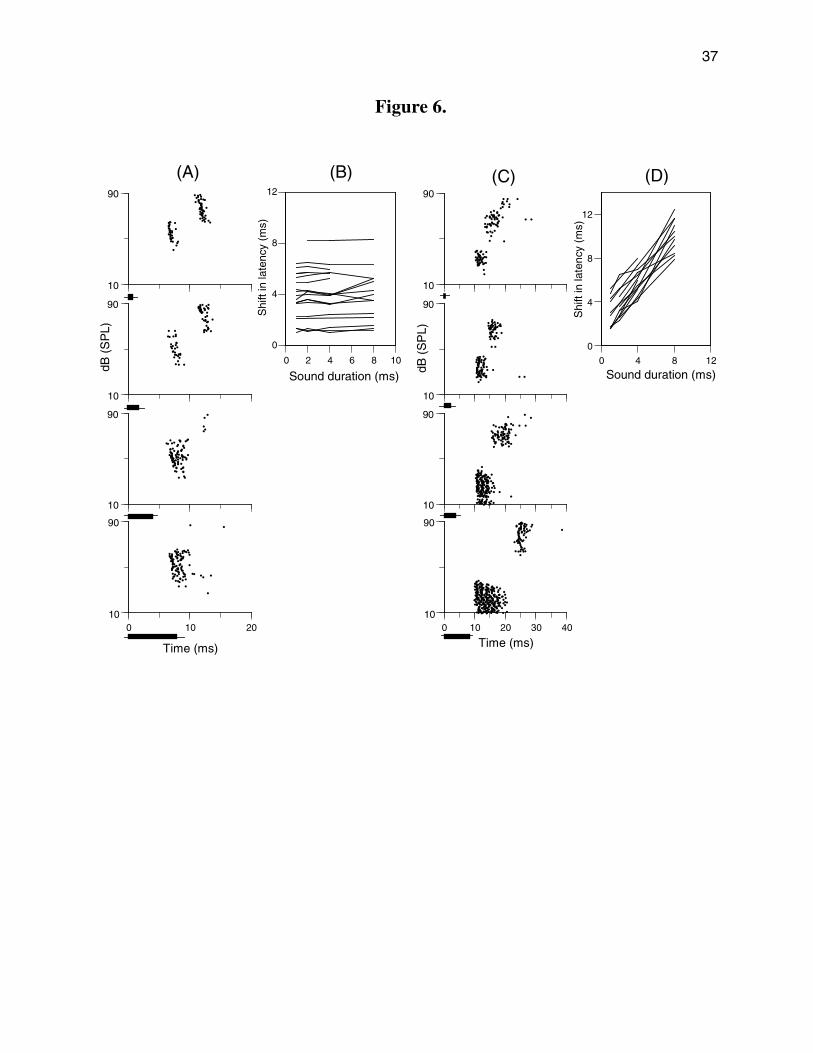
37
Figure 6.
0
4
8
12
0 2 4 6 8 10
Shi
ft in
late
ncy
(ms)
Sound duration (ms)
(A) (B)
• ••••• ••• ••••••
•• •••••••
•• •••• •• • •••••••••••• ••••
• •••••• ••• •• •••• •••• •• ••
dB (
SP
L)
•••
• •••••••••••••••••• ••••••• •• •• •• ••• •••
•••••••••• •••••••• ••••••••••••• •••••
•• •
•• •••• •••• • •• •• •• • •• •• • •• ••••• •• ••• ••• ••• •••• ••• ••• ••••• •• •• ••• •• • ••• •• •• • •• •• •• •• •• •• • •• •• •• •• ••
• •
0 10 20
Time (ms)
• •••• •• •• •• •••••• •••••• ••••• •• • •••• • •• • •• • ••• • •• ••• • • •••••• ••• ••• ••• ••• ••• •••• •• • ••• • ••
•••
•
•
10
90
10
90
10
90
90
10
0
4
8
12
0 4 8 12
Shi
ft in
late
ncy
(ms)
Sound duration (ms)
(C) (D)
••• • •• • •• •• •• ••• •• •• •• •••• ••• ••• • • •• ••• •• ••• •• ••• ••• •• ••• •••• ••• •• ••• •••••
• •• •• •••• •• •••• • •••••• •• ••• •• •• •• •• • •• • •••• •• • ••••
dB (
SP
L)
••
••• ••• •• •• ••••• •••• ••• •• • •• ••••• ••• • •• ••
•••• •
•• •••• ••• •• ••• • •• •• ••• • •• •••• •• • ••• •• • •• •• •• ••
•• •• ••• •• • •
• •• • • • • •• • • • •• • • • •• • • • •• • •• • • •• • ••• •• • • •• •• • • • •• • • • •• •• • • •• • •• • • •• • • •• • • • • • •• • • • •• • • •• • • • •• • • • • •• • • • •• • • • • •• • • •• • • • •• • • •• • • • •• • • • •• • • • • •• •• • • • •• • • •• • • • • •• • • •• • • • •• • • • •• • • • • •• •• • • • •• • • • •• • • • • •• • •• • •• • • •• • •• •• • ••• • •• •• • •• • •• • • • •• • • •• • • •• • • •• • • • •• • • •• •• • • • •• •• • • •• •• • •• • •• • •• •• •••••
•• •• • •••••••••• •• ••• ••••• •••• ••• •••• •• •• •• • • ••• •• ••• •• • • •• •• • ••• ••••
0 10 20 30 40
Time (ms)
• •• • ••• • • •• • •• •• •• • •••• • ••• •• • •• • •• •• •••• • •• • •• •• • • • •• • •• • • •• • •• • •• • •• •• • •• •• • • •• • • •• •• • •• • •• • • •• • •• ••• •• •• • • •• • • •• • •• •• • •• • • •• • •• • •• • •• •• • • •• • •• • •• • •• •• •• •• • •• • • ••••••••
• •
• •••• • ••• •• •• •• •• • •• ••• •• • •• •• ••• •• • •• • • •• •• •• •• ••• ••• •• • •• •• •••• ••• • • •• • •••• ••• •
10
90
10
90
10
90
90
10

38
Figure 7.
0
1
-10 -5 0 5 10
Avg
. Res
p. to
Ech
o
••• ••••
••••••••••• ••••
• •••• • ••••• •••••••••••••••
••
••
0 10 20 30 40
dB S
PL
0
3
-10 -5 0 5 10
Echo Delay (ms)
Pulse-Echo Interaction
• • •• •••••• •• •• •• ••• • • •• ••• ••••• • •••••• ••• ••••• •• ••• ••• •• • • •• • • • •• •• ••• •• •• • • ••••••• ••• ••• •••••• •••••• • ••• •• ••• •• ••••• •• •• ••• ••• • •• •••••• ••• • ••••••• •• • •••• •••••••• ••••••• •••••• ••••••••• ••••••••••••••••• •••• •• •• • ••••••••••• • •••••••••••••• •• ••••••••••••••••••••• •••••• •••• •• ••••••••••••••••••••••••• •• ••• •• • •• •••••• ••••••• •••••• •• •••••••••• ••••• •••••••• •• ••••• •• •• ••••••••• ••••••••• ••••••••• ••••• • •• •••• •••••• ••• ••••••••••••••••••••••• •••• •••• •• •• ••••••••••••••••••••••••• •••• ••• • • •• ••••
0 10 20 30 4010
0
10
-10 -5 0 5 10
• ••• •• • • • • ••• •• ••• • •• • •••• •• • ••• • •• • •• •• ••• • •• •••• ••• •• •••• •••• •• ••• • • •• ••• • ••• ••• •••• ••• • ••• •• •• • •• •• • •••• ••• •• ••• • •••• •••• •• •• • ••• ••••• ••• • •• • •• •• ••• ••• ••• ••• ••• •• •• ••• • • ••• •• •• •• ••• •••• ••••• ••• • •• • •• • • •• •••• • • ••• ••• • ••• •• •• • ••••• ••• • •• • • • •• •• ••• • ••• • ••• •• ••• •• •• • •• •• •••• •• • •• • • •• •• • • ••• • • •• •• • •• • ••• ••• • •••• • •• • • •• • • •• •••• • •• • •• • •• •••• • •• •• • •• •••• • ••• • • ••• • ••• ••• • ••• • •••• ••• •• ••• •• •• •• • •• • •• •• • •• • • •• •• •• •••• •• • •• •• • • ••
0 10 20 30 40
90
• • • • • • • • • • • • • • • • • •• • • • • • • • • • •• • • • • • • • • • •• • • • • • • • • • •• • • • • • •• • • • • • • •• • • • • • • •• • • • • • • •• • • • • • • • • •• • • • • • • • • •• • • • • • •• • • • • • • • • •• • • • •• • • • • • •• • • • •• • • • • • •• • • • •• • • • • • • •• • • • •• • • • •• • • • • • • •• • • • • •• • • • • •• • • • •• • • •• • • • • •• • • • • • •• • • • • • •• • • • • • •• • • • • •• • • • • •• • • • •• • • • • • • •• • • • •• • • • •• • • •• • • • • •• • • •• • • •• • • • • •• • • •• • •• • • • •• • • •• • • • • •• • • •• • • • •• • • • •• • • •• • • • • •• • •• • • •• • •• • •• • • •• • • • • •• • • • •• • • •• • • •• • • •• • • • • •• • • • •• • • • •• • •• • • • •• • •• • • • •• • • •• • • •• • • •• • • •• • • • •• • • •• • • •• • •• • •• • •• • • • •• • •• • •• • • •• • • • •• • • •• • • •• • • • •• • • • •• • • • •• • • • •• • • • • • • •• • • •• • • • •• • • • •• • • • •• • • •• • • •• • •• • •• • •• • • • •• • • •• • • •• • • • •• • • • • •• • • • • •• • • •• • • • • •• • • •• • • • •• • • •• • • •• • • •• • • •• • • • •• • • • • • • • •• • • •• • •• • • • •• • • •• • • • •• • • • •• • • • •• • • •• • • • •• • • • •• • •• • •• • • •• • • • •• • • •• • • • •• • • •• • • •• • • •• • • • •• • •• • • • •• • • •• • • •• • • •• • •• • • •• • • •• • • •• • • •• • • •• • • •• • • • •• • • • •• • •• • • • •• • • •• • • •• • •• • • •• • • •• • • •• • • • •• • • •• • • • •• • • • •• • • • •• • • •• • • • • • •• • • • •• • • •• • • • •• • • • • •• • • • • •• • •• • • •• • • • • •• • • •• • • • • • •• • • •• • • •• • • •• • • •• • • •• • • •• • •• • • • • •• • • • •• • • • •• • • •• • • •• • • • •• • • • •• • •• • • • • •• • • •• • • • •• • • • • •• • • • •• • • • •• • • • • •• • • • • • •• • • • • •• • • • •• • • • • • •• • • • •• • • •• • • • •• • • •• • • • •• • •• • •• • • • •• • • • • • • •• • • • •• • • • •
0 10 20 30 40
Discharge Pattern
(H) (I)(G)
(E) (F)(D)
Pulse-Echo Response Function
(B) (C)(A)
-10
10
-5
0
5
•• • •• ••••••• ••• ••• ••••• ••• •••••• •••••••• ••••••• ••••••• •••••••• ••• •••••• ••• •• •••• • ••••• • •• ••••••••• ••••••• • •••• • •••••••• ••••••••••••••••• •• ••••••••••••• •••••••••• •••••• •••• •• ••••••••• • •• •••• • ••••••••••• •• • ••••••••••••• •••••• • ••••••••• •• ••••••••
• •••••• • •• •••••••• •••• • •••• ••• •••••• ••••
0 10 20 30 40
Time (ms)
•••• •••••• •••••••••••••••••• ••• •••••••• •• ••••••••••• •••••• •••••••••••••••••••• •••• •••••• ••• ••••• •••• •••••••••• ••••••••••••
•••••••• ••••••• •••••••• • ••••• •••••••••••••••••
• •• ••••• ••• ••••••••
•••• ••••• ••••• • •••••••• ••• ••••• •• •••• •• •• •• ••••• ••• ••••••• •• •• •••••••••• ••
0 10 20 30 40
Pul
se-E
cho
Inte
rval
(m
s)

39
Figure 8.
•
•
••••••
•
••••
•
•
•••
•
•
•
••
•••
•
•
•••
•••
•
•
•
••
•
•
••
••••••
•
•
••••••
•
••
••
•
•
•••••
•
••••
•
•
•
•
•
•
•
•
•••
•
•
•
•
•••
•
•••
•
••
••
•
•
•
•
••
••
•
•
•
•
••
••
••
•
••
•
•
•
•
••
••
•
•
•
•
•
•
•
•
•
•
•
•
•
•
•
•
••
•
•
•
•
•
•
•
•
•
•
•
•
•
•
••
•
••
•
•
••
•
•
•
•
•
•
•
•
•
•
•
•
•
•
•
•
•
•
•
••
•
••
•
•
••
••
•
•
•
•
••••
•
•
•
•••
•
•
•
••
•
•
••
•
•
•
•
••
•
•
•
•
••
•
•
•
••
•
•
••••
•
••
•
•
••
•
•
••
•
•••
•
•
•
•
•
•
•
•
•
•
••
•
••
•
••••
•
•
••
••
•
•
••
•
•
••
•
••
•
••
•
•
•
•
•
•
•
•
•
•
•
•
•
•
•
•
•
••
•
•
•
•
•
•
•
•
•
••
•
•
•
•
••
••
•
•
••
•
••
•
•
••••
•••
•
•
•
•
•
•
•
•
•
•
•
•
•
•
•
•
•
•
•
•
•
•
•
•
•
•
•
•
••
•
••
•
•
•
•
••
•
•
•
•
••
•
•
•
•
•
•
•••
•
•
•
•
•
•
•
••
•
•
•
•
•
•
••
•
••
••
••
•
•
••
•
•
•
•
•
•
•
•
•
•
•
•
••
•
•
•
•
•
•
•
•
•
•
•
••
•
•
•
•
•
••
•
•
•
•
•
•
•
••••
•
•
•
•
•
•
••
•
•
•
•
•
••
•
•
•
••
•
•
••
•
•
•
•
•••
•
•
•
•
•
•
••
••
•
•
•
•
•
••
•
•
•••
•
•
•
•
•
•
••
•
•
•
•
•
•
•
•
•
••
•
•
••
••
•
•
•
•
••••
•
•
•
•
•
•
•
•
••
•
•
•
•
•
•••
•
•
•
•
•
•
•
•
••
•
•
•
•
•
•
•
••
•
••
•
••
•
•
•
•
•
•
•
•
•••
•
•
•
•
•
••
•
••
•
•
••
••
•
•
•
•
•
•
•
•
•
•
•
•••
•
•
•
•
••
•
•
•
••
•
•
••
•
•
•
•
•
••
•
•
•
•
•
•
•
•
••
•
•
•
•
•
••
•
•
•
•
•
••
•
••
•
•
•••
•••
••
•
•
•
•
•
•
••
•
•
•
•
••
•
••
••
•
•
•
•
•
••
••
•
•
•
•
•
•
•
••
•
•
•
••
•
•
•
••
•
•
•••
•
•
•
•
•
•
•
•
•
•
•
•
•
•
••
•
•
•
•
•
••
•
•
•
•
•
•
••
•
•
••
•
•
•
••
•
•
•
•
•
•
••
•
•
•
••
••
•
•
•
••
•
•
•
•
•
•
•••
•
•
•••
•
•
•
••
•
•
•
•
•
•
•
•••
•
•
•
•
•
•
•
•••
•
••
•
••
•
•
•
•
•
•
••
•
••
•
••••••••
••
••
•••
••
•
•
•
•
•
•••
•
•
•
•
•
•
•
•
•
•
•
••
••
•
•
•
•
•
•
•
•
••
•
•
•
•
•
••
•
•
•
•
•
•
•
•
•
•
•
•
••
•
•
•
•
••
•
•
•
•
•
•••
•
••
•
•
•••
•
•
•
•
•
••
••
•
••
••
•
••
••
••
••
••••
•
•
•
•
•
•
••
•
•
•
•••
•
•
•
•
•
•
•
••
•
••••••••••
••
•
•
•
•••
•
•
••••
•
•
••
•
•••
•
•
•
••
•
•
•
••
••••
•
•
•
••
••
•
•••
•
•
•
•
•
•
•
•
•
•
•
•
•
•
••
•
•
•
•
•
•
•
••••
•
•
•
•
•
•
•
••
•
•
•
•
•
•
•
•
•
•
•
•
•
•
•
•
•
•••
•
•••
•
•
•
••
•
•
•
•
•••
••
•
•
•
••
••
•
•
•
•
•
•
•
•••
•
•
•
•
•
•
••
••
•
••
•
•
•
•
•
•
•
•
••
•
•••
•
•
•
•
••
••
•••
•••
•
•
•
•
•
•
••
•
•
•
•
•
••••
•
•
•
•
•
•
•
•
•
•
•
••
•
•
•••
••
••
••
dB (
SP
L)
•••
•
•
•
•
•
••••••
••
••
•••
•
••
•
••
••••
•
•
•
•
•••••
••
•
•
•
•
•
•
•
•
••
•
•••
•
•
•
•
•
•
••
•
••
•
••
•
•
•
•
•
•
•
•••••
•
•
•
•
•
•
•••
••
••
•
•
•
••••
•
••
•
•
••
•
•
••
•
••
•
•
•
•
•
•
•
•
•
••
•
••••
•
•
•
•
•
••
•
••
••
•••
••
•
•
•
•
•
••
••
••
•
•
•
•
•
•
•
•
•
•
•
••
•
•
•
•
•
•
••
•••
•
•
•
•
••
•
•
•
•
•
•
•••
•
•
•
•
•
•
•
•
•
•
••
•
•
•
•
•
•
•
•
•
••
•
••
•
•
•
••••
•
•
••
•
•
•••
••
••
••
•
•
•
•
••
••
•
•••
••••
•
•
•
•
•
•
•
•
•
••
•
••••
•
•
•
•
•
•
•
•
•
•
•
•••
•
•
•
••
•
•••
•
•
•
•
•
•
•
•••
•
•
•
••
•
•••
•
•
•
••••
•
•
•
•
•
•
• ••• • ••• • •• •• ••• •• •• ••• •• ••• •• • •• ••••• • •• •• •• ••• •• •• •• • •• •• •• •• •• •• ••••• • •• ••••• •• •• •• •• •• ••• • •• •• •• •• •••• ••• •• ••• •• •• •• • ••• • ••• •• •• ••• • ••• •• •• •• • •• • ••• •• ••• ••• •• •• ••• •• • • ••• • ••• • •• • •••• • • ••• •• • • • ••• •• ••••• ••• • •••• •• •••• • •• •• •• •• •• ••• • •• • •••• • •• ••• •• • ••• •• •• • • •• ••• • ••• ••• •• •• ••• • •• •• • •• •••• • •••• •• ••• • • ••• •• ••• •• •• ••• • •• •• ••• •• •• •• •• •••• ••• • •• ••• • ••• ••• •• ••• ••• ••• • ••• •• •••••• • ••• •••
0 50 100 150Time (ms)
10
90
(A) Predrug
(B) Bicuculine
(C) Recovery10
90
10
90

40
Figure 9.
(A)unit#7/16-7
0 50 100 150 200
dB (
SP
L)
Time (ms)
(B)unit#W751
0 50 100 150 200
10
90
10
90
10
90
10
90
10
90
10
90
10
90
10
90

41
Figure 10.
0
1
-100 -50 0 50 100
Avg
. Res
p. to
Ech
o
(A)
0 50 100 150 200 250
dB S
PL
0
100
0 50 100 150 200 250Pul
se-E
cho
Inte
rval
(m
s)
0
3
-100 -50 0 50 100
Echo Delay (ms)
Pulse-Echo Interaction
(B)
0 50 100 150 200 250
0
4
-100 -50 0 50 100
(C)
0 50 100 150 200 250
Discharge Pattern
-100
0
100
-50
50
0 50 100 150 200 2500 50 100 150 200 250
Time (ms)
(D) (E) (F)
(G) (H) (I)
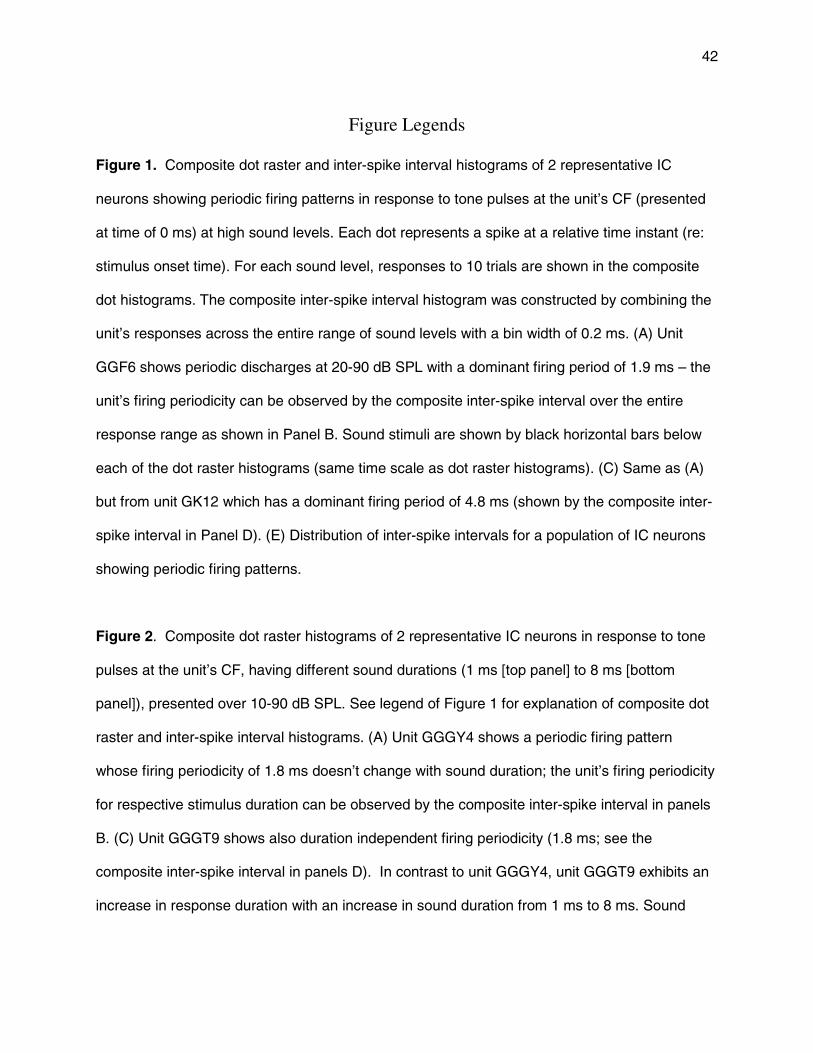
42
Figure Legends
Figure 1. Composite dot raster and inter-spike interval histograms of 2 representative IC
neurons showing periodic firing patterns in response to tone pulses at the unit’s CF (presented
at time of 0 ms) at high sound levels. Each dot represents a spike at a relative time instant (re:
stimulus onset time). For each sound level, responses to 10 trials are shown in the composite
dot histograms. The composite inter-spike interval histogram was constructed by combining the
unit’s responses across the entire range of sound levels with a bin width of 0.2 ms. (A) Unit
GGF6 shows periodic discharges at 20-90 dB SPL with a dominant firing period of 1.9 ms – the
unit’s firing periodicity can be observed by the composite inter-spike interval over the entire
response range as shown in Panel B. Sound stimuli are shown by black horizontal bars below
each of the dot raster histograms (same time scale as dot raster histograms). (C) Same as (A)
but from unit GK12 which has a dominant firing period of 4.8 ms (shown by the composite inter-
spike interval in Panel D). (E) Distribution of inter-spike intervals for a population of IC neurons
showing periodic firing patterns.
Figure 2. Composite dot raster histograms of 2 representative IC neurons in response to tone
pulses at the unit’s CF, having different sound durations (1 ms [top panel] to 8 ms [bottom
panel]), presented over 10-90 dB SPL. See legend of Figure 1 for explanation of composite dot
raster and inter-spike interval histograms. (A) Unit GGGY4 shows a periodic firing pattern
whose firing periodicity of 1.8 ms doesn’t change with sound duration; the unit’s firing periodicity
for respective stimulus duration can be observed by the composite inter-spike interval in panels
B. (C) Unit GGGT9 shows also duration independent firing periodicity (1.8 ms; see the
composite inter-spike interval in panels D). In contrast to unit GGGY4, unit GGGT9 exhibits an
increase in response duration with an increase in sound duration from 1 ms to 8 ms. Sound
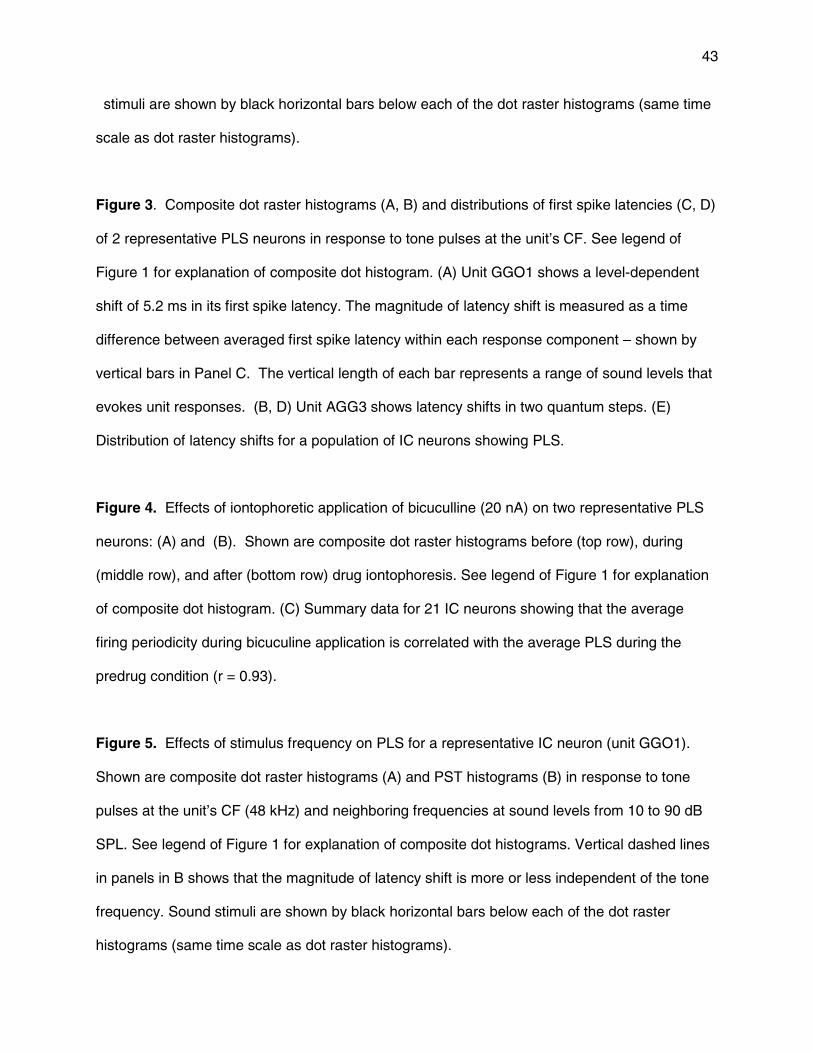
43
stimuli are shown by black horizontal bars below each of the dot raster histograms (same time
scale as dot raster histograms).
Figure 3. Composite dot raster histograms (A, B) and distributions of first spike latencies (C, D)
of 2 representative PLS neurons in response to tone pulses at the unit’s CF. See legend of
Figure 1 for explanation of composite dot histogram. (A) Unit GGO1 shows a level-dependent
shift of 5.2 ms in its first spike latency. The magnitude of latency shift is measured as a time
difference between averaged first spike latency within each response component – shown by
vertical bars in Panel C. The vertical length of each bar represents a range of sound levels that
evokes unit responses. (B, D) Unit AGG3 shows latency shifts in two quantum steps. (E)
Distribution of latency shifts for a population of IC neurons showing PLS.
Figure 4. Effects of iontophoretic application of bicuculline (20 nA) on two representative PLS
neurons: (A) and (B). Shown are composite dot raster histograms before (top row), during
(middle row), and after (bottom row) drug iontophoresis. See legend of Figure 1 for explanation
of composite dot histogram. (C) Summary data for 21 IC neurons showing that the average
firing periodicity during bicuculine application is correlated with the average PLS during the
predrug condition (r = 0.93).
Figure 5. Effects of stimulus frequency on PLS for a representative IC neuron (unit GGO1).
Shown are composite dot raster histograms (A) and PST histograms (B) in response to tone
pulses at the unit’s CF (48 kHz) and neighboring frequencies at sound levels from 10 to 90 dB
SPL. See legend of Figure 1 for explanation of composite dot histograms. Vertical dashed lines
in panels in B shows that the magnitude of latency shift is more or less independent of the tone
frequency. Sound stimuli are shown by black horizontal bars below each of the dot raster
histograms (same time scale as dot raster histograms).
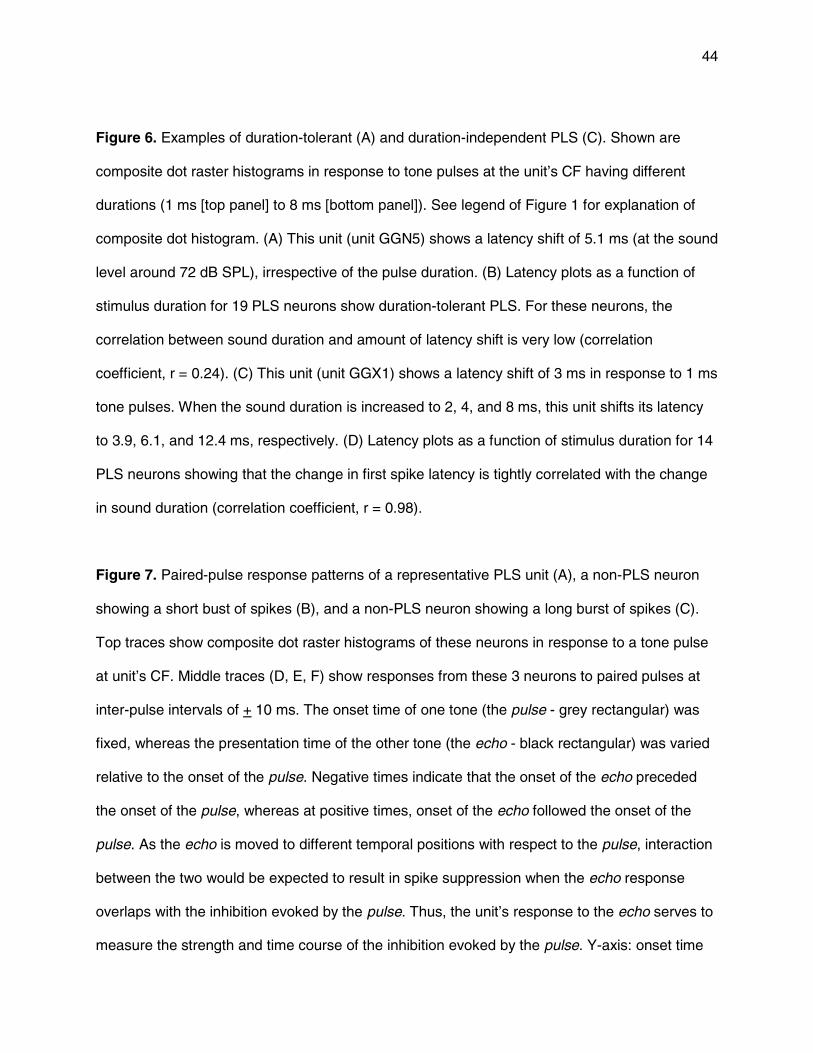
44
Figure 6. Examples of duration-tolerant (A) and duration-independent PLS (C). Shown are
composite dot raster histograms in response to tone pulses at the unit’s CF having different
durations (1 ms [top panel] to 8 ms [bottom panel]). See legend of Figure 1 for explanation of
composite dot histogram. (A) This unit (unit GGN5) shows a latency shift of 5.1 ms (at the sound
level around 72 dB SPL), irrespective of the pulse duration. (B) Latency plots as a function of
stimulus duration for 19 PLS neurons show duration-tolerant PLS. For these neurons, the
correlation between sound duration and amount of latency shift is very low (correlation
coefficient, r = 0.24). (C) This unit (unit GGX1) shows a latency shift of 3 ms in response to 1 ms
tone pulses. When the sound duration is increased to 2, 4, and 8 ms, this unit shifts its latency
to 3.9, 6.1, and 12.4 ms, respectively. (D) Latency plots as a function of stimulus duration for 14
PLS neurons showing that the change in first spike latency is tightly correlated with the change
in sound duration (correlation coefficient, r = 0.98).
Figure 7. Paired-pulse response patterns of a representative PLS unit (A), a non-PLS neuron
showing a short bust of spikes (B), and a non-PLS neuron showing a long burst of spikes (C).
Top traces show composite dot raster histograms of these neurons in response to a tone pulse
at unit’s CF. Middle traces (D, E, F) show responses from these 3 neurons to paired pulses at
inter-pulse intervals of + 10 ms. The onset time of one tone (the pulse - grey rectangular) was
fixed, whereas the presentation time of the other tone (the echo - black rectangular) was varied
relative to the onset of the pulse. Negative times indicate that the onset of the echo preceded
the onset of the pulse, whereas at positive times, onset of the echo followed the onset of the
pulse. As the echo is moved to different temporal positions with respect to the pulse, interaction
between the two would be expected to result in spike suppression when the echo response
overlaps with the inhibition evoked by the pulse. Thus, the unit’s response to the echo serves to
measure the strength and time course of the inhibition evoked by the pulse. Y-axis: onset time

45
of the echo with respect to onset time of the pulse. For each of three neurons (single column),
pulse and echo sound levels are indicated on the y-axis in A, B, and C by grey and black
rectangular, respectively. The bottom traces (G, H, I) show unit’s spike count as a function of
pulse-echo interval, based on results of paired-pulse data in D - F. Each data point represents
the average spike count of echo response during paired-pulse stimulation at a given pulse-echo
interval. Dashed line on each graph indicates the 50% level below the maximum spike count. All
responses below dashed line were arbitrary considered as inhibition.
Figure 8. Effects of bicuculline on a PLS neuron in the frog IC. Shown are unit’s composite dot
raster histograms before (A), during (B), and after (B) iontophoretic application of bicuculline (30
nA). To construct the dot histogram, tone pulses (duration = 20 ms) at unit’s CF were presented
at different sound levels, from 10 to 90 dB SPL. For each sound level, 10 tone pulses were
presented. See legend of Figure 4 for other details. Open arrows in panel A represent the times
of first spike latency at different sound levels. Sound stimuli are shown by black horizontal bars
below each of the dot raster histograms (same time scale as dot raster histograms).
Figure 9. (A) Example from a representative PLS neuron (unit 7/16-7) showing that stimulus
duration has little or no influence over the PLS of 46 ms at around 80 dB SPL. Shown are
composite dot raster histograms in response to tone pulses at the unit’s CF having different
durations (10 ms [top panel] to 80 ms [bottom panel]). Increase in sound duration from 10 ms
(top panel) to 80 ms (bottom panel) reduced the spike count to sounds at high levels (>80 dB
SPL) but didn’t change the amount of PLS. (B) Example from a representative PLS neuron (unit
W751) showing duration-dependent PLS. This unit showed a latency shift of 25 ms in response
to 10 ms tone pulses. When the sound duration was increased to 20, 40, and 80 ms this unit
increased the latency shift to 50 ms, 81 ms, and 98 ms, respectively.

46
Figure 10. Paired-pulse response patterns of a representative PLS unit (A), a non-PLS neuron
sowing a short bust of spikes (B), and a non-PLS neuron showing a long burst of spikes (C).
Top traces show composite dot raster histograms of these neurons in response to a tone pulse
at the unit’s CF. Middle traces (D, E, F) show responses from these 3 neurons to paired pulses
at inter-pulse intervals of + 100 ms. The onset time of one tone (the pulse - grey rectangular)
was fixed, whereas the presentation time of the other tone (the echo - black rectangular) was
varied relative to the onset of the fixed pulse. The unit’s response to the echo serves to
measure the strength and time course of the inhibition evoked by the pulse. Y-axis: onset time
of the echo with regard to onset time of the pulse. The bottom traces (G, H, I) show unit’s
response to the echo as a function of pulse-echo interval, based on results of paired-pulse data
in D - F. See legend of Figure 8 for other details.