Embed Size (px)
Citation preview
UNLV Center for Democratic Culture Edited by Dmitri N. Shalin
Suicide Trends and Prevention in Nevada Matt Wray, Department of Sociology, Temple University, [email protected] Tatiana Poladko, Department of Sociology, Temple University. Misty Vaughan Allen, Nevada Office of Suicide Prevention. © Matt Wray, Tatiana Poladko, Misty Vaughan Allen 2011 Suicide is a leading cause of death in the United States. In 2007, nearly 35,000 Americans took their own lives, a rate of 11.5 suicides per 100,000 (Xu et al. 2010). Among 15-24 year olds, suicide is the third leading cause of death and for those aged 25-34, it is the second leading cause (CDC WISQARS 2007). Within the United States, suicide rates vary significantly from county to county, state to state, and region to region. For decades, Nevada has consistently had one of the highest rates among all the states, routinely posting rates that are two or more times the national average. If all of the states in the US had rates as high as Nevada’s average rate, the US would have a suicide rate on par with countries like the Ukraine and Hungary, both of which are generally recognized as countries with extremely high levels of suicide (World Health Organization n.d.) Nevada is not the only state in the US to have such high rates. In fact, Nevada
Chapter Highlights
Nevada has long had one of the highest suicide rates in the nation.
The rate is nearly double the national average.
Nevada’s suicide rate appears to be increasing during the Great Recession.
Guns remain the most common method of suicide, accounting for ~60% of the total.
For most subpopulations, Nevada’s trend lines follow national trend lines.
Statewide suicide prevention efforts are reshaping public perceptions of suicide in positive ways.
How to Cite this Report
Wray, Matt, Tatiana Poladko, and Misty Vaughan Allen. 2011. “Suicide Trends in Nevada, 1999-2009.” In The Social Health of Nevada: Leading Indicators and Quality of Life in the Silver State, edited by Dmitri N. Shalin. Las Vegas, NV: UNLV Center for Democratic Culture, http://cdclv.unlv.edu/mission/index.html
The Social Health of Nevada Leading Indicators and Quality of Life in the Silver State

Suicide Trends 2
shares high rates with eight other states in the intermountain West, a region that has sometimes been called the American suicide belt (Harper et al. 2008). Together with Alaska, these ten states regularly lead the nation in the number of suicides per 100,000 persons per year. This is a distinction that no state wants to have, but as Table 1 indicates below, the geographical patterning of suicides is clear and Nevada lies at the heart of the American suicide belt.
Table 1: Suicide Rates by State (age adjusted rates) 1999–2007. States highlighted in yellow comprise the Western suicide belt.
States 1999 2000 2001 2002 2003 2004 2005 2006 2007 Alabama 12.5 13.1 11.4 11.5 11.5 11.8 11.6 12.5 12.5 Alaska 16.8 21.5 16 20.7 20.2 22.9 19.7 19.9 22.2 Arizona 15.5 15.6 14.7 16.5 15.3 15.6 16 16 16.1 Arkansas 12.6 13 14.2 14 13.6 13 14.4 13.3 14.3 California 9.6 9.2 8.5 9.6 9.9 9.6 9.1 9.3 9.9 Colorado 13.7 14.3 16.5 16.1 16 17.1 17.1 15.2 16.4 Connecticut 7.9 8.7 8.1 7.3 7.6 8.2 8.2 8 7.4 Delaware 11.1 10.4 13.5 9.1 11.4 11.1 9.8 10.4 10.7 D.C. 5.1 3.8 6.5 5.1 6 5.5 5.2 5.1 5.8 Florida 12.2 12.4 13.5 13.4 12.9 13.1 12.6 12.7 13.4 Georgia 11.2 10.7 11.3 11 11.5 11.1 10.4 10.1 10.7 Hawaii 11.1 11.2 10.9 9.6 10.3 9 8.3 9.2 9.8 Idaho 14.8 13.3 16.3 15.5 16.3 17.5 16.4 15.8 15.1 Illinois 8.3 8.1 9.2 9.1 8 8.1 8.5 7.9 8.6 Indiana 10.4 11.3 11.7 12.1 11.9 11.4 11.9 13 12.4 Iowa 10.3 9.8 10.2 10.7 11.9 11.5 11.2 11.2 10.7 Kansas 11.2 12.2 10.9 12.7 12.7 13.6 13.3 13.8 13.7 Kentucky 11.6 12.8 12 13 13.6 13.3 13.4 14.6 15.1 Louisiana 11.9 10.7 11.3 11.3 10.4 12.1 11.2 11.6 12 Maine 13.4 11.8 12.1 12.5 10 12.4 12.4 11.1 13.7 Maryland 8.3 9 8.4 8.8 8.9 8.9 8.4 8.6 9 Massachusetts 6.7 6 6.5 6.6 6.5 6.4 7.2 6.7 7.6 Michigan 9.9 9.8 10.5 11 10.2 10.8 10.9 11.1 11 Minnesota 9 8.9 9.6 9.8 9.8 10.2 10.5 10.6 10.8 Mississippi 11 10.5 11.7 12.2 11.9 12.2 12.8 11.5 13.7 Missouri 12.5 12.5 12.8 12.1 11.8 12.4 12.5 13.5 13.5 Montana 17.7 17.5 19.3 20 19.4 18.8 21.8 19.7 19.4 Nebraska 10.5 11.3 10.9 11.8 10.2 9.6 10.9 11.3 10.2 Nevada 21.3 20.2 18.7 19.7 20 19.1 20.1 19.7 18.4 New Hampshire 11.2 10.3 13.1 10.2 12 9.9 11.9 11.1 11.1 New Jersey 6.6 6.6 6.8 6.3 6.7 6.8 6.1 6.5 6.7

Suicide Trends 3
Source: Centers for Disease Control and Prevention In this chapter, we report on suicide deaths and suicide prevention efforts in Nevada, following up on an earlier report (Wray 2006). That earlier report, which tracked Nevada suicide trends from 1994-2003, focused on group differences in suicide rates by age and gender and identified a set of risk factors for suicide that appeared to be especially significant in Nevada. Nevadans, the report suggested, experience a lethal mixture of social isolation (caused in part by rapid population growth and demographic change), poor mental health (caused in part by an inadequate mental health infrastructure and by higher than average rates of addictive behaviors, including problem gambling), and high rates of gun ownership and a frontier culture that stigmatizes help-seeking. Several of the findings and themes of the report were cited and echoed in the 2007 Nevada State Suicide Prevention Plan (Allen et al. 2007). In 2008, Wray and colleagues at the Harvard School of Public Health published research that showed that even after controlling for age and marital status both residents of and visitors to Las Vegas were at uniquely high risk of suicide compared to the rest of the US, suggesting either that Nevada attracts people who are prone to suicide or that there are some as yet unidentified factors about the state that are, in effect, generating more cases of suicide per capita than most other places in the US (Wray et al. 2008). In the present report, our focus is on documenting basic facts about the trends of suicide deaths in the state, updating the data to include deaths through 2009. In addition, we detail the people, agencies, and community groups that have
New Mexico 18.1 18.3 20.3 19.2 18.6 18.9 17.9 18.1 20.5 New York 6.3 5.9 6.5 6.3 5.9 6 6 6.6 6.9 North Carolina 11 12 12.1 11.8 11.2 12 11.5 12.3 11.7 North Dakota 11 10.4 12.8 14.4 12.4 11.3 13.9 13.5 14.5 Ohio 9.7 9.5 10.6 11.2 9.3 11.4 11.5 11.3 11 Oklahoma 14.4 14.6 14.9 14.4 13.7 14.5 14.9 15.1 14.8 Oregon 13.9 14.1 14.3 14.4 16.2 15 14.9 15.2 15.2 Pennsylvania 10.3 10.8 10.2 10.7 10.6 11.1 11.2 10.9 11.2 Rhode Island 9.1 7 8.1 7.9 7.7 7.6 6.3 8.2 8.8 South Carolina 10.5 11.1 11.4 10.8 11.5 11.3 11.9 11.9 11.7 South Dakota 13.7 12.7 14 12.3 13.4 14.7 15.3 15.9 12.5 Tennessee 12.7 12.7 12.2 13.2 12.8 13.2 14 14.2 13.4 Texas 10.2 10.2 10.9 11.1 11.1 10.7 10.9 10.3 10.5 Utah 14 14.8 15.4 16.1 15.3 16.9 15 15.6 15.3 Vermont 10.2 12.3 11.4 14.3 13 14.4 12.4 12.1 13.8 Virginia 11.2 10.8 11 10.9 10.9 11 11.2 11.2 11.2 Washington 14 12.4 11.8 13.3 13 13.3 12.8 12.3 13.1 West Virginia 12.1 13.2 15.1 14.9 14.1 15.5 13.3 14.1 15.9 Wisconsin 11 10.9 11.7 11.3 11.6 11.9 11.5 11.9 12.7 Wyoming 20.3 16.8 16.5 20.9 21.9 17.6 17.5 21.9 19.7

Suicide Trends 4
organized and implemented suicide prevention plans. We pay particular attention to recent trends and we briefly discuss—using preliminary data—the effects that the economic recession may be having on the suicide rate. We close the chapter with a discussion of the work that lies ahead in meeting the challenges posed by suicide in Nevada. Changing Trends Suicide rates vary significantly across the globe, with some nations exhibiting very low rates and other nations very high rates (World Health Organization n.d.). This same range of variation occurs within nations because states, provinces, counties, and cities range from high to low. Variation in suicide rates also occurs across different subpopulations, in quite predictable ways. Generally speaking, the patterns of suicide risk in the US (and most developed nations) look like this: men > women (i.e., men kill themselves more often than women do) whites > non-whites old > young single & divorced > married unemployed > employed non-religious > religious A standard sociological explanation of these patterns is that members of groups that enjoy stable, supportive social and familial ties are protected from suicide, while members of groups where such ties are weak or dysfunctional are at greater risk of suicide (Wray et al. 2011). This explanation is consistent with psychological and medical explanations of suicide that give greater weight to mental illness as a primary driver of suicidality if one understands that supportive social and familial ties not only protect groups from suicide, but also protect individuals’ emotional and mental well-being. In sociological perspectives, a primary driver of mental illness is social disconnectedness (Kawachi & Berkman 2001). As shown in Figure 1 below, during the nine-year period from 1999 to 2007, the national, age-adjusted suicide rate experienced a significant increase, rising to 11.3/100,000 from 10.5/100,000, an increase of 7.6 percent. Preliminary mortality figures recently released by the National Center for Health Statistics show this upward trend continuing, with estimated rates of 11.5 in 2008 (Miniño et al. 2010) and 11.7 in 2009 (Kochanek et al. 2011). This rising level of suicide is likely related to the Great Recession, the impact of which we briefly discuss at the end of this report. Although we found no studies that tested this idea directly, there is strong evidence that suicide rates typically rise during economic downturns (Stuckler et al. 2009; Luo et al. 2011). Figure 1 also shows the age-adjusted suicide rate in Nevada through 2009. Although much higher than the national rate, the Nevada trend line shows a longer term

Suicide Trends 5
decline, followed by a sudden spike in 2008. This one year increase may be related to the economic crisis, although the drop in 20091
to the lowest level in a decade challenges that line of interpretation.
Rates by Gender Across the globe, suicide rates vary sharply by gender. While women attempt suicide 2-3 times more often than men, men complete suicide 3-4 times more often than women (Goldsmith et al. 2002). With few exceptions, women around the world appear to be much less vulnerable to suicide than men. Figures 2 and 3 below show suicide rates by gender for both the nation and the state, rates that generally reflect the gender disparity observed elsewhere. Notable here is the fact that in Nevada the gender disparity in suicide rates, while still quite large, has become smaller, from 4.3 male suicides for every female suicide in 1999 to just over 3 males suicides for every female suicide in 2007. This is due entirely to a nearly 19 percent reduction in the male suicide rate. Suicide rates among females in Nevada have remained virtually unchanged. The reasons for this gender difference remain puzzling, but this is a potentially important trend to watch in years to come, as it may be indicative of factors that are unique to the epidemiology of suicide in Nevada. Sociological studies of changes in the size of gender disparities in suicide rates correlate strongly with changes in the social status of women. As women experience greater social equality, their suicide rates initially go up (although the pattern is complex [Pampel 1998]). One speculation regarding the gender trends observed in Nevada would be that women’s social status is not changing relative to men’s status. As 1 The suicide rate for 2009 is still preliminary and excludes the count of out-of-state victims.

Suicide Trends 6
male Nevadans are becoming less vulnerable to suicide, the risk to female Nevadans remains about 1.5 times higher than the national average.
Rates by Race & Ethnicity Figures 4-8 track trends in age-adjusted suicide rates by ethnoracial group, comparing rates in Nevada to national rates where data are available. Due to the small number of cases and small total populations of most minorities in Nevada, year to year changes can appear quite dramatic, resulting in a characteristically “saw tooth” trend line.2
2 This is due to the fact that suicide rates are computed as the number of cases per 100,000 persons per year. With small denominators (i.e., a small total population), a “multiplier effect” occurs which can make comparisons with larger populations misleading. For example, if there are only 2000 people in the total

Suicide Trends 7
Above, figures 4a and 4b contrast suicide rates by race and ethnicity in the nation and state. Most remarkable among these trends, highlighted in figure 5 below, is population and there are 2 suicides in that group in a single year, the suicide rate for that year is 100/100,000—an exceedingly (and misleadingly high) rate. If the next year, there are 3 suicides, the rate will jump to 150. If the following year, there is only 1 suicide, the rate drops to 50. Small changes in the numerator can result in large swings in rates due to this multiplier effect and thus mortality rates for small populations must be interpreted with caution. This cautionary principle applies to rural counties in Nevada, many of which have total populations of less than 5000 people.

Suicide Trends 8
the 17 percent decline in the rate of suicide among white Nevadans from 25.2 to 21 at the time when the national suicide rate for whites has risen 11 percent, from 11.3 to 12.5. The decline in suicide among Nevada’s white population is largely attributable to the declining trend in male suicide discussed above. Nationally, suicide rates among men slightly increased during that time period.
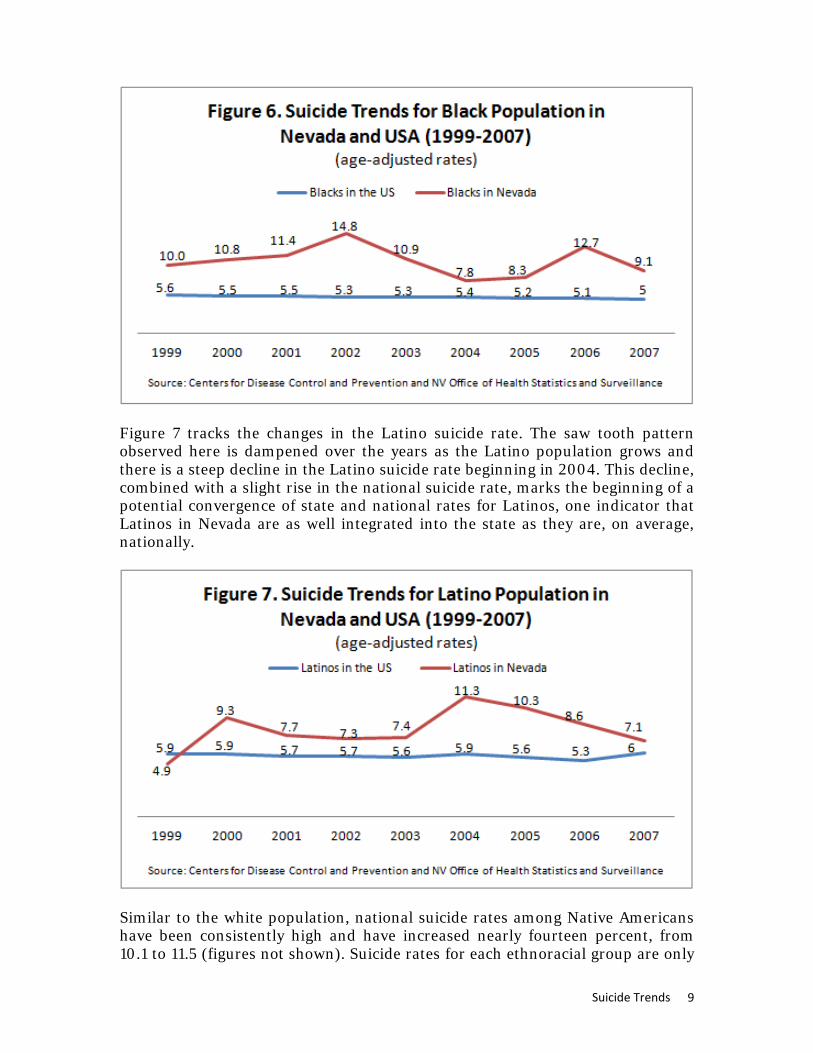
Figure 6 below charts the trends in the Black suicide rate, depicting large year to year changes in the rates, as well as periods of extremely high suicide levels when compared to the national average for this population. From a peak of 14.8 in 2002 (nearly three times higher than the national average for blacks) the rate has mostly declined to levels that are about twice the national average, which is what we also see among white populations in Nevada. The unexplained exception is 2006, but again, the relatively small population of Blacks in Nevada (about 200,000, or 8% of the total population) makes interpreting year to year changes difficult.
Suicide Trends 9
Figure 7 tracks the changes in the Latino suicide rate. The saw tooth pattern observed here is dampened over the years as the Latino population grows and there is a steep decline in the Latino suicide rate beginning in 2004. This decline, combined with a slight rise in the national suicide rate, marks the beginning of a potential convergence of state and national rates for Latinos, one indicator that Latinos in Nevada are as well integrated into the state as they are, on average, nationally.
Similar to the white population, national suicide rates among Native Americans have been consistently high and have increased nearly fourteen percent, from 10.1 to 11.5 (figures not shown). Suicide rates for each ethnoracial group are only

Suicide Trends 10
reported when more than five suicides occurred in a single year. The relatively small number of cases and the small population makes it difficult to interpret trend lines, but the reported rates for the following years 1999 (30.4); 2001 (39.7); 2003 (17.5); and 2006 (13.1) suggest that rates are declining in Nevada, countering the national trend. Figure 8 below depicts changes in the suicide rate among Asians in Nevada. Total suicide counts among Asians in 2005 was less than 5, so the rate is suppressed. But remaining years clearly show that rates of suicides among Asians are typically lower than they are for other minorities in Nevada, even though nationwide, Blacks, Latinos and Asians experience similar rates (about 5.5 per 100,000, or approximately half the overall suicide rate). Why Asians in Nevada enjoy substantially lower suicide risk than other racial minorities in Nevada is not well understand.
Urban and Rural Rates A well-established rural-urban gradient in suicide rates exists in the United States, with rural areas having consistently higher rates of suicide than urban areas since at least the 1970s (Singh & Siapush 2002; Branas et al. 2004). This gradient exists within Nevada as well, with rural counties generally exhibiting higher rates of suicide than urban counties.

Suicide Trends 11
Of Nevada’s seventeen counties, only two—Clark (Las Vegas) and Washoe (Reno)—are designated by the census department as urban. As illustrated by Figure 9 above, Clark County experiences lower suicide rates than the rest of Nevada and suicide rates have been slowly declining in Clark County from 18.9 to 16.9, a decline of 11 percent. Suicide rates in Washoe County have fluctuated between 18 and 22 and have generally far exceeded the total Nevada suicide rate. But it is Nevada’s rural counties that post the highest annual suicide rates, in keeping with the national trends observed over the last four decades.3
In both Nevada and the larger US, rural areas pose uniquely high suicide risks compared to cities or suburbs. Public health researchers have found in several studies that the availability of guns in rural areas is greater than in urban areas and that this difference in gun availability increases suicide risk in rural areas, particularly among rural men, who are more likely to use guns than are women (Branas et al. 2004; Miller et al. 2002).
Rates by Age As shown in Figures 10a, 10b, and 11, suicide rates have consistently been the highest among the elderly (75+ years old) and the middle-aged (45-64 years old). Between 1999 and 2007, suicide rates among the elderly, both on the national and Nevada state levels, have been declining. Nationally, suicide among 75-84 year olds went down from 18.1 to 16.3 and among the 85 and older population group it decreased from 19.3 to 15.6. A significantly more pronounced decline occurred among the elderly in Nevada. Among 75-84 year olds, for example, suicide declined from 54.8 to 34.7, although as these raw numbers attest, elderly
3 In light of the cautionary principle noted above, rather than reporting rates county by county, we have aggregated all of the rural counties, thus insuring large denominator and numerator.

Suicide Trends 12
suicide rates in Nevada remain alarmingly high—more than twice the national average.

Suicide Trends 13
Contrary to the suicide trends among the elderly population, national rates of suicide among the middle-aged population have been gradually increasing (Paulozzi et al. 2007). For example, suicide among the 45-54 year old population went up from 13.9 to 17.7. Among the 55-64 year old population, it rose from 12.2 to 15.5. In the state of Nevada, while suicide among the 55-64 year old group has been precipitously increasing from 24.4 to 31.3, suicide among those aged 45-54 fluctuated in a relatively consistent manner (ranging between 23 and 29) with the exception of three years when it spiked to 33.8 in 2000, 33.9 in 2004 and 33.5 in 2008. All of these spikes could arguably be related to the burden of economic recessions on the working-age population, although additional data would be necessary to test this hypothesis. Rates by Method of Suicide As figure 12 illustrates below, guns play a major role in Nevada suicide rates; they are by far the most common method, as they are in the rest of the US (Brent 2001). An average of 57.7 percent of suicides occur by means of firearms, more than twice the average of suicides that occur by hanging (20.6 percent). Guns are an extraordinarily lethal method by which to attempt suicide and these attempts result in a much higher percentage of completions than attempts by other means, such as intentional drug overdoses, which often result in non-fatal suicide attempts (Goldsmith et al. 2002).

Suicide Trends 14
Systematic research on suicide prevention demonstrates clearly that policies and practices that promote firearm safety in the home reduce overall suicide rates (Mann et al. 2005). While such efforts to limit access to unsafe firearms in the home continue to be unpopular with legislators, high levels of gun ownership and accessibility in Nevada coupled with high levels of suicide by gun indicate that restricting access to guns remains an underutilized and potentially powerful strategy to reduce statewide suicide rates. This logic holds true for prescription drugs, which contribute directly to the state’s high rate of suicide by poisoning (Chino et al. 2010). Rates of suicide by self-poisoning are now approaching rates by hanging and suffocation. Based on the available scientific evidence, restricting access to these means of suicide should be a high priority. National Suicide Prevention Efforts The National Strategy for Suicide Prevention (NSSP) issued by the Surgeon General in 2001 became the first national plan designed to tackle the issue of suicide in a systematic and comprehensive fashion (SAHMSA 2001). During the past 10 years, the federal government declared it a priority to reduce and prevent suicide among youth as well as military members and veterans. Following the publication of the NSSP, local governments and non-profit agencies initiated a variety of programs aimed at preventing suicide. The Garrett Lee Smith Memorial Act (GLS), passed in 2004, authorized funding to state governments for statewide suicide prevention programs among youth to programs aimed at reducing mental and behavioral health problems among students (SPRC & SPAN USA 2010). The grant program is named after former Senator Gordon Smith’s son who died by

Suicide Trends 15
suicide. The State of Nevada was part of the first cohort of the GLS program funding, which is administrated by the Substance Abuse and Mental Health Services Administration (SAMHSA), a federal agency established by Congress in 1992 to reduce the effects of mental illness and substance abuse on Americans. Suicide among veterans and military servants continues to be a growing concern. Despite various suicide prevention and mental health programs implemented by the Department of Defense, suicide rates in the military are significantly higher than in the past (US Army 2010). With the passage of the Joshua Omvig Veterans Suicide Prevention Act in 2007, a comprehensive suicide prevention and mental health program has been designed and implemented by the Department of Veterans Affairs to reduce suicide rates among veterans (SPRC & SPAN USA 2010). The past decade has thus witnessed an unprecedented level of federal government involvement in addressing the issue of suicide.
Suicide Prevention Efforts in Nevada Since its founding in 2005, the Nevada Office of Suicide Prevention (NOSP) has made significant progress in addressing the persistent problem of suicide among state residents. In addition to crafting the Nevada Suicide Prevention Plan 2007-2012, the NOSP has successfully implemented a wide range of programs and initiatives, both state-wide and local, aimed at suicide prevention and raising public awareness about suicide. Given that the state has directly funded just two officers to coordinate and direct suicide prevention efforts for the entire state, the achievements of this office have been remarkable. We highlight below the goals of the statewide prevention plan, adopted in May 2007, which are intended to guide statewide suicide prevention strategies and policies through 2012. Also, we briefly profile some of the NOSP’s most noteworthy efforts, including the cutting-edge statewide text message crisis intervention service; the community-based annual “Walk in Memory, Walk for Hope” initiative; and suicide prevention efforts in Native American communities. Goals of the Statewide Suicide Prevention Plan The Nevada Suicide Prevention Plan is based on the goals of the NSSP with objectives and additional recommendations modified for Nevada. Goal 1: Promote awareness that suicide is a public health problem that can be
prevented. Goal 2: Develop broad-based support for suicide prevention. Goal 3: Develop and implement strategies to reduce the stigma associated with
being a consumer of mental health, substance abuse, and suicide prevention services.
Goal 4: Develop and implement community-based suicide prevention and
postvention programs.

Suicide Trends 16
Goal 5: Promote efforts to reduce access to lethal means and methods of self- harm.
Goal 6: Implement training for recognition of at risk behavior and delivery of
effective treatment. Goal 7: Engage professional organizations in the development and promotion of
effective clinical and professional practices. Goal 8: Improve access to and community linkages with mental health and
substance abuse services. Goal 9: Improve reporting and portrayals of suicidal behavior, mental illness, and
substance abuse in the entertainment and news media. Goal 10: Partner with other agencies and academic researchers who are
advancing suicide prevention research efforts. Goal 11: Improve and expand surveillance systems (goals excerpted verbatim
from Allen et al, 2007, 36-43). Efforts to meet these goals are highlighted below in brief descriptions of several strategic programs developed by the NOSP in the past five years. Text Message Support Program The Text Message Support Program, administered by the Crisis Call Center in partnership with Educational Message Services (EMS) Inc., is the first school-based live crisis intervention service for youth in the United States. While the Crisis Call Center has been successfully operating a 24-hour crisis prevention hotline in Nevada since 1966, it recognized the need to adapt its communication methods with youth to the changing communication patterns and needs in this population group (EMS 2010a). Texting is widely considered the preferred means of communication among youth and is a potentially effective tool in encouraging young people to reach out to professional support services in a crisis situation. As part of the Text Message Support Program, EMS installs narrowcast displays in visible public and private spaces, such as school libraries, cafeterias, and restrooms in participating schools (EMS 2010b). Prompted by these displays, students can communicate live via text message with trained volunteers at the Crisis Call Center. The program has been launched in twelve middle and high schools. These schools are located in Washoe County, the second largest county in Nevada, and two rural counties (Lyon and Storey); one tribal high school is included. Clark County schools are expected to join the program in 2011-12. The program is designed to advance Goals 1, 2, 3, 4, 8 and 9. Walk in Memory, Walk for Hope The annual Walk in Memory, Walk for Hope is another successful initiative implemented by the NOSP in partnership with the Nevada Coalition of Suicide Prevention. The first Walk took place in 2006 in the city of Elko, NV. In 2010,

Suicide Trends 17
seven communities (Reno, Las Vegas, Douglas County, Hawthorne, Winnemucca, Pyramid Lake, and Yerington) joined the initiative and organized a walk on the same day during National Suicide Prevention and Awareness Week in September. Another community, Pahrump, will participate in the 2011 Walk. Nearly 800 people participated in the Walk in 2010, while only 50 participants walked in the first year of the initiative. The annual walk aims to raise public awareness about suicide and suicide prevention as well as to raise funds for the Nevada Coalition for Suicide Prevention in keeping with Goals 1 and 2 of the statewide plan. The funds raised through the walks stay in the respective local communities to build their grassroots suicide prevention programs, consistent with Goal 4. Media Campaigns As part of the Garrett Lee Smith Memorial Youth Suicide Prevention Initiative in Nevada, launched in 2005 with the help of the GLS funding, the NOSP, in partnership with the Clark County Children’s Mental Health Consortium, is implementing large-scale media campaigns targeted at youth, parents and the public at large to raise awareness about the issue of suicide in Nevada as well as reduce stigma around mental health disorders and encourage help-seeking behaviors. The youth-focused campaign promotes the National Suicide Prevention Lifeline for children and teens who feel like they have no one to speak to. It also encourages friends to help friends—emphasizing that one does not need to be an expert in suicide prevention in order to help a friend. Finally, public advertisement also promotes youth-friendly national websites (such as www.reachout.com) that encourage youth to help themselves and each other. These media campaigns are key strategies aimed at achieving Goals 1, 2, 3 and 9. Statewide Epidemiological Workgroup (SEW) The NOSP has also made significant advances with respect to Goals 10 and 11 in building effective regional and local partnerships to facilitate data-sharing among the relevant agencies and to coordinate suicide prevention efforts. Seeking to address health-related issues in a comprehensive fashion, Nevada launched a Statewide Epidemiological Workgroup hosted by the Substance Abuse and Prevention Agency (SAPA) under the Nevada Division of Mental Health. SAPA has had an active Statewide Epidemiology Workgroup since 2004. The Workgroup currently includes epidemiologists from the Nevada State Health Division, Clark County, and the Indian Health Board of Nevada. Members also include two community coalition directors; law enforcement and traffic safety; substance abuse researchers; juvenile justice; the Department of Education; domestic violence prevention; suicide prevention; perinatal substance abuse prevention; and youth-serving organizations. The Workgroup includes representatives from all county governments and various state agencies, including the Department of Education, the Department of Health and Human Services, the NOSP, and others. The Workgroup has a mandate to create effective treatment and prevention programs, with suicide prevention included as an essential component of all programming. The Workgroup is also charged with developing a user-friendly data collection tool that will allow all partner organizations to upload data into a centralized location and then use it in their preferred ways. The Workgroup not only places suicide prevention on the agenda

Suicide Trends 18
of Nevada state and county agencies, but it also has the potential to address data acquisition delays, one of the main challenges in the work of the NOSP. When the data collection tool is launched and regularly populated by the stakeholders, suicide prevention officers will be able to track trends and recent patterns in suicide attempts and completions. While more work remains to be done to ensure that suicide prevention officers have access to current data on suicide attempts and completions in Nevada and its counties, the current agenda of the Statewide Epidemiological Workgroup promises to bring about rapid improvements to statewide data-collection and sharing as early as 2012. Children’s Mental Health Consortia Established by the Nevada legislature in 2001 in three regions – Clark County, Washoe County and the rest of the state (rural region)—the Children’s Mental Health Consortia bring together relevant government agencies and community organizations to coordinate regional efforts aimed at prevention and treatment of behavioral health disorders among youth. In each region, Consortia members include representatives from the Division of Child and Family Services, county Departments of Juvenile and Social Services, county school districts, children and parent advocacy groups, and local nonprofit agencies working to address children’s needs and offer services in the community. Legislatively, regional Children’s Mental Health Consortia have a mandate to assess the need for mental health services in their respective regions, to assess the quality of extant efforts to meet the need, and to develop an annual plan of actions to address the need in a more comprehensive effort (Clark County Mental Health Consortium 2002). In 2010, each of the three Consortia developed 10-year plans that were submitted to the legislature. With representatives of the NOSP being among the collaborators in the process, the plans specify a decrease in suicide and suicide attempts among youth as one of the ten-year goals of the Consortia and they outline a range of efforts to be implemented by each Consortium in partnership with the NOSP. For example, in Clark County, the Consortium declared its commitment to expansion of the school-based screening programs, such as TeenScreen, crisis intervention services and training programs for school staff (Clark County Mental Health Consortium 2010). It is expected that based on the ten-year plans, each regional Consortium will develop two-year action plans defining the short-term goals for the Consortium. Clark County hosted its first Youth Suicide Prevention Summit in September 2011, bringing together policy-makers and community members to design an action plan for the county. The regional Children’s Mental Health Consortia allowed the stakeholders to see suicide prevention in the larger context of behavioral health, and not as an isolated issue. They also stimulated partnership building between the Nevada Office of Suicide Prevention and various governmental agencies and community groups. This program is designed to advance multiple prevention goals. Screening Programs In primary care, the American Academy of Pediatrics new standard of care is to integrate behavioral health check-ups into all routine preventive health care visits and procedures (Foy & Perrin 2010). Several validated and efficient mental

Suicide Trends 19
health screening tools and effective treatment services are available. The purpose is to identify behavioral health problems early, to prevent youth suicide, and to link those identified adolescents with services. Nationally, some medical professional groups have begun taking steps to ensure that primary care providers have the training and technical assistance they need , not only to screen, but also to diagnose, treat, and refer patients for mental health diagnoses when necessary. Currently, the NOSP is using the Columbia Health Screen (CHS), a fourteen item, self completed, paper and pencil questionnaire used for youth 11-18 who read at a sixth grade level. The questionnaire is used to identify risk factors in teen suicide. It includes questions about depression, suicidal ideation, attempts, anxiety, alcohol and drug use, and three general health questions. It takes about ten minutes to complete and is available in English and Spanish. In order to participate in a screening the parent and the youth must consent. CHS screenings occur at schools with appropriate school staff and are assisted by NOSP staff as well as community and mental health volunteers. If a youth screens positive, a mental health provider immediately completes a clinical interview, and informs the parent regarding the results. A case manager then helps the parent find follow-up care if recommended. In the past five years, over 10,000 youth have been screened in public and private schools in Clark County. Currently, only one private school has scheduled screening for the 2011-2012 school year. In addition to CHS efforts, twenty-one primary care physicians are currently screening youth and completing federal data forms. Pediatricians, pediatric residents, and public health nurses throughout Nevada have received training to implement screening. NOSP has also partnered with over 100 mental health providers statewide to be available for referrals. Over eighty physicians statewide are screening on their own without funding. Every pediatrician and family practice physician in Nevada has been offered support and training to implement screening tools into his or her well-child checks. NOSP provides the screening materials and shares relevant codes, ICD9s classifications, and modifiers that may be used for physician reimbursement. To date, NOSP has screened approximately 2500 youth for depression and suicidality and trained over 8000 Nevadans in suicide awareness, prevention, intervention, and postvention to help identify youth at risk that were not exposed to screening opportunities. These screening efforts are designed to advance Goals 1, 2, 6, and 7. Native American Suicide Prevention Initiatives Many suicide prevention efforts are underway in Indian Country. Native Aspirations has worked with three communities in Nevada. Two communities have been trained in the Native American Lifeskills Curriculum. The NOSP has collaborated with tribal communities throughout the state, including the IHS Office of Environmental Health and Engineering, the Indian Health Board of Nevada, the Intertribal Council of Nevada, Nevada Urban Indians and several
Suicide Trends 20
communities to address this major public health crisis. These relationships have facilitated opportunities for collaborators to apply for suicide prevention grants and to participate in community trainings and events that promote awareness of youth suicide as an issue, and to build skills in the community for better recognizing those at risk and ensuring that they are supported. Two initiatives are mentioned below. Garrett Lee Smith Tribal Youth Suicide Prevention Grants These 3-year federal grants support state and tribal efforts to prevent suicide by bringing together public and private sector organizations that focus on the lives of young people and put into place a network of services that can help youth in times of crisis. The grant program is authorized under the Garrett Lee Smith (GLS) Memorial Act and is administered by SAMHSA. The Indian Health Board of Nevada was awarded a Cohort 4 GLS grant in 2008 and in 2011, the Pyramid Lake Paiute Tribe was awarded a Cohort 6 GLS grant. The Suicide and Methamphetamine Initiative In 2007, Congress passed an amended H.R. 2764, which appropriated $14,000,000 in funding to tribal and urban communities for methamphetamine abuse and suicide prevention. Since 2009, 134 Federal, Tribal, and urban Indian Programs have been awarded Methamphetamine and Suicide Prevention Initiative (MSPI) grants to carry out local programs in Indian country that prevent or treat meth addiction, suicide or both. The MSPI is a nationally-coordinated demonstration program that is supported by the IHS with programmatic technical assistance support provided by the National Indian Health Board and the National Council of Urban Indian Health. To date, three tribal communities and one urban Indian program have been awarded MSPI funding in Nevada. Community Coalitions and Local Efforts Communities vary in their readiness to recognize problems and take action; suicide prevention programs must be designed accordingly. Focusing on the community gives residents opportunities to become invested in the work, rather than passively relying on one entity to solve the problem. As a major community and public health issue, the problem of suicide requires a community solution. The Nevada Suicide Prevention Plan closely adheres to the recommendations outlined in the National Strategy of Suicide Prevention, which emphasizes the importance of gaining strong and broad support of a variety of organizations and individuals and the importance of coordinating resources and culturally appropriate services at all levels of government - federal, state, tribal, and local - in partnership with the private sector. Given this context, NOSP has developed working partnerships with several community organizations around the state, including the Suicide Prevention Network in Douglas County, the Pyramid Lake Suicide Prevention Coalition, and several school districts. Most notable among these community partners is the Healthy Communities Coalition of Lyon, Storey, and Mineral Counties (HCC). Current members of HCC include seven community Task Forces with a total of

Suicide Trends 21
ninety-seven citizens overall that meet in each community monthly; eight youth prevention teams with a total of 123 members, and a regional provider membership with over thirty local, county, state, tribal, and federal agencies all work collaboratively on a leadership agenda to end poverty and reduce substance abuse which impact suicide rates in Lyon, Storey, and Mineral Counties. The coalition has been meeting for sixteen years and was formally organized eight years ago. These and many other community networks and coalitions have taken significant steps towards implementing the goals and objectives of their local plans, including training of child-serving systems and members of the general community. They have started support groups to offer support and reduce risk to survivors of suicide loss and they are piloting text-messaging programs (discussed above) in their schools and community settings. While this sample of NOSP efforts does not capture the full range of activities of the NOSP, it does suggest the depth and breadth of statewide prevention efforts during the past five years. The Challenges of Economic Recession Arguably, the recession that began in 2007 hit Nevada harder than any other state. Despite official government findings that the national recession is over, Nevada continues to be pummeled by forces of economic contraction and the state’s economy continues its freefall. In large part, this is due to the fact that the twin pillars of Nevada’s economy—tourism and homebuilding—are two economic sectors that remain stalled. Discretionary spending on tourism has been sharply reduced everywhere, resulting in steep declines in visitors to the state. The national housing bust has ground new home construction to a halt and oversupply has sent home prices tumbling. Without these twin engines of economic growth, the state has few other generators of jobs, revenues, and economic stability. This translates into the economic disaster that Nevadans are experiencing today: steep declines in home values coupled with extremely high rates of unemployment, home foreclosure, and personal bankruptcy, within the context of massive cuts to state spending on health, education, and welfare (Wray 2010). These are downward spiraling forces, and they conspire to force people to leave the state, resulting in even further declines in revenues. Nevada, for decades one of the fastest growing states in the country, now appears to be losing residents to states with more robust economies, like Texas. Undoubtedly, if fewer Nevadans were underwater on their homes, the out-migration rate would be even higher. Those who are unable to relocate may find their native optimism about the state’s future severely challenged by these new social realities. Survey research by sociologists Robert Futrell, Barbara Brents, and Christine Batson at University of Nevada, Las Vegas found that by 2009, nearly 40 percent of Nevadans wished they could leave the state entirely (Futrell et al. 2010). Untold thousands of residents want to leave to find better opportunities, but they are stuck because they owe more on their homes than the homes are worth. Feeling trapped can be

Suicide Trends 22
a strong motivator, spurring individuals to work harder to change their circumstances, but it can also lead to feelings of insecurity, hopelessness, and despair, especially by those who have few social supports or those suffering from poor mental health. It is too early to say exactly how the recession will impact Nevada’s already high suicide rate. Final mortality statistics are not yet available for the recession years, nor is it clear when the recession will actually hit bottom and the state will begin to climb back up. But there are indications that the suicide rate will continue to ratchet up as the recession grinds on. Recent research indicates that unemployed people are at 2-3 times greater risk for suicide than employed people (Gunnell et al. 2009). Moreover, a comprehensive study of the impact of the recession on the suicide rate in ten European Union countries concluded that nations that experienced the most severe economic crises saw the sharpest rise in suicide rates (17 percent in Greece and 13 percent in Ireland [Stuckler et al. 2011]). These patterns do not bode well for Nevadans. Perhaps the clearest indicator of the problems ahead can be found in preliminary mortality data from the National Center for Health Statistics that indicate a sharp, 10 percent spike in the Nevada suicide rate in 2008, effectively reversing at once the 11 percent decline in the suicide rate experienced from 1999-2007. The suicide rate declined again in 2009, but preliminary reports from Clark County (which comprises roughly 70 percent of the population of the entire state) indicate the suicide rate spiked again in 2010 to 20.5—a total of 400 suicides compared to 352 in 2009 (Las Vegas Sun 2011). That represents a 17 percent rise compared to 2008. Historically speaking, this is a massive increase. If this seesaw pattern continues to follow an upward trending line, it will effectively reverse the long decline in the state suicide rate that has been observed since the 1970s. There are reasons to believe that this will occur, since the impact of the economic recession is likely to reverberate for years even after economic growth returns to the state, because many individuals may be left behind in the new economy that will emerge from the ruins of today’s economy. For some of our most vulnerable citizens, the damage will already have been done. Conclusions This report has identified current trends in suicide in Nevada, comparing the statewide trends to national trends and identifying how different populations in Nevada experience different levels of suicide risk. In many instances, recent trends in Nevada are in line with the trends we see for the nation as a whole, suggesting that whatever forces are determining the national suicide rate are shaping the Nevada rate as well. This is particularly true for the period immediately following the economic downturn of 2007. However, we identified some key divergences from national trends which may be indicative of different factors at work in the state than elsewhere. These include: a decline in the male suicide rate that is contrary to the national trend; virtually no change in the female suicide rate during a time when suicide among females is increasing nationally; a decline in the white suicide rate that is, again, contrary to

Suicide Trends 23
the national trend. That recent suicide trends by gender and race are so at odds with national trends is striking and bears further investigation. We also identified several strategic efforts underway in Nevada to address the goals of the statewide suicide prevention plan. On the whole, the breadth and scope of the NOSP’s efforts is remarkable to observe. However, there are areas of concern that remain. There is, for instance, a sharp mismatch between the epidemiological facts about those most vulnerable to suicide in Nevada (the elderly and middle-aged, as illustrated in figure 10) and those to whom most of the programs are targeted; i.e., youth aged 15-24. This is partly explained by the fact that federal and non-governmental funding for suicide prevention is disproportionately targeted to teen suicide and school programs, but the fact remains that youth suicide is not a particularly significant problem in Nevada. Our rates for this population are at or slightly above the national mean. While NOSP administrators are well aware of the mismatch, efforts to secure funding for prevention efforts aimed at the middle-aged and elderly have yet to bear fruit. Additionally, while some of the state’s prevention goals are being addressed with multiple strategies, Goal 5, having to do with lethal means reduction is poorly represented in NOSP efforts. Yet this is one of only two prevention strategies that have been shown through rigorous scientific evaluation to have achieved any reduction in suicide rates around the world (Mann et al. 2005). Working with the state legislature, local county governments and municipalities and through its many public/private partnerships, the NOSP should strive to better address issues of reducing access to lethal means such as guns and prescription drugs. In summary, the past five years have witnessed the emergence of an inspiring blend of citizen and community activism and state-sponsored action that has begun to address, in a serious way, both the scope and magnitude of the longstanding problem of Nevada’s high suicide rates. Much work remains to be done, but we hope that this trend continues and that suicide prevention efforts become a permanent feature of the state’s commitments to safeguard the health and well-being of all Nevadans. Acknowledgements The authors would like to thank the following people for their expert and generous assistance in creating this report: Barb Brents, Linda Flatt, Robert Futrell, Stacy Gillham, Alicia Hansen, Jeff Hardcastle, Christine Poole, Dmitri Shalin, Cathy Staples, Brad Towle and the staff of the Nevada Office of Suicide Prevention.

Suicide Trends 24
References Allen M, Flatt L, Tyson J, Bates S. 2007. “Preventing Suicide One Community at a
Time: Nevada Suicide Prevention Plan 2007-2012.” Office of Suicide Prevention. Department of Health and Human Services.
Branas CC, Nance ML, Elliott MR, Richmond TS, Schwab CW. 2004. "Urban-
Rural Shifts in Intentional Firearm Death: Different Causes, Same Results." American Journal of Public Health 94(10):1750.
Brent D. 2001. “Firearms and Suicide.” Annals of the New York Academy of
Sciences 1:225-240. Centers for Disease Control and Prevention (CDC). Web-based Injury Statistics
Query and Reporting System (WISQARS) [Online]. (2007). National Center for Injury Prevention and Control, CDC (producer). Available from URL: www.cdc.gov/injury/wisqars/index.html.
Chino M, LaValley, J, Haff D, Harris DA, Rivers, AR.. 2010. Injury in Nevada.
University of Nevada, Las Vegas. http://health.nv.gov/PDFs/InjuryInNevada.pdf.
Clark County Mental Health Consortium. First Annual Plan. 2002. http://www.dcfs.state.nv.us/CW_Policies/Consortia/CLARK/ClarkCountyChildr
ensMentalHealthConsortiumFirstAnnualPlan.pdf. Clark County Mental Health Consortium. 10-Year Strategic Plan. 2010.
http://www.dcfs.state.nv.us/CW_Policies/Consortia/CLARK/CLARK10-YearStrategicPlan.pdf.
Educational Message Services. 2010a. School Participation Information Sheet. Educational Message Services. 2010b. School Participation Agreement. Foy, JM, Perrin, J. 2010. “Enhancing Pediatric Mental Health Care: Strategies for
Preparing a Community.” Pediatrics. Vol. 125. Supplement: 575-86.
Futrell R, Batson C, Brents B. 2010. Las Vegas metropolitan area social survey 2010 highlights. http://digitalcommons.library.unlv.edu/reports/2.
Goldsmith SK, Pellmar TC, Kleinman AM, Bunny WE, (Eds). 2002. “Reducing
Suicide: A National Imperative.” Washington, DC: National Academies Press.
Gunnell D, Platt S, Hawton K. 2009. “The economic crisis and suicide.” BMJ
338:b1891.

Suicide Trends 25
Harper S, Yang S, Lynch J. 2008. “Is there a Suicide Belt in the United States?” Paper presented at the Society for Epidemiologic Research, June. 25.
Kawachi I, Berkman L. 2001. “Social ties and mental health.” Journal of Urban
Health 78 (3): 485 Kochanek KD, Xu JQ, Murphy SL, Miniño AM, Kung HC. 2011. Deaths:
Preliminary Data for 2009. National Vital Statistics Reports; vol 59 no 4. Hyattsville, MD: National Center for Health Statistics.
Las Vegas Sun. 2011. “Tough Times: Slow Recoverty May Be a Factor in Suicide
Increase.” http://www.lasvegassun.com/news/2011/apr/11/tough-times-slow-recovery-las-vegas-may-be-factor-.
Luo, F, Florence CS, Quispe-Agnoli, M, Ouyang, L, and Crosby AE. 2011. Impact
of Business Cycles on US Suicide Rates, 1928–2007. American Journal of Public Health. Vol. 101, No. 6: 1139-46.
Mann JJ, Apter A, Bertolote J, Beautrais A, Currier D, et al. 2005. Suicide
prevention strategies: a systematic review. JAMA 294:2064–74. Miller M, Azrael D, Hemenway D. 2002. “Firearm availability and unintentional
firearm deaths, suicide, and homicide among 5-14 year olds.” Journal of Trauma, Injury Infection, and Critical Care 52(2): 267-275.
Miniño AM, Xu JQ, Kochanek KD. 2010. Deaths: Preliminary Data for 2008.
National Vital Statistics Reports; vol 59 no 2. Hyattsville, MD: National Center for Health Statistics.
Pampel FC. 1998. National context, social change, and sex differences in suicide
rates. American Sociological Review 63:744–58. Paulozzi, L, Crosby A, Ryan, G. 2007. “Increases in Age-Group--Specific Injury
Mortality --- United States, 1999—2004.” MMWR 56(49);1281-84. Singh, GK, Siahpush, M. 2002. “Increasing Rural-Urban Gradients in US Suicide
Mortality, 1970-1997.” Am J Public Health 92(7):1161-7. Stuckler D, Basu S, Suhrcke M, Coutts A, McKee, M. 2009. “The public health
effect of economic crises and alternative policy responses in Europe: an empirical analysis.” The Lancet. Vol. 374, Iss. 9686: 315-23.
Stuckler D, Basu S, Suhrcke M, Coutts A, McKee, M. 2011. “Effects of the 2008
recession on health: a first look at European data.” The Lancet. Vol. 378, Iss. 9786, Pages 124–25.
Suicide Trends 26
Suicide Prevention Resource Center, Suicide Prevention Action Network USA. 2010. Charting the Future of Suicide Prevention: A 2010 Progress Review of the National Strategy and Recommendations for the Decade Ahead.
U.S. Army. 2010. Health Promotion, Risk Reduction and Suicide Prevention
Report. Xu JQ, Kochanek KD, Murphy SL, Tejada-Vera B. 2010. Deaths: Final data for
2007. National vital statistics reports; vol 58 no 19. Hyattsville, MD: National Center for Health Statistics. Available from URL: http://www.cdc.gov/NCHS/data/nvsr/nvsr58/nvsr58_19.pdf.
World Health Organization. N.d. “Country Reports.”
http://www.who.int/mental_health/prevention/suicide/country_reports/en/index.html.
Wray M. 2006. “Suicide Trends in Nevada.” In Dmitri Shalin, ed. The Social
Health of Nevada. http://www.unlv.edu/centers/cdclv/healthnv/health_contents.html.
Wray, M. 2010. “Losing Las Vegas: Risk-Taking in the Age of Constraint.”
Contexts Magazine. Vol. 9, no. 4. (Fall). Wray M, Colen C, & Pescosolido B. 2011. “The Sociology of Suicide.” Annual
Review of Sociology 37:505-28. Wray M, Miller M, Gurvey JE, Carroll J, Kawachi I. 2008. Leaving Las Vegas:
exposure to Las Vegas and risk of suicide. Social Science & Medicine 67:1882–88.
Nationwide Resources American Association of Suicidology is a national clearinghouse for
suicide-related information and research. 4201 Connecticut Avenue, N.W., Suite 408. Washington, DC 20008. Tel. 202-237-2280, Fax 202-237-2282. More information can be found at the association’s web site: http://www.suicidology.org.
National Center for Injury Prevention and Control, Centers for
Disease Control and Prevention provides a wealth of information and statistics related to suicide and suicidality in the United States. 1600 Clifton Road, N.E., Atlanta, GA 30333 USA. Tel. 404-639-3534 or 800- 311-3435. Web link: http://www.cdc.gov/ncipc/.
National Suicide Prevention Lifeline is an anonymous toll free hotline for
anyone experiencing suicidal thoughts or emotions. Tel. 800-273-TALK or

Suicide Trends 27
800-779-4TTY. http://www.suicidepreventionlifeline.org/. Funded and organized by the US Department of Health and Human Services, Substance Abuse and Mental Health Services Administration. Web link: http://www.samhsa.gov.
Native American Suicide Prevention -- The Suicide Prevention
Resource Center. http://www2.sprc.org/aian/index. The Native American Center for Excellence (NACE) was established by
SAMHSA’s Center for Substance Abuse Prevention (CSAP) as a national resource to address issues related to substance abuse prevention and behavioral health in Native American communities.
Suicide Prevention Resource Center promotes the implementation of the
National Strategy for Suicide Prevention and enhances the nation’s mental health infrastructure by providing states, government agencies, private organizations, colleges and universities, and suicide survivor and mental health consumer groups with access to the science and experience that can support their efforts to develop programs, implement interventions, and promote policies to prevent suicide. http://www.sprc.org.
To Live to See the Great Day That Dawns, a guide (PDF) from the
Substance Abuse and Mental Health Administration, lays the groundwork for comprehensive suicide prevention planning. The guide explores some of the cultural issues around prevention and describes respectful approaches. It also provides practical tools and resources that a community can use for assessment, program selection, coalition-building, and implementation of a comprehensive plan, http://www.samhsa.gov/samhsaNewsletter/Volume_18_Number_3/MakingOfLiveToSeeTheGreatDay.aspx.
Nevada-based Resources Crisis Call Center is the statewide suicide hotline, operating 24/7/365.
Hotline services are now available in text-messaging format, as well. www.crisiscallcenter.org, PO Box 8016, Reno, NV 89507. Business Line 775-784-8085. Toll-free 1-800-273-TALK (8255).
Healthy Communities Coalition of Lyon, Mineral and Storey Counties is a
collaboration of groups and citizens that agree to work together so that all members of our communities have opportunities to grow, learn and thrive. Phone: (775) 246-7550 or http://healthycomm.org/Home.shtml.
Nevada Coalition for Suicide Prevention is a volunteer membership based
organization that serves to coordinate and direct community, county, and statewide suicide prevention and intervention efforts. They offer training

Suicide Trends 28
opportunities and annual awareness events. 205 N. Stephanie St., Ste. D #149, Henderson, NV 89074. http://www.nvsuicideprevention.org.
Nevada Division of Mental Health and Developmental Services is the
state government agency responsible for caring for and improving the mental health of Nevada’s citizens. Inpatient and outpatient services are available in Washoe and Clark counties, and outpatient services are available throughout the rural counties, http://mhds.state.nv.us/. 4126 Technology Way, Ste 201, Carson City, NV 89706 Tel. 775-684-5943.
Nevada Office of Suicide Prevention is the state government office devoted
to comprehensive suicide prevention efforts across the state. www.suicideprevention.nv.gov, 445 Apple St., Ste 104, Reno, NV 89502 Tel: 775-443-7843.
Suicide Prevention Network of Douglas County provide suicide
prevention, intervention, education and support services for all members of Douglas County. 1702 County Road, Suite A3 Minden, Nevada 89423 775.783.1510 or .