Embed Size (px)
Citation preview
LEADING CAUSES OF DEATH IN CHICAGODATA FROM 2006
CITY OF CHICAGO • DEPARTMENT OF PUBLIC HEALTH • OFFICE OF EPIDEMIOLOGY
Health Status Index SeriesVolume XVIII Number II
Suggested CitationHarper-Jemison DM, Thomas SD, Woldemi-chael G. Leading Causes of Death in Chi-cago. Health Status Index Series: Vol. XVIII No. II. Chicago, Illinois: Chicago Department of Public Health Office of Epidemiology, 2009.
Leading Causes of Death in ChicagoDana M. Harper-Jemison, B.S.Sandra D. Thomas, M.D., M.S.Girma Woldemichael, Ph.D.
Copyright InformationAll material appearing in this report is in the public domain and may be reproduced or copied without permission; citation as to source, however, is appreciated.
TABLE OF CONTENTS
Preface..............................................................................................i
Executive Summary.............................................................................ii
CHAPTER 1Methods..............................................................................................1
CHAPTER 2Ten Leading Causes of Death by Ethnicity and Age, 2006...................5
CHAPTER 3Ten Leading Causes of Death by Age-Specific Ethnicity, 2006...........33
CHAPTER 4Ten Year Comparison of 2006 Leading Causes of Death....................45
Appendix....................................................................................59
Tables in this report provide leading cause of death information for all Chicago residents and for the following subgroups:
• Gender• Ethnicity• Age
Tables in Chapters 2 and 3 list:
• Ten leading causes of death in descending order
• Total number of deaths associated with each leading cause
• Annual number of deaths due to all causes
Graphs in Chapter 4 contain mortality rates for 2006 and comparability-adjusted rates for 1996 for:
• 2006 ten leading causes of death • Deaths due to all causes
PREFACE
This edition of the Leading Causes of Death in Chicago has two major changes from the 2008 version. We have converted from age-adjusted to actual (crude) mortality rates for ten year trend comparisons. To reflect the changing demographics of Chicago’s Hispanic population, we have added the Central American population as a study group and dropped reporting for the Cuban population. The report begins with data on the 2006 leading causes of death for Chicago residents presented for different ethnic groups and sex by detailed age categories, and for different age groups by ethnicity categories. The report concludes with ten year comparisons of mortality rates for 2006 leading causes and all-cause death by ethnicity and sex. It is hoped that this report will prove helpful in developing effective public health interventions in Chicago. Questions, comments or suggestions for improving future editions are welcome. Please contact:
Office of Epidemiology Chicago Department of Public Health 333 South State Street DePaul Center, Room 2137 Chicago, IL 60604-3972 312-747-9617
Health Status Index Series Vol XVIII No II pg. i
EXECUTIVE SUMMARY
Health Status Index Series Vol XVIII No II pg. ii
The ten leading causes of death for •Chicago residents represented 77% of all deaths, and 72% of all infant deaths. Although the positioning changed slightly, the 2006 leading causes of death were the same as those for 2005 and most of the 2006 leading causes of infant death were the same.
Heart disease and cancer were the top •two leading causes of death for all Chi-cago residents, also for both sexes and all ethnic groups studied.
Although HIV/AIDS mortality continues to •decline, it was among the leading causes of death for two groups —non-Hispanic Black Males, and Puerto Rican Males.
Either prematurity related disorders or •birth defects were the top cause of infant death for all ethnic groups studied, with the exception of Puerto Ricans. For Puerto Ricans, SIDS (Sudden Infant Death Syn-drome) was the leading cause of infant mortality.
Infant mortality (Certain Conditions Origi-•nating in the Perinatal Period) is one of the leading causes of death for Chicago’s Mexican population.
For the 15-24 age group, either homicide, •accidents or suicide was the leading cause of death for all ethnic and gender groups studied.
Homicide was the 10• th leading cause for all Chicagoans, and the 5th leading cause of death for the Mexican and non-Hispan-ic Black populations in Chicago.
Heart disease mortality declined dramati-•cally from 1996 to 2006, but these im-provements were not distributed evenly. Non-Hispanic Whites and Asian popula-tions, and non-Hispanic Black Females all had significant decreases in heart disease mortality rates, while Hispanics and non-Hispanic Black males saw no im-provement or worsening of heart disease mortality.
Cancer mortality decreased from 1996 to •2006 for all Chicago residents. This was driven by a decline in cancer mortality for the non-Hispanic White population, all other ethnic categories had stable or increasing cancer mortality rates.
Influenza & pneumonia mortality im-•proved slightly over the ten year period but remained the 9th leading cause of death for Chicagoans.
Alzheimer’s disease is becoming an •increasingly common cause of death for Chicago women. Non-Hispanic White women have the highest mortality rate from Alzheimer’s but non-Hispanic Black women had the most rapid increase, with mortality rates tripling over the ten year period (1996-2006).

CHAPTER 1
METHODS
BACKGROUND In order to understand and appro-priately interpret the data, it is important to understand:
•datareportingcriteria,•causeofdeathdetermination,•rankingprocedures,and•ratecalculations.
DATA REPORTING CRITERIA The guidelines for data release used by the Office of Epidemiology balance data acces-sibility with privacy concerns and the stability of the statistics we publish. Rates based on a few events (e.g. 20 or less) can vary widely just by random chance even when there is no meaningful statisti-cal difference between measurements. Rare events occurring in large populations do not usually allow for the identification of individu-als, but reporting small cell sizes for popula-tion subgroups increases the risk of breaching confidentiality. The general guidelines for data re-lease used in this report (adapted from the Massachusetts Department of Public Health) are based on both the numerator (event) and denominator (population or group size) values. To prevent back calculation of sup-pressed numbers, secondary suppression of other numbers may be performed in conjunc-tion with the primary suppression. See Table 1 for specific reporting conditions. Tables were reviewed and additional suppression was applied in some cases when there were two or less rankable causes of death for a small number of deaths in an age group.
The system is periodically revised to reflect advances in medical knowledge and public health priorities. The ninth revision, ICD-9, was used for deaths in the United States for twenty years, 1979-1998. The ICD-10 is the most recent update, and is being used for US deaths with data from 1999 and later. There are important differences between ICD-10 and ICD-9, including the following:
•Thenumberofdetailed categories nearly doubled.
•Importantchangesinsomeof rules for classifying underlying cause of death.
Therefore, even with the same information being recorded on the death certificate, a death can be attributed to a different underly-ing cause of death. Due to these differences, mortality rates based on data classified under ICD-10 cannot be directly compared to ICD-9. In order to compare mortality statistics between deaths in 1996 (classified by ICD-9)and deaths in 2006 (classified by ICD-10), the 1996 data were multiplied by a comparability ratio. There is a different ratio for each cause of death, determined by a comparability study conducted by the National Center for Health Statistics. See the Appendix for the compara-bility ratios used in this publication. Contact the Office of Epidemiology for more informa-tion.
Health Status Index Series Vol XVIII No II pg. 2
CAUSE OF DEATH DETERMINATION All deaths are registered using death certificates. Death certificates are processed and analyzed by a standardized system that is used in most countries throughout the world, the International Classification of Diseases (ICD). On the death certificate, the certifier (a physician, coroner or medical examiner) enters information about the causes and cir-cumstances of death in a specific sequence. When received by the vital statistics office, the causes are placed in standard categories, and the underlying cause of death is then deter-mined. Underlying cause of death is not neces-sarily the first medical condition listed on the death certificate. All of the information on the certificate is examined systematically, using classification rules, to determine the most ap-propriate underlying cause of death.
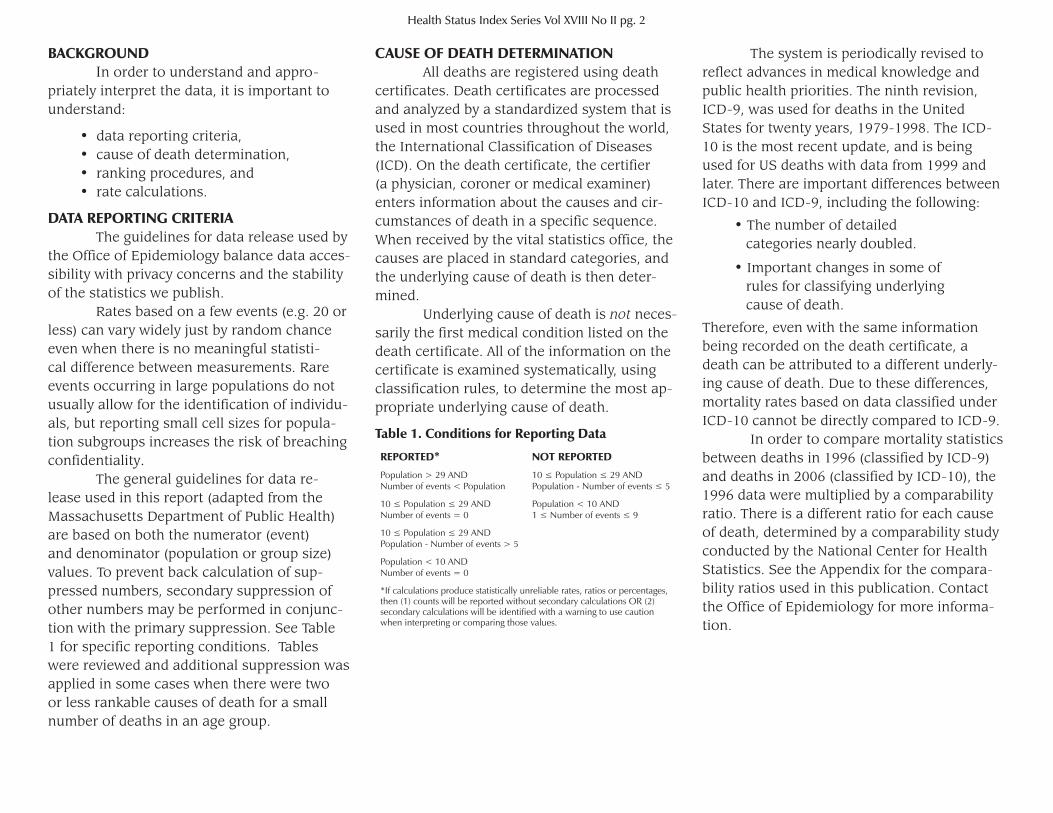
Table 1. Conditions for Reporting Data
reported* not reported
Population > 29 AND Number of events < Population
10 ≤ Population ≤ 29 AND Population - Number of events ≤ 5
10 ≤ Population ≤ 29 AND Number of events = 0
Population < 10 AND 1 ≤ Number of events ≤ 9
10 ≤ Population ≤ 29 AND Population - Number of events > 5
Population < 10 AND Number of events = 0
*If calculations produce statistically unreliable rates, ratios or percentages, then (1) counts will be reported without secondary calculations OR (2) secondary calculations will be identified with a warning to use caution when interpreting or comparing those values.
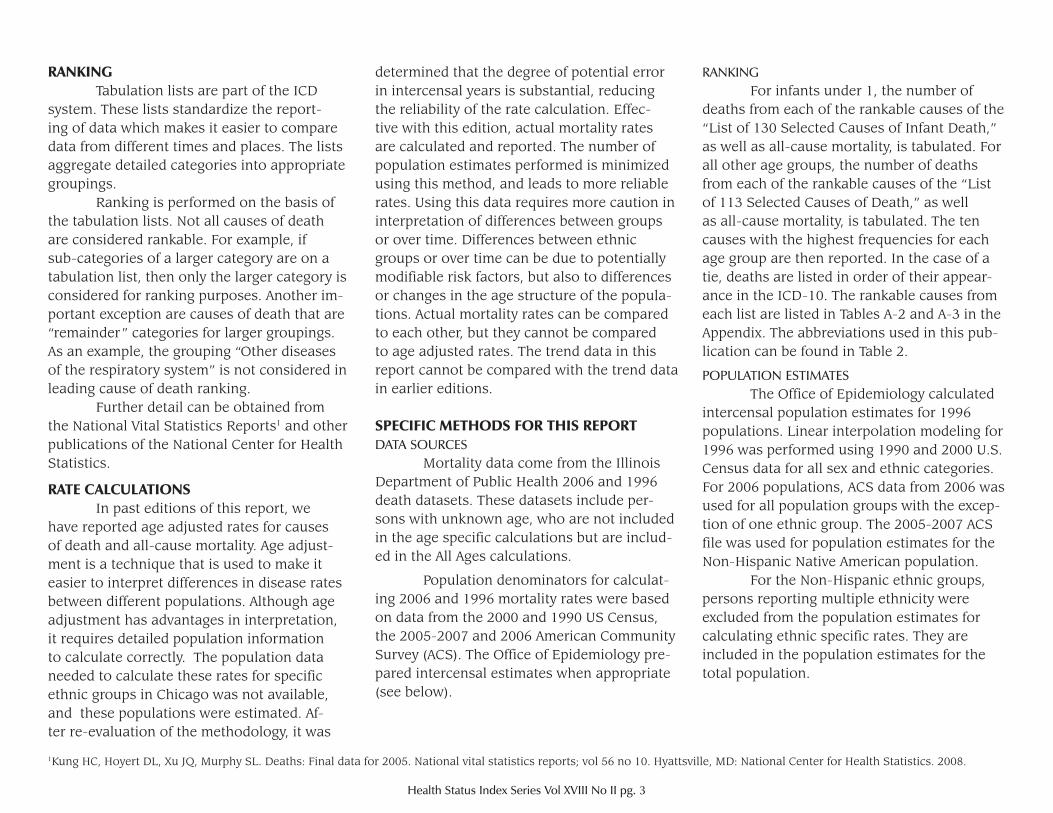
determined that the degree of potential error in intercensal years is substantial, reducing the reliability of the rate calculation. Effec-tive with this edition, actual mortality rates are calculated and reported. The number of population estimates performed is minimized using this method, and leads to more reliable rates. Using this data requires more caution in interpretation of differences between groups or over time. Differences between ethnic groups or over time can be due to potentially modifiable risk factors, but also to differences or changes in the age structure of the popula-tions. Actual mortality rates can be compared to each other, but they cannot be compared to age adjusted rates. The trend data in this report cannot be compared with the trend data in earlier editions.
SPECIFIC METHODS FOR THIS REPORTdata sources Mortality data come from the Illinois Department of Public Health 2006 and 1996 death datasets. These datasets include per-sons with unknown age, who are not included in the age specific calculations but are includ-ed in the All Ages calculations.
Population denominators for calculat-ing 2006 and 1996 mortality rates were based on data from the 2000 and 1990 US Census, the 2005-2007 and 2006 American Community Survey (ACS). The Office of Epidemiology pre-pared intercensal estimates when appropriate (see below).
Health Status Index Series Vol XVIII No II pg. 3
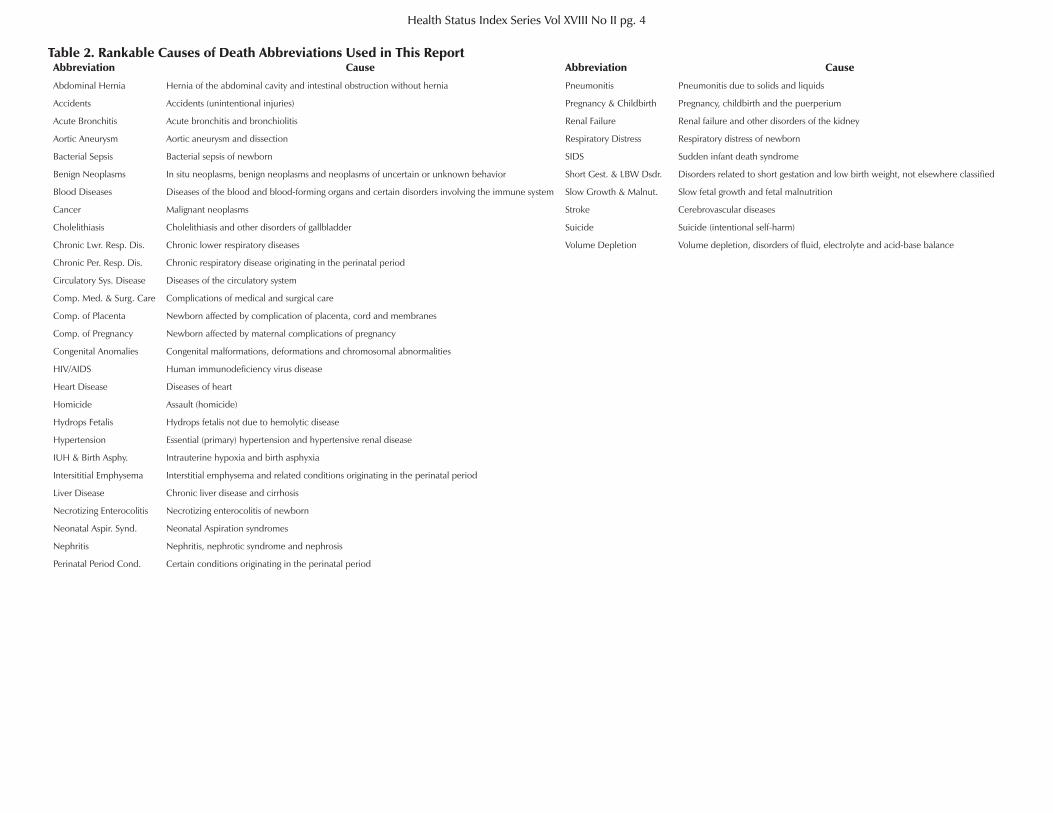
ranking For infants under 1, the number of deaths from each of the rankable causes of the “List of 130 Selected Causes of Infant Death,” as well as all-cause mortality, is tabulated. For all other age groups, the number of deaths from each of the rankable causes of the “List of 113 Selected Causes of Death,” as well as all-cause mortality, is tabulated. The ten causes with the highest frequencies for each age group are then reported. In the case of a tie, deaths are listed in order of their appear-ance in the ICD-10. The rankable causes from each list are listed in Tables A-2 and A-3 in the Appendix. The abbreviations used in this pub-lication can be found in Table 2.
population estimates The Office of Epidemiology calculated intercensal population estimates for 1996 populations. Linear interpolation modeling for 1996 was performed using 1990 and 2000 U.S. Census data for all sex and ethnic categories. For 2006 populations, ACS data from 2006 was used for all population groups with the excep-tion of one ethnic group. The 2005-2007 ACS file was used for population estimates for the Non-Hispanic Native American population. For the Non-Hispanic ethnic groups, persons reporting multiple ethnicity were excluded from the population estimates for calculating ethnic specific rates. They are included in the population estimates for the total population.
RANKING Tabulation lists are part of the ICD system. These lists standardize the report-ing of data which makes it easier to compare data from different times and places. The lists aggregate detailed categories into appropriate groupings. Ranking is performed on the basis of the tabulation lists. Not all causes of death are considered rankable. For example, if sub-categories of a larger category are on a tabulation list, then only the larger category is considered for ranking purposes. Another im-portant exception are causes of death that are “remainder” categories for larger groupings. As an example, the grouping “Other diseases of the respiratory system” is not considered in leading cause of death ranking. Further detail can be obtained from the National Vital Statistics Reports1 and other publications of the National Center for Health Statistics.
RATE CALCULATIONS In past editions of this report, we have reported age adjusted rates for causes of death and all-cause mortality. Age adjust-ment is a technique that is used to make it easier to interpret differences in disease rates between different populations. Although age adjustment has advantages in interpretation, it requires detailed population information to calculate correctly. The population data needed to calculate these rates for specific ethnic groups in Chicago was not available, and these populations were estimated. Af-ter re-evaluation of the methodology, it was
1Kung HC, Hoyert DL, Xu JQ, Murphy SL. Deaths: Final data for 2005. National vital statistics reports; vol 56 no 10. Hyattsville, MD: National Center for Health Statistics. 2008.
Health Status Index Series Vol XVIII No II pg. 4
Abbreviation Cause Abbreviation Cause
Abdominal Hernia Hernia of the abdominal cavity and intestinal obstruction without hernia Pneumonitis Pneumonitis due to solids and liquids
Accidents Accidents (unintentional injuries) Pregnancy & Childbirth Pregnancy, childbirth and the puerperium
Acute Bronchitis Acute bronchitis and bronchiolitis Renal Failure Renal failure and other disorders of the kidney
Aortic Aneurysm Aortic aneurysm and dissection Respiratory Distress Respiratory distress of newborn
Bacterial Sepsis Bacterial sepsis of newborn SIDS Sudden infant death syndrome
Benign Neoplasms In situ neoplasms, benign neoplasms and neoplasms of uncertain or unknown behavior Short Gest. & LBW Dsdr. Disorders related to short gestation and low birth weight, not elsewhere classified
Blood Diseases Diseases of the blood and blood-forming organs and certain disorders involving the immune system Slow Growth & Malnut. Slow fetal growth and fetal malnutrition
Cancer Malignant neoplasms Stroke Cerebrovascular diseases
Cholelithiasis Cholelithiasis and other disorders of gallbladder Suicide Suicide (intentional self-harm)
Chronic Lwr. Resp. Dis. Chronic lower respiratory diseases Volume Depletion Volume depletion, disorders of fluid, electrolyte and acid-base balance
Chronic Per. Resp. Dis. Chronic respiratory disease originating in the perinatal period
Circulatory Sys. Disease Diseases of the circulatory system
Comp. Med. & Surg. Care Complications of medical and surgical care
Comp. of Placenta Newborn affected by complication of placenta, cord and membranes
Comp. of Pregnancy Newborn affected by maternal complications of pregnancy
Congenital Anomalies Congenital malformations, deformations and chromosomal abnormalities
HIV/AIDS Human immunodeficiency virus disease
Heart Disease Diseases of heart
Homicide Assault (homicide)
Hydrops Fetalis Hydrops fetalis not due to hemolytic disease
Hypertension Essential (primary) hypertension and hypertensive renal disease
IUH & Birth Asphy. Intrauterine hypoxia and birth asphyxia
Intersititial Emphysema Interstitial emphysema and related conditions originating in the perinatal period
Liver Disease Chronic liver disease and cirrhosis
Necrotizing Enterocolitis Necrotizing enterocolitis of newborn
Neonatal Aspir. Synd. Neonatal Aspiration syndromes
Nephritis Nephritis, nephrotic syndrome and nephrosis
Perinatal Period Cond. Certain conditions originating in the perinatal period
Table 2. Rankable Causes of Death Abbreviations Used in This Report
CHAPTER 2
TEN LEADING CAUSES OF DEATHBY ETHNICITY AND AGE, 2006
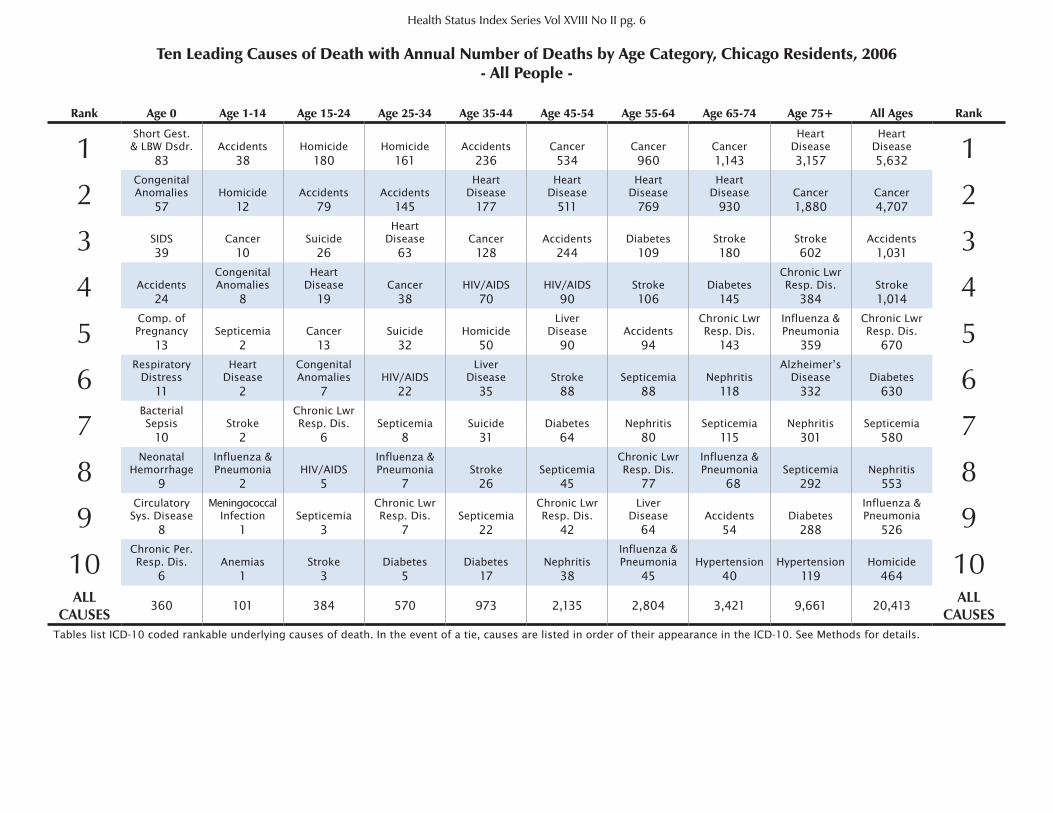
Ten Leading Causes of Death with Annual Number of Deaths by Age Category, Chicago Residents, 2006- All People -
Health Status Index Series Vol XVIII No II pg. 6
Rank Age 0 Age 1-14 Age 15-24 Age 25-34 Age 35-44 Age 45-54 Age 55-64 Age 65-74 Age 75+ All Ages Rank
1Short Gest.& LBW Dsdr. Accidents Homicide Homicide Accidents Cancer Cancer Cancer
HeartDisease
HeartDisease 183 38 180 161 236 534 960 1,143 3,157 5,632
2Congenital Anomalies Homicide Accidents Accidents
Heart Disease
HeartDisease
Heart Disease
HeartDisease Cancer Cancer 257 12 79 145 177 511 769 930 1,880 4,707
3 SIDS Cancer SuicideHeart
Disease Cancer Accidents Diabetes Stroke Stroke Accidents 339 10 26 63 128 244 109 180 602 1,031
4 AccidentsCongenital Anomalies
HeartDisease Cancer HIV/AIDS HIV/AIDS Stroke Diabetes
Chronic Lwr Resp. Dis. Stroke 424 8 19 38 70 90 106 145 384 1,014
5Comp. of Pregnancy Septicemia Cancer Suicide Homicide
LiverDisease Accidents
Chronic Lwr Resp. Dis.
Influenza & Pneumonia
Chronic Lwr Resp. Dis. 513 2 13 32 50 90 94 143 359 670
6Respiratory
DistressHeart
DiseaseCongenital Anomalies HIV/AIDS
LiverDisease Stroke Septicemia Nephritis
Alzheimer’s Disease Diabetes 611 2 7 22 35 88 88 118 332 630
7Bacterial Sepsis Stroke
Chronic Lwr Resp. Dis. Septicemia Suicide Diabetes Nephritis Septicemia Nephritis Septicemia 710 2 6 8 31 64 80 115 301 580
8Neonatal
HemorrhageInfluenza & Pneumonia HIV/AIDS
Influenza & Pneumonia Stroke Septicemia
Chronic Lwr Resp. Dis.
Influenza & Pneumonia Septicemia Nephritis 89 2 5 7 26 45 77 668 292 553
9Circulatory
Sys. DiseaseMeningococcal
Infection SepticemiaChronic Lwr Resp. Dis. Septicemia
Chronic Lwr Resp. Dis.
LiverDisease Accidents Diabetes
Influenza & Pneumonia 98 1 3 7 22 42 64 54 288 526
10Chronic Per. Resp. Dis. Anemias Stroke Diabetes Diabetes Nephritis
Influenza & Pneumonia Hypertension Hypertension Homicide 106 1 3 5 17 38 45 40 119 464
ALL CAUSES
360 101 384 570 973 2,135 2,804 3,421 9,661 20,413ALL
CAUSESTables list ICD-10 coded rankable underlying causes of death. In the event of a tie, causes are listed in order of their appearance in the ICD-10. See Methods for details.
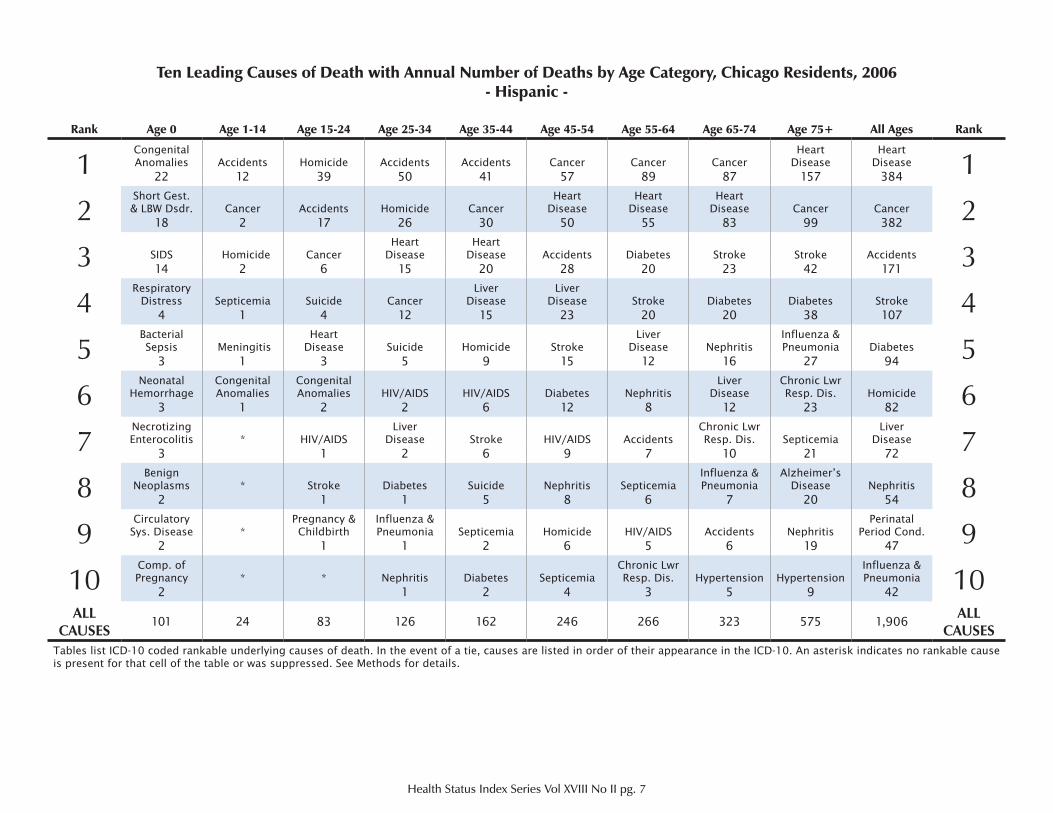
Ten Leading Causes of Death with Annual Number of Deaths by Age Category, Chicago Residents, 2006- Hispanic -
Health Status Index Series Vol XVIII No II pg. 7
Rank Age 0 Age 1-14 Age 15-24 Age 25-34 Age 35-44 Age 45-54 Age 55-64 Age 65-74 Age 75+ All Ages Rank
1Congenital Anomalies Accidents Homicide Accidents Accidents Cancer Cancer Cancer
HeartDisease
HeartDisease 122 12 39 50 41 57 89 87 157 384
2Short Gest.& LBW Dsdr. Cancer Accidents Homicide Cancer
HeartDisease
HeartDisease
HeartDisease Cancer Cancer 218 2 17 26 30 50 55 83 99 382
3 SIDS Homicide CancerHeart
DiseaseHeart
Disease Accidents Diabetes Stroke Stroke Accidents 314 2 6 15 20 28 20 23 42 171
4Respiratory
Distress Septicemia Suicide CancerLiver
DiseaseLiver
Disease Stroke Diabetes Diabetes Stroke 44 1 4 12 15 23 20 20 38 107
5Bacterial Sepsis Meningitis
HeartDisease Suicide Homicide Stroke
LiverDisease Nephritis
Influenza & Pneumonia Diabetes 53 1 3 5 9 15 12 16 27 94
6Neonatal
HemorrhageCongenital Anomalies
Congenital Anomalies HIV/AIDS HIV/AIDS Diabetes Nephritis
LiverDisease
Chronic Lwr Resp. Dis. Homicide 63 1 2 2 6 12 8 12 23 82
7Necrotizing Enterocolitis * HIV/AIDS
LiverDisease Stroke HIV/AIDS Accidents
Chronic Lwr Resp. Dis. Septicemia
LiverDisease 73 1 2 6 9 7 10 21 72
8Benign
Neoplasms * Stroke Diabetes Suicide Nephritis SepticemiaInfluenza & Pneumonia
Alzheimer’s Disease Nephritis 82 1 1 5 8 6 7 20 54
9Circulatory
Sys. Disease *Pregnancy & Childbirth
Influenza & Pneumonia Septicemia Homicide HIV/AIDS Accidents Nephritis
Perinatal Period Cond. 92 1 1 2 6 5 6 19 47
10Comp. of Pregnancy * * Nephritis Diabetes Septicemia
Chronic Lwr Resp. Dis. Hypertension Hypertension
Influenza & Pneumonia 102 1 2 4 3 5 9 42
ALL CAUSES
101 24 83 126 162 246 266 323 575 1,906ALL
CAUSESTables list ICD-10 coded rankable underlying causes of death. In the event of a tie, causes are listed in order of their appearance in the ICD-10. An asterisk indicates no rankable cause is present for that cell of the table or was suppressed. See Methods for details.
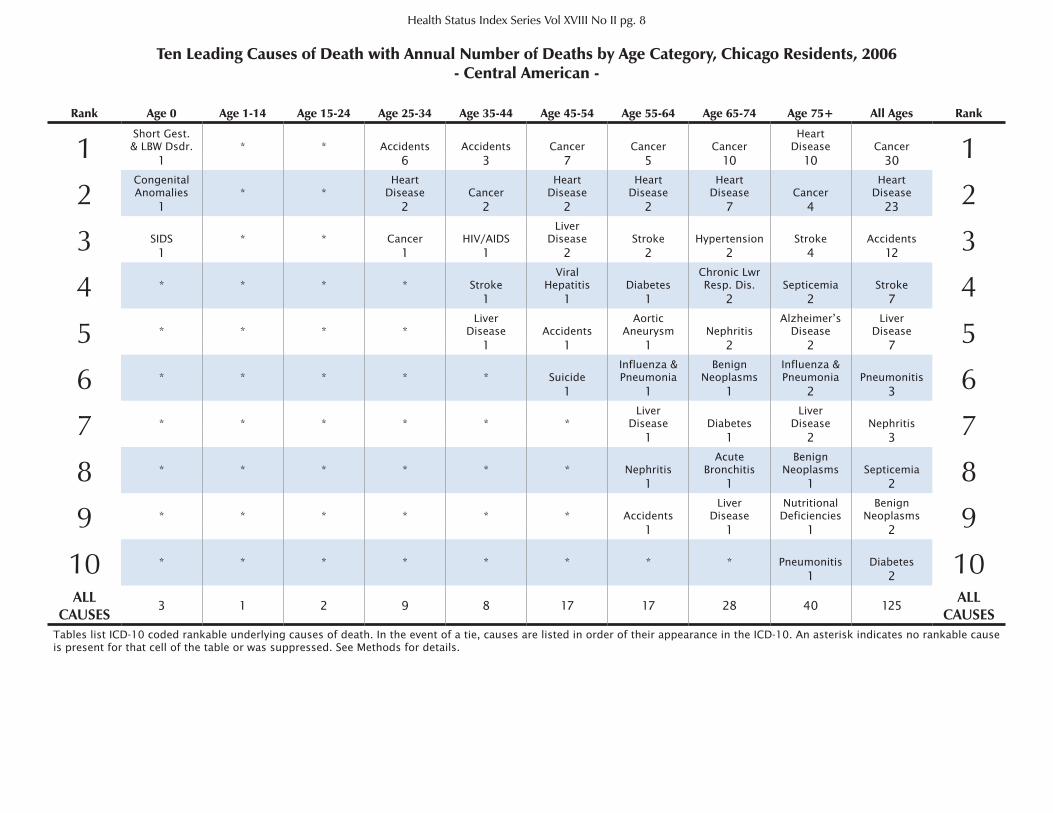
Health Status Index Series Vol XVIII No II pg. 8
Ten Leading Causes of Death with Annual Number of Deaths by Age Category, Chicago Residents, 2006- Central American -
Rank Age 0 Age 1-14 Age 15-24 Age 25-34 Age 35-44 Age 45-54 Age 55-64 Age 65-74 Age 75+ All Ages Rank
1Short Gest.& LBW Dsdr. * * Accidents Accidents Cancer Cancer Cancer
HeartDisease Cancer 11 6 3 7 5 10 10 30
2Congenital Anomalies * *
HeartDisease Cancer
HeartDisease
HeartDisease
HeartDisease Cancer
Heart Disease 21 2 2 2 2 7 4 23
3 SIDS * * Cancer HIV/AIDSLiver
Disease Stroke Hypertension Stroke Accidents 31 1 1 2 2 2 4 12
4 * * * * StrokeViral
Hepatitis DiabetesChronic Lwr Resp. Dis. Septicemia Stroke 41 1 1 2 2 7
5 * * * *Liver
Disease AccidentsAortic
Aneurysm NephritisAlzheimer’s
DiseaseLiver
Disease 51 1 1 2 2 7
6 * * * * * SuicideInfluenza & Pneumonia
Benign Neoplasms
Influenza & Pneumonia Pneumonitis 61 1 1 2 3
7 * * * * * *Liver
Disease DiabetesLiver
Disease Nephritis 71 1 2 3
8 * * * * * * NephritisAcute
BronchitisBenign
Neoplasms Septicemia 81 1 1 2
9 * * * * * * AccidentsLiver
DiseaseNutritional
DeficienciesBenign
Neoplasms 91 1 1 2
10 * * * * * * * * Pneumonitis Diabetes 101 2
ALL CAUSES
3 1 2 9 8 17 17 28 40 125ALL
CAUSESTables list ICD-10 coded rankable underlying causes of death. In the event of a tie, causes are listed in order of their appearance in the ICD-10. An asterisk indicates no rankable cause is present for that cell of the table or was suppressed. See Methods for details.
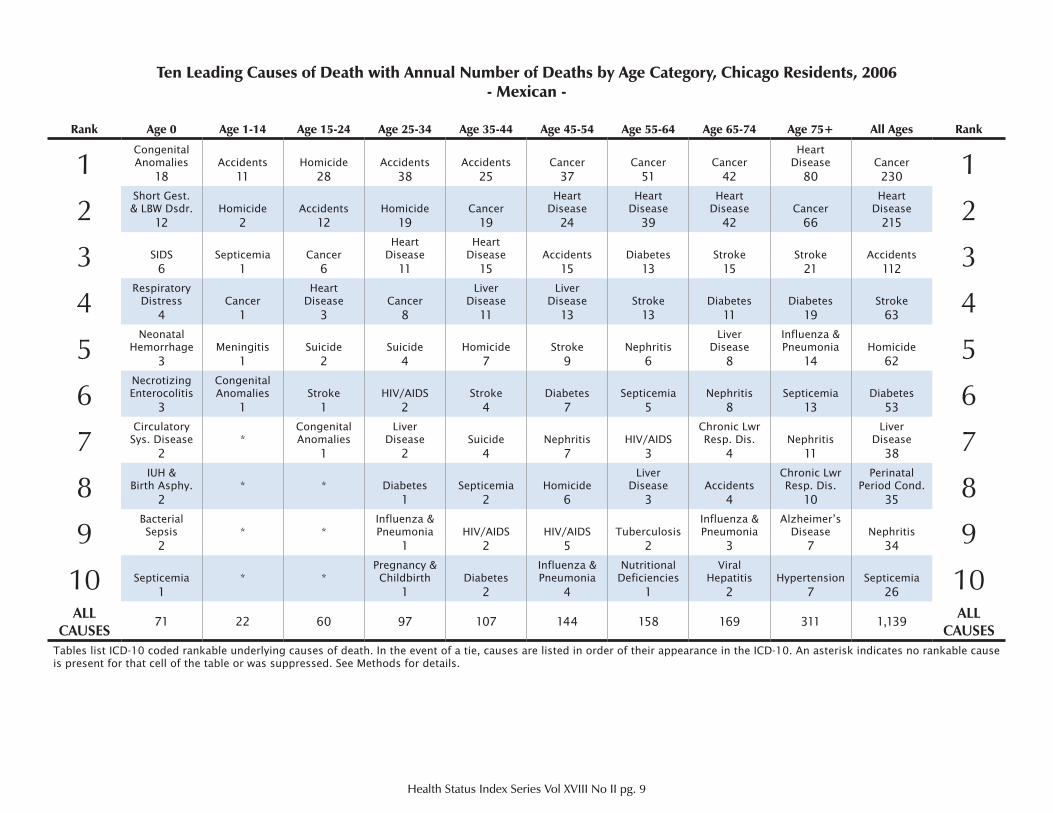
Health Status Index Series Vol XVIII No II pg. 9
Ten Leading Causes of Death with Annual Number of Deaths by Age Category, Chicago Residents, 2006- Mexican -
Rank Age 0 Age 1-14 Age 15-24 Age 25-34 Age 35-44 Age 45-54 Age 55-64 Age 65-74 Age 75+ All Ages Rank
1Congenital Anomalies Accidents Homicide Accidents Accidents Cancer Cancer Cancer
HeartDisease Cancer 118 11 28 38 25 37 51 42 80 230
2Short Gest.& LBW Dsdr. Homicide Accidents Homicide Cancer
HeartDisease
HeartDisease
HeartDisease Cancer
HeartDisease 212 2 12 19 19 24 39 42 66 215
3 SIDS Septicemia CancerHeart
DiseaseHeart
Disease Accidents Diabetes Stroke Stroke Accidents 36 1 6 11 15 15 13 15 21 112
4Respiratory
Distress CancerHeart
Disease CancerLiver
DiseaseLiver
Disease Stroke Diabetes Diabetes Stroke 44 1 3 8 11 13 13 11 19 63
5Neonatal
Hemorrhage Meningitis Suicide Suicide Homicide Stroke NephritisLiver
DiseaseInfluenza & Pneumonia Homicide 53 1 2 4 7 9 6 8 14 62
6Necrotizing Enterocolitis
Congenital Anomalies Stroke HIV/AIDS Stroke Diabetes Septicemia Nephritis Septicemia Diabetes 63 1 1 2 4 7 5 8 13 53
7Circulatory
Sys. Disease *Congenital Anomalies
LiverDisease Suicide Nephritis HIV/AIDS
Chronic Lwr Resp. Dis. Nephritis
LiverDisease 72 1 2 4 7 3 4 11 38
8IUH &
Birth Asphy. * * Diabetes Septicemia HomicideLiver
Disease AccidentsChronic Lwr Resp. Dis.
PerinatalPeriod Cond. 82 1 2 6 3 4 10 35
9Bacterial Sepsis * *
Influenza & Pneumonia HIV/AIDS HIV/AIDS Tuberculosis
Influenza & Pneumonia
Alzheimer’s Disease Nephritis 92 1 2 5 2 3 7 34
10 Septicemia * *Pregnancy & Childbirth Diabetes
Influenza & Pneumonia
Nutritional Deficiencies
ViralHepatitis Hypertension Septicemia 101 1 2 4 1 2 7 26
ALL CAUSES
71 22 60 97 107 144 158 169 311 1,139ALL
CAUSESTables list ICD-10 coded rankable underlying causes of death. In the event of a tie, causes are listed in order of their appearance in the ICD-10. An asterisk indicates no rankable cause is present for that cell of the table or was suppressed. See Methods for details.
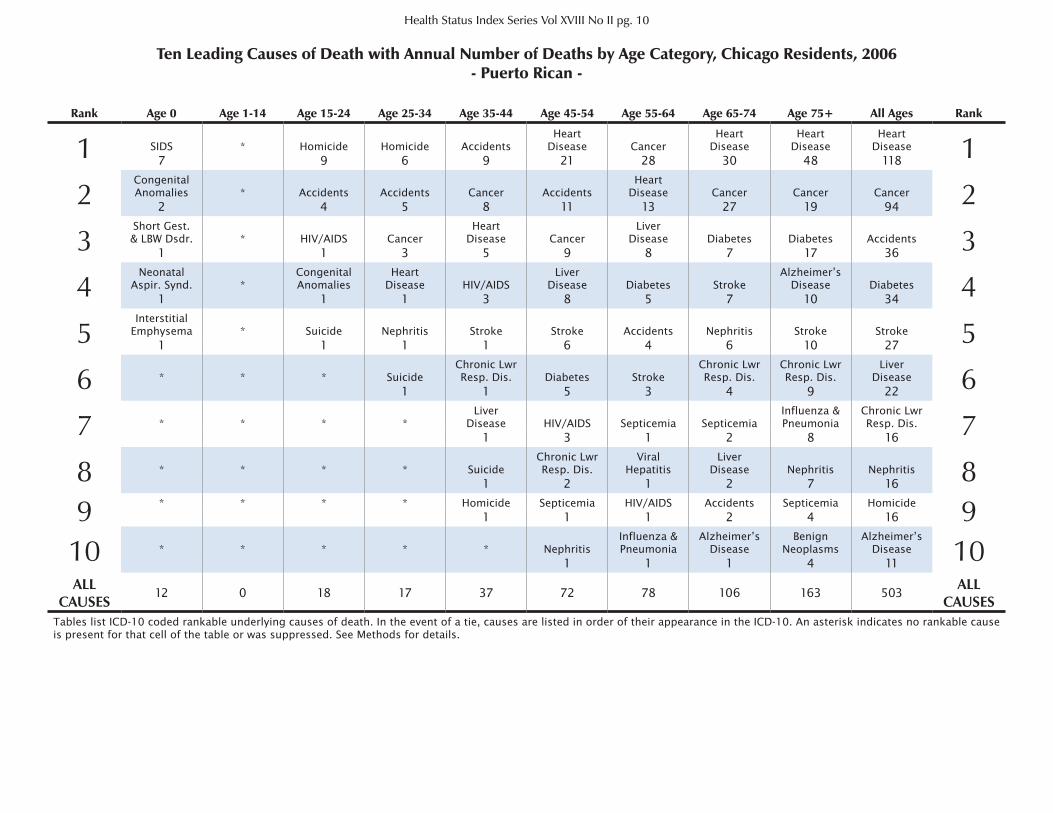
Health Status Index Series Vol XVIII No II pg. 10
Ten Leading Causes of Death with Annual Number of Deaths by Age Category, Chicago Residents, 2006- Puerto Rican -
Rank Age 0 Age 1-14 Age 15-24 Age 25-34 Age 35-44 Age 45-54 Age 55-64 Age 65-74 Age 75+ All Ages Rank
1 SIDS * Homicide Homicide AccidentsHeart
Disease CancerHeart
DiseaseHeart
DiseaseHeart
Disease 17 9 6 9 21 28 30 48 118
2Congenital Anomalies * Accidents Accidents Cancer Accidents
HeartDisease Cancer Cancer Cancer 22 4 5 8 11 13 27 19 94
3Short Gest.& LBW Dsdr. * HIV/AIDS Cancer
HeartDisease Cancer
LiverDisease Diabetes Diabetes Accidents 31 1 3 5 9 8 7 17 36
4Neonatal
Aspir. Synd. *Congenital Anomalies
HeartDisease HIV/AIDS
LiverDisease Diabetes Stroke
Alzheimer’s Disease Diabetes 41 1 1 3 8 5 7 10 34
5Interstitial
Emphysema * Suicide Nephritis Stroke Stroke Accidents Nephritis Stroke Stroke 51 1 1 1 6 4 6 10 27
6 * * * SuicideChronic Lwr Resp. Dis. Diabetes Stroke
Chronic Lwr Resp. Dis.
Chronic Lwr Resp. Dis.
LiverDisease 61 1 5 3 4 9 22
7 * * * *Liver
Disease HIV/AIDS Septicemia SepticemiaInfluenza & Pneumonia
Chronic Lwr Resp. Dis. 71 3 1 2 8 16
8 * * * * SuicideChronic Lwr Resp. Dis.
ViralHepatitis
LiverDisease Nephritis Nephritis 81 2 1 2 7 16
9 * * * * Homicide Septicemia HIV/AIDS Accidents Septicemia Homicide 91 1 1 2 4 16
10 * * * * * Nephritis Influenza & Pneumonia
Alzheimer’s Disease
Benign Neoplasms
Alzheimer’s Disease 101 1 1 4 11
ALL CAUSES
12 0 18 17 37 72 78 106 163 503ALL
CAUSESTables list ICD-10 coded rankable underlying causes of death. In the event of a tie, causes are listed in order of their appearance in the ICD-10. An asterisk indicates no rankable cause is present for that cell of the table or was suppressed. See Methods for details.
Health Status Index Series Vol XVIII No II pg. 11
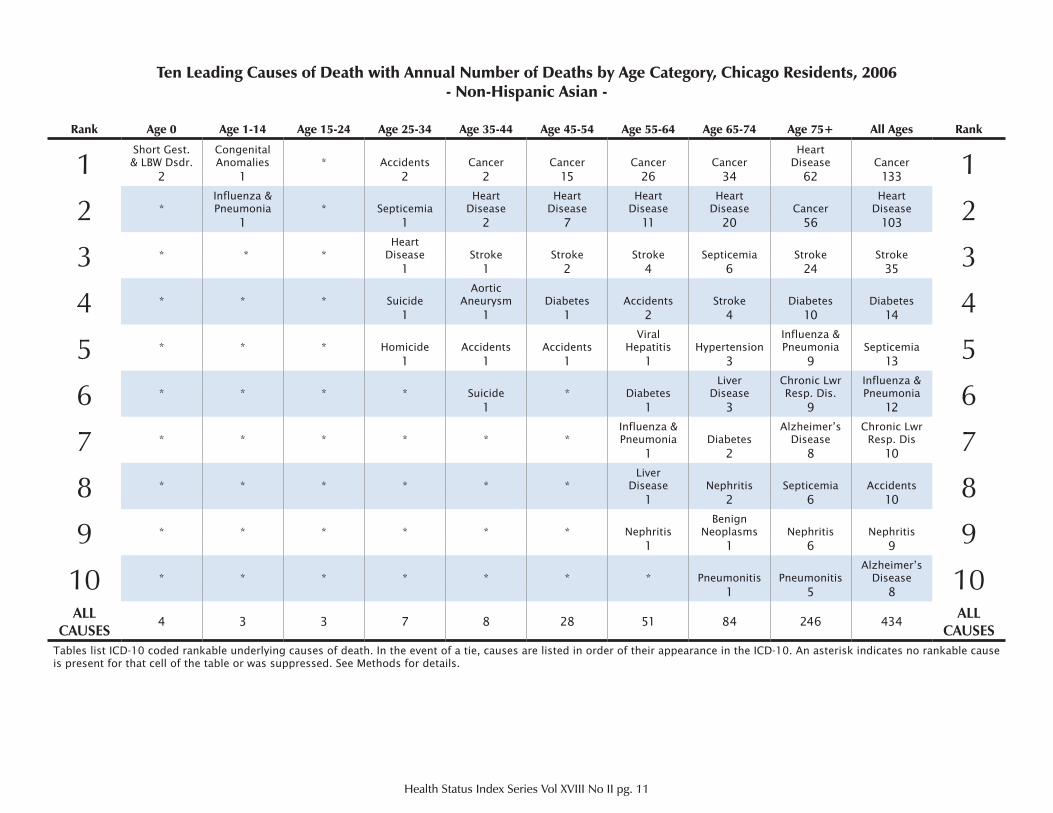
Ten Leading Causes of Death with Annual Number of Deaths by Age Category, Chicago Residents, 2006- Non-Hispanic Asian -
Rank Age 0 Age 1-14 Age 15-24 Age 25-34 Age 35-44 Age 45-54 Age 55-64 Age 65-74 Age 75+ All Ages Rank
1Short Gest.& LBW Dsdr.
Congenital Anomalies * Accidents Cancer Cancer Cancer Cancer
HeartDisease Cancer 12 1 2 2 15 26 34 62 133
2 *Influenza & Pneumonia * Septicemia
HeartDisease
HeartDisease
HeartDisease
HeartDisease Cancer
HeartDisease 21 1 2 7 11 20 56 103
3 * * *Heart
Disease Stroke Stroke Stroke Septicemia Stroke Stroke 31 1 2 4 6 24 35
4 * * * SuicideAortic
Aneurysm Diabetes Accidents Stroke Diabetes Diabetes 41 1 1 2 4 10 14
5 * * * Homicide Accidents AccidentsViral
Hepatitis HypertensionInfluenza & Pneumonia Septicemia 51 1 1 1 3 9 13
6 * * * * Suicide * DiabetesLiver
DiseaseChronic Lwr Resp. Dis.
Influenza & Pneumonia 61 1 3 9 12
7 * * * * * *Influenza & Pneumonia Diabetes
Alzheimer’s Disease
Chronic Lwr Resp. Dis 71 2 8 10
8 * * * * * *Liver
Disease Nephritis Septicemia Accidents 81 2 6 10
9 * * * * * * NephritisBenign
Neoplasms Nephritis Nephritis 91 1 6 9
10 * * * * * * * Pneumonitis PneumonitisAlzheimer’s
Disease 101 5 8
ALL CAUSES
4 3 3 7 8 28 51 84 246 434ALL
CAUSESTables list ICD-10 coded rankable underlying causes of death. In the event of a tie, causes are listed in order of their appearance in the ICD-10. An asterisk indicates no rankable cause is present for that cell of the table or was suppressed. See Methods for details.
Health Status Index Series Vol XVIII No II pg. 12
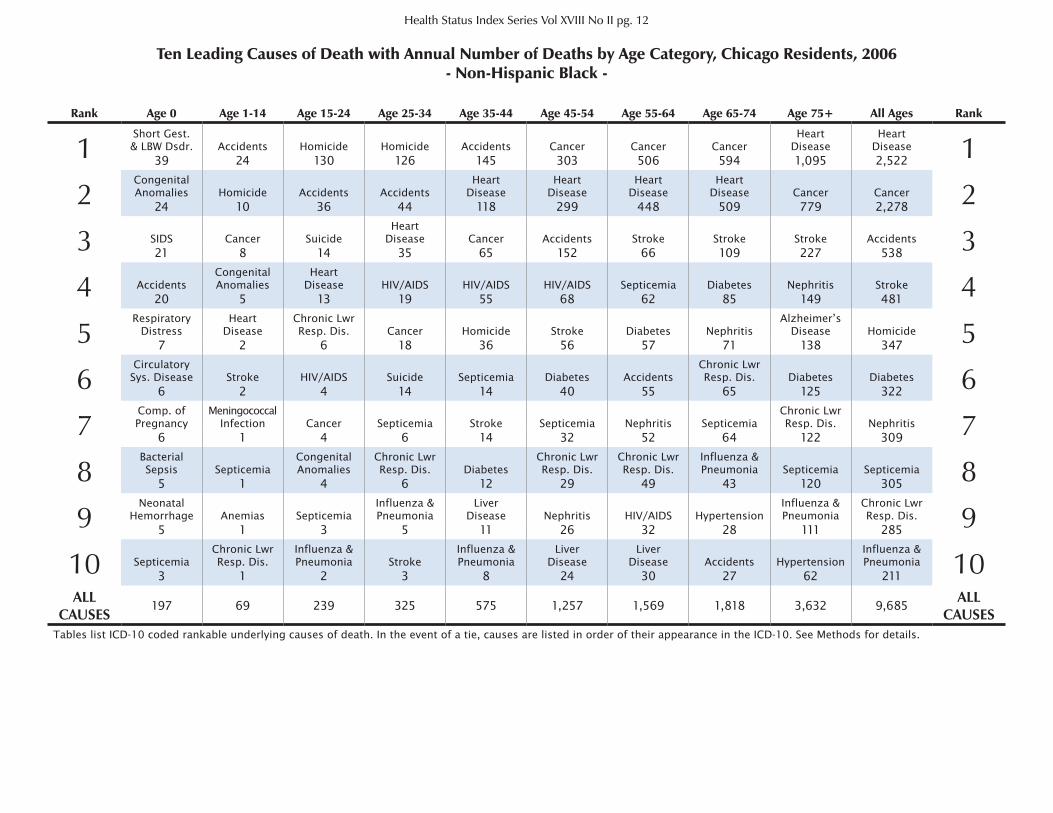
Ten Leading Causes of Death with Annual Number of Deaths by Age Category, Chicago Residents, 2006- Non-Hispanic Black -
Rank Age 0 Age 1-14 Age 15-24 Age 25-34 Age 35-44 Age 45-54 Age 55-64 Age 65-74 Age 75+ All Ages Rank
1Short Gest.& LBW Dsdr. Accidents Homicide Homicide Accidents Cancer Cancer Cancer
HeartDisease
HeartDisease 139 24 130 126 145 303 506 594 1,095 2,522
2Congenital Anomalies Homicide Accidents Accidents
HeartDisease
HeartDisease
HeartDisease
HeartDisease Cancer Cancer 224 10 36 44 118 299 448 509 779 2,278
3 SIDS Cancer SuicideHeart
Disease Cancer Accidents Stroke Stroke Stroke Accidents 321 8 14 35 65 152 66 109 227 538
4 AccidentsCongenital Anomalies
HeartDisease HIV/AIDS HIV/AIDS HIV/AIDS Septicemia Diabetes Nephritis Stroke 420 5 13 19 55 68 62 85 149 481
5Respiratory
DistressHeart
DiseaseChronic Lwr Resp. Dis. Cancer Homicide Stroke Diabetes Nephritis
Alzheimer’s Disease Homicide 57 2 6 18 36 56 57 71 138 347
6Circulatory
Sys. Disease Stroke HIV/AIDS Suicide Septicemia Diabetes AccidentsChronic Lwr Resp. Dis. Diabetes Diabetes 66 2 4 14 14 40 55 65 125 322
7Comp. of Pregnancy
Meningococcal Infection Cancer Septicemia Stroke Septicemia Nephritis Septicemia
Chronic Lwr Resp. Dis. Nephritis 76 1 4 6 14 32 52 64 122 309
8Bacterial Sepsis Septicemia
Congenital Anomalies
Chronic Lwr Resp. Dis. Diabetes
Chronic Lwr Resp. Dis.
Chronic Lwr Resp. Dis.
Influenza & Pneumonia Septicemia Septicemia 85 1 4 6 12 29 49 43 120 305
9Neonatal
Hemorrhage Anemias SepticemiaInfluenza & Pneumonia
LiverDisease Nephritis HIV/AIDS Hypertension
Influenza & Pneumonia
Chronic Lwr Resp. Dis. 95 1 3 5 11 26 32 28 111 285
10 SepticemiaChronic Lwr Resp. Dis.
Influenza & Pneumonia Stroke
Influenza & Pneumonia
LiverDisease
LiverDisease Accidents Hypertension
Influenza & Pneumonia 103 1 2 3 8 24 30 27 62 211
ALL CAUSES
197 69 239 325 575 1,257 1,569 1,818 3,632 9,685ALL
CAUSESTables list ICD-10 coded rankable underlying causes of death. In the event of a tie, causes are listed in order of their appearance in the ICD-10. See Methods for details.
Health Status Index Series Vol XVIII No II pg. 13
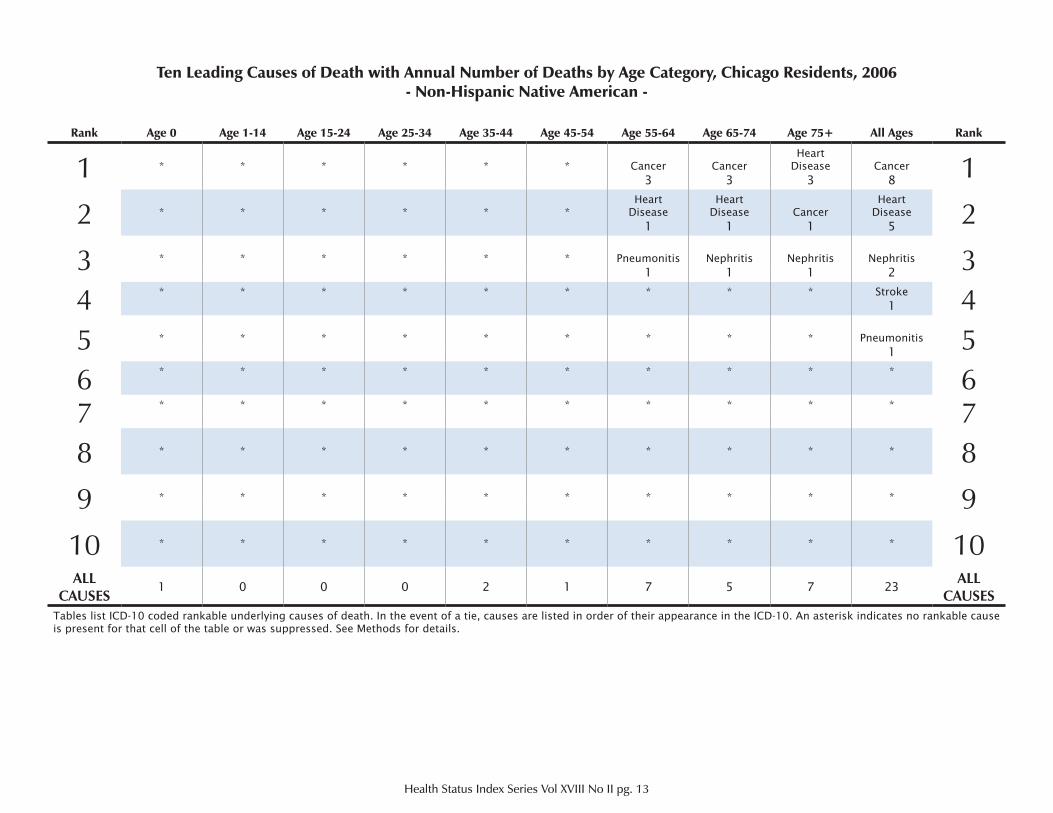
Ten Leading Causes of Death with Annual Number of Deaths by Age Category, Chicago Residents, 2006- Non-Hispanic Native American -
Rank Age 0 Age 1-14 Age 15-24 Age 25-34 Age 35-44 Age 45-54 Age 55-64 Age 65-74 Age 75+ All Ages Rank
1 * * * * * * Cancer CancerHeart
Disease Cancer 13 3 3 8
2 * * * * * *Heart
DiseaseHeart
Disease CancerHeart
Disease 21 1 1 5
3 * * * * * * Pneumonitis Nephritis Nephritis Nephritis 31 1 1 2
4 * * * * * * * * * Stroke 41
5 * * * * * * * * * Pneumonitis 51
6 * * * * * * * * * * 67 * * * * * * * * * * 78 * * * * * * * * * * 8
9 * * * * * * * * * * 9
10 * * * * * * * * * * 10ALL
CAUSES1 0 0 0 2 1 7 5 7 23
ALL CAUSES
Tables list ICD-10 coded rankable underlying causes of death. In the event of a tie, causes are listed in order of their appearance in the ICD-10. An asterisk indicates no rankable cause is present for that cell of the table or was suppressed. See Methods for details.
Health Status Index Series Vol XVIII No II pg. 14
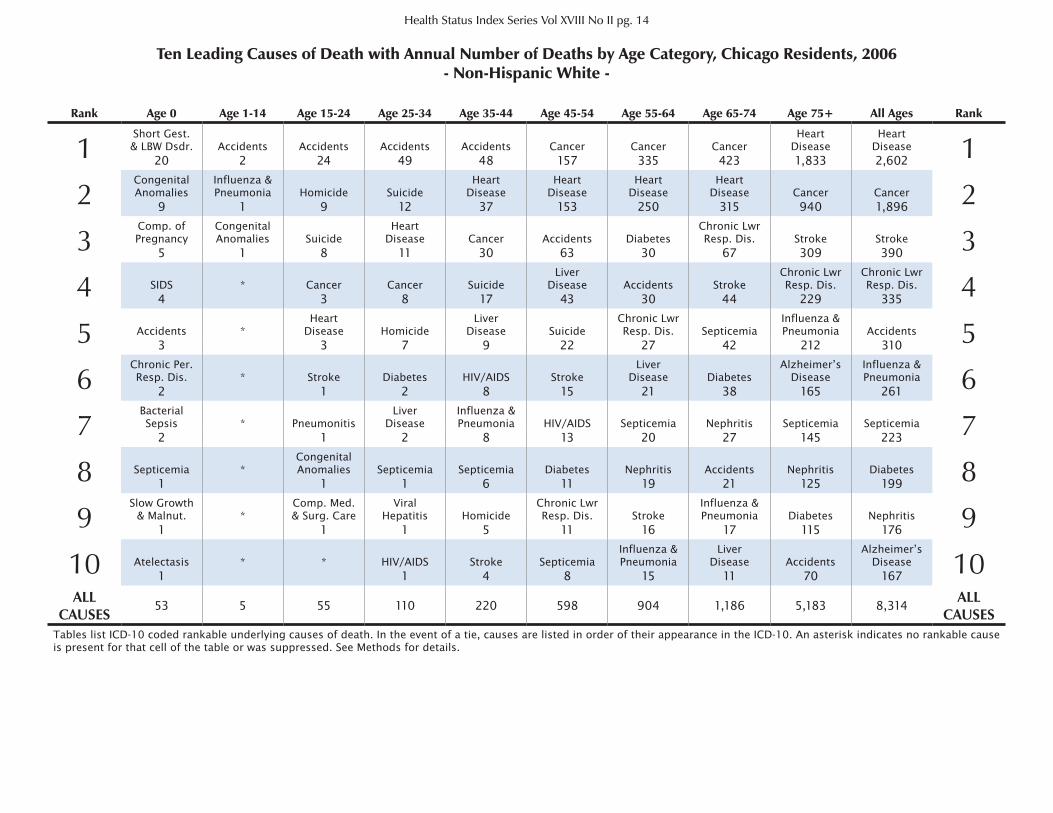
Ten Leading Causes of Death with Annual Number of Deaths by Age Category, Chicago Residents, 2006- Non-Hispanic White -
Rank Age 0 Age 1-14 Age 15-24 Age 25-34 Age 35-44 Age 45-54 Age 55-64 Age 65-74 Age 75+ All Ages Rank
1Short Gest.& LBW Dsdr. Accidents Accidents Accidents Accidents Cancer Cancer Cancer
HeartDisease
HeartDisease 120 2 24 49 48 157 335 423 1,833 2,602
2Congenital Anomalies
Influenza & Pneumonia Homicide Suicide
HeartDisease
HeartDisease
HeartDisease
HeartDisease Cancer Cancer 29 1 9 12 37 153 250 315 940 1,896
3Comp. of Pregnancy
Congenital Anomalies Suicide
HeartDisease Cancer Accidents Diabetes
Chronic Lwr Resp. Dis. Stroke Stroke 35 1 8 11 30 63 30 67 309 390
4 SIDS * Cancer Cancer SuicideLiver
Disease Accidents StrokeChronic Lwr Resp. Dis.
Chronic Lwr Resp. Dis. 44 3 8 17 43 30 44 229 335
5 Accidents *Heart
Disease HomicideLiver
Disease SuicideChronic Lwr Resp. Dis. Septicemia
Influenza & Pneumonia Accidents 53 3 7 9 22 27 42 212 310
6Chronic Per. Resp. Dis. * Stroke Diabetes HIV/AIDS Stroke
LiverDisease Diabetes
Alzheimer’s Disease
Influenza & Pneumonia 62 1 2 8 15 21 38 165 261
7Bacterial Sepsis * Pneumonitis
LiverDisease
Influenza & Pneumonia HIV/AIDS Septicemia Nephritis Septicemia Septicemia 72 1 2 8 13 20 27 145 223
8 Septicemia * Congenital Anomalies Septicemia Septicemia Diabetes Nephritis Accidents Nephritis Diabetes 81 1 1 6 11 19 21 125 199
9Slow Growth
& Malnut. *Comp. Med. & Surg. Care
Viral Hepatitis Homicide
Chronic Lwr Resp. Dis. Stroke
Influenza & Pneumonia Diabetes Nephritis 91 1 1 5 11 16 17 115 176
10 Atelectasis * * HIV/AIDS Stroke SepticemiaInfluenza & Pneumonia
LiverDisease Accidents
Alzheimer’s Disease 101 1 4 8 15 11 70 167
ALL CAUSES
53 5 55 110 220 598 904 1,186 5,183 8,314ALL
CAUSESTables list ICD-10 coded rankable underlying causes of death. In the event of a tie, causes are listed in order of their appearance in the ICD-10. An asterisk indicates no rankable cause is present for that cell of the table or was suppressed. See Methods for details.
Health Status Index Series Vol XVIII No II pg. 15
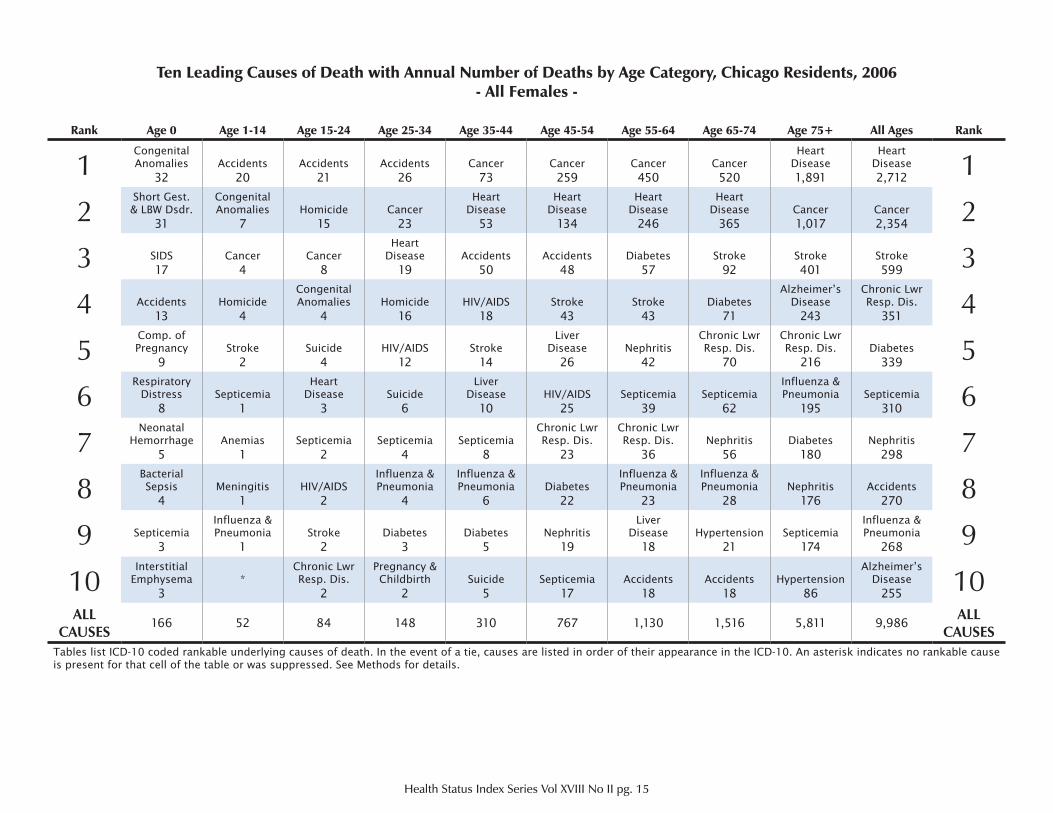
Ten Leading Causes of Death with Annual Number of Deaths by Age Category, Chicago Residents, 2006- All Females -
Rank Age 0 Age 1-14 Age 15-24 Age 25-34 Age 35-44 Age 45-54 Age 55-64 Age 65-74 Age 75+ All Ages Rank
1Congenital Anomalies Accidents Accidents Accidents Cancer Cancer Cancer Cancer
HeartDisease
HeartDisease 132 20 21 26 73 259 450 520 1,891 2,712
2Short Gest.& LBW Dsdr.
Congenital Anomalies Homicide Cancer
HeartDisease
HeartDisease
HeartDisease
HeartDisease Cancer Cancer 231 7 15 23 53 134 246 365 1,017 2,354
3 SIDS Cancer CancerHeart
Disease Accidents Accidents Diabetes Stroke Stroke Stroke 317 4 8 19 50 48 57 92 401 599
4 Accidents HomicideCongenital Anomalies Homicide HIV/AIDS Stroke Stroke Diabetes
Alzheimer’s Disease
Chronic Lwr Resp. Dis. 413 4 4 16 18 43 43 71 243 351
5Comp. of Pregnancy Stroke Suicide HIV/AIDS Stroke
LiverDisease Nephritis
Chronic Lwr Resp. Dis.
Chronic Lwr Resp. Dis. Diabetes 59 2 4 12 14 26 42 70 216 339
6Respiratory
Distress SepticemiaHeart
Disease SuicideLiver
Disease HIV/AIDS Septicemia SepticemiaInfluenza & Pneumonia Septicemia 68 1 3 6 10 25 39 62 195 310
7Neonatal
Hemorrhage Anemias Septicemia Septicemia SepticemiaChronic Lwr Resp. Dis.
Chronic Lwr Resp. Dis. Nephritis Diabetes Nephritis 75 1 2 4 8 23 36 56 180 298
8Bacterial Sepsis Meningitis HIV/AIDS
Influenza & Pneumonia
Influenza & Pneumonia Diabetes
Influenza & Pneumonia
Influenza & Pneumonia Nephritis Accidents 84 1 2 4 6 22 23 28 176 270
9 SepticemiaInfluenza & Pneumonia Stroke Diabetes Diabetes Nephritis
Liver Disease Hypertension Septicemia
Influenza & Pneumonia 93 1 2 3 5 19 18 21 174 268
10Interstitial
Emphysema *Chronic Lwr Resp. Dis.
Pregnancy & Childbirth Suicide Septicemia Accidents Accidents Hypertension
Alzheimer’s Disease 103 2 2 5 17 18 18 86 255
ALL CAUSES
166 52 84 148 310 767 1,130 1,516 5,811 9,986ALL
CAUSESTables list ICD-10 coded rankable underlying causes of death. In the event of a tie, causes are listed in order of their appearance in the ICD-10. An asterisk indicates no rankable cause is present for that cell of the table or was suppressed. See Methods for details.
Health Status Index Series Vol XVIII No II pg. 16
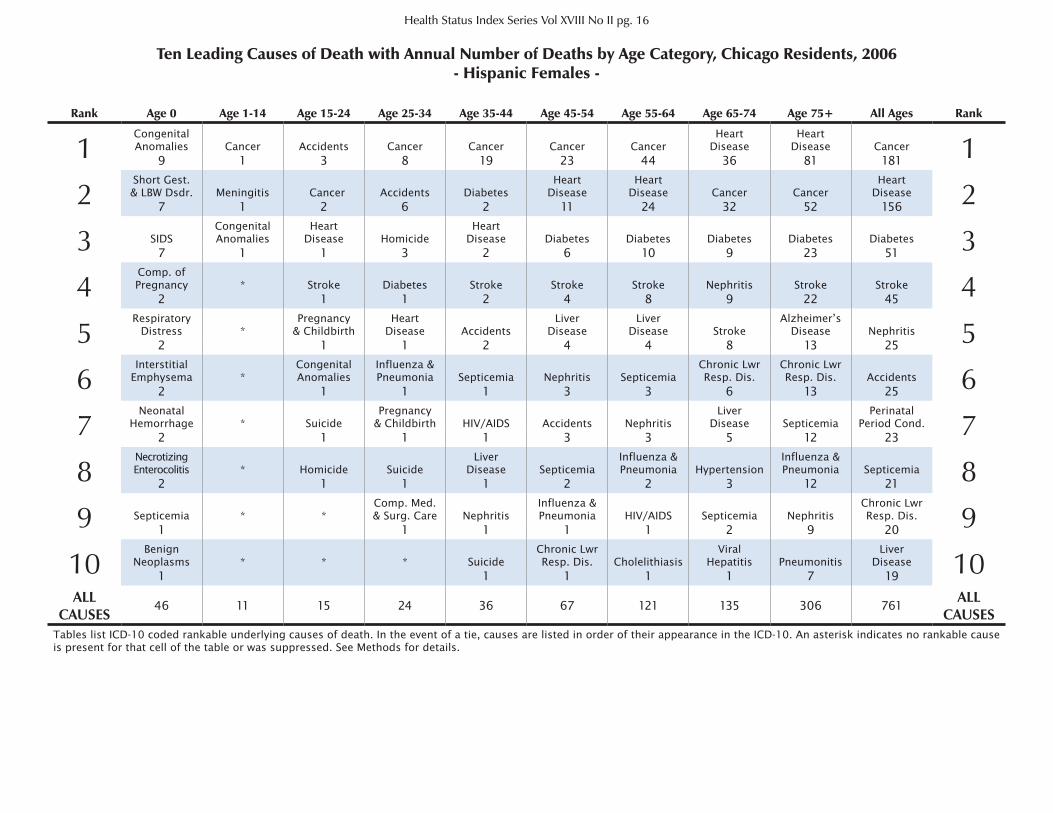
Ten Leading Causes of Death with Annual Number of Deaths by Age Category, Chicago Residents, 2006- Hispanic Females -
Rank Age 0 Age 1-14 Age 15-24 Age 25-34 Age 35-44 Age 45-54 Age 55-64 Age 65-74 Age 75+ All Ages Rank
1Congenital Anomalies Cancer Accidents Cancer Cancer Cancer Cancer
HeartDisease
HeartDisease Cancer 19 1 3 8 19 23 44 36 81 181
2Short Gest.& LBW Dsdr. Meningitis Cancer Accidents Diabetes
HeartDisease
HeartDisease Cancer Cancer
HeartDisease 27 1 2 6 2 11 24 32 52 156
3 SIDSCongenital Anomalies
HeartDisease Homicide
HeartDisease Diabetes Diabetes Diabetes Diabetes Diabetes 37 1 1 3 2 6 10 9 23 51
4Comp. of Pregnancy * Stroke Diabetes Stroke Stroke Stroke Nephritis Stroke Stroke 42 1 1 2 4 8 9 22 45
5Respiratory
Distress *Pregnancy
& ChildbirthHeart
Disease AccidentsLiver
DiseaseLiver
Disease StrokeAlzheimer’s
Disease Nephritis 52 1 1 2 4 4 8 13 25
6Interstitial
Emphysema *Congenital Anomalies
Influenza & Pneumonia Septicemia Nephritis Septicemia
Chronic Lwr Resp. Dis.
Chronic Lwr Resp. Dis. Accidents 62 1 1 1 3 3 6 13 25
7Neonatal
Hemorrhage * SuicidePregnancy
& Childbirth HIV/AIDS Accidents NephritisLiver
Disease SepticemiaPerinatal
Period Cond. 72 1 1 1 3 3 5 12 23
8Necrotizing Enterocolitis * Homicide Suicide
LiverDisease Septicemia
Influenza & Pneumonia Hypertension
Influenza & Pneumonia Septicemia 82 1 1 1 2 2 3 12 21
9 Septicemia * *Comp. Med. & Surg. Care Nephritis
Influenza & Pneumonia HIV/AIDS Septicemia Nephritis
Chronic Lwr Resp. Dis. 91 1 1 1 1 2 9 20
10Benign
Neoplasms * * * SuicideChronic Lwr Resp. Dis. Cholelithiasis
Viral Hepatitis Pneumonitis
LiverDisease 101 1 1 1 1 7 19
ALL CAUSES
46 11 15 24 36 67 121 135 306 761ALL
CAUSESTables list ICD-10 coded rankable underlying causes of death. In the event of a tie, causes are listed in order of their appearance in the ICD-10. An asterisk indicates no rankable cause is present for that cell of the table or was suppressed. See Methods for details.
Health Status Index Series Vol XVIII No II pg. 17
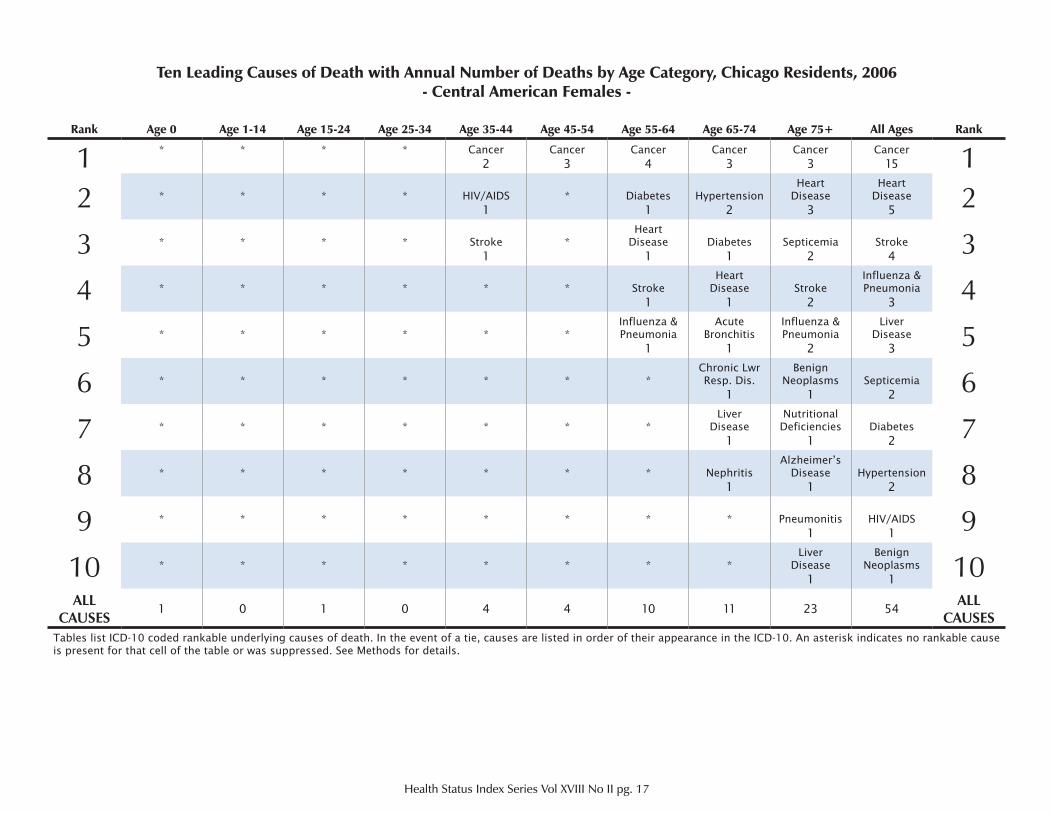
Ten Leading Causes of Death with Annual Number of Deaths by Age Category, Chicago Residents, 2006- Central American Females -
Rank Age 0 Age 1-14 Age 15-24 Age 25-34 Age 35-44 Age 45-54 Age 55-64 Age 65-74 Age 75+ All Ages Rank
1 * * * * Cancer Cancer Cancer Cancer Cancer Cancer 12 3 4 3 3 15
2 * * * * HIV/AIDS * Diabetes HypertensionHeart
DiseaseHeart
Disease 21 1 2 3 5
3 * * * * Stroke *Heart
Disease Diabetes Septicemia Stroke 31 1 1 2 4
4 * * * * * * StrokeHeart
Disease StrokeInfluenza & Pneumonia 41 1 2 3
5 * * * * * *Influenza & Pneumonia
AcuteBronchitis
Influenza & Pneumonia
LiverDisease 51 1 2 3
6 * * * * * * *Chronic Lwr Resp. Dis.
BenignNeoplasms Septicemia 61 1 2
7 * * * * * * *Liver
DiseaseNutritional
Deficiencies Diabetes 71 1 2
8 * * * * * * * NephritisAlzheimer’s
Disease Hypertension 81 1 2
9 * * * * * * * * Pneumonitis HIV/AIDS 91 1
10 * * * * * * * *Liver
DiseaseBenign
Neoplasms 101 1
ALL CAUSES
1 0 1 0 4 4 10 11 23 54ALL
CAUSESTables list ICD-10 coded rankable underlying causes of death. In the event of a tie, causes are listed in order of their appearance in the ICD-10. An asterisk indicates no rankable cause is present for that cell of the table or was suppressed. See Methods for details.
Health Status Index Series Vol XVIII No II pg. 18
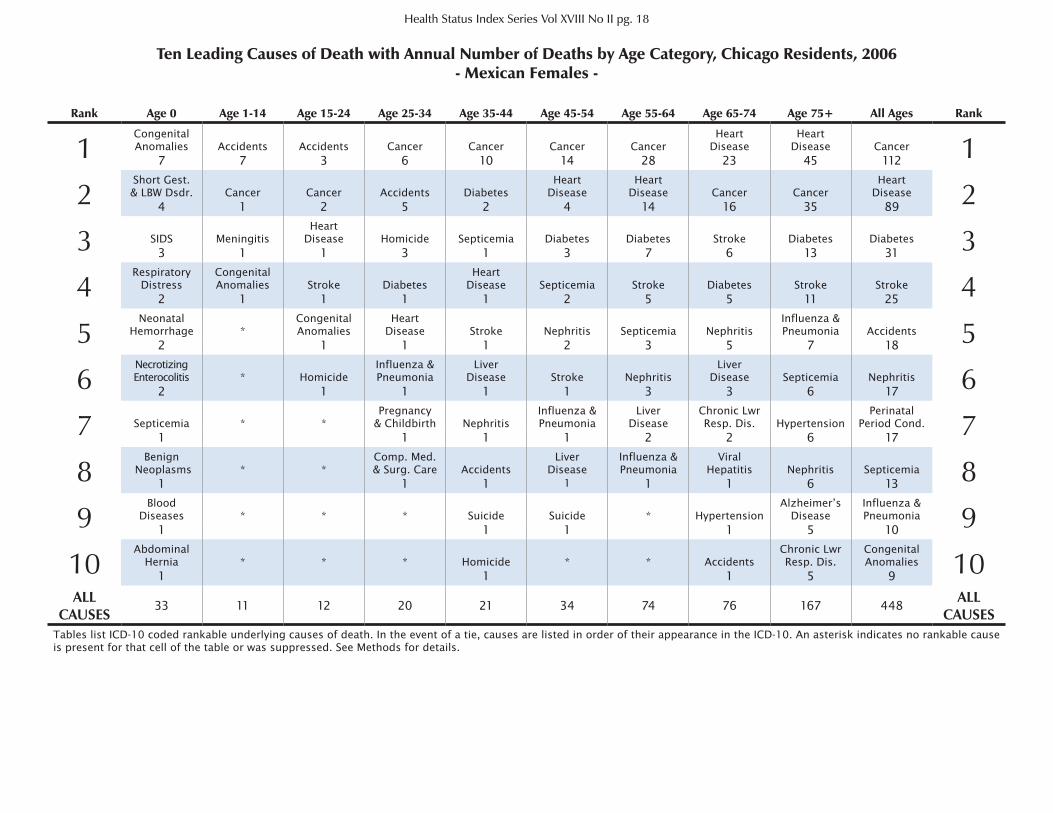
Ten Leading Causes of Death with Annual Number of Deaths by Age Category, Chicago Residents, 2006- Mexican Females -
Rank Age 0 Age 1-14 Age 15-24 Age 25-34 Age 35-44 Age 45-54 Age 55-64 Age 65-74 Age 75+ All Ages Rank
1Congenital Anomalies Accidents Accidents Cancer Cancer Cancer Cancer
HeartDisease
HeartDisease Cancer 17 7 3 6 10 14 28 23 45 112
2Short Gest.& LBW Dsdr. Cancer Cancer Accidents Diabetes
HeartDisease
HeartDisease Cancer Cancer
HeartDisease 24 1 2 5 2 4 14 16 35 89
3 SIDS Meningitis Heart
Disease Homicide Septicemia Diabetes Diabetes Stroke Diabetes Diabetes 33 1 1 3 1 3 7 6 13 31
4Respiratory
DistressCongenital Anomalies Stroke Diabetes
HeartDisease Septicemia Stroke Diabetes Stroke Stroke 42 1 1 1 1 2 5 5 11 25
5Neonatal
Hemorrhage *Congenital Anomalies
HeartDisease Stroke Nephritis Septicemia Nephritis
Influenza & Pneumonia Accidents 52 1 1 1 2 3 5 7 18
6Necrotizing Enterocolitis * Homicide
Influenza & Pneumonia
Liver Disease Stroke Nephritis
Liver Disease Septicemia Nephritis 62 1 1 1 1 3 3 6 17
7 Septicemia * *Pregnancy
& Childbirth NephritisInfluenza & Pneumonia
Liver Disease
Chronic Lwr Resp. Dis. Hypertension
PerinatalPeriod Cond. 71 1 1 1 2 2 6 17
8Benign
Neoplasms * *Comp. Med. & Surg. Care Accidents
Liver Disease
Influenza & Pneumonia
Viral Hepatitis Nephritis Septicemia 81 1 1 1 1 1 6 13
9Blood
Diseases * * * Suicide Suicide * HypertensionAlzheimer’s
DiseaseInfluenza & Pneumonia 91 1 1 1 5 10
10Abdominal
Hernia * * * Homicide * * AccidentsChronic Lwr Resp. Dis.
Congenital Anomalies 101 1 1 5 9
ALL CAUSES
33 11 12 20 21 34 74 76 167 448ALL
CAUSESTables list ICD-10 coded rankable underlying causes of death. In the event of a tie, causes are listed in order of their appearance in the ICD-10. An asterisk indicates no rankable cause is present for that cell of the table or was suppressed. See Methods for details.
Health Status Index Series Vol XVIII No II pg. 19
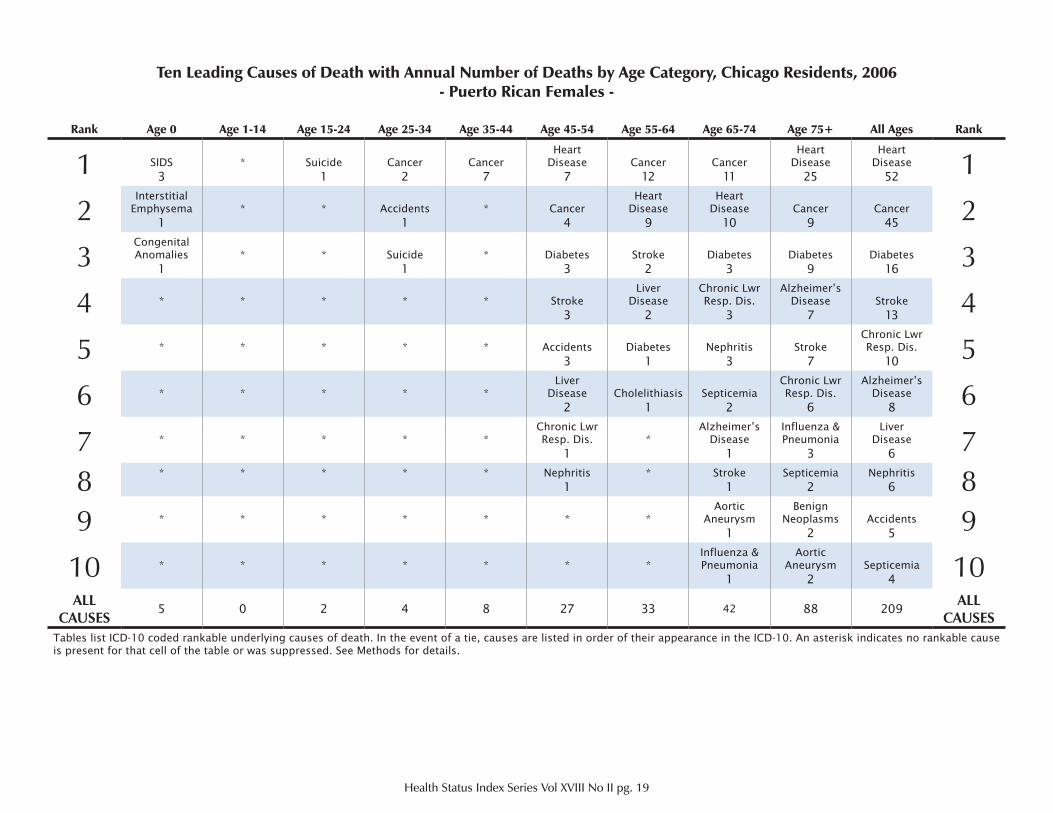
Ten Leading Causes of Death with Annual Number of Deaths by Age Category, Chicago Residents, 2006- Puerto Rican Females -
Rank Age 0 Age 1-14 Age 15-24 Age 25-34 Age 35-44 Age 45-54 Age 55-64 Age 65-74 Age 75+ All Ages Rank
1 SIDS * Suicide Cancer CancerHeart
Disease Cancer CancerHeart
DiseaseHeart
Disease 13 1 2 7 7 12 11 25 52
2Interstitial
Emphysema * * Accidents * CancerHeart
DiseaseHeart
Disease Cancer Cancer 21 1 4 9 10 9 45
3Congenital Anomalies * * Suicide * Diabetes Stroke Diabetes Diabetes Diabetes 31 1 3 2 3 9 16
4 * * * * * StrokeLiver
DiseaseChronic Lwr Resp. Dis.
Alzheimer’s Disease Stroke 43 2 3 7 13
5 * * * * * Accidents Diabetes Nephritis StrokeChronic Lwr Resp. Dis. 53 1 3 7 10
6 * * * * *Liver
Disease Cholelithiasis SepticemiaChronic Lwr Resp. Dis.
Alzheimer’s Disease 62 1 2 6 8
7 * * * * *Chronic Lwr Resp. Dis. *
Alzheimer’s Disease
Influenza & Pneumonia
LiverDisease 71 1 3 6
8 * * * * * Nephritis * Stroke Septicemia Nephritis 81 1 2 6
9 * * * * * * *Aortic
AneurysmBenign
Neoplasms Accidents 91 2 5
10 * * * * * * *Influenza & Pneumonia
Aortic Aneurysm Septicemia 101 2 4
ALL CAUSES
5 0 2 4 8 27 33 42 88 209ALL
CAUSESTables list ICD-10 coded rankable underlying causes of death. In the event of a tie, causes are listed in order of their appearance in the ICD-10. An asterisk indicates no rankable cause is present for that cell of the table or was suppressed. See Methods for details.
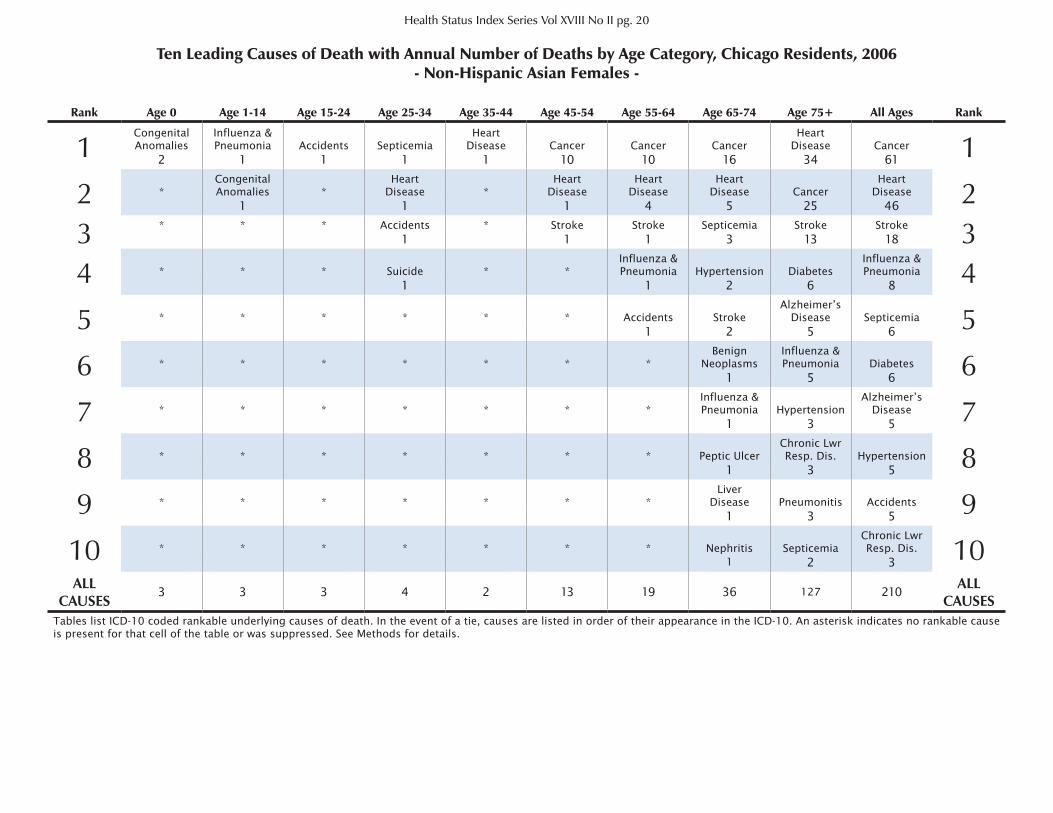
Ten Leading Causes of Death with Annual Number of Deaths by Age Category, Chicago Residents, 2006- Non-Hispanic Asian Females -
Health Status Index Series Vol XVIII No II pg. 20
Rank Age 0 Age 1-14 Age 15-24 Age 25-34 Age 35-44 Age 45-54 Age 55-64 Age 65-74 Age 75+ All Ages Rank
1Congenital Anomalies
Influenza & Pneumonia Accidents Septicemia
HeartDisease Cancer Cancer Cancer
HeartDisease Cancer 12 1 1 1 1 10 10 16 34 61
2 *Congenital Anomalies *
HeartDisease *
HeartDisease
HeartDisease
HeartDisease Cancer
HeartDisease 21 1 1 4 5 25 46
3 * * * Accidents * Stroke Stroke Septicemia Stroke Stroke 31 1 1 3 13 18
4 * * * Suicide * *Influenza & Pneumonia Hypertension Diabetes
Influenza & Pneumonia 41 1 2 6 8
5 * * * * * * Accidents StrokeAlzheimer’s
Disease Septicemia 51 2 5 6
6 * * * * * * *Benign
NeoplasmsInfluenza & Pneumonia Diabetes 61 5 6
7 * * * * * * *Influenza & Pneumonia Hypertension
Alzheimer’s Disease 71 3 5
8 * * * * * * * Peptic UlcerChronic Lwr Resp. Dis. Hypertension 81 3 5
9 * * * * * * *Liver
Disease Pneumonitis Accidents 91 3 5
10 * * * * * * * Nephritis SepticemiaChronic Lwr Resp. Dis. 101 2 3
ALL CAUSES
3 3 3 4 2 13 19 36 127 210ALL
CAUSESTables list ICD-10 coded rankable underlying causes of death. In the event of a tie, causes are listed in order of their appearance in the ICD-10. An asterisk indicates no rankable cause is present for that cell of the table or was suppressed. See Methods for details.
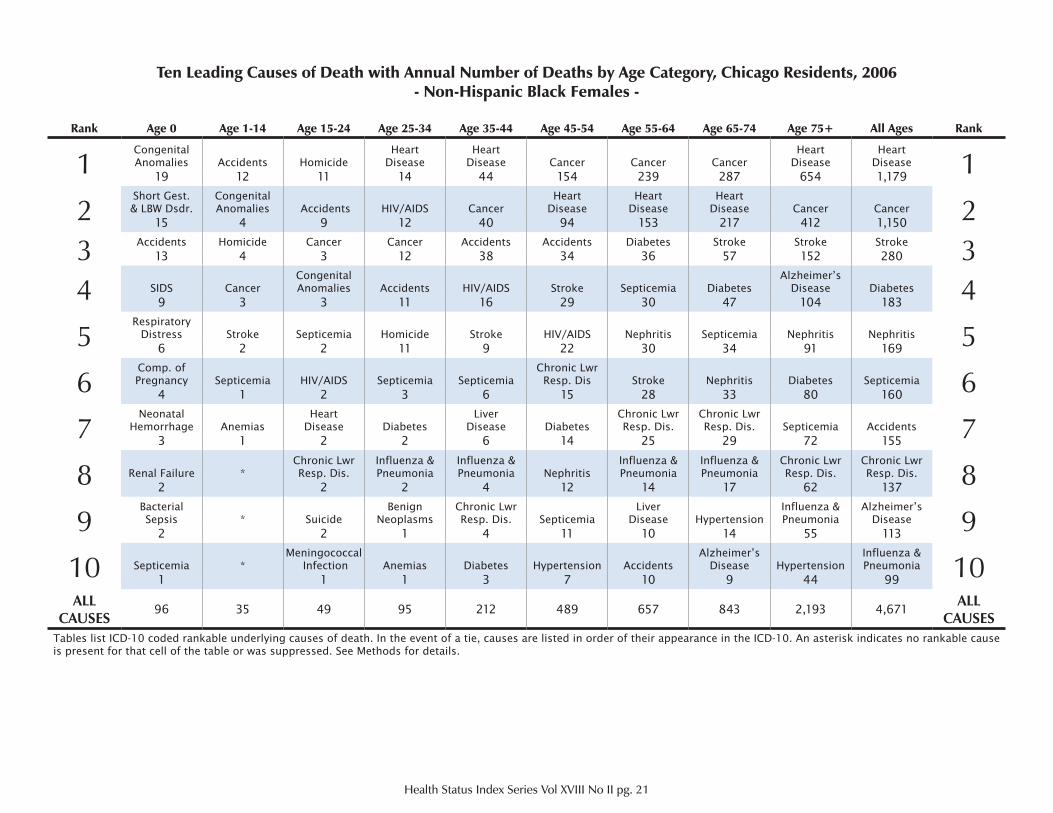
Ten Leading Causes of Death with Annual Number of Deaths by Age Category, Chicago Residents, 2006- Non-Hispanic Black Females -
Health Status Index Series Vol XVIII No II pg. 21
Rank Age 0 Age 1-14 Age 15-24 Age 25-34 Age 35-44 Age 45-54 Age 55-64 Age 65-74 Age 75+ All Ages Rank
1Congenital Anomalies Accidents Homicide
HeartDisease
HeartDisease Cancer Cancer Cancer
HeartDisease
HeartDisease 1
19 12 11 14 44 154 239 287 654 1,179
2Short Gest.& LBW Dsdr.
Congenital Anomalies Accidents HIV/AIDS Cancer
HeartDisease
HeartDisease
HeartDisease Cancer Cancer 215 4 9 12 40 94 153 217 412 1,150
3 Accidents Homicide Cancer Cancer Accidents Accidents Diabetes Stroke Stroke Stroke 313 4 3 12 38 34 36 57 152 280
4 SIDS CancerCongenital Anomalies Accidents HIV/AIDS Stroke Septicemia Diabetes
Alzheimer’s Disease Diabetes 49 3 3 11 16 29 30 47 104 183
5Respiratory
Distress Stroke Septicemia Homicide Stroke HIV/AIDS Nephritis Septicemia Nephritis Nephritis 56 2 2 11 9 22 30 34 91 169
6Comp. of Pregnancy Septicemia HIV/AIDS Septicemia Septicemia
Chronic Lwr Resp. Dis Stroke Nephritis Diabetes Septicemia 64 1 2 3 6 15 28 33 80 160
7Neonatal
Hemorrhage AnemiasHeart
Disease DiabetesLiver
Disease DiabetesChronic Lwr Resp. Dis.
Chronic Lwr Resp. Dis. Septicemia Accidents 73 1 2 2 6 14 25 29 72 155
8 Renal Failure *Chronic Lwr Resp. Dis.
Influenza & Pneumonia
Influenza & Pneumonia Nephritis
Influenza & Pneumonia
Influenza & Pneumonia
Chronic Lwr Resp. Dis.
Chronic Lwr Resp. Dis. 8
2 2 2 4 12 14 17 62 137
9Bacterial Sepsis * Suicide
Benign Neoplasms
Chronic Lwr Resp. Dis. Septicemia
LiverDisease Hypertension
Influenza & Pneumonia
Alzheimer’s Disease 92 2 1 4 11 10 14 55 113
10 Septicemia *Meningococcal
Infection Anemias Diabetes Hypertension AccidentsAlzheimer’s
Disease HypertensionInfluenza & Pneumonia 101 1 1 3 7 10 9 44 99
ALL CAUSES
96 35 49 95 212 489 657 843 2,193 4,671ALL
CAUSESTables list ICD-10 coded rankable underlying causes of death. In the event of a tie, causes are listed in order of their appearance in the ICD-10. An asterisk indicates no rankable cause is present for that cell of the table or was suppressed. See Methods for details.
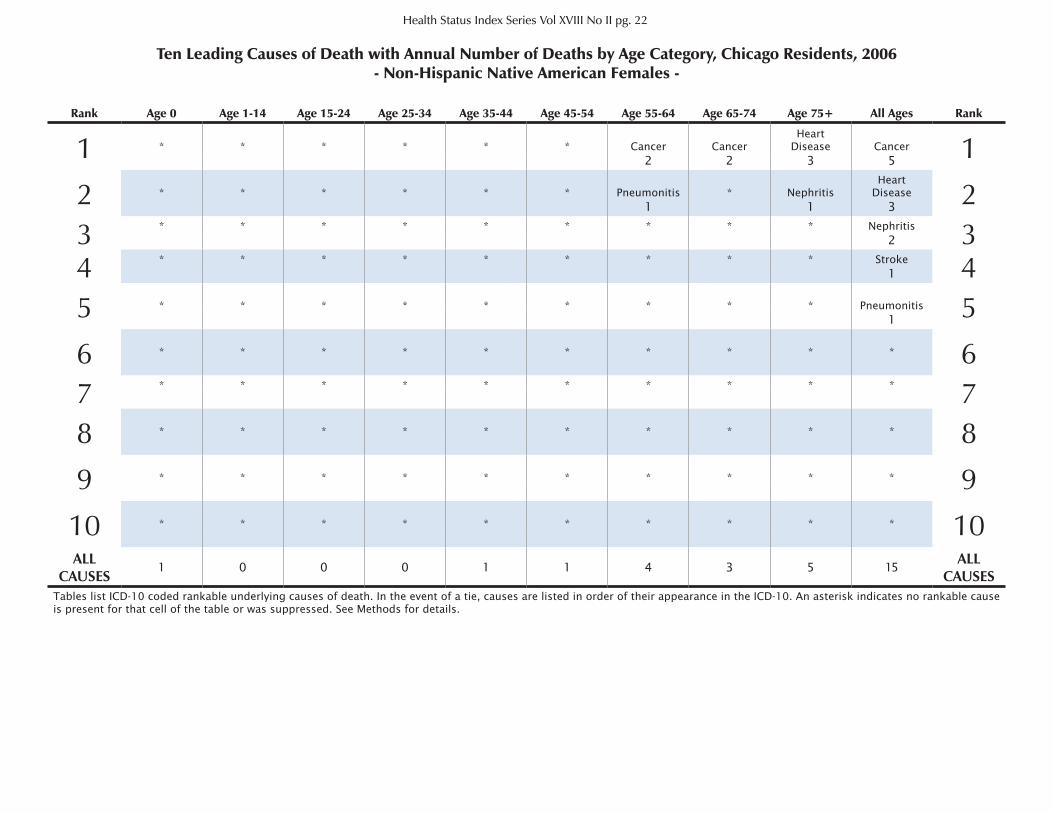
Ten Leading Causes of Death with Annual Number of Deaths by Age Category, Chicago Residents, 2006- Non-Hispanic Native American Females -
Health Status Index Series Vol XVIII No II pg. 22
Rank Age 0 Age 1-14 Age 15-24 Age 25-34 Age 35-44 Age 45-54 Age 55-64 Age 65-74 Age 75+ All Ages Rank
1 * * * * * * Cancer CancerHeart
Disease Cancer 12 2 3 5
2 * * * * * * Pneumonitis * NephritisHeart
Disease 21 1 3
3 * * * * * * * * * Nephritis 32
4 * * * * * * * * * Stroke 41
5 * * * * * * * * * Pneumonitis 51
6 * * * * * * * * * * 67 * * * * * * * * * * 78 * * * * * * * * * * 8
9 * * * * * * * * * * 9
10 * * * * * * * * * * 10ALL
CAUSES1 0 0 0 1 1 4 3 5 15
ALL CAUSES
Tables list ICD-10 coded rankable underlying causes of death. In the event of a tie, causes are listed in order of their appearance in the ICD-10. An asterisk indicates no rankable cause is present for that cell of the table or was suppressed. See Methods for details.
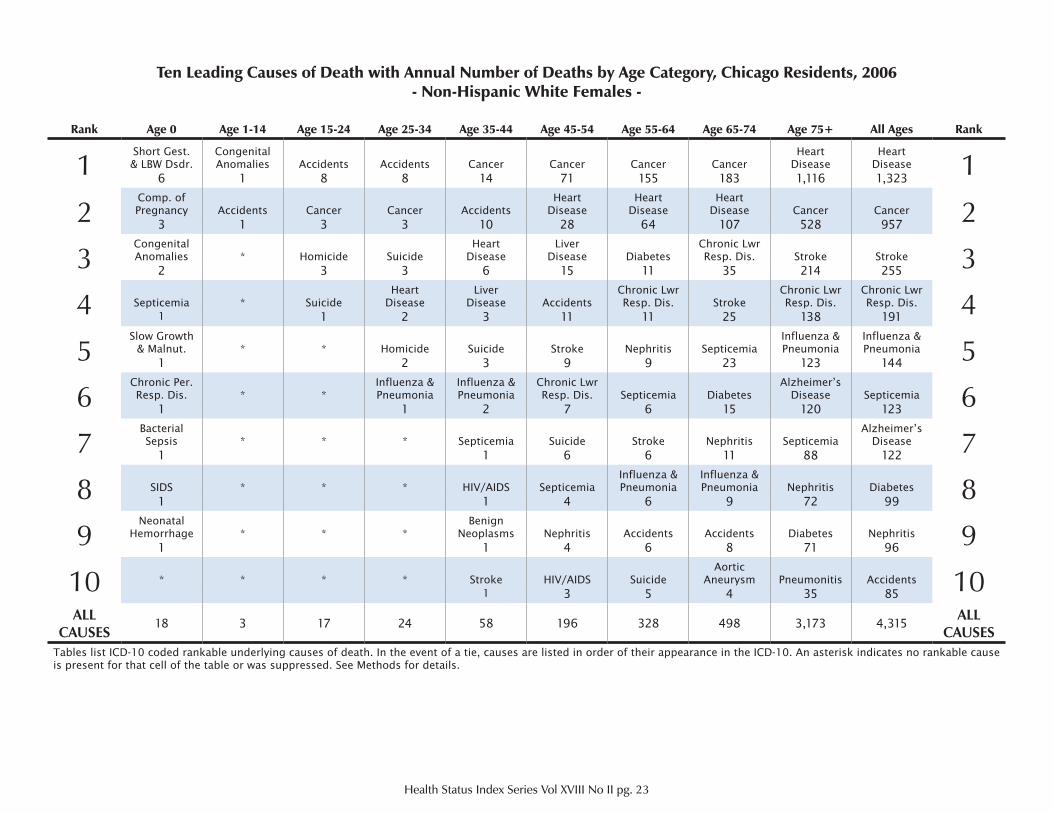
Ten Leading Causes of Death with Annual Number of Deaths by Age Category, Chicago Residents, 2006- Non-Hispanic White Females -
Health Status Index Series Vol XVIII No II pg. 23
Rank Age 0 Age 1-14 Age 15-24 Age 25-34 Age 35-44 Age 45-54 Age 55-64 Age 65-74 Age 75+ All Ages Rank
1Short Gest.& LBW Dsdr.
Congenital Anomalies Accidents Accidents Cancer Cancer Cancer Cancer
HeartDisease
HeartDisease 1
6 1 8 8 14 71 155 183 1,116 1,323
2Comp. of Pregnancy Accidents Cancer Cancer Accidents
HeartDisease
HeartDisease
HeartDisease Cancer Cancer 23 1 3 3 10 28 64 107 528 957
3Congenital Anomalies * Homicide Suicide
HeartDisease
LiverDisease Diabetes
Chronic Lwr Resp. Dis. Stroke Stroke 32 3 3 6 15 11 35 214 255
4 Septicemia * SuicideHeart
DiseaseLiver
Disease AccidentsChronic Lwr Resp. Dis. Stroke
Chronic Lwr Resp. Dis.
Chronic Lwr Resp. Dis. 41 1 2 3 11 11 25 138 191
5Slow Growth
& Malnut. * * Homicide Suicide Stroke Nephritis SepticemiaInfluenza & Pneumonia
Influenza & Pneumonia 51 2 3 9 9 23 123 144
6Chronic Per. Resp. Dis. * *
Influenza & Pneumonia
Influenza & Pneumonia
Chronic Lwr Resp. Dis. Septicemia Diabetes
Alzheimer’s Disease Septicemia 61 1 2 7 6 15 120 123
7Bacterial Sepsis * * * Septicemia Suicide Stroke Nephritis Septicemia
Alzheimer’s Disease 71 1 6 6 11 88 122
8 SIDS * * * HIV/AIDS SepticemiaInfluenza & Pneumonia
Influenza & Pneumonia Nephritis Diabetes 81 1 4 6 9 72 99
9Neonatal
Hemorrhage * * *Benign
Neoplasms Nephritis Accidents Accidents Diabetes Nephritis 91 1 4 6 8 71 96
10 * * * * Stroke HIV/AIDS SuicideAortic
Aneurysm Pneumonitis Accidents 101 3 5 4 35 85
ALL CAUSES
18 3 17 24 58 196 328 498 3,173 4,315ALL
CAUSESTables list ICD-10 coded rankable underlying causes of death. In the event of a tie, causes are listed in order of their appearance in the ICD-10. An asterisk indicates no rankable cause is present for that cell of the table or was suppressed. See Methods for details.
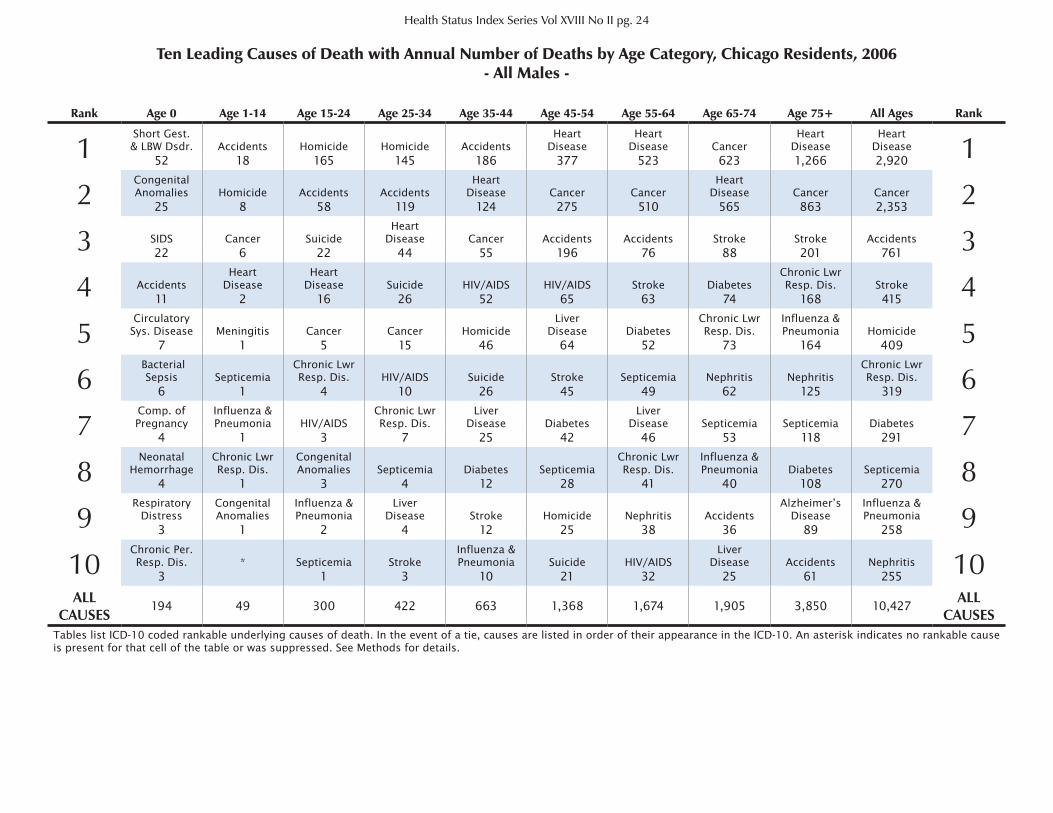
Ten Leading Causes of Death with Annual Number of Deaths by Age Category, Chicago Residents, 2006- All Males -
Health Status Index Series Vol XVIII No II pg. 24
Rank Age 0 Age 1-14 Age 15-24 Age 25-34 Age 35-44 Age 45-54 Age 55-64 Age 65-74 Age 75+ All Ages Rank
1Short Gest.& LBW Dsdr. Accidents Homicide Homicide Accidents
HeartDisease
HeartDisease Cancer
HeartDisease
HeartDisease 152 18 165 145 186 377 523 623 1,266 2,920
2Congenital Anomalies Homicide Accidents Accidents
HeartDisease Cancer Cancer
HeartDisease Cancer Cancer 225 8 58 119 124 275 510 565 863 2,353
3 SIDS Cancer SuicideHeart
Disease Cancer Accidents Accidents Stroke Stroke Accidents 322 6 22 44 55 196 76 88 201 761
4 AccidentsHeart
Disease Heart
Disease Suicide HIV/AIDS HIV/AIDS Stroke DiabetesChronic Lwr Resp. Dis. Stroke 411 2 16 26 52 65 63 74 168 415
5Circulatory
Sys. Disease Meningitis Cancer Cancer HomicideLiver
Disease DiabetesChronic Lwr Resp. Dis.
Influenza & Pneumonia Homicide 57 1 5 15 46 64 52 73 164 409
6 Bacterial
Sepsis SepticemiaChronic Lwr Resp. Dis. HIV/AIDS Suicide Stroke Septicemia Nephritis Nephritis
Chronic Lwr Resp. Dis. 66 1 4 10 26 45 49 62 125 319
7Comp. of Pregnancy
Influenza & Pneumonia HIV/AIDS
Chronic Lwr Resp. Dis.
LiverDisease Diabetes
LiverDisease Septicemia Septicemia Diabetes 74 1 3 7 25 42 46 53 118 291
8Neonatal
HemorrhageChronic Lwr Resp. Dis.
Congenital Anomalies Septicemia Diabetes Septicemia
Chronic Lwr Resp. Dis.
Influenza & Pneumonia Diabetes Septicemia 84 1 3 4 12 28 41 40 108 270
9Respiratory
DistressCongenital Anomalies
Influenza & Pneumonia
LiverDisease Stroke Homicide Nephritis Accidents
Alzheimer’s Disease
Influenza & Pneumonia 93 1 2 4 12 25 38 36 89 258
10Chronic Per. Resp. Dis. * Septicemia Stroke
Influenza & Pneumonia Suicide HIV/AIDS
LiverDisease Accidents Nephritis 103 1 3 10 21 32 25 61 255
ALL CAUSES
194 49 300 422 663 1,368 1,674 1,905 3,850 10,427ALL
CAUSESTables list ICD-10 coded rankable underlying causes of death. In the event of a tie, causes are listed in order of their appearance in the ICD-10. An asterisk indicates no rankable cause is present for that cell of the table or was suppressed. See Methods for details.
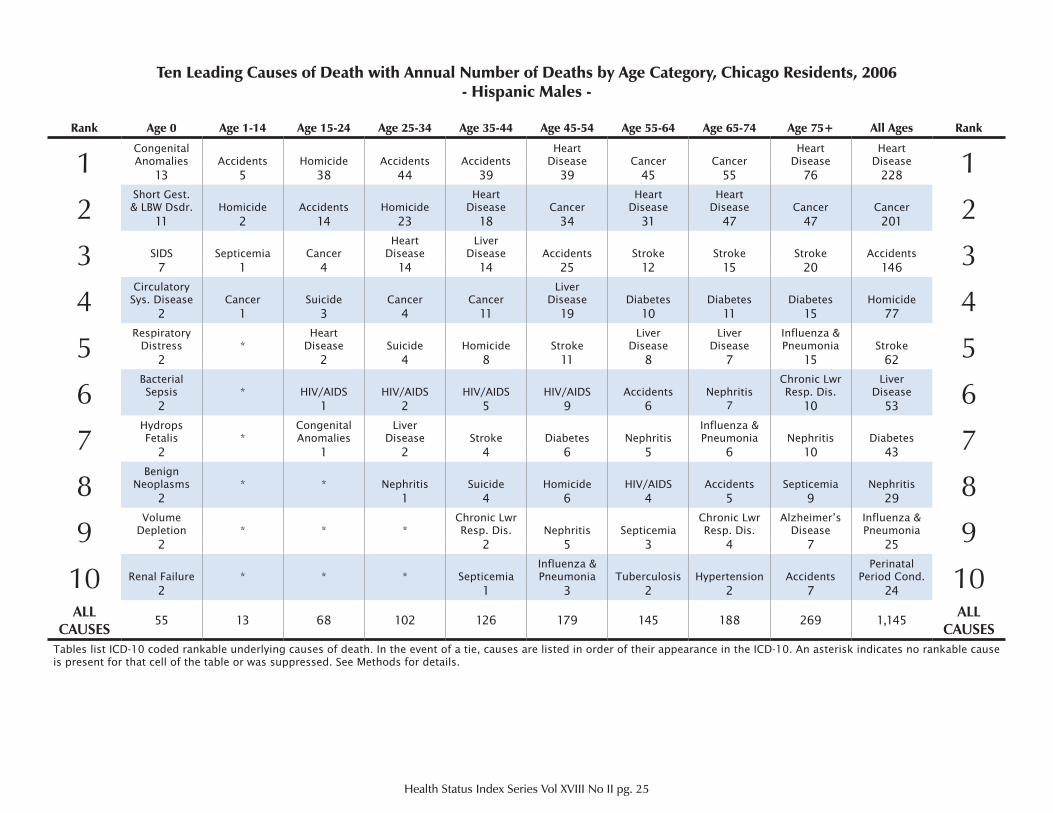
Ten Leading Causes of Death with Annual Number of Deaths by Age Category, Chicago Residents, 2006- Hispanic Males -
Health Status Index Series Vol XVIII No II pg. 25
Rank Age 0 Age 1-14 Age 15-24 Age 25-34 Age 35-44 Age 45-54 Age 55-64 Age 65-74 Age 75+ All Ages Rank
1Congenital Anomalies Accidents Homicide Accidents Accidents
HeartDisease Cancer Cancer
HeartDisease
HeartDisease 113 5 38 44 39 39 45 55 76 228
2Short Gest.& LBW Dsdr. Homicide Accidents Homicide
HeartDisease Cancer
HeartDisease
HeartDisease Cancer Cancer 211 2 14 23 18 34 31 47 47 201
3 SIDS Septicemia CancerHeart
DiseaseLiver
Disease Accidents Stroke Stroke Stroke Accidents 37 1 4 14 14 25 12 15 20 146
4Circulatory
Sys. Disease Cancer Suicide Cancer CancerLiver
Disease Diabetes Diabetes Diabetes Homicide 42 1 3 4 11 19 10 11 15 77
5Respiratory
Distress *Heart
Disease Suicide Homicide StrokeLiver
DiseaseLiver
DiseaseInfluenza & Pneumonia Stroke 52 2 4 8 11 8 7 15 62
6Bacterial Sepsis * HIV/AIDS HIV/AIDS HIV/AIDS HIV/AIDS Accidents Nephritis
Chronic Lwr Resp. Dis.
LiverDisease 62 1 2 5 9 6 7 10 53
7Hydrops Fetalis *
Congenital Anomalies
LiverDisease Stroke Diabetes Nephritis
Influenza & Pneumonia Nephritis Diabetes 72 1 2 4 6 5 6 10 43
8Benign
Neoplasms * * Nephritis Suicide Homicide HIV/AIDS Accidents Septicemia Nephritis 82 1 4 6 4 5 9 29
9Volume
Depletion * * *Chronic Lwr Resp. Dis. Nephritis Septicemia
Chronic Lwr Resp. Dis.
Alzheimer’s Disease
Influenza & Pneumonia 92 2 5 3 4 7 25
10 Renal Failure * * * SepticemiaInfluenza & Pneumonia Tuberculosis Hypertension Accidents
PerinatalPeriod Cond. 102 1 3 2 2 7 24
ALL CAUSES
55 13 68 102 126 179 145 188 269 1,145ALL
CAUSESTables list ICD-10 coded rankable underlying causes of death. In the event of a tie, causes are listed in order of their appearance in the ICD-10. An asterisk indicates no rankable cause is present for that cell of the table or was suppressed. See Methods for details.
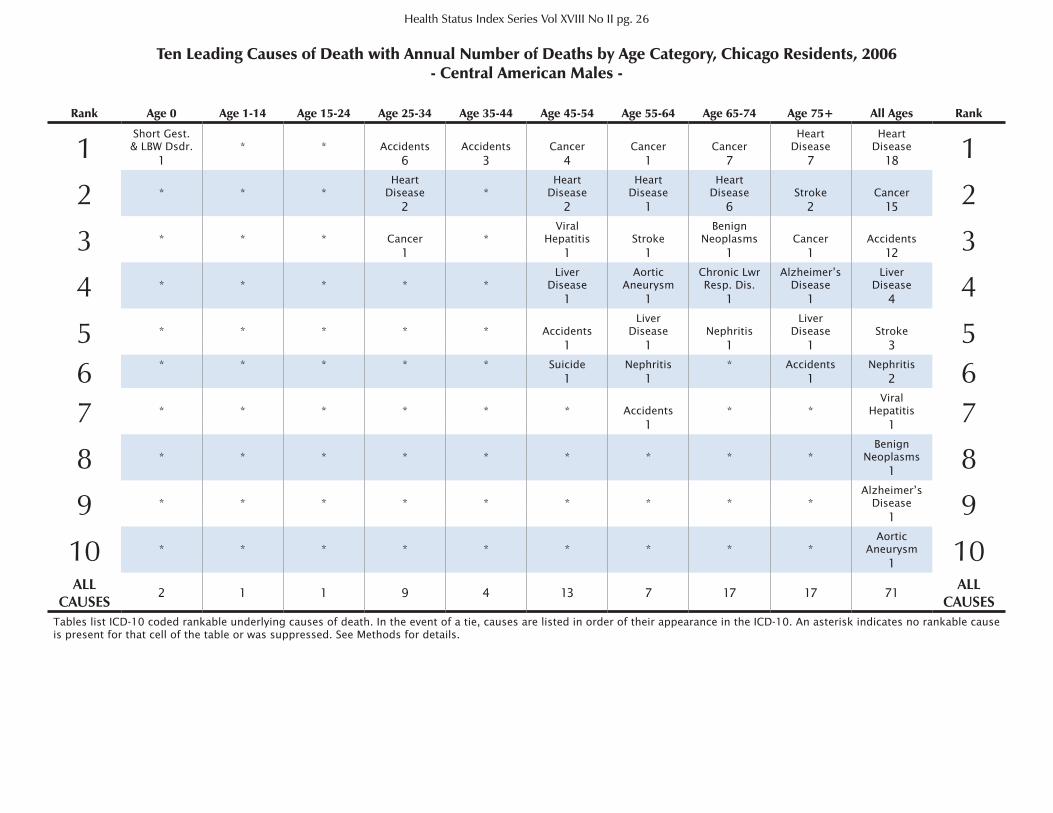
Health Status Index Series Vol XVIII No II pg. 26
Ten Leading Causes of Death with Annual Number of Deaths by Age Category, Chicago Residents, 2006- Central American Males -
Rank Age 0 Age 1-14 Age 15-24 Age 25-34 Age 35-44 Age 45-54 Age 55-64 Age 65-74 Age 75+ All Ages Rank
1Short Gest.& LBW Dsdr. * * Accidents Accidents Cancer Cancer Cancer
HeartDisease
HeartDisease 11 6 3 4 1 7 7 18
2 * * *Heart
Disease *Heart
DiseaseHeart
DiseaseHeart
Disease Stroke Cancer 22 2 1 6 2 15
3 * * * Cancer *Viral
Hepatitis StrokeBenign
Neoplasms Cancer Accidents 31 1 1 1 1 12
4 * * * * *Liver
DiseaseAortic
AneurysmChronic Lwr Resp. Dis.
Alzheimer’s Disease
LiverDisease 41 1 1 1 4
5 * * * * * AccidentsLiver
Disease NephritisLiver
Disease Stroke 51 1 1 1 3
6 * * * * * Suicide Nephritis * Accidents Nephritis 61 1 1 2
7 * * * * * * Accidents * *Viral
Hepatitis 71 1
8 * * * * * * * * *Benign
Neoplasms 81
9 * * * * * * * * *Alzheimer’s
Disease 91
10 * * * * * * * * *Aortic
Aneurysm 101
ALL CAUSES
2 1 1 9 4 13 7 17 17 71ALL
CAUSESTables list ICD-10 coded rankable underlying causes of death. In the event of a tie, causes are listed in order of their appearance in the ICD-10. An asterisk indicates no rankable cause is present for that cell of the table or was suppressed. See Methods for details.
Health Status Index Series Vol XVIII No II pg. 27
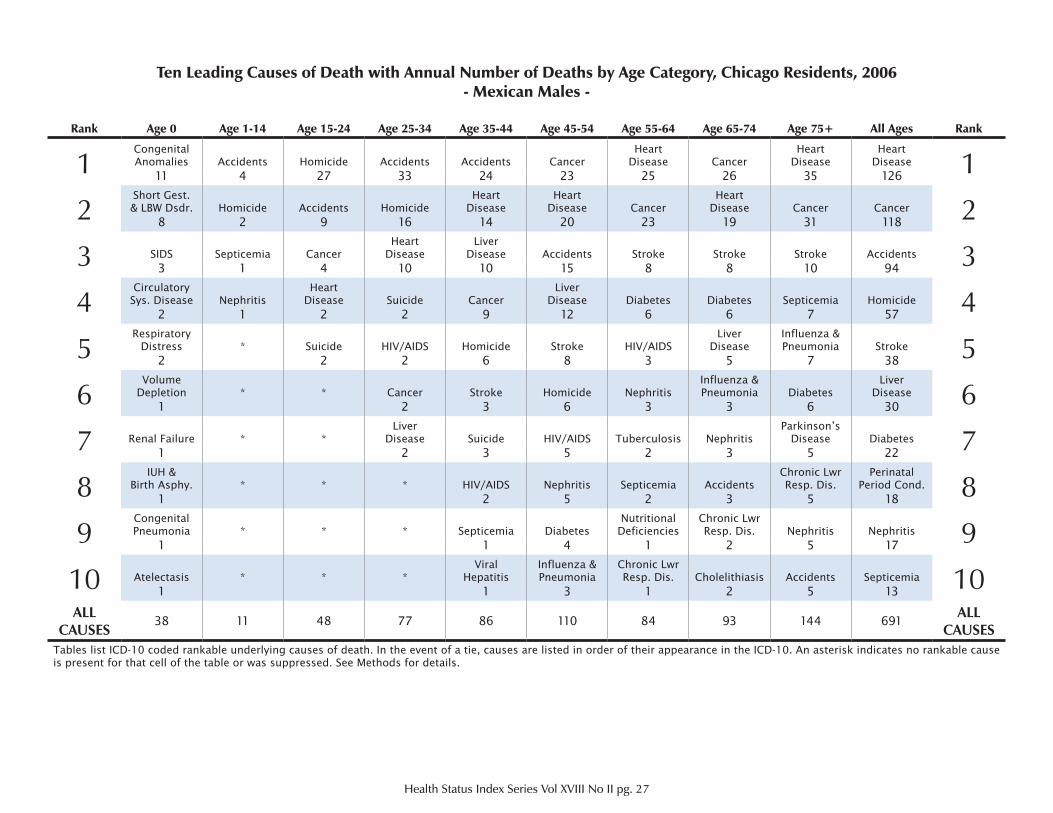
Ten Leading Causes of Death with Annual Number of Deaths by Age Category, Chicago Residents, 2006- Mexican Males -
Rank Age 0 Age 1-14 Age 15-24 Age 25-34 Age 35-44 Age 45-54 Age 55-64 Age 65-74 Age 75+ All Ages Rank
1Congenital Anomalies Accidents Homicide Accidents Accidents Cancer
HeartDisease Cancer
HeartDisease
HeartDisease 111 4 27 33 24 23 25 26 35 126
2Short Gest.& LBW Dsdr. Homicide Accidents Homicide
HeartDisease
HeartDisease Cancer
HeartDisease Cancer Cancer 28 2 9 16 14 20 23 19 31 118
3 SIDS Septicemia CancerHeart
DiseaseLiver
Disease Accidents Stroke Stroke Stroke Accidents 33 1 4 10 10 15 8 8 10 94
4Circulatory
Sys. Disease NephritisHeart
Disease Suicide CancerLiver
Disease Diabetes Diabetes Septicemia Homicide 42 1 2 2 9 12 6 6 7 57
5Respiratory
Distress * Suicide HIV/AIDS Homicide Stroke HIV/AIDSLiver
DiseaseInfluenza & Pneumonia Stroke 52 2 2 6 8 3 5 7 38
6Volume
Depletion * * Cancer Stroke Homicide NephritisInfluenza & Pneumonia Diabetes
LiverDisease 61 2 3 6 3 3 6 30
7 Renal Failure * *Liver
Disease Suicide HIV/AIDS Tuberculosis NephritisParkinson’s
Disease Diabetes 71 2 3 5 2 3 5 22
8IUH &
Birth Asphy. * * * HIV/AIDS Nephritis Septicemia AccidentsChronic Lwr Resp. Dis.
PerinatalPeriod Cond. 81 2 5 2 3 5 18
9Congenital Pneumonia * * * Septicemia Diabetes
Nutritional Deficiencies
Chronic Lwr Resp. Dis. Nephritis Nephritis 91 1 4 1 2 5 17
10 Atelectasis * * *Viral
HepatitisInfluenza & Pneumonia
Chronic Lwr Resp. Dis. Cholelithiasis Accidents Septicemia 101 1 3 1 2 5 13
ALL CAUSES
38 11 48 77 86 110 84 93 144 691ALL
CAUSESTables list ICD-10 coded rankable underlying causes of death. In the event of a tie, causes are listed in order of their appearance in the ICD-10. An asterisk indicates no rankable cause is present for that cell of the table or was suppressed. See Methods for details.
Health Status Index Series Vol XVIII No II pg. 28
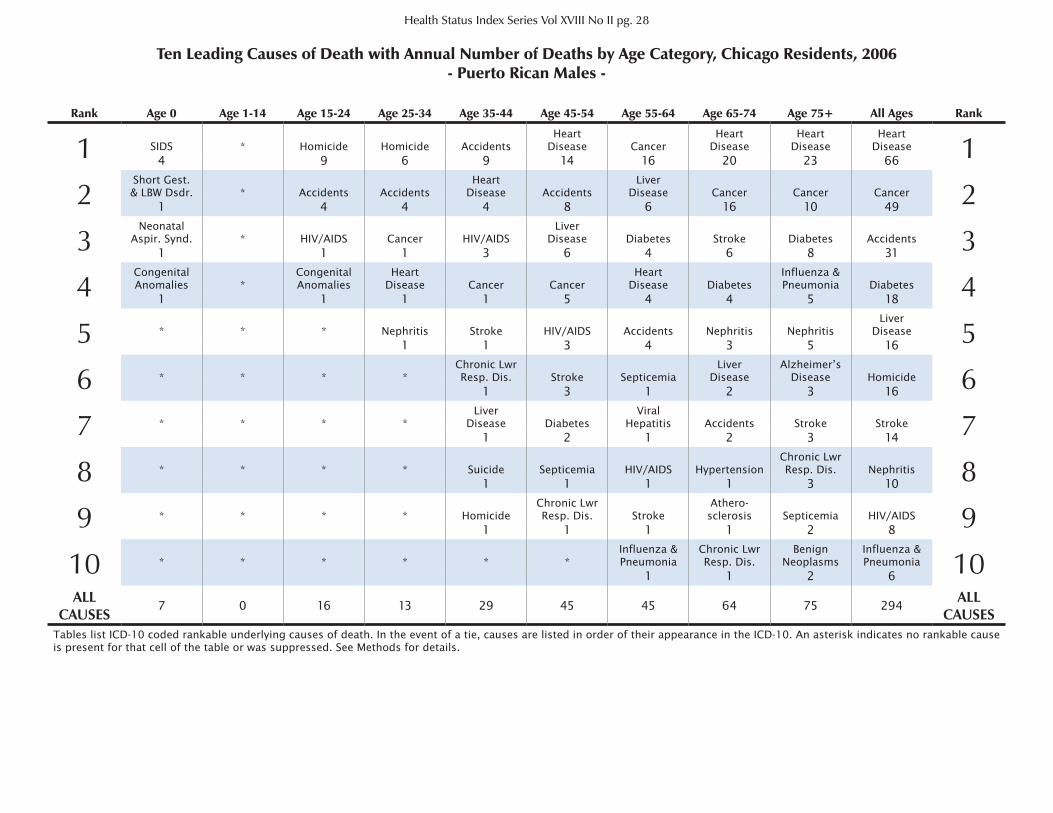
Ten Leading Causes of Death with Annual Number of Deaths by Age Category, Chicago Residents, 2006- Puerto Rican Males -
Rank Age 0 Age 1-14 Age 15-24 Age 25-34 Age 35-44 Age 45-54 Age 55-64 Age 65-74 Age 75+ All Ages Rank
1 SIDS * Homicide Homicide AccidentsHeart
Disease CancerHeart
DiseaseHeart
DiseaseHeart
Disease 14 9 6 9 14 16 20 23 66
2Short Gest.& LBW Dsdr. * Accidents Accidents
HeartDisease Accidents
LiverDisease Cancer Cancer Cancer 21 4 4 4 8 6 16 10 49
3Neonatal
Aspir. Synd. * HIV/AIDS Cancer HIV/AIDSLiver
Disease Diabetes Stroke Diabetes Accidents 31 1 1 3 6 4 6 8 31
4Congenital Anomalies *
Congenital Anomalies
HeartDisease Cancer Cancer
HeartDisease Diabetes
Influenza & Pneumonia Diabetes 41 1 1 1 5 4 4 5 18
5 * * * Nephritis Stroke HIV/AIDS Accidents Nephritis NephritisLiver
Disease 51 1 3 4 3 5 16
6 * * * *Chronic Lwr Resp. Dis. Stroke Septicemia
LiverDisease
Alzheimer’s Disease Homicide 61 3 1 2 3 16
7 * * * *Liver
Disease DiabetesViral
Hepatitis Accidents Stroke Stroke 71 2 1 2 3 14
8 * * * * Suicide Septicemia HIV/AIDS HypertensionChronic Lwr Resp. Dis. Nephritis 81 1 1 1 3 10
9 * * * * HomicideChronic Lwr Resp. Dis. Stroke
Athero-sclerosis Septicemia HIV/AIDS 91 1 1 1 2 8
10 * * * * * *Influenza & Pneumonia
Chronic Lwr Resp. Dis.
BenignNeoplasms
Influenza & Pneumonia 101 1 2 6
ALL CAUSES
7 0 16 13 29 45 45 64 75 294ALL
CAUSESTables list ICD-10 coded rankable underlying causes of death. In the event of a tie, causes are listed in order of their appearance in the ICD-10. An asterisk indicates no rankable cause is present for that cell of the table or was suppressed. See Methods for details.
Health Status Index Series Vol XVIII No II pg. 29
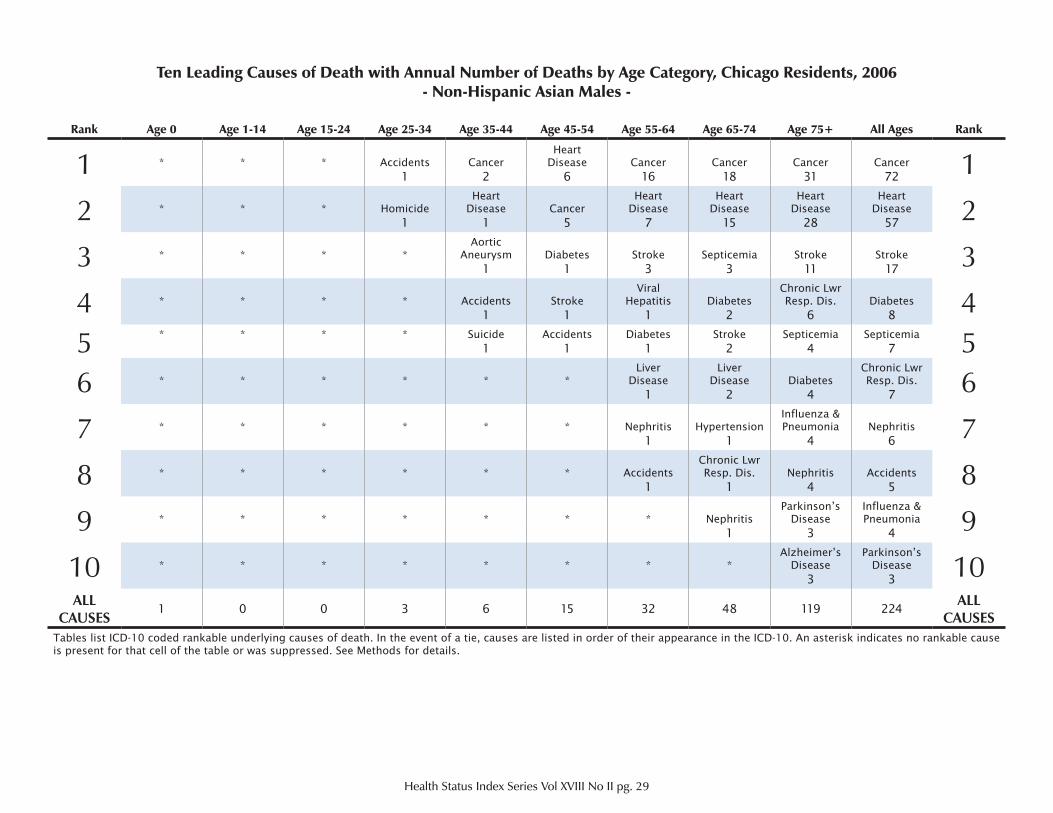
Ten Leading Causes of Death with Annual Number of Deaths by Age Category, Chicago Residents, 2006- Non-Hispanic Asian Males -
Rank Age 0 Age 1-14 Age 15-24 Age 25-34 Age 35-44 Age 45-54 Age 55-64 Age 65-74 Age 75+ All Ages Rank
1 * * * Accidents CancerHeart
Disease Cancer Cancer Cancer Cancer 11 2 6 16 18 31 72
2 * * * HomicideHeart
Disease CancerHeart
DiseaseHeart
DiseaseHeart
DiseaseHeart
Disease 21 1 5 7 15 28 57
3 * * * *Aortic
Aneurysm Diabetes Stroke Septicemia Stroke Stroke 31 1 3 3 11 17
4 * * * * Accidents StrokeViral
Hepatitis DiabetesChronic Lwr Resp. Dis. Diabetes 41 1 1 2 6 8
5 * * * * Suicide Accidents Diabetes Stroke Septicemia Septicemia 51 1 1 2 4 7
6 * * * * * *Liver
DiseaseLiver
Disease DiabetesChronic Lwr Resp. Dis. 61 2 4 7
7 * * * * * * Nephritis HypertensionInfluenza & Pneumonia Nephritis 71 1 4 6
8 * * * * * * AccidentsChronic Lwr Resp. Dis. Nephritis Accidents 81 1 4 5
9 * * * * * * * NephritisParkinson’s
DiseaseInfluenza & Pneumonia 91 3 4
10 * * * * * * * *Alzheimer’s
DiseaseParkinson’s
Disease 103 3
ALL CAUSES
1 0 0 3 6 15 32 48 119 224ALL
CAUSESTables list ICD-10 coded rankable underlying causes of death. In the event of a tie, causes are listed in order of their appearance in the ICD-10. An asterisk indicates no rankable cause is present for that cell of the table or was suppressed. See Methods for details.
Health Status Index Series Vol XVIII No II pg. 30
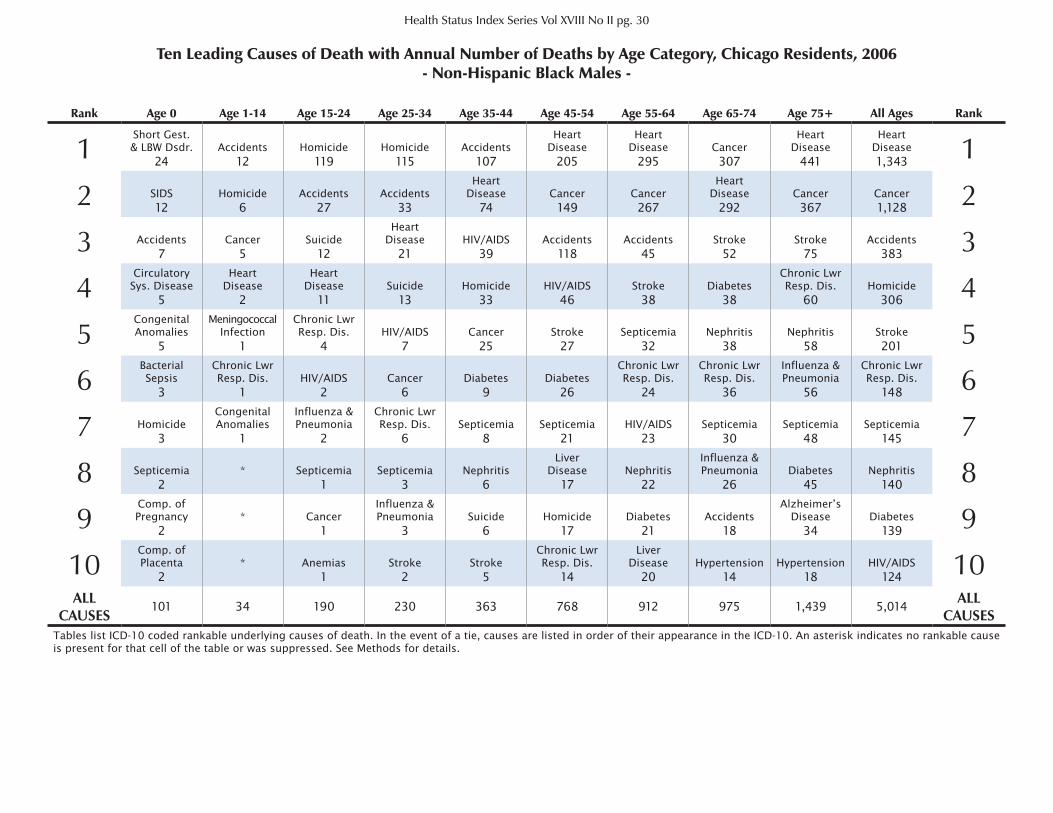
Ten Leading Causes of Death with Annual Number of Deaths by Age Category, Chicago Residents, 2006- Non-Hispanic Black Males -
Rank Age 0 Age 1-14 Age 15-24 Age 25-34 Age 35-44 Age 45-54 Age 55-64 Age 65-74 Age 75+ All Ages Rank
1Short Gest.& LBW Dsdr. Accidents Homicide Homicide Accidents
HeartDisease
HeartDisease Cancer
HeartDisease
HeartDisease 1
24 12 119 115 107 205 295 307 441 1,343
2 SIDS Homicide Accidents AccidentsHeart
Disease Cancer CancerHeart
Disease Cancer Cancer 212 6 27 33 74 149 267 292 367 1,128
3 Accidents Cancer SuicideHeart
Disease HIV/AIDS Accidents Accidents Stroke Stroke Accidents 37 5 12 21 39 118 45 52 75 383
4Circulatory
Sys. DiseaseHeart
DiseaseHeart
Disease Suicide Homicide HIV/AIDS Stroke DiabetesChronic Lwr Resp. Dis. Homicide 45 2 11 13 33 46 38 38 60 306
5Congenital Anomalies
Meningococcal Infection
Chronic Lwr Resp. Dis. HIV/AIDS Cancer Stroke Septicemia Nephritis Nephritis Stroke 55 1 4 7 25 27 32 38 58 201
6Bacterial Sepsis
Chronic Lwr Resp. Dis. HIV/AIDS Cancer Diabetes Diabetes
Chronic Lwr Resp. Dis.
Chronic Lwr Resp. Dis.
Influenza & Pneumonia
Chronic Lwr Resp. Dis. 63 1 2 6 9 26 24 36 56 148
7 HomicideCongenital Anomalies
Influenza & Pneumonia
Chronic Lwr Resp. Dis. Septicemia Septicemia HIV/AIDS Septicemia Septicemia Septicemia 73 1 2 6 8 21 23 30 48 145
8 Septicemia * Septicemia Septicemia NephritisLiver
Disease NephritisInfluenza & Pneumonia Diabetes Nephritis 82 1 3 6 17 22 26 45 140
9Comp. of Pregnancy * Cancer
Influenza & Pneumonia Suicide Homicide Diabetes Accidents
Alzheimer’s Disease Diabetes 92 1 3 6 17 21 18 34 139
10Comp. of Placenta * Anemias Stroke Stroke
Chronic Lwr Resp. Dis.
LiverDisease Hypertension Hypertension HIV/AIDS 102 1 2 5 14 20 14 18 124
ALL CAUSES
101 34 190 230 363 768 912 975 1,439 5,014ALL
CAUSESTables list ICD-10 coded rankable underlying causes of death. In the event of a tie, causes are listed in order of their appearance in the ICD-10. An asterisk indicates no rankable cause is present for that cell of the table or was suppressed. See Methods for details.
Health Status Index Series Vol XVIII No II pg. 31
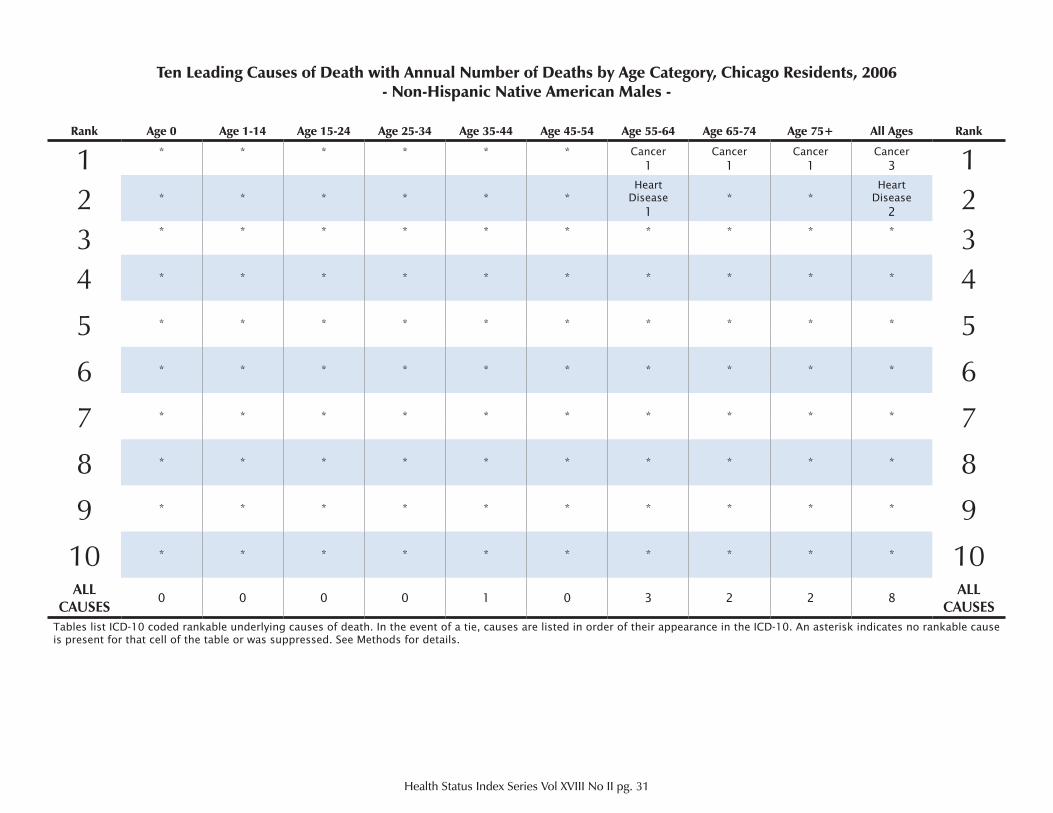
Ten Leading Causes of Death with Annual Number of Deaths by Age Category, Chicago Residents, 2006- Non-Hispanic Native American Males -
Rank Age 0 Age 1-14 Age 15-24 Age 25-34 Age 35-44 Age 45-54 Age 55-64 Age 65-74 Age 75+ All Ages Rank
1 * * * * * * Cancer Cancer Cancer Cancer 11 1 1 3
2 * * * * * *Heart
Disease * *Heart
Disease 21 2
3 * * * * * * * * * * 34 * * * * * * * * * * 4
5 * * * * * * * * * * 5
6 * * * * * * * * * * 6
7 * * * * * * * * * * 7
8 * * * * * * * * * * 8
9 * * * * * * * * * * 9
10 * * * * * * * * * * 10ALL
CAUSES0 0 0 0 1 0 3 2 2 8
ALL CAUSES
Tables list ICD-10 coded rankable underlying causes of death. In the event of a tie, causes are listed in order of their appearance in the ICD-10. An asterisk indicates no rankable cause is present for that cell of the table or was suppressed. See Methods for details.
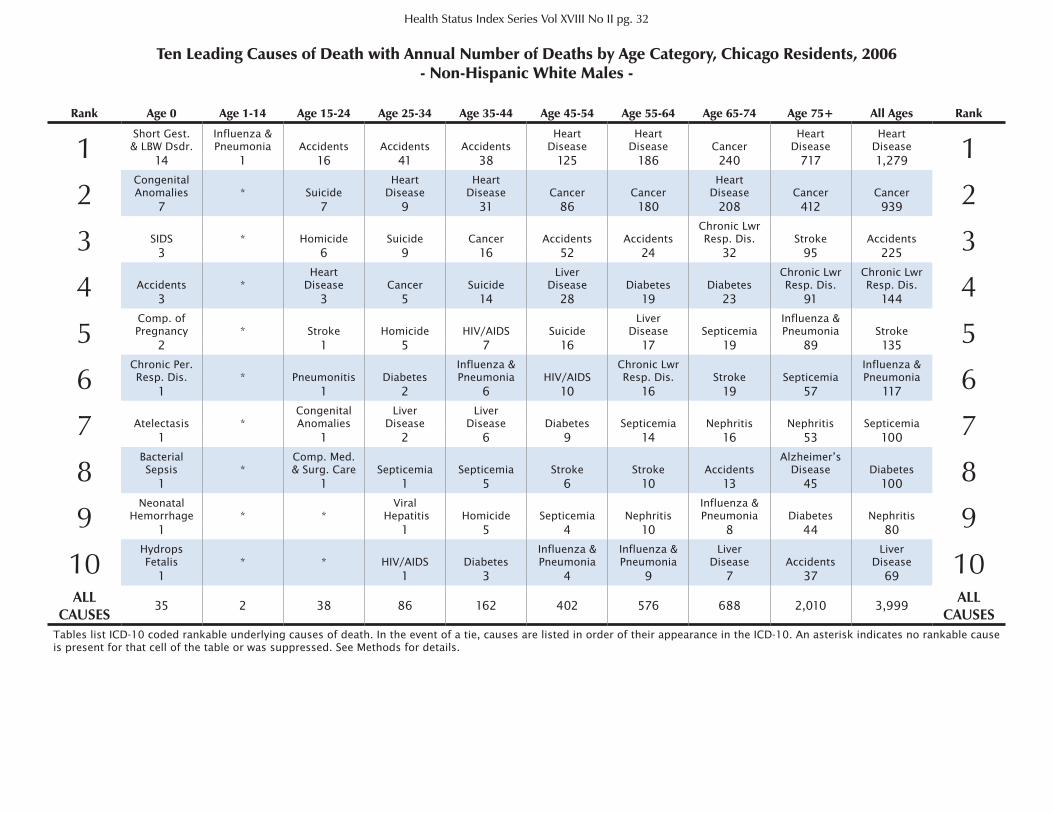
Ten Leading Causes of Death with Annual Number of Deaths by Age Category, Chicago Residents, 2006- Non-Hispanic White Males -
Health Status Index Series Vol XVIII No II pg. 32
Rank Age 0 Age 1-14 Age 15-24 Age 25-34 Age 35-44 Age 45-54 Age 55-64 Age 65-74 Age 75+ All Ages Rank
1Short Gest.& LBW Dsdr.
Influenza & Pneumonia Accidents Accidents Accidents
HeartDisease
HeartDisease Cancer
HeartDisease
HeartDisease 114 1 16 41 38 125 186 240 717 1,279
2Congenital Anomalies * Suicide
HeartDisease
HeartDisease Cancer Cancer
HeartDisease Cancer Cancer 27 7 9 31 86 180 208 412 939
3 SIDS * Homicide Suicide Cancer Accidents AccidentsChronic Lwr Resp. Dis. Stroke Accidents 33 6 9 16 52 24 32 95 225
4 Accidents *Heart
Disease Cancer SuicideLiver
Disease Diabetes DiabetesChronic Lwr Resp. Dis.
Chronic Lwr Resp. Dis. 43 3 5 14 28 19 23 91 144
5Comp. of Pregnancy * Stroke Homicide HIV/AIDS Suicide
LiverDisease Septicemia
Influenza & Pneumonia Stroke 52 1 5 7 16 17 19 89 135
6Chronic Per. Resp. Dis. * Pneumonitis Diabetes
Influenza & Pneumonia HIV/AIDS
Chronic Lwr Resp. Dis. Stroke Septicemia
Influenza & Pneumonia 61 1 2 6 10 16 19 57 117
7 Atelectasis *Congenital Anomalies
LiverDisease
LiverDisease Diabetes Septicemia Nephritis Nephritis Septicemia 71 1 2 6 9 14 16 53 100
8Bacterial Sepsis *
Comp. Med. & Surg. Care Septicemia Septicemia Stroke Stroke Accidents
Alzheimer’s Disease Diabetes 81 1 1 5 6 10 13 45 100
9Neonatal
Hemorrhage * *Viral
Hepatitis Homicide Septicemia NephritisInfluenza & Pneumonia Diabetes Nephritis 91 1 5 4 10 8 44 80
10Hydrops Fetalis * * HIV/AIDS Diabetes
Influenza & Pneumonia
Influenza & Pneumonia
LiverDisease Accidents
LiverDisease 101 1 3 4 9 7 37 69
ALL CAUSES
35 2 38 86 162 402 576 688 2,010 3,999ALL
CAUSESTables list ICD-10 coded rankable underlying causes of death. In the event of a tie, causes are listed in order of their appearance in the ICD-10. An asterisk indicates no rankable cause is present for that cell of the table or was suppressed. See Methods for details.
CHAPTER 3
TEN LEADING CAUSES OF DEATH BY AGE-SPECIFIC ETHNICITY, 2006
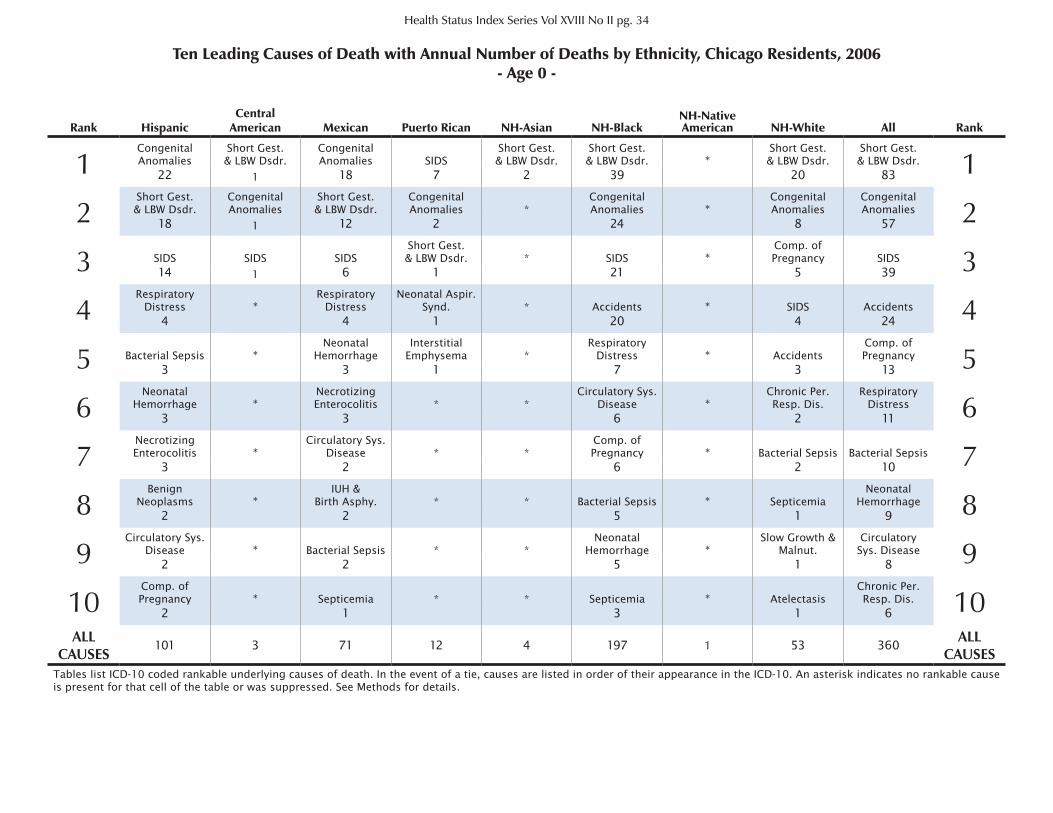
Ten Leading Causes of Death with Annual Number of Deaths by Ethnicity, Chicago Residents, 2006- Age 0 -
Health Status Index Series Vol XVIII No II pg. 34
Rank HispanicCentral
American Mexican Puerto Rican NH-Asian NH-BlackNH-Native American NH-White All Rank
1Congenital Anomalies
Short Gest. & LBW Dsdr.
Congenital Anomalies SIDS
Short Gest.& LBW Dsdr.
Short Gest.& LBW Dsdr. *
Short Gest.& LBW Dsdr.
Short Gest.& LBW Dsdr. 122 1 18 7 2 39 20 83
2Short Gest.& LBW Dsdr.
Congenital Anomalies
Short Gest.& LBW Dsdr.
Congenital Anomalies *
Congenital Anomalies *
Congenital Anomalies
Congenital Anomalies 218 1 12 2 24 8 57
3 SIDS SIDS SIDSShort Gest.& LBW Dsdr. * SIDS *
Comp. of Pregnancy SIDS 314 1 6 1 21 5 39
4Respiratory
Distress *Respiratory
DistressNeonatal Aspir.
Synd. * Accidents * SIDS Accidents 44 4 1 20 4 24
5 Bacterial Sepsis *Neonatal
HemorrhageInterstitial
Emphysema *Respiratory
Distress * Accidents Comp. ofPregnancy 53 3 1 7 3 13
6Neonatal
Hemorrhage *Necrotizing Enterocolitis * *
Circulatory Sys. Disease *
Chronic Per. Resp. Dis.
Respiratory Distress 63 3 6 2 11
7Necrotizing Enterocolitis *
Circulatory Sys. Disease * *
Comp. of Pregnancy * Bacterial Sepsis Bacterial Sepsis 73 2 6 2 10
8Benign
Neoplasms *IUH &
Birth Asphy. * * Bacterial Sepsis * SepticemiaNeonatal
Hemorrhage 82 2 5 1 9
9Circulatory Sys.
Disease * Bacterial Sepsis * *Neonatal
Hemorrhage *Slow Growth &
Malnut.Circulatory
Sys. Disease 92 2 5 1 8
10Comp. of Pregnancy * Septicemia * * Septicemia * Atelectasis
Chronic Per. Resp. Dis. 102 1 3 1 6
ALL CAUSES
101 3 71 12 4 197 1 53 360ALL
CAUSESTables list ICD-10 coded rankable underlying causes of death. In the event of a tie, causes are listed in order of their appearance in the ICD-10. An asterisk indicates no rankable cause is present for that cell of the table or was suppressed. See Methods for details.
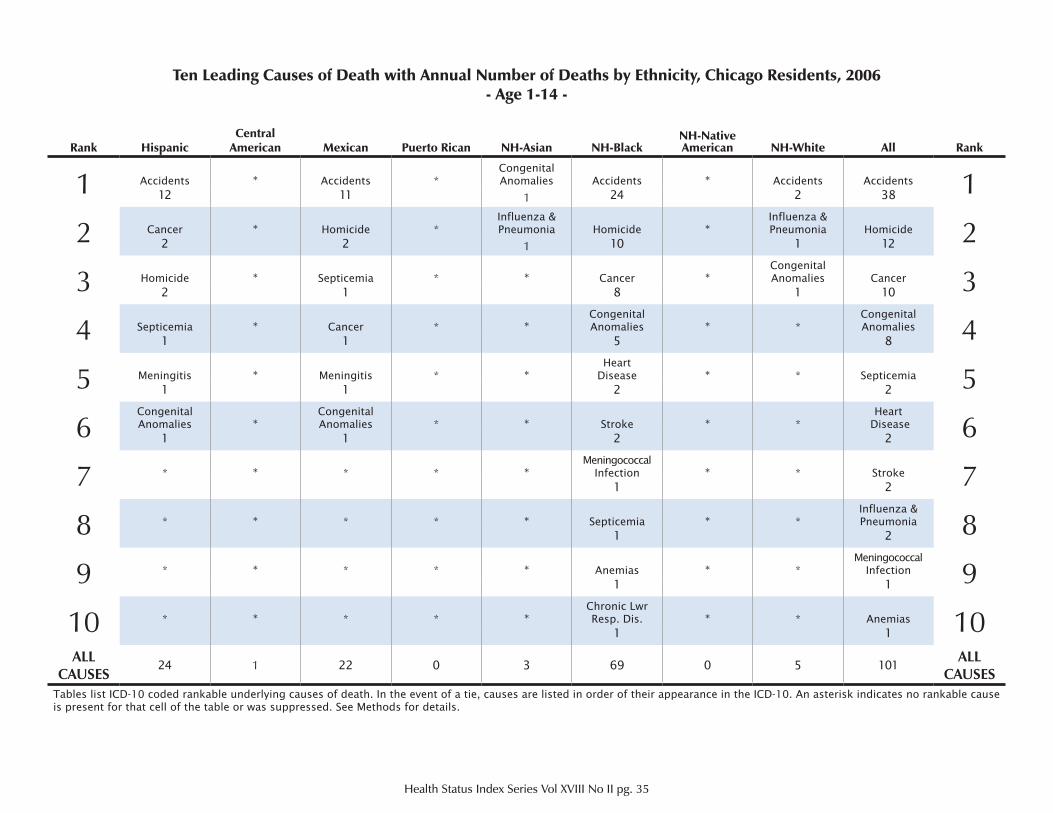
Ten Leading Causes of Death with Annual Number of Deaths by Ethnicity, Chicago Residents, 2006- Age 1-14 -
Health Status Index Series Vol XVIII No II pg. 35
Rank HispanicCentral
American Mexican Puerto Rican NH-Asian NH-BlackNH-Native American NH-White All Rank
1 Accidents * Accidents *Congenital Anomalies Accidents * Accidents Accidents 112 11 1 24 2 38
2 Cancer * Homicide *Influenza & Pneumonia Homicide *
Influenza & Pneumonia Homicide 22 2 1 10 1 12
3 Homicide * Septicemia * * Cancer *Congenital Anomalies Cancer 32 1 8 1 10
4 Septicemia * Cancer * *Congenital Anomalies * *
Congenital Anomalies 41 1 5 8
5 Meningitis * Meningitis * *Heart
Disease * * Septicemia 51 1 2 2
6Congenital Anomalies *
Congenital Anomalies * * Stroke * *
Heart Disease 61 1 2 2
7 * * * * *Meningococcal
Infection * * Stroke 71 2
8 * * * * * Septicemia * *Influenza & Pneumonia 81 2
9 * * * * * Anemias * *Meningococcal
Infection 91 1
10 * * * * *Chronic Lwr Resp. Dis. * * Anemias 101 1
ALL CAUSES
24 1 22 0 3 69 0 5 101ALL
CAUSESTables list ICD-10 coded rankable underlying causes of death. In the event of a tie, causes are listed in order of their appearance in the ICD-10. An asterisk indicates no rankable cause is present for that cell of the table or was suppressed. See Methods for details.
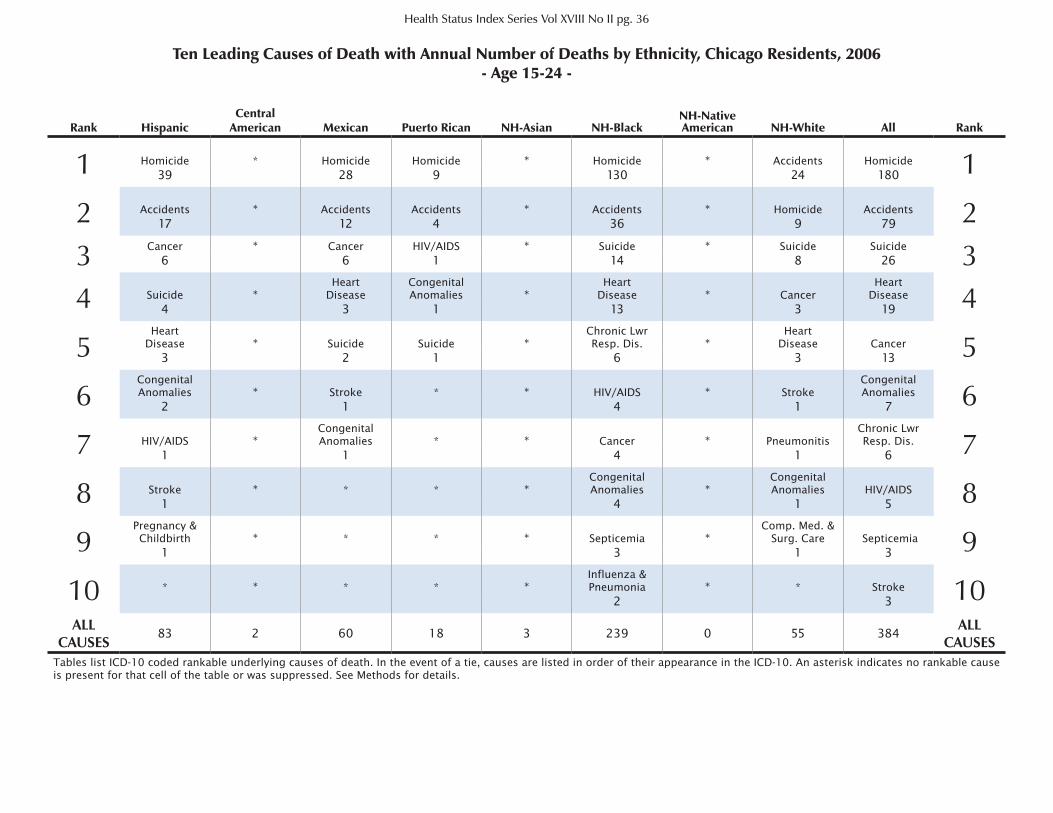
Ten Leading Causes of Death with Annual Number of Deaths by Ethnicity, Chicago Residents, 2006- Age 15-24 -
Health Status Index Series Vol XVIII No II pg. 36
Rank HispanicCentral
American Mexican Puerto Rican NH-Asian NH-BlackNH-Native American NH-White All Rank
1 Homicide * Homicide Homicide * Homicide * Accidents Homicide 139 28 9 130 24 180
2 Accidents * Accidents Accidents * Accidents * Homicide Accidents 217 12 4 36 9 79
3 Cancer * Cancer HIV/AIDS * Suicide * Suicide Suicide 36 6 1 14 8 26
4 Suicide *Heart
DiseaseCongenital Anomalies *
HeartDisease * Cancer
HeartDisease 44 3 1 13 3 19
5Heart
Disease * Suicide Suicide *Chronic Lwr Resp. Dis. *
HeartDisease Cancer 53 2 1 6 3 13
6Congenital Anomalies * Stroke * * HIV/AIDS * Stroke
Congenital Anomalies 62 1 4 1 7
7 HIV/AIDS *Congenital Anomalies * * Cancer * Pneumonitis
Chronic Lwr Resp. Dis. 71 1 4 1 6
8 Stroke * * * *Congenital Anomalies *
Congenital Anomalies HIV/AIDS 81 4 1 5
9Pregnancy & Childbirth * * * * Septicemia *
Comp. Med. & Surg. Care Septicemia 91 3 1 3
10 * * * * *Influenza & Pneumonia * * Stroke 102 3
ALL CAUSES
83 2 60 18 3 239 0 55 384ALL
CAUSESTables list ICD-10 coded rankable underlying causes of death. In the event of a tie, causes are listed in order of their appearance in the ICD-10. An asterisk indicates no rankable cause is present for that cell of the table or was suppressed. See Methods for details.
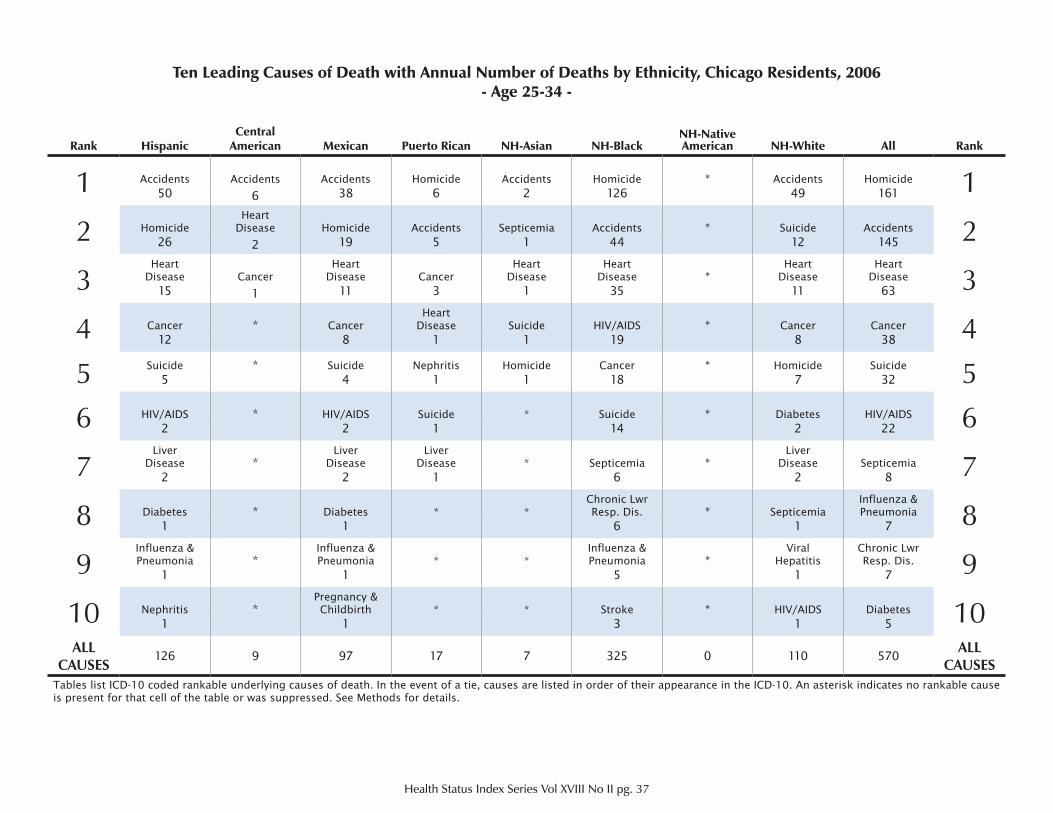
Ten Leading Causes of Death with Annual Number of Deaths by Ethnicity, Chicago Residents, 2006- Age 25-34 -
Health Status Index Series Vol XVIII No II pg. 37
Rank HispanicCentral
American Mexican Puerto Rican NH-Asian NH-BlackNH-Native American NH-White All Rank
1 Accidents Accidents Accidents Homicide Accidents Homicide * Accidents Homicide 150 6 38 6 2 126 49 161
2 HomicideHeart
Disease Homicide Accidents Septicemia Accidents * Suicide Accidents 226 2 19 5 1 44 12 145
3Heart
Disease CancerHeart
Disease CancerHeart
DiseaseHeart
Disease *Heart
DiseaseHeart
Disease 315 1 11 3 1 35 11 63
4 Cancer * CancerHeart
Disease Suicide HIV/AIDS * Cancer Cancer 412 8 1 1 19 8 38
5 Suicide * Suicide Nephritis Homicide Cancer * Homicide Suicide 55 4 1 1 18 7 32
6 HIV/AIDS * HIV/AIDS Suicide * Suicide * Diabetes HIV/AIDS 62 2 1 14 2 22
7Liver
Disease *Liver
DiseaseLiver
Disease * Septicemia *Liver
Disease Septicemia 72 2 1 6 2 8
8 Diabetes * Diabetes * *Chronic Lwr Resp. Dis. * Septicemia
Influenza & Pneumonia 81 1 6 1 7
9Influenza & Pneumonia *
Influenza & Pneumonia * *
Influenza & Pneumonia *
ViralHepatitis
Chronic Lwr Resp. Dis. 91 1 5 1 7
10 Nephritis *Pregnancy & Childbirth * * Stroke * HIV/AIDS Diabetes 101 1 3 1 5
ALL CAUSES
126 9 97 17 7 325 0 110 570ALL
CAUSESTables list ICD-10 coded rankable underlying causes of death. In the event of a tie, causes are listed in order of their appearance in the ICD-10. An asterisk indicates no rankable cause is present for that cell of the table or was suppressed. See Methods for details.
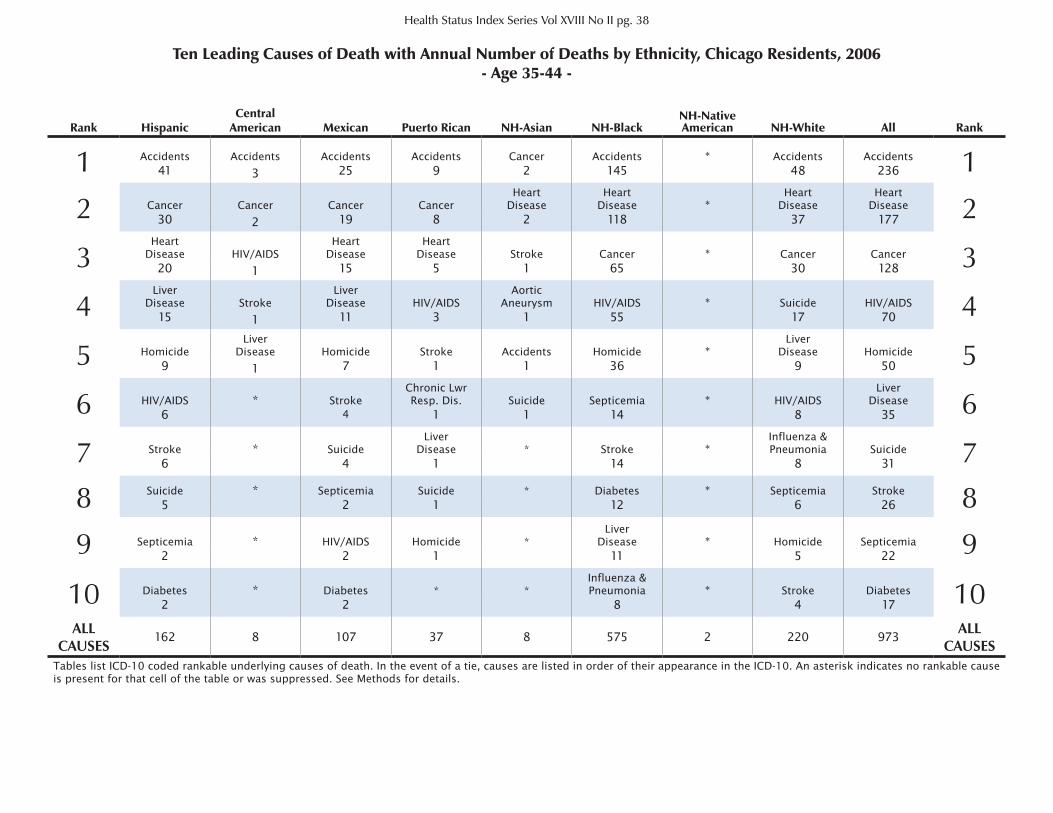
Ten Leading Causes of Death with Annual Number of Deaths by Ethnicity, Chicago Residents, 2006- Age 35-44 -
Health Status Index Series Vol XVIII No II pg. 38
Rank HispanicCentral
American Mexican Puerto Rican NH-Asian NH-BlackNH-Native American NH-White All Rank
1 Accidents Accidents Accidents Accidents Cancer Accidents * Accidents Accidents 141 3 25 9 2 145 48 236
2 Cancer Cancer Cancer CancerHeart
DiseaseHeart
Disease *Heart
DiseaseHeart
Disease 230 2 19 8 2 118 37 177
3Heart
Disease HIV/AIDSHeart
DiseaseHeart
Disease Stroke Cancer * Cancer Cancer 320 1 15 5 1 65 30 128
4Liver
Disease StrokeLiver
Disease HIV/AIDSAortic
Aneurysm HIV/AIDS * Suicide HIV/AIDS 415 1 11 3 1 55 17 70
5 HomicideLiver
Disease Homicide Stroke Accidents Homicide *Liver
Disease Homicide 59 1 7 1 1 36 9 50
6 HIV/AIDS * StrokeChronic Lwr Resp. Dis. Suicide Septicemia * HIV/AIDS
LiverDisease 66 4 1 1 14 8 35
7 Stroke * SuicideLiver
Disease * Stroke *Influenza & Pneumonia Suicide 76 4 1 14 8 31
8 Suicide * Septicemia Suicide * Diabetes * Septicemia Stroke 85 2 1 12 6 26
9 Septicemia * HIV/AIDS Homicide *Liver
Disease * Homicide Septicemia 92 2 1 11 5 22
10 Diabetes * Diabetes * *Influenza & Pneumonia * Stroke Diabetes 102 2 8 4 17
ALL CAUSES
162 8 107 37 8 575 2 220 973ALL
CAUSESTables list ICD-10 coded rankable underlying causes of death. In the event of a tie, causes are listed in order of their appearance in the ICD-10. An asterisk indicates no rankable cause is present for that cell of the table or was suppressed. See Methods for details.
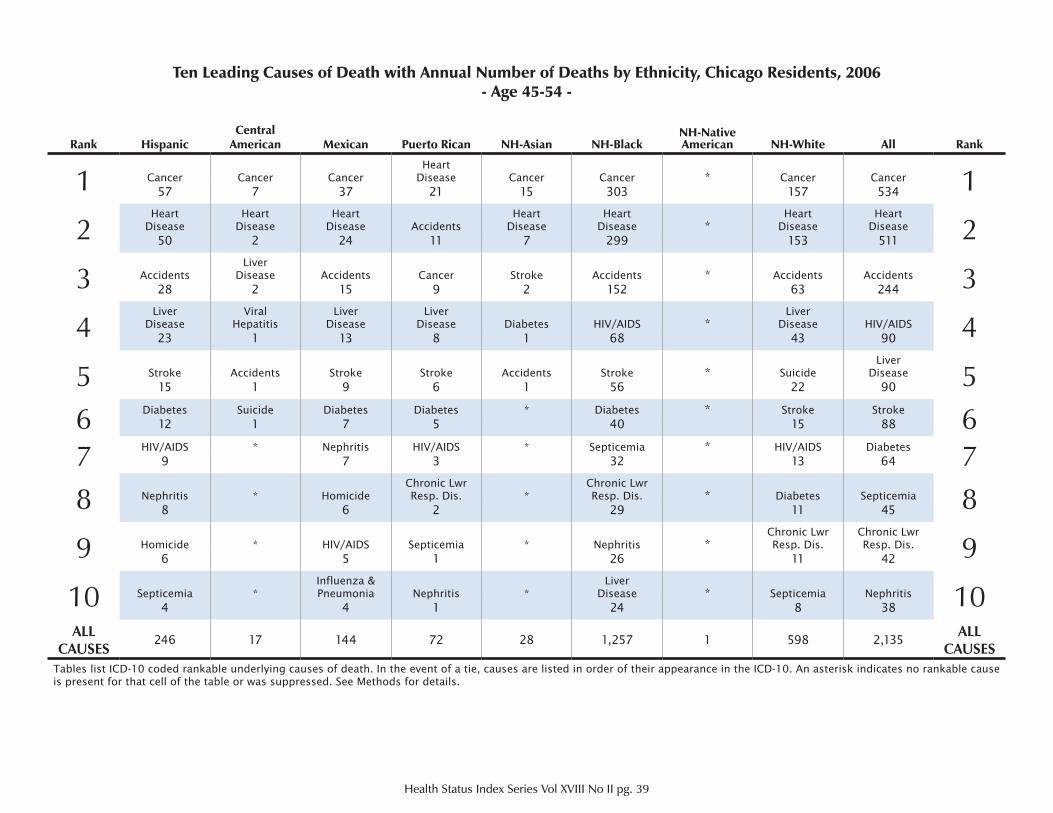
Ten Leading Causes of Death with Annual Number of Deaths by Ethnicity, Chicago Residents, 2006- Age 45-54 -
Health Status Index Series Vol XVIII No II pg. 39
Rank HispanicCentral
American Mexican Puerto Rican NH-Asian NH-BlackNH-Native American NH-White All Rank
1 Cancer Cancer CancerHeart
Disease Cancer Cancer * Cancer Cancer 157 7 37 21 15 303 157 534
2Heart
DiseaseHeart
DiseaseHeart
Disease AccidentsHeart
DiseaseHeart
Disease *Heart
DiseaseHeart
Disease 250 2 24 11 7 299 153 511
3 AccidentsLiver
Disease Accidents Cancer Stroke Accidents * Accidents Accidents 328 2 15 9 2 152 63 244
4Liver
DiseaseViral
HepatitisLiver
DiseaseLiver
Disease Diabetes HIV/AIDS *Liver
Disease HIV/AIDS 423 1 13 8 1 68 43 90
5 Stroke Accidents Stroke Stroke Accidents Stroke * SuicideLiver
Disease 515 1 9 6 1 56 22 90
6 Diabetes Suicide Diabetes Diabetes * Diabetes * Stroke Stroke 612 1 7 5 40 15 88
7 HIV/AIDS * Nephritis HIV/AIDS * Septicemia * HIV/AIDS Diabetes 79 7 3 32 13 64
8 Nephritis * HomicideChronic Lwr Resp. Dis. *
Chronic Lwr Resp. Dis. * Diabetes Septicemia 88 6 2 29 11 45
9 Homicide * HIV/AIDS Septicemia * Nephritis *Chronic Lwr Resp. Dis.
Chronic Lwr Resp. Dis. 96 5 1 26 11 42
10 Septicemia *Influenza & Pneumonia Nephritis *
LiverDisease * Septicemia Nephritis 104 4 1 24 8 38
ALL CAUSES
246 17 144 72 28 1,257 1 598 2,135ALL
CAUSESTables list ICD-10 coded rankable underlying causes of death. In the event of a tie, causes are listed in order of their appearance in the ICD-10. An asterisk indicates no rankable cause is present for that cell of the table or was suppressed. See Methods for details.
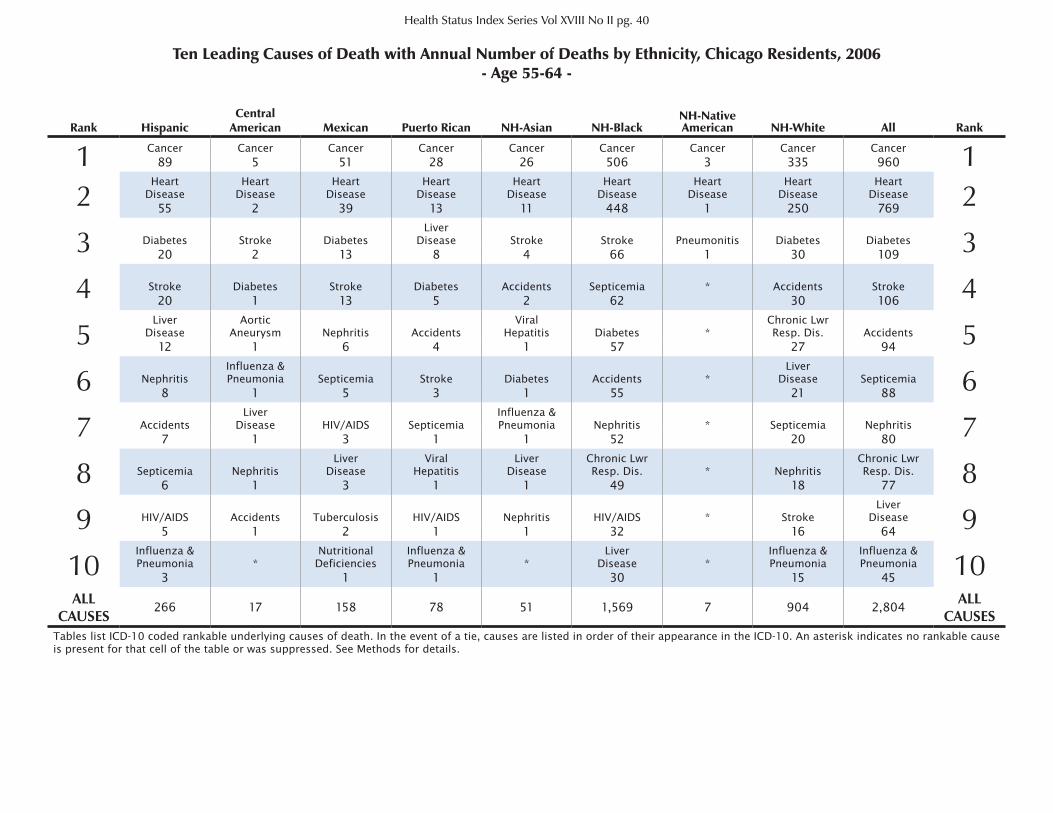
Ten Leading Causes of Death with Annual Number of Deaths by Ethnicity, Chicago Residents, 2006- Age 55-64 -
Health Status Index Series Vol XVIII No II pg. 40
Rank HispanicCentral
American Mexican Puerto Rican NH-Asian NH-BlackNH-Native American NH-White All Rank
1 Cancer Cancer Cancer Cancer Cancer Cancer Cancer Cancer Cancer 189 5 51 28 26 506 3 335 960
2Heart
DiseaseHeart
DiseaseHeart
DiseaseHeart
DiseaseHeart
DiseaseHeart
DiseaseHeart
DiseaseHeart
DiseaseHeart
Disease 255 2 39 13 11 448 1 250 769
3 Diabetes Stroke DiabetesLiver
Disease Stroke Stroke Pneumonitis Diabetes Diabetes 320 2 13 8 4 66 1 30 109
4 Stroke Diabetes Stroke Diabetes Accidents Septicemia * Accidents Stroke 420 1 13 5 2 62 30 106
5Liver
DiseaseAortic
Aneurysm Nephritis AccidentsViral
Hepatitis Diabetes *Chronic Lwr Resp. Dis. Accidents 512 1 6 4 1 57 27 94
6 NephritisInfluenza & Pneumonia Septicemia Stroke Diabetes Accidents *
LiverDisease Septicemia 68 1 5 3 1 55 21 88
7 AccidentsLiver
Disease HIV/AIDS SepticemiaInfluenza & Pneumonia Nephritis * Septicemia Nephritis 77 1 3 1 1 52 20 80
8 Septicemia NephritisLiver
DiseaseViral
HepatitisLiver
DiseaseChronic Lwr Resp. Dis. * Nephritis
Chronic Lwr Resp. Dis. 86 1 3 1 1 49 18 77
9 HIV/AIDS Accidents Tuberculosis HIV/AIDS Nephritis HIV/AIDS * StrokeLiver
Disease 95 1 2 1 1 32 16 64
10Influenza & Pneumonia *
Nutritional Deficiencies
Influenza & Pneumonia *
LiverDisease *
Influenza & Pneumonia
Influenza & Pneumonia 103 1 1 30 15 45
ALL CAUSES
266 17 158 78 51 1,569 7 904 2,804ALL
CAUSESTables list ICD-10 coded rankable underlying causes of death. In the event of a tie, causes are listed in order of their appearance in the ICD-10. An asterisk indicates no rankable cause is present for that cell of the table or was suppressed. See Methods for details.
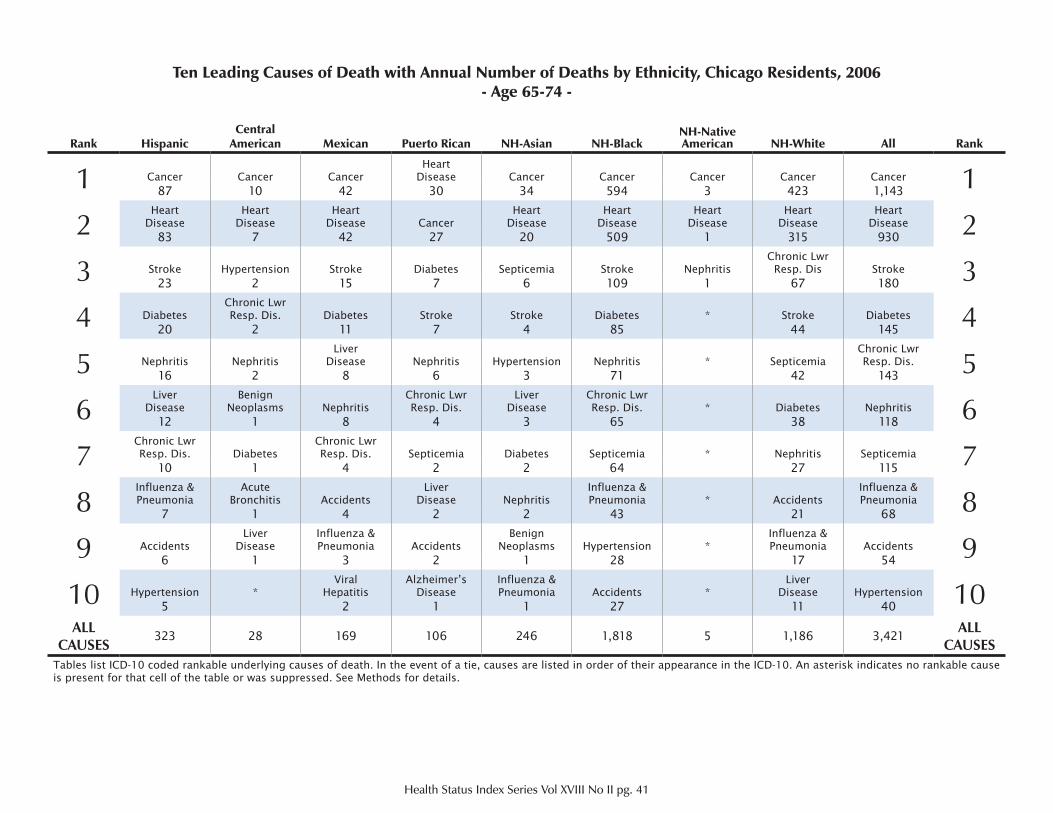
Ten Leading Causes of Death with Annual Number of Deaths by Ethnicity, Chicago Residents, 2006- Age 65-74 -
Health Status Index Series Vol XVIII No II pg. 41
Rank HispanicCentral
American Mexican Puerto Rican NH-Asian NH-BlackNH-Native American NH-White All Rank
1 Cancer Cancer CancerHeart
Disease Cancer Cancer Cancer Cancer Cancer 187 10 42 30 34 594 3 423 1,143
2Heart
DiseaseHeart
DiseaseHeart
Disease CancerHeart
DiseaseHeart
DiseaseHeart
DiseaseHeart
DiseaseHeart
Disease 283 7 42 27 20 509 1 315 930
3 Stroke Hypertension Stroke Diabetes Septicemia Stroke NephritisChronic Lwr
Resp. Dis Stroke 323 2 15 7 6 109 1 67 180
4 DiabetesChronic Lwr Resp. Dis. Diabetes Stroke Stroke Diabetes * Stroke Diabetes 420 2 11 7 4 85 44 145
5 Nephritis NephritisLiver
Disease Nephritis Hypertension Nephritis * SepticemiaChronic Lwr Resp. Dis. 516 2 8 6 3 71 42 143
6Liver
DiseaseBenign
Neoplasms NephritisChronic Lwr Resp. Dis.
LiverDisease
Chronic Lwr Resp. Dis. * Diabetes Nephritis 612 1 8 4 3 65 38 118
7Chronic Lwr Resp. Dis. Diabetes
Chronic Lwr Resp. Dis. Septicemia Diabetes Septicemia * Nephritis Septicemia 710 1 4 2 2 64 27 115
8Influenza & Pneumonia
AcuteBronchitis Accidents
LiverDisease Nephritis
Influenza & Pneumonia * Accidents
Influenza & Pneumonia 87 1 4 2 2 43 21 68
9 AccidentsLiver
DiseaseInfluenza & Pneumonia Accidents
Benign Neoplasms Hypertension *
Influenza & Pneumonia Accidents 96 1 3 2 1 28 17 54
10 Hypertension *Viral
HepatitisAlzheimer’s
DiseaseInfluenza & Pneumonia Accidents *
LiverDisease Hypertension 105 2 1 1 27 11 40
ALL CAUSES
323 28 169 106 246 1,818 5 1,186 3,421ALL
CAUSESTables list ICD-10 coded rankable underlying causes of death. In the event of a tie, causes are listed in order of their appearance in the ICD-10. An asterisk indicates no rankable cause is present for that cell of the table or was suppressed. See Methods for details.
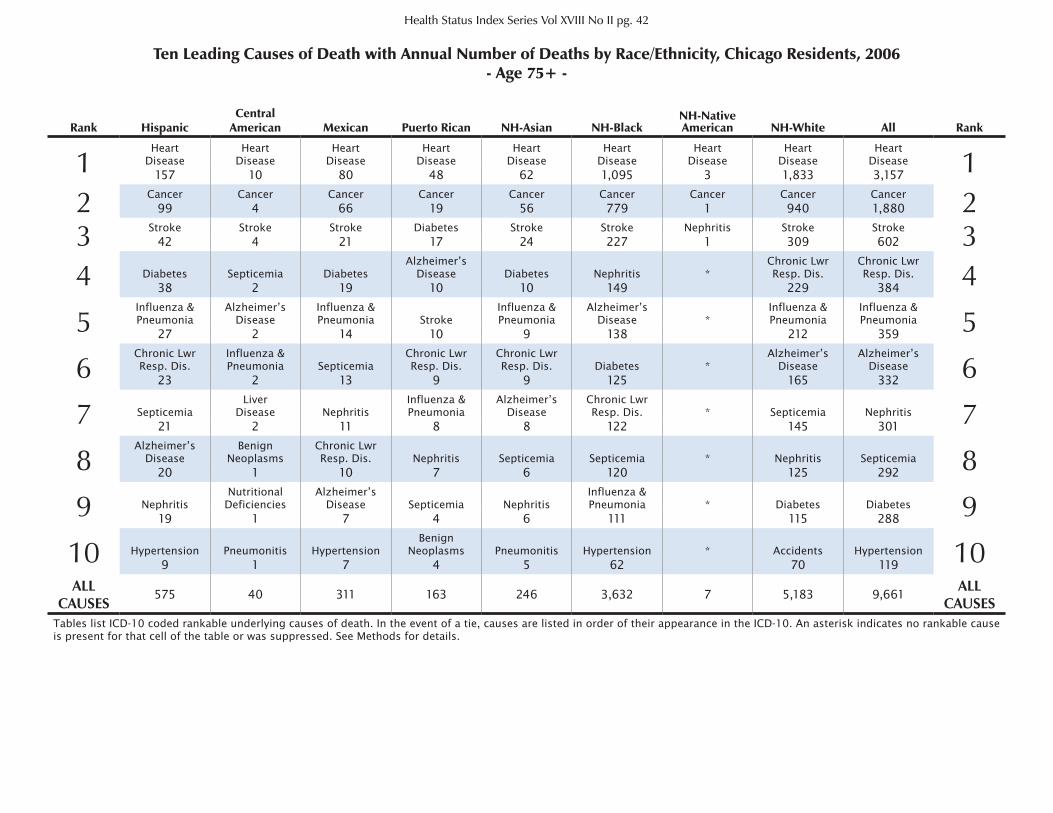
Ten Leading Causes of Death with Annual Number of Deaths by Race/Ethnicity, Chicago Residents, 2006- Age 75+ -
Health Status Index Series Vol XVIII No II pg. 42
Rank HispanicCentral
American Mexican Puerto Rican NH-Asian NH-BlackNH-Native American NH-White All Rank
1Heart
DiseaseHeart
DiseaseHeart
DiseaseHeart
DiseaseHeart
DiseaseHeart
DiseaseHeart
DiseaseHeart
DiseaseHeart
Disease 1157 10 80 48 62 1,095 3 1,833 3,157
2 Cancer Cancer Cancer Cancer Cancer Cancer Cancer Cancer Cancer 299 4 66 19 56 779 1 940 1,880
3 Stroke Stroke Stroke Diabetes Stroke Stroke Nephritis Stroke Stroke 342 4 21 17 24 227 1 309 602
4 Diabetes Septicemia DiabetesAlzheimer’s
Disease Diabetes Nephritis *Chronic Lwr Resp. Dis.
Chronic Lwr Resp. Dis. 438 2 19 10 10 149 229 384
5Influenza & Pneumonia
Alzheimer’s Disease
Influenza & Pneumonia Stroke
Influenza & Pneumonia
Alzheimer’s Disease *
Influenza & Pneumonia
Influenza & Pneumonia 527 2 14 10 9 138 212 359
6Chronic Lwr Resp. Dis.
Influenza & Pneumonia Septicemia
Chronic Lwr Resp. Dis.
Chronic Lwr Resp. Dis. Diabetes *
Alzheimer’s Disease
Alzheimer’s Disease 623 2 13 9 9 125 165 332
7 SepticemiaLiver
Disease NephritisInfluenza & Pneumonia
Alzheimer’s Disease
Chronic Lwr Resp. Dis. * Septicemia Nephritis 721 2 11 8 8 122 145 301
8Alzheimer’s
DiseaseBenign
NeoplasmsChronic Lwr Resp. Dis. Nephritis Septicemia Septicemia * Nephritis Septicemia 820 1 10 7 6 120 125 292
9 NephritisNutritional
DeficienciesAlzheimer’s
Disease Septicemia NephritisInfluenza & Pneumonia * Diabetes Diabetes 919 1 7 4 6 111 115 288
10 Hypertension Pneumonitis HypertensionBenign
Neoplasms Pneumonitis Hypertension * Accidents Hypertension 109 1 7 4 5 62 70 119
ALL CAUSES
575 40 311 163 246 3,632 7 5,183 9,661ALL
CAUSESTables list ICD-10 coded rankable underlying causes of death. In the event of a tie, causes are listed in order of their appearance in the ICD-10. An asterisk indicates no rankable cause is present for that cell of the table or was suppressed. See Methods for details.
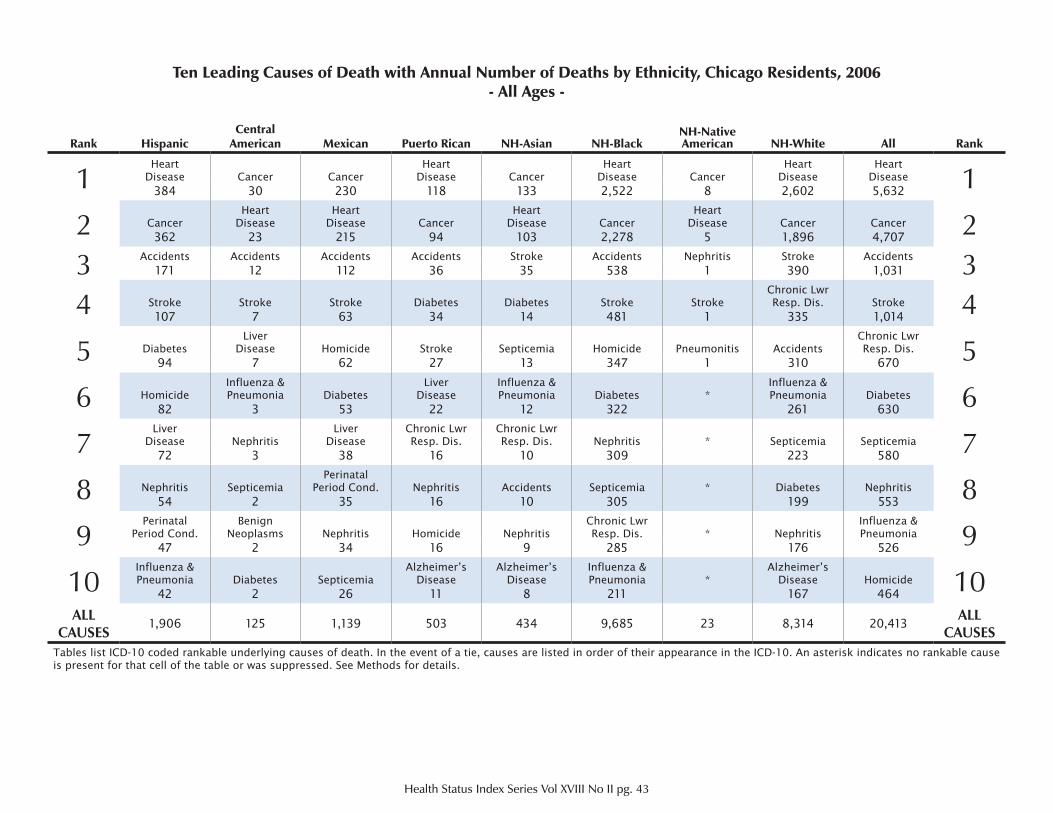
Ten Leading Causes of Death with Annual Number of Deaths by Ethnicity, Chicago Residents, 2006- All Ages -
Health Status Index Series Vol XVIII No II pg. 43
Rank HispanicCentral
American Mexican Puerto Rican NH-Asian NH-BlackNH-Native American NH-White All Rank
1Heart
Disease Cancer CancerHeart
Disease CancerHeart
Disease CancerHeart
DiseaseHeart
Disease 1384 30 230 118 133 2,522 8 2,602 5,632
2 CancerHeart
DiseaseHeart
Disease CancerHeart
Disease CancerHeart
Disease Cancer Cancer 2362 23 215 94 103 2,278 5 1,896 4,707
3 Accidents Accidents Accidents Accidents Stroke Accidents Nephritis Stroke Accidents 3171 12 112 36 35 538 1 390 1,031
4 Stroke Stroke Stroke Diabetes Diabetes Stroke StrokeChronic Lwr Resp. Dis. Stroke 4107 7 63 34 14 481 1 335 1,014
5 DiabetesLiver
Disease Homicide Stroke Septicemia Homicide Pneumonitis AccidentsChronic Lwr Resp. Dis. 594 7 62 27 13 347 1 310 670
6 HomicideInfluenza & Pneumonia Diabetes
LiverDisease
Influenza & Pneumonia Diabetes *
Influenza & Pneumonia Diabetes 682 3 53 22 12 322 261 630
7Liver
Disease NephritisLiver
DiseaseChronic Lwr Resp. Dis.
Chronic Lwr Resp. Dis. Nephritis * Septicemia Septicemia 772 3 38 16 10 309 223 580
8 Nephritis SepticemiaPerinatal
Period Cond. Nephritis Accidents Septicemia * Diabetes Nephritis 854 2 35 16 10 305 199 553
9Perinatal
Period Cond.Benign
Neoplasms Nephritis Homicide NephritisChronic Lwr Resp. Dis. * Nephritis
Influenza & Pneumonia 947 2 34 16 9 285 176 526
10Influenza & Pneumonia Diabetes Septicemia
Alzheimer’s Disease
Alzheimer’s Disease
Influenza & Pneumonia *
Alzheimer’s Disease Homicide 1042 2 26 11 8 211 167 464
ALL CAUSES
1,906 125 1,139 503 434 9,685 23 8,314 20,413ALL
CAUSESTables list ICD-10 coded rankable underlying causes of death. In the event of a tie, causes are listed in order of their appearance in the ICD-10. An asterisk indicates no rankable cause is present for that cell of the table or was suppressed. See Methods for details.

CHAPTER 4
TEN YEAR COMPARISON OF 2006 LEADING CAUSES OF DEATH
Note: Graphs for the Non-Hispanic Native American population were not produced because the number of deaths for each leading cause of death was less than 21. See Methods for details.
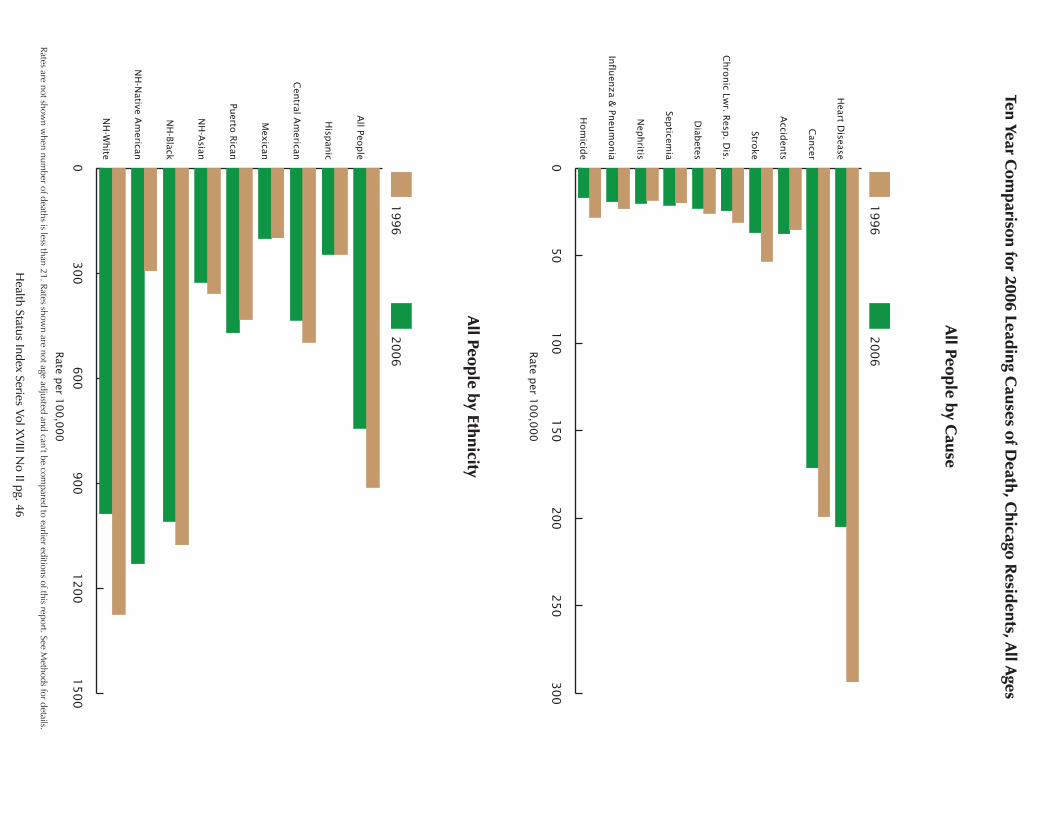
Ten Year Com
parison for 2006 Leading Causes of D
eath, Chicago Residents, All Ages
Health Status Index Series Vol XV
III No II pg. 46
Rates are not shown w
hen number of deaths is less than 21. Rates show
n are not age adjusted and can’t be compared to earlier editions of this report. See M
ethods for details.
050
100
150
200
25
0300
2006
1996
Hom
icide
Influ
enza &
Pneu
monia
Nep
hritis
Septicem
ia
Diab
etes
Chro
nic Lw
r. Resp
. Dis.
Stroke
Accid
ents
Can
cer
Heart D
isease
Rate p
er 100,0
00
All People by Cause
0300
600
90
01
200
15
00
2006
1996
NH
-White
NH
-Native A
merican
NH
-Black
NH
-Asian
Puerto
Rican
Mex
ican
Cen
tral Am
erican
Hisp
anic
All Peo
ple
All People by Ethnicity
Rate p
er 100,0
00
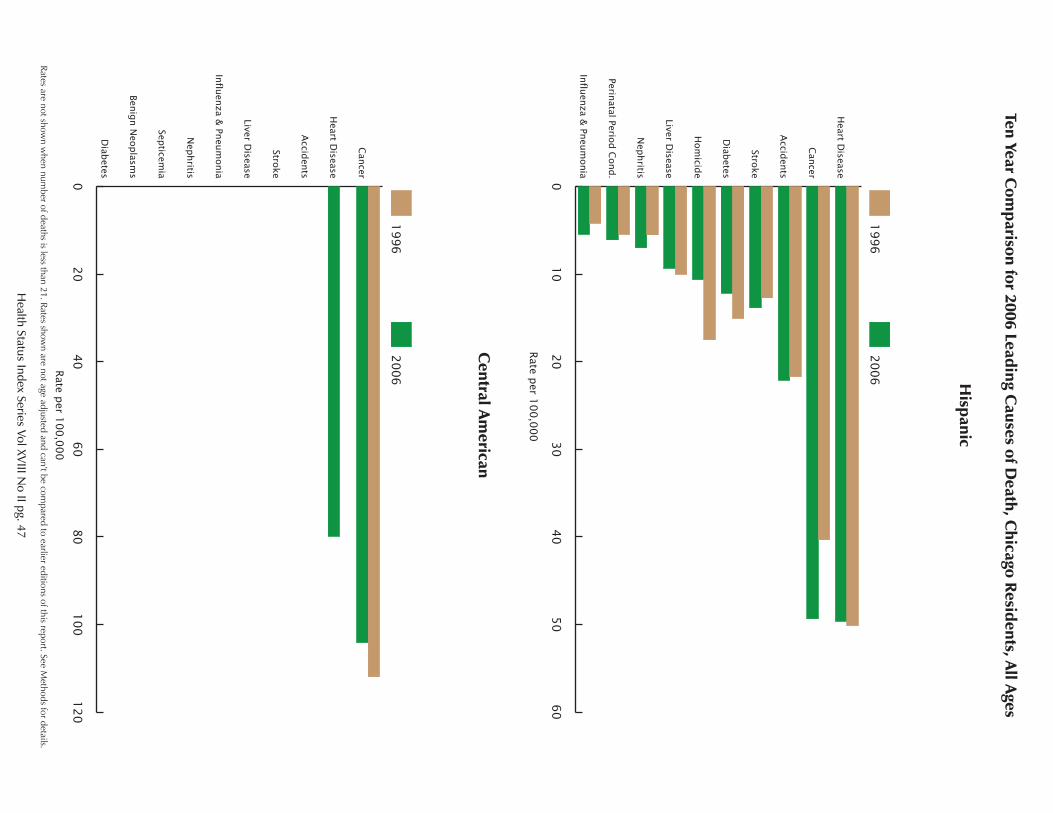
Health Status Index Series Vol XV
III No II pg. 47
Ten Year Com
parison for 2006 Leading Causes of D
eath, Chicago Residents, All Ages
Rates are not shown w
hen number of deaths is less than 21. Rates show
n are not age adjusted and can’t be compared to earlier editions of this report. See M
ethods for details.
010
20
30
40
50
60
2006
1996
Influ
enza &
Pneu
monia
Perinatal Perio
d C
ond.
Nep
hritis
Liver Disease
Hom
icide
Diab
etes
Stroke
Accid
ents
Can
cer
Heart D
isease
Hispanic
020
40
60
80
10
0120
2006
1996
Diab
etes
Ben
ign N
eoplasm
s
Septicem
ia
Nep
hritis
Influ
enza &
Pneu
monia
Liver Disease
Stroke
Accid
ents
Heart D
isease
Can
cer
Central Am
erican
Rate p
er 100,0
00
Rate p
er 100,0
00
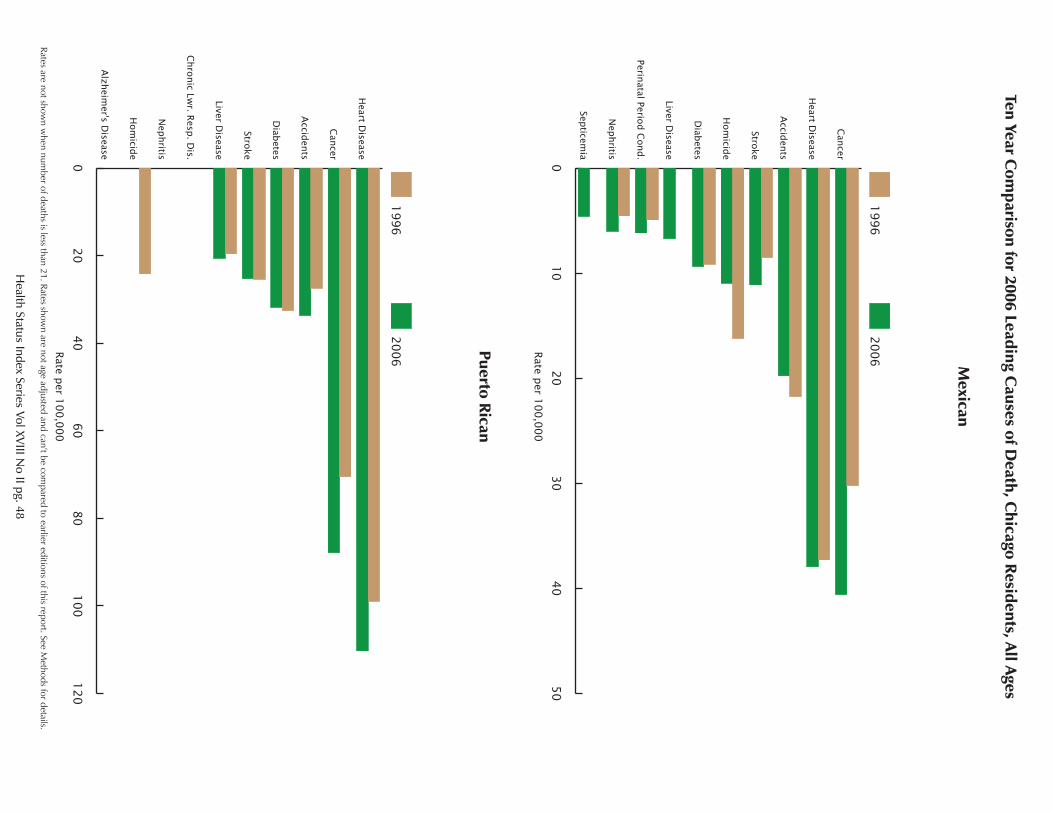
Health Status Index Series Vol XV
III No II pg. 48
Ten Year Com
parison for 2006 Leading Causes of D
eath, Chicago Residents, All Ages
Rates are not shown w
hen number of deaths is less than 21. Rates show
n are not age adjusted and can’t be compared to earlier editions of this report. See M
ethods for details.
010
20
30
40
50
2006
1996
Septicem
ia
Nep
hritis
Perinatal Perio
d C
ond.
Liver Disease
Diab
etes
Hom
icide
Stroke
Accid
ents
Heart D
isease
Can
cer
Mexican
020
40
60
80
10
0120
2006
1996
Alz
heim
er's Disease
Hom
icide
Nep
hritis
Chro
nic Lw
r. Resp
. Dis.
Liver Disease
Stroke
Diab
etes
Accid
ents
Can
cer
Heart D
isease
Puerto Rican
Rate p
er 100,0
00
Rate p
er 100,0
00
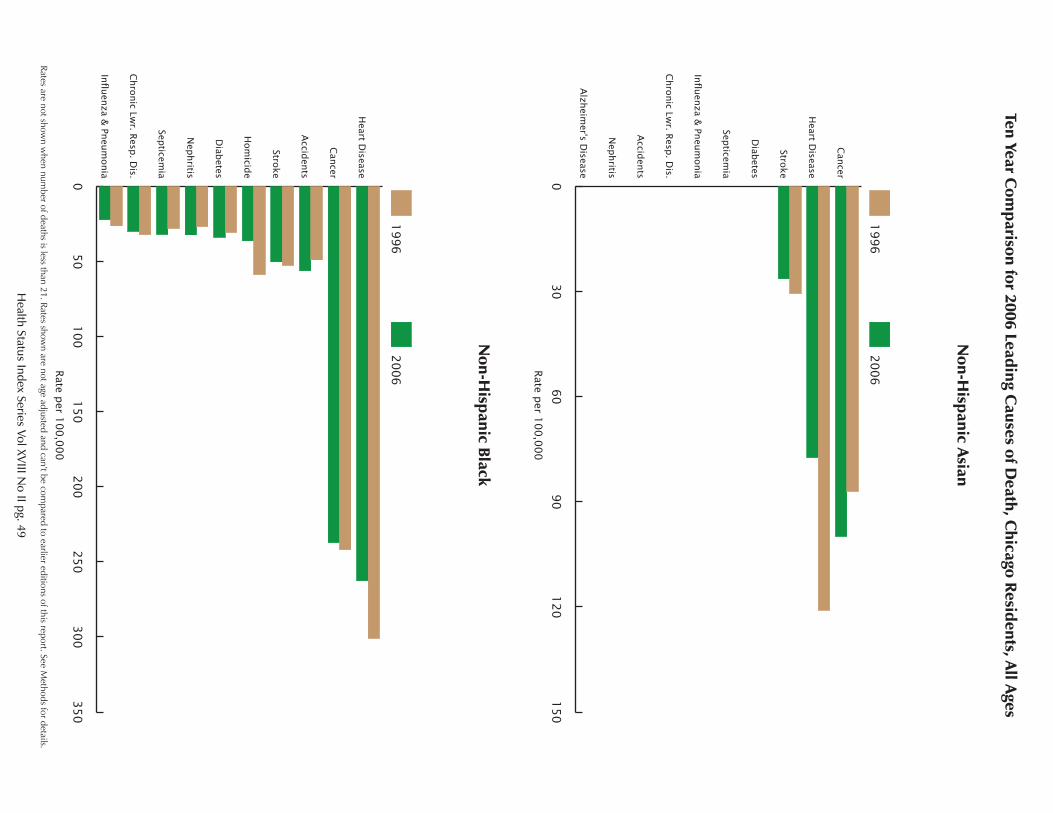
Health Status Index Series Vol XV
III No II pg. 49
Ten Year Com
parison for 2006 Leading Causes of D
eath, Chicago Residents, All Ages
Rates are not shown w
hen number of deaths is less than 21. Rates show
n are not age adjusted and can’t be compared to earlier editions of this report. See M
ethods for details.
030
60
90
120
15
0
2006
1996
Alz
heim
er's Disease
Nep
hritis
Accid
ents
Chro
nic Lw
r. Resp
. Dis.
Influ
enza &
Pneu
monia
Septicem
ia
Diab
etes
Stroke
Heart D
isease
Can
cer
Non-H
ispanic Asian
050
100
150
200
250
300
350
2006
1996
Influ
enza &
Pneu
monia
Chro
nic Lw
r. Resp
. Dis.
Septicem
ia
Nep
hritis
Diab
etes
Hom
icide
Stroke
Accid
ents
Can
cer
Heart D
isease
Non-H
ispanic Black
Rate p
er 100,0
00
Rate p
er 100,0
00
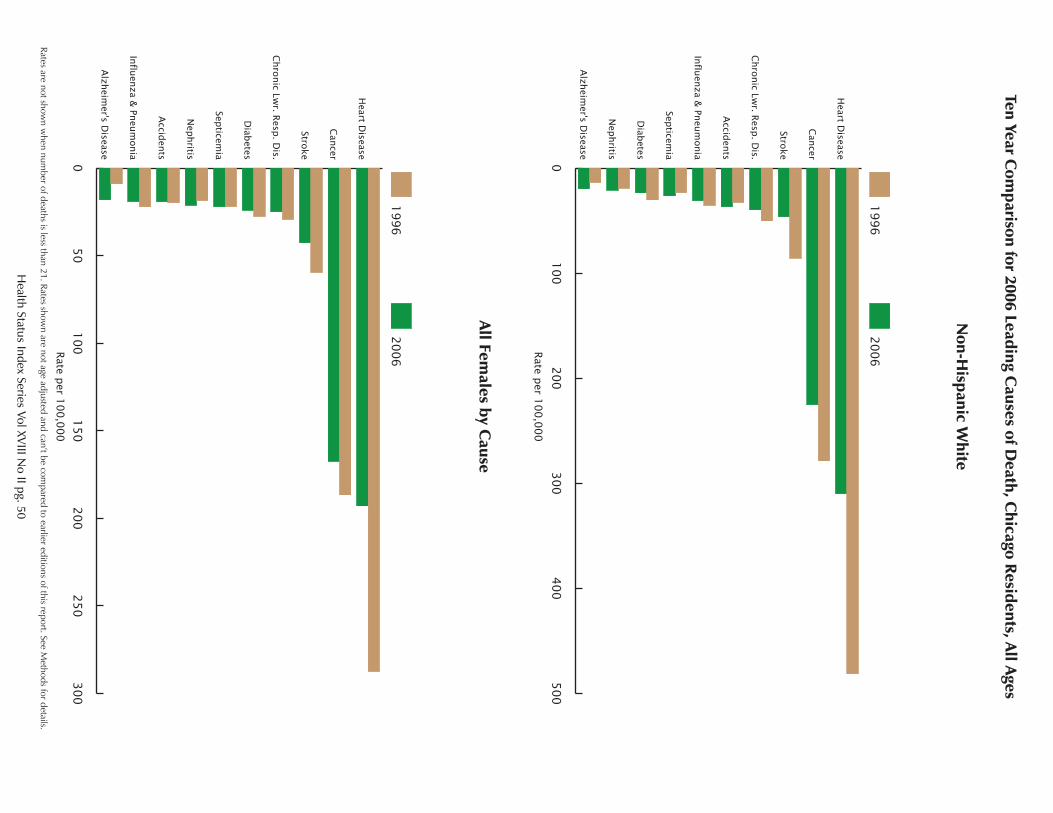
Health Status Index Series Vol XV
III No II pg. 50
Ten Year Com
parison for 2006 Leading Causes of D
eath, Chicago Residents, All Ages
Rates are not shown w
hen number of deaths is less than 21. Rates show
n are not age adjusted and can’t be compared to earlier editions of this report. See M
ethods for details.
0100
200
30
0400
500
2006
1996
Alz
heim
er's Disease
Nep
hritis
Diab
etes
Septicem
ia
Influ
enza &
Pneu
monia
Accid
ents
Chro
nic Lw
r. Resp
. Dis.
Stroke
Can
cer
Heart D
isease
Non-H
ispanic White
Rate p
er 100,0
00
050
100
150
200
25
0300
2006
1996
Alz
heim
er's Disease
Influ
enza &
Pneu
monia
Accid
ents
Nep
hritis
Septicem
ia
Diab
etes
Chro
nic Lw
r. Resp
. Dis.
Stroke
Can
cer
Heart D
isease
All Females by C
ause
Rate p
er 100,0
00
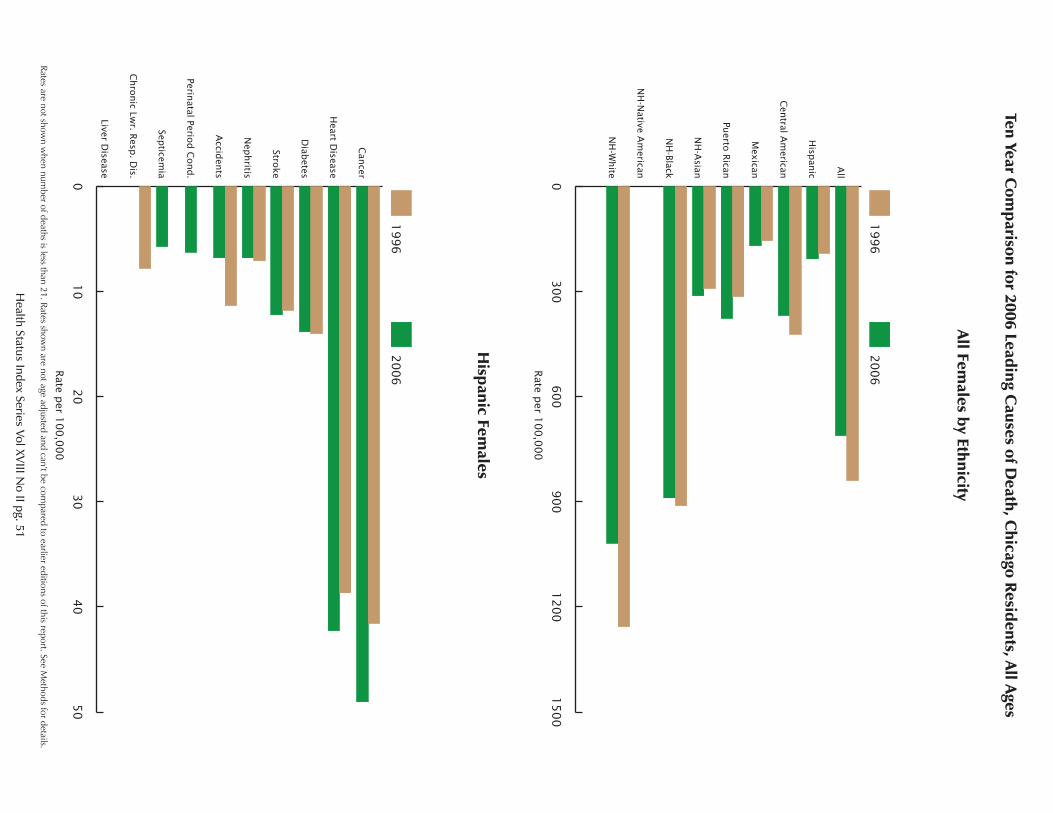
Health Status Index Series Vol XV
III No II pg. 51
Ten Year Com
parison for 2006 Leading Causes of D
eath, Chicago Residents, All Ages
Rates are not shown w
hen number of deaths is less than 21. Rates show
n are not age adjusted and can’t be compared to earlier editions of this report. See M
ethods for details.
0300
600
900
1200
15
00
2006
1996
NH
-White
NH
-Native A
merican
NH
-Black
NH
-Asian
Puerto
Rican
Mex
ican
Cen
tral Am
erican
Hisp
anic
All
All Females by Ethnicity
010
20
30
40
50
2006
1996
Liver Disease
Chro
nic Lw
r. Resp
. Dis.
Septicem
ia
Perinatal Perio
d C
ond.
Accid
ents
Nep
hritis
Stroke
Diab
etes
Heart D
isease
Can
cer
Hispanic Fem
ales
Rate p
er 100,0
00
Rate p
er 100,0
00
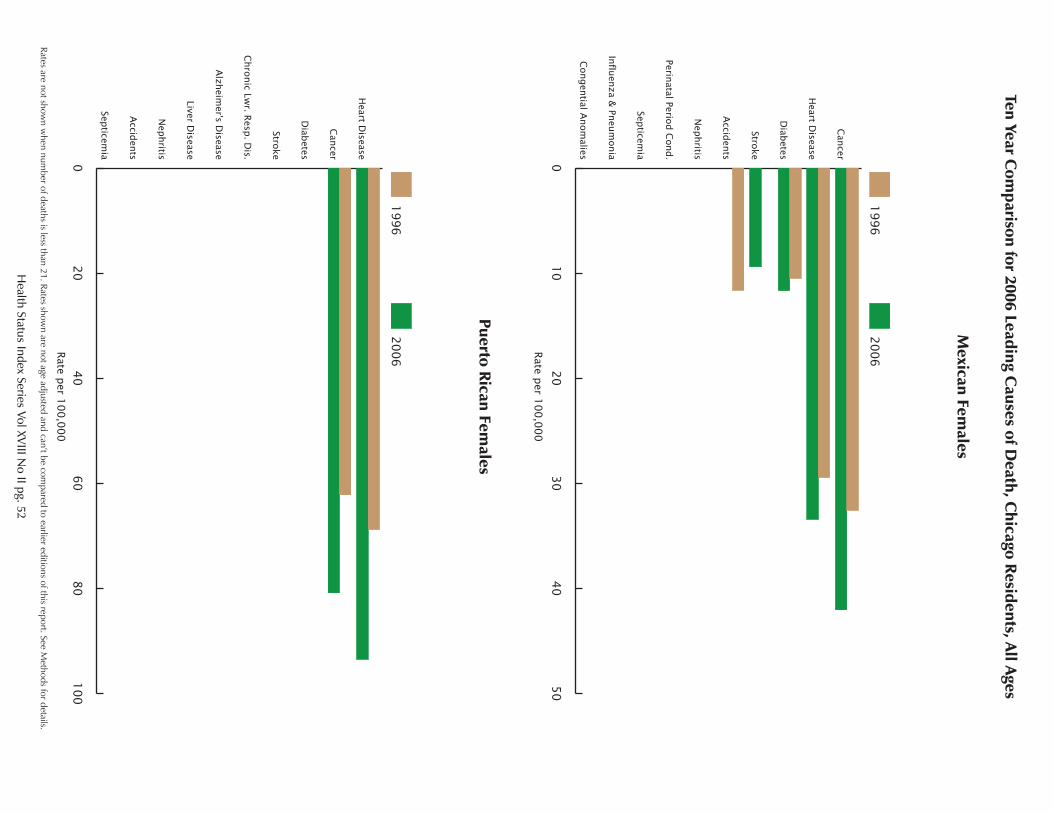
Health Status Index Series Vol XV
III No II pg. 52
Ten Year Com
parison for 2006 Leading Causes of D
eath, Chicago Residents, All Ages
Rates are not shown w
hen number of deaths is less than 21. Rates show
n are not age adjusted and can’t be compared to earlier editions of this report. See M
ethods for details.
010
20
30
40
50
2006
1996
Congen
tial Anom
alies
Influ
enza &
Pneu
monia
Septicem
ia
Perinatal Perio
d C
ond.
Nep
hritis
Accid
ents
Stroke
Diab
etes
Heart D
isease
Can
cer
Mexican Fem
ales
020
40
60
80
10
0
2006
1996
Septicem
ia
Accid
ents
Nep
hritis
Liver Disease
Alz
heim
er's Disease
Chro
nic Lw
r. Resp
. Dis.
Stroke
Diab
etes
Can
cer
Heart D
isease
Puerto Rican Females
Rate p
er 100,0
00
Rate p
er 100,0
00
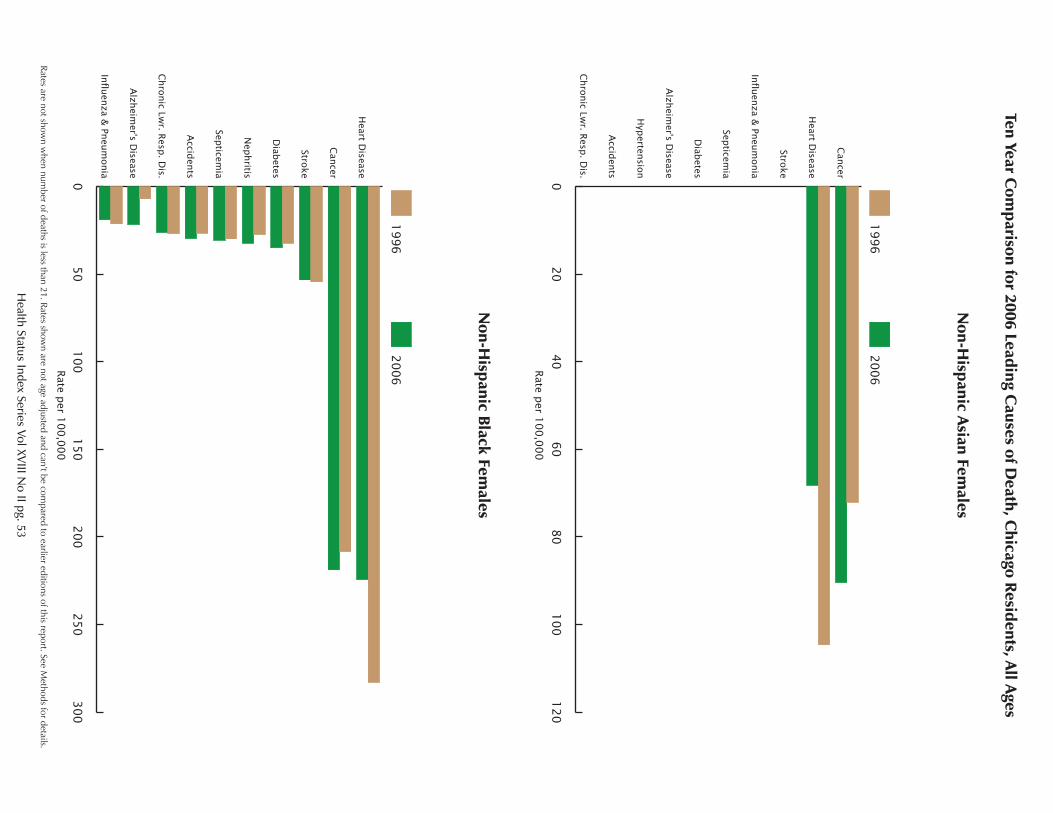
Ten Year Com
parison for 2006 Leading Causes of D
eath, Chicago Residents, All Ages
Health Status Index Series Vol XV
III No II pg. 53
Rates are not shown w
hen number of deaths is less than 21. Rates show
n are not age adjusted and can’t be compared to earlier editions of this report. See M
ethods for details.
020
40
60
80
10
0120
2006
1996
Chro
nic Lw
r. Resp
. Dis.
Accid
ents
Hyp
ertensio
n
Alz
heim
er's Disease
Diab
etes
Septicem
ia
Influ
enza &
Pneu
monia
Stroke
Heart D
isease
Can
cer
Non-H
ispanic Asian Females
050
100
150
200
25
0300
2006
1996
Influ
enza &
Pneu
monia
Alz
heim
er's Disease
Chro
nic Lw
r. Resp
. Dis.
Accid
ents
Septicem
ia
Nep
hritis
Diab
etes
Stroke
Can
cer
Heart D
isease
Non-H
ispanic Black Females
Rate p
er 100,0
00
Rate p
er 100,0
00
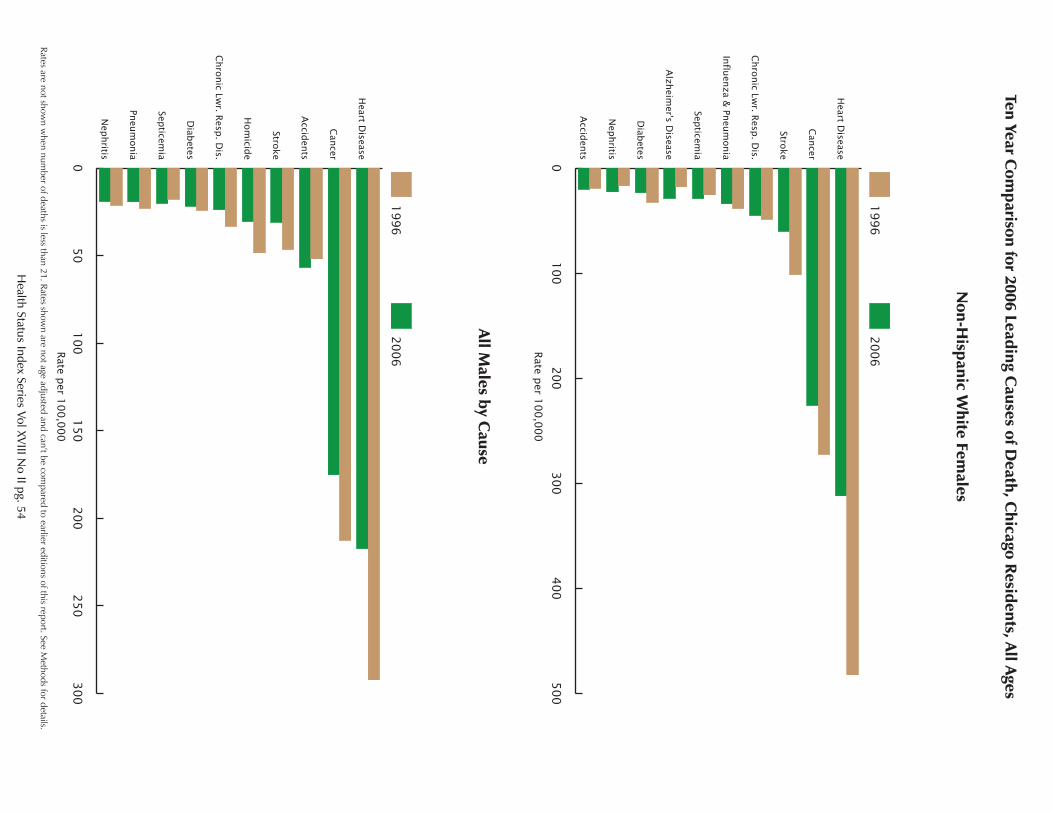
Ten Year Com
parison for 2006 Leading Causes of D
eath, Chicago Residents, All Ages
Health Status Index Series Vol XV
III No II pg. 54
Rates are not shown w
hen number of deaths is less than 21. Rates show
n are not age adjusted and can’t be compared to earlier editions of this report. See M
ethods for details.
0100
200
30
0400
500
2006
1996
Accid
ents
Nep
hritis
Diab
etes
Alz
heim
er's Disease
Septicem
ia
Influ
enza &
Pneu
monia
Chro
nic Lw
r. Resp
. Dis.
Stroke
Can
cer
Heart D
isease
Non-H
ispanic White Fem
ales
050
100
150
200
25
0300
2006
1996
Nep
hritis
Pneu
monia
Septicem
ia
Diab
etes
Chro
nic Lw
r. Resp
. Dis.
Hom
icide
Stroke
Accid
ents
Can
cer
Heart D
isease
All Males by C
ause
Rate p
er 100,0
00
Rate p
er 100,0
00
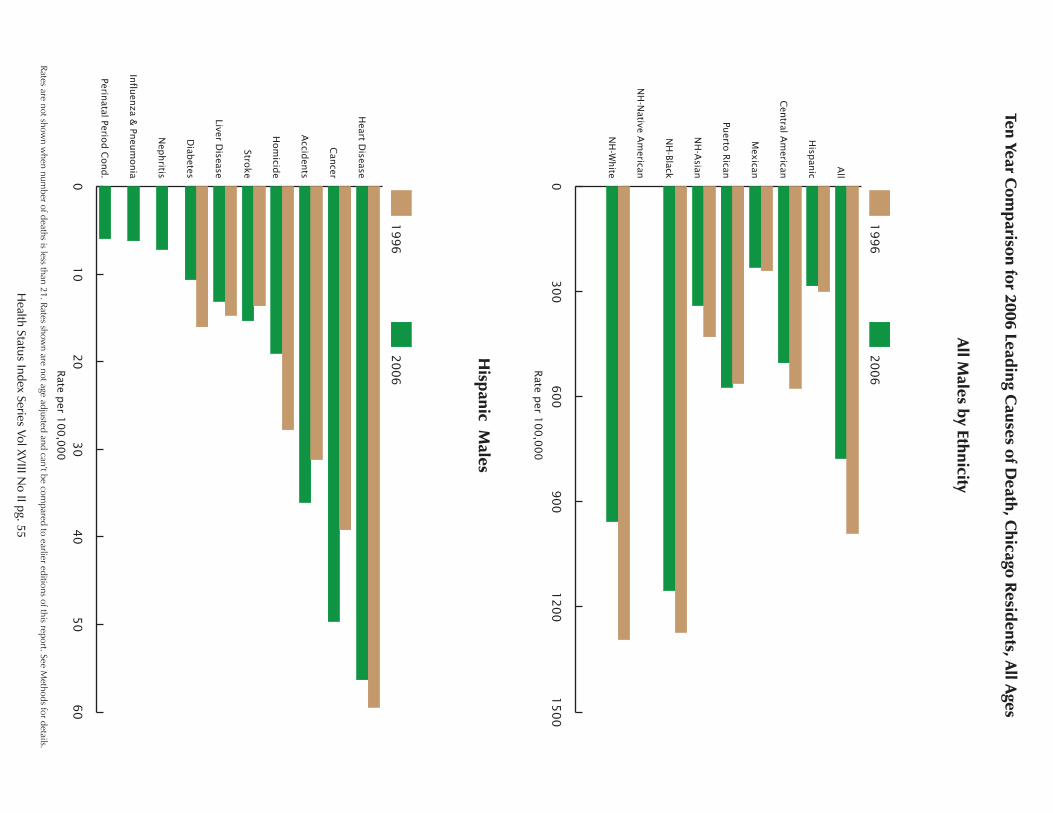
Ten Year Com
parison for 2006 Leading Causes of D
eath, Chicago Residents, All Ages
Health Status Index Series Vol XV
III No II pg. 55
Rates are not shown w
hen number of deaths is less than 21. Rates show
n are not age adjusted and can’t be compared to earlier editions of this report. See M
ethods for details.
0300
600
900
1200
15
00
2006
1996
NH
-White
NH
-Native A
merican
NH
-Black
NH
-Asian
Puerto
Rican
Mex
ican
Cen
tral Am
erican
Hisp
anic
All
010
20
30
40
50
60
2006
1996
Perinatal Perio
d C
ond.
Influ
enza &
Pneu
monia
Nep
hritis
Diab
etes
Liver Disease
Stroke
Hom
icide
Accid
ents
Can
cer
Heart D
isease
All Males by Ethnicity
Hispanic M
ales
Rate p
er 100,0
00
Rate p
er 100,0
00
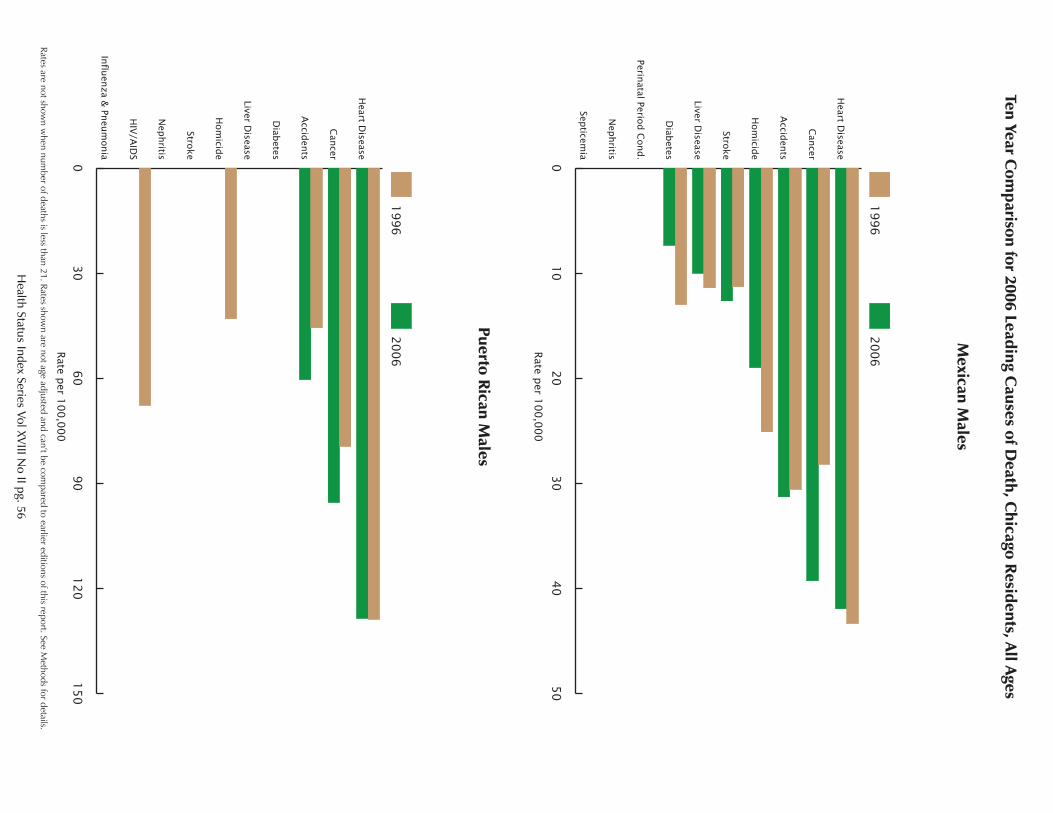
Ten Year Com
parison for 2006 Leading Causes of D
eath, Chicago Residents, All Ages
Health Status Index Series Vol XV
III No II pg. 56
Rates are not shown w
hen number of deaths is less than 21. Rates show
n are not age adjusted and can’t be compared to earlier editions of this report. See M
ethods for details.
010
20
30
40
50
2006
1996
Septicem
ia
Nep
hritis
Perinatal Perio
d C
ond.
Diab
etes
Liver Disease
Stroke
Hom
icide
Accid
ents
Can
cer
Heart D
isease
Mexican M
ales
030
60
90
120
15
0
2006
1996
Influ
enza &
Pneu
monia
HIV
/AID
S
Nep
hritis
Stroke
Hom
icide
Liver Disease
Diab
etes
Accid
ents
Can
cer
Heart D
isease
Puerto Rican Males
Rate p
er 100,0
00
Rate p
er 100,0
00
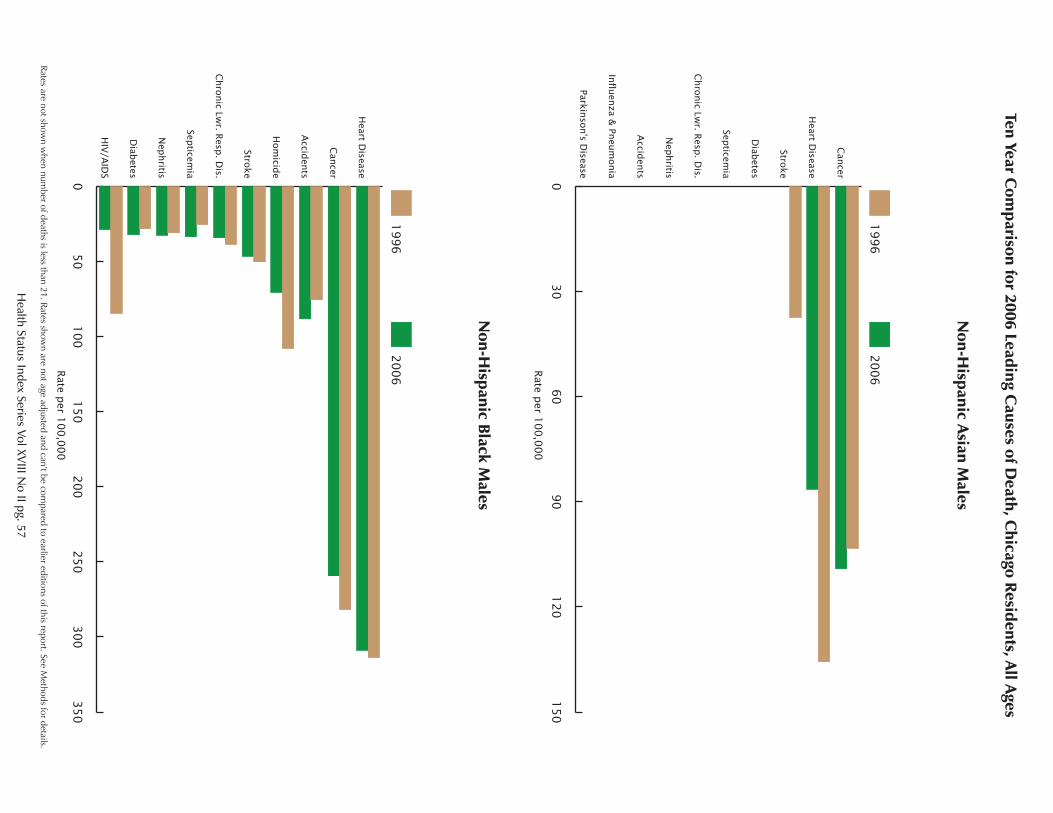
Ten Year Com
parison for 2006 Leading Causes of D
eath, Chicago Residents, All Ages
Health Status Index Series Vol XV
III No II pg. 57
Rates are not shown w
hen number of deaths is less than 21. Rates show
n are not age adjusted and can’t be compared to earlier editions of this report. See M
ethods for details.
030
60
90
120
15
0
2006
1996
Parkin
son's D
isease
Influ
enza &
Pneu
monia
Accid
ents
Nep
hritis
Chro
nic Lw
r. Resp
. Dis.
Septicem
ia
Diab
etes
Stroke
Heart D
isease
Can
cer
Non-H
ispanic Asian Males
050
100
150
200
250
300
350
2006
1996
HIV
/AID
S
Diab
etes
Nep
hritis
Septicem
ia
Chro
nic Lw
r. Resp
. Dis.
Stroke
Hom
icide
Accid
ents
Can
cer
Heart D
isease
Non-H
ispanic Black Males
Rate p
er 100,0
00
Rate p
er 100,0
00
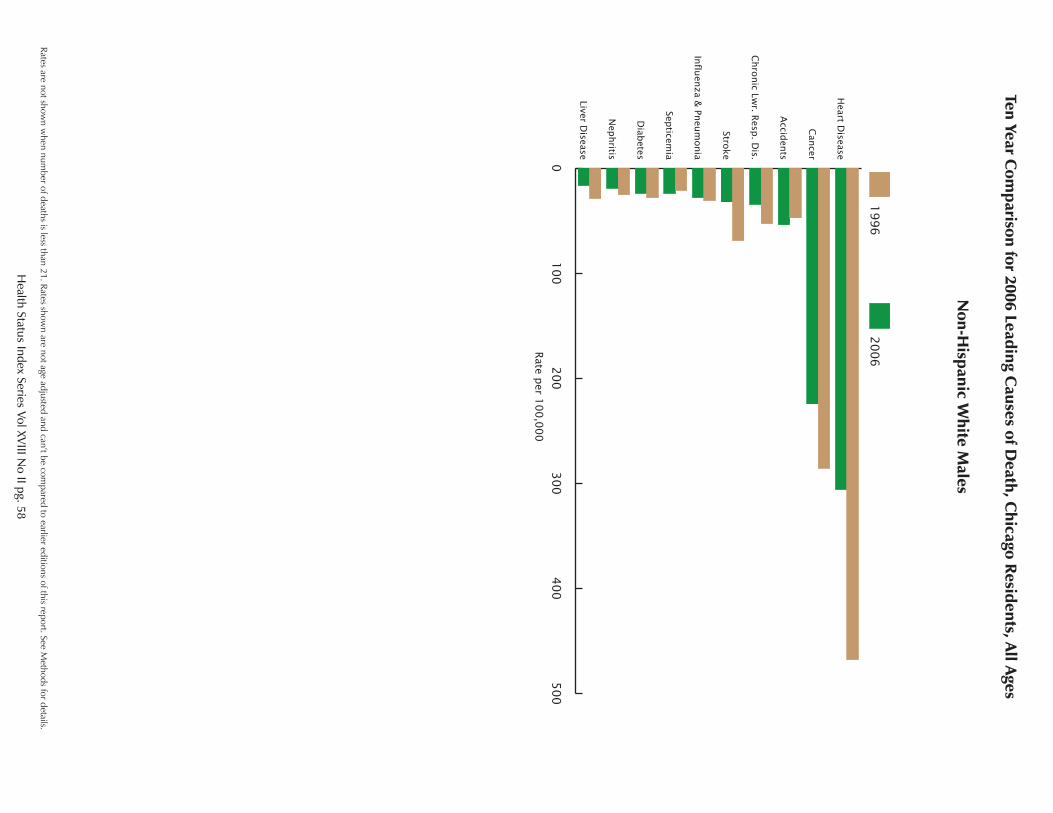
Ten Year Com
parison for 2006 Leading Causes of D
eath, Chicago Residents, All Ages
Health Status Index Series Vol XV
III No II pg. 58
Rates are not shown w
hen number of deaths is less than 21. Rates show
n are not age adjusted and can’t be compared to earlier editions of this report. See M
ethods for details.
0100
200
30
0400
500
2006
1996
Liver Disease
Nep
hritis
Diab
etes
Septicem
ia
Influ
enza &
Pneu
monia
Stroke
Chro
nic Lw
r. Resp
. Dis.
Accid
ents
Can
cer
Heart D
isease
Non-H
ispanic White M
ales
Rate p
er 100,0
00
APPENDIX
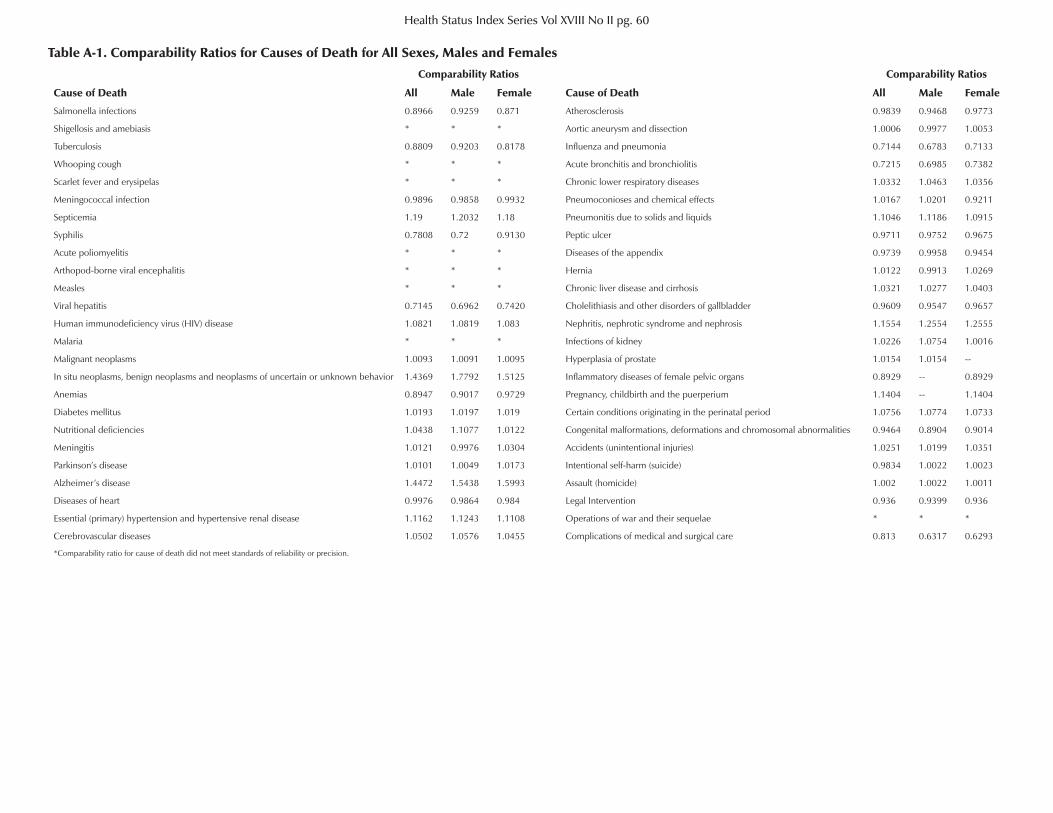
Table A-1. Comparability Ratios for Causes of Death for All Sexes, Males and FemalesComparability Ratios Comparability Ratios
Cause of Death All Male Female Cause of Death All Male Female
Salmonella infections 0.8966 0.9259 0.871 Atherosclerosis 0.9839 0.9468 0.9773
Shigellosis and amebiasis * * * Aortic aneurysm and dissection 1.0006 0.9977 1.0053
Tuberculosis 0.8809 0.9203 0.8178 Influenza and pneumonia 0.7144 0.6783 0.7133
Whooping cough * * * Acute bronchitis and bronchiolitis 0.7215 0.6985 0.7382
Scarlet fever and erysipelas * * * Chronic lower respiratory diseases 1.0332 1.0463 1.0356
Meningococcal infection 0.9896 0.9858 0.9932 Pneumoconioses and chemical effects 1.0167 1.0201 0.9211
Septicemia 1.19 1.2032 1.18 Pneumonitis due to solids and liquids 1.1046 1.1186 1.0915
Syphilis 0.7808 0.72 0.9130 Peptic ulcer 0.9711 0.9752 0.9675
Acute poliomyelitis * * * Diseases of the appendix 0.9739 0.9958 0.9454
Arthopod-borne viral encephalitis * * * Hernia 1.0122 0.9913 1.0269
Measles * * * Chronic liver disease and cirrhosis 1.0321 1.0277 1.0403
Viral hepatitis 0.7145 0.6962 0.7420 Cholelithiasis and other disorders of gallbladder 0.9609 0.9547 0.9657
Human immunodeficiency virus (HIV) disease 1.0821 1.0819 1.083 Nephritis, nephrotic syndrome and nephrosis 1.1554 1.2554 1.2555
Malaria * * * Infections of kidney 1.0226 1.0754 1.0016
Malignant neoplasms 1.0093 1.0091 1.0095 Hyperplasia of prostate 1.0154 1.0154 --
In situ neoplasms, benign neoplasms and neoplasms of uncertain or unknown behavior 1.4369 1.7792 1.5125 Inflammatory diseases of female pelvic organs 0.8929 -- 0.8929
Anemias 0.8947 0.9017 0.9729 Pregnancy, childbirth and the puerperium 1.1404 -- 1.1404
Diabetes mellitus 1.0193 1.0197 1.019 Certain conditions originating in the perinatal period 1.0756 1.0774 1.0733
Nutritional deficiencies 1.0438 1.1077 1.0122 Congenital malformations, deformations and chromosomal abnormalities 0.9464 0.8904 0.9014
Meningitis 1.0121 0.9976 1.0304 Accidents (unintentional injuries) 1.0251 1.0199 1.0351
Parkinson’s disease 1.0101 1.0049 1.0173 Intentional self-harm (suicide) 0.9834 1.0022 1.0023
Alzheimer’s disease 1.4472 1.5438 1.5993 Assault (homicide) 1.002 1.0022 1.0011
Diseases of heart 0.9976 0.9864 0.984 Legal Intervention 0.936 0.9399 0.936
Essential (primary) hypertension and hypertensive renal disease 1.1162 1.1243 1.1108 Operations of war and their sequelae * * *
Cerebrovascular diseases 1.0502 1.0576 1.0455 Complications of medical and surgical care 0.813 0.6317 0.6293
*Comparability ratio for cause of death did not meet standards of reliability or precision.
Health Status Index Series Vol XVIII No II pg. 60
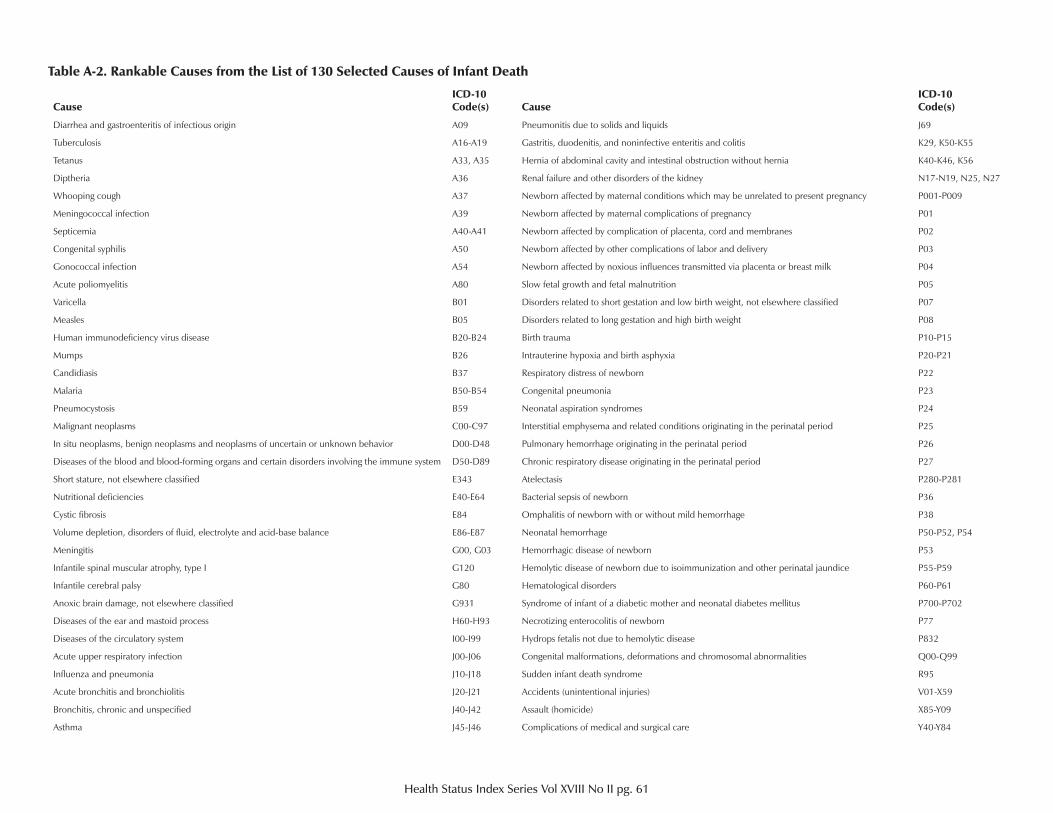
CauseICD-10Code(s) Cause
ICD-10Code(s)
Diarrhea and gastroenteritis of infectious origin A09 Pneumonitis due to solids and liquids J69
Tuberculosis A16-A19 Gastritis, duodenitis, and noninfective enteritis and colitis K29, K50-K55
Tetanus A33, A35 Hernia of abdominal cavity and intestinal obstruction without hernia K40-K46, K56
Diptheria A36 Renal failure and other disorders of the kidney N17-N19, N25, N27
Whooping cough A37 Newborn affected by maternal conditions which may be unrelated to present pregnancy P001-P009
Meningococcal infection A39 Newborn affected by maternal complications of pregnancy P01
Septicemia A40-A41 Newborn affected by complication of placenta, cord and membranes P02
Congenital syphilis A50 Newborn affected by other complications of labor and delivery P03
Gonococcal infection A54 Newborn affected by noxious influences transmitted via placenta or breast milk P04
Acute poliomyelitis A80 Slow fetal growth and fetal malnutrition P05
Varicella B01 Disorders related to short gestation and low birth weight, not elsewhere classified P07
Measles B05 Disorders related to long gestation and high birth weight P08
Human immunodeficiency virus disease B20-B24 Birth trauma P10-P15
Mumps B26 Intrauterine hypoxia and birth asphyxia P20-P21
Candidiasis B37 Respiratory distress of newborn P22
Malaria B50-B54 Congenital pneumonia P23
Pneumocystosis B59 Neonatal aspiration syndromes P24
Malignant neoplasms C00-C97 Interstitial emphysema and related conditions originating in the perinatal period P25
In situ neoplasms, benign neoplasms and neoplasms of uncertain or unknown behavior D00-D48 Pulmonary hemorrhage originating in the perinatal period P26
Diseases of the blood and blood-forming organs and certain disorders involving the immune system D50-D89 Chronic respiratory disease originating in the perinatal period P27
Short stature, not elsewhere classified E343 Atelectasis P280-P281
Nutritional deficiencies E40-E64 Bacterial sepsis of newborn P36
Cystic fibrosis E84 Omphalitis of newborn with or without mild hemorrhage P38
Volume depletion, disorders of fluid, electrolyte and acid-base balance E86-E87 Neonatal hemorrhage P50-P52, P54
Meningitis G00, G03 Hemorrhagic disease of newborn P53
Infantile spinal muscular atrophy, type I G120 Hemolytic disease of newborn due to isoimmunization and other perinatal jaundice P55-P59
Infantile cerebral palsy G80 Hematological disorders P60-P61
Anoxic brain damage, not elsewhere classified G931 Syndrome of infant of a diabetic mother and neonatal diabetes mellitus P700-P702
Diseases of the ear and mastoid process H60-H93 Necrotizing enterocolitis of newborn P77
Diseases of the circulatory system I00-I99 Hydrops fetalis not due to hemolytic disease P832
Acute upper respiratory infection J00-J06 Congenital malformations, deformations and chromosomal abnormalities Q00-Q99
Influenza and pneumonia J10-J18 Sudden infant death syndrome R95
Acute bronchitis and bronchiolitis J20-J21 Accidents (unintentional injuries) V01-X59
Bronchitis, chronic and unspecified J40-J42 Assault (homicide) X85-Y09
Asthma J45-J46 Complications of medical and surgical care Y40-Y84
Table A-2. Rankable Causes from the List of 130 Selected Causes of Infant Death
Health Status Index Series Vol XVIII No II pg. 61
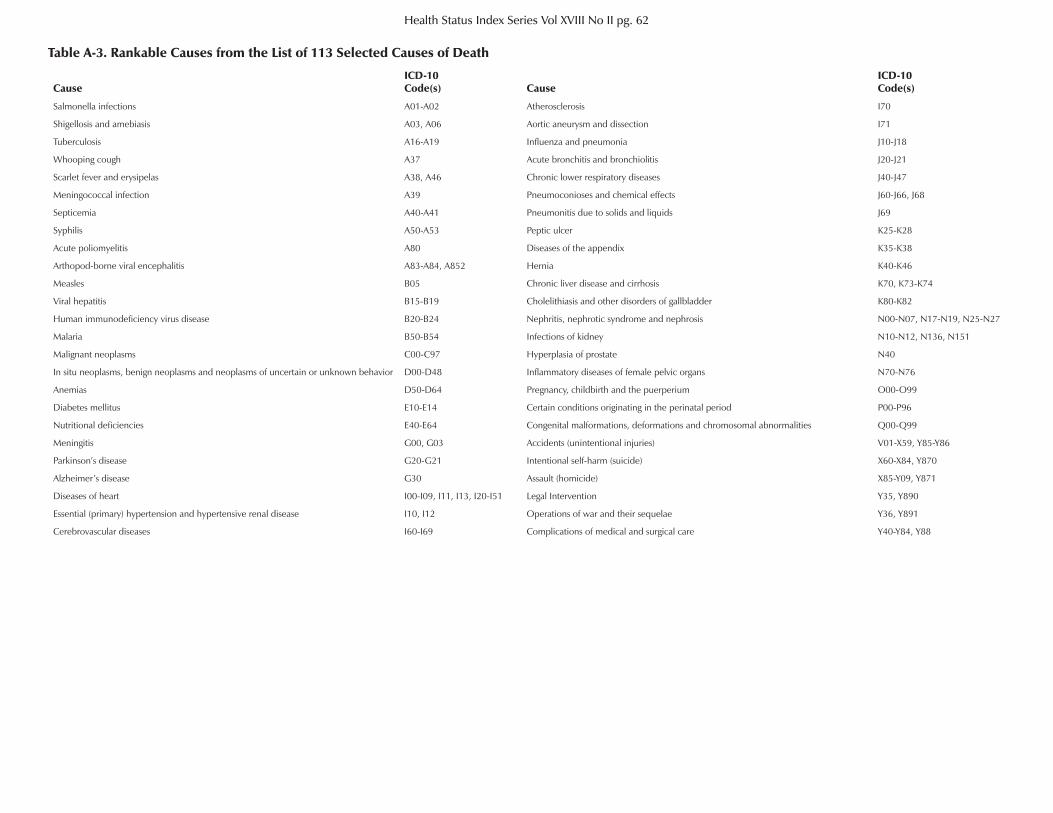
CauseICD-10Code(s) Cause
ICD-10Code(s)
Salmonella infections A01-A02 Atherosclerosis I70
Shigellosis and amebiasis A03, A06 Aortic aneurysm and dissection I71
Tuberculosis A16-A19 Influenza and pneumonia J10-J18
Whooping cough A37 Acute bronchitis and bronchiolitis J20-J21
Scarlet fever and erysipelas A38, A46 Chronic lower respiratory diseases J40-J47
Meningococcal infection A39 Pneumoconioses and chemical effects J60-J66, J68
Septicemia A40-A41 Pneumonitis due to solids and liquids J69
Syphilis A50-A53 Peptic ulcer K25-K28
Acute poliomyelitis A80 Diseases of the appendix K35-K38
Arthopod-borne viral encephalitis A83-A84, A852 Hernia K40-K46
Measles B05 Chronic liver disease and cirrhosis K70, K73-K74
Viral hepatitis B15-B19 Cholelithiasis and other disorders of gallbladder K80-K82
Human immunodeficiency virus disease B20-B24 Nephritis, nephrotic syndrome and nephrosis N00-N07, N17-N19, N25-N27
Malaria B50-B54 Infections of kidney N10-N12, N136, N151
Malignant neoplasms C00-C97 Hyperplasia of prostate N40
In situ neoplasms, benign neoplasms and neoplasms of uncertain or unknown behavior D00-D48 Inflammatory diseases of female pelvic organs N70-N76
Anemias D50-D64 Pregnancy, childbirth and the puerperium O00-O99
Diabetes mellitus E10-E14 Certain conditions originating in the perinatal period P00-P96
Nutritional deficiencies E40-E64 Congenital malformations, deformations and chromosomal abnormalities Q00-Q99
Meningitis G00, G03 Accidents (unintentional injuries) V01-X59, Y85-Y86
Parkinson’s disease G20-G21 Intentional self-harm (suicide) X60-X84, Y870
Alzheimer’s disease G30 Assault (homicide) X85-Y09, Y871
Diseases of heart I00-I09, I11, I13, I20-I51 Legal Intervention Y35, Y890
Essential (primary) hypertension and hypertensive renal disease I10, I12 Operations of war and their sequelae Y36, Y891
Cerebrovascular diseases I60-I69 Complications of medical and surgical care Y40-Y84, Y88
Table A-3. Rankable Causes from the List of 113 Selected Causes of Death
Health Status Index Series Vol XVIII No II pg. 62


City of ChicagoRichard M. Daley
Mayor