Embed Size (px)
Citation preview

4 December 2013
Leadership SeriesHow to Effectively Use Market Research tomake your Branded Content more Effective

The graveyard of failed BEprograms is littered with greatideas, even great executions.
“”Ogilvy Entertainment: Making magic, using logic. BEAM

The more I practice, the luckier I get.“ ”Arnold Palmer
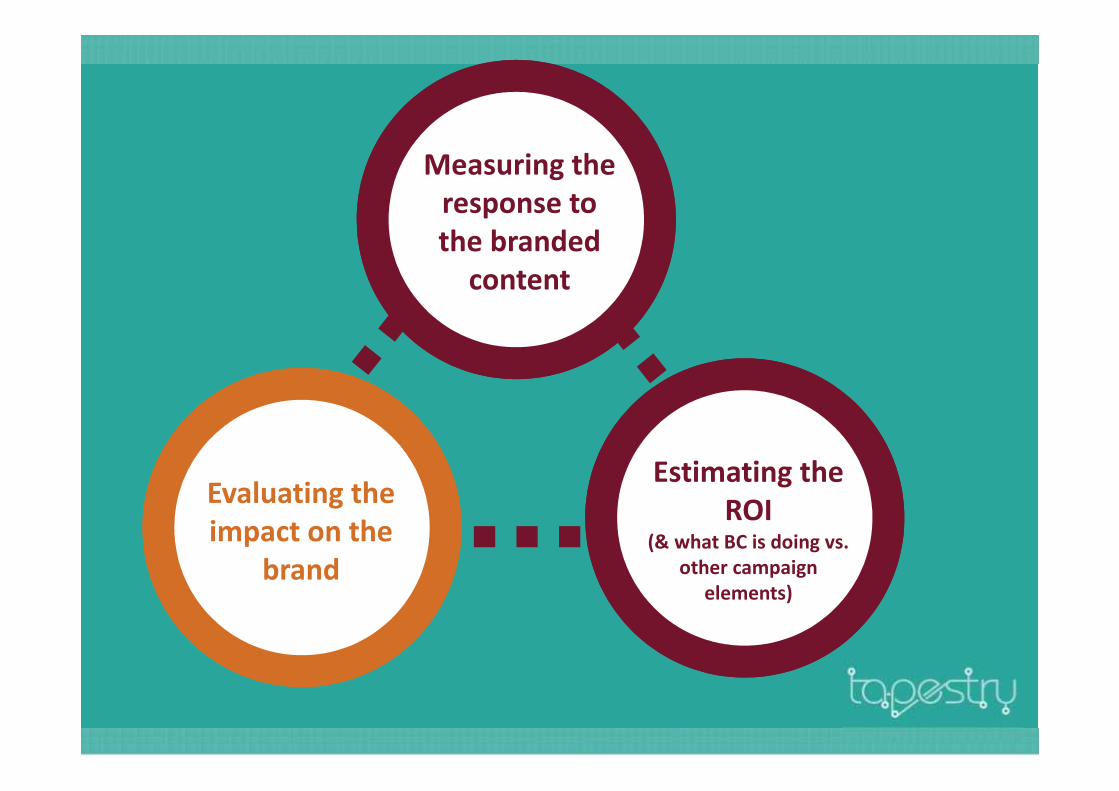
Estimating theROI
(& what BC is doing vs.other campaign
elements)
Measuring theresponse tothe branded
content
Evaluating theimpact on the
brand

Conscious response is ok, but limited.- Consumers tend to post-rationalise- They can’t articulate how they’re feeling
Measuring theresponse tothe branded
content

Measuring the unconscious response
Brain scansExpensiveDifficult tointerpret
Facial CodingSinglemeasurement ofengagementMeasures thenature of theresponseSimple toimplement andinterpret
BiometricsSingle measure ofengagementEasier to interpretNo measure of thenature of theresponseNot cheap

Be Emotive
2005 Luca Bruno, 2013 Michael Sohn - AP

Creative Media ROI+ =
Challenge
? ✓ !

Source: Gunn Report 2000-2008, IPA
Les Binet & Peter Field,Marketing in the Era of
Accountability, 2007
Emotional advertisingcampaigns are moreeffective and more
profitable than rationalcampaigns - even in
'rational' categories…
“
”
11xmore efficient
in market sharegrowth
The Gunn Report

Emotions?

1800s
DarwinThe Expressionof Emotions in
Man andAnimals

1960s
!
EkmanFacial Action
Coding System(FACS)

2010s1800s 1960s
CodingAutomated
FacialCoding
Emotions

Demo

Cannes Study
11kpeople
75%prediction
accuracy forshortlists
Entered 96
Shortlisted 72
Bronze 24
Gold 30
Silver 24
246videos tested
35k+viewings

Grow the trend
0.14
0.13
0.12
0.11
0.10
0.09
0.08
0.0 0.2 0.4 0.6 0.8 1.0
Bronze/SilverGold
Shortlisted
Nothing
Relative time
Happy aggregated trendlines
Steeper slope=
Better outcome

Value
What kind ofemotionsdoes your
video spark?
How differentdemographics
react to thecontent?
How does itcompare to closecompetitors and
industry?

15” to 5’content length
20+categories
EmotionalImpact
1,000+videos tested30+
countries

EngagementConnect via
emotions
AttractionHook in 8seconds
RetentionKeep theaudience
ImpactKahneman’s
Peak-End
Successful video components

Case study


Confusion isdominant
emotion for first45 secs, lowering
attraction
Happinessspikes anddominatesthroughout
Happiness drops,but video ends
with peak, leavingviewers withstrong impact
Minimalnegativeemotions
throughout

This video has very goodoverall performance.
Better than 95% of videos.
So Real it’s ScaryEmotional
Impact

Male79.5%
Female79.4%
EmotionalImpact
Age
Income
CountriesCompetitor
In-depth analysis

Conclusions
Confusion in the first45 seconds lowersattraction. Happinessspikes and dominatesthroughout.
Top5%
Compared withvideo A, LG leavesviewers with ahigher impact.
A B
• 18-34• Single, divorced,
separated.• Low or very low
income.
~

Get attention with a strong spike ofsurprise and happiness in the first eightseconds. Avoid confusion.
Prevent drops and endwith a spike for thestrongest impact.
Ending with an engagementspike benefits the syndicationstrategy of publishers withhigher play-to-end rates.
Syndicate to relevantaudiences with thehighest engagement.
Learning
€Activate the videoacross UK and USaudiences

http://beon.aolnetworks.com/en/advertisers/case-studies/technology

Emotional
CampaignData SetCampaignData Set

EmotionalEngagement
Audience Brand LiftResearch
CampaignData
CampaignData Set

Revolutionising measurement
The most advanced campaignreporting tool, utilising industrystandard brand lift measurement,audience profiling, engagementand emotive analysis to provideROI visibility.
Insights

Consumers love emotional content...
3xhigher averageview to end %
8xhigher click
through rate
20xbetter in
converting viewsinto social
actions
100xQuicker inattractingviewers
Source: Be On research

8ppincrease in BrandRecommendation
7ppincrease in
Purchase Intent
14ppincrease in Brand
Favourability
...and it also creates ROI

CreativeAttractionRetention
EngagementImpact
MediaSyndication
OptimisationSharing
ROIBrand Favourability
Purchase IntentBrand Awareness
+ =
Create Syndicate Measure
Impact Model
Estimating theROI
(& what BC is doing vs.other campaign
elements)
Measuring theresponse tothe branded
content
Evaluating theimpact on the
brand

11.5m views on YouTube
#1 tweeted about video inFrance (a tweet a second)
2000 facebook fans in 2 days
Non-survey based approach
Perrier’s “Le Club”

100,000 people interacted with Persil on the forum
25,000 people aged 18-35 bought tickets to the event
9% uplift in brand awareness among target audience*
8% increase in brand usage*
*Source: TNS Russia
Quasi-survey based approach

Survey based approach
Exposedto branded
contentN=200
NotExposed
N=200
Audience

NotExposed
Awareness Perceptions Purchase intent
Advocacy Affinity Associations(more metricsthe better)
Audience
Metrics
Exposedto branded
contentN=200
Survey based approach

NotExposed
Awareness Perceptions Purchase intent
Advocacy Affinity Associations
45%
22%
(more metricsthe better)
Audience
Metrics
The content has led to a 23%points increase in brand affinityAnalysis
Exposedto branded
contentN=200
Survey based approach

Aired on UKTV at a time when paid-for references for productsand services were NOT permitted in TV shows in the UK
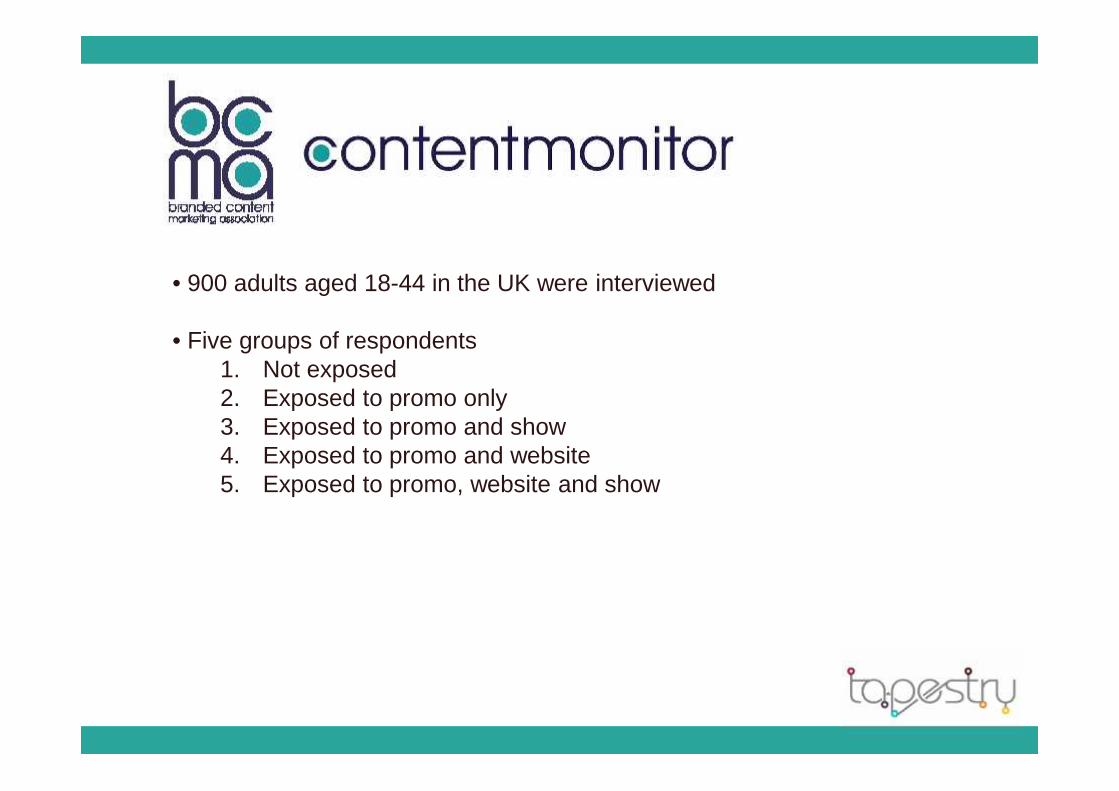
• 900 adults aged 18-44 in the UK were interviewed
• Five groups of respondents1. Not exposed2. Exposed to promo only3. Exposed to promo and show4. Exposed to promo and website5. Exposed to promo, website and show

Impact #1: Unprompted awareness of Prius increased
24%
37%
Not Exposedto Show
Exposed toShow
% mentioning ‘Toyota Prius’ or ‘Prius’ (unprompted)
+13% points increaseas a result of the show
Exposed
NotExposed

Impact #2: More people would consider buying a Toyota
32%
43%
Not Exposedto Show
Exposed toShow
% considering Toyota for next car purchase
+11% points increaseas a result of the show
Exposed
NotExposed

Impact #3: The show strengthened perceptions of Toyota
+12% Leads the way in tackling environmental issues
+10% Safe
+9% Suitable for families
+8% Practical
+7% Honest
+7% Constantly innovating
+5% Warm / friendly

We can also analyse what each campaign element delivered…
13%
44% 39%62%
Promo Only Promo & Show Promo & Website Promo, Website &Show
% correctly identifying Toyota/Prius as the sponsor of Carpool once the nameof the show has been revealed
The showadded+31%points vs.
promos alone

Estimating theROI
(& what BC is doing vs.other campaign
elements)
Measuring theresponse tothe branded
content
Evaluating theimpact on the
brand

Pointlogic PPT Template v 1.0
Pointlogic Valuepoint - Respondent level modelling
ROI of branded content in a complex world

What does Return on Investment (ROI) mean?
ROI All the things a brand does
- Ads- Sponsorships- Branded content- Product experience

Investment types

What does Return on Investment (ROI) mean?
ROI
All the things that happen- Sales- Brand health

The challenge

What we would like to know?
Did the tacticalcampaigns alsomove brand health?
Was my TV spendtoo high or too low ?
Which KPIs weremoved the most?

54
Our approach in 4 steps
1
2
3
Measure their brand attitudes and behaviours
Understand what marketing consumers have been exposed to
Determine the links between marketing and behaviour
4 Feedback into future planning

Understanding Communication ROITraditional methods
Aggregate modelling - Look at each week and work with total spend, total TVexposures etc.
Struggles badly to isolate the effects of media in complex environments

We start with individuals…
WomanHas childrenAffluent
.
Light TV AdsHeavy facebook adsVisited brand pageMedium radio ads
.
TrialistTrusts brandAware of ad messageIntends to buy us
.
What havethey seen
?
What didthey do orbelieve ?
What elsemakes
them dothat?

As the numbers grow, we can isolate more effects…
WomanHas childrenAffluent
.
Light TV AdsHeavy facebook adsVisited brand pageMedium radio ads
.
TrialistTrusts brandAware of ad messageIntends to buy us
.
What havethey seen
?
What didthey do orbelieve ?
What elsemakes
them dothat?
ManHas childrenMiddle income
.
Heavy TV AdsNo facebook adsHeavy YoutubeLow press ads
.
AwareTrusts brandNot aware of admessageIntends to buy other
.
WomanSingleLow income
.
WomanHas childrenMiddle income
.
ManHas childrenAffluent
.
Medium TV AdsHeavy facebook adsVisited brand websiteHeavy radio ads
.
Light TV AdsLow facebook adsLow YouTubeMedium press ads
.
Heavy TV AdsHeavy facebook adsNo press adsNo radio ads
.
LoyalistTrusts brandAware of ad messageIntends to buy us
.
Not awareDoes not trust brandNot aware of admessageIntends to buy other
.
Re-purchaseTrusts brandAware of ad messageIntends to buy us
.

Once we get up to bigger numbers, we can start to unpick ROI

Once we get up to bigger numbers, we can start to unpick ROI
Saw TV ad 4 timesSaw TV ad 4 times
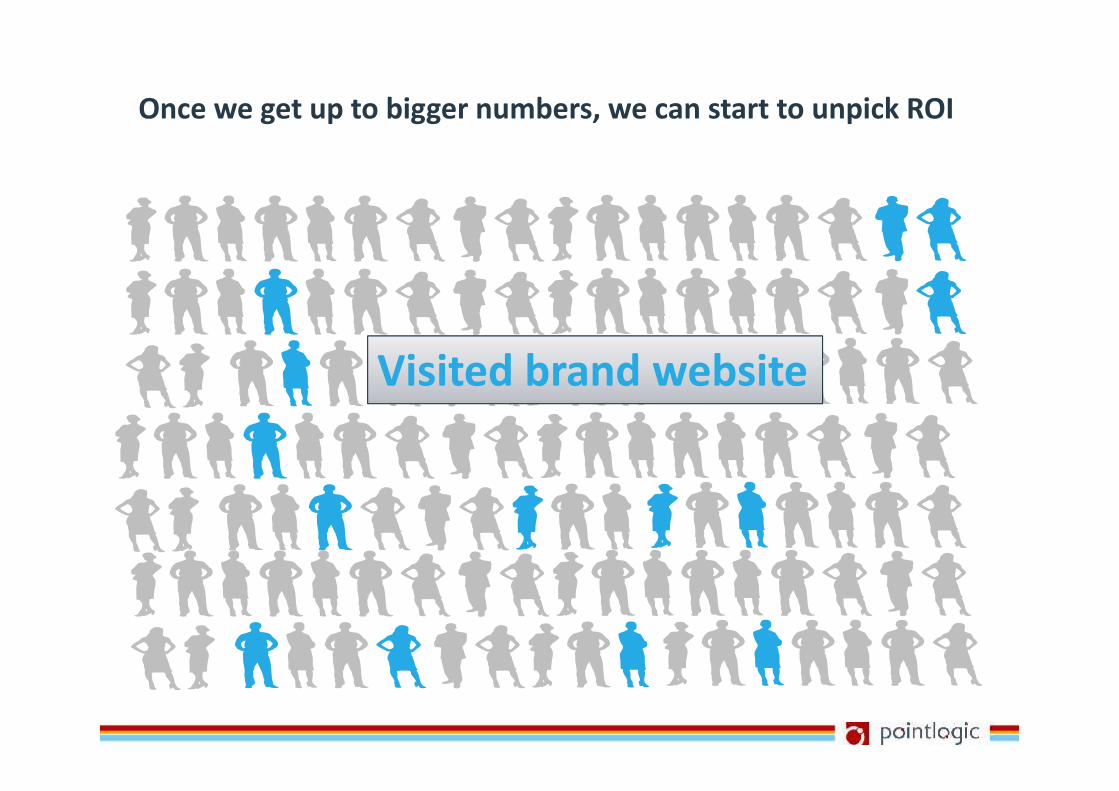
Once we get up to bigger numbers, we can start to unpick ROI
Visited brand websiteVisited brand website

Once we get up to bigger numbers, we can start to unpick ROI
Intend to purchaseIntend to purchase

Applying the power of modelling
• We then just need modelling totease out all the causes and effectsfrom the hundreds of individualswe have precise data for
• We can sort out the media effectsbut also understand what is downto their personal history andpreferences
• We use new and powerfultechniques to do this atrespondent level

Example - modeling results
Product AAwareness
Product APurchase
intent
Product BAwareness
Product BPurchase
intent
TelevisionCampaign 1
TelevisionBranded content
OnlineCampaign 1
OnlineCampaign 2
Significant, highly cost efficient
Which media have a significant effect and are cost efficient to increase the KPI?
Significant, less cost efficient

The media agency and client supply details of all the media activity at adetailed level
In a survey (existing tracker or custom) we measure all behaviours, brandhealth and media usage
Branded content can be specifically probed for
From the media usage we can estimate how many exposures to all thecampaign activities
Then we do the modelling
Then we load the results into our planning tools
Practical implementation

65
Software to use insights for scenario planning…

Thank you.
Leadership SeriesHow to Effectively Use Market Research tomake your Branded Content more Effective


![RIP: Technology Graveyard [Infographic]](https://img.pdfslide.us/doc/110x75/55c43135bb61ebb6628b47d0/rip-technology-graveyard-infographic.jpg)