Embed Size (px)
Citation preview
LEADERSHIP IN COLLEGES OF AGRICULTURAL AND LIFE SCIENCES:
AN EXAMINATION OF LEADERSHIP SKILLS, LEADERSHIP STYLES, AND PROBLEM-SOLVING STYLES OF ACADEMIC PROGRAM LEADERS
BY DAVID WILLIAM WARD JONES
A DISSERTATION PRESENTED TO THE GRADUATE SCHOOL OF THE UNIVERSITY OF FLORIDA IN PARTIAL FULFILLMENT OF THE
REQUIREMENTS FOR THE DEGREE OF DOCTOR OF PHILOSOPHY
UNIVERSITY OF FLORIDA
2006

Copyright 2006
by
David William Ward Jones

This is dedicated to my family:
My incredible wife, Jennifer, and my two wonderful daughters, Kelsey May and
Abbey Rose.
iv
ACKNOWLEDGMENTS
I would like to thank the members of my advisory committee: Drs. Rick Rudd, Ed
Osborne, Tracy Irani, Katie Sieving, and Kirby Barrick. Without their remarkable
talents, knowledge, and individual expertise, this dissertation would not have been
possible. Each of their words of wisdom, challenge for excellence, and encouragement
provided the continual support needed to accomplish this task. I am grateful for the
advice and support of my advisor, Dr. Rick Rudd. He not only made me question my
assumptions, he provided an endless supply of questions for the future.
I am extremely grateful for the love and support of my family. I am truly indebted
to my wife, Jennifer, for helping and encouraging me to accomplish this great feat.
Abbey and Kelsey have constantly been a source of encouragement and comic relief just
when needed.
My success at the University of Florida, in a large part, can be attributed to the
MacJonesingham’s. Their never-ending laughter, love, and support kept me going.
Thank you. It goes without saying that the crew in Rolfs 310 helped me reach this point.
The incredible friends I have made not only supplied endless hours of laughter, but some
great intellectual discussions. During times of frustration and disappointment, they were
always there to tell me I could do it and to lend support. I will be forever grateful to all
of them.
v
TABLE OF CONTENTS page
ACKNOWLEDGMENTS ................................................................................................. iv
LIST OF TABLES...............................................................................................................x
LIST OF FIGURES ......................................................................................................... xiii
ABSTRACT..................................................................................................................... xiv
CHAPTER
1 INTRODUCTION AND PURPOSE OF THE STUDY...............................................1
Introduction to the Study ..............................................................................................1 Background of the Study ..............................................................................................2 Problem Statement........................................................................................................6 Purpose and Objectives of the Study ............................................................................7 Significance of the Study..............................................................................................8 Definition of Terms ....................................................................................................10 Limitations of the Study .............................................................................................11 Summary.....................................................................................................................11
2 REVIEW OF LITERATURE.....................................................................................13
Leadership Defined.....................................................................................................14 Types of Leaders .................................................................................................18 Traits of Leaders..................................................................................................19 Leadership Styles.................................................................................................21 Transformational and Transactional Leadership Styles ......................................22 Leadership Theories ............................................................................................24 Trait Theories ......................................................................................................25
The Great Man Theory.................................................................................25 Leadership Traits Theory .............................................................................25
Behavioral Theories.............................................................................................27 Expectancy Theory.......................................................................................29 Humanistic Theories ....................................................................................30 Exchange Theory..........................................................................................31 Authoritarian Leadership..............................................................................31 Charismatic Leadership................................................................................31
vi
Situational Theories.............................................................................................32 Transformational Leadership Theory ..................................................................36
Measuring Leadership Styles......................................................................................39 Leadership Skills ........................................................................................................41 Leadership Skills Can Be Learned .............................................................................51 Land-grant Universities ..............................................................................................53
Colleges of Agricultural and Life Science at Land-grant Universities ...............54 The Role of the Dean...........................................................................................60 The Changing Role of the Academic Program Dean ..........................................60 A Leader’s Role in Change .................................................................................63 The Dean’s Role in Change.................................................................................67
Kirton Adaption-Innovation Inventory (KAI) ............................................................72 Differences between Adapters and Innovators....................................................73 Innovation and Adaptability in Organizational Change......................................77
Innovative vs. Adaptive Leaders ................................................................................81 Influence of Demographics on Leadership Skills.......................................................82
Gender Differences in Leadership.......................................................................82 Ethnicity and Leadership.....................................................................................85 Age and Educational Level .................................................................................87 Type of Degree ....................................................................................................88 Tenure in Position................................................................................................89
Theoretical Framework...............................................................................................89 Summary.....................................................................................................................97
3 METHODS.................................................................................................................99
Research Design .......................................................................................................100 Population .................................................................................................................102 Instrumentation .........................................................................................................102
Leadership Skills Instrument .............................................................................103 Demographic Instrument ...................................................................................106 Multifactor Leadership Questionnaire...............................................................107 Problem-solving Style Instrument .....................................................................110 Data Collection Time Frame .............................................................................112
Method and Data Analysis Used for Objective 1 .....................................................114 Method and Data Analysis Used for Objective 2 and 3 ...........................................114 Method and Data Analysis Used for Objective 4 .....................................................115 Method and Data Analysis Used for Objectives 5 and 6..........................................115 Method and Data Analysis Used for Objective 7 .....................................................116 Non-response ............................................................................................................117 Summary...................................................................................................................118
4 RESULTS.................................................................................................................121
Objective 1................................................................................................................122 Determine Selected Demographic Characteristics of Land-grant Academic
Program Leaders ............................................................................................122
vii
Participant Age ..................................................................................................123 Educational Degree Held...................................................................................123 Previous Leadership Experience .......................................................................123
Objective 2................................................................................................................124 Assess Level of Importance of Leadership Skills, as Determined by
Academic Program Leaders...........................................................................124 Perceived Importance of Leadership Skill Areas ..............................................124
Objective 3................................................................................................................129 Assess Self-perceived Proficiency of Leadership Skills of Academic Program
Leaders...........................................................................................................129 Self-perceived Proficiency in Leadership Skill Areas.......................................129
Objective 4................................................................................................................133 Identify Gaps in Leadership Skills and Proficiency Level of Academic
Program Leaders ............................................................................................133 Difference Between Perceived Importance and Self-Perceived Proficiency of
Leadership Skills............................................................................................133 Objective 5................................................................................................................133
Determine Leadership Behaviors of Academic Program Leaders as Being Transformational, Transactional and/or Laissez-faire ...................................133
Leadership Style and Gender.............................................................................134 Leadership Style and Ethnicity..........................................................................135 Leadership Style and Age..................................................................................137 Leadership Style and Tenure in Formal Leadership Position ...........................139 Leadership Style and Previous College Leadership Courses ............................140 Leadership Style and Previous Leadership Workshop Training .......................140 Leadership Style and Any Other Additional Leadership Training....................141
Objective 6................................................................................................................142 Identify Academic Program Leader’s Problem-solving Style...........................142 Problem-solving Style and Gender....................................................................142 Problem-solving Style and Ethnicity.................................................................143 Problem-solving Style and Type of Degree ......................................................145 Problem-solving Style and Tenure at a College or University..........................146 Problem-solving Style and Tenure in a Formal Leadership Position................146 Problem-solving Style and Previous College Leadership Training ..................146 Problem-solving Style and Previous Leadership Workshop Training ..............147 Problem-solving Style Previous Leadership Training.......................................147
Objective 7................................................................................................................148 Explain Leadership Styles of Academic Program Leaders ...............................148 Transformational Leadership Style ...................................................................153 Transactional Leadership Style .........................................................................154 Laissez-faire Leadership Style ..........................................................................155
Summary...................................................................................................................155
5 SUMMARY AND DISCUSSION ...........................................................................158
Study Summation......................................................................................................159 Statement of the Problem ..................................................................................159
viii
Methodology......................................................................................................160 Findings and Conclusions.........................................................................................162
Objective 1: To determine selected demographic characteristics of land-grant academic program leaders..............................................................................162
Objective 2: To assess level of importance of leadership skills, as determined by academic program leaders.........................................................................164
Objective 3: To assess self-perceived proficiency of leadership skills of academic program leaders..............................................................................165
Objective 4: To identify gaps in leadership skills and proficiency level of academic program leaders..............................................................................166
Objective 5: To determine leadership styles of academic program leaders, as being transformational, transactional, and/or laissez-faire ............................167
Objective 6: To identify an academic program leader’s problem-solving style170 Objective 7: Explain leadership styles of academic program leaders ..............172
Implications and Recommendations.........................................................................175 Objective 1: To determine selected demographic characteristics of land-grant
academic program leaders..............................................................................175 Objective 2: To assess level of importance of leadership skills, as determined
by academic program leaders.........................................................................176 Objective 3: To assess self-perceived proficiency of leadership skills, of
academic program leaders..............................................................................176 Objective 4: To identify gaps in leadership skills and proficiency level of
academic program leaders..............................................................................179 Objective 5: To determine leadership styles of academic program leaders as
being transformational, transactional or laissez-faire ....................................181 Objective 6: To identify academic program leader’s problem-solving style ...182 Objective 7: To explain leadership styles of academic program leaders .........183
Future Research Recommendations .........................................................................187
APPENDIX
A PRELETTER ............................................................................................................189
B LETTER TO ACADEMIC PROGRAM LEADER .................................................190
C POSTCARD REMINDER........................................................................................191
D INFORMED CONSENT LETTER ..........................................................................192
E MULTIFACTOR LEADERSHIP QUESTIONAIRE (MLQ)..................................193
F KAI ...........................................................................................................................194
G LEADERSHIP SKILLS INSTRUMENT.................................................................195
H CORRELATION TABLE ........................................................................................198

ix
LIST OF REFERENCES.................................................................................................208
BIOGRAPHICAL SKETCH ...........................................................................................223
x
LIST OF TABLES
Table page 3-1 Cronbach’s Alpha for Importance and Proficiency for Leadership
Skills (N=16) ..........................................................................................................106
3-2 Comparison of Early and Late Respondents (N=26).............................................117
3-3 Independent t-Test Comparing Early and Late Respondents (N=26)....................118
4-1 Age and Tenure of Academic Program Leaders (N=56) .......................................123
4-2 Previous Leadership Training Scores (N=56) .......................................................124
4-3 Human Skill Importance Item Response Scores (Importance)...............................124
4-4 Conceptual Skill Importance Item Response Scores (Importance) ........................125
4-5 Technical Skill Importance Item Response Scores (Importance)...........................126
4-6 Communication Skill Importance Item Response Scores (Importance).................126
4-7 Emotional Intelligence Skill Item Response Scores (Importance) .........................127
4-8 Industry Knowledge Skill Item Response Scores (Importance) .............................127
4-9 Perceived Leadership Skill Importance (N=56) ....................................................128
4-10 Human Skill Self-perceived Proficiency Item Response Scores (Proficiency).......129
4-11 Conceptual Skill Self-perceived Proficiency Item Response Scores (Proficiency) 130
4-12 Technical Skill Self-perceived Proficiency Item Response Scores (Proficiency)...130
4-13 Communication Skill Self-perceived Proficiency Item Response Scores ...............131
4-14 Emotional Intelligence Self-perceived Proficiency Item Response Scores ............131
4-15 Industry Knowledge Self-perceived Proficiency Item Response Scores (Proficiency) ...........................................................................................................132
4-16 Leadership Skill Self-perceived Proficiency (N=56) .............................................132
xi
4-17 Difference Between Mean for Importance and Proficiency...................................133
4-18 Leadership Scale Scores and Leadership Style Scores ..........................................134
4-19 Leadership Style Scores by Gender........................................................................135
4-20 Leadership Scale Scores by Gender .......................................................................135
4-21 Leadership Style Scores by Ethnicity .....................................................................136
4-22 Leadership Style of Whites and non-Whites (N=26) ..............................................137
4-23 Pearson’s Product Moment Correlations Between Leadership Style Scores and Leadership Scale Scores, and Age (N=56) ............................................................138
4-24 Pearson’s Product Moment Correlations Between Leadership Style Scores and Leadership Scale Scores and Years of Tenure at a College or University ............139
4-25 Pearson’s Product Moment Correlations Between Leadership Style Scores and Leadership Scale Scores and Years of Formal Leadership Position Tenure (N=56) ....................................................................................................................139
4-26 Pearson’s Product Moment Correlations Between Leadership Style Scores and Leadership Scale Scores and the Number of College Leadership Courses (N=56) ....................................................................................................................140
4-27 Pearson’s Product Moment Correlations Between Leadership Style Scores and Leadership Scale Scores and Number of Leadership Workshops (N=56).............141
4-28 Pearson’s Product Moment Correlations Between Leadership Style Scores and Leadership Scale Scores and Number of Previous Leadership Training Courses (N=56) ....................................................................................................................141
4-29 Problem-solving Style (N=56) ...............................................................................142
4-30 Problem-solving Style and Gender (N=56) ...........................................................143
4-31 Problem-solving Style and Ethnicity (N=56) .........................................................144
4-32 Problem-solving Style of Whites and non-Whites (N=56) .....................................144
4-33 Pearson’s Product Moment Correlation Between Problem-solving Style and Age (N=56) ....................................................................................................................144
4-34 Problem-solving Style and Type of Degree (N=56)...............................................145
4-35 Pearson’s Product Moment Correlation Between Problem-solving Style and Type of Degree (N=56) ..........................................................................................145
xii
4-36 Pearson’s Product Moment Correlation Between Problem-solving Style and Tenure at a College or University (N=56).............................................................146
4-37 Pearson’s Product Moment Correlation Between Problem-solving Style and Tenure in a Formal Leadership Position (N=56) ..................................................146
4-38 Pearson’s Product Moment Correlation Between Problem-solving Style and Previous College Leadership Training (N=56) .....................................................147
4-39 Pearson’s Product Moment Correlation Between Problem-solving Style and Previous Leadership Workshop Training (N=56) .................................................147
4-40 Pearson’s Product Moment Correlation Between Problem-solving Style and Previous Leadership Training (N=56)...................................................................147
4-41 Pearson’s Product Moment Correlations Between Cognitive Function Variables and Transformational Leadership Style .................................................................149
4-42 Pearson’s Product Moment Correlations Between Cognitive Function Variables and Transactional Leadership Style.......................................................................152
4-43 Pearson’s Product Moment Correlations Between Cognitive Function Variables and Laissez-faire Leadership Style ........................................................................153
4-44 Backward Regression Explaining Transformational Leadership Style (N=56) ....154
4-45 Backward Regression Explaining Transactional Leadership Style (N=56) ..........154
4-46 Backward Regression Explaining Laissez-faire Leadership Style (N=56) ............155
xiii
LIST OF FIGURES
Figure page 2-1 Cognitive Function...................................................................................................91
2-2 Cognitive Function Schema (Kirton, 2003) .............................................................93
2-3 Leadership Style Behavior Indicator Model (adapted from Kirton, 2003) ..............96
xiv
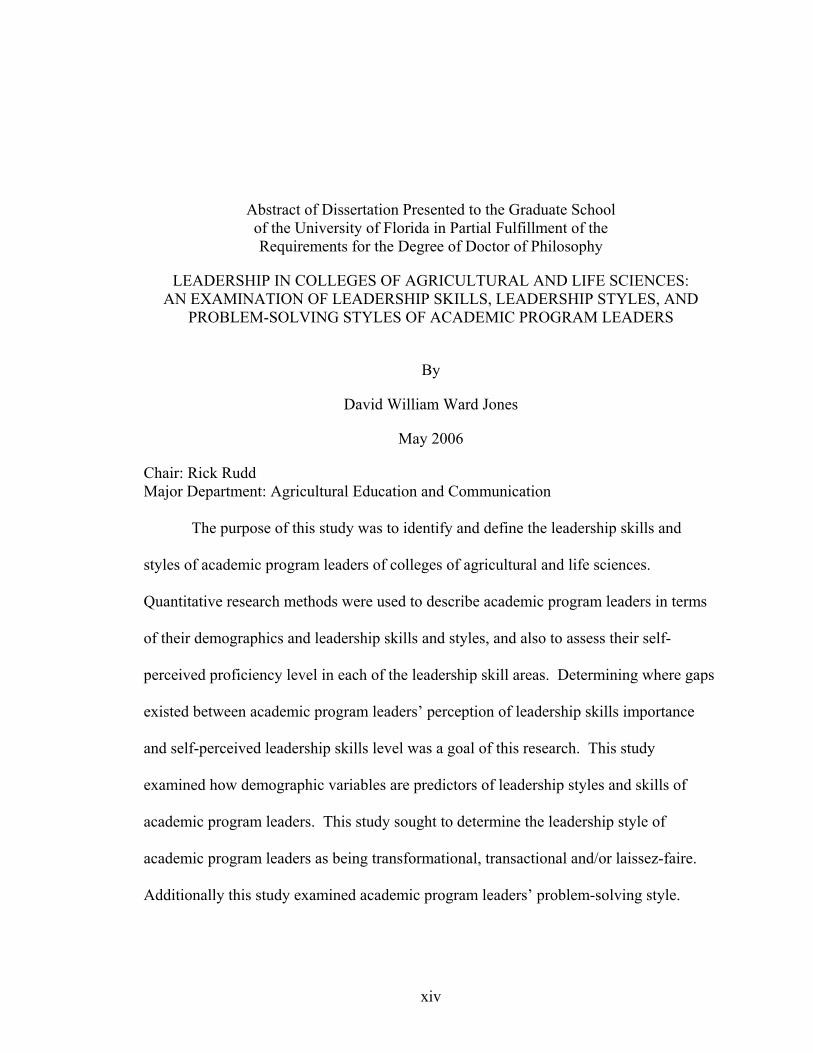
Abstract of Dissertation Presented to the Graduate School of the University of Florida in Partial Fulfillment of the Requirements for the Degree of Doctor of Philosophy
LEADERSHIP IN COLLEGES OF AGRICULTURAL AND LIFE SCIENCES: AN EXAMINATION OF LEADERSHIP SKILLS, LEADERSHIP STYLES, AND
PROBLEM-SOLVING STYLES OF ACADEMIC PROGRAM LEADERS
By
David William Ward Jones
May 2006
Chair: Rick Rudd Major Department: Agricultural Education and Communication
The purpose of this study was to identify and define the leadership skills and
styles of academic program leaders of colleges of agricultural and life sciences.
Quantitative research methods were used to describe academic program leaders in terms
of their demographics and leadership skills and styles, and also to assess their self-
perceived proficiency level in each of the leadership skill areas. Determining where gaps
existed between academic program leaders’ perception of leadership skills importance
and self-perceived leadership skills level was a goal of this research. This study
examined how demographic variables are predictors of leadership styles and skills of
academic program leaders. This study sought to determine the leadership style of
academic program leaders as being transformational, transactional and/or laissez-faire.
Additionally this study examined academic program leaders’ problem-solving style.

xv
Finally, this study sought to explain academic program leaders’ leadership styles by
specific variables.
1
CHAPTER 1 INTRODUCTION AND PURPOSE OF THE STUDY
Introduction to the Study
This study utilized quantitative research methodologies to identify and define the
leadership skills and styles of academic program leaders of colleges of agricultural and
life sciences. Quantitative research methods were used to describe academic program
leaders in terms of their demographics and leadership skills, leadership behaviors and
leadership styles. This study sought to assess academic program leaders’ self-perceived
proficiency level in specific leadership skill areas. Determining where gaps existed
between an academic program leader’s perception of leadership skill importance and self-
perceived leadership skill level was a goal of this research. This study examined how
demographic variables are predictors of leadership styles and skills of academic program
leaders. This study sought to determine the leadership style of academic program leaders
as being transformational, transactional and/or laissez-faire. This study examined the
problem-solving style of academic program leaders of colleges of agricultural and life
sciences. Finally, this study sought to explain leadership styles of academic program
leaders by specific variables.
The National Association of State Universities and Land-Grant Institutions
designates 110 individuals to oversee academic programs. These 110 individuals were
contacted to participate in this study. These academic program leaders were asked to
complete four leadership measurement instruments. The Multi-factor Leadership
Questionnaire (MLQ), developed by Bass and Avolio (2000), was used to assess each
2
academic program leader’s leadership style as transactional, transformational and/or
laissez-faire. Kirton’s (1999) Adaption-Innovation instrument (KAI) was used to
measure the academic program leader’s problem-solving ability. Each college of
agricultural and life sciences academic program leader was given a leadership skills
instrument, which measured the academic program leader’s perception of leadership skill
importance and self-perceived proficiency level in the leadership skill area. Finally, a
demographic instrument was given to each academic program leader to determine gender,
ethnicity, age, highest educational degree, type of degree, tenure in position, tenure in a
formal leadership position, as well as previous leadership training.
Independent variables identified in the literature were gender, ethnicity, age,
highest educational degree earned, type of degree earned, tenure in position, tenure in
formal leadership position, and previous leadership training. These independent variables
were used to determine how demographics influence an academic program leader’s
leadership style and leadership skills.
Background of the Study
On July 2, 1862, President Abraham Lincoln signed into law what is generally
referred to as the Land-Grant Act. This piece of legislation introduced by U.S.
Representative Justin Smith Morrill of Vermont granted to each state 30,000 acres of
public land, which could be used to finance the purchase of land needed for a state-run
college. The Land-Grant Act was to assist the universities to
support, and maintain at least one college in each state where the leading object shall be, without excluding other scientific or other classical studies, to teach such branches of learning as are related to agriculture and the mechanic arts, as the legislatures of the states may respectively prescribe, in order to promote the liberal and practical education of the industrial classes in the several pursuits and professions of life. (Morrill Land-Grant Act, 1862)
3
The Morrill Act of 1862 established 51 land-grant universities. In the second
Morrill Act of 1890, 18 more land-grant universities were created. Between 1890 and
1994, 34 land-grant institutions were added. The Morrill Land-Grant College acts of
1862 and 1890 provided higher education to the general public rather than just the elite.
The purpose of the two Morrill acts was to provide for at least one college in each state.
Colleges established under the Morrill acts were to teach agriculture and mechanical arts.
There are currently 105 land-grant institutions; 74 traditional land-grant colleges
have been established by the Morrill acts of 1862 and 1890. Twenty-nine tribal colleges
were established in 1994, which are represented by a single membership designated by
the American Indian Higher Education Consortium in Virginia. Four institutions are not
in the United States: the Community College of Micronesia; Northern Marianas College;
University of Guam; and the University of Puerto Rico.
Land-grant universities were established to teach foundational skills ranging from
military sciences to practical agriculture application. They were also created to bring
education to the general public and make this education relevant to the daily lives of any
student attending a land-grant university.
Senator Morrill, speaking at the Massachusetts Agriculture College in 1887, stated:
The land-grant colleges were founded on the idea that a higher and broader education should be placed in every State within the reach of those whose destiny assigns them to, or who may have the courage to choose industrial locations where the wealth of nations is produced; where advanced civilization unfolds its comforts, and where a much larger number of the people need wider educational advantages, and impatiently await their possession. (Morrill, 1887)
Land-grant universities were designed to allow for the collection and dissemination
of research and the teaching to the general public. As land-grant universities grew in
size, so did the need for more academic program support. Historically, the administration
4
for higher education has had an important impact on facilities and operations of these
land-grant universities. The academic program leader, who over time has come to be
known as the “dean,” has served in roles dealing with educational instruction to teacher
support services, as well as community education and raising funds for the college.
Seventy-five years ago, the role of the academic dean was not standardized (Hawkes,
1930). Today, there is still no consensus on the roles of the dean (Wolverton, Gmelch,
Montez, & Nies, 2001). Deans of colleges and universities serve to oversee not only the
daily operations of the facility, but they must also have the ability to generate, foster, and
help implement future goals and expectations of the facility. The responsibilities and
tasks of today’s deans include, but are not limited to, maintaining the budget, keeping
records, managing the staff, and representing the university.
Deans today are responsible for personnel, budgetary, policy, governance,
development and fundraising, and other oversight functions (Tucker & Bryan, 1988).
Because of their often-undefined role, the dean is oftentimes expected to take on duties
commonly associated with corporate business managers: figurehead, leader, liaison,
monitor, disseminator, spokesperson, entrepreneur, disturbance handler, resource
allocator, and negotiator (Miller, 1989; Mintzberg, 1973).
The duties of an academic dean involve leadership activities that include
supporting, motivating, and developing the faculty (Wilson, 1999). The roles and
responsibilities of today’s academic dean are a much broader position than what was
originally established for an educational administrator when the Morrill acts were written.
Living and working by the founding premise of Senator Morrill’s vision for land-
grant universities, the need to transcend the old and new roles and responsibilities of
5
land-grant universities has resulted in the need for effective leadership. The need for
strong leaders is now more important than ever. Effective leadership is required to take
colleges and universities through the next era of change. These leaders must exhibit
leadership traits, such as vision, integrity, and perceptiveness. They must possess the
ability to encourage communication and compromise as they work on behalf of the
faculty and the college (Wisniewski, 1998).
The role of the college and the university dean is continually changing.
Universities and colleges in the United States are encountering a turbulent climate. The
quality of their future in many ways depends on how well they respond to evolving
realities in the larger world beyond their walls (Abelson, 1997). How proficient college
of agricultural and life sciences academic program leaders are at leading their colleges
and faculty through the change and their style of leadership could ensure that the change
will be positive for higher education institutions.
Moore (2003) and Stedman (2004) reported a relationship between demographic
variables’, including age, gender, ethnicity, educational background, and leadership
training, and these variables’ that influence on leadership styles. However, an assessment
of those leadership skills current academic program leaders need and have is much harder
to find. Furthermore, an academic program leader’s problem-solving ability has not been
researched. By aligning leadership style, leadership skills, demographics, as well as an
academic program leader’s problem-solving abilities, side by side and determining the
gaps between them, it will draw a clearer picture as to what academic program leaders
need in order to lead their institution effectively through the next period of change.
6
Problem Statement
Leadership ability determines effectiveness and the potential impact of the leader’s
organization (Maxwell, 2002). Until now, the most difficult question has always been:
How can one learn to be an effective leader, not just a manager (Bennis & Nanus, 1985)?
This study worked to define leadership styles and skills that college of agricultural and
life science academic program leaders possess. In modern organizations, leadership and
management roles are seldom separate, and the leaders of organizations set the
atmosphere of the work environment. At times, a leader/manager may need to charge up
followers, creating commitment, inspiration, growth, and adaptation. Here the individual
is clearly exerting leadership (Howell & Costley, 2006).
Academic leaders typically come to their positions without leadership training,
without prior experience, and without a clear understanding of the ambiguity and
complexity of their roles (Gmelch, 1999). Therefore, a strong need for preparation is
required.
The Kellogg Commission, in its report on the Future of State and Land-Grant
Universities (2000), reported that today’s university setting is changing. It stated
universities needed to reform public higher education in five areas: (1) student
experiences; (2) student access; (3) engagement with society; (4) a learning society; and
(5) campus culture. The commission’s findings conclude that universities need to pay
more attention to promoting lifelong learning. The commission also noted universities
need to pay more attention to student experiences and to campus culture.
The commission found several key obstacles that would slow down university or
institutional reform. These obstacles include: lack of resources, money and time;
inadequate facilities; the organization of universities into decentralized, disciplinary
7
departments and colleges; the lack of communication between academic units; personal
attitudes; and a general resistance to change. One of the key aspects the commission
alluded to throughout its report was the lack of leadership at every level. The
commission found that mid-level administrators stressed the need for: clarification of
core values; improvement in the integration of university missions; greater support for
non-traditional students; and re-emphasizing and valuing excellence in all aspects of the
university missions - - teaching, research, and outreach.
In today’s colleges of agricultural and life sciences the role of an academic leader is
dealing with extramural funding, making personnel decisions, and relating to alumni, as
well as focusing on curriculum issues. More specifically, administrative roles include
maintaining the budget, keeping records, managing the staff, and representing the
department in other aspects of the university. What skills are required for academic
program leadership positions in a college of agricultural and life sciences. Do current
staff members in these leadership positions possess these skills? If they do not possess
these skills, where are they expected to obtain the training to acquire these leadership
skills?
Purpose and Objectives of the Study
Due to the changing environment of the higher education system specifically for
this study - - colleges of agricultural and life sciences, the leadership of an organization
will determine if the organization will be able to successfully manage the change or
succumb to it. The academic program leaders of colleges of agricultural and life sciences
have been designated as the individuals responsible for guiding their organization during
this time of change. With this responsibility in mind, this study seeks to answer the
following questions in regard to academic program leaders:
8
• Who are they? • What leadership skills are important to successfully complete their tasks? • What is the self-perceived proficiency of these leadership skills? • Where are the leadership skill “gaps” between what academic program leaders feel
are important and their proficiency level in these leadership skill areas? • What leadership styles do current academic program leaders possess? • Which problem-solving style do academic program leaders prefer to use?
The purpose of this study was to identify and define the leadership skills needed by
academic program leaders in colleges of agricultural and life sciences. The self-
perceived level of proficiency of current academic program leaders was assessed in each
leadership skill area. The study described current academic program leaders in terms of
their leadership style by being transactional, transformational and/or laissez-faire.
This research addressed the following specific objectives:
1. Determine selected demographic characteristics of land-grant academic program leaders.
2. Assess level of importance of leadership skills, as determined by academic program leaders.
3. Assess self-perceived proficiency of leadership skills of academic program leaders.
4. Identify gaps in leadership skills and proficiency level of academic program leaders.
5. Determine leadership styles of academic program leaders as being transformational, transactional and/or laissez-faire.
6. Identify academic program leader’s problem-solving style.
7. Explain leadership styles of academic program leaders.
Significance of the Study
This study determined the specific leadership skills that academic program leaders
believe are important in order to be effective and promote positive change in their
positions. By determining the specific skills that academic program leaders need to
perform their jobs, standards and criterion can be set for hiring colleges of agricultural
9
and life science academic program leaders. In addition, determining the specific skills
deemed important by these leaders will assist in the preparation and successful delivery
of future leadership development programs. Developing leadership programs, which
focus on preparing professional academic program leaders, will help to ensure more
competent leaders from more diverse populations, including women and other minorities.
This information will assist individuals who are interested in pursuing leadership
positions in colleges of agricultural and life sciences, but they may not know how to
pursue this career choice by defining the leadership skills required. Understanding the
role of academic program leaders and how they fulfill this role will benefit future
individuals who aspire to realize this role. Hiring committees can use the information
obtained from this research during the interview process to find new academic program
leaders by asking questions relevant to leadership roles, responsibilities, and proficiency
levels.
This study can be used to develop professional development activities and
leadership training courses as well as other opportunities for personal and professional
growth for academic program leaders. Helping aspiring educational leaders gain an
understanding of the qualities, characteristics, and leadership skills, as well as leadership
behaviors that will be necessary for them to be effective leaders, is a major impact of this
study.
This study described the specific demographic information, and self-perceived
leadership skills, as well as leadership styles of academic program leaders, within
colleges of agricultural and life sciences at land-grant universities. Few studies have
been conducted on agricultural leaders within colleges of land-grant universities. Even
10
fewer studies have been done at land-grant universities that include leaders holding senior
leadership positions. By defining leadership skills needed in leadership positions, as well
as offering explanations of factors that influence these leadership skills, better
recruitment and attainment and retention of educational/academic leaders will result.
Definition of Terms
• Land-grant university: A university directed to educate the people and solve problems through academics, research, and extension programs. It is the land-grant university that has the major responsibility for agricultural research and teaching responsibility, as well as a major "outreach" or extension education mission to the public (NDSU Extension Service website).
• College of agricultural and life sciences academic program leader (dean): For this study the term College of agricultural and life sciences academic program leader will be those individuals listed by the National Association of State University and Land-Grant Colleges as the Dean of Academic Programs in Schools and Colleges of Agricultural and Life Sciences or Agriculture and Natural Resources. These individuals are the chief academic and administrative officers in most Colleges of Agriculture. The dean is typically expected to provide leadership in strategic and program planning, faculty and staff development, fundraising, and setting a vision of the future of the university and college. They serve as academic facilitators between presidential initiatives, faculty governance, and student needs (Astin & Scherrei, 1980). These individuals usually have the primary responsibility for participation/correspondence in academic programs (Directory of Deans and Directors of Academic Programs in Schools and Colleges of Agriculture, Agricultural and Life Sciences, or Agriculture and Natural Resources, 2005). Also known as dean, associate dean, assistant dean, chief academic officer (CAO), or academic program leader.
• Leadership: The process of influencing one or more individuals in an attempt to affect their choices of goals, and to inspire, organize or direct their efforts to achieve the goals. The ability to see a problem or opportunity and do something about it with other people (Pisapia & Coukos-Semel, 2002).
• Leadership styles: The characteristic manner in which an individual leads other people; patterns of leadership behavior (Moore, 2003).
• Leadership skills: The abilities and acquired tasks related to leadership developed by an individual (Moore, 2003).
11
• Transformational leadership style: A “process whereby an individual engages with others and creates a connection that raises the level of motivation and morality in both the leader and the follower” (Northouse, 2004).
• Transactional leadership style: A leadership process which has a focus on the exchanges that occur between leaders and their followers (Northouse, 2004).
• Laissez-faire leadership style: The leadership process that abdicates responsibility, delays decisions, gives no feedback, and makes little effort to help followers satisfy their needs. A “hands-off - - let-things-ride” approach (Northouse, 2004).
Limitations of the Study
The first limitation of this study that must be considered is the institutions being
studied. This study was conducted within colleges of agriculture at land-grant
universities; the findings should therefore only be applied to those institutions. The
conclusions drawn from this study should be limited to the professional academic
program leaders included in this study. The second limitation is that information may or
may not be accurate because it is self-reported data. The data gained might have been
more accurate if it was gained from the dean’s coworkers, staff, or superiors and the
researcher assumes the information to be true and accurate. The third limitation is that
environmental, personal, and situational variables might influence leadership skills and
styles that were not reported in this study.
This study will contribute to the general body of knowledge in regard to leadership
skills, and leadership styles, as well as problem-solving approaches of academic program
leaders of colleges of agricultural and life sciences.
Summary
This chapter provided the background and significance of the problem, as well as
the purpose of the study. The academic program leader position has become a very
important position in colleges and universities. Higher education is undergoing a
12
significant time of change, and academic program leaders are responsible for ensuring
success for the higher education community. These changes include a more diverse
student population, advances in technology, and budget deficits. This study sought to
examine academic program leaders’ leadership skills, and styles, as well as their
problem-solving styles. This study investigated the influence of demographics on the
leadership skills, styles, and problem-solving approaches of professional academic
program leaders in colleges of agricultural and life sciences.
This research addressed the following specific objectives:
Determine selected demographic characteristics of land-grant academic program leaders.
Assess level of importance of leadership skills, as determined by academic program leaders.
Assess self-perceived proficiency of leadership skills of academic program leaders.
Identify gaps in leadership skills and proficiency level of academic program leaders.
Determine leadership behaviors of academic program leaders as being transformational, transactional, and/or laissez-faire.
Identify academic program leader’s problem solving style.
Explain leadership styles of academic program leaders.
This chapter defined significant terms used in the study. Limitations to the study
were discussed.
Chapter 2 will address the theoretical and the conceptual framework for the study.
Chapter 2 will also discuss the research on leadership skills and styles and how people
respond and influence change in organizations, as well as information in regard to
demographics and their influences on leadership styles. Chapter 2 will also take into
account the research in regard to the influence of demographics on leadership styles,
skills, and problem-solving approaches.
13
CHAPTER 2 REVIEW OF LITERATURE
The purpose of this study was to identify and define the leadership skills and styles
of academic program leaders of colleges of agricultural and life sciences. Quantitative
research methods were used to describe academic program leaders in terms of their
demographics and leadership skills and styles, and also to assess their self-perceived
proficiency level in each of the leadership skill areas. A goal of this research was to
determine where gaps existed between an academic program leader’s perception of
leadership skill importance and self-perceived leadership skill level. This study
examined how demographic variables are predictors of leadership styles and skills of
academic program leaders. This study sought to determine the leadership style of
academic program leaders as being transformational, transactional and/or laissez-faire.
Additionally, this study examined the problem-solving style of academic program leaders
of colleges of agricultural and life sciences.
The purpose of this chapter is to present the literature in leadership theory and
leadership styles, as well as leadership skills that contributed to this study. This chapter
will focus on the literature that describes leadership variables and their effect on
leadership styles. This chapter will set the theoretical framework for the study. Included
in this chapter is a brief history of the land-grant universities and the development and
role of the professional academic program leader in colleges of agriculture.
14
Leadership Defined
The term leadership has been much researched, discussed, and debated. Each
author or expert who uses the term leadership uses it in a manner that best encompasses
the focus of his or her work. No consensus exists on a definite/specific definition among
the experts. One of the problems with the concept of leadership is the ambiguity of its
definition and measurement (Pfeffer, 1977). Leadership is an important topic of
discussion in all disciplines and fields of studies. In and of itself, leadership is among the
most studied and least understood subjects (Bennis & Nanus, 1985).
Researchers have worked to define leadership and effective leadership. British
Field Marshal Bernard Montgomery defined leadership by stating, “Leadership is the
capacity and will to rally men and women to a common purpose and the character which
inspires confidence.” President Harry Truman stated, “A leader is a man who has the
ability to get other people to do what they don’t want to do and like it.” In examining
these definitions, it is easy to see that leadership has a very broad definition, depending
on who is being asked and the setting to which one is referring. In this review of
literature, the researcher evaluated definitions of leadership from different theoretical
perspectives.
According to Burns (1978), leadership is one of the most observed and least
understood phenomena on earth. Researchers have investigated aspects of leadership in
order to try and determine what makes a leader, how he or she came about being a leader,
and what traits a leader possesses.
Chemers (1993) defined leadership as a process of social influence, and effective
leadership as the successful application of the influence to mission accomplishment.
When a leader is able to get others to attain goals of the organization, in Chemers’s view,
15
he or she is effective. Chemers suggested that the effective leader is able to get the
followers to perform desired job tasks or outcomes. Chemers’s leader is able to do this
while being consistent with policies, procedures, and conditions of the organizational
policy.
An approach to establishing the characteristics of the effective leader can take on a
sociological perspective (Fiedler & Garcia, 1987). Fiedler and Garcia’s main concern
was with the success of the group and the task that has been assigned. While many
scholars assume there is one best style of leadership, Fiedler and Garcia’s contingency
model proposed that the leader’s success is based on the situation where he or she must
demonstrate his or her leadership skills. Fiedler and Garcia’s work believes that
leadership is a system of interactions that takes place between a leader and work group.
According to Fiedler and Garcia, this system of interaction is demonstrated through the
actions of the leader. They measured the leader’s skills and characteristics by what they
call the least preferred co-worker (LPC) scale, which is an instrument used for measuring
an individual’s leadership orientation. The LPC scale takes what a leader thinks of all the
persons with whom he or she has ever worked, and then asks the leader to describe the
one person with whom he or she has worked the least well. The instrument then asks the
leader to rate this person on a scale of 1 through 8. The leader is asked to describe this
person through a series questions and then is scored by their responses. Fiedler and
Garcia’s research led to building a case for showing a strong relationship between the
leader and the followers’ interaction.
Krech and Crutchfield (1948) maintained that “by virtue of his [the leader] special
position in the group, [the leader] serves as a primary agent for the determination of
16
group structure, group atmosphere, group goals, group ideology, and group activities.”
Mendl (1990) suggested that groups display measures of effect leadership and that the
more productive a group is, the more effective the leadership is. The value of the leader
is then measured by the productivity and satisfaction of the members of the group.
Mendl differentiated between “process” measures of leadership, which are behaviors that
leaders show or display. These outcomes do not have any true value within themselves;
however, the result of the behavior to the group is the important part. Alternatively, the
group performance is the true measure of the effective leader.
Other researchers have defined leadership as having influence over others
(Northouse, 2004). Some theorists believe that leadership is getting others to comply
with the leader’s desires. Still other theorists believe that leadership is an exercise or use
of power (Schenk, 1928). As leadership becomes more refined over time, the term goal
achievement has entered leadership discussions (Cowley, 1928; Bellows, 1959; Davis,
1962; Northouse, 2004). With these different concepts, the role of leaders and the
definition of leadership have evolved over time. Even today, not a single, all-
encompassing definition of leadership can be agreed upon. As many definitions of
leadership exist as there are researchers and authors studying and writing about
leadership. Researchers of leadership, as with all researchers, define the term to suit their
need and purpose at that particular time.
It is important to realize that leadership has essential elements. These elements
include (Rost, 1991):
• A relationship based on influence; • Leaders and followers are the people in this relationship; • Leaders and followers intend real changes; and • Leaders and followers develop mutual purposes.
17
An influencing relationship can take several forms. Bell (1975) defined influence
as the process of using persuasion to have an impact on other people in a relationship. In
order to persuade, a leader must use his or her reputation, personality, purpose, status,
goals and aims, interpersonal and group skills, symbolic interaction, perception,
motivation, gender, race, religion, along with many other talents.
Leaders and followers are the second essential elements in this definition of
leadership. Followers in simple terms are those who are being led. The term followers
has often been used synonymously with people who are subordinate and not as intelligent
as their leader. Followers have given up control and are unproductive unless directed by
others. Recently, the opinion of the followers has changed. The term followers has taken
on a larger, more encompassing definition, and has been expanded to include all types of
people from different groups and organizations, and at different times. In today’s world,
followers are not passive or submissive. It is easy to understand how a person in one
situation might be a follower and in another situation that same person may be a leader.
The third essential element in understanding leadership is that leaders and followers
intend real change. Burns (1978) wrote,
The leadership process must be defined, in short, as carrying through from decision-making stages to the point of concrete changes in people’s lives, attitudes, behaviors, institutions. Leadership brings about real change that leaders intend. The test of leadership is purpose and intent, drawn from values and goals, of leaders, high and low, resulting in policy decisions and real, intended change.
Within this element, the word intend expresses the notion that changes are
intentional and purposeful. Leaders promote a change purposefully. The term real
means the change that will occur is of some value to the leader or followers. It is
important to realize that the change may or may not occur, but the intent must have value.
18
The final essential element of the definition of leadership is that leaders and
followers must develop a mutual purpose. The idea of a purpose is different than the
concept of a goal. Purposes are typically not specific. Purposes are broad and more
encompassing. Purposes could be categorized more as a future vision or a mission
statement. The idea of a goal is typically considered as being very specific and
measurable. Goals are not excluded from one’s purpose, but in a leader-follower
relationship, mutual goals are not required where a mutual purpose exists.
Types of Leaders
In the late 19th century, leadership research focused on the “mob” or “crowd”
leader. LeBon (1897) described the crowd leader as: (1) the crowd-compeller inflames
the followers with his or her point of view; (2) the crowd-exponent senses what the
crowd desires and gives expression to it; and (3) the crowd-representative merely voices
the already formed opinions of the crowd.
As the turn of the century occurred Bogardus (1918) suggested four types of leaders: (1) the autocratic type who rises to office in a powerful organization; (2) the democratic type who represents the interests of a group; (3) the executive type who is granted leadership because he is able to get things done; and (4) the reflective-intellectual type who may find it difficult to recruit a large following.
Within these types of leaders, certain types of leaders have arisen in our society.
These leaders were designated as: (1) educational leaders; (2) student leaders; (3) public
leaders; (4) legislative leaders; (5) transactional leaders; (6) transformational leaders; (7)
opinion leaders; (8) small group leaders (Bass, 1981). But what do all these types of
leaders have in common?
19
Traits of Leaders
Based on 15 different studies (Stogdilll, 1981), early research tried to attach
specific leadership traits to highly effective leaders. These early 20th century studies had
the following conclusions:
• The average person who occupies a position of leadership exceeds the average member of his group in the following respects: (1) intelligence; (2) scholarship; (3) dependability in exercising responsibilities; (4) activity and social participation; and (5) socioeconomic status.
• Factors that have been found which are specific to well-defined groups, such as gangs and play groups, include athletic ability and prowess while intellectual fortitude and integrity emerge as groups mature.
• The traits that showed the highest overall correlation with leadership are originality, popularity, sociability, judgment, aggressiveness, desire to excel, humor, cooperativeness, liveliness, and athletic ability.
Researchers have tried to correlate leadership with IQ, grades, age, height, and
physical weight all with mixed results and conclusions. No findings were conclusive.
As leadership research continued through the 1940s, the research tried to contradict
the notion that suggested leaders, due to inheritance or social advantage, possess the
qualities and abilities that make them better leaders than the rest of their peers. Stogdill
(1948) reviewed 124 trait studies and found leaders could be characterized by several
clusters of items. These traits represented or classified capacity, achievement,
responsibility, participation and status. Stogdill also concluded that leaders’ traits tend to
differ with each situation in which they are required to make decisions.
In a comparison of 52 studies between the 1950s and 1970s, the results concluded
that leaders had the following driving motivations:
• A strong drive for responsibility and task completion; • Vigor and persistence in pursuit of goals; • Venturesomeness and originality in problem-solving; • Drive to exercise initiative in social situations;
20
• Self-confidence and sense of personal identity; • Willingness to accept consequences of decision and actions; • Readiness to absorb interpersonal stress; • Willingness to tolerate frustration and delay; • Ability to influence another person’s behavior; and • Capacity to structure social interaction systems to the purpose at hand.
Kirkpatrick and Locke (1991) reviewed the literature and identified and
summarized the following list of traits of an effective leader:
• Drive (achievement, ambition, energy, tenacity, initiative); • Leadership motivation (the desire to lead); • Honesty and integrity; • Self-confidence; • Cognitive ability; and • Knowledge of the business.
Early studies, as well as current leadership studies, seem to agree that qualities,
characteristics, and skills required in a leader are determined to a large extent by the
demands of the situation in which the leader is needed to function (Stogdill, 1981). The
research suggests leadership is not a matter of status or mere possession or a combination
of specific traits. Research suggests that effective leadership is the relationship between
the members of the group and the leader. The leader acquires his or her status through
active participation and demonstrates his or her capacity for completion of tasks through
ability and demonstration of abilities.
During the 1980s, leadership studies developed a list of traits believed to enhance
effective leadership. These traits include high energy, trustworthiness, charismatic
persona, visionary purpose, honest communication, and obsession with goals which assist
the leader in using the correct behavior that the situation demands. Depending on the
situation, leadership would allow the correct behavior, such as challenging the process,
21
modeling the way, inspiring a shared vision, enabling others to act, and encouraging the
heart (Kouzes & Posner, 2002).
Leadership Styles
Leadership styles are based on personality styles, personal traits, and effectiveness,
as well as other behaviors, traits, and characteristics. Goleman, Boyatzis, and McKee
(2002) outlined six styles of leadership in their book, Primal Leadership: Realizing the
Power of Emotional Intelligence. The authors offer the following six styles of leadership:
The Visionary Leader. This person works to move people toward a shared vision, but allows them to find their own path to that goal. This type of leader is good for moving a company forward in a particular direction, and makes a strong impact on the environment of the company.
The Coaching Leader. This leader works closely with people to find their strengths and weaknesses and tie these traits into their plans and actions. He or she delegates assignments, achievements or goals are accomplished because of loyalty.
The Affiliative Leader. The affiliative leader connects with people and keeps peace within the team. This collaborative style pays attention to emotional needs, not just work needs, and usually has a positive attitude, helping people through stressful situations.
The Democratic Leader. This type of leader wants input from others and participation from them hoping to get everyone on board with ideas and to garner support for actions.
The Pace-setting Leader. This person likes challenges and goals; putting pressure on others is a way of keeping up with the task at hand. This hands-off style works best for the short term.
The Commanding Leader. This type of person is often seen as cold and distant, but works by giving good directions and expecting and receiving cooperation from others. He or she is committed and confident and is rarely questioned.
Goleman, Boyatzis, and McKee believed that these six different leadership styles
influence the working climate and can affect results of the organization.
There are many styles of leadership. Depending on the leadership style, the
followers will relate to the leader differently in regard to the legitimacy and expectations
22
of the leader. As the study of leadership has evolved, two distinctly different but related
leadership concepts of leadership styles have become popular. These two concepts of
leadership styles founded on Burns’s (1978) work are transactional and transformational
leadership.
Transformational and Transactional Leadership Styles
Burns’s (1978) work drew from earlier research in which leadership scholars
deemed leadership as a relationship of mutual stimulation built on the characteristics,
attitudes, and needs of both leaders and followers. These scholars felt that the purpose
and structure of the organization, the nature of the work, and the social, economic and
political nature of the organization were all important (Hare, Borgatta, & Bales, 1955;
McGregor, 1960). Later scholars (Avolio & Bass, 1988; Bass, 1985; Bennis & Nanus,
1985; Conger & Kanungo, 1988; Rost, 1991) refined the definitions of transformational
and transactional leadership styles.
A transactional leader views the leader-follower relationship as a process of give-
and-take. The transactional leader makes an exchange with the followers, and her or she
gets compliance by rewarding performance and threatening punishment for non-
performance. Transactional leaders tend to use compliance mandates in an attempt to get
an intrinsic motivation factor. The transactional leadership is seen as a trading of benefits
between leaders and followers (Wolverton et al., 2001).
In direct contrast, the transformational leader is more visionary and inspirational
toward his or her followers. Transforming leadership is seen as the mobilization of
others to act in a manner that is morally superior to what might otherwise be the case
(Wolverton et al., 2001). The transformational leader communicates a clear vision and
goal his or her followers can relate to and identify with. The transformational leader
23
usually tends to create intense emotions among his or her followers. The transformational
leader is able to tap into the self-concept and goal identification in order to motivate the
followers. Instead of using rewards and punishments for performance or lack of
performance, the transformational leader works to instill ownership into the group. This
group ownership is often accomplished by involving the followers in the decision-making
process. The goal of the transformational leader is to get the followers to perform due to
internal control and self-motivation factors, instead of external motivators. One of the
benefits of having followers intrinsically motivated is that the need to monitor a
follower’s actions is greatly reduced. Scholl (2002) explained that transformational
leaders are capable of promoting the change from external motivation to internal
motivation by:
• Linking desired outcomes to values held by followers; • Creating employee ownership in outcomes so that positive outcomes validate the
self-concept of followers; and • Building strong follower identification with/within the group or organization.
Burns (1978) referred to transformational leadership as being the ability for
“leaders and followers to raise one another to higher levels of motivation and morality.”
Transformational leadership is considered to promote extreme devotion and increase
effort among the followers. An examination of transformational leaders found that they
were highly charismatic excellent communicators. Additionally, transformational leaders
showed caring personalities, consideration of followers, and a genuine sense of
sensitivity to the followers’ wishes and desires (Howell & Costley, 2006).
The success of transactional leadership is based on the willingness of the followers
to be directed by the leader. The success of transformational leadership is based on the
24
group’s collective belief that what is better for the group will be better for the individual
(Mintzberg, 1998).
Current studies on transactional and transformational leadership suggest effective
and successful leaders combine and use both transactional and transformational
leadership to some degree (Bass, 1998). Bass stated the best leaders are both
transformational and transactional, but they are likely to be more transformational and
less transactional than poorer leaders.
Leadership Theories
As with the issue of defining leadership, researchers have debated on the different
approaches of leadership theory. Some scholars believe leaders are born with leadership
traits and leadership traits are difficult to learn. Stogdill (1974), Yukl (1989), and Bass
(1990) described leadership in terms of behaviors. The theory of leadership offered by
Fiedler (1967) Hershey and Blanchard, (1988) viewed leadership as more of a situation
and how the leader responds to that particular situation. In its simplest of terms,
situational leaders are ones who adopt a particular leadership style based on the situation
they are facing.
Blake and Mouton (1989) approached leadership as believing there is a “one best”
way of leading. Early sociological theorists posited that the use of power, authority, and
control gave the leader his or her ability to lead the group (Burns, 1978). However, other
researchers suggested leadership and effective leaders are on a continuum of transactional
leadership and transformational leadership (Burns, 1978; Bennis & Nannus, 1985;
Kouzes & Posner, 1990; Deal & Peterson, 1990).
The research in leadership theory suggests most theories can be separated into four
major categories: (1) Trait Theories; (2) Behavioral Theories; (3) Contingency Theories;
25
and (4) Transformational Theories. Rost (1991) quickly pointed out that none of these
theories should be used in isolation. Rost explained how all leadership theories have
some common elements. He stated that the various leadership theories are not discrete
and distinct conceptual frameworks, but are grounded on similar assumptions.
Trait Theories
The Great Man Theory
Great Man theorists believe leadership and the capability to lead are inherited traits.
Great Man theorists state prominent leaders from the past have included men and women
who had inborn talents to become leaders. These theorists believe great leaders are born;
they are not made. Leaders such as Winston Churchill, Vladimir Lenin, John F.
Kennedy, Joseph Stalin, Lee Iacocca, and Friedrich Nietzsche have been greatly studied.
Many theorists believe these men were “born” to be leaders.
Leadership Traits Theory
Leaders who have particular qualities, which separate them from other individuals,
are the premise of the Trait Theory of leadership. Trait leaders have specific
characteristics of their personality and character distinguishing them as leaders (Stogdill,
1948). Studies attempting to identify traits of leaders have come to no consensus as to
the mandatory traits that leaders must have in order to be successful. Variables included
in these trait studies have included: IQ; grades; age; height; weight; gender; physique;
energy; health; appearance; fluency of speech; scholarship; knowledge; judgment and
decision-making ability; insight; originality; adaptability; introversion-extroversion;
dominance; initiative; persistence; ambition; responsibility; integrity and conviction; self-
confidence; mood control or mood optimism; emotional control; social and economic
26
status; social activity and mobility; biosocial activity; social skills; popularity or prestige;
and cooperation (Stogdill, 1948).
The average person who occupies a position of leadership exceeds in the leadership
traits of: intelligence; scholarship; dependability in exercising responsibilities; activity
and social participation; and socioeconomic status. It was also determined that the
average person who has or plays a leadership role exceeds the average member of his
group to a certain degree in: sociability; initiative; persistence; knowing how to get things
done; self-confidence; alertness to and insight into situations; cooperativeness;
popularity; adaptability and verbal ability (Mann, 1959).
Traits with the highest correlation with leadership included: originality; popularity;
sociability; judgment; aggressiveness; desire to excel; humor; cooperativeness and
liveliness. Age, height, weight, physique, energy, appearance, dominance, and mood
control were found to have little correlation with leadership (Bass, 1981).
During a study of North American organizations and leaders, John Gardner (1989)
identified common attributes generally possessed by leaders that allowed a leader in one
situation to be successful in another. These traits included:
• Physical vitality and stamina; • Intelligence and action-oriented judgment; • Eagerness to accept responsibility; • Task competence; • Understanding of followers and their needs; • Skill in dealing with people; • Need for achievement; • Capacity to motivate people; • Courage and resolution; • Trustworthiness; • Decisiveness; • Self-confidence; • Assertiveness; and • Adaptability/flexibility.
27
Early researchers of trait leadership concluded there were specific traits or
characteristics making a leader successful independent of the situation. These early
theorists asked the question: What happened if a leader exhibited some traits and not
others?
While trait theorists tried to answer this question, other leadership scholars
examined leaders’ behaviors. During the 1950s and 1960s, a shift took place in how the
study of leadership was approached. Studies focused more on leaders’ behaviors instead
of leaders’ traits. This led to Behavioral Leadership theories.
Behavioral Theories
Using specific patterns and decision-making characteristics in all situations is the
premise of Behavioral Leadership theories. One of the most well-known studies of
leadership behavior is a study conducted at Ohio State University in the 1950s. The
study measured 12 subscales of a leader’s behavior and determined how often the leader
exhibited each leadership behavior. This research was not meant to be evaluative or to be
used for assessment purposes. This study was meant to describe a leader’s behavior. The
12 subscales measured:
1. Representation – speaks or acts for the group; 2. Demand Reconciliation – reconciles conflicting demands and reduces disorder to
the system; 3. Tolerance of Uncertainty – is able to tolerate uncertainty and postponement without
anxiety or upset; 4. Persuasiveness – uses persuasion and argument effectively; strong convictions; 5. Initiation of Structure – clearly defines own role, and lets followers know what is
expected; 6. Tolerance of Freedom – allows followers scope for initiation and action; 7. Role Assumption – actively exercises the leadership role rather than surrendering
leadership to others; 8. Consideration – regards the comfort, well-being, status and contributions of
followers; 9. Production Emphasis – applies pressure for productive output; 10. Predictive Accuracy – exhibits foresight and ability to predict outcome accurately;
28
11. Integration – maintains a closely knit organization; resolves member conflicts; and 12. Superior Orientation – maintains cordial relations with superiors; has influence
with them; is striving for higher status. The Ohio State University study, as well as a similar study conducted at Michigan State
University, found leaders to be employee-(follower) centered or job-(task) centered.
The Managerial Grid (Blake & Mouton, 1964) denotes five behavior types or styles
that leaders possess. These five styles include: (1) the impoverished style; (2) country
club style; (3) produce or perish style; (4) middle of the road style; and (5) team style.
The impoverished-style of leadership shows a low concern for both people and
production or accomplishment of the task. Leaders use this style to avoid getting into
trouble. The main concern for the leader is not to be held responsible for any errors or
mistakes.
The country club-style leader shows a high concern for people and a low concern
for accomplishment of the task. Leaders using this style of leadership pay attention to the
security and comfort of the employees. The country club-style leader hopes his or her
followers will increase performance and task accomplishment while still maintaining a
friendly atmosphere. Productivity is often not as high as the leader might hope.
Leaders who exhibit more concern for production and less concern for people are
exhibiting the produce or perish-style of leadership. Leaders using this style of
leadership find followers’ needs of little importance. Leaders exchange a reward for an
expected performance. Leaders using this style also regulate their followers through
rewards and punishments to achieve goals.
The middle-of-the-road style of leadership is evident in leaders who try to balance
goals and followers’ needs. These leaders show concern for the people they are leading
29
and appreciation for task accomplishment. Leaders using this style hope to achieve
acceptable performance from their followers, as well as taking care of their followers.
The team-style leader is concerned about the follower and production or task
accomplishment. This type of leader encourages teamwork and commitment among
followers. This method of leadership relies heavily on making followers feel as though
they are a constructive part of the organization or team.
The Ohio State University and Michigan State University studies, as well as Blake
and Mouton’s Managerial Grid, have four ideas in common. These four styles of
leadership include:
1. Concern for the task – The leader emphasizes the achievement of concrete objectives. The leader looks for high levels of productivity, and ways to organize people and activities in order to meet those objectives.
2. Concern for people – The leader looks upon his or her followers as people – their needs, interests, problems, development, etc. Followers are not simply units of production or means to an end.
3. Directive leadership – This style of leadership is characterized by leaders taking decisions for others – and expecting followers to follow instructions.
4. Participative leadership - These leaders try to share decision-making with others. (Wright, 1996)
Many behavioral studies failed to take into account the situation in which the
leadership style was being used. These studies failed to examine how leaders adapt to the
workers and the environment in which they are working.
Expectancy Theory
A leader who uses action, interaction, and sentiments during his or her dealings
with his or her followers is displaying characteristics of expectancy theory. Expectancy
theory states leaders take action and increase the interaction between themselves and their
followers. This increase in interaction leads to higher sentiments of mutual liking and the
30
clearer definition of group goals and norms. It is this interaction that defines the
expectancy theory. According to Stogdill (1959), different aspects of expectancy theory
should be closely examined. Stogdill maintained that as the leader interacts with the
group and is encouraged by the group, he or she will be more likely to continue to
function as the leader. With this increased expectation of group interaction, the leader
will continue to perform the function of the leader.
Bass (1960) discussed the reinforced change theory: the effort of one member to
change the motivation and understanding of other members or to change the group or
followers’ behavior. This theory is a construct of the expectancy theory. Bass argued
that the emergence of leadership and what would promote effectiveness as a leader
depended on the interaction potential of the situation and the physical, psychological, and
social distance among individuals.
Humanistic Theories
The notion that people are lazy and resistant to organizational needs is the
foundation of Theory X. Theory Y is based on the assumption that people are motivated,
desire responsibility, and look to fulfill organizational goals and objectives (McGregor,
1966). Likert (1967) believed leadership is the process where a leader needs to take into
account the expectations, values, and interpersonal skills of those with whom he or she is
interacting. Likert explained that leaders need to exhibit behaviors of organizational
processes that followers believe are supportive of their efforts and their sense of personal
worth. Followers want and need to be involved in making decisions affecting their
welfare and their work. Humanistic leaders will use their abilities to further task
performance and their followers’ personal welfare. Leaders work to build group
cohesiveness and motivate followers to increase productivity. If leaders allow their
31
followers to exhibit their own freedom in making decisions that affect their welfare and
working conditions, then task accomplishment and productivity are increased.
Exchange Theory
Leader Member Exchange Theory posits a strong relationship between superiors
and their subordinates. This relationship’s influence and obligation lead to how tasks are
implemented and completed. By building these relationships, the exchange theory
suggests resulting positive outcomes. These positive outcomes are in the form of low
follower turnover, high production, high self-efficacy, and job satisfaction.
Authoritarian Leadership
In many instances, leadership is confused with having authority. Heifetz (1994)
explained that individuals are assumed to be leaders because they have been placed in a
position of authority or have been given power in a formal role. These leaders are
followed because the followers often fear consequences if they do not follow orders.
Authoritarian leaders can often fall into the exchange category of leadership. The leader
needs to perform well and meet the followers’ expectations or he or she risks the
possibility of being removed as the leader.
Charismatic Leadership
Charisma is often viewed as a person’s skills, personality, and presence.
Personality characteristics of a charismatic leader include being dominant, having a
strong desire to influence others, being confident with his or her skills, and having strong
values. Behaviors that are indicative of such a leader include being a strong role model,
continually showing competence, having the ability to articulate goals, having continual
communication of high expectations of followers, and having the ability to arouse
individuals’ motives (Northouse, 2004). Followers of a charismatic leader will respond
32
by trusting the leader’s ideology, unquestioningly accepting what the leader is promoting,
and showing affection to the leader. Followers have a high level of confidence in the
leader and are able to identify with the leader. At the same time, followers become
emotionally involved with the project or task. This relationship between the leader and
followers leads to heightened goal setting.
Situational Theories
Situational leadership is the ability of the leader to bring his or her expertise and
pertinent information to promote a positive outcome when making a leadership decision.
Leaders draw conclusions and implications in order to generate solutions based on
information gathered in each situation. As the study of leadership evolved, researchers
began to look at the situation, environment, and/or context in which the leader was
performing. The premise of situational leadership is that particular forms or certain
forms of leadership will be prevalent in particular situations. Situational leaders are
capable of using different leadership behaviors in different ways, dependent upon the
situation.
Some persons become leaders because of their formal position within an
organization (Northouse, 2004). French and Raven (1959) conceptualized that the
relationship between the leader and the followers was manipulated by the degree and
amount of power and influence the leader had over the followers. French and Raven
identified five different types of power exhibited by the leader: (1) reward; (2) coercive;
(3) legitimate; (4) referent; and (5) expert.
1. Reward power – the ability of one individual to facilitate the attainment of desired outcomes by others. The more valuable the rewards a leader could provide, the more closely this ability was related to leadership.
33
2. Coercive power – The ability to impose penalties for noncompliance. Typically, coercive power uses threats and punishment to obtain results.
3. Legitimate power – Legitimate power is given to the leader based on the norms and expectations held by group members regarding behaviors appropriate in a given role or position. The legitimate leader is selected by the group.
4. Referent power – Followers comply because they admire or identify with the leader and want to gain the leader’s approval.
5. Expert power – Followers believe the leader has special knowledge in regard to the best way to achieve the task or goal.
Stogdill (1948) determined leaders not only have certain traits, but when analyzing
leaders and leadership, the situations in which leaders are performing must also be
examined. Stogdill’s findings led to a “contingency” approach to leadership.
Contingency theorists conclude there is no one single approach to leadership that works
best all the time or that all leadership theories are equal in effectiveness (Bensimon et al.,
1989).
Fiedler and Garcia (1987) formulated three important aspects as to how leaders and
the situation interact with one another. These three factors include:
1. The relationship between the leaders and followers: If leaders are liked and respected, they are more likely to have the support of others.
2. The structure of the task: If the task is clearly spelled out as to goals, methods, and standards of performance, then it is more likely that leaders will be able to exert influence.
3. Position power: If an organization or group confers powers on the leader for the purpose of getting the job done, then this will increase the influence of the leader.
After considering Stogdill’s theory of Situational leadership, Gerth and Mills
(1952) developed the following four criteria to consider when determining a leader’s
capabilities:
1. The traits and motives of the leader as a person;
2. The image the public holds of his or her and their motives for following them;
34
3. The features of the role that he or she plays as a leader; and
4. The institutional context in which he or she and his or her followers may be involved.
Bass (1960) explained the Great Man theory was lacking the situation in which the
leader was performing. Bass believed the outcome of leadership is due not only to the
leader’s certain characteristics, but also the situation in which the leader is responding.
Hersey and Blanchard (1977) developed a leadership theory that falls into the
category of situational leadership. Their leadership theory involves four different
leadership styles used by leaders, depending on the situation the leader was presented.
Hersey and Blanchard’s theory included leaders who were telling, selling, participating,
or delegating in their leadership style.
The telling leader is one who concentrates more specifically on the task needed to
be accomplished and less on building relationships with his or her followers. This leader
typically gives a lot of direction and specific information to his or her subordinates. This
type of leader is concerned with defining roles of each team member and the goals of the
team. Extremely repetitive work or under-pressure work completion works well with this
type of leadership. Followers are deemed by the telling leader as unable or unwilling to
do a good job without being told specifically what to do.
The selling leader works to achieve high-task accomplishment and a high/strong
relationship between himself and his followers. This leader works to get the team
members to “buy into” the group’s tasks and goals. People often consider this type of
leader to be a “coaching” leader.
Participating leadership is having the leader and his or her followers work together
to make decisions and share in the decision-making process. This form of leadership
35
entails more relationship building and less concern for making decisions from the top.
This type of leadership allows the followers to make decisions about the immediate task.
Leaders with a delegating style of leadership do not worry about building
relationships with followers. The leader identifies followers and then assigns or issues
them tasks to be completed. This form of leadership requires the leader to understand the
capabilities of the followers. The leader has faith that the followers will be capable of
completing the task, and he or she allows the followers to “go for it” without interference.
Path-goal Theory
House and Dessler (1974) developed their Path-goal Theory which focused on
follower motivation. Their theory examined factors that motivate people to accomplish a
given task. House and Dessler used expectancy theory research to examine how leaders
motivate subordinates to accomplish designated goals. Their Path-goal Theory focused
on three motivating factors:
1. Offering rewards for achieving goals; 2. Clarifying paths toward the goal; and 3. Removing obstacles standing in the way of achieving the goal.
House and Dessler’s Path-goal Theory also generalized four leadership behaviors
that effective leaders exhibited. The effective leader is:
1. Directive – gives specific guidance of performance desired; 2. Achievement-oriented – sets high goals and expectations; 3. Supportive – friendly and shows concern; and 4. Participative – consults followers and considers their perspective.
House and Dessler suggested these leadership behaviors are exhibited under
different situations and could be influenced by situational variables, including personal
characteristics and environmental characteristics. The Path-goal Theory believes these
four leadership behaviors lead to higher quality results, better worker attitudes, and
36
acceptance of the leader. The Path-goal Theory suggests a leader’s behavior motivates or
satisfies followers if the behavior increases the attractiveness of goals and increases
followers’ confidence in achieving them. The Path-goal Theory continues on the premise
that the effective leader helps followers achieve goals by coaching, guiding, encouraging,
motivating, and rewarding followers for their efforts and achievements (House, 1996).
Transformational Leadership Theory
The Transformational Leadership Theory is often associated with charismatic
leadership, which is a reflection of the leader’s personal skills, personality, and presence.
Some of the personality characteristics of a charismatic leader include being dominant,
having a strong desire to influence others, being confident with his or her skills, and
having strong values. Behaviors that are indicative of such a leader include being a
strong role model, continually showing competence, having the ability to articulate goals,
having continual communication of high expectations of followers, and having the ability
to arouse individuals’ motives (Northouse, 2004). Using these characteristics, the leader
influences followers to adopt the goals, vision, mission, or sense of purpose of the
organization for the good of the group (Howell & Costley, 2006).
Transformational leadership involves four components: (1) idealized influence;
(attributed and behavioral); (2) inspirational motivation; (3) individualized consideration;
and (4) intellectual stimulation (Howell & Costley, 2006; Bass, 1997; Avolio et al.,
1991).
1. Idealized influence – Attributed: the social charisma of the leader, focusing on whether or not the leader is perceived as competent, self-confident, and committed to higher-order ideals and ethics. Behavioral: the actions of the leader related to values, beliefs, and mission.
37
2. Inspirational motivation – leader’s behaviors, including articulating appealing visions, focusing followers’ efforts, and modeling appropriate behaviors to energize followers.
3. Intellectual stimulation – behaviors exhibited by the leader that assist the followers to view problems and issues they face from a new perspective.
4. Individualized consideration – the ability of the leader to be supportive and to show concern for his or her followers’ needs and well-being. Giving encouragement and compliments to improve the followers’ self-confidence falls into this component.
5. Transformational leadership is concerned with followers and group results. Emotions by the leader and followers clearly influence results and performance (Howell & Costley, 2006). Transformational leadership will get followers to identify with the values and beliefs of the leader, group, and organization. Followers of transactional leadership have increased self-efficacy and have developed better critical thinking skills; they exert extra effort for task performance. Additionally, these individuals typically work more cohesively in a group (Howell & Costley, 2006).
The four characteristics that Avolio and Bass identified as stimulating and engaging
followers, known as the four “I’s,” were further defined by Avolio, Waldman, and
Yammarino (1991). The four “I's” of Avolio and Bass’s (1997) model of
transformational leadership include:
Individualized Consideration – gives personal attention to others, making each individual feel uniquely valued.
1. Intellectual Stimulation – actively encourages a new look at old methods, stimulates creativity, encourages others to look at problems and issues in a new way.
2. Inspirational Motivation – increases optimism and enthusiasm, communicates high expectations, and points out possibilities not previously considered.
3. Idealized Influence – provides vision and a sense of purpose; elicits respect, trust, and confidence from followers.
Transformational leaders engage followers by using one or more of the four "I's" in their
leadership techniques.
A leader who shows idealized influence characteristics is the one who can be
trusted, admired, and respected. The needs and desires of the followers are at the
38
forefront of the leader’s consideration. Idealized attributes include: setting the example;
going beyond self interests for the good of the common goal; building and maintaining
respect; sharing highly idealized standards, instilling pride in others and sharing a sense
of confidence and power with the followers. The idealized leader will talk about his or
her beliefs and value system. The idealized leader is very concerned with the ethical and
moral consequences of his or her actions.
Inspirational motivation is the ability to bring meaning and challenge to the work
process. The inspirational motivator is able to get his or her followers to think about the
future and its possibilities. Vision, enthusiasm, foresight about goals and mission, and
the ability to express these with the followers are all behaviors characteristically shown
by an inspirational motivator. This leader will work to motivate and inspire his or her
followers to obtain superior results. Thinking, problem-solving, and looking at problems
from different angles are encouraged (Avolio & Bass, 2002). A leader may use
intellectual stimulation to encourage creativity and innovative thinking. The leader who
tries to create a safe and pleasant environment in which followers feel comfortable in
sharing new ideas is high in the intellectual stimulation leadership technique. This type
of leader will often surround himself with others who work well together as a team.
Leaders who act as mentors, teachers, and coaches, and who pay attention to the
needs of each person in order to be self-fulfilled in a safe, supportive climate, use the
technique termed individualized consideration. Individualized consideration means
understanding and sharing in other persons’ concerns and developmental needs and
treating each individual uniquely (Avolio & Bass, 2004). This technique matches the
abilities of the followers with the task needed completed.
39
Measuring Leadership Styles
The Multifactor Leadership Questionnaire (MLQ) is based on the Full Range
Leadership Model developed by Bernard Bass and Bruce Avolio (1997). The
questionnaire is a short and comprehensive survey of 45 items that measures a full range
of leadership styles. The leader/manager and his or her followers complete the
questionnaire. Completing the questionnaire typically takes about 15 minutes. It is
strongly predictive of leader performance across a broad range of organizations (Bass,
1997). The MLQ measures leadership styles, and designates behaviors ranging from
transactional leadership to transformational leadership, including laissez-faire leadership.
The MLQ measures individual leadership styles as being transformational,
transactional, and laissez-faire as well as scales of leadership. The MLQ was utilized to
measure elements or scales of transformational and transactional leadership of the
academic program leader. The MLQ measures characteristics of the behaviors of leaders.
These characteristics include: Individualized Consideration; Intellectual Stimulation;
Inspirational Motivation; Idealized Influence (attributed); and Idealized Influence
(behavior) associated with Transformational Leadership; Contingent Reward; and
Management by Exception (active); associated with Transactional Leadership;
Management-by-Exception (passive); which is a method of leadership associated with
either solving or preventing problems; and laissez-faire; an inactive form of leadership
characterized by a reluctance to become actively involved and a view that the best
leadership is to disassociate from the action known as laissez-faire leadership. The MLQ
also measures leadership outcomes. Leadership outcomes include: Extra Effort,
Effectiveness, and Satisfaction.
40
Contingent Reward and Management-by-Exception (active) make up transactional
leadership style. Contingent Reward is how the leader and followers exchange specific
rewards for outcomes or results. Goals and objectives are agreed upon by both the leader
and followers and the achievement is rewarded or punished. Management-by-Exception
(active) is when a leader makes corrective criticisms or uses negative reinforcement.
This leadership behavior monitors followers closely so they can point out mistakes and
errors.
Laissez-faire leadership has the scales of Management-by-Exception (passive) and
laissez-faire leadership. In this leadership style, the leader uses Management-by-
Exception (passive), which is only intervening when goals have not been met or a
problem arises. Laissez-faire behaviors are ones that delay decisions and give up
responsibility. Laissez-faire leaders offer no feedback or support to the follower.
Laissez-faire leadership is a “hands-off” approach to leadership (Northouse, 2001).
The following seven leadership scale scores measured by the MLQ represent
transformational, transactional and/or laissez-faire leadership:
1. Individualized Consideration - associated with transformational leadership
2. Intellectual Stimulation - associated with transformational leadership
3. Inspirational Motivation - associated with transformational leadership
4. Idealized Influence - associated with transformational leadership
5. Contingent Reward - associated with transactional leadership
6. Management-by-Exception – associated with transactional leadership, a method of leadership associated with either solving or preventing problems
7. Laissez-faire - an inactive form of leadership characterized by a reluctance to become actively involved and a view that the best leadership is to disassociate from the action
41
The MLQ measures a leader’s degree of possessing Contingent Reward leadership
attributes: Leaders engage in a constructive path to goal transaction and exchange
rewards for performance. These leaders clarify expectations, exchange promises and
resources, arrange mutually satisfactory agreements, negotiate for resources, exchange
assistance for effort, and provide commendations for successful follower performance.
Leaders with Management-by-Exception with “active” behaviors have characteristics of
monitoring followers' performances and taking corrective action if deviations from the set
standards occur. These leaders enforce rules to avoid mistakes. The Management-by-
Exception leader with a “passive” behavior would not intervene until problems become
serious. The Management-by-Exception leader (passive) waits to take action until
mistakes are brought to his or her attention.
Laissez-faire leadership is also measured by the MLQ. Laissez-faire leadership is
also termed a non-leadership style. The laissez-faire leader avoids accepting
responsibilities, is absent when needed, fails to follow up on requests for assistance, and
resists expressing his or her views on important issues. The laissez-faire leader gives the
majority of control in the decision-making process to the followers. With laissez-faire
leadership, the leader assumes that followers are intrinsically motivated and should be
left alone to accomplish tasks and goals. With laissez-faire leadership, the leader does
not provide direction or guidance.
Leadership Skills
A skill is a trait that has been developed by way of training or experience (Gregory,
1987). The U.S. Army (1973) developed 10 leadership skills to teach in order to become
a more proficient and effective leader:
42
1. Be technically proficient – as a leader, you must know your job and have a solid familiarity with your employees' tasks.
2. Seek responsibility and take responsibility for your actions – search for ways to guide your organization to new heights; and when things go wrong, they always do sooner or later - do not blame others; analyze the situation, take corrective action, and move on to the next challenge.
3. Make sound and timely decisions – use good problem-solving, decision-making, and planning tools.
4. Set the example – be a good role model for your employees; they must not only hear what they are expected to do, but also see; “we must become the change we want to see.” - Mahatma Gandhi
5. Know your people and look out for their well-being – know human nature and the importance of sincerely caring for your workers.
6. Keep your workers informed – know how to communicate not only with them, but also seniors and other key people.
7. Develop a sense of responsibility in your workers – help to develop good character traits that will help them carry out their professional responsibilities.
8. Ensure that tasks are understood, supervised, and accomplished – communication is the key to this responsibility.
9. Train as a team – although many so-called leaders call their organization, department, section, etc. a team, they are not really teams - - they are just a group of people doing their jobs.
10. Use the full capabilities of your organization – by developing a team spirit, you will be able to employ your organization, department, section, etc. to its fullest capabilities.
Abilities, competencies, or skills are general human capacities related to the
performance of tasks. They develop over time through the interaction of heredity and
experience, and they are long lasting (Desimone et al., 2002).
Clark (1999) categorized leadership skills and competencies into three groups.
Clark suggested that these three groups formed the basic requirements for becoming a
leader. The three groups consisted of Core or Essential Competencies, Leadership
Competencies, and Professional Competencies.
43
The Core or Essential Competencies group consists of communication, teamwork,
creative problem-solving, interpersonal, ability to manage client relationships, self-
direction, flexibility, the ability to build appropriate relationships, professionalism, and
financial skills.
These Core or Essential Competencies are further defined as:
• Communication Skills – the ability to express oneself effectively in both individual and group settings. The ability to communicate plans and activities in a manner that supports strategies for followers’ involvement. The ability to actively listen to others. The ability to express written ideals clearly, using good grammatical form, and finally being able to comprehend written material with little or no help.
• Teamwork – Uses appropriate interpersonal style to steer team members toward the goal. Has the ability to allocate decision-making and other responsibilities to the appropriate individuals. Is able to organize resources to accomplish tasks with maximum efficiency. Has the ability to influence events to achieve goals beyond what was called for.
• Creative Problem-solving – Identifies and collects information relevant to the problem or task. Uses brainstorming techniques to create a variety of choices. Has the ability to select the best course of action by identifying all the alternatives and then making a logical assumption.
• Interpersonal Skills – Treats others with respect, trust, and dignity. Works well with others by being considerate of the needs and feelings of each individual. Has the ability to promote a productive culture by valuing individuals and their contributions.
• Manage Client Relationships – Works effectively with both internal and external stakeholders. Gathers and analyzes feedback to assist in decision-making.
• Self-Direction – Establishes goals, deliverables, timelines, and budgets with little or no motivation from superiors (self-motivation rather than passive acceptance). Assembles and leads teams to achieve established goals with deadlines.
• Flexibility – Willingness to change to meet organizational needs. Challenges established norms and makes hard, but correct decisions. Has the ability to adapt to stressful situations.
• Build appropriate relationships – Networks with peers and associates to build a support base. Builds constructive and supportive relationships.
44
• Professionalism – Sets the example. Stays current in terms of professional development. Contributes to and promotes the development of the profession through active participation in the community.
• Financial – Does not waste resources and looks for methods to improve processes that have a positive impact on the bottom line.
These Core or Essential competencies are the foundation for leaders. Clark’s
(1999) next set of leadership skills consist of skills possessed by leaders that will take the
organization to a higher, more successful level.
• Leadership Abilities – Displays attributes that make people glad to follow. Provides a feeling of trust. Rallies the troops and builds morale when the going gets tough.
• Visioning Process – Applies effort to increase productiveness in areas needing the most improvement. Creates and set goals and visions. Senses the environment by using personal sway to influence subordinates and peers. Gains commitment by influencing the team to set objectives and buy into the process. Reinforces change by embracing it.
• Create and Lead Teams – Develops high performance teams by establishing a spirit of cooperation and cohesion for achieving goals. Quickly takes teams out of the storming and norming phases and into the performing phase.
• Assess Situations Quickly and Accurately - Takes charge when the situation demands it.
• Foster Conflict Resolutions (Win-Win) - Effectively handles disagreements and conflicts. Settles disputes by focusing on solving the problems, without offending egos. Provides support and expertise to other leaders with respect to managing people. Evaluates the feasibility of alternative dispute resolution mechanisms.
• Project Management - Tracks critical steps in projects to ensure they are completed on time. Identifies and reacts to the outside forces that might influence or alter the organization's goals. Establishes a course of action to accomplish a specific goal. Identifies, evaluates, and implements measurement systems for current and future projects.
• Implement Employee Involvement Strategies - Develops ownership by bringing employees in on the decision-making and planning process. Provides the means to enable employee success while maintaining the well-being of the organization. Develops processes to engage employees in achieving the objectives of the organization. Empowers employees by giving them the authority to get things accomplished in the most efficient and timely manner.
45
• Coach and Train Peers and Subordinates - Recognizes that learning happens at every opportunity (treats mistakes as a learning event). Develops future leaders by being involved in the company-mentoring program. Provides performance feedback, coaching, and career development to teams and individuals to maximize their probability of success. Ensures leadership at every level by coaching employees to ensure the right things happen. Ensures performance feedback is an integral part of the daily activities.
The skills Clark (1999) suggested that are required to make the leader successful
are termed Professional or Individual Skills. These skills include a working knowledge
of technical skills needed by the leader. Clark explained these skills are different from
one organization to the next and from one leadership position to the next. The leader
must have a basic understanding of the system he or she is working with in order to have
control over it. Clark suggested the following skills that leaders need to be effective and
successful:
• Business Acumen - Reacts positively to key developments in area of expertise that may affect his or her business. Leads process improvement programs in all major systems falling under area of control.
• Technical Competency - Completes tasks according to established standards. Understands and adheres to rules, regulations, and code of ethics.
The Boy Scouts of America, which is the largest youth organization in the United
States, has been regarded as a premier leadership organization. The Boy Scout program
encourages boys to learn and practice leadership skills. Understanding the concepts of
leadership helps a boy accept the leadership role from others and guides him toward the
citizenship aim of Scouting (Boy Scouts of America National Council website).
The 1981 edition of the Scoutmaster Handbook offers a list of leadership skills that
the youth, as well as the leaders of the Boy Scouts organization, should develop. These
leadership skills include: communication; knowing and using the resources of the group;
understanding characteristics and needs of the group; representing the group; setting the
46
example; planning; controlling group performance; evaluating; effective teaching;
sharing leadership; and counseling.
The leadership skills promoted in the Scoutmaster Handbook are similar in content
to those which Clark (1999) prescribed:
• Communicating - As a leader, one must get and give information. The leader must be able to do both of these well. Learn to take notes when there is a lot of detail. Ask questions after giving or receiving instructions. Get feedback to make sure the message gets through. Don't give orders; discuss things that are going to happen. Measure success in terms of the job getting done and the degree to which instructions are followed. Good communication fosters good morale; poor communication can bring mumbling and dissent.
• Knowing and Using the Resources of the Group - A leader has to depend on what the members of the group can do, as well as what the leader can do. In order to use these available resources, a leader must know what they are. Find out what they are by observing, asking the members, as well as other leaders. When you are using the resources of the group, others will lead, and the program will not be the result of your ideas alone.
• Understanding Characteristics and Needs of the Group - When this skill is used properly, a leader will give others what they need to grow--not what the leader thinks they need. Each person has certain strengths and weaknesses. When a leader understands individual needs, everyone benefits. The leader who applies this skill will meet the needs and desires of the followers.
• Representing the Group - This skill is leadership in action. Success can be measured by each Scout feeling he has a part in the decision-making process.
• Setting the Example - What you are speaks louder than what you say. The old saying "Do as I say, not as I do" will not work. You will lose valuable influence if you do not live up to the standards that you recommend or the ideals that you teach. People need a model to follow; their leaders may be the only good examples they know.
• Planning - The core of a successful program is planning. A successful program comes from planning. You cannot achieve Scouting's aims of building character, fostering citizenship, and developing fitness without good plans.
• Controlling Group Performance - The purpose of this skill is to control the performance of a group so that it will be successful in doing its job. Sometimes controlling group performance means you will have to stop behavior that negatively impacts the group, but everyone is happier if the group helps to control itself rather than depend on the leader to do all the controlling.
47
• Evaluating - Evaluating should be done both during and after every activity.
• Effective Teaching - This is not a new method of teaching, Scouting has used it since 1910. The difference today is we do not assume that just because we have taught that Scouts have learned. The proof lies in what they can DO. If they can do something, then you have successfully taught. The key is to actively involve the Scouts in the learning process by giving them choices as to what they can learn and by checking constantly to see what they have learned. Find out what they know, put them into a situation where they recognize the need to know, and then offer them the opportunity to learn. Place the emphasis on the learner, not on the teacher.
• Sharing Leadership or Styles of Leadership - With the responsibility of leadership goes trust. The effective leader must adjust his leadership style to fit the situation without giving up the responsibility for the welfare of the troop. The secret is to share the leadership. Allow everyone to join and share in the responsibility without giving up the role as a leader.
• Counseling - A leader must be able to counsel Scouts in order to help them. Listening is the most important key to counseling. Be careful not to give advice. Instead, use questions to help the individual arrive at his own solution to the problem. Feel free to give factual information but cautious about giving advice. A person grows if he is able to think problems through for himself. Be a facilitator, not a manipulator.
Yates (2005) comprised a study of women in leadership positions in public
educational facilities. Yates found through her qualitative study the leadership skills
leaders deemed most important. These leadership skills were:
• Communication skills – The ability to listen as well as to communicate verbally and in writing.
• A caring attitude – The ability to get everyone to work together for the benefit of the student (follower). The ability to care about those who will be affected should drive the decision-making process.
• Honesty, Integrity, Truthfulness, and Respect – Trust and respect must be earned through honesty and fairness--the character of a person.
• Visionary – A sense of purpose and vision. Having integrity, commitment, and the ability to recognize, appreciate, and develop skills of others to further the goals of the organization.
• People Skills – The ability to successfully interact with others.
• Intelligence – Being able to solve problems.
48
• Courage, Flexibility, and Experience – The ability to think through a situation. Taking time to listen, gather information, and make an effective decision in order to solve problems.
• Organizational Skills – Being able to handle a multitude of tasks on a daily basis. Being organized and having organizational skills.
• Sense of Humor – Being able to put everything into perspective and being able to deal with how others handle and react to different situations.
• Creating a Safe Environment – The ability to make followers feel like they have the opportunity to take risks.
Fourteen qualities or skills were named by the Anderson Consulting Institute for
Strategic Change (2000). The leadership qualities or named skills include:
1. Creating a shared vision;
2. Ensuring customer satisfaction;
3. Living the values;
4. Building teamwork;
5. Being able to think globally;
6. Appreciating cultural diversity;
7. Empowering people;
8. Anticipating opportunity;
9. Achieving a competitive advantage;
10. Being able to embrace change;
11. Sharing leadership;
12. Demonstrating personal mastery;
13. Showing technical savvy; and
14. Encouraging constructive challenges.
Maxwell (1999) listed 21 qualities that can be learned to encourage better
leadership and leadership practices. Maxwell posited that leaders are effective because of
49
whom they are on the inside, that is, their qualities. To go to the highest level of
leadership, people have to develop these traits (skills) from the inside out. Maxwell
examined “best” leaders and analyzed the characteristics of these leaders. Maxwell
looked for common themes among his “best” leaders and leaders who have had a
significant impact or left an impression on our history. Maxwell determined there were
21 qualities possessed by all great leaders and that these qualities can be learned and
developed:
1. Character – the essential nature of a person: integrity, fortitude, or reputation.
2. Charisma – the ability to draw people to you;
3. Commitment – having conviction; belief in a cause;
4. Communication – the ability to share knowledge and ideas; the ability to simplify a message, understand people, show the truth, seek a response;
5. Competence – qualifications to fulfill a task;
6. Courage – the willingness to take risks;
7. Discernment – the ability to discover the true issue or task, the ability to solve problems, and to evaluate options and maximize opportunities;
8. Focus – being able to set priorities and then concentrate on those priorities;
9. Generosity – giving to others;
10. Initiative – looking for opportunities and being ready to take action;
11. Listening – the ability to connect with people and to learn;
12. Passion – desires, a fire for something; wanting something badly;
13. Positive Attitude – having a positive outlook on life; expecting the best of oneself and others;
14. Problem-solving – being able to anticipate problems, finding out what others in the same situation have done, create possible solutions, and implement the best possible solution;
50
15. Relationships – the ability to work with people, relate with people, and have good interpersonal skills;
16. Responsibility – reliable or accountable; the ability to get the job done and willing to go the extra mile; driven by excellence and produce results regardless of the situation;
17. Security – the ability to provide a secure environment for followers. The ability to believe in others; the building up of followers;
18. Self-discipline – the ability to develop and follow priorities;
19. Servanthood – an attitude toward serving others, not oneself; putting others ahead of oneself; initiating service to other. Does not focus on rank or position; service motivated by love and concern for others;
20. Teachability - the desire to continually learn;
21. Vision – the ability to see and develop plans to meet other persons’ needs; the ability to gather resources that will assist in meeting goals and task completion.
Maxwell (1999) believed the development of these traits, qualities, skills, abilities, or
competencies will maximize personal leadership potential and effectiveness.
Kouzes and Posner (2002) developed five qualities or skills that should be
continually developed for optimum leadership:
1. Modeling the Way – find your voice by clarifying your personal values; set the example by aligning actions with shared values;
2. Inspiring a Shared Vision – envision the future by imagining exciting possibilities; enlist others in a common vision;
3. Challenging the Process – search for opportunities by seeking ways to change and grow; experiment and take risks;
4. Enabling Others to Act – foster collaboration by promoting goals and building trust; strengthen others by sharing power;
5. Encouraging the Heart – the ability to recognize contributions made by others; the ability to celebrate the values and victories by creating a spirit of community.
51
Followers desire these traits, qualities, or skills of their leaders (Kouzes and Posner,
2002). It is imperative that leaders work to increase their proficiency in these areas if
they truly desire to be more effective, successful leaders.
Katz (1955) categorized leadership skills into three categories. These categories
include: (1) technical skills; (2) human skills; and (3) conceptual skills. From this
researcher’s review of literature, it is easy to place the leadership traits, qualities, skills,
abilities, or competencies mentioned into one of these three categories.
Leadership traits, qualities, skills, abilities, or competencies of effective, successful
leaders show several commonalities. Effective, successful leaders exhibit planning skills.
Leaders who have the ability to identify causes, restrictions, and consequences of actions
and who tend to show higher performance and task accomplishment rates are deemed
successful. The literature reveals that leadership qualities, traits, skills, abilities, or
competencies can be classified into one of the following categories:
• Communication skills; • Human skills; • Technical skills; • Conceptual skills; • Emotional Intelligence skills; and • Industry Knowledge skills.
Leadership Skills Can Be Learned
Katz (1955) and Nahavandi (2000) supported the premise that leadership skills can
be learned. Goleman (1998) supported the idea that leadership skills can be developed
over time. His research reported emotional intelligence increases with age and
experience. Schreiber and Shannon (2001) believed it is imperative to recognize
individuals with certain leadership traits and infuse their career with specifically designed
52
training experiences. They believed that leadership development is a “life-long
endeavor.”
Educational institutions believe leadership skills can be taught. More than 800
(leadership) programs are located across American campuses today (DiPaolo, 2002).
Some leadership theorists have concluded that leadership skills are developed throughout
one’s career (Mumford et al., 2002). A leader’s skills develop with education, training,
and work experience (Howell & Costley, 2006). Howell and Costly has stated that
“improving your leadership skills takes persistence and self-discipline to put forth the
long-term effort needed for lasting change.” Kouzes and Posner (2002) concluded that
leadership is not a place, it’s not a gene, and it’s not a secret code that can’t be deciphered
by ordinary people. Kouzes and Posner stated that leadership is an observable set of
skills and abilities, and any skill can be strengthened, honed, and enhanced, given the
motivation and desire, the practice and feedback, and the role models and coaching.
Bennis and Nanus (1985) agreed that leadership capacity and competencies can be
learned. They asserted that all people have some natural leadership abilities and that
these abilities can be enhanced. These findings would appear to be supported by the
number of books, magazines, journals, and other material dedicated to the promotion of
leadership and leadership skill acquisition. For example, a quick Google search listed
“about 490,000,000” results, indicating there were more results that could be listed.
Yahoo listed “about 6,200, 000” results of only journal articles on leadership. In
addition, Yahoo listed, “about 38,400,000” books related to leadership. Leadership is a
popular subject. It appears that many individuals are interested in leadership and how to
become a better leader.
53
Land-grant Universities
Land-grant universities were established by Congress or a particular state’s
legislature to provide resources and funding set forth by the Morrill acts of 1862 and
1890. The original mission of the land-grant institutions was to teach agriculture,
military tactics, and mechanical arts, as well as classical studies, so that members of the
working classes could obtain a liberal, practical education (NASULGC, 2006).
The Morrill Act of 1862 established land-grant institutions due to the increased
demand for agricultural and technical education in the United States. Since higher
education was unavailable to many agriculture and industrial workers, the Morrill Act of
1862 was intended to provide a broad segment of the population with a practical
education that had direct relevance to daily lives (NASULGC, 2006).
Currently, land-grant institutions are located in every state and territory of the
United States, including the District of Columbia. Several states have more than one
land-grant institution. Additional institutions were established in some states as a product
of the second Morrill Act of 1890, which mandated African-Americans access to higher
education facilities. Additionally, four land-grant universities are located outside the
United States: in Micronesia, Northern Marianas, Guam, and Puerto Rico. Twenty-nine
tribal colleges were founded in 1994 and are also part of the land-grant university system.
The Hatch Act of 1887 and the Smith-Lever Act of 1914 worked together to
establish the land-grant three-part mission. This three-part mission of teaching, research,
and extension is the foundation for the current land-grant university mission. The
extension aspect of the land-grant mission was intended to bridge the college’s teaching
and research programming to the needs of the community.
54
Colleges of Agricultural and Life Science at Land-grant Universities
With the original intent of the land-grant colleges to be for education in the realm
of agriculture, the land-grant university grew and expanded around colleges of
agriculture. Still today, the main focus of colleges of agricultural and life sciences is to
support science and education related to agriculture, agriculture research, and agriculture
technology transfer (National Academic Press, Colleges of Agriculture at the Land Grant
Universities). The commitment of land-grant colleges of agriculture to higher education
was in sharp contrast to the orientation of most of the nation’s academic institutions of
the time (Meyer, 1995). Most higher education institutions emphasized philosophy,
theology, law, medicine, and the classics.
Each land-grant college deals with sciences basic to agriculture and agriculture
technology in three ways: teaching, research, and extension. First, colleges offer
educational curriculum for undergraduates and graduate programs. Second, through
scientific research, agricultural problems are solved. Third, each college of agriculture
maintains extension personnel to disseminate information to the public. Most faculty in
colleges of agriculture have some combination of responsibilities to include teaching,
research, and/or extension.
Today, less than 2% of all U.S. residents live on farms. The U.S. farm labor force
is comprised of only 3% of U.S. citizens. Nearly 75% of U.S. citizens live in urban and
suburban environments. The American public is concerned with how agriculture
production and processing activities interact with natural resources and the environment,
rural communities, consumer health, safety, and ethics (National Research Council,
1995).
55
Changes in the business of farming have forced colleges of agriculture to
continually modify their role in the educational system. Today’s farming industry is
based on science and technology (National Academic Press, Colleges of Agriculture at
the Land Grant Universities). Small-scale specialty farms have been replaced by large-
scale commercial operations. Additionally, changes in how the global marketplace and
economy have forced land-grant colleges of agriculture to re-examine their strategies of
instruction. Topics related to health, food safety, water and air quality, soil, water and
energy conservation, wildlife habitat, and open space are all associated with the
curriculum of current land-grant colleges of agriculture.
Colleges of agriculture from their foundations have accepted the responsibility to
serve the community by solving its perplexing problems (Bowden, 1962). The
Committee on the Future of the Colleges of Agriculture in the Land Grant University
System, established in 1993, had a mission to assess the land-grant colleges of agriculture
in regard to how they were positioned for the public’s changing needs and priorities. The
committee saw that the colleges needed to change in order to enhance their role in
serving the national interests. The conclusions and recommendations included an
assessment of the three components of the land-grant colleges of agriculture; teaching,
research, and extension. The committee identified four areas for change:
1. The need for greater relevance and accessibility through programs that embody an expanded view of the modern food and agricultural system and through inclusion of a wider array of students, faculty, and clientele of diverse backgrounds and perspectives.
2. The need to remove historic barriers and encourage research, teaching, and extension collaborations that cross disciplines, institutions, and states; to encourage faculty and student exchanges; and to make all programs in the system accessible to as wide a variety of stakeholders as possible--there is a firm need to create a “new geography” that cannot be confined to a locality.
56
3. The need for stronger linkages among the equally important functions of teaching, research, and extension, as well as the need to reinvigorate the college’s role as models of the land-grant concept and philosophy.
4. The need for heightened accountability and quality through competitive processes for funding, guiding principles for the use of public resources, and more regular and critical evaluations of publicly funded programs.
The committee also gave 20 recommendations to enhance the ability of the land-grant
colleges of agriculture to respond to these challenges.
The land-grant system has worked well but is currently undergoing a major era of
change. The changes the land-grant system must face deal with the modern realities,
challenges, and opportunities that impact society. Only those who look at agriculture in a
broad sense realize how vital it is to our society. Many Americans see only the negative
side of agriculture. These individuals fail to see the vital contributions that agriculture
makes to our society (Kellogg & Knapp, 1966). Kellogg and Knapp believed that as
agriculture becomes more technical, as its problems become more intricate, and as
agriculture and our society become more urbanized, the demands for more advanced
education increase.
Kellogg and Knapp (1966) outlined five broad missions or major responsibilities
and tasks for advancing and transmitting knowledge that fall within the province of a
college of agriculture. Kellogg and Knapp argued that as agriculture has broadened, so
has the role of college of agriculture, and therefore so should its mission. The five
missions or responsibilities that colleges of agriculture should pursue include:
• The use of science and technology of modern agriculture; • Dealing with rural people and their institution; • Dealing with environmental issues; • Dealing with urban and non-farm use; and • International agriculture.
57
A major area of change that land-grant institutions must face is the demographic
profile of its leadership. Baby Boomers (born between 1946 and 1964) are beginning to
retire, and without proper preparation of future leaders to take their leadership positions,
land-grant universities could be severely hampered in their ability to effectively manage
the forthcoming changes. Economic restraints, flattened organizational structures, a
national trend to reduce administration and a lack of resources of adequate training have
helped contribute to a shortage of qualified professionals with the necessary leadership
knowledge and skills to manage land-grant administrative roles (Austin, 1984;
Green,1981; Jackson, 2000; Lamborn, 1991). The future challenges that academic
program deans will face will be comprised of more than changing demographics and
filling teacher vacancies. The Kellogg Commission (2000), in its report titled Future of
State and Land-Grant Universities, reported higher education would be faced with a
more diverse pool of traditionally aged applicants, and financial inequality, which will
lead to concerns about access to individual educational opportunities.
Two concerns arise about the future of higher education: the distinction between
secondary and undergraduate education is narrowing, and the new technology is growing
and expanding at an amazing rate. The boundaries between the university, nation, and
world have all but been erased due to technological advances.
The Kellogg Commission continues with the challenge facing higher education
facilities: the urge to “privatize” public institutions. The commission found that research
is valued more for its commercial promise than for its ability to advance knowledge. The
commission also states that gender and ethnic diversity issues will continue to be issues
that higher education must face.
58
Kellogg and Knapp (1962) referenced challenges that colleges must face. These
challenges were aimed at students and the curriculum. Colleges, Kellogg and Knapp
contended, are going to need to provide a high quality, updated curriculum to their
students. Student diversity and changing demographics are going to have to be
acknowledged and addressed.
Meredith et al. (2002) showed that different age groups have different work ethics,
career aspirations, and goals. For example, the Generation X worker (those born between
1965 and 1980) has different career goals than the traditionalist, or the Baby Boomer.
Many of the Generation X faculty do not aspire to take administrative positions, wanting
a more balanced, flexible lifestyle from what they perceive as a demanding leadership
role. The findings of the research found, however, that Generation X was inclined to be
more entrepreneurial, and it valued lifelong learning. Those who belong to Generation X
were found to be more independent and viewed skill and competence as higher values
than positional power or authority. It is evident from these findings that deans who are to
lead higher education through these times of change are going to need communication
skills and the ability to develop relationships with diverse populations.
With today’s leaders facing a rapidly changing world of uncertainty in regard to
globalization and technology, future leaders are going to need the knowledge and skills to
solve problems in new and creative manners. Leaders can no longer rely on past
routines. Leaders will focus more on environmental trends and opportunities for
collaboration than for past policies, practices, or institutional history (Bennis, Spreitzer,
& Cummings, 2001; Kouzes & Posner, 2002).
59
A holistic approach to personal development of leadership is a process--not a quick
fix (Doh, 2003). To benefit from leadership development projects, Doh contended that
the leader must have the motivation, the capacity for strategic thinking, basic
communications skills, emotional intelligence, and a desire to learn, as well as a desire to
be a leader (Doh, 2003).
The leadership literature suggests that satisfactory leadership enhances the success
of the organization in meeting its goals. Since traditional public higher education was to
provide access to a wide range of curriculum and practical research for the people and
communities, how or will future leaders of higher education fulfill the traditional role, as
well as meet the new challenges they will face?
The Kellogg Commission believes today’s university will be a new kind of public
institution transformed in several ways by needing to be a first-rate student university, as
well as a research university. The university will work to reach the diverse student
population from the “global” community. The new changing university will promote
active life-long learning. In order for the university of tomorrow to meet the inevitable
change successfully, the commission believes higher education must publicly renew its
commitment to its founding principles. These principles include providing access to as
much education as possible for as many students as possible, regardless of ethnicity,
economics, or age. Higher education needs to apply research to communities, states,
national and international problems. Education of the highest quality must be the utmost
priority. The commission states that it is imperative to get highly qualified persons into
leadership positions in order to facilitate these changes.
60
The Role of the Dean
Trying to summarize the role of an academic program leader (dean) is difficult at
best (Walker, 2000). The role of the academic program dean is continually changing and
is often ambiguous. Present-day deans are required to possess skills and abilities that
their predecessors never imagined. Today’s dean may work in different areas or types of
higher education. The dean may work at various levels and in different capacities.
Defining a single role that a dean plays may be difficult. Dean Herbert Hawkes of
Columbia College stated, “There is no such thing as a standardized dean. There is a dean
of this and that college, but I have never seen any two deans who could exchange places
and retain the same duties.”
The role of the dean continues to change. As higher education changes, so does the
role of the dean. As a curriculum changes, so does the role of the dean. The higher
education environment or culture demands that change occur, and therefore the deans
must change with the times.
However, even with all the change that occurs in higher education, most people see
a universal role of a dean--and that is one of a leader. Within this leadership role the
dean needs to “perform service, be accountable, fulfill a moral role, act as a steward,
build diverse communities with trust and collaboration, and promote excellence”
(www.aacte.org).
The Changing Role of the Academic Program Dean
The position of the dean saw its greatest growth immediately after the Civil War
(Rudolph, 1990). As enrollment in higher education increased, so did the need for more
administrative staff. Prior to the Civil War, most schools had administrative staff
consisting of a president, treasurer, and librarian. Positions such as secretary of faculty,
61
registrar, vice-president, dean, dean of women, chief business officer, assistant dean,
dean of men, director of admissions, and administrative assistants were created as
enrollment grew. Rudolph’s (1990) research found that with the exception of the dean,
all new administrators worked with colleagues at other institutions in similar positions to
develop standards and procedures for their positions.
It was generally left up to the dean to develop his or her own job description.
These descriptions typically developed into relieving the president of tasks he did not
want to do. However, students viewed the dean as the “first response to the inevitable
tendencies of the organization institution; he was the human touch” (Rudolph, 1990).
Gould (1964) noted that in a 30-year span, the role of the dean had changed from
an “almost sole concern with students, through a phase when students and curriculum
were his largest responsibilities, to a period when curriculum and faculty demanded the
greatest part of his energies, and finally to a place where his major concern is the faculty
alone.” Today, however, the dean’s duties have changed once again from being almost
entirely student-focused to including a multifaceted array of roles, such as budgeting and
fundraising, personnel and work environment management, program oversight, and
external public relations (Wolverton, Gmelch, Montez & Nies (2001).
Robillard (2000) conducted a review of The Chronicle of Higher Education job
announcements and reported one description that stated: “Assume leadership
responsibility, curriculum planning and development, staffing, evaluation, and budgetary
administration.” Another job description listed these duties: “Assessment, development
of partnerships among internal and external constituents, and conflict management
62
skills.” The role of the dean is dependent upon the institution and the needs of the
institution.
Bragg (2002) found effective deans possessed high levels of competency in six
core knowledge areas:
1. Knowledge of the mission, philosophy, and history of the institution; 2. Learner-centered orientation; 3. Instructional leadership; 4. Information and educational technologies; 5. Assessment and accountability; and 6. Administrative preparation.
Deans should possess democratic leadership, creative management and finely tuned
human relationship skills (Bragg, 2002).
The leadership linchpin that holds an organization together lies midway between
those perceived as leaders and those upon whose work the reputation of the organization
rests. In universities today, academic deans fill this role (Wolverton et al., 2001). The
dean must always be considerate and conscientious of the future. The dean needs to be
considerate of the standards of the university. Deans need to be caring and
compassionate to student needs and concerns.
Colleges of agriculture have worked to strengthen the role of the dean (Kellogg &
Knapp, 1962). Today’s college of agriculture dean is usually the chief academic
administrator. Kellogg and Knapp found in their research of college of agriculture deans
that most deans who were successful in molding college-wide programs came to their
positions with a good general education and learned about administration on the job.
Kellogg & Knapp summed up the dean as being a vigorous leader dedicated to achieving
excellence in the college and in the agriculture of the state (Kellogg & Knapp, 1962). A
major facet of a dean is working with faculty in order to develop college-wide programs
63
(Kellogg & Knapp, 1962). The belief is that the dean needs to work with faculty and
staff to develop ideas on which future plans for the college can be based.
A Leader’s Role in Change
Today, leaders can no longer solve problems alone. In today's much more complex
world, problems call for the combined expertise of multiple resources and assistants. For
these reasons, strong emphasis is placed on promoting teamwork and strong leadership.
Today, due to the complex challenges created by globalization and technological
advances, it is imperative for organizations to solve problems and make the most of
available resources. Leaders must recognize the creativeness of all the organization's
members across multiple disciplines. Suggestions and ideas need to be implemented
quickly and efficiently. Leaders must promote collaboration and teamwork. In order to
facilitate change, leaders must respect each other's expertise and find ways to identify and
solve complex problems and challenges. The effective leader will be able to see
obstacles sooner than later.
To lead people through this process in an orderly manner, leaders will also have to
learn to become process leaders rather than relying solely on their content expertise.
Effective leaders recognize that they will not be able to solve all their critical challenges
alone and that assistance will lie within the faculty, and they will also have to involve
other people in taking responsibility for many of these key challenges. These leaders
may include their subordinates and employees, their peers, and perhaps even their
superiors. In order to use the thinking skills of other people, leaders will have to engage
them in the process of thinking innovatively and creatively, rather than telling them what
to do. When leaders concentrate on the process of continuously finding and solving
important problems, they concentrate on the process.
64
The successful leaders of the 21st century will be the ones who can lead their
organization and teams to make adaptability a routine way of business. This leadership
skill requires leading others to think innovatively and promoting the continual discovery
of new solutions. Getting people to work toward a common goal is not easy. The leader
must know when and how to synchronize the thinking of others. This ability includes
building skills in being a process leader--not only a content expert. People tend to lack
skills in problem-solving and divergent thinking, as well as the ability to create
innovative solutions to complex problems. Leaders can use their skills to help others to
work together to reach a common goal. Research shows that involving people in using
their creativity is itself motivating. By encouraging people to think for themselves, the
leader creates intrinsic motivation in their followers.
Good leadership fosters change that is both transformative and sustainable. It can be concerned with moral or organizational matters. It can define the college’s role in the world beyond its walls, or it can determine their internal dynamics of the institution. Most importantly, it requires a worthy goal-vision, if you will--but it also requires persistence. (Ekman, 2003)
While the dean’s role may be multifaceted from college to college or university to
university, there is one role that all deans must face: dealing with “change.” While
undergoing change, researchers have found that followers have to be empowered so that
they are willing to work for new change. Research suggests that leaders need to have
qualities that facilitate followers to transform from one situation to another, that is
transformational leadership (Shamir et al., 1993; Yukl, 1999). Transformational
leadership may motivate people to go beyond their own self-interest and to pursue goals
and values of the collective group. Effective leadership is central to change and, in
particular, to the ability to produce “constructive or adaptive change” as leaders “risk
disorder and instability as they seek out opportunities for change” (Bedeian & Hunt,
65
2005). Leadership requires the development of a vision, communication of that vision,
and the ability to set purpose or direction (Bedeian & Hunt, 2005).
Transformational leadership also involves the ability to inspire and motivate
followers. Research findings support the process-based approach to leadership. This
approach posits that a person is influenced by activating internal motivators. A process-
based view of leadership involves the ability to motivate followers to act, recognizing
that the ability to successfully influence others is the essence of leadership (Yukl, 1999).
The successful, effective leader has the ability to have his or her vision accepted, as well
as to motivate followers to work toward a common end (Chemers, 2001). Effective
leadership is enhanced when leaders can inspire their followers to accept change by
communicating a compelling vision of the future and motivating willingness to work in
the new manner. Leaders do not gain acceptance simply by dispensing resources to
employees. Giving people resources may have positive effects on their motivation in the
short term, but it will not be long lasting (Bess & Goldman, 2001).
Leaders must be sensitive to the fairness of their decision-making procedures. It is
also important that people receive decent and respectful treatment, that is experiencing
politeness and dignity from leaders. This interpersonal aspect of treatment is clearly
distinct from how decisions are made. Followers’ interactions with their leader are
distinct, and, they have a distinct influence on their acceptance of change. Polite and
respectful treatment is important because they communicate that followers have standing
or worth within the group, and they are respected and valued members of the
organization (De Cremer & Tyler, 2005a; De Cremer & Tyler, 2005b).
66
If followers believe their leaders are interested in their well-being, or care about
their needs and concerns, and are taking account of those issues when making decisions,
they are more accepting and willing to change. If, on the other hand, these inferred
qualities are missing, the followers will resist change.
Finally, it is important to provide followers opportunities to participate by having
the chance to present their arguments. Those arguments can then be considered and
incorporated into management decisions. Followers are more willing to accept change
when they have input in the change process.
Along similar lines, House's (1971) Path-goal Theory sees the successful leader as
someone who engages followers by reconciling their personal goals with those of the
group. Also, other leadership theorists have increasingly acknowledged that expectations
about leaders vary according to context. There may be value in examining how the
categorization process relates to the ongoing dynamics of the group and its interests
(Lord et al., 1999). Leadership is not simply a matter of leaders or of leaders and
followers. Leadership is the relationship between leaders and followers within a social
group (Haslam, 2001). Effective leadership is about supplying a vision, creating social
power, and directing that power so an individual can realize that vision.
An overarching theme of the leadership literature is the concept of change. Through
times of major change, effective leadership has been attributed to successful outcomes
(Hackman & Johnson, 1996; Yukl, 2002). The concept of change within the leadership
literature adds a dimension to leadership and supports the notion that leadership can be
regarded as a process.
67
Goal attainment is another issue that the study of leadership addresses. Within the
group, the leader influences or leads in the setting of direction or the attainment of goals.
Therefore, leadership involves directing a group toward some end point or accomplishing
some task. This direction includes defining and articulating a direction according to
external and environmental contingencies for the leader’s followers (Zaccaro & Banks,
2001). Transformational leadership theory includes the idea of inspirational motivation
as one way of encouraging followers to envision attractive future states (Bass, 1998).
The leader who expects to advance change must first have job “know-how.” He
must also be able to gain the respect of his colleagues and superiors. If a person has
embarked on a course of action for change, he will require the general capacity, for
example, leadership and management qualities to carry out such a task (Kirton, 1999). A
person’s ability to recognize and understand cognitive behavior will give him or her an
advantage by being able to anticipate events.
The Dean’s Role in Change
Leaders who can get followers to adhere to ambitious goals and high standards are
valuable. With the changing of times, trust becomes an issue between followers and
leaders. Faculty members may not believe that rewards for dedication to goals will be
forthcoming (Wolverton et al., 2001). The changing priorities of higher education also
reduce the potential for transformational leadership. The apparent transition of higher
education from a collegial to a managerial orientation is probably going to render the
possibilities for transformational leadership even less likely (Cameron & Ulrich, 1986).
Most business organizations with concrete goals and bottom-line mentalities engender a
"calculative" exchange norm (Etzioni, 1961). Universities are now also moving in that
direction, as chair–faculty relationships are increasingly based on quid pro quo rather
68
than collegial expectations. Faculty may be unwilling to take risks or even to be "good
citizens" unless there is a clear-cut reward in prospect (Organ, 1988).
Bess (2001) found "pockets" of transformational leadership. Smaller subcultures
generally reflect the prevailing values of the larger university culture in which they are
immersed, but there are occasional deviant groups. Some departments have long-lasting
cultures that have survived changes in institutional culture and climate. In these
instances, the culture allows common goals and objectives to move to the forefront, and it
allows for transformational leadership to induce creativity, productivity, and
organizational change.
Effective leadership in universities needs to be achieved by identifying leaders who
are able to understand the social, political, and moral changes that are intimately
implicated in the dynamic changes processes that their institutions are undergoing
(Chaffee & Tierney, 1988). Very few, if any, of the daily activities of a dean directly
relate to the educational programs of the school (Machen, 1995). The dean’s attitude,
however, has an enormous impact on what happens to an educational institution and its
programs (Chapman, 1998).
Traditionally, public schools in the United States are slow to change. As a
“system,” (Cohen, 1995) stated that it is almost impervious to change. University faculty
are concerned with personal, social, career survival, and also with achievement that
addresses deep-seated, human psychological needs for meaning and growth (Day, 1998).
A leader, who has the characteristics of charismatic or transformational leadership, will
be successful in leading his or her personnel. Leaders who are able to interpret, prepare,
and meet the external and internal pressures for change will be able to make workers
69
comfortable. These leaders will be successful in assisting their followers in working
toward achieving their organizations goals. Smircich and Morgan (1986) argued that
effective leadership results when the leader's definition and framing of a situation for
others serves as a basis for their actions.
Academic program leaders who are able to deal with the challenges and changes of
the university setting and are able to clarify meaning for their followers will be seen as
successful. A dean’s primary responsibility is to keep relationships balanced within his
or her college. The relationship between faculty, students, central administration,
external entities, and support agencies must be maintained by the dean (Wolverton et al.,
2001).
Deans often must engage in “innovative practices” in order to promote higher
education viability and improvement of the institution (Huffman-Joley, 1992).
Innovative practices require deans to become experts in how to change institutional
culture (Huffman-Joley, 1992).
According to Fullan (1993), three different types of change must be addressed
within an organization. The three types of change that deans face are changes in attitude,
change of structure, and change of process.
A dean must address a change in attitude when the organizational culture is
changed. With the continual reform of higher education without an attitude change, most
followers will be satisfied with the status quo (Wolverton et al., 2001). Change leaders
realize that organizations--and they themselves--must learn as they go (Bennis, 1999).
Deans must communicate and convince others that change is required and necessary, as
well as generating support for ideas and possibilities (Wisniewski, 1998). Deans must
70
encourage new ways of thinking and learning and help modify organization norms and
structures that impede change (Arends, 1998).
Some colleges of agriculture have lost their sense of urgency because they have not
looked far enough ahead (Kellogg & Knapp, 1962). Kellogg and Knapp contended that
good programs, which the colleges seek, can come best from self-study and positive
leadership. The National Research Council’s Committee on the Future of the Colleges of
Agriculture in the Land Grant University System recommended four changes that require
significant institutional leadership:
1. Integrate teaching and learning opportunities more fully with research and extension, for example, through involving undergraduates in research and enhancing the role and status of extension in academic programs.
2. Reduce barriers to multidisciplinary and interdepartmental approaches to teaching and learning, for example, through rewards for and recognition of team scholarship.
3. Develop long-term, comprehensive regional consortia to reduce duplication, differentiate course offerings, create inter-institutional faculty teams, capitalize on distance learning technologies, and broaden experiential learning opportunities.
4. Strengthen relationships with and build bridges to other units of the university, for example, by developing courses that fill general education requirements in the sciences and humanities and that place food and agricultural issues squarely in the scientific context.
These recommendations were developed to enhance accessibility and relevance,
organizational efficiency, institutional strengths, and accountability of land-grant colleges
of agriculture (National Research Council, 1996).
Deans have taken on a leadership role. This role places the dean in the position to
facilitate and manage change. As change agents, deans must possess the emotional
strength to support the organization as it undergoes change. The grounding for such
strength lies in a true understanding of the cultural dynamics and properties of the
organizational culture (Bennis, 1999). Deans who anticipate and directly confront
71
change may be more effective at what they do than deans who simply sit and hope that
the storm will pass (Wolverton et al., 2001).
Wolverton et al. (2001) proposed that deans need certain, specific strategies to
address the challenges they face. These strategies include:
• Creating a diverse culture; • Knowing the legal environment; • Becoming technologically connected; • Strategically managing and securing financial resources; • Seeking and maintaining professional and personal balance; • Nurturing the integrity of the college.
The complicated role of the dean underscores the importance of each of the issues
mentioned. If the dean is to be successful he or she must deal with the critical issues that
the strategies present.
For deans to implement change, they must educate themselves about how to
become a change agent. In order for deans to implement change, they must show that
change is valued, create an environment conducive to change, and understand how people
respond to change (Wolverton et al., 2001). Wolverton et al. (2001) contended that the
first step toward rebuilding institutional integrity rests entirely with deans. They must
determine where their goals lie and then let their actions reflect that belief.
The second step for deans to promote change is to promote a climate in which
change can occur. Deans must supply adequate resources and encourage faculty and staff
to become involved in the change (Singleton, Burack, & Hirsch, 1997). Deans can offer
support by providing office space, student assistants, release time, seed money, and
clerical support (Singleton, Burack, & Hirsch, 1997).
Finally, deans must recognize that different people respond to change in different
manners. Ramely (2000) suggested that people approach change in different manners:
72
• Committed change personnel – want and look forward to change; • Cautious change personnel – hesitant about change, want answers before
committing to change; • Skeptical change personnel – see no reason to change; • Resistant change personnel – fear the risk that change might bring, they know the
current system and are comfortable with it.
Deans need to recognize these different characteristics in the people who are
assisting them in the change process. To enhance the college’s integrity requires change.
Deans who understand change stand a better chance of bringing it about (Katzenbach,
1998).
Kirton Adaption-Innovation Inventory (KAI)
People understand and process information in different ways. Some people best
process information experientially and concretely and others more theoretically and
abstractly (Fedler & Silverman, 1988). People also use what they learn and understand in
different ways. Using their knowledge, some people prefer creating new options while
others prefer adapting options. Leaders who are unaware of such differences in learning
preferences will lack the tools or skills to communicate to their followers.
The basic tenant of Kirton’s Adaption-Innovation Theory is that a person’s
problem-solving style operates as a personality dimension. Kirton’s research indicated
that problem-solving orientation is considered a part of an individual’s personality. It is
hard to argue that the best organizations need able and creative members. Theoretically,
both adaptors and innovators are capable of providing quality solutions to complex
problems. An adaptor is a person who typically solves problems by making the situation
better. The innovator is one who solves problems by making the situation different.
Kirton’s research has shown that problem-solving is independent of one’s level of
creativity, as well as cognitive ability. Kirton’s Adaption-Innovation Inventory (KAI) is
73
a self-reported instrument that yields scores ranging between High Adaption to High
Innovation. The range of scores is 32 to 160, with a theoretical mean of 96.
Differences between Adapters and Innovators
The difference between an adapter and innovator is important for a leader to
understand. A person who is prone to solving problems in a more adaptive manner
prefers to address problems in a more structured format. The more innovative person is
less concerned about the structure of the problem-solving process.
Those individuals scoring as more adaptive, as measured by the KAI, approach
problems within the given boundaries, theories, rules, policies, structures, and strive to
provide "better" solutions. The adaptor is trying to build a better mousetrap. By contrast,
the more innovative problem-solver tries to separate the problem from the way it is
typically approached and begin solving the problem from there. The innovator builds a
new or different mousetrap.
Leaders today who are aware of the Adaption Innovation Theory realize the value
of having followers who approach solving problems in different manners. These leaders
are more tolerant and accept divergent ideas and solutions, as well as coming to
appreciate a diverse set of ideas.
Kirton's theory posits that the cognitive style exerts a strong influence on behavior.
Kirton believed that forcing people to work outside of their preferred behavioral style
will cause additional cognitive or mental work as well as stress.
Differences in an individual’s cognitive style, including a problem-solving method,
can result in problems of communication and understanding, which in turn can affect
productivity and teamwork.
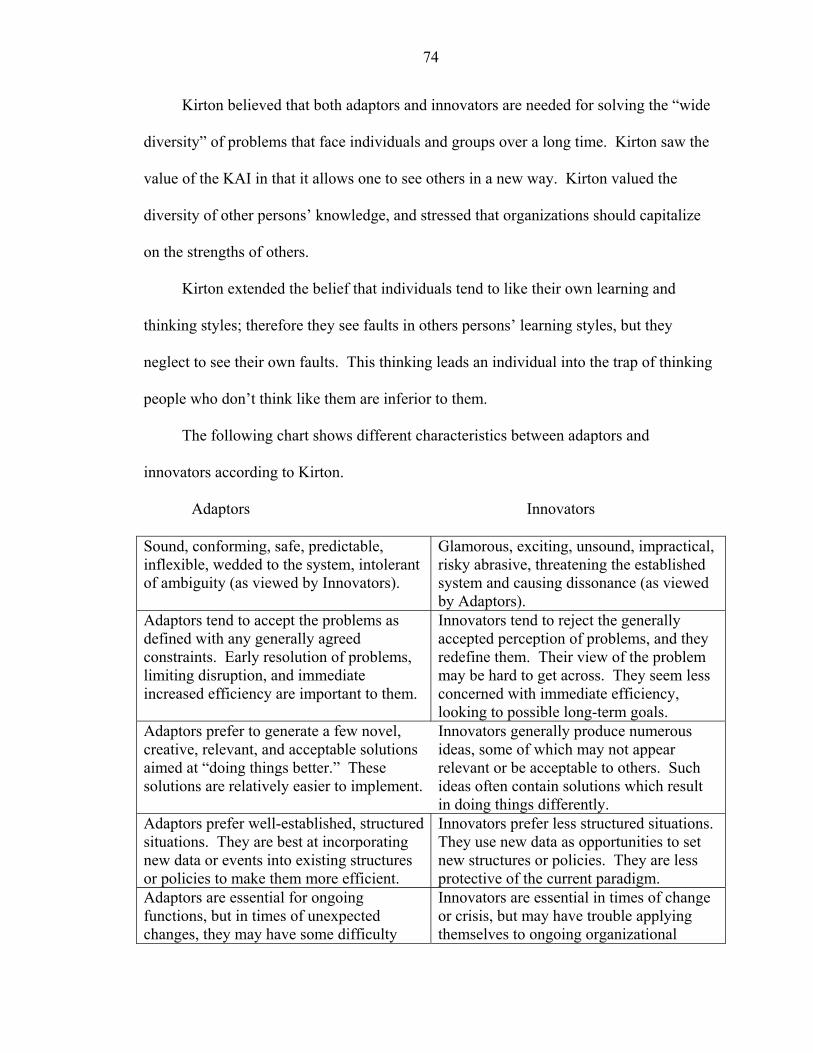
74
Kirton believed that both adaptors and innovators are needed for solving the “wide
diversity” of problems that face individuals and groups over a long time. Kirton saw the
value of the KAI in that it allows one to see others in a new way. Kirton valued the
diversity of other persons’ knowledge, and stressed that organizations should capitalize
on the strengths of others.
Kirton extended the belief that individuals tend to like their own learning and
thinking styles; therefore they see faults in others persons’ learning styles, but they
neglect to see their own faults. This thinking leads an individual into the trap of thinking
people who don’t think like them are inferior to them.
The following chart shows different characteristics between adaptors and
innovators according to Kirton.
Adaptors Innovators
Sound, conforming, safe, predictable, inflexible, wedded to the system, intolerant of ambiguity (as viewed by Innovators).
Glamorous, exciting, unsound, impractical, risky abrasive, threatening the established system and causing dissonance (as viewed by Adaptors).
Adaptors tend to accept the problems as defined with any generally agreed constraints. Early resolution of problems, limiting disruption, and immediate increased efficiency are important to them.
Innovators tend to reject the generally accepted perception of problems, and they redefine them. Their view of the problem may be hard to get across. They seem less concerned with immediate efficiency, looking to possible long-term goals.
Adaptors prefer to generate a few novel, creative, relevant, and acceptable solutions aimed at “doing things better.” These solutions are relatively easier to implement.
Innovators generally produce numerous ideas, some of which may not appear relevant or be acceptable to others. Such ideas often contain solutions which result in doing things differently.
Adaptors prefer well-established, structured situations. They are best at incorporating new data or events into existing structures or policies to make them more efficient.
Innovators prefer less structured situations. They use new data as opportunities to set new structures or policies. They are less protective of the current paradigm.
Adaptors are essential for ongoing functions, but in times of unexpected changes, they may have some difficulty
Innovators are essential in times of change or crisis, but may have trouble applying themselves to ongoing organizational
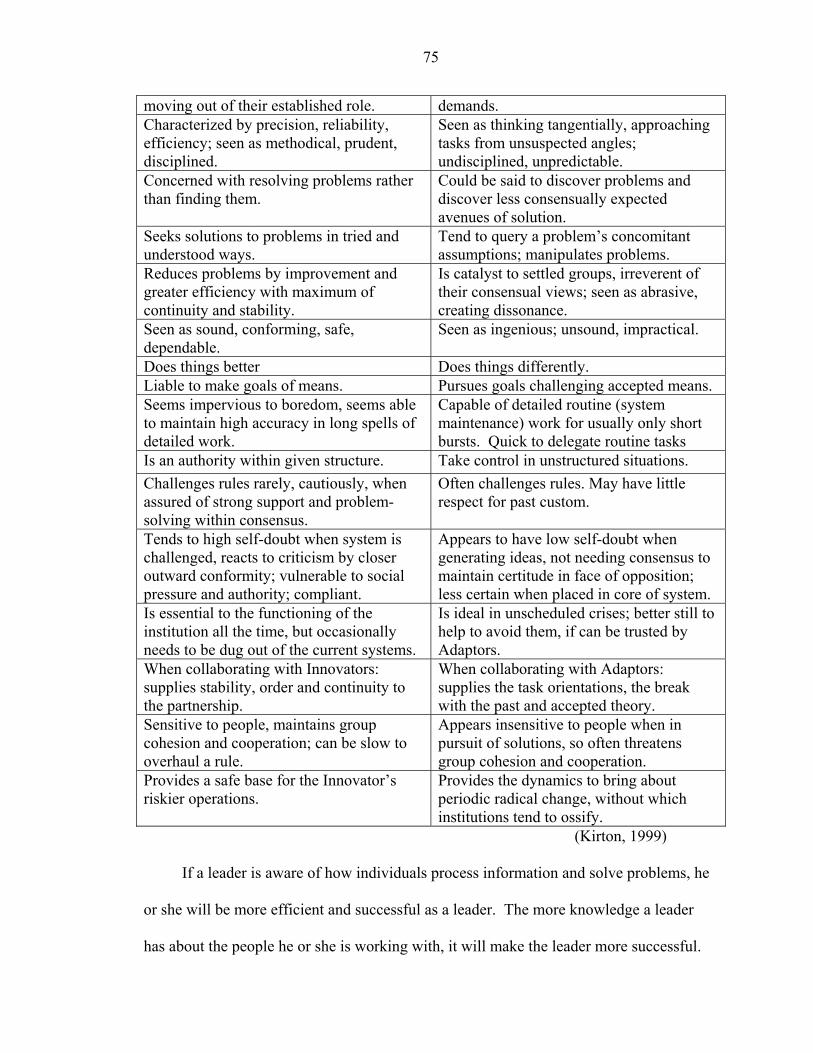
75
moving out of their established role. demands. Characterized by precision, reliability, efficiency; seen as methodical, prudent, disciplined.
Seen as thinking tangentially, approaching tasks from unsuspected angles; undisciplined, unpredictable.
Concerned with resolving problems rather than finding them.
Could be said to discover problems and discover less consensually expected avenues of solution.
Seeks solutions to problems in tried and understood ways.
Tend to query a problem’s concomitant assumptions; manipulates problems.
Reduces problems by improvement and greater efficiency with maximum of continuity and stability.
Is catalyst to settled groups, irreverent of their consensual views; seen as abrasive, creating dissonance.
Seen as sound, conforming, safe, dependable.
Seen as ingenious; unsound, impractical.
Does things better Does things differently. Liable to make goals of means. Pursues goals challenging accepted means. Seems impervious to boredom, seems able to maintain high accuracy in long spells of detailed work.
Capable of detailed routine (system maintenance) work for usually only short bursts. Quick to delegate routine tasks
Is an authority within given structure. Take control in unstructured situations. Challenges rules rarely, cautiously, when assured of strong support and problem-solving within consensus.
Often challenges rules. May have little respect for past custom.
Tends to high self-doubt when system is challenged, reacts to criticism by closer outward conformity; vulnerable to social pressure and authority; compliant.
Appears to have low self-doubt when generating ideas, not needing consensus to maintain certitude in face of opposition; less certain when placed in core of system.
Is essential to the functioning of the institution all the time, but occasionally needs to be dug out of the current systems.
Is ideal in unscheduled crises; better still to help to avoid them, if can be trusted by Adaptors.
When collaborating with Innovators: supplies stability, order and continuity to the partnership.
When collaborating with Adaptors: supplies the task orientations, the break with the past and accepted theory.
Sensitive to people, maintains group cohesion and cooperation; can be slow to overhaul a rule.
Appears insensitive to people when in pursuit of solutions, so often threatens group cohesion and cooperation.
Provides a safe base for the Innovator’s riskier operations.
Provides the dynamics to bring about periodic radical change, without which institutions tend to ossify.
(Kirton, 1999)
If a leader is aware of how individuals process information and solve problems, he
or she will be more efficient and successful as a leader. The more knowledge a leader
has about the people he or she is working with, it will make the leader more successful.
76
Knowledge and use of information related to the KAI allow the leader to: enhance
individual awareness; facilitate problem-solving in teams; and help resolve conflict
(Kirton, 1999). In addition, effective, successful leaders with KAI knowledge will be
more adept at bridging the gap between adaptors and innovators in the work place. This
knowledge in turn reduces power struggles and promotes teamwork (Kirton, 1999).
Kirton’s Adaption-Innovation Inventory (KAI) not only measures thinking style,
which is the process or means in which each individual solves problems, but it also
measures the creativity in which problems are solved. The KAI total score breaks down
into three sections: (1) Sufficiency of Originality (KAI-SO); (2) Efficiency (KAI-E), and
(3) Rule/Group Conformity (KAI-R). These three sub scores make up the total KAI
score.
The KAI-Sufficiency of Originality subscore distinguishes differences between
individuals and their preferred handling of original ideas. A more adaptive individual
tends to produce a fewer number of novel ideas, but these ideas are typically agreed to be
relevant, safe, and well thought, and/or useful. The innovative individual generates a
large number of ideas. These ideas are often “out of the box” and seem risky to others.
The innovative individual produces ideas seen by others as crossing boundaries and
breaking new ground. Many of these ideas are seen as likely to fail, even by the
innovative individual who conceived the idea.
The KAI-Efficiency subscore helps in explaining the differences of the preferred
method of solving a problem. The more adaptive individual will look at a problem more
closely than an innovative person. The adaptive person’s KAI-E score explains an
individual’s structure in problem-solving as being more methodical in the way he or she
77
analyzes a problem. A high KAI-E score individual works within the current system and
is more likely to get the system to work for him or her. The more innovative person will
trade the benefits of immediate efficiency and lower the risk of his or her decision by
paying less attention to the immediate structure of the problem and less attention to detail
and thoroughness. These individuals will get a broader picture of the problem and create
new ideas of handling the situation. Innovative individuals want to achieve their goals
often and not worry about details.
The KAI-Rules/Group Conformity subscore is responsible for the differences in
how an individual deals with the management structure where problem-solving occurs.
The more adaptive individual works within the rules of the organization. Adaptive
individuals accept the group norms and responsibilities and work for group cohesion.
The more innovative individuals have less respect for structure and organizational rules.
They work to solve problems regardless of group consensus and cohesion. The
innovative individual charges forward to bring about change. The innovative individual
often brings about rapid change at the expense of others.
Innovation and Adaptability in Organizational Change
In part, organizational change consists of innovations to improve the organization's
adaptation to the environment (Kraatz & Zajac, 2001, p. 634). Innovation is important for
preserving competitiveness and ensuring the organization's viability (Mumford et al.,
2002; Wolfe, 1994). Leadership behavior promotes the coordination of the activities
undertaken by members of the organization within its division of labor to attain certain
objectives of its own (Bass, 1990), such as promoting organizational innovativeness.
Leadership achieves this coordination by influencing the attitudes of the organizational
members, their behaviors, or both (Bass, 1990; Mumford et al., 2002; Northhouse, 2004;
78
Yukl, 2002). Most scholars of leadership acknowledge a link between leadership and
influence, as well as leadership and change.
Effective organizations, or those that enjoy sustained competitive edge, display two
specific characteristics simultaneously: efficiency and adaptability (Mott, 1972).
Efficiency allows an organization to implement and follow well-structured, stable
routines for delivering its product (goods and services). The efficient organization is able
to react quickly to unexpected turns of events that allow it to continue with minimal
disruptions in its daily routine (Mott, 1972). In today’s changing world, being able to
deal with daily routine is not enough. Successful organizations must be able to adapt to
the challenges and changes of each day. Adaptability allows an effective organization to
face changes deliberately and continually with minimal damaging consequences.
Adaptability requires looking outside the organization and anticipating new opportunities
and problems, trends, technologies, ideas, and methods to improve or change its routines
(Mott, 1972). In today's ever-changing organizations, leaders must promote not only
efficiency but also adaptability if they wish to remain effective.
Having the knowledge and ability to gain understanding of a situation determines a
leader’s innovation process profile. Understanding differences allows leaders to change
their own view to complement the innovation process preferences of others and to
include other persons’ ideas to reduce frustration within the organization. Understanding
these differences can also help with the interaction of the group in order to make best use
of all people and resources available. Effective leaders can help strong innovators
discover new problems and facts or present new problems and facts to them. They can
help strong adaptors better define challenges or present well-defined challenges to them.
79
Leaders can help adaptors evaluate and select from among solutions and make plans or
present evaluated solutions and ready-made plans. Alternatively, they can help strong
innovators to convince others of the value of their ideas and push them to act on them or
push their ideas through to acceptance and implementation for them.
Burns (1978) introduced the concept of transformational leadership, suggesting that
certain leaders can elevate their followers’ frames of reference, ideological
underpinnings, and attitudes toward self, peers, the organization, and society in ways that
go well beyond extracting performance commitment. The transformational leader appeals
to a higher order universal set of human needs that can be activated by virtue of the
natural proclivities of human nature to become self-actualized and self-organized. As
Yukl (1994) noted, transforming leadership can be viewed both as a micro-level
influence process between individuals and as a macro-level process of mobilizing power
to change social systems and reform institutions. At the macro-level of analysis,
transformational leadership involves shaping, expressing, and mediating conflict among
groups of people in addition to motivating individuals.
Bass (1998) contended that transformational leadership has four key components
reflecting four types of behavior that leaders need in order to facilitate change:
1. Charismatic leadership or idealized influence; 2. Inspirational motivation; 3. Intellectual stimulation – which encourages problem-reframing and creativity; 4. Individual consideration.
Bass (1998) believed transformational leaders may not show or exhibit these
behaviors at the same time. The transformational leader makes choices about how to take
advantage of his or her own and his or her followers’ abilities. Situational factors also
80
play a role in leadership decisions. Bass (1985) suggested that changing environments
encourage transformational leadership.
Bass noted that transformational leadership must overcome opposition to change.
Some organizations lend themselves to transactional leadership, partly because
transactional leaders are both recruited for this type of organization. Transformational
leadership requires a climate of trust. Followers must believe that the leader has their
interests at heart. Followers must feel that the leader's vision about the possible future,
promise, and fulfillment of the institutional mission is worthy of the followers’ attention,
commitment, and dedication.
The term transformational leadership implies that leaders "transform" either
organizations and/or their followers. Change is a typical precursor in most discussions
regarding transformational leadership. Conger (1999) suggested that the approach
emerged as corporations faced global competition, requiring them to radically reinvent
themselves. Public schools and universities face similar pressures to change.
Bass (1985) argued that transformational leadership is not likely to be found in the
American university, especially public universities, primarily because they are rule-
bound. Because transformational leadership depends on peer support for significant
organizational change, the diversity of faculty interests and orientations in typical higher
education institutions usually presents problems for leaders. Even though most higher
educational institutions group similar academic subject matters together in colleges, the
diversity of faculties, diversity of research interests, resource allocations, and personal
and professional goals tend to pull at the leader’s ability to be truly transformational.
Bass (1985) noted the "arousal" process in transformational leadership requires the use of
81
appealing, “symbols, images, and vision of a better state of affairs." It would take an
extraordinarily broadly educated and informed person to communicate effectively to each
faculty member (Bass, 1985).
Proponents of organizational change claim that charismatic and transformational
leadership are ways to achieve change in organizations (House & Aditya, 1997). Some
researchers of leadership argue that leadership is the ability to produce change (Conger &
Kanungo, 1998).
Innovative vs. Adaptive Leaders
Trice and Beyer (1990, 1993) theorized that leaders who maintain cultures (work
environments) are similar in some ways and differ in other ways from leaders whose
leadership produces cultural innovations (change). They contended that the two types of
leaders are similar in many of their behaviors, but differ in terms of some of their
personal qualities, their vision and mission, the type of performance they produce, and
their administrative actions. For example, they suggested innovative leaders are self-
confident and dominant, and adaptive leaders have confidence in their followers and
possess facilitative skills.
Trice and Beyer (1990, 1993) stated that innovative leaders see themselves as
evangelists in preaching new ideas, while adaptive leaders serve as catalysts for other
persons’ ideas. Trice and Beyer also thought that the reaction to the leadership situation
was different for the two types of leaders. They believed that innovative leadership is a
response to crisis and advances a radical ideology. More adaptive leadership occurs in
situations where there is no perceived crisis or the crisis or problems that are present are
seen as manageable. Followers’ beliefs about leaders differ for these two types of
leadership. Innovative leaders are seen by followers as possessing extraordinary qualities
82
needed to deal with the crisis or challenge. Adaptive leaders are seen as representing
existing values that were successful in the past.
Tichy and Devanna (1990) reported transformational leaders recognize the need for
change. These leaders would be able to create a new vision and bring about the required
change. They stated the characteristics of transformational leadership as:
• Being a change agent; • Having courage; • Believing in people; • Being value-driven; • Being a life-long learner; • Having the ability to deal with “complexity, ambiguity, and uncertainty”; • Being visionary.
Influence of Demographics on Leadership Skills
When discussing leaders and the study of leadership, it is important to evaluate the
variables influencing the study. The independent variables involved in this study include
gender, ethnicity, age, highest college degree earned, type of degree earned, tenure in
position, and leadership training.
Gender Differences in Leadership
Studies have noted that the traits associated with traditional leadership are
masculine. Men or women can display them, but the traits themselves, such as
individualism, control, assertiveness, and skills of advocacy and domination, are typically
masculine traits (Acker, 1990). In contrast, the traits associated with new leadership
tend to be more feminine. These traits characterized as being more feminine include
empathy, community, vulnerability, and skills of inquiry and collaboration (Acker, 1990).
Eagly et al. (2003), in their meta-analysis of 45 studies, found that women tend to
use transformational leadership styles more often than men, that is, women use a more
83
participative and inclusive style of leadership behaviors. In their analysis, they found
men used a more directive and controlling style, that is, a more transactional style of
leadership. Eagly et al.’s findings are supported by other research that concludes men in
general, are more likely to use a transactional leadership style, and women are more
likely to use a transformational leadership style (Rosener, 1990).
In a study of leadership among county extension faculty, middle, managers, district
directors, county extension directors, and program leaders, Holder (1990) concluded that
gender was not significantly related to leadership style. Moore (2003) found gender did
not significantly influence transactional or transformational leadership style in her
research of state directors and administrators in the cooperative extension system. These
findings were also supported by Stedman (2004), who made similar conclusions in her
study of volunteer administrators, volunteer specialists, and county faculty.
Characteristics typically thought of as being more feminine include ones that
primarily are concerned with the welfare and relationship building with other people.
These characteristics include the ability to show affection, being helpful, kind,
sympathetic, interpersonally sensitive, nurturing, and gentle. In contrast, the
characteristics most closely associated with men describe them as being primarily
assertive, controlling, and confident.
Typically, more masculine traits include a tendency toward being aggressive,
ambitious, dominant, forceful, independent, self-sufficient, self-confident, and prone to
act as a leader. But other types of attributes are also differentially credited to women and
men (Deaux & Lewis, 1983).
84
Boatwright and Forrest (2000) suggested women prefer more relationally oriented,
worker-centered leadership behaviors than their male counterparts. Their findings
support other research that found women value the more relational (transformational)
aspects of their work environment than men do (Elizur, 1994; Pryor 1983). Boatwright
and Forrest suggested that their findings in the difference between men and women’s
preferences in leadership behaviors were statistically significant but not necessarily
meaningful. Boatwright and Forrest suggested men may be becoming more interested in
more transformational leadership behaviors and their ability to use them successfully.
Helgesen examined how female leaders made decisions, gathered and dispensed
information, delegated tasks, and structured their organizations, as well as how they
motivated their followers. She concluded that women were more interested in building
relationships, and sharing information, while their male counterparts were more
interested in task completion, achieving goals, getting and keeping information, and
winning (Chliwniak, 1997). In a study of Tennessee school directors, Yates (2005) found
that women scored high in the five transformational leadership factors, as reported by
their completion of the Multifactor Leadership Questionnaire (MLQ).
The ideal leader is one who is androgynous (Rosen, 1996), having both a masculine
and a feminine side. Rosen asserted that traditional, masculine characteristics of
decisiveness and accountability should be blended with collaboration and open
communication, which have typically been associated with feminine characteristics.
Research conducted by Wylie (1996) named physiological differences in females
allowing for gender specific strengths:
• Women’s brains may allow women to think more nonlinearly – allowing for women to consider more possibilities when problem-solving;
85
• Women’s brains have more connective tissue between the two brain hemispheres which may allow women more interaction between the two sides of the brain during the thought process;
• Women may also tend to have a more innate ability to receive sensory data.
Reviewing the literature allows several conclusions to be made in regard to gender
and leadership. First, men and women approach and react to their leadership roles
differently. Second, men and women have certain characteristics that best fit their
respective leadership style. Some men and some women are able to interchange gender-
specific leadership characteristics, depending on the situation and need.
Ethnicity and Leadership
We know that prototypes of ideal leaders differ among individuals from different
nations (Brodbeck et al., 2000; Dorfman & Hanges, 2000). For instance, team orientation
plays a more important role in ideal leader prototypes in Latin American countries than it
does in English-speaking countries (House et al., 2002).
Chliwniak (1997) stated, “Until recently, scholarship on leadership continued to
use the white male as the exemplar of leadership style and characteristics.” Fortunately,
times are changing and more research has been conducted to determine leadership
characteristics of diverse populations. Research has shown that gender and ethnicity
influence organizational processes, such as leadership and work attitudes (Bartol, Evans,
& Stith,1978; Eagly & Johnson, 1990).
The effectiveness of charismatic and contingent reward leader behaviors has
generally been supported across cultures although there are some differences (Bass, 1997;
Den Hartog et al., 1999; Dorfman, 1996). Charismatic behaviors, which include
providing followers with a favorable vision or mission, having confidence in followers
and making inspirational speeches are particularly effective in some cultures. The
86
contingent reward leader behaviors that involve providing favorable rewards for
followers when they perform well work well in other cultures.
Studies have not shown that ethnicity and the ability to lead successfully are
related. Research has recently shown more minorities entering leadership positions than
ever before, possibly be attributed to laws to advance diversity in the workplace.
Leadership studies, which support a relationship between leadership skill and style
and ethnicity, are difficult to find. In this review of literature, it was determined that
ethnicity and race played a role in the opportunity to possess leadership positions, but
failed to provide empirical evidence toward success or ability based on ethnicity.
Studies by Bass, Burger et al. (1979), which related the five most and least
important leadership traits required by leaders in management positions from 12 different
countries, found significant differences in the 3,401 leaders in many of the traits
attributed to leadership styles. The researchers found being systematic was judged to be
of high importance in Italy, Spain, Portugal, and certain countries in South America.
Leaders in the United States and Britain believed being resourceful was an important
leadership trait. Holland, Belgium, Italy, Spain, Portugal, Latin America and India all
thought the abilities to be social and build relationships should be high priorities for
leaders.
Kouzes and Posner (2002) found that most followers rate trust in the leader as a
very important leadership trait. Early studies by Williams, Whyte, and Green (1966)
found that many nationalities have different views on trust and their ability to trust their
leaders. This trust was founded on historical events of past leaders. Italians, for
87
example, were found to have difficulty trusting their political leaders. This study also
found Peruvians’ overall trust level in their leaders to be generally low.
Sadler and Hofstede’s (1972) research of IBM leaders found that Australians,
Britains, Brazilians, and Japanese preferred a more consultative type of leadership.
However, Brazilians were found to have a much higher preference for participative
leadership. Bass (1975) found similar results when he gathered data from the United
States, Spain, Sweden, Finland, and Italy. Bass (1975) found participative leadership is
preferred across the board by all nationalities.
In conclusion national boundaries (ethnicity) make a difference in the speed of
promotion of leaders, as well as in their goals, risk preferences, pragmatism, interpersonal
competence, effective intelligence, emotional stability, and leadership style (Bass, 1981).
Stedman (2004) found that race predicted the transformational leadership style of 4-H
county faculty. These findings were similar to what Davis (1982) reported: Black leaders
were cited as using more transformational behaviors than White leaders.
Bass (1997) and House et al. (1998) asserted that some of the variance in leadership
theory and behavior is universal and some is contingent on the culture of the country and
organization. In other words, certain leadership practices are universally independent of
culture, and some leadership practices are dependent on culture (Bass & Steidlmeier,
1998).
Age and Educational Level
Several studies have shown that age and educational levels influence the preference
of leadership behaviors (Neil & Kirby, 1985; Stinson & Robertson, 1973). These studies
found that younger workers preferred a more transformational or worker-centered
relationship with their leaders. Boatwright and Forrest (2000) reported similar findings
88
in younger and less educated workers who were more likely to prefer worker-centered or
transformational leadership behaviors.
The more education one has, the research suggests, the less likely they are to prefer
structured, task-oriented leadership styles (Boatwright & Forrest, 2000). Bass (1981)
reported leaders surpass followers in the areas of grade point average and overall
intelligence. A leader’s ability or willingness to accept innovation or change, which is a
transformational behavior, is related to his or her educational level (Hambrick and
Mason, 1984).
Type of Degree
No literature has shown how the type of scholarly degree (bench science vs. social
science) might affect leadership skills and styles. However, from reviewing the literature
on leadership behaviors and general characteristics of professionals in each of the
respective sciences, it is possible to make some general statements.
The Merriam-Webster Dictionary defines natural (bench) science as: (1) any of the
sciences (as physics, chemistry, or biology) that deal with matter, energy, and their
interrelations and transformations or with objectively measurable phenomena. Merriam-
Webster defines a social science as: (1) a branch of science that deals with the institutions
and functioning of human society and with the interpersonal relationships of individuals
as members of society; and (2) a science dealing with a particular phase or aspect of
human society. Often social science is called a behavioral science that studies human
interactions and why humans act the way they do. Natural sciences, on the other hand,
study mostly plants and animals or the non-living.
Using these two broad and general descriptions of natural (bench) and social
sciences, some generalizations might be made as to how they relate to leadership and
89
leadership skills. Transactional leadership characteristics tend to emphasize the
transaction or exchange of what the leader requires or expects for certain rewards if the
followers fulfill their commitment.
Transformational leaders tend to motivate others in four ways to do more than they
originally intended and often even more than they thought possible (Avolio & Bass,
2002). First the transformational leader must build a relationship with his or her
followers in order for the followers to be able to identify with their leader. Second, the
transformational leader is able to inspire followers with meaningful pleas and persuasion.
Third, the transformational leader creates an atmosphere with his or her followers that is
intellectually stimulating. Fourth, the transformational leader is considerate, providing
the followers with support, mentoring, and coaching (Avolio & Bass, 2002).
Tenure in Position
Hambrick and Mason (1984) reported that leaders in organizations for extended
periods are less likely to initiate or follow change. These findings were supported by
Krishnan and Park (1998).
Theoretical Framework
The literature identifies the variables of gender, ethnicity, age, and tenure in the
profession, as well as previous leadership experience and training, as having influences
on the leadership style of leaders. The literature also suggests that certain characteristic
demographic variables, such as age and individuals’ experiences, can affect leadership
skills. For example, background, education, tenure with an organization, tenure in a
leadership position, and past leadership training may influence a person’s leadership
skills.
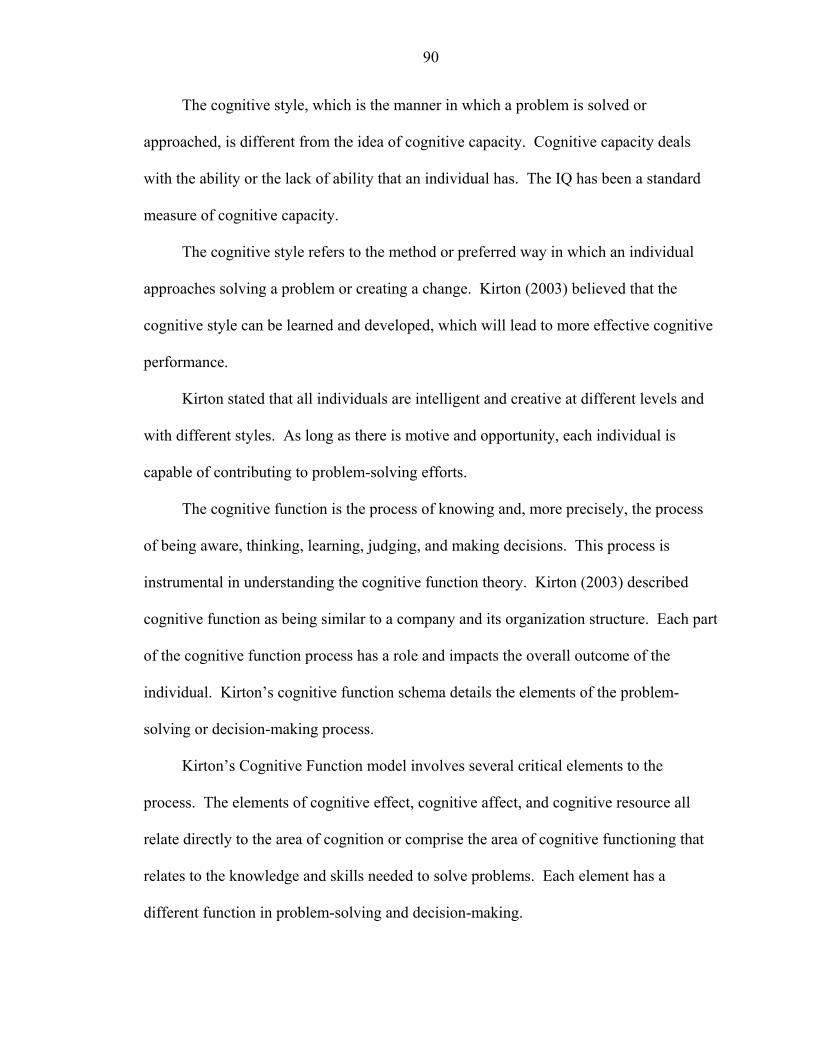
90
The cognitive style, which is the manner in which a problem is solved or
approached, is different from the idea of cognitive capacity. Cognitive capacity deals
with the ability or the lack of ability that an individual has. The IQ has been a standard
measure of cognitive capacity.
The cognitive style refers to the method or preferred way in which an individual
approaches solving a problem or creating a change. Kirton (2003) believed that the
cognitive style can be learned and developed, which will lead to more effective cognitive
performance.
Kirton stated that all individuals are intelligent and creative at different levels and
with different styles. As long as there is motive and opportunity, each individual is
capable of contributing to problem-solving efforts.
The cognitive function is the process of knowing and, more precisely, the process
of being aware, thinking, learning, judging, and making decisions. This process is
instrumental in understanding the cognitive function theory. Kirton (2003) described
cognitive function as being similar to a company and its organization structure. Each part
of the cognitive function process has a role and impacts the overall outcome of the
individual. Kirton’s cognitive function schema details the elements of the problem-
solving or decision-making process.
Kirton’s Cognitive Function model involves several critical elements to the
process. The elements of cognitive effect, cognitive affect, and cognitive resource all
relate directly to the area of cognition or comprise the area of cognitive functioning that
relates to the knowledge and skills needed to solve problems. Each element has a
different function in problem-solving and decision-making.
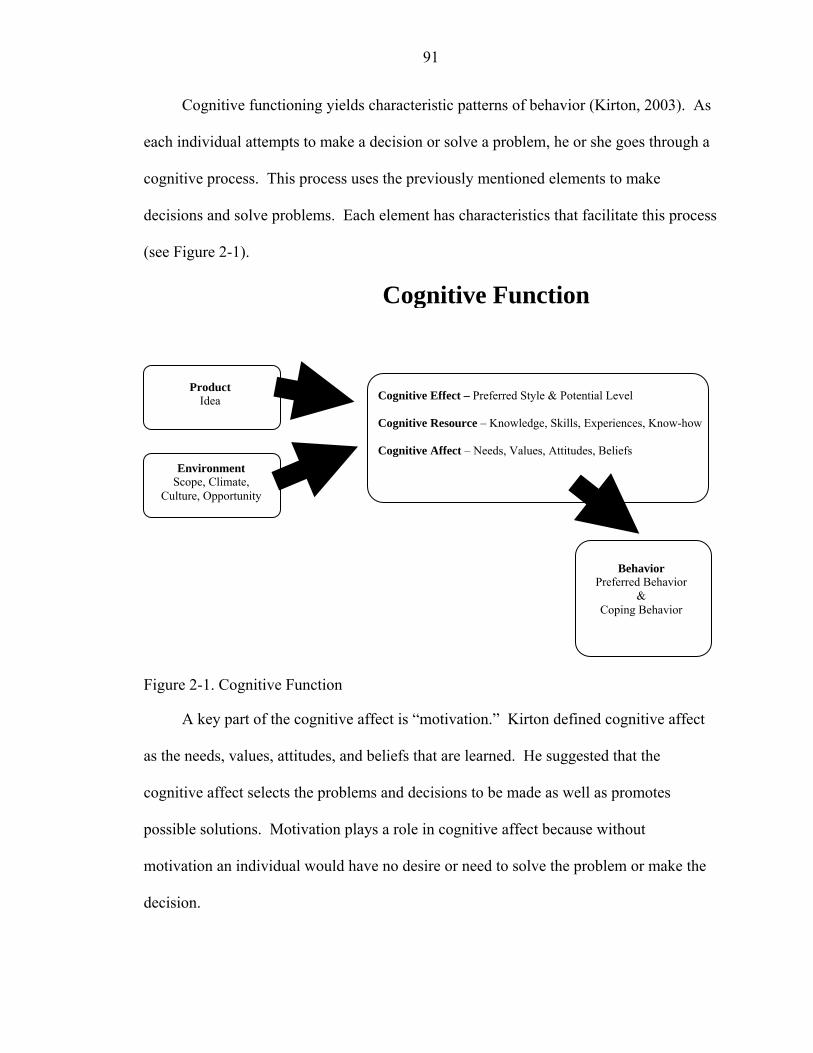
91
Cognitive functioning yields characteristic patterns of behavior (Kirton, 2003). As
each individual attempts to make a decision or solve a problem, he or she goes through a
cognitive process. This process uses the previously mentioned elements to make
decisions and solve problems. Each element has characteristics that facilitate this process
(see Figure 2-1).
Figure 2-1. Cognitive Function
A key part of the cognitive affect is “motivation.” Kirton defined cognitive affect
as the needs, values, attitudes, and beliefs that are learned. He suggested that the
cognitive affect selects the problems and decisions to be made as well as promotes
possible solutions. Motivation plays a role in cognitive affect because without
motivation an individual would have no desire or need to solve the problem or make the
decision.
Product Idea
Cognitive Function
Cognitive Effect – Preferred Style & Potential Level Cognitive Resource – Knowledge, Skills, Experiences, Know-how Cognitive Affect – Needs, Values, Attitudes, Beliefs
Environment Scope, Climate,
Culture, Opportunity
Behavior Preferred Behavior
& Coping Behavior
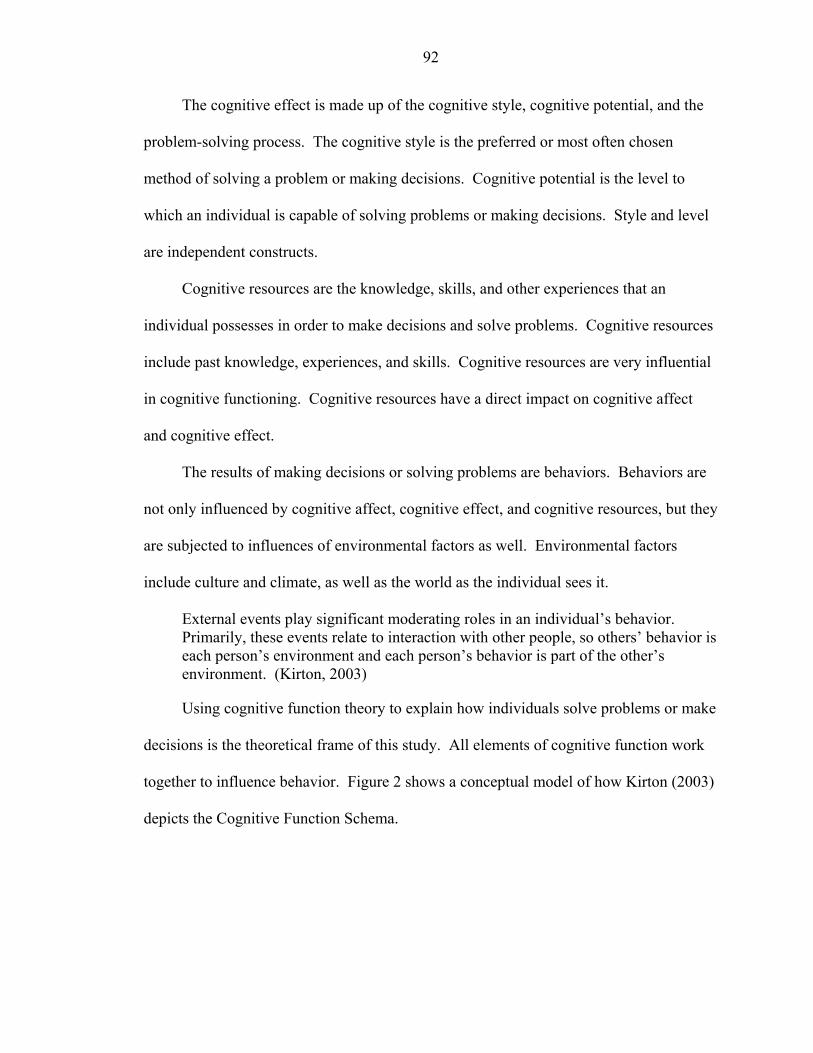
92
The cognitive effect is made up of the cognitive style, cognitive potential, and the
problem-solving process. The cognitive style is the preferred or most often chosen
method of solving a problem or making decisions. Cognitive potential is the level to
which an individual is capable of solving problems or making decisions. Style and level
are independent constructs.
Cognitive resources are the knowledge, skills, and other experiences that an
individual possesses in order to make decisions and solve problems. Cognitive resources
include past knowledge, experiences, and skills. Cognitive resources are very influential
in cognitive functioning. Cognitive resources have a direct impact on cognitive affect
and cognitive effect.
The results of making decisions or solving problems are behaviors. Behaviors are
not only influenced by cognitive affect, cognitive effect, and cognitive resources, but they
are subjected to influences of environmental factors as well. Environmental factors
include culture and climate, as well as the world as the individual sees it.
External events play significant moderating roles in an individual’s behavior. Primarily, these events relate to interaction with other people, so others’ behavior is each person’s environment and each person’s behavior is part of the other’s environment. (Kirton, 2003)
Using cognitive function theory to explain how individuals solve problems or make
decisions is the theoretical frame of this study. All elements of cognitive function work
together to influence behavior. Figure 2 shows a conceptual model of how Kirton (2003)
depicts the Cognitive Function Schema.
93
Figure 2-2. Cognitive Function Schema (Kirton, 2003)
Guided by Kirton’s Cognitive Function Schema as the theoretical frame, this study
proposed that leadership behavior, as evidenced by practiced leadership style (as
measured by the MLQ), of academic program leaders is a function of leadership skills,
leadership training, problem-solving style, value attributed to leadership skills, and
selected demographic variables.
Variables included in this study to explain an academic program leader’s leadership
style include: gender, ethnicity, age, tenure working at a college or university, tenure in a
formal leadership role, and leadership training. Additionally, this study used the variable
of proficiency of leadership skills, perceived beliefs of the importance of specific
Environment Scope, Climate,
Culture, Opportunity
Behavior Preferred & Coping
Behavior
Cognitive Affect Needs, Values,
Attitudes, Beliefs
Cognitive Effect Preferred Style
& Potential Level
Product Idea, Artifact
Motive
Learning and Memory
Cognitive Process
Cognitive Resource Knowledge, Skills,
Experiences, Know-how
Cognitive Function
94
leadership skills, and problem-solving ability to explain an academic program leader’s
leadership style as being transformational, transactional and/or laissez-faire. Explaining
the cognitive function of an academic program leader’s leadership style in terms of the
variables can be expressed by cognitive resources. These resources were measured by
self-perceived proficiency levels, and cognitive effect, which were measured using the
KAI and environmental variables. The variables are demographic in nature and cognitive
affect, which includes values, attitudes, and beliefs.
Cognitive resources are knowledge, skills, experiences, and know-how of the
academic program leaders. For this study, the cognitive resources include the academic
program leader’s self-perceived proficiency in the leadership skills, his or her college
courses in leadership, workshop training in leadership, and any other previous leadership
training.
Cognitive effects are an individual’s preferred style of problem-solving. For this
study, the KAI was used to measure problem-solving ability, as well as the academic
program leader’s sufficiency of originality (KAI-SO), effectiveness (KAI-E), and the
academic program leader’s response to following rules (KAI-R).
For this study, environmental factors include variables of scope, climate, culture,
and opportunity. Environmental variables, which this study included as predictors of
leadership style, were age, gender, ethnicity, tenure at the college or university, and
tenure in a formal leadership position.
The Leadership Style Behavior Indicator Model was adapted from Kirton’s (2003)
Cognitive Function Schema model. The purpose of the Leadership Style Behavior
Indicator Model is to assemble the components of Kirton’s model in a more linear
95
fashion. All the components of Kirton’s model are included in the Leadership Style
Behavior Indicator model. The Leadership Style Behavior model also denotes the
method in which the researcher measured each variable in this study.
A “Leadership Trigger” is at the top of the model. It is this trigger that starts the
leadership behavior of the leader. A need arises for leadership at this point. This trigger
could include a task to be accomplished or a goal or objective to be met.
At this point, the leader uses cognitive resources, cognitive effect, cognitive affect
and environmental variables to reach a leadership decision. Cognitive resources include
knowledge, training, skills, and past experiences. Cognitive resources are measured
through the use of the leadership skills inventory. Cognitive resources are a self-
perceived measure.
The next leadership variable is the cognitive effect, which includes the preferred
style of problem-solving. In this study, the cognitive effect is measured using Kirton’s
Adaption-Innovation Inventory. The cognitive affect includes attitudes, values, and
beliefs of the leader and is measured in this study using the leadership skills inventory
self-perceived proficiency score.
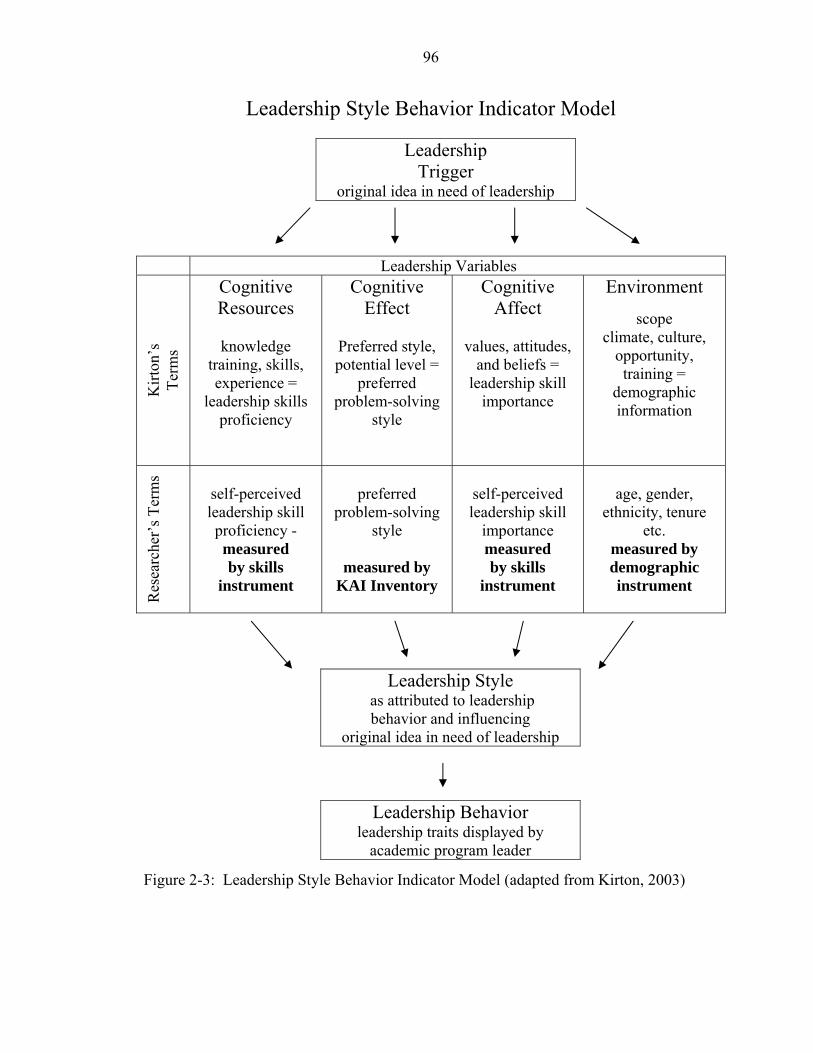
96
Leadership Style Behavior Indicator Model
Leadership Trigger
original idea in need of leadership
Leadership Variables
Kirt
on’s
Te
rms
Cognitive Resources
knowledge
training, skills, experience =
leadership skills proficiency
Cognitive Effect
Preferred style, potential level =
preferred problem-solving
style
Cognitive Affect
values, attitudes,
and beliefs = leadership skill
importance
Environment
scope climate, culture,
opportunity, training =
demographic information
Res
earc
her’
s Ter
ms
self-perceived leadership skill proficiency -measured by skills
instrument
preferred
problem-solving style
measured by
KAI Inventory
self-perceived leadership skill
importance measured by skills
instrument
age, gender,
ethnicity, tenure etc.
measured by demographic instrument
Figure 2-3: Leadership Style Behavior Indicator Model (adapted from Kirton, 2003)
Leadership Style as attributed to leadership behavior and influencing
original idea in need of leadership
Leadership Behavior leadership traits displayed by
academic program leader
97
Environmental variables are measured using the demographic instrument.
Environmental variables include working climate, culture, opportunity, and training
availability. Environmental variables for this study include age, gender, ethnicity, tenure
at college or university, tenure in a formal leadership position, and leadership training, as
well as past leadership training and experiences.
These variables come together to influence a leader’s preferred leadership style,
these styles being transformational, transactional, and/or laissez-faire. Each leadership
style has a certain set of characteristics that can be attributed to it. These behaviors are
manifested from the leadership style.
Needs, values, attitudes, and beliefs are all cognitive affects for cognitive function.
For this study, cognitive affects include the academic program leader’s perceived
importance of specific leadership skills.
This study sought to explain the leadership style of an academic program leader--
whether it be transformational, transactional and/or laissez-faire--and if that leadership
style could be determined by examining his or her leadership behaviors. These behaviors
are influenced by his or her self-perceived level of importance of his or her leadership
skills (cognitive affect), his or her self-perceived level of proficiency of their leadership
skill (cognitive resources), preferred problem-solving style (cognitive effect), and
environmental variables--as strong predictors of his or her leadership style (see Figure 2-
3).
Summary
Chapter 2 reviewed the literature as it pertains to different leadership theories
developed during the last 100 years. The leadership literature shows many definitions of
leadership and many different theories supporting leadership and leadership related to
98
change. A review of the literature also indicates little consensus on the definition of
leadership or the theories that describe leadership. The literature illuminates a growing
interest in transactional and transformational leadership theory.
Land-grant universities and colleges of agriculture were also reviewed in this
chapter. A historical perspective, as well as the current status of land-grant institutions
and colleges of agriculture, was discussed. Challenges facing both land-grant universities
and colleges of agriculture were deemed significant and eminent.
The role of the academic program leader, as well as how present-day deans are the
catalyst and controller of change, was also presented. Deans play a crucial role in not
only managing change, but they are often the catalyst and facilitator of change.
Cognitive function theory was used as the theoretical framework for this study.
Cognitive function theory uses cognitive resources, cognitive effect, environmental
variables, and cognitive affect to explain an academic program leader’s leadership style.
The leadership styles explained by this study include transformational, transactional
and/or laissez-faire leadership.
Chapter 3 discusses the methods and procedures used to conduct this study. Data
collection procedures and data analysis are also discussed.
99
CHAPTER 3 METHODS
Chapter 1 introduced this study and described the background of the study’s
purpose. The purpose and objectives were outlined in Chapter 1. Providing reasons for
the significance of this study were also discussed.
Chapter 1 described why the land-grant university system and colleges of
agriculture were founded and what roles they play today. Definitions of key terms were
provided and limitations of this study were identified. Seven specific research objectives
were identified:
1. To determine selected demographic characteristics of land-grant academic program leaders.
2. To assess level of importance of leadership skills, as determined by academic program leaders.
3. To assess self-perceived proficiency of leadership skills of academic program leaders.
4. To identify gaps in leadership skills and proficiency level of academic program leaders.
5. To determine leadership styles of academic program leaders as being transformational, transactional and/or laissez-faire.
6. To identify an academic program leader’s problem-solving style.
7. To explain leadership styles of academic program leaders.
The purpose of this study was to identify and describe the leadership skills and
styles of colleges of agriculture academic program leaders (deans). Demographic
variables of the colleges of agriculture academic program leaders were included to draw a
clearer picture of who are currently holding academic program leadership positions, what
100
previous leadership training they have had, and where gaps exist between their perception
of leadership skill importance and leadership skill training, and whether or not variables
influence academic program leaders’ leadership style. Additionally, this study sought to
determine the leadership style of academic program leaders as being transformational,
transactional and/or laissez-faire. This study sought to determine the academic program
leader’s problem-solving style, and the influence of specific variables on his or her
leadership style and behavior.
Chapter 2 examined previous research related to this study. The theoretical
framework used for this study was discussed. Chapter 2 reviewed the literature related to
the following 11 key areas: (1) the nature of leadership; (2) definitions of leadership; (3)
major leadership theories; (4) leadership styles; (5) the influence of demographics on
leadership styles; (6) leadership skills; (7) the influence of demographics on leadership
skills; (8) leadership and change; (9) land-grant universities; (10) academic program
leaders (deans); and (11) academic program leaders as change agents.
The research design, conceptual model, target populations, instrumentation, and
method of data collection and analysis, along with statistical procedures for analysis, are
addressed in Chapter 3.
Research Design
This study used quantitative research methods to accomplish the specific research
objectives. This study used four different questionnaires to collect the data needed to
meet the objectives of the study. A questionnaire, which targeted specific demographic
information of the academic program leaders, was used to address Objective 1.
In order to address Objectives 2, 3, and 4, a leadership skills instrument was given
to each academic program leader. The leadership skills instrument measured self-
101
perceived level of importance of individual leadership skills and the self-perceived
proficiency of each individual leadership skill.
The Multifactor Leadership Questionnaire (MLQ), designed by Bass and Avolio
(1995), determined the degree to which each academic program leader uses transactional,
transformational and/or laissez-faire leadership styles in performing his or her leadership
behaviors as the academic program leader. The MLQ was used to address Objective 5.
The KAI problem-solving instrument was used to address Objective 6. Objective 6
was used to measure and identify the academic program leader’s problem-solving style.
Descriptive research methods were used for Objectives 1, 2, and 3. Correlational
and causal-comparative, or ex-post facto design, was used to analyze the data for
Objectives 5, and 6. Backward regression was used for Objective 7 to predict leadership
styles of academic program leaders with specifically selected demographics.
Independent variables in this study were age, gender, ethnicity, highest educational
degree, type of degree, tenure in profession, tenure in leadership position(s), and previous
leadership courses and/or training. Gender, ethnicity, and highest educational degree
classifications were nominal independent variables. Each participant was classified as
having either a bench science degree or a social science degree. Age, tenure in
profession, tenure in leadership position(s), and/or leadership training courses were
continuous independent variables. Participants’ experiences in leadership courses and/or
training were computed by taking the total number of experiences listed by the
participants on the demographic instrument described later in this chapter. The
leadership styles scores, along with the leadership skills and competencies scores, were
dependent variables in this study.
102
Population
The population for this study included academic program leaders of colleges of
agricultural and life sciences of land-grant universities. Academic program leaders of
colleges of agricultural and life sciences were determined by using the National
Association of State Universities and Land-Grant Colleges (NASULGC) 2005 directory.
Participant Selection: College of Agricultural and Life Sciences Academic Program Leaders
The colleges of agricultural and life science academic program leaders included in
this study represented both 1862 and 1890 land-grant universities, along with the 1994
tribal land-grant universities. The colleges of agricultural and life science academic
program leaders were identified by accessing the NASULGC 2005 directory of Deans and
Directors of Academic Programs in Schools of Colleges of Agriculture, Agriculture and
Life Sciences, or Agriculture and Natural Resources. The National Association of State
Universities and Land-Grant Colleges published the directory in September 2005. Each
participant was contacted because he or she held the title of “Professional Academic
Program Leader,” “Dean,” or a similar title. The directory identified 106 individuals as
having the title or fulfilling the role of the academic program leader.
Instrumentation
A total of four questionnaires were used to collect data for this study. A leadership
skills questionnaire was used to measure the importance of leadership skills each
academic program leader perceives as important for the success of his or her position.
This leadership skills questionnaire also measured each academic program leader’s self-
perceived proficiency in that particular leadership skill area. The leadership skills
instrument was adopted from a previous leadership study (Moore, 2003). In Moore’s
103
study, the leadership instrument was developed from content analysis of long interviews
with administrative heads on what specific leadership skills they believed were needed to
be successful in their position.
The second instrument was the Multifactor Leadership Questionnaire (MLQ)
designed by Bass and Avolio (1995). The MLQ was used to determine the degree to
which each academic program leader uses transactional, transformational and/or laissez-
faire leadership styles in performing his or her role as the academic program leader. The
KAI problem-solving instrument was the third instrument used in this study. The KAI
was used to measure and identify the academic program leader’s problem-solving style.
The fourth instrument used in this study was a demographic questionnaire to gather
demographic information of the participants. Both the MLQ and KAI have had their
reliability and validity established through previous research.
All instruments used in this study were tested for reliability and validity prior to
conducting the study. Reliability and validity of instrumentation need to be considered in
all research studies utilizing questionnaires or surveys. Validity is a term used to describe
an instrument’s accuracy in measuring what it is supposed to measure. Validity is the
extent to which the data gathered is appropriate for answering the research question.
Reliability is the consistency or stability of a test or measure. Reliability is the degree of
freedom of measurement error.
Leadership Skills Instrument
The leadership skills instrument consisted of 44 questions. This instrument was
designed to measure how important colleges of agricultural and life sciences academic
program leaders believe each skill to be in his or her overall success in performing his or
her job. The instrument also measured his or her self-perceived level of leadership ability

104
(proficiency) in each of these leadership skill areas. The reliability of the leadership
skills instrument (importance) was (α=.87). The reliability for the leadership skills
instrument (proficiency) was (α=.89).
To measure the perceived importance of each leadership skill, each academic
program leader was asked to rate the leadership skill on a Likert scale ranging from 1
(Not Important) to 5 (Very Important). The raw scores were calculated for the perceived
importance of each of the six skill areas by summing the responses within each area. The
raw scores were then converted to a 100-point scale by dividing the sum of the responses
by the total possible response score for each skill area. These scores were converted to a
100-point score for calculation ease with evaluation and interpretation. The Human
Skills, Conceptual Skills, Technical Skills, Communication Skills, and Industry
Knowledge Skills areas each had a total of seven questions for a total possible range of
scores from 7 to 35 in each skill area. The Emotional Intelligence Skills area had eight
questions for a possible range of scores from 8 to 40.
Participants were asked to measure their self-perceived proficiency in each of the
six leadership skill areas. The academic program leader’s responses were recorded on a
Likert scale ranging from 1 (Not Proficient) to 5 (Very Proficient). The raw scores were
calculated for the self-perceived proficiency of each of the six skill areas by summing the
responses within each skill area. The raw scores were then converted to a 100-point scale
by dividing the sum of the responses by the total possible response score for each skill
area. These scores were converted to a 100-point score for ease of evaluation and
interpretation.
105
Before conducting this study, the leadership skills instrument was reviewed and
evaluated by a panel of experts for content and face validity. This panel consisted of
individuals having knowledge in the field of leadership and/or research design and
instrumentation. The leadership skills instrument was pilot-tested with a group of
academic program leaders not included in this study to establish reliability and face
validity. The pilot group consisted of academic program leaders who were members of
the American Association of State Colleges of Agriculture and Renewable Resources
(AASCARR).
Reliability was established during the pilot study. The pilot study consisted of 40
academic program leaders from AASCARR schools. Sixteen of the 40 individuals
participated in the pilot study for a response rate of 40%.
Internal consistency of the leadership skills instrument was measured using
Cronbach’s alpha and factor analysis to make certain the questionnaire was in fact
measuring what it claimed to measure. Cronbach’s alpha is the appropriate measure of
internal consistency or reliability with items on an instrument or index (Vogt, 2005).
Cronbach’s alpha is a measure of the intercorrelation of the items, and estimates the
proportion of the variance in all the items accounted for by a common factor (Vogt,
2005).
Cronbach’s alpha was calculated to determine the reliability in each leadership skill
area (see Table 3-1). Alpha levels for each leadership skill area were: Human Skills
α=.90; Conceptual Skills α=.92; Technical Skills α=.74; Communication Skills α=.90;
Emotional Intelligence Skills α=.86; and Industry Knowledge Skills α=.92. For the
reliability in the proficiency skills area, Cronbach’s alpha for each skill area were:
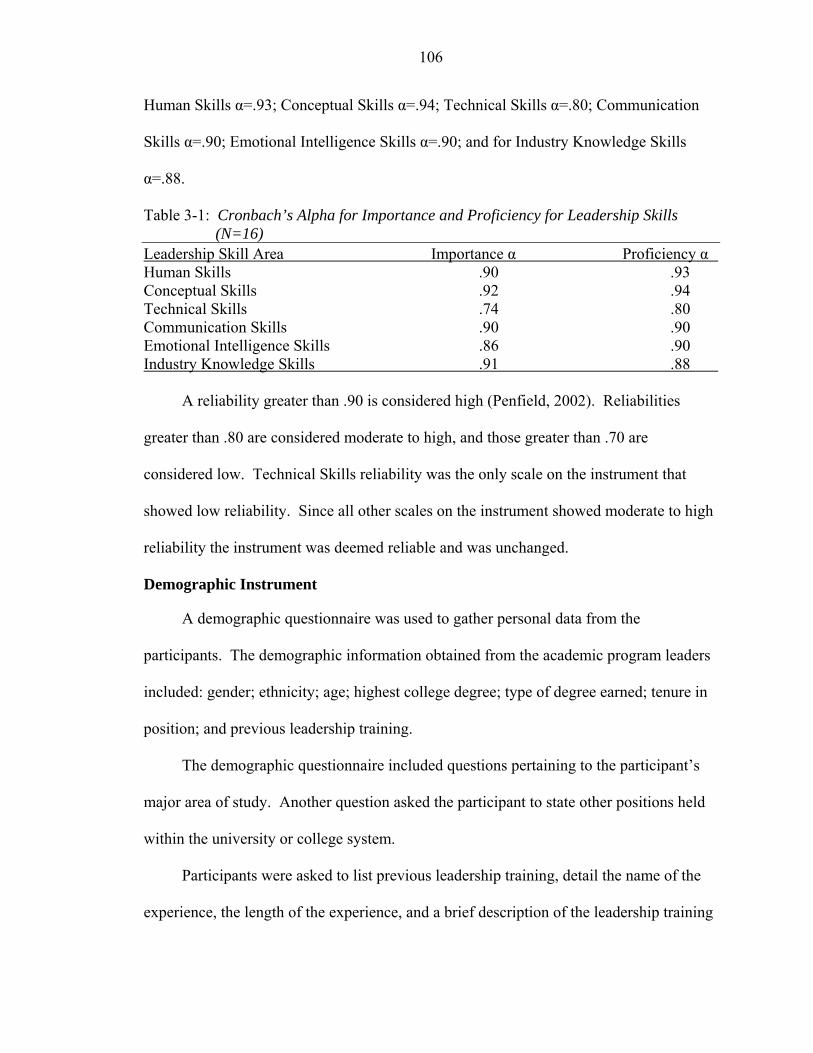
106
Human Skills α=.93; Conceptual Skills α=.94; Technical Skills α=.80; Communication
Skills α=.90; Emotional Intelligence Skills α=.90; and for Industry Knowledge Skills
α=.88.
Table 3-1: Cronbach’s Alpha for Importance and Proficiency for Leadership Skills (N=16)
Leadership Skill Area Importance α Proficiency α Human Skills .90 .93 Conceptual Skills .92 .94 Technical Skills .74 .80 Communication Skills .90 .90 Emotional Intelligence Skills .86 .90 Industry Knowledge Skills .91 .88
A reliability greater than .90 is considered high (Penfield, 2002). Reliabilities
greater than .80 are considered moderate to high, and those greater than .70 are
considered low. Technical Skills reliability was the only scale on the instrument that
showed low reliability. Since all other scales on the instrument showed moderate to high
reliability the instrument was deemed reliable and was unchanged.
Demographic Instrument
A demographic questionnaire was used to gather personal data from the
participants. The demographic information obtained from the academic program leaders
included: gender; ethnicity; age; highest college degree; type of degree earned; tenure in
position; and previous leadership training.
The demographic questionnaire included questions pertaining to the participant’s
major area of study. Another question asked the participant to state other positions held
within the university or college system.
Participants were asked to list previous leadership training, detail the name of the
experience, the length of the experience, and a brief description of the leadership training
107
experience. Previous leadership experience responses were recorded in three different
areas: (1) college courses in leadership; (2) leadership workshops; and (3) other previous
leadership experiences.
Multifactor Leadership Questionnaire
The Multifactor Leadership Questionnaire (MLQ) is based on the Full Range
Leadership Model developed by Bass and Avolio (2000). The survey is short and
comprehensive with 45 items that measure a full range of leadership behaviors.
Completing the questionnaire takes approximately 15 minutes. The MLQ has been
shown to be a strong predictor of leadership performance across a broad range of
organizations (Bass, 1997). The MLQ measures leadership behaviors used to determine
leadership styles, ranging from transactional leadership, transformational leadership,
and/or laissez-faire leadership.
The MLQ was used to gather information on the leadership behaviors of
participants. It determined if each academic program leader had a transactional,
transformational, and/or laissez-faire leadership style. The MLQ has 45 statements items
in which the participant circles a number rating for his or her self-perceived leadership
behavior by responding on a Likert scale ranging from 0 (not at all) to 4 (frequently, if
not always).
The MLQ determines individual leadership style as being transformational,
transactional, and/or laissez-faire, based on scales of leadership behavior. The MLQ was
utilized to measure elements or scales of transformational and transactional leadership of
the academic program leader. The MLQ measures characteristics of the behaviors of
leaders: Individualized Consideration; Intellectual Stimulation; Inspirational Motivation;
Idealized Influence (attributed) and Idealized Influence (behavior) associated with
108
Transformational Leadership; Contingent Reward and Management by Exception (active)
associated with Transactional Leadership; Management by Exception (passive) a method
of leadership associated with either solving or preventing problems; and Laissez-Faire.
Laissez-faire is an inactive form of leadership characterized by a reluctance to become
actively involved, that is to become disassociated from the action.
Contingent Reward, and Management-by-Exception (active) make up the
transactional leadership style. Contingent Reward is how the leader and followers
exchange specific rewards for outcomes or results. Goals and objectives are agreed upon
by both the leader and followers and the achievement is rewarded or punished.
Management-by-Exception (active) is when a leader makes corrective criticisms or uses
negative reinforcement. This leadership behavior monitors followers closely so they can
point out mistakes and errors.
Laissez-faire leadership has the scales of Management-by-Exception (passive) and
laissez-faire leadership. Laissez-faire leadership style uses Management-by-Exception
(passive) by intervening only when goals have not been met or a problem arises. Laissez-
faire behaviors are ones that delay decisions and give up responsibility. Laissez-faire
leaders offer little feedback or support to the follower; it is a “hands-off” approach to
leadership (Northouse, 2001).
There were four items per leadership scale. Leadership styles were derived by
taking the average of the leadership scale scores. For the transformational leadership
style, there was a possible total score of 20. Transactional leadership style and laissez-
faire leadership scores both had a maximum score of 8.
109
The MLQ also contains eight leadership scales: (1) Contingent Reward; (2)
Intellectual Stimulation; (3) Management-by-Exception (passive); (4) Management-by-
Exception (active); (5) Idealized Influence (behavior); (6) Idealized Influence
(attributed); (7) Inspirational Motivation; and (8) Individualized Consideration.
Contingent Reward refers to the engagement of leaders and followers in an
exchange process in which effort by followers is exchanged for specific rewards.
Objectives are agreed upon by both leaders and followers, and achievement of the
objectives is positively reinforced (Northouse, 2001).
Intellectual Stimulation includes leadership that stimulates followers to be creative
and innovative and to challenge their own beliefs and values, as well as those of the
leader and the organization. This type of leader encourages followers to try new
approaches and develop innovative ways of dealing with challenges (Northouse, 2001).
The two forms of Management-by-Exception, are passive and active. A leader
using the active form watches the followers for mistakes or errors. Once the follower has
made the mistake, the leader then takes corrective action. The leader using Management-
by-Exception (passive) interrupts the follower only after the standards have not been met
or a problem has already arisen (Northouse, 2001).
Idealized Influence leaders are often called charismatic leaders, and they act as
strong role models for the followers. The Idealized Influence leader sets high standards
of moral and ethical conduct, and The can be counted on to do the “right” thing. The
Idealized Influence leader is one whom followers want to follow because the leader has
been able to establish a vision (Northouse, 2001).
110
Inspirational Motivation is the leadership behavior of being able to communicate
high expectations to the followers. This leader is able to inspire the followers to share in
the vision of the organization (Northouse, 2001).
The Individualized Consideration leader provides support and consideration for his
or her followers. These leaders treat their followers in a kind and caring way. The
Individualized Consideration leader’s behaviors include being interested in his or her
followers and has the ability to help followers through times of challenges (Northouse,
2001).
Bass and Avolio’s (2000) technical report discussed the validation of the different
constructs measured by the MLQ. Bass and Avolio went into great detail explaining how
early versions of the MLQ were evaluated by leadership scholars. Leadership experts
have validated the MLQ more than 10 times since its initial use. The reliability of the
MLQ, as reported by Bass and Avolio for each leadership factor, ranges from .74 to .91.
Problem-solving Style Instrument
The fourth instrument used in this study was the Kirton Adaption Innovator
Inventory (KAI). The KAI is a 32-item questionnaire measuring an individual’s
preferred problem-solving style. The premise of Kirton’s Adaption-Innovation Theory is
that all individuals solve problems and are creative in some manner. The KAI
distinguishes how adaptive or innovative an individual is in solving problems. Adaptive
individuals prefer more structure in their problem-solving methods whereas innovative
individuals prefer to solve problems with less structure and more consensus method of
problem-solving.
The KAI asks participants to respond by marking an “X” on a continuum scale.
The scale ranged from Very Hard to Very Easy for each statement item. Each response
111
was then given a score between 1 and 5. Responses were then totaled to give an overall
KAI score. Scores are ranged on a Total Score continuum from 32 to 160. The overall
population average is 96. Those individuals scoring less than 96 are considered adaptors.
Those individuals scoring above 96 are termed innovators. The KAI also measures three
subfactors. These subfactors include KAI-Sufficiency of Originality (KAI-SO), KAI-
Efficiency (KAI-E), and KAI-Rules/Group Conformity (KAI-R).
Subfactor KAI-SO is the measure of an individual’s degree of generating ideas.
This sub-factor entails the difference individuals have in their preferred handling of ideas.
Adaptors tend to produce fewer ideas; however, the ideas that are produced tend to be
sound and useful. Innovators prefer to produce a multitude of ideas, which are often
considered to be more risky and abstract. The KAI-SO scores range from 13 to 65, with
the general population mean being 41.
Subfactor KAI-E is the term used for the degree of thoroughness and attention to
detail. Adaptors tend to be more organized and search in patterns for relevant
information. Innovators tend to pay less attention to detail and thoroughness and prefer
to start a new project rather than finish current projects. The KAI-E factor scale ranges
from 7 to 35, with the population mean of 19.
Subfactor KAI-R defines an individual’s preference for operating within the group
norms, conforming to the rules and structure of the organization and arriving at a
consensus. Adaptors use and accept rules as an asset, and these rules aid them in
problem-solving. Innovators see rules and group consensus as a limitation to problem-
solving. Innovators will often break or ignore rules to accomplish their goals. The KAI-
R factor has a range of 12 to 69, with a general population mean of 35. Reliabilities, as
112
reported in the literature for the KAI, range from .83 to .91 across multiple studies
(Kirton, 1999).
Data Collection Time Frame
In accordance with University of Florida policy, prior to any collection of data, a
proposal to conduct research for non-medical projects was submitted to the University of
Florida Institutional Review Board.
In November 2005, the University of Florida Institutional Review Board granted
approval for data collection: Approved Protocol # 2005-U-0870. Once approval was
granted by the University of Florida IRB, the research project began. Data collection for
this research project began in January 2006 and continued through March 2006. Data
were processed and analyzed in January, February, and March 2006, with concluding
statements and findings reported in March 2006.
In order to accomplish the research objectives, Dillman’s (2000) Internet and
Interactive Voice Response Surveys Design Methodology was followed to enhance
participants’ response rate. The first step was to send a brief letter of introduction to the
colleges of agricultural and life sciences academic program leaders notifying them of
forthcoming materials regarding study and encouraging their participation in the study.
The NASULGC Directory of Deans generated the list of deans.
Next, the researcher mailed a packet containing directions for completing the study,
the informed consent notice, the leadership skills questionnaire, the demographic
instrument, the Multifactor Leadership Questionnaire (MLQ), and the KAI to each of the
academic program leaders. Included in the packet were directions for completing the
MLQ and KAI, as well as information on how to return the completed questionnaires in
the pre-addressed stamped envelope provided.
113
One week after the initial mailing, a post card reminder was sent to all participants
of the study. Two weeks after the initial mailing was sent requesting their participation in
the study--and their packet had not yet been received by the researcher, an electronic mail
reminder was sent requesting their completion of the questionnaires. Using a number
corresponding with each participant’s name, the researcher tracked the participants who
completed and returned the questionnaires.
Three weeks after beginning the research study, an additional participation request
was sent electronically to those individuals who had not yet responded. Three days after
this request was sent, individuals were contacted by telephone to determine if they had
received the questionnaire, as well as a request for participation.
Dillman (2000) suggested as the fourth contact to send a replacement packet which
includes a letter requesting participation in the study, as well as replacement
questionnaires. This contact was omitted from this study and replaced with the e-mail,
fax, and phone call follow-ups. Due to the cost of the instrumentation and mailing, it was
not practical to send replacement packages to non-responders. As requests were made for
replacement packages, they were mailed immediately. Dillman (2000) provided for
alternative methods of contacts: telephone calls and certified mailings, as well as any
other form of specialized contact.
The researcher recorded electronic mail that was returned due to wrong electronic
mail addresses or some other reason. For these participants, the researcher attempted to
get the correct address through the use of the Internet or by making a personal call to the
institution where the participant worked requesting the current electronic mail address.
114
Data collection of demographic information, Multifactor Leadership Questionnaire,
and KAI, as well as the leadership skills instrument, were analyzed using the SPSS®
statistical package for Windows™.
The specific instruments used to gather the data can be found in the appendix.
Method and Data Analysis Used for Objective 1
Descriptive statistics, including frequencies and measures of central tendency, were
used to describe the academic program leaders in terms of their gender, age, ethnicity,
highest college degree, type of degree, tenure in position, and previous leadership
training.
Method and Data Analysis Used for Objective 2 and 3
Objective 2 included defining skills that college of agricultural and life sciences
academic program leaders (deans) need in order to perform their leadership duties. The
study population consisted of the academic program leaders. Their names were obtained
from the Directory of National Association of Colleges and Land-Grant Universities.
This directory provided the names of the deans of each institution associated with the
National Association of Colleges and Land-Grant Universities. Each academic program
leader was contacted to determine if he or she would be involved in the research project.
The leadership skills instrument was divided into six leadership categories. These
categories called Leadership Skill Areas included:
1. Human skills; 2. Conceptual skills; 3. Technical skills 4. Communication skills; 5. Emotional Intelligence skills; and 6. Industry knowledge skills.
115
These categories were developed after reviewing the relevant literature on
leadership, leadership skills, and leadership behaviors. Each leadership skill area had
seven questions with the exception of the Emotional Intelligence area, which had eight
questions. The leadership skills questionnaire had a total of 44 response questions.
Perceived leadership skill level importance and self-perceived proficiency in each of the
leadership skill areas were analyzed using SPSS®, the statistical package for
Windows™.
Method and Data Analysis Used for Objective 4
To identify the gaps in leadership skills and proficiency levels for college of
agricultural and life sciences academic program leaders, the difference between rated
importance of leadership skills and self-perceived proficiency was analyzed.
Significance was determined by finding the largest variations in rated importance of
leadership skills and self-perceived proficiency in the same leadership skill area.
Method and Data Analysis Used for Objectives 5 and 6
Colleges of agricultural and life sciences academic program leaders completed the
Multifactor Leadership Questionnaire and KAI. The MLQ was used to determine
leadership style while the KAI was used to determine preferred problem-solving and
creativeness in problem-solving style.
Independent and dependent variables were analyzed for correlations to examine the
relationship of the independent variables on the dependent variables per individual
variable basis. Correlational statistics were used to determine if a relationship exists
between specific personal (gender, ethnicity, age, highest college degree, and type of
degree) and situational (tenure in position and previous leadership training) demographics
with leadership skills, leadership behaviors, and leadership styles.
116
Method and Data Analysis Used for Objective 7
For Objective 7, multiple linear regression was used to evaluate the relationship of
the independent variables on the dependent variables. Multiple linear regression statistics
is the method used for evaluating the relationship of more than one independent or
predictor variables on a dependent or outcome variable (Vogt, 2005). Multiple linear
regression answers two main questions: (1) What is the relationship on a dependent
variable of a one-unit change in an independent variable, while controlling for the effects
of all the other independent variables?; and (2) What is the total relationship on the
dependent variable of all the independent variables taken together? (Vogt, 2005)
Multiple linear regression is a form of regression analysis using more than one
predictor variable (independent variable) to predict a single criterion variable (dependent
variable). The coefficient for any particular predictor variable is an estimate of the
relationship of that variable while holding constant the effects of the other predictor
variables (Vogt, 2005).
Regression analysis is used to explain or predict the variability of a dependent
variable using information about one or more independent variables. Regression analysis
attempts to answer the question: What values in the dependent variable can we expect,
given certain values of the independent variable? Regression analysis indicates the
closeness of the relationship between two or more variables. It indicates the extent to
which you can predict one variable by knowing another (Vogt, 2005).
Linear regression is a method of describing the relationship between two or more
variables by calculating a “best-fitting” straight line on a graph (Vogt, 2005). The line
averages or summarizes the relationship between variables. Typically a linear regression
equation is formulated by means of linear regression. A regression equation is an
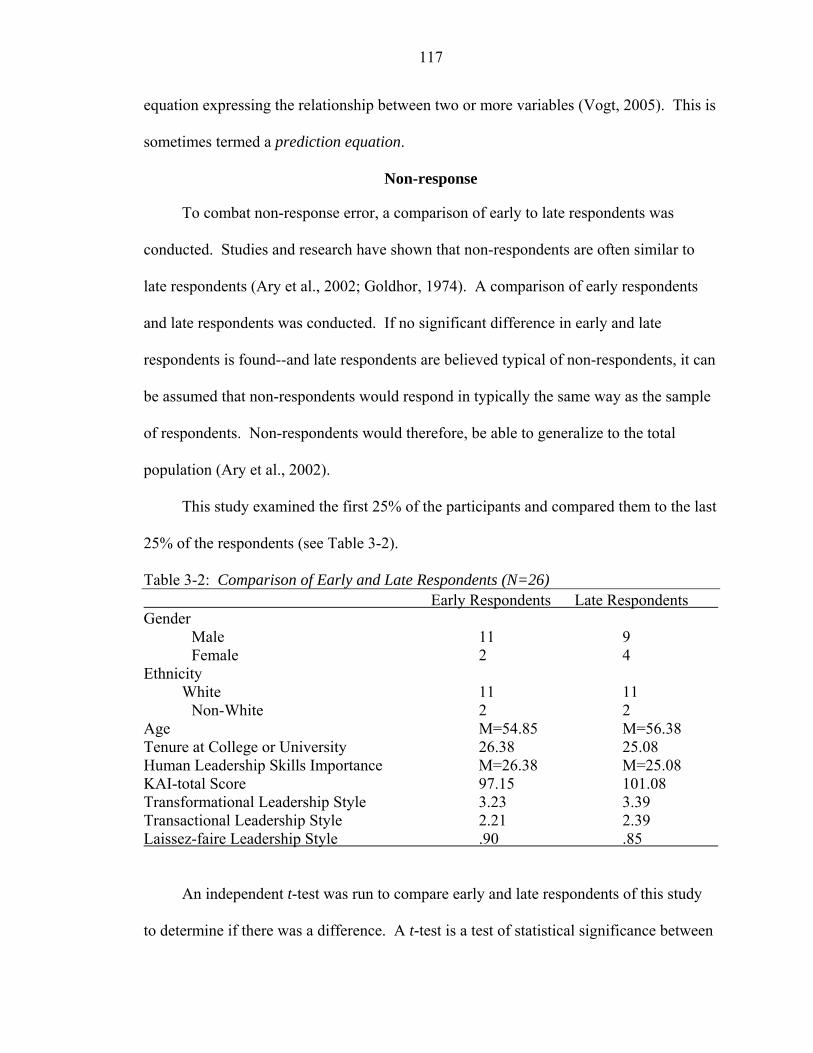
117
equation expressing the relationship between two or more variables (Vogt, 2005). This is
sometimes termed a prediction equation.
Non-response
To combat non-response error, a comparison of early to late respondents was
conducted. Studies and research have shown that non-respondents are often similar to
late respondents (Ary et al., 2002; Goldhor, 1974). A comparison of early respondents
and late respondents was conducted. If no significant difference in early and late
respondents is found--and late respondents are believed typical of non-respondents, it can
be assumed that non-respondents would respond in typically the same way as the sample
of respondents. Non-respondents would therefore, be able to generalize to the total
population (Ary et al., 2002).
This study examined the first 25% of the participants and compared them to the last
25% of the respondents (see Table 3-2).
Table 3-2: Comparison of Early and Late Respondents (N=26) Early Respondents Late Respondents Gender Male 11 9 Female 2 4 Ethnicity
White 11 11 Non-White 2 2 Age M=54.85 M=56.38 Tenure at College or University 26.38 25.08 Human Leadership Skills Importance M=26.38 M=25.08 KAI-total Score 97.15 101.08 Transformational Leadership Style 3.23 3.39 Transactional Leadership Style 2.21 2.39 Laissez-faire Leadership Style .90 .85
An independent t-test was run to compare early and late respondents of this study
to determine if there was a difference. A t-test is a test of statistical significance between
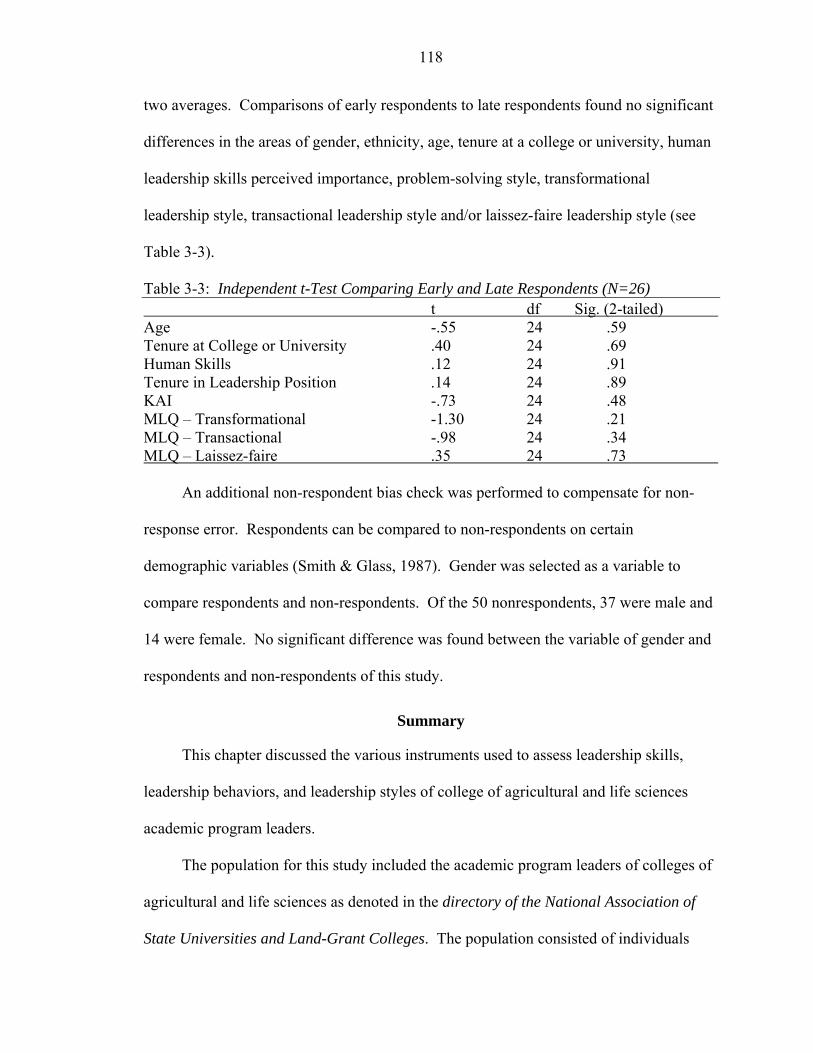
118
two averages. Comparisons of early respondents to late respondents found no significant
differences in the areas of gender, ethnicity, age, tenure at a college or university, human
leadership skills perceived importance, problem-solving style, transformational
leadership style, transactional leadership style and/or laissez-faire leadership style (see
Table 3-3).
Table 3-3: Independent t-Test Comparing Early and Late Respondents (N=26) t df Sig. (2-tailed) Age -.55 24 .59 Tenure at College or University .40 24 .69 Human Skills .12 24 .91 Tenure in Leadership Position .14 24 .89 KAI -.73 24 .48 MLQ – Transformational -1.30 24 .21 MLQ – Transactional -.98 24 .34 MLQ – Laissez-faire .35 24 .73
An additional non-respondent bias check was performed to compensate for non-
response error. Respondents can be compared to non-respondents on certain
demographic variables (Smith & Glass, 1987). Gender was selected as a variable to
compare respondents and non-respondents. Of the 50 nonrespondents, 37 were male and
14 were female. No significant difference was found between the variable of gender and
respondents and non-respondents of this study.
Summary
This chapter discussed the various instruments used to assess leadership skills,
leadership behaviors, and leadership styles of college of agricultural and life sciences
academic program leaders.
The population for this study included the academic program leaders of colleges of
agricultural and life sciences as denoted in the directory of the National Association of
State Universities and Land-Grant Colleges. The population consisted of individuals
119
having the primary responsibility for participation and correspondence in academic
programming for their college, as denoted by the directory of the National Association of
State Universities and Land-Grant Colleges.
This quantitative study included a description of college of agricultural and life
science academic program leaders and their perceived level of importance of specific
leadership skills. Self-perceived proficiency of leadership skills was described as well.
This study sought to explain the influence of specific demographics on academic program
leaders’ leadership skills, as well as their individual leadership style. This study also
described current academic program leaders in regard to their problem-solving style.
Four questionnaires were used to collect data for this study. The first instrument
was a questionnaire to collect the perceived importance of leadership skills needed by
colleges of agricultural and life science academic program leaders to successfully
perform their job. This instrument also measured the academic program leaders’ self-
perceived proficiency in the leadership skill area. This instrument was designed for
academic program leaders to rate their perceived level of importance of certain leadership
skills, as well as measuring their own self-perceived level of proficiency within each
leadership skill area.
The second instrument used in this research was the Multifactor Leadership
Questionnaire (Bass & Avolio, 2000). The MLQ measured the leadership style of each
of the academic program leaders, and it measured each leader’s transactional,
transformational and/or laissez-faire leadership style.
The KAI was used to assess the academic program leader’s preferred problem-
solving style. The KAI measures an individual’s thinking/problem-solving style as either
120
more adaptive or more innovative in how he or she solves problems and his or her
creativeness in solving those problems. Finally, a questionnaire was used to gather
demographic information about the participants of the study.
The process of analyzing the data of this study was also discussed in this chapter.
Descriptive statistics, correlations, and multiple regression statistics were used to analyze
the data collected by the instruments.
121
CHAPTER 4 RESULTS
Chapter 1 introduced this study and described its background, purpose, and
objectives. The significance of this study was also discussed. The reasons the land-grant
university system and colleges of agriculture were founded and what roles they play
today were also presented. Definitions of key terms used in this study were provided in
Chapter 1, as well as limitations of this study.
Significant impacts to the educational profession in recruitment and professional
leadership development of academic program leaders (deans) are reasons this study was
conducted. The purpose was to identify, define, and describe the leadership skills, as
well as leadership behaviors and leadership styles of colleges of agriculture academic
program leaders. Demographic variables of colleges of agriculture academic program
leaders were included and examined to draw a clearer picture of those who currently hold
these positions and their previous training and future training that they feel would be
beneficial for their job performance.
Chapter 2 discussed previous research related to this study and the theoretical
framework used for this study. Chapter 2 reviewed the literature related to the following
11 key areas: (1) the nature of leadership; (2) definitions of leadership; (3) major
leadership theories; (4) leadership styles; (5) influence of demographics on leadership
styles; (6) leadership skills; (7) influence of demographics on leadership skills and
behaviors; (8) leadership and change; (9) land-grant universities; (10) academic program
leaders; and (11) academic program leaders as change agents.
122
The methodology used to complete this study was explained in Chapter 3. The
seven research objectives identified were:
1. Determine selected demographic characteristics of land-grant academic program leaders.
2. Assess level of importance of leadership skills, as determined by academic program leaders.
3. Assess self-perceived proficiency of leadership skills of academic program leaders.
4. Identify gaps in leadership skills and proficiency level of academic program leaders.
5. Determine leadership styles of academic program leaders as being transformational, transactional, and/or laissez-faire.
6. Identify an academic program leader’s problem-solving style.
7. Explain leadership styles of academic program leaders.
The research design, target populations, instrumentation, and method of data
collection and analysis, along with statistical procedures for analysis, were addressed in
Chapter 3. Methodologies used to reach the objectives of the study were also discussed.
The findings of this study are presented in this chapter.
Objective 1
Determine Selected Demographic Characteristics of Land-grant Academic Program Leaders
The National Association of State Universities and Land Grant Colleges designates
106 individuals as being academic program leaders or persons with those responsibilities.
Fifty-six individuals responded to the research for a response rate of 53%. Of the 56
academic program leaders (deans) who participated in the study, 76.8% (n=43) were male
and 23.3% (n=13) were female. In terms of ethnicity, this study found 76.8% (n=43)
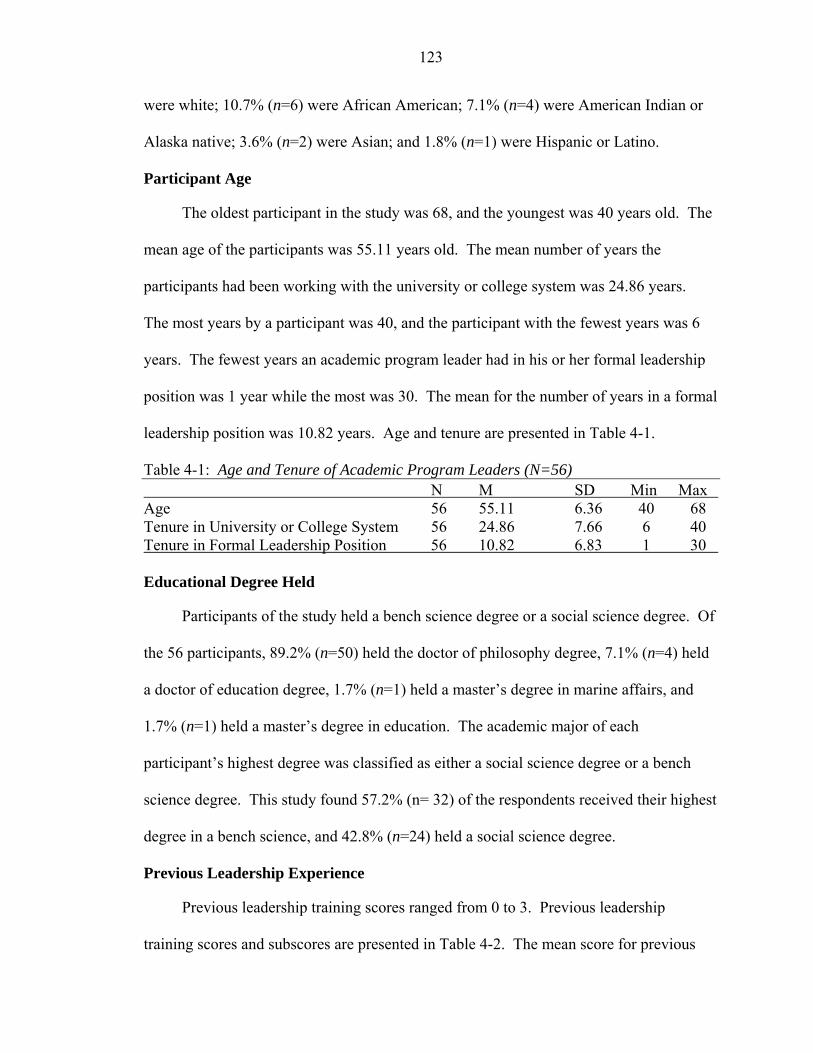
123
were white; 10.7% (n=6) were African American; 7.1% (n=4) were American Indian or
Alaska native; 3.6% (n=2) were Asian; and 1.8% (n=1) were Hispanic or Latino.
Participant Age
The oldest participant in the study was 68, and the youngest was 40 years old. The
mean age of the participants was 55.11 years old. The mean number of years the
participants had been working with the university or college system was 24.86 years.
The most years by a participant was 40, and the participant with the fewest years was 6
years. The fewest years an academic program leader had in his or her formal leadership
position was 1 year while the most was 30. The mean for the number of years in a formal
leadership position was 10.82 years. Age and tenure are presented in Table 4-1.
Table 4-1: Age and Tenure of Academic Program Leaders (N=56) N M SD Min Max Age 56 55.11 6.36 40 68 Tenure in University or College System 56 24.86 7.66 6 40 Tenure in Formal Leadership Position 56 10.82 6.83 1 30 Educational Degree Held
Participants of the study held a bench science degree or a social science degree. Of
the 56 participants, 89.2% (n=50) held the doctor of philosophy degree, 7.1% (n=4) held
a doctor of education degree, 1.7% (n=1) held a master’s degree in marine affairs, and
1.7% (n=1) held a master’s degree in education. The academic major of each
participant’s highest degree was classified as either a social science degree or a bench
science degree. This study found 57.2% (n= 32) of the respondents received their highest
degree in a bench science, and 42.8% (n=24) held a social science degree.
Previous Leadership Experience
Previous leadership training scores ranged from 0 to 3. Previous leadership
training scores and subscores are presented in Table 4-2. The mean score for previous
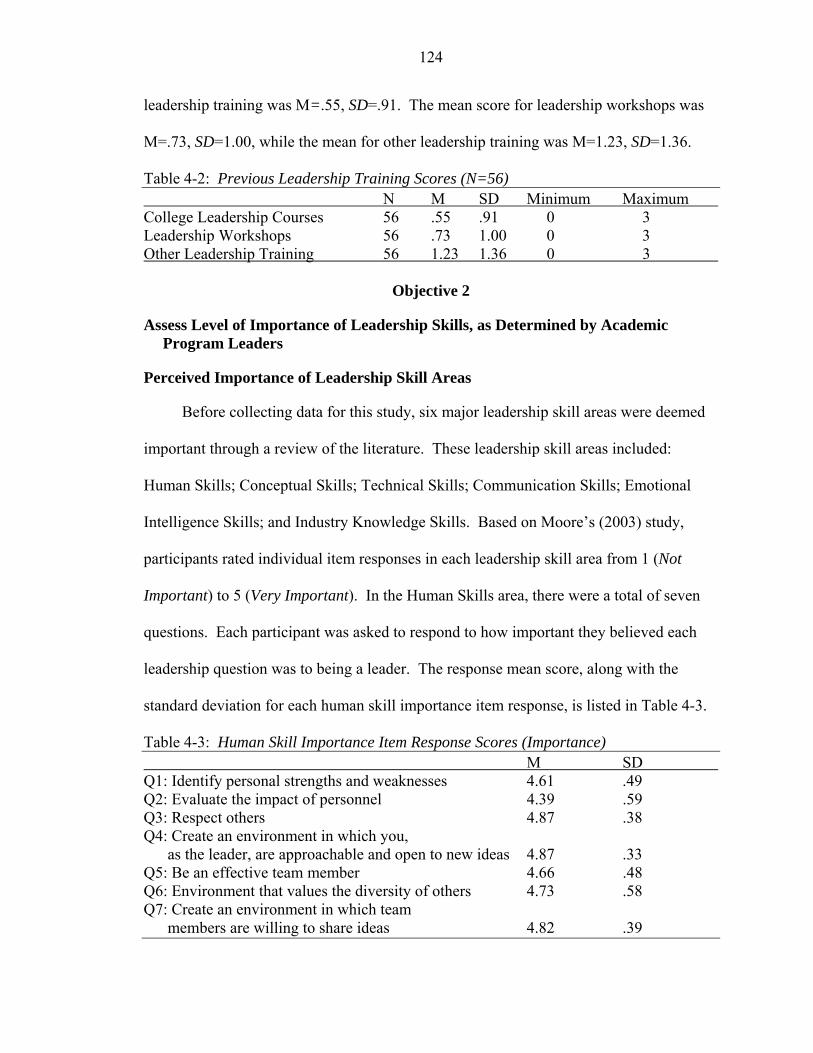
124
leadership training was M=.55, SD=.91. The mean score for leadership workshops was
M=.73, SD=1.00, while the mean for other leadership training was M=1.23, SD=1.36.
Table 4-2: Previous Leadership Training Scores (N=56) N M SD Minimum Maximum College Leadership Courses 56 .55 .91 0 3 Leadership Workshops 56 .73 1.00 0 3 Other Leadership Training 56 1.23 1.36 0 3
Objective 2
Assess Level of Importance of Leadership Skills, as Determined by Academic Program Leaders
Perceived Importance of Leadership Skill Areas
Before collecting data for this study, six major leadership skill areas were deemed
important through a review of the literature. These leadership skill areas included:
Human Skills; Conceptual Skills; Technical Skills; Communication Skills; Emotional
Intelligence Skills; and Industry Knowledge Skills. Based on Moore’s (2003) study,
participants rated individual item responses in each leadership skill area from 1 (Not
Important) to 5 (Very Important). In the Human Skills area, there were a total of seven
questions. Each participant was asked to respond to how important they believed each
leadership question was to being a leader. The response mean score, along with the
standard deviation for each human skill importance item response, is listed in Table 4-3.
Table 4-3: Human Skill Importance Item Response Scores (Importance) M SD Q1: Identify personal strengths and weaknesses 4.61 .49 Q2: Evaluate the impact of personnel 4.39 .59 Q3: Respect others 4.87 .38 Q4: Create an environment in which you,
as the leader, are approachable and open to new ideas 4.87 .33 Q5: Be an effective team member 4.66 .48 Q6: Environment that values the diversity of others 4.73 .58 Q7: Create an environment in which team
members are willing to share ideas 4.82 .39
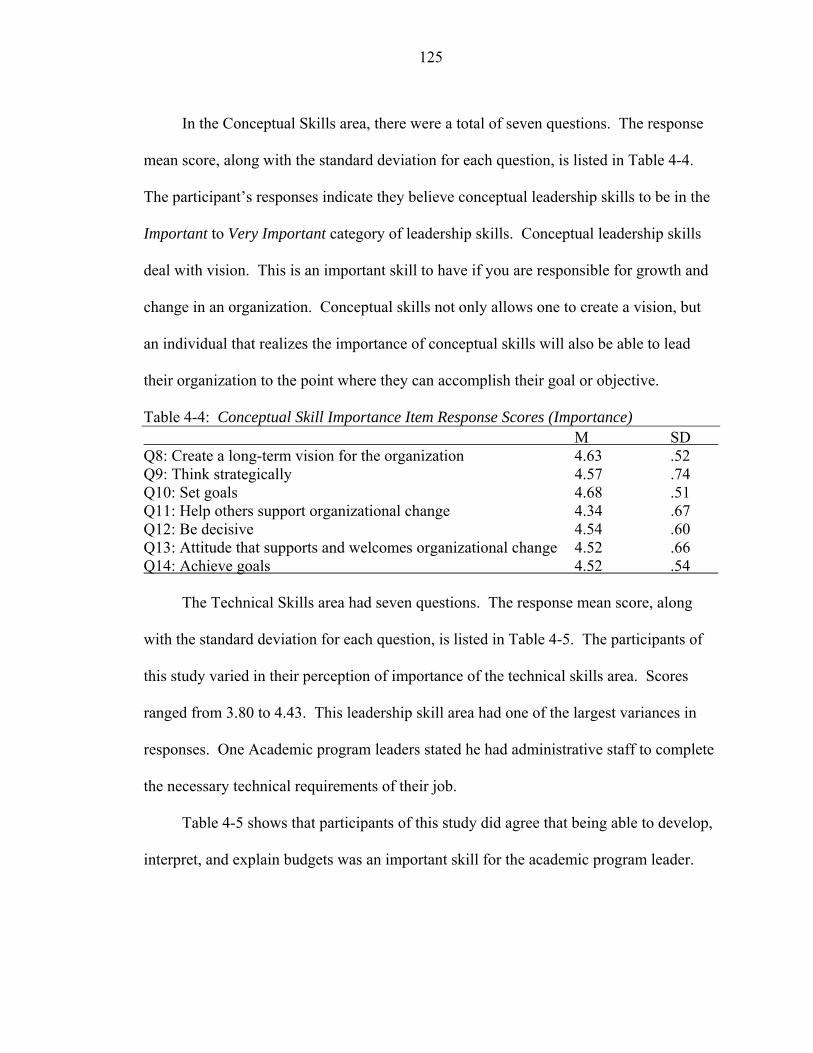
125
In the Conceptual Skills area, there were a total of seven questions. The response
mean score, along with the standard deviation for each question, is listed in Table 4-4.
The participant’s responses indicate they believe conceptual leadership skills to be in the
Important to Very Important category of leadership skills. Conceptual leadership skills
deal with vision. This is an important skill to have if you are responsible for growth and
change in an organization. Conceptual skills not only allows one to create a vision, but
an individual that realizes the importance of conceptual skills will also be able to lead
their organization to the point where they can accomplish their goal or objective.
Table 4-4: Conceptual Skill Importance Item Response Scores (Importance) M SD Q8: Create a long-term vision for the organization 4.63 .52 Q9: Think strategically 4.57 .74 Q10: Set goals 4.68 .51 Q11: Help others support organizational change 4.34 .67 Q12: Be decisive 4.54 .60 Q13: Attitude that supports and welcomes organizational change 4.52 .66 Q14: Achieve goals 4.52 .54
The Technical Skills area had seven questions. The response mean score, along
with the standard deviation for each question, is listed in Table 4-5. The participants of
this study varied in their perception of importance of the technical skills area. Scores
ranged from 3.80 to 4.43. This leadership skill area had one of the largest variances in
responses. One Academic program leaders stated he had administrative staff to complete
the necessary technical requirements of their job.
Table 4-5 shows that participants of this study did agree that being able to develop,
interpret, and explain budgets was an important skill for the academic program leader.
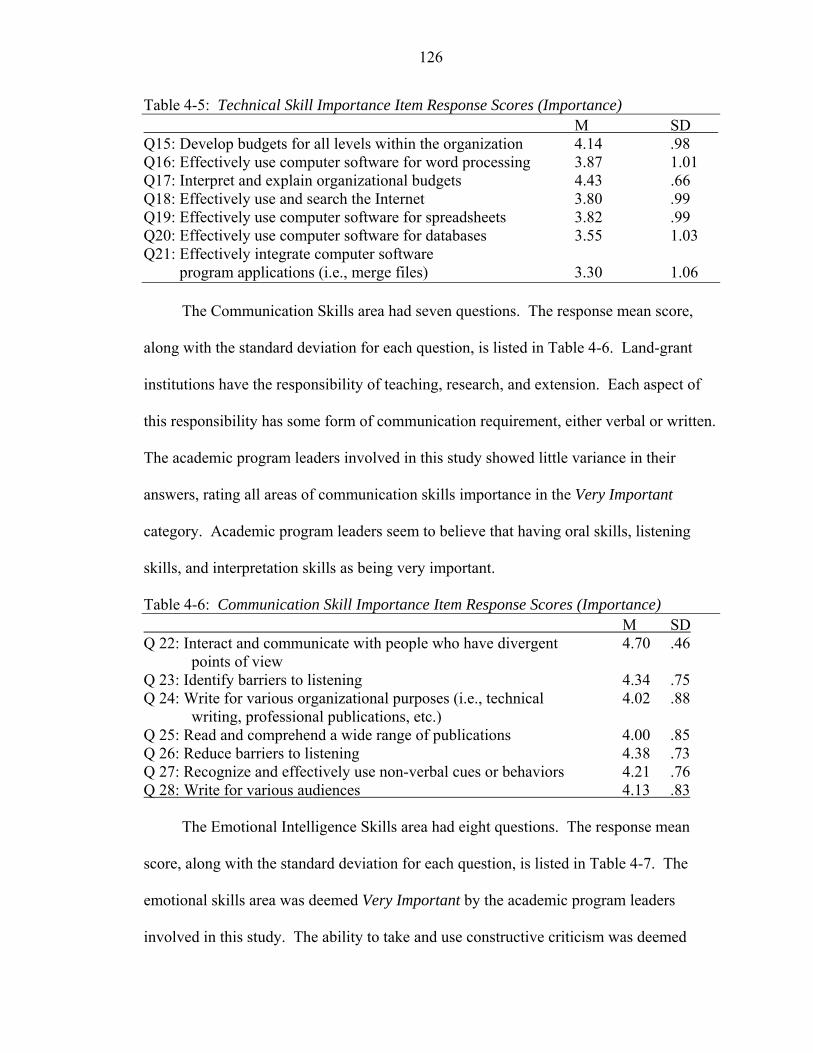
126
Table 4-5: Technical Skill Importance Item Response Scores (Importance) M SD Q15: Develop budgets for all levels within the organization 4.14 .98 Q16: Effectively use computer software for word processing 3.87 1.01 Q17: Interpret and explain organizational budgets 4.43 .66 Q18: Effectively use and search the Internet 3.80 .99 Q19: Effectively use computer software for spreadsheets 3.82 .99 Q20: Effectively use computer software for databases 3.55 1.03 Q21: Effectively integrate computer software
program applications (i.e., merge files) 3.30 1.06
The Communication Skills area had seven questions. The response mean score,
along with the standard deviation for each question, is listed in Table 4-6. Land-grant
institutions have the responsibility of teaching, research, and extension. Each aspect of
this responsibility has some form of communication requirement, either verbal or written.
The academic program leaders involved in this study showed little variance in their
answers, rating all areas of communication skills importance in the Very Important
category. Academic program leaders seem to believe that having oral skills, listening
skills, and interpretation skills as being very important.
Table 4-6: Communication Skill Importance Item Response Scores (Importance) M SD Q 22: Interact and communicate with people who have divergent 4.70 .46 points of view Q 23: Identify barriers to listening 4.34 .75 Q 24: Write for various organizational purposes (i.e., technical 4.02 .88 writing, professional publications, etc.) Q 25: Read and comprehend a wide range of publications 4.00 .85 Q 26: Reduce barriers to listening 4.38 .73 Q 27: Recognize and effectively use non-verbal cues or behaviors 4.21 .76 Q 28: Write for various audiences 4.13 .83
The Emotional Intelligence Skills area had eight questions. The response mean
score, along with the standard deviation for each question, is listed in Table 4-7. The
emotional skills area was deemed Very Important by the academic program leaders
involved in this study. The ability to take and use constructive criticism was deemed
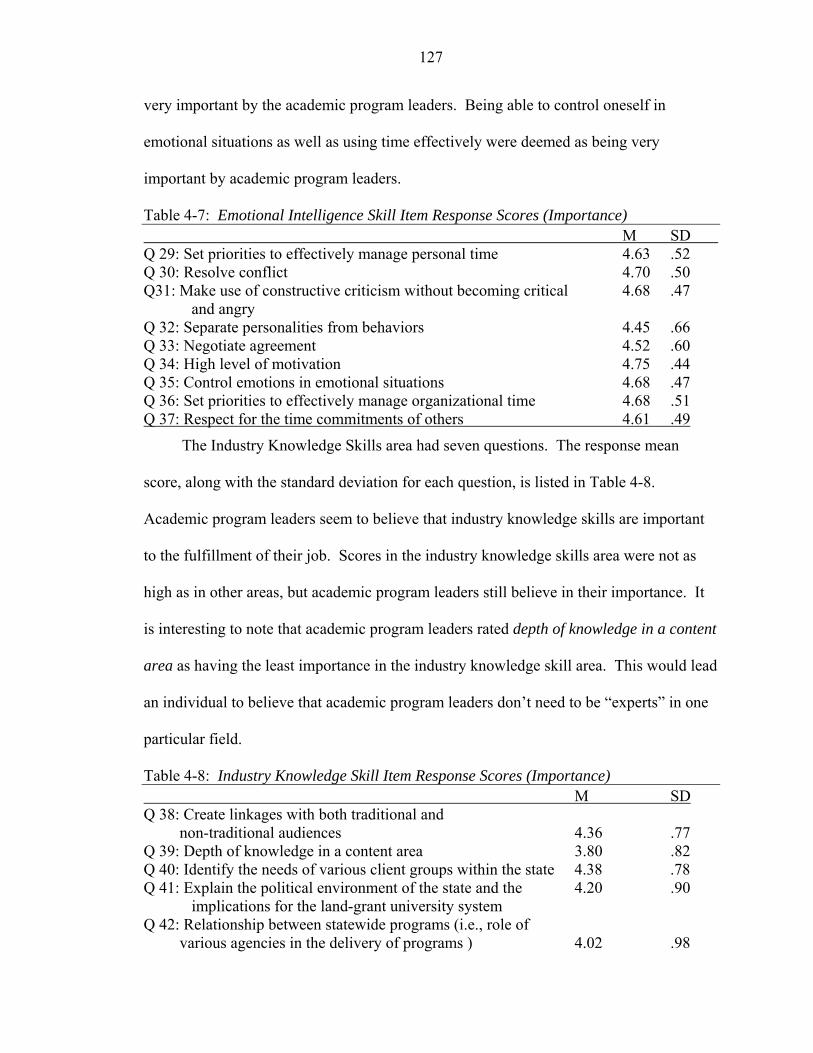
127
very important by the academic program leaders. Being able to control oneself in
emotional situations as well as using time effectively were deemed as being very
important by academic program leaders.
Table 4-7: Emotional Intelligence Skill Item Response Scores (Importance) M SD Q 29: Set priorities to effectively manage personal time 4.63 .52 Q 30: Resolve conflict 4.70 .50 Q31: Make use of constructive criticism without becoming critical 4.68 .47 and angry Q 32: Separate personalities from behaviors 4.45 .66 Q 33: Negotiate agreement 4.52 .60 Q 34: High level of motivation 4.75 .44 Q 35: Control emotions in emotional situations 4.68 .47 Q 36: Set priorities to effectively manage organizational time 4.68 .51 Q 37: Respect for the time commitments of others 4.61 .49
The Industry Knowledge Skills area had seven questions. The response mean
score, along with the standard deviation for each question, is listed in Table 4-8.
Academic program leaders seem to believe that industry knowledge skills are important
to the fulfillment of their job. Scores in the industry knowledge skills area were not as
high as in other areas, but academic program leaders still believe in their importance. It
is interesting to note that academic program leaders rated depth of knowledge in a content
area as having the least importance in the industry knowledge skill area. This would lead
an individual to believe that academic program leaders don’t need to be “experts” in one
particular field.
Table 4-8: Industry Knowledge Skill Item Response Scores (Importance) M SD Q 38: Create linkages with both traditional and
non-traditional audiences 4.36 .77 Q 39: Depth of knowledge in a content area 3.80 .82 Q 40: Identify the needs of various client groups within the state 4.38 .78 Q 41: Explain the political environment of the state and the 4.20 .90
implications for the land-grant university system Q 42: Relationship between statewide programs (i.e., role of
various agencies in the delivery of programs ) 4.02 .98
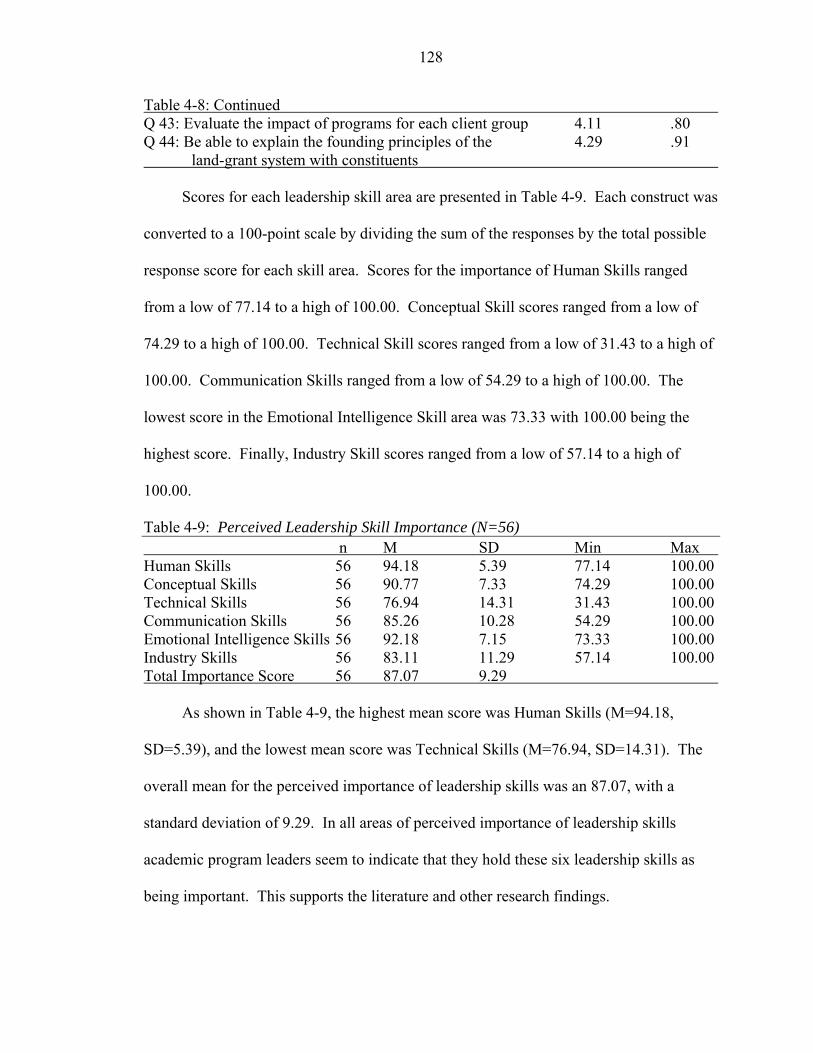
128
Table 4-8: Continued Q 43: Evaluate the impact of programs for each client group 4.11 .80 Q 44: Be able to explain the founding principles of the 4.29 .91 land-grant system with constituents
Scores for each leadership skill area are presented in Table 4-9. Each construct was
converted to a 100-point scale by dividing the sum of the responses by the total possible
response score for each skill area. Scores for the importance of Human Skills ranged
from a low of 77.14 to a high of 100.00. Conceptual Skill scores ranged from a low of
74.29 to a high of 100.00. Technical Skill scores ranged from a low of 31.43 to a high of
100.00. Communication Skills ranged from a low of 54.29 to a high of 100.00. The
lowest score in the Emotional Intelligence Skill area was 73.33 with 100.00 being the
highest score. Finally, Industry Skill scores ranged from a low of 57.14 to a high of
100.00.
Table 4-9: Perceived Leadership Skill Importance (N=56) n M SD Min Max Human Skills 56 94.18 5.39 77.14 100.00 Conceptual Skills 56 90.77 7.33 74.29 100.00 Technical Skills 56 76.94 14.31 31.43 100.00 Communication Skills 56 85.26 10.28 54.29 100.00 Emotional Intelligence Skills 56 92.18 7.15 73.33 100.00 Industry Skills 56 83.11 11.29 57.14 100.00 Total Importance Score 56 87.07 9.29
As shown in Table 4-9, the highest mean score was Human Skills (M=94.18,
SD=5.39), and the lowest mean score was Technical Skills (M=76.94, SD=14.31). The
overall mean for the perceived importance of leadership skills was an 87.07, with a
standard deviation of 9.29. In all areas of perceived importance of leadership skills
academic program leaders seem to indicate that they hold these six leadership skills as
being important. This supports the literature and other research findings.
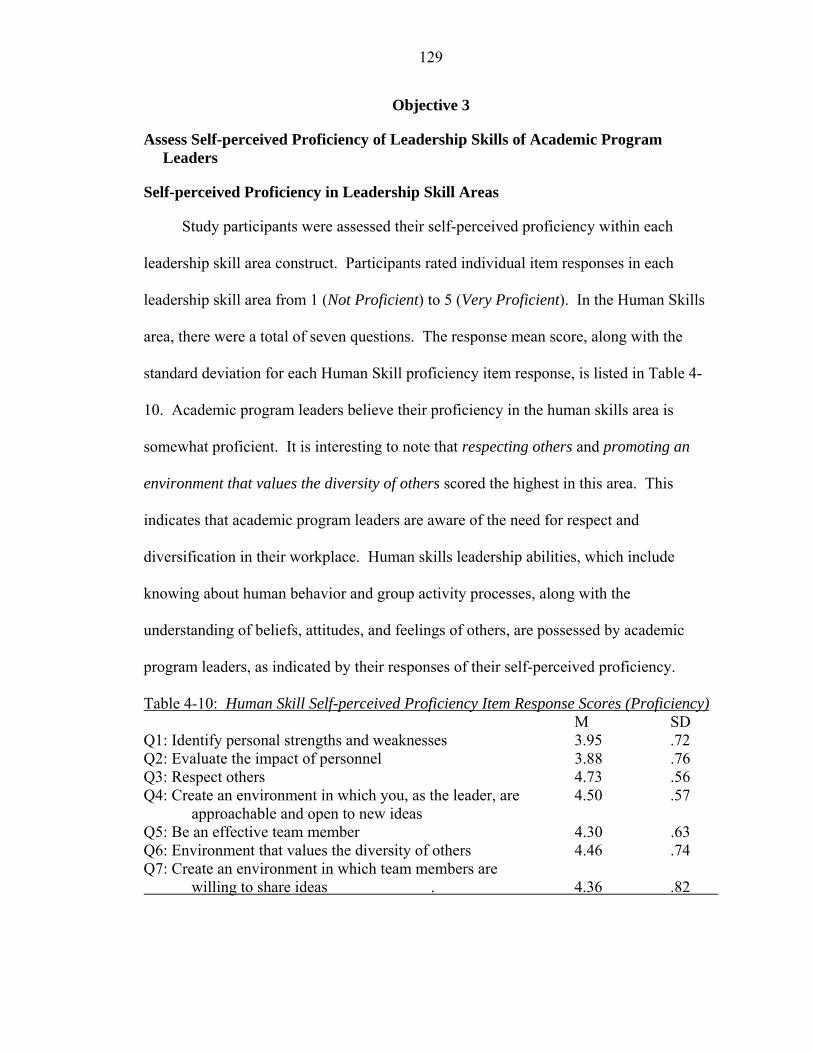
129
Objective 3
Assess Self-perceived Proficiency of Leadership Skills of Academic Program Leaders
Self-perceived Proficiency in Leadership Skill Areas
Study participants were assessed their self-perceived proficiency within each
leadership skill area construct. Participants rated individual item responses in each
leadership skill area from 1 (Not Proficient) to 5 (Very Proficient). In the Human Skills
area, there were a total of seven questions. The response mean score, along with the
standard deviation for each Human Skill proficiency item response, is listed in Table 4-
10. Academic program leaders believe their proficiency in the human skills area is
somewhat proficient. It is interesting to note that respecting others and promoting an
environment that values the diversity of others scored the highest in this area. This
indicates that academic program leaders are aware of the need for respect and
diversification in their workplace. Human skills leadership abilities, which include
knowing about human behavior and group activity processes, along with the
understanding of beliefs, attitudes, and feelings of others, are possessed by academic
program leaders, as indicated by their responses of their self-perceived proficiency.
Table 4-10: Human Skill Self-perceived Proficiency Item Response Scores (Proficiency) M SD Q1: Identify personal strengths and weaknesses 3.95 .72 Q2: Evaluate the impact of personnel 3.88 .76 Q3: Respect others 4.73 .56 Q4: Create an environment in which you, as the leader, are 4.50 .57
approachable and open to new ideas Q5: Be an effective team member 4.30 .63 Q6: Environment that values the diversity of others 4.46 .74 Q7: Create an environment in which team members are willing to share ideas . 4.36 .82
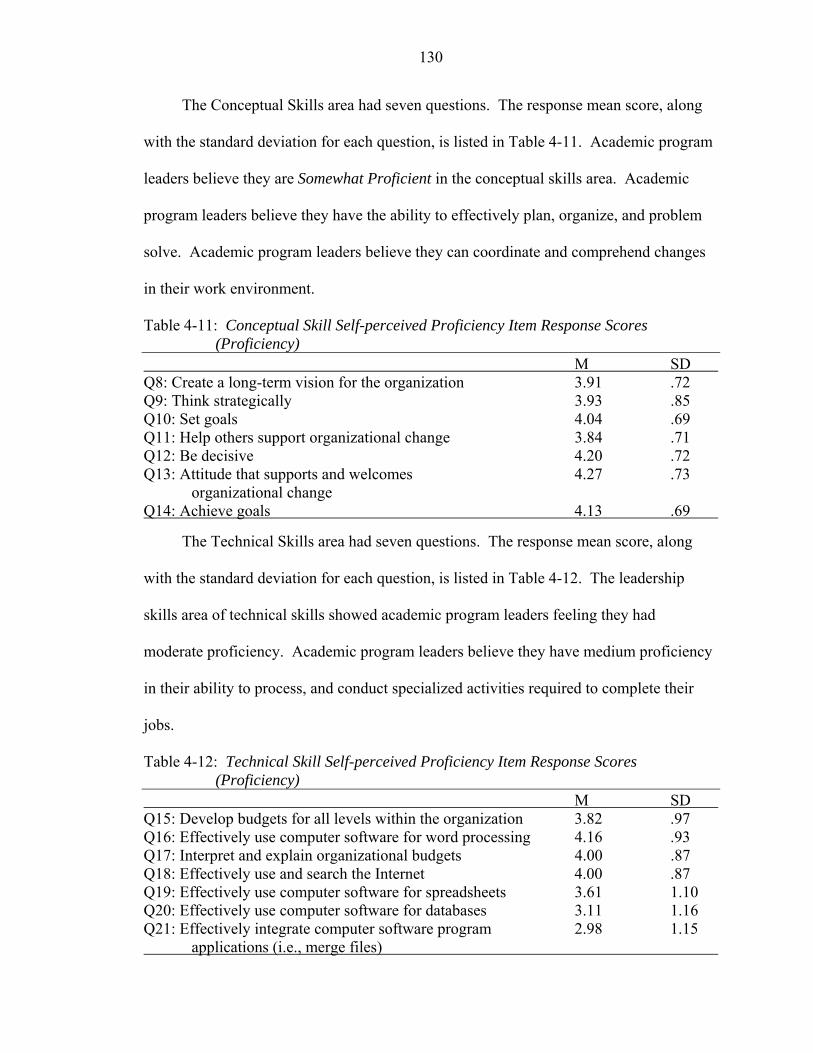
130
The Conceptual Skills area had seven questions. The response mean score, along
with the standard deviation for each question, is listed in Table 4-11. Academic program
leaders believe they are Somewhat Proficient in the conceptual skills area. Academic
program leaders believe they have the ability to effectively plan, organize, and problem
solve. Academic program leaders believe they can coordinate and comprehend changes
in their work environment.
Table 4-11: Conceptual Skill Self-perceived Proficiency Item Response Scores (Proficiency)
M SD Q8: Create a long-term vision for the organization 3.91 .72 Q9: Think strategically 3.93 .85 Q10: Set goals 4.04 .69 Q11: Help others support organizational change 3.84 .71 Q12: Be decisive 4.20 .72 Q13: Attitude that supports and welcomes 4.27 .73 organizational change Q14: Achieve goals 4.13 .69
The Technical Skills area had seven questions. The response mean score, along
with the standard deviation for each question, is listed in Table 4-12. The leadership
skills area of technical skills showed academic program leaders feeling they had
moderate proficiency. Academic program leaders believe they have medium proficiency
in their ability to process, and conduct specialized activities required to complete their
jobs.
Table 4-12: Technical Skill Self-perceived Proficiency Item Response Scores (Proficiency)
M SD Q15: Develop budgets for all levels within the organization 3.82 .97 Q16: Effectively use computer software for word processing 4.16 .93 Q17: Interpret and explain organizational budgets 4.00 .87 Q18: Effectively use and search the Internet 4.00 .87 Q19: Effectively use computer software for spreadsheets 3.61 1.10 Q20: Effectively use computer software for databases 3.11 1.16 Q21: Effectively integrate computer software program 2.98 1.15 applications (i.e., merge files)
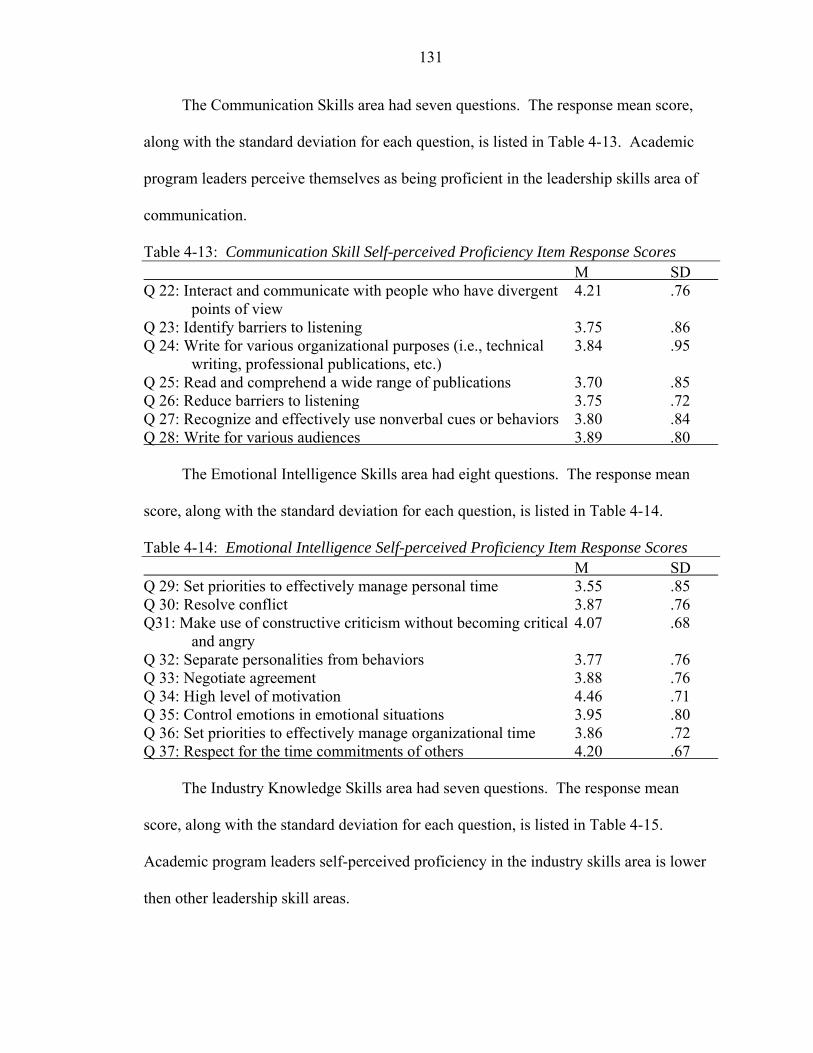
131
The Communication Skills area had seven questions. The response mean score,
along with the standard deviation for each question, is listed in Table 4-13. Academic
program leaders perceive themselves as being proficient in the leadership skills area of
communication.
Table 4-13: Communication Skill Self-perceived Proficiency Item Response Scores M SD Q 22: Interact and communicate with people who have divergent 4.21 .76 points of view Q 23: Identify barriers to listening 3.75 .86 Q 24: Write for various organizational purposes (i.e., technical 3.84 .95 writing, professional publications, etc.) Q 25: Read and comprehend a wide range of publications 3.70 .85 Q 26: Reduce barriers to listening 3.75 .72 Q 27: Recognize and effectively use nonverbal cues or behaviors 3.80 .84 Q 28: Write for various audiences 3.89 .80
The Emotional Intelligence Skills area had eight questions. The response mean
score, along with the standard deviation for each question, is listed in Table 4-14.
Table 4-14: Emotional Intelligence Self-perceived Proficiency Item Response Scores M SD Q 29: Set priorities to effectively manage personal time 3.55 .85 Q 30: Resolve conflict 3.87 .76 Q31: Make use of constructive criticism without becoming critical 4.07 .68 and angry Q 32: Separate personalities from behaviors 3.77 .76 Q 33: Negotiate agreement 3.88 .76 Q 34: High level of motivation 4.46 .71 Q 35: Control emotions in emotional situations 3.95 .80 Q 36: Set priorities to effectively manage organizational time 3.86 .72 Q 37: Respect for the time commitments of others 4.20 .67
The Industry Knowledge Skills area had seven questions. The response mean
score, along with the standard deviation for each question, is listed in Table 4-15.
Academic program leaders self-perceived proficiency in the industry skills area is lower
then other leadership skill areas.
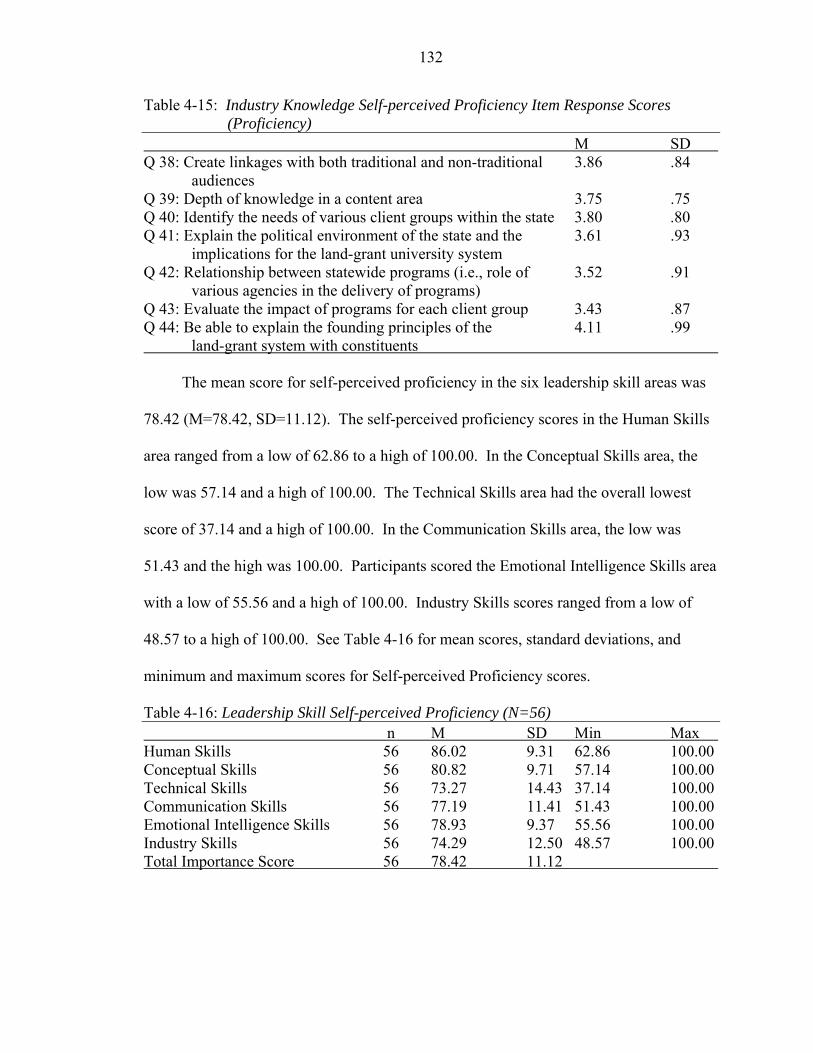
132
Table 4-15: Industry Knowledge Self-perceived Proficiency Item Response Scores (Proficiency)
M SD Q 38: Create linkages with both traditional and non-traditional 3.86 .84 audiences Q 39: Depth of knowledge in a content area 3.75 .75 Q 40: Identify the needs of various client groups within the state 3.80 .80 Q 41: Explain the political environment of the state and the 3.61 .93
implications for the land-grant university system Q 42: Relationship between statewide programs (i.e., role of 3.52 .91
various agencies in the delivery of programs) Q 43: Evaluate the impact of programs for each client group 3.43 .87 Q 44: Be able to explain the founding principles of the 4.11 .99 land-grant system with constituents
The mean score for self-perceived proficiency in the six leadership skill areas was
78.42 (M=78.42, SD=11.12). The self-perceived proficiency scores in the Human Skills
area ranged from a low of 62.86 to a high of 100.00. In the Conceptual Skills area, the
low was 57.14 and a high of 100.00. The Technical Skills area had the overall lowest
score of 37.14 and a high of 100.00. In the Communication Skills area, the low was
51.43 and the high was 100.00. Participants scored the Emotional Intelligence Skills area
with a low of 55.56 and a high of 100.00. Industry Skills scores ranged from a low of
48.57 to a high of 100.00. See Table 4-16 for mean scores, standard deviations, and
minimum and maximum scores for Self-perceived Proficiency scores.
Table 4-16: Leadership Skill Self-perceived Proficiency (N=56) n M SD Min Max Human Skills 56 86.02 9.31 62.86 100.00 Conceptual Skills 56 80.82 9.71 57.14 100.00 Technical Skills 56 73.27 14.43 37.14 100.00 Communication Skills 56 77.19 11.41 51.43 100.00 Emotional Intelligence Skills 56 78.93 9.37 55.56 100.00 Industry Skills 56 74.29 12.50 48.57 100.00 Total Importance Score 56 78.42 11.12
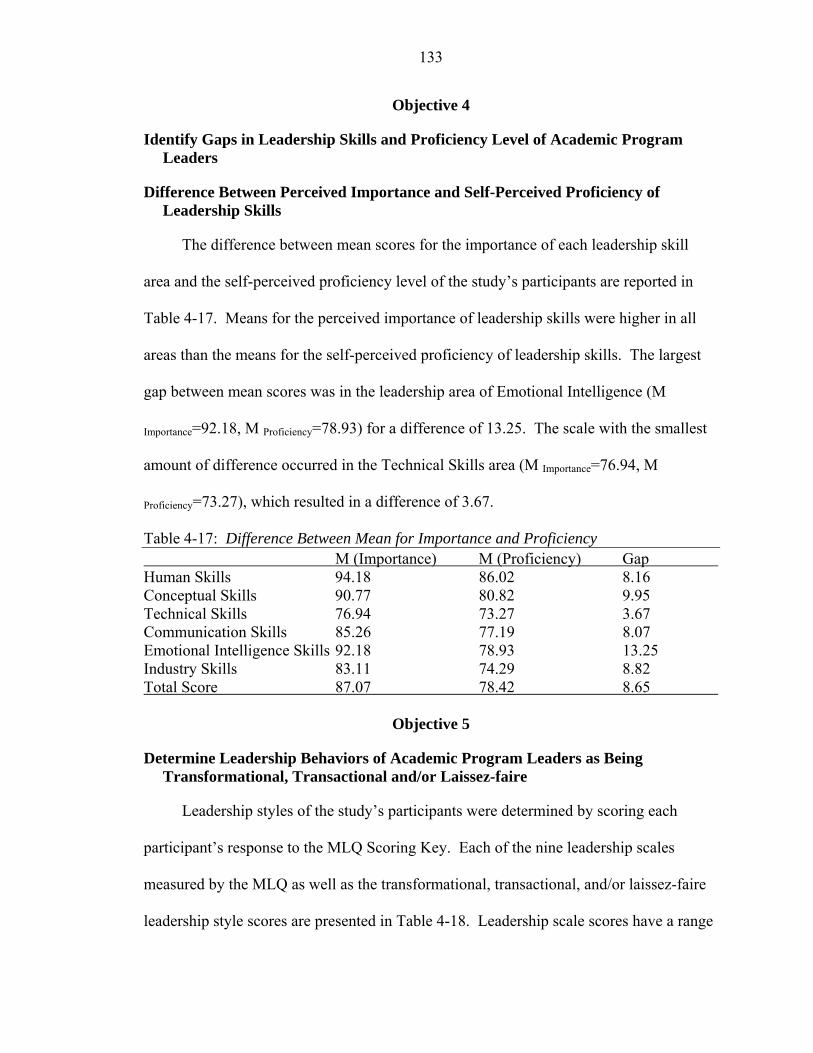
133
Objective 4
Identify Gaps in Leadership Skills and Proficiency Level of Academic Program Leaders
Difference Between Perceived Importance and Self-Perceived Proficiency of Leadership Skills
The difference between mean scores for the importance of each leadership skill
area and the self-perceived proficiency level of the study’s participants are reported in
Table 4-17. Means for the perceived importance of leadership skills were higher in all
areas than the means for the self-perceived proficiency of leadership skills. The largest
gap between mean scores was in the leadership area of Emotional Intelligence (M
Importance=92.18, M Proficiency=78.93) for a difference of 13.25. The scale with the smallest
amount of difference occurred in the Technical Skills area (M Importance=76.94, M
Proficiency=73.27), which resulted in a difference of 3.67.
Table 4-17: Difference Between Mean for Importance and Proficiency M (Importance) M (Proficiency) Gap Human Skills 94.18 86.02 8.16 Conceptual Skills 90.77 80.82 9.95 Technical Skills 76.94 73.27 3.67 Communication Skills 85.26 77.19 8.07 Emotional Intelligence Skills 92.18 78.93 13.25 Industry Skills 83.11 74.29 8.82 Total Score 87.07 78.42 8.65
Objective 5
Determine Leadership Behaviors of Academic Program Leaders as Being Transformational, Transactional and/or Laissez-faire
Leadership styles of the study’s participants were determined by scoring each
participant’s response to the MLQ Scoring Key. Each of the nine leadership scales
measured by the MLQ as well as the transformational, transactional, and/or laissez-faire
leadership style scores are presented in Table 4-18. Leadership scale scores have a range
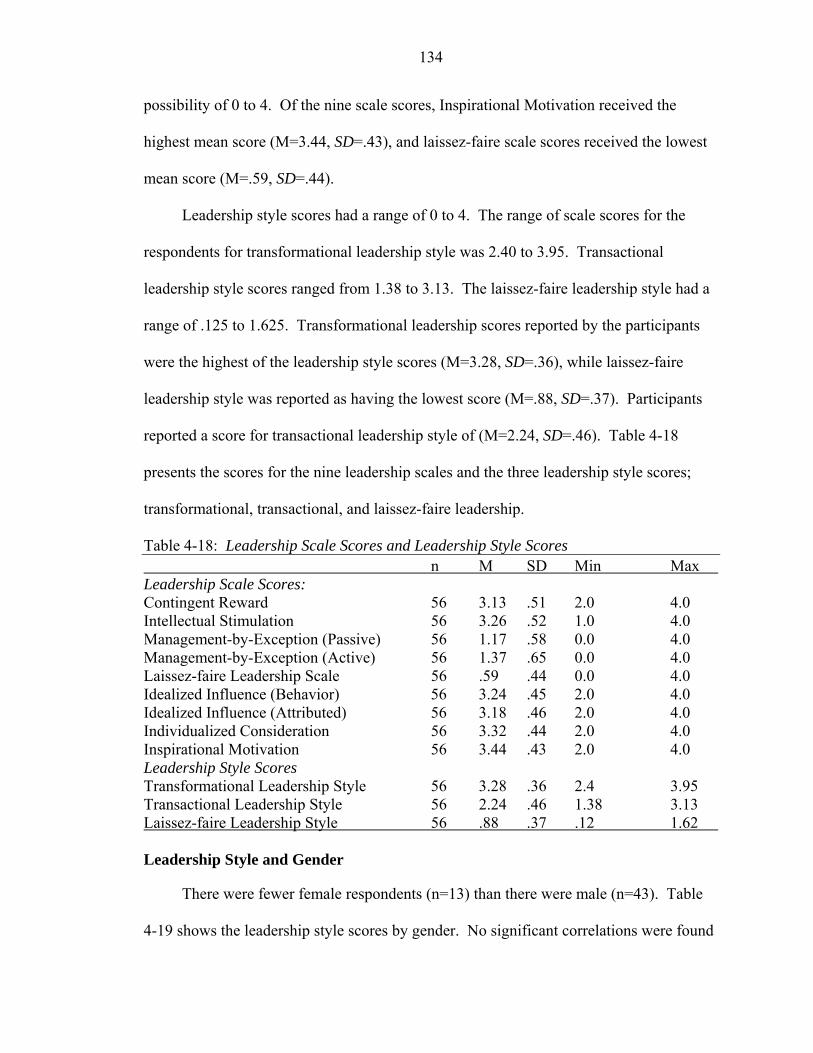
134
possibility of 0 to 4. Of the nine scale scores, Inspirational Motivation received the
highest mean score (M=3.44, SD=.43), and laissez-faire scale scores received the lowest
mean score (M=.59, SD=.44).
Leadership style scores had a range of 0 to 4. The range of scale scores for the
respondents for transformational leadership style was 2.40 to 3.95. Transactional
leadership style scores ranged from 1.38 to 3.13. The laissez-faire leadership style had a
range of .125 to 1.625. Transformational leadership scores reported by the participants
were the highest of the leadership style scores (M=3.28, SD=.36), while laissez-faire
leadership style was reported as having the lowest score (M=.88, SD=.37). Participants
reported a score for transactional leadership style of (M=2.24, SD=.46). Table 4-18
presents the scores for the nine leadership scales and the three leadership style scores;
transformational, transactional, and laissez-faire leadership.
Table 4-18: Leadership Scale Scores and Leadership Style Scores n M SD Min Max Leadership Scale Scores: Contingent Reward 56 3.13 .51 2.0 4.0 Intellectual Stimulation 56 3.26 .52 1.0 4.0 Management-by-Exception (Passive) 56 1.17 .58 0.0 4.0 Management-by-Exception (Active) 56 1.37 .65 0.0 4.0 Laissez-faire Leadership Scale 56 .59 .44 0.0 4.0 Idealized Influence (Behavior) 56 3.24 .45 2.0 4.0 Idealized Influence (Attributed) 56 3.18 .46 2.0 4.0 Individualized Consideration 56 3.32 .44 2.0 4.0 Inspirational Motivation 56 3.44 .43 2.0 4.0 Leadership Style Scores Transformational Leadership Style 56 3.28 .36 2.4 3.95 Transactional Leadership Style 56 2.24 .46 1.38 3.13 Laissez-faire Leadership Style 56 .88 .37 .12 1.62 Leadership Style and Gender
There were fewer female respondents (n=13) than there were male (n=43). Table
4-19 shows the leadership style scores by gender. No significant correlations were found
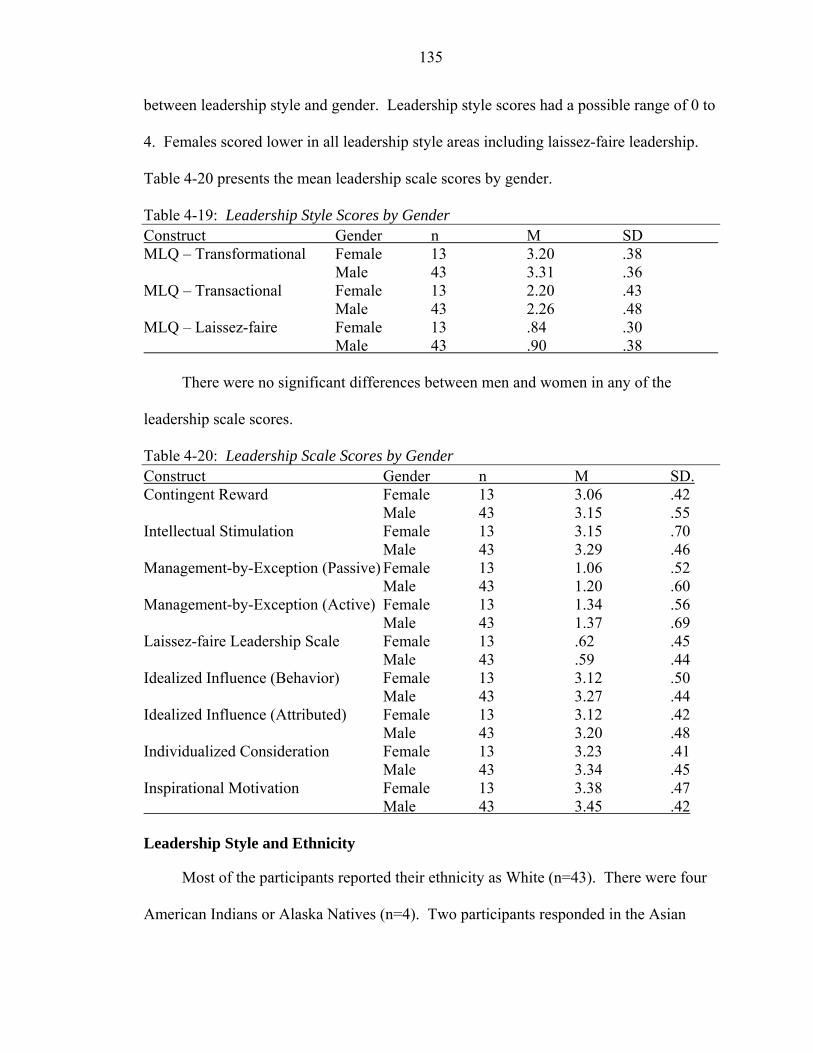
135
between leadership style and gender. Leadership style scores had a possible range of 0 to
4. Females scored lower in all leadership style areas including laissez-faire leadership.
Table 4-20 presents the mean leadership scale scores by gender.
Table 4-19: Leadership Style Scores by Gender Construct Gender n M SD MLQ – Transformational Female 13 3.20 .38
Male 43 3.31 .36 MLQ – Transactional Female 13 2.20 .43 Male 43 2.26 .48 MLQ – Laissez-faire Female 13 .84 .30 Male 43 .90 .38
There were no significant differences between men and women in any of the
leadership scale scores.
Table 4-20: Leadership Scale Scores by Gender Construct Gender n M SD. Contingent Reward Female 13 3.06 .42 Male 43 3.15 .55 Intellectual Stimulation Female 13 3.15 .70 Male 43 3.29 .46 Management-by-Exception (Passive) Female 13 1.06 .52 Male 43 1.20 .60 Management-by-Exception (Active) Female 13 1.34 .56 Male 43 1.37 .69 Laissez-faire Leadership Scale Female 13 .62 .45 Male 43 .59 .44 Idealized Influence (Behavior) Female 13 3.12 .50 Male 43 3.27 .44 Idealized Influence (Attributed) Female 13 3.12 .42 Male 43 3.20 .48 Individualized Consideration Female 13 3.23 .41 Male 43 3.34 .45 Inspirational Motivation Female 13 3.38 .47 Male 43 3.45 .42 Leadership Style and Ethnicity
Most of the participants reported their ethnicity as White (n=43). There were four
American Indians or Alaska Natives (n=4). Two participants responded in the Asian
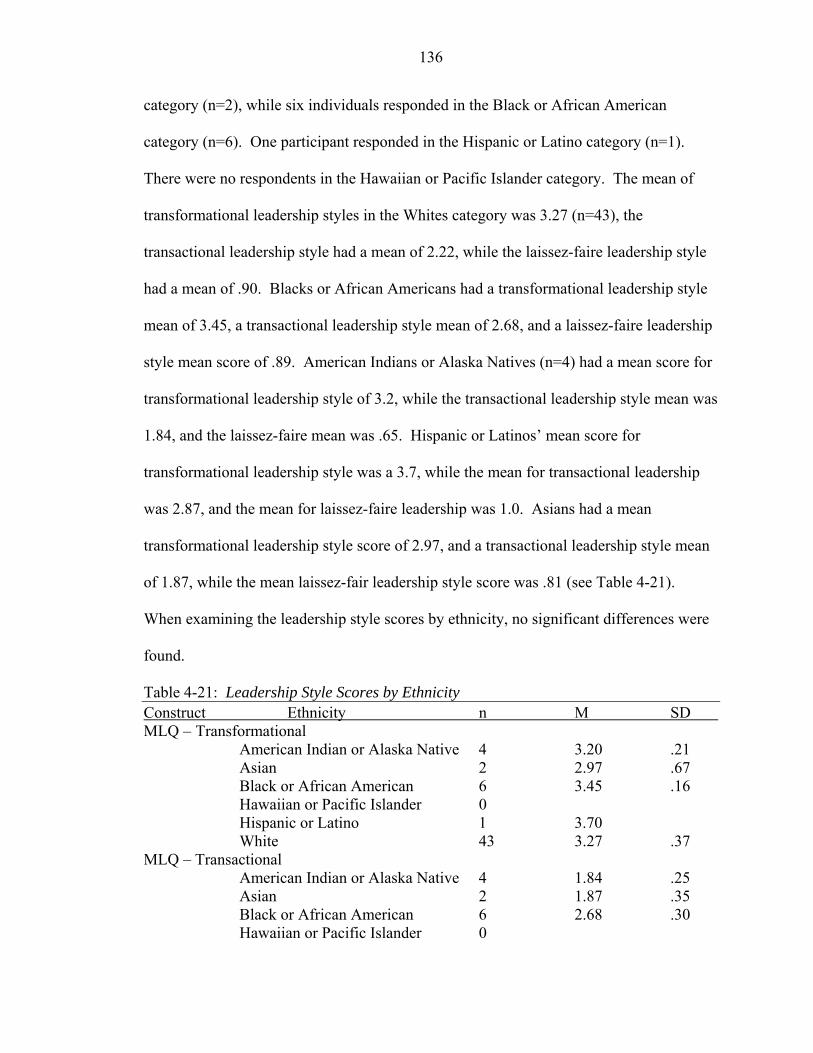
136
category (n=2), while six individuals responded in the Black or African American
category (n=6). One participant responded in the Hispanic or Latino category (n=1).
There were no respondents in the Hawaiian or Pacific Islander category. The mean of
transformational leadership styles in the Whites category was 3.27 (n=43), the
transactional leadership style had a mean of 2.22, while the laissez-faire leadership style
had a mean of .90. Blacks or African Americans had a transformational leadership style
mean of 3.45, a transactional leadership style mean of 2.68, and a laissez-faire leadership
style mean score of .89. American Indians or Alaska Natives (n=4) had a mean score for
transformational leadership style of 3.2, while the transactional leadership style mean was
1.84, and the laissez-faire mean was .65. Hispanic or Latinos’ mean score for
transformational leadership style was a 3.7, while the mean for transactional leadership
was 2.87, and the mean for laissez-faire leadership was 1.0. Asians had a mean
transformational leadership style score of 2.97, and a transactional leadership style mean
of 1.87, while the mean laissez-fair leadership style score was .81 (see Table 4-21).
When examining the leadership style scores by ethnicity, no significant differences were
found.
Table 4-21: Leadership Style Scores by Ethnicity Construct Ethnicity n M SD MLQ – Transformational
American Indian or Alaska Native 4 3.20 .21 Asian 2 2.97 .67 Black or African American 6 3.45 .16 Hawaiian or Pacific Islander 0 Hispanic or Latino 1 3.70 White 43 3.27 .37
MLQ – Transactional American Indian or Alaska Native 4 1.84 .25 Asian 2 1.87 .35 Black or African American 6 2.68 .30 Hawaiian or Pacific Islander 0
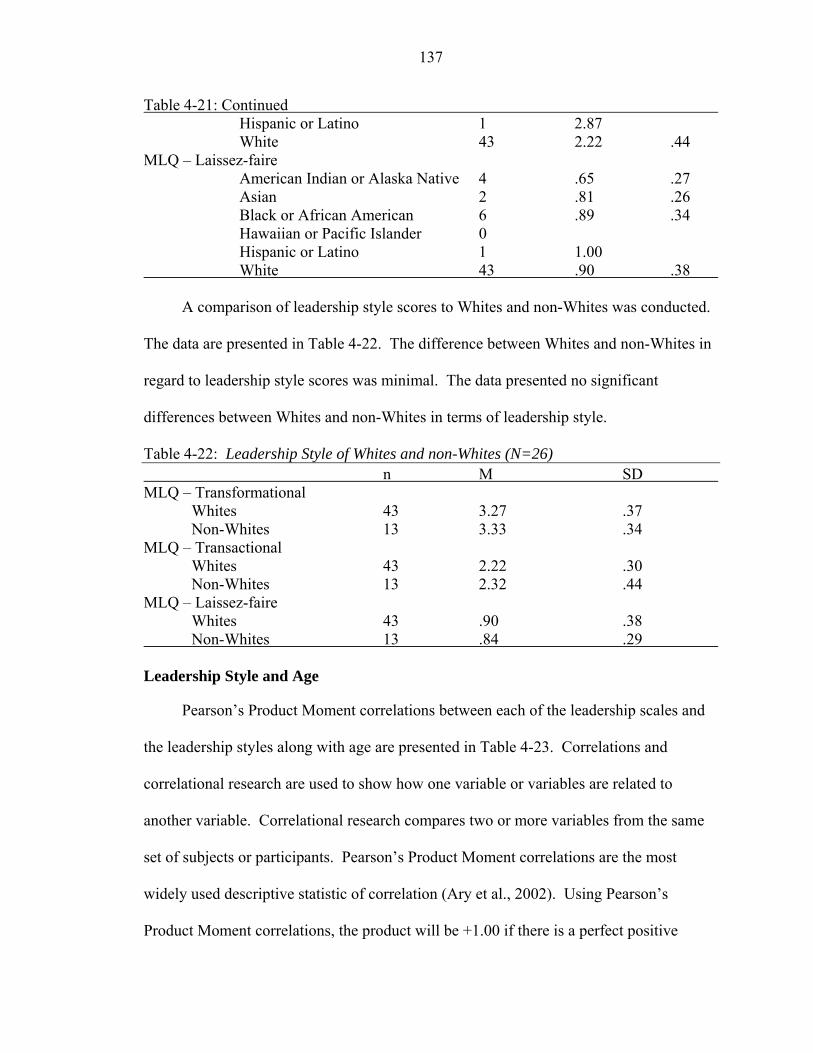
137
Table 4-21: Continued Hispanic or Latino 1 2.87 White 43 2.22 .44
MLQ – Laissez-faire American Indian or Alaska Native 4 .65 .27 Asian 2 .81 .26 Black or African American 6 .89 .34 Hawaiian or Pacific Islander 0 Hispanic or Latino 1 1.00
White 43 .90 .38
A comparison of leadership style scores to Whites and non-Whites was conducted.
The data are presented in Table 4-22. The difference between Whites and non-Whites in
regard to leadership style scores was minimal. The data presented no significant
differences between Whites and non-Whites in terms of leadership style.
Table 4-22: Leadership Style of Whites and non-Whites (N=26) n M SD MLQ – Transformational Whites 43 3.27 .37 Non-Whites 13 3.33 .34 MLQ – Transactional Whites 43 2.22 .30 Non-Whites 13 2.32 .44 MLQ – Laissez-faire Whites 43 .90 .38 Non-Whites 13 .84 .29 Leadership Style and Age
Pearson’s Product Moment correlations between each of the leadership scales and
the leadership styles along with age are presented in Table 4-23. Correlations and
correlational research are used to show how one variable or variables are related to
another variable. Correlational research compares two or more variables from the same
set of subjects or participants. Pearson’s Product Moment correlations are the most
widely used descriptive statistic of correlation (Ary et al., 2002). Using Pearson’s
Product Moment correlations, the product will be +1.00 if there is a perfect positive
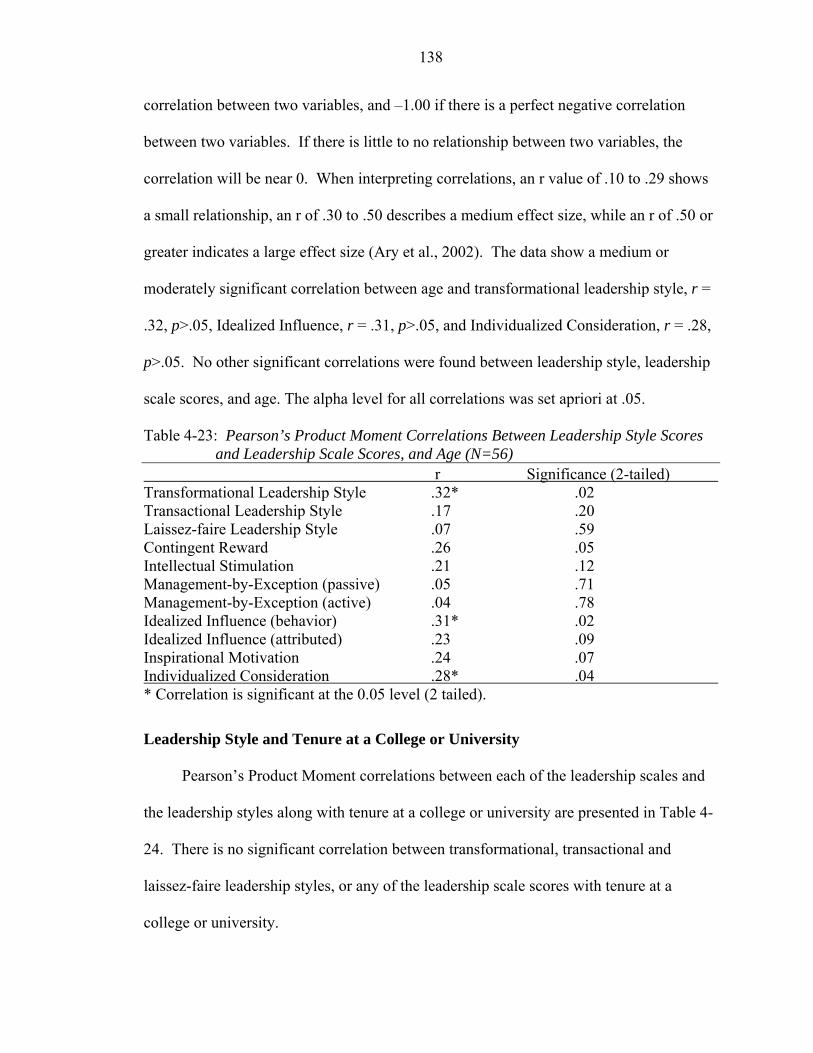
138
correlation between two variables, and –1.00 if there is a perfect negative correlation
between two variables. If there is little to no relationship between two variables, the
correlation will be near 0. When interpreting correlations, an r value of .10 to .29 shows
a small relationship, an r of .30 to .50 describes a medium effect size, while an r of .50 or
greater indicates a large effect size (Ary et al., 2002). The data show a medium or
moderately significant correlation between age and transformational leadership style, r =
.32, p>.05, Idealized Influence, r = .31, p>.05, and Individualized Consideration, r = .28,
p>.05. No other significant correlations were found between leadership style, leadership
scale scores, and age. The alpha level for all correlations was set apriori at .05.
Table 4-23: Pearson’s Product Moment Correlations Between Leadership Style Scores and Leadership Scale Scores, and Age (N=56)
r Significance (2-tailed) Transformational Leadership Style .32* .02 Transactional Leadership Style .17 .20 Laissez-faire Leadership Style .07 .59 Contingent Reward .26 .05 Intellectual Stimulation .21 .12 Management-by-Exception (passive) .05 .71 Management-by-Exception (active) .04 .78 Idealized Influence (behavior) .31* .02 Idealized Influence (attributed) .23 .09 Inspirational Motivation .24 .07 Individualized Consideration .28* .04 * Correlation is significant at the 0.05 level (2 tailed).
Leadership Style and Tenure at a College or University
Pearson’s Product Moment correlations between each of the leadership scales and
the leadership styles along with tenure at a college or university are presented in Table 4-
24. There is no significant correlation between transformational, transactional and
laissez-faire leadership styles, or any of the leadership scale scores with tenure at a
college or university.
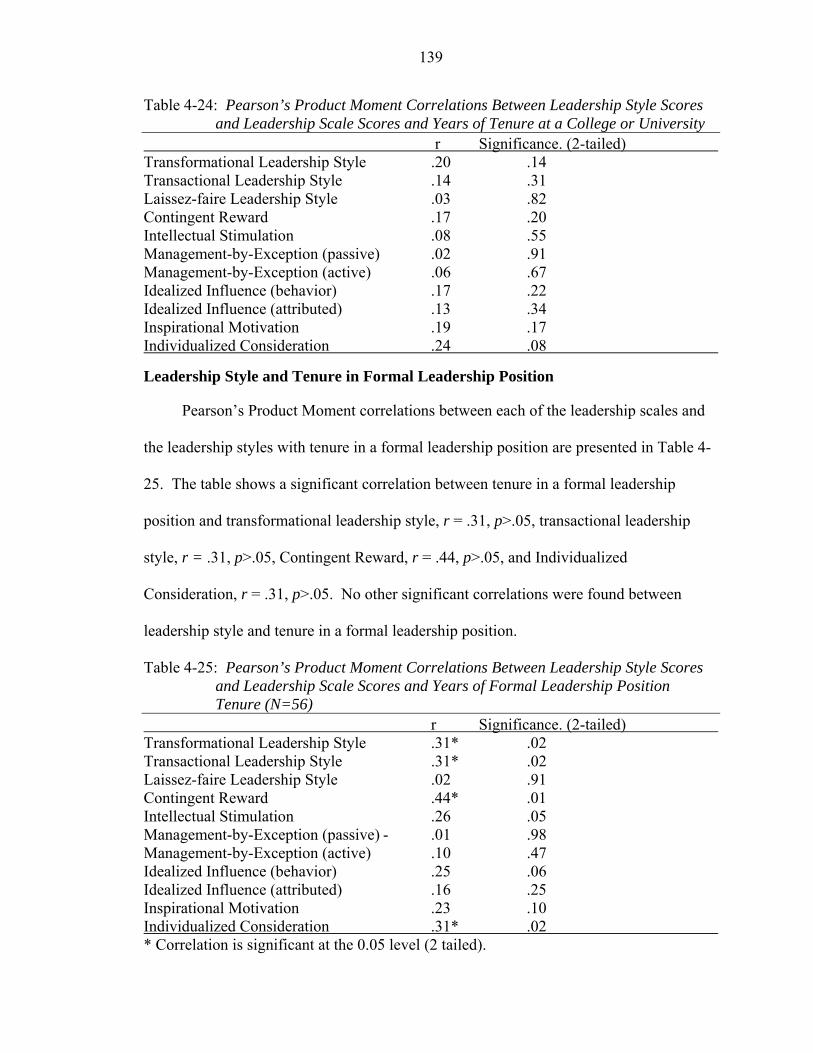
139
Table 4-24: Pearson’s Product Moment Correlations Between Leadership Style Scores and Leadership Scale Scores and Years of Tenure at a College or University
r Significance. (2-tailed) Transformational Leadership Style .20 .14 Transactional Leadership Style .14 .31 Laissez-faire Leadership Style .03 .82 Contingent Reward .17 .20 Intellectual Stimulation .08 .55 Management-by-Exception (passive) .02 .91 Management-by-Exception (active) .06 .67 Idealized Influence (behavior) .17 .22 Idealized Influence (attributed) .13 .34 Inspirational Motivation .19 .17 Individualized Consideration .24 .08 Leadership Style and Tenure in Formal Leadership Position
Pearson’s Product Moment correlations between each of the leadership scales and
the leadership styles with tenure in a formal leadership position are presented in Table 4-
25. The table shows a significant correlation between tenure in a formal leadership
position and transformational leadership style, r = .31, p>.05, transactional leadership
style, r = .31, p>.05, Contingent Reward, r = .44, p>.05, and Individualized
Consideration, r = .31, p>.05. No other significant correlations were found between
leadership style and tenure in a formal leadership position.
Table 4-25: Pearson’s Product Moment Correlations Between Leadership Style Scores and Leadership Scale Scores and Years of Formal Leadership Position Tenure (N=56)
r Significance. (2-tailed) Transformational Leadership Style .31* .02 Transactional Leadership Style .31* .02 Laissez-faire Leadership Style .02 .91 Contingent Reward .44* .01 Intellectual Stimulation .26 .05 Management-by-Exception (passive) - .01 .98 Management-by-Exception (active) .10 .47 Idealized Influence (behavior) .25 .06 Idealized Influence (attributed) .16 .25 Inspirational Motivation .23 .10 Individualized Consideration .31* .02 * Correlation is significant at the 0.05 level (2 tailed).
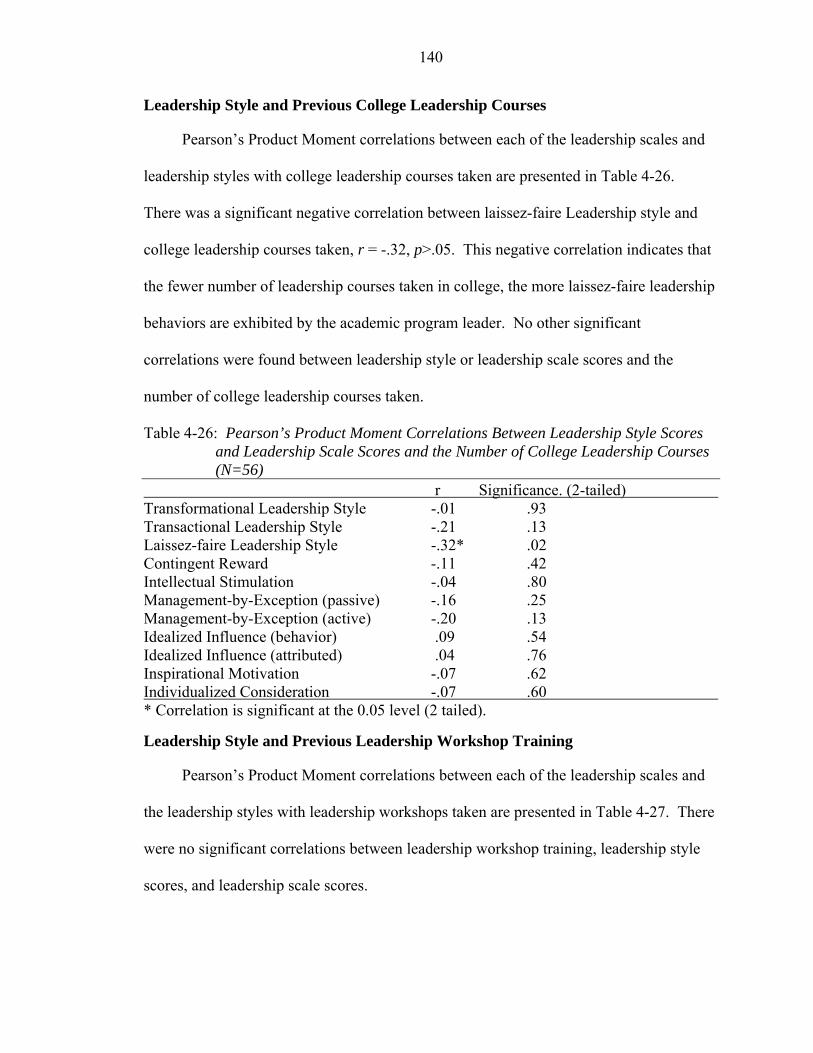
140
Leadership Style and Previous College Leadership Courses
Pearson’s Product Moment correlations between each of the leadership scales and
leadership styles with college leadership courses taken are presented in Table 4-26.
There was a significant negative correlation between laissez-faire Leadership style and
college leadership courses taken, r = -.32, p>.05. This negative correlation indicates that
the fewer number of leadership courses taken in college, the more laissez-faire leadership
behaviors are exhibited by the academic program leader. No other significant
correlations were found between leadership style or leadership scale scores and the
number of college leadership courses taken.
Table 4-26: Pearson’s Product Moment Correlations Between Leadership Style Scores and Leadership Scale Scores and the Number of College Leadership Courses (N=56)
r Significance. (2-tailed) Transformational Leadership Style -.01 .93 Transactional Leadership Style -.21 .13 Laissez-faire Leadership Style -.32* .02 Contingent Reward -.11 .42 Intellectual Stimulation -.04 .80 Management-by-Exception (passive) -.16 .25 Management-by-Exception (active) -.20 .13 Idealized Influence (behavior) .09 .54 Idealized Influence (attributed) .04 .76 Inspirational Motivation -.07 .62 Individualized Consideration -.07 .60 * Correlation is significant at the 0.05 level (2 tailed). Leadership Style and Previous Leadership Workshop Training
Pearson’s Product Moment correlations between each of the leadership scales and
the leadership styles with leadership workshops taken are presented in Table 4-27. There
were no significant correlations between leadership workshop training, leadership style
scores, and leadership scale scores.
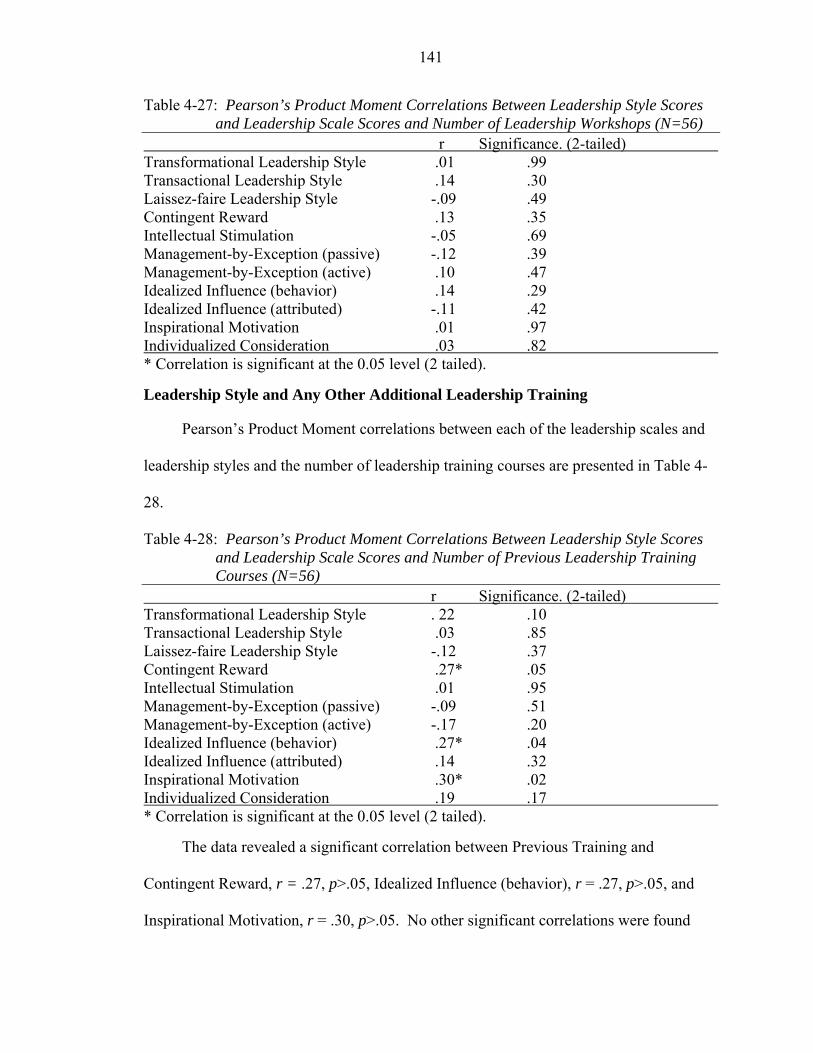
141
Table 4-27: Pearson’s Product Moment Correlations Between Leadership Style Scores and Leadership Scale Scores and Number of Leadership Workshops (N=56)
r Significance. (2-tailed) Transformational Leadership Style .01 .99 Transactional Leadership Style .14 .30 Laissez-faire Leadership Style -.09 .49 Contingent Reward .13 .35 Intellectual Stimulation -.05 .69 Management-by-Exception (passive) -.12 .39 Management-by-Exception (active) .10 .47 Idealized Influence (behavior) .14 .29 Idealized Influence (attributed) -.11 .42 Inspirational Motivation .01 .97 Individualized Consideration .03 .82 * Correlation is significant at the 0.05 level (2 tailed). Leadership Style and Any Other Additional Leadership Training
Pearson’s Product Moment correlations between each of the leadership scales and
leadership styles and the number of leadership training courses are presented in Table 4-
28.
Table 4-28: Pearson’s Product Moment Correlations Between Leadership Style Scores and Leadership Scale Scores and Number of Previous Leadership Training Courses (N=56)
r Significance. (2-tailed) Transformational Leadership Style . 22 .10 Transactional Leadership Style .03 .85 Laissez-faire Leadership Style -.12 .37 Contingent Reward .27* .05 Intellectual Stimulation .01 .95 Management-by-Exception (passive) -.09 .51 Management-by-Exception (active) -.17 .20 Idealized Influence (behavior) .27* .04 Idealized Influence (attributed) .14 .32 Inspirational Motivation .30* .02 Individualized Consideration .19 .17 * Correlation is significant at the 0.05 level (2 tailed).
The data revealed a significant correlation between Previous Training and
Contingent Reward, r = .27, p>.05, Idealized Influence (behavior), r = .27, p>.05, and
Inspirational Motivation, r = .30, p>.05. No other significant correlations were found
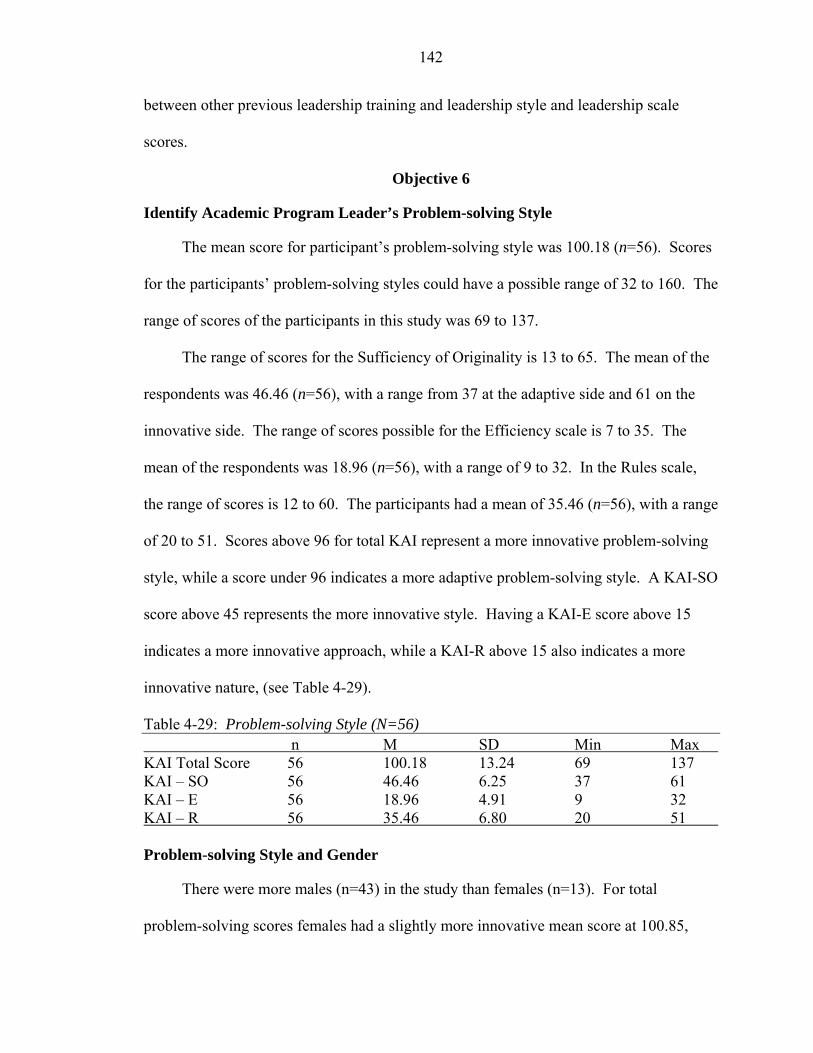
142
between other previous leadership training and leadership style and leadership scale
scores.
Objective 6
Identify Academic Program Leader’s Problem-solving Style
The mean score for participant’s problem-solving style was 100.18 (n=56). Scores
for the participants’ problem-solving styles could have a possible range of 32 to 160. The
range of scores of the participants in this study was 69 to 137.
The range of scores for the Sufficiency of Originality is 13 to 65. The mean of the
respondents was 46.46 (n=56), with a range from 37 at the adaptive side and 61 on the
innovative side. The range of scores possible for the Efficiency scale is 7 to 35. The
mean of the respondents was 18.96 (n=56), with a range of 9 to 32. In the Rules scale,
the range of scores is 12 to 60. The participants had a mean of 35.46 (n=56), with a range
of 20 to 51. Scores above 96 for total KAI represent a more innovative problem-solving
style, while a score under 96 indicates a more adaptive problem-solving style. A KAI-SO
score above 45 represents the more innovative style. Having a KAI-E score above 15
indicates a more innovative approach, while a KAI-R above 15 also indicates a more
innovative nature, (see Table 4-29).
Table 4-29: Problem-solving Style (N=56) n M SD Min Max KAI Total Score 56 100.18 13.24 69 137 KAI – SO 56 46.46 6.25 37 61 KAI – E 56 18.96 4.91 9 32 KAI – R 56 35.46 6.80 20 51 Problem-solving Style and Gender
There were more males (n=43) in the study than females (n=13). For total
problem-solving scores females had a slightly more innovative mean score at 100.85,
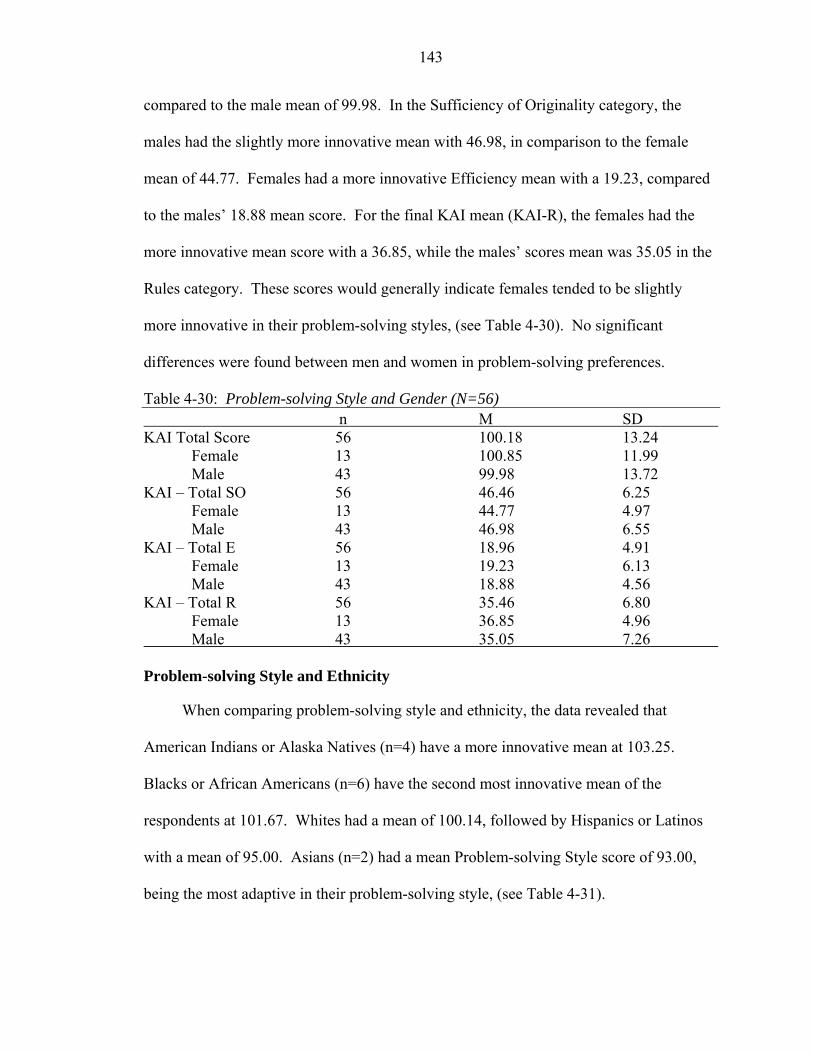
143
compared to the male mean of 99.98. In the Sufficiency of Originality category, the
males had the slightly more innovative mean with 46.98, in comparison to the female
mean of 44.77. Females had a more innovative Efficiency mean with a 19.23, compared
to the males’ 18.88 mean score. For the final KAI mean (KAI-R), the females had the
more innovative mean score with a 36.85, while the males’ scores mean was 35.05 in the
Rules category. These scores would generally indicate females tended to be slightly
more innovative in their problem-solving styles, (see Table 4-30). No significant
differences were found between men and women in problem-solving preferences.
Table 4-30: Problem-solving Style and Gender (N=56) n M SD KAI Total Score 56 100.18 13.24 Female 13 100.85 11.99 Male 43 99.98 13.72 KAI – Total SO 56 46.46 6.25 Female 13 44.77 4.97 Male 43 46.98 6.55 KAI – Total E 56 18.96 4.91 Female 13 19.23 6.13 Male 43 18.88 4.56 KAI – Total R 56 35.46 6.80 Female 13 36.85 4.96 Male 43 35.05 7.26 Problem-solving Style and Ethnicity
When comparing problem-solving style and ethnicity, the data revealed that
American Indians or Alaska Natives (n=4) have a more innovative mean at 103.25.
Blacks or African Americans (n=6) have the second most innovative mean of the
respondents at 101.67. Whites had a mean of 100.14, followed by Hispanics or Latinos
with a mean of 95.00. Asians (n=2) had a mean Problem-solving Style score of 93.00,
being the most adaptive in their problem-solving style, (see Table 4-31).
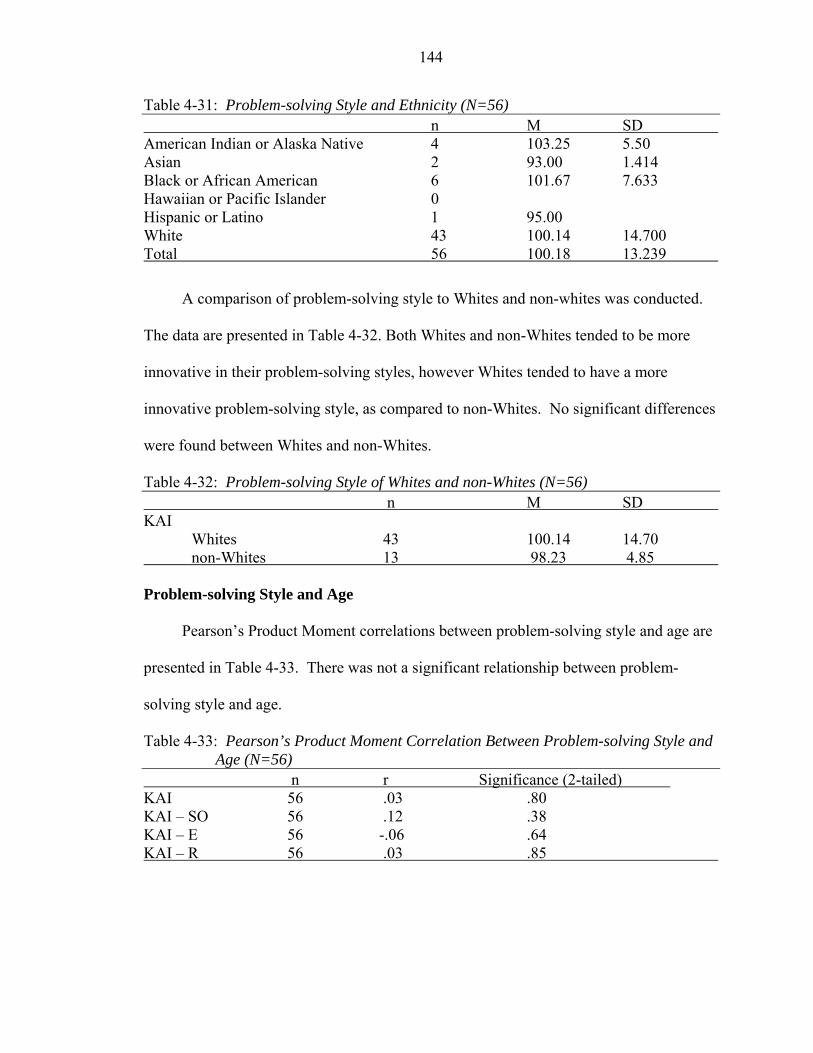
144
Table 4-31: Problem-solving Style and Ethnicity (N=56) n M SD American Indian or Alaska Native 4 103.25 5.50 Asian 2 93.00 1.414 Black or African American 6 101.67 7.633 Hawaiian or Pacific Islander 0 Hispanic or Latino 1 95.00 White 43 100.14 14.700 Total 56 100.18 13.239
A comparison of problem-solving style to Whites and non-whites was conducted.
The data are presented in Table 4-32. Both Whites and non-Whites tended to be more
innovative in their problem-solving styles, however Whites tended to have a more
innovative problem-solving style, as compared to non-Whites. No significant differences
were found between Whites and non-Whites.
Table 4-32: Problem-solving Style of Whites and non-Whites (N=56) n M SD KAI Whites 43 100.14 14.70 non-Whites 13 98.23 4.85 Problem-solving Style and Age
Pearson’s Product Moment correlations between problem-solving style and age are
presented in Table 4-33. There was not a significant relationship between problem-
solving style and age.
Table 4-33: Pearson’s Product Moment Correlation Between Problem-solving Style and Age (N=56)
n r Significance (2-tailed) KAI 56 .03 .80 KAI – SO 56 .12 .38 KAI – E 56 -.06 .64 KAI – R 56 .03 .85
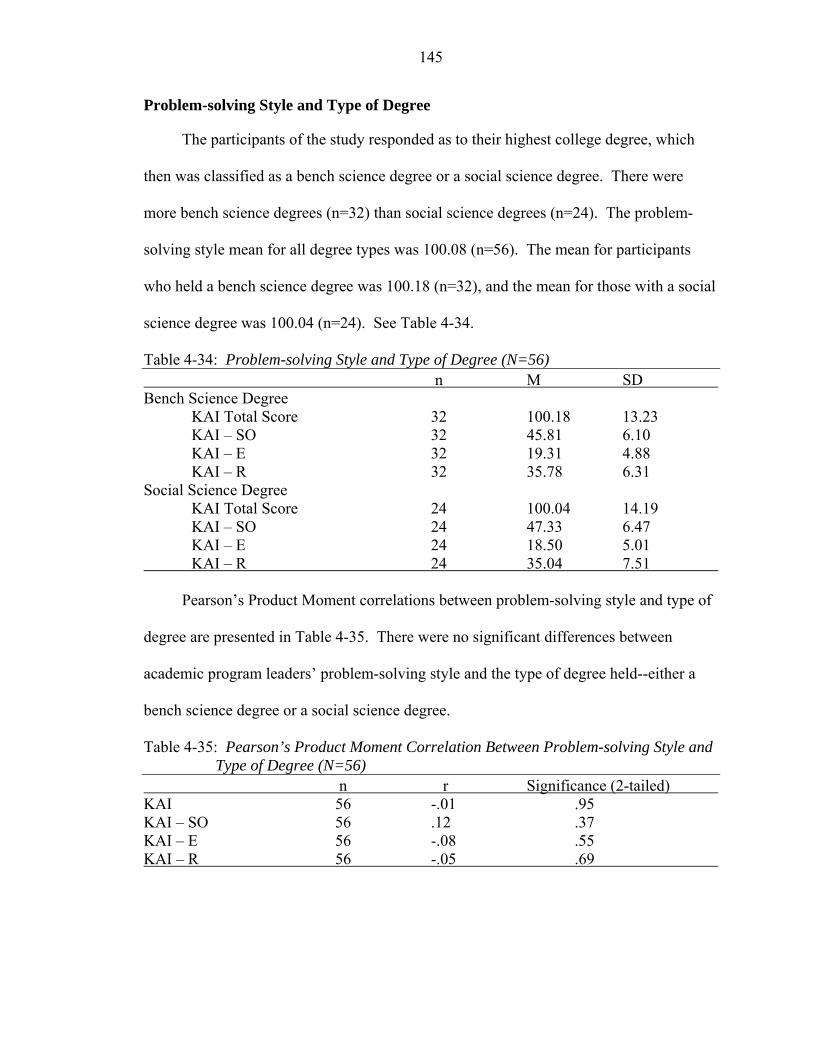
145
Problem-solving Style and Type of Degree
The participants of the study responded as to their highest college degree, which
then was classified as a bench science degree or a social science degree. There were
more bench science degrees (n=32) than social science degrees (n=24). The problem-
solving style mean for all degree types was 100.08 (n=56). The mean for participants
who held a bench science degree was 100.18 (n=32), and the mean for those with a social
science degree was 100.04 (n=24). See Table 4-34.
Table 4-34: Problem-solving Style and Type of Degree (N=56) n M SD Bench Science Degree KAI Total Score 32 100.18 13.23 KAI – SO 32 45.81 6.10 KAI – E 32 19.31 4.88 KAI – R 32 35.78 6.31 Social Science Degree
KAI Total Score 24 100.04 14.19 KAI – SO 24 47.33 6.47 KAI – E 24 18.50 5.01 KAI – R 24 35.04 7.51
Pearson’s Product Moment correlations between problem-solving style and type of
degree are presented in Table 4-35. There were no significant differences between
academic program leaders’ problem-solving style and the type of degree held--either a
bench science degree or a social science degree.
Table 4-35: Pearson’s Product Moment Correlation Between Problem-solving Style and Type of Degree (N=56)
n r Significance (2-tailed) KAI 56 -.01 .95 KAI – SO 56 .12 .37 KAI – E 56 -.08 .55 KAI – R 56 -.05 .69
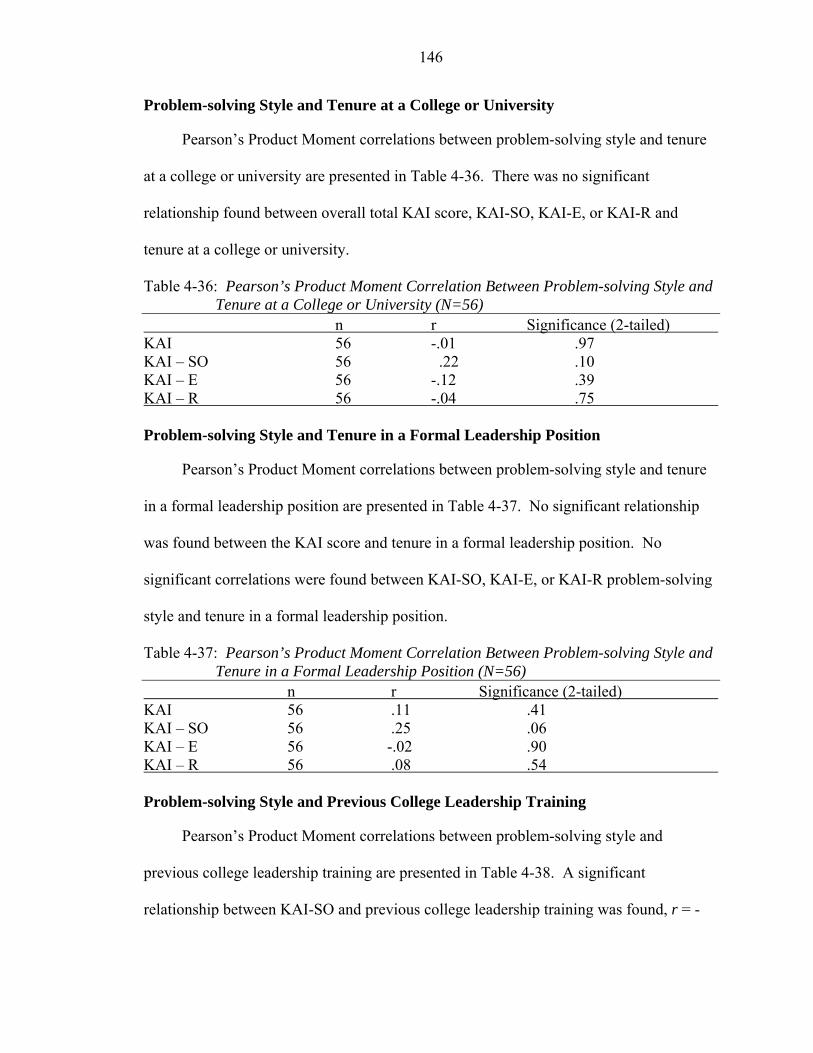
146
Problem-solving Style and Tenure at a College or University
Pearson’s Product Moment correlations between problem-solving style and tenure
at a college or university are presented in Table 4-36. There was no significant
relationship found between overall total KAI score, KAI-SO, KAI-E, or KAI-R and
tenure at a college or university.
Table 4-36: Pearson’s Product Moment Correlation Between Problem-solving Style and Tenure at a College or University (N=56)
n r Significance (2-tailed) KAI 56 -.01 .97 KAI – SO 56 .22 .10 KAI – E 56 -.12 .39 KAI – R 56 -.04 .75 Problem-solving Style and Tenure in a Formal Leadership Position
Pearson’s Product Moment correlations between problem-solving style and tenure
in a formal leadership position are presented in Table 4-37. No significant relationship
was found between the KAI score and tenure in a formal leadership position. No
significant correlations were found between KAI-SO, KAI-E, or KAI-R problem-solving
style and tenure in a formal leadership position.
Table 4-37: Pearson’s Product Moment Correlation Between Problem-solving Style and Tenure in a Formal Leadership Position (N=56)
n r Significance (2-tailed) KAI 56 .11 .41 KAI – SO 56 .25 .06 KAI – E 56 -.02 .90 KAI – R 56 .08 .54 Problem-solving Style and Previous College Leadership Training
Pearson’s Product Moment correlations between problem-solving style and
previous college leadership training are presented in Table 4-38. A significant
relationship between KAI-SO and previous college leadership training was found, r = -
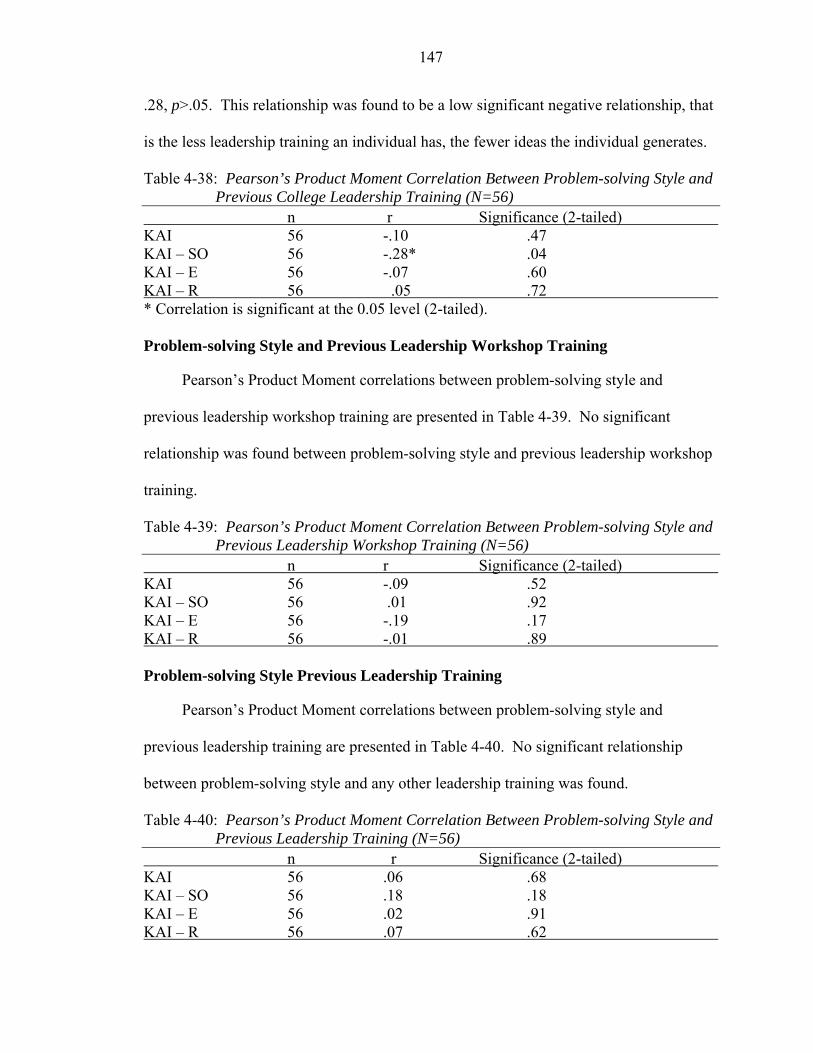
147
.28, p>.05. This relationship was found to be a low significant negative relationship, that
is the less leadership training an individual has, the fewer ideas the individual generates.
Table 4-38: Pearson’s Product Moment Correlation Between Problem-solving Style and Previous College Leadership Training (N=56)
n r Significance (2-tailed) KAI 56 -.10 .47 KAI – SO 56 -.28* .04 KAI – E 56 -.07 .60 KAI – R 56 .05 .72 * Correlation is significant at the 0.05 level (2-tailed). Problem-solving Style and Previous Leadership Workshop Training
Pearson’s Product Moment correlations between problem-solving style and
previous leadership workshop training are presented in Table 4-39. No significant
relationship was found between problem-solving style and previous leadership workshop
training.
Table 4-39: Pearson’s Product Moment Correlation Between Problem-solving Style and Previous Leadership Workshop Training (N=56)
n r Significance (2-tailed) KAI 56 -.09 .52 KAI – SO 56 .01 .92 KAI – E 56 -.19 .17 KAI – R 56 -.01 .89 Problem-solving Style Previous Leadership Training
Pearson’s Product Moment correlations between problem-solving style and
previous leadership training are presented in Table 4-40. No significant relationship
between problem-solving style and any other leadership training was found.
Table 4-40: Pearson’s Product Moment Correlation Between Problem-solving Style and Previous Leadership Training (N=56)
n r Significance (2-tailed) KAI 56 .06 .68 KAI – SO 56 .18 .18 KAI – E 56 .02 .91 KAI – R 56 .07 .62
148
Objective 7
Explain Leadership Styles of Academic Program Leaders
The previous sections discussed the relationships between individual demographic
variables and Leadership scale scores and leadership styles. Stepwise, backward multiple
regression was performed between the demographic variables (gender, ethnicity, age,
years employed with the university or college, and years in formal leadership position),
problem-solving score (KAI) and subscores (KAI-SO, KAI-E, and KAI-R), college
leadership courses, leadership workshops, and other previous leadership training with
each of the leadership skills perceived importance and the leadership skill proficiency,
with the three leadership styles (transformational leadership style, transactional
leadership style, and laissez-faire leadership) in order to explain the influence of
demographic variables on leadership style. Regression equations are used to explain the
dependent variable by using two or more independent variables. Each independent
variable is weighted in proportion to its contribution to explanatory accuracy (Ary et al.,
2002). Gall, Borg, and Gall (1996) stated that when conducting multiple regression
analysis, there should be at least 10 subjects for every variable included in the model in
order to avoid model over-specification. Since there were 56 participants in this study, a
maximum of 5 variables will be used to determine the best model for explaining the
leadership styles of academic program leaders.
Correlations were conducted with the 24 variables of the study and the three
leadership styles. The correlations for the 24 variables are shown in Appendix H. The
correlations between the variables and transformational leadership style are presented in
Table 4-41. This study found thirteen independent or explanatory variables that produced
significant correlations with the dependent variable. Significant correlations were found
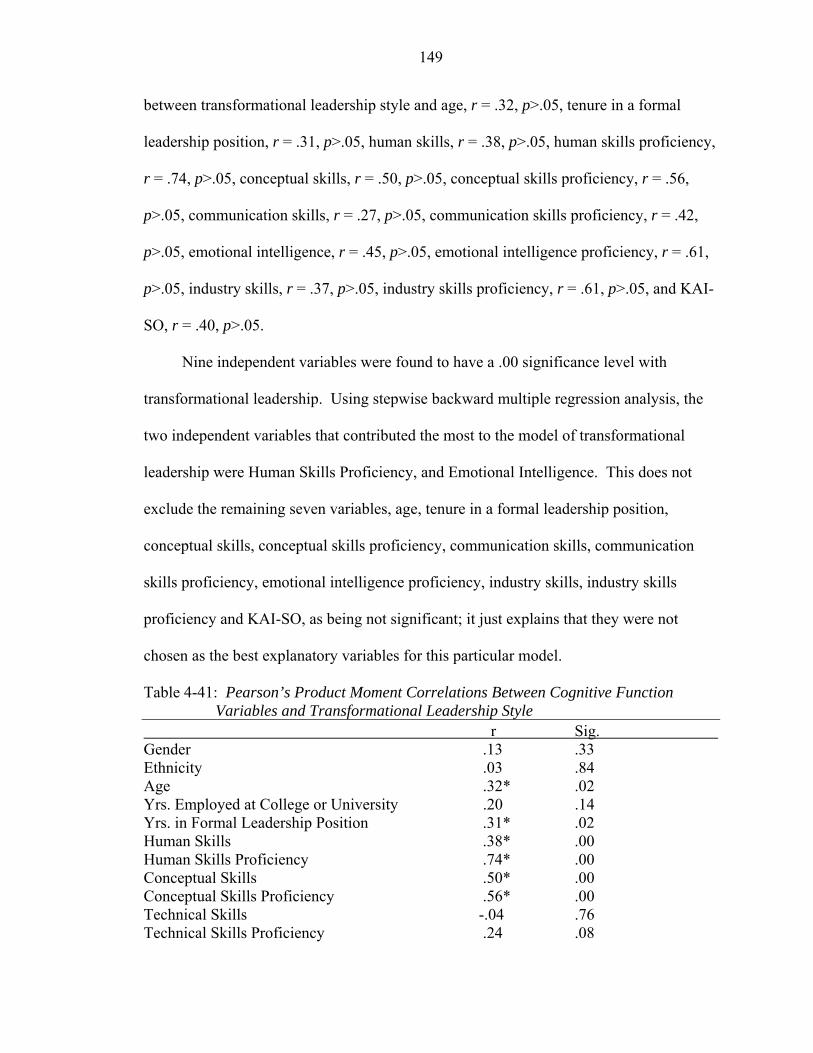
149
between transformational leadership style and age, r = .32, p>.05, tenure in a formal
leadership position, r = .31, p>.05, human skills, r = .38, p>.05, human skills proficiency,
r = .74, p>.05, conceptual skills, r = .50, p>.05, conceptual skills proficiency, r = .56,
p>.05, communication skills, r = .27, p>.05, communication skills proficiency, r = .42,
p>.05, emotional intelligence, r = .45, p>.05, emotional intelligence proficiency, r = .61,
p>.05, industry skills, r = .37, p>.05, industry skills proficiency, r = .61, p>.05, and KAI-
SO, r = .40, p>.05.
Nine independent variables were found to have a .00 significance level with
transformational leadership. Using stepwise backward multiple regression analysis, the
two independent variables that contributed the most to the model of transformational
leadership were Human Skills Proficiency, and Emotional Intelligence. This does not
exclude the remaining seven variables, age, tenure in a formal leadership position,
conceptual skills, conceptual skills proficiency, communication skills, communication
skills proficiency, emotional intelligence proficiency, industry skills, industry skills
proficiency and KAI-SO, as being not significant; it just explains that they were not
chosen as the best explanatory variables for this particular model.
Table 4-41: Pearson’s Product Moment Correlations Between Cognitive Function Variables and Transformational Leadership Style
r Sig. Gender .13 .33 Ethnicity .03 .84 Age .32* .02 Yrs. Employed at College or University .20 .14 Yrs. in Formal Leadership Position .31* .02 Human Skills .38* .00 Human Skills Proficiency .74* .00 Conceptual Skills .50* .00 Conceptual Skills Proficiency .56* .00 Technical Skills -.04 .76 Technical Skills Proficiency .24 .08
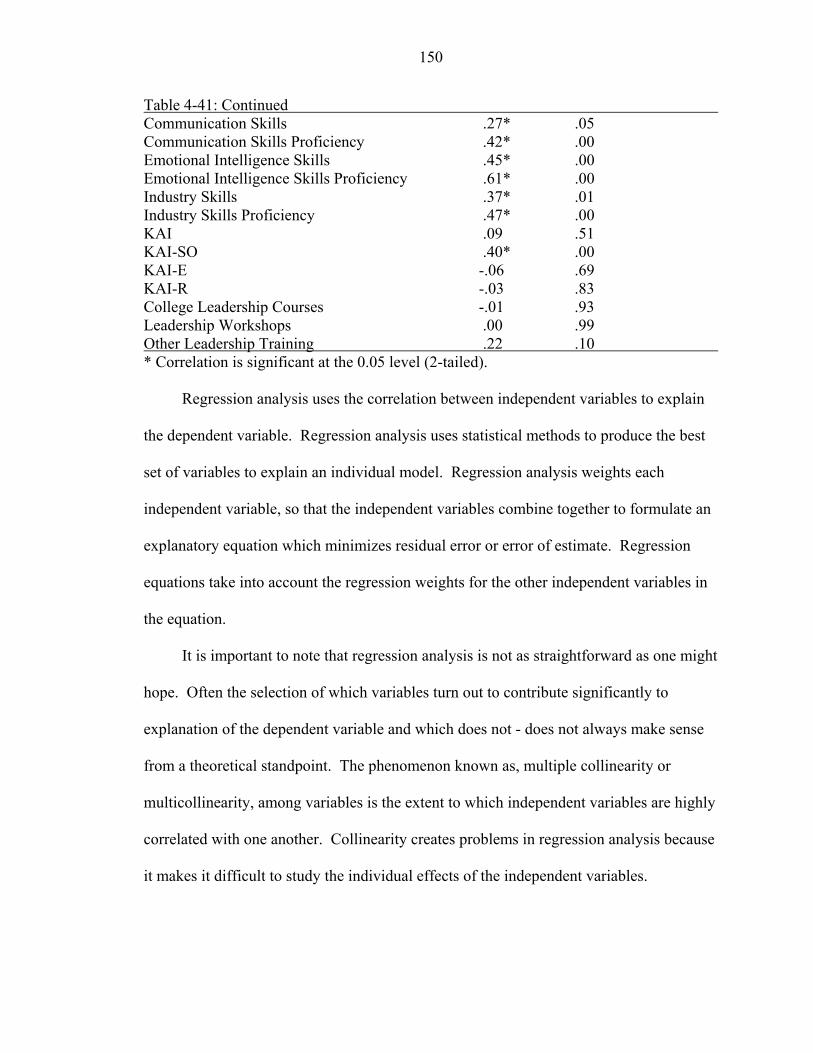
150
Table 4-41: Continued Communication Skills .27* .05 Communication Skills Proficiency .42* .00 Emotional Intelligence Skills .45* .00 Emotional Intelligence Skills Proficiency .61* .00 Industry Skills .37* .01 Industry Skills Proficiency .47* .00 KAI .09 .51 KAI-SO .40* .00 KAI-E -.06 .69 KAI-R -.03 .83 College Leadership Courses -.01 .93 Leadership Workshops .00 .99 Other Leadership Training .22 .10 * Correlation is significant at the 0.05 level (2-tailed).
Regression analysis uses the correlation between independent variables to explain
the dependent variable. Regression analysis uses statistical methods to produce the best
set of variables to explain an individual model. Regression analysis weights each
independent variable, so that the independent variables combine together to formulate an
explanatory equation which minimizes residual error or error of estimate. Regression
equations take into account the regression weights for the other independent variables in
the equation.
It is important to note that regression analysis is not as straightforward as one might
hope. Often the selection of which variables turn out to contribute significantly to
explanation of the dependent variable and which does not - does not always make sense
from a theoretical standpoint. The phenomenon known as, multiple collinearity or
multicollinearity, among variables is the extent to which independent variables are highly
correlated with one another. Collinearity creates problems in regression analysis because
it makes it difficult to study the individual effects of the independent variables.
151
Sometimes in regression equations correlations are found that do not significantly
influence the overall model. Suppressor variables are predictor variables that add
significance to the model, however, due to being combined with other variables do not
show up in the final model. Giving meaning to regression weights when multicollinearity
exists, particularly in small sample sizes is likely to be misleading (Cohen & Cohen,
1983). One would be taking an unreasonable risk in concluding that specific, significant
predictor variables, which were not included in the model, were of no importance.
Regression equations use statistical procedures to tell whether the variable entered adds
significantly to the predictable variance of the dependent variable. Regression analysis
merely enhances the overall predictability of the dependent variable and does not reflect
the theoretical significance of the individual predictor variables (Smith & Glass, 1987).
With regression analysis, predictor variables are selected statistically based on the
amount of predictable variance they add.
It has been pointed out that often times misleading interpretations of regression
coefficients are made. A problem known a “capitalization on chance” is when a
regression procedure selects and combines independent variables to conclude the best
explanation for a specific model (Smith & Glass, 1987). Regression equations assume
that the correlations between independent variables are determined with minimal error.
There are several occurrences that enlarge the capitalization on chance. The first being a
small sample size. As the ratio of the number of independent variables to the size of the
sample rises, the results can become misleading. In this study there were 24 independent
variables with a sample size of 56. This creates the opportunity for misinterpretation. A
method used to combat capitalization on chance is to pick a limited number of
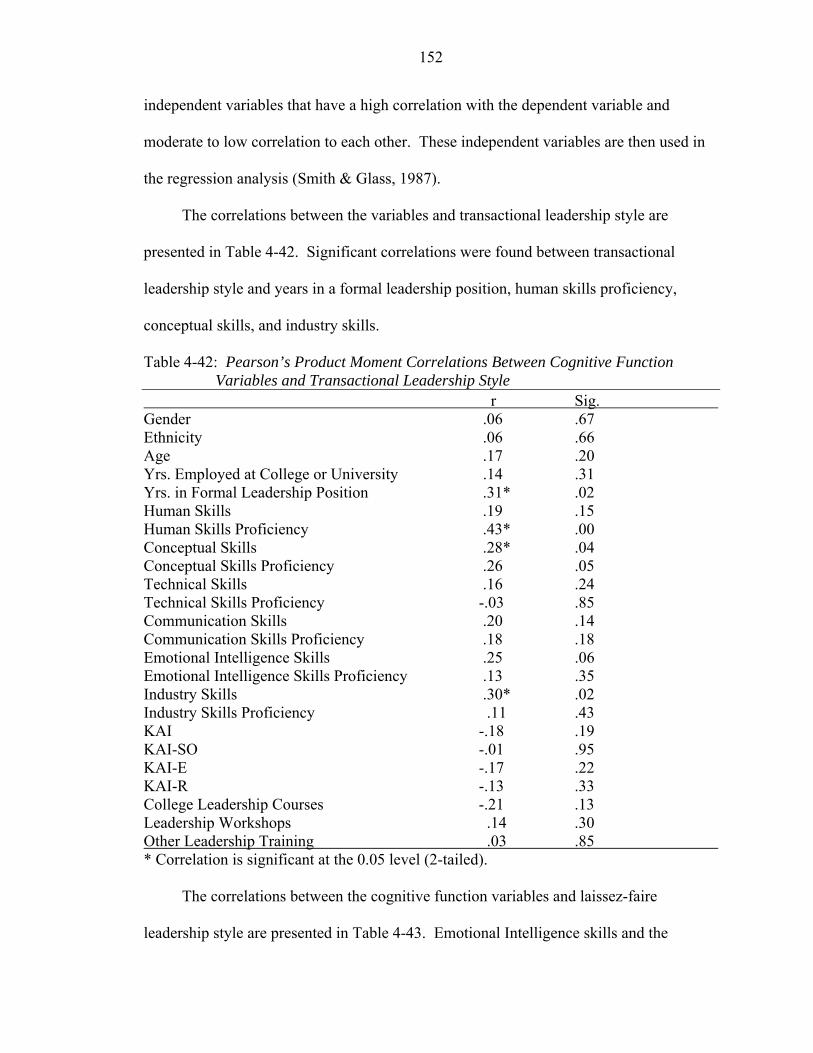
152
independent variables that have a high correlation with the dependent variable and
moderate to low correlation to each other. These independent variables are then used in
the regression analysis (Smith & Glass, 1987).
The correlations between the variables and transactional leadership style are
presented in Table 4-42. Significant correlations were found between transactional
leadership style and years in a formal leadership position, human skills proficiency,
conceptual skills, and industry skills.
Table 4-42: Pearson’s Product Moment Correlations Between Cognitive Function Variables and Transactional Leadership Style
r Sig. Gender .06 .67 Ethnicity .06 .66 Age .17 .20 Yrs. Employed at College or University .14 .31 Yrs. in Formal Leadership Position .31* .02 Human Skills .19 .15 Human Skills Proficiency .43* .00 Conceptual Skills .28* .04 Conceptual Skills Proficiency .26 .05 Technical Skills .16 .24 Technical Skills Proficiency -.03 .85 Communication Skills .20 .14 Communication Skills Proficiency .18 .18 Emotional Intelligence Skills .25 .06 Emotional Intelligence Skills Proficiency .13 .35 Industry Skills .30* .02 Industry Skills Proficiency .11 .43 KAI -.18 .19 KAI-SO -.01 .95 KAI-E -.17 .22 KAI-R -.13 .33 College Leadership Courses -.21 .13 Leadership Workshops .14 .30 Other Leadership Training .03 .85 * Correlation is significant at the 0.05 level (2-tailed).
The correlations between the cognitive function variables and laissez-faire
leadership style are presented in Table 4-43. Emotional Intelligence skills and the
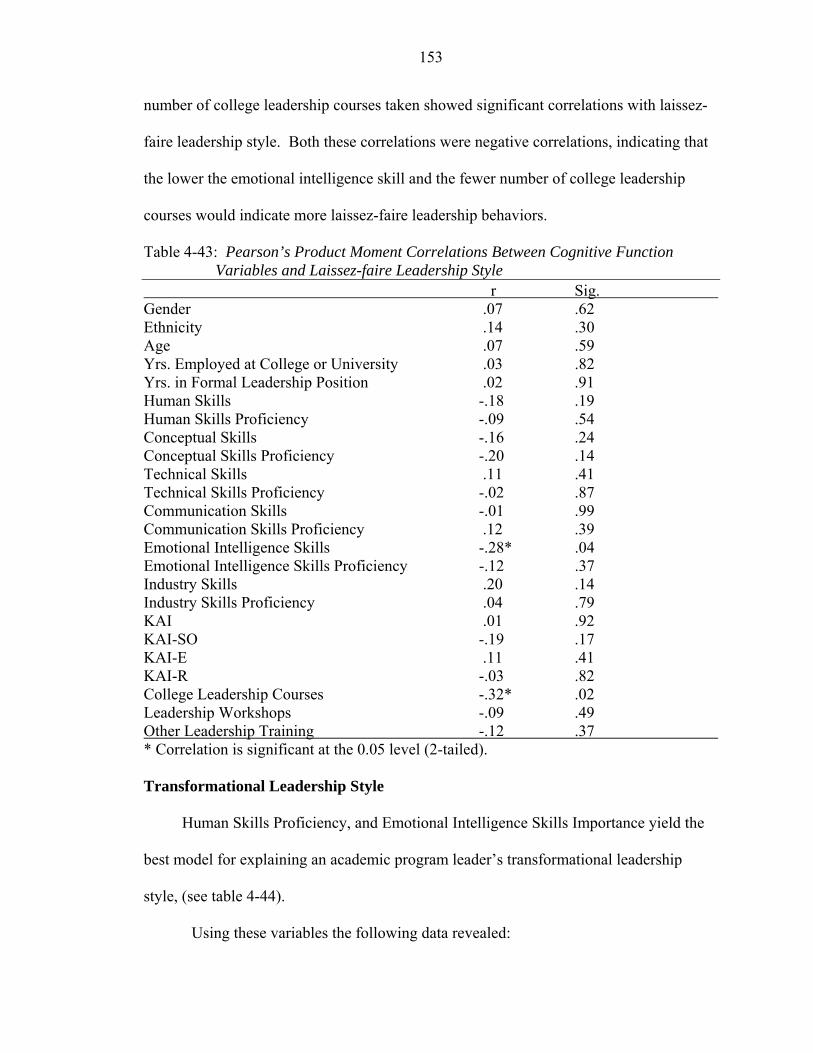
153
number of college leadership courses taken showed significant correlations with laissez-
faire leadership style. Both these correlations were negative correlations, indicating that
the lower the emotional intelligence skill and the fewer number of college leadership
courses would indicate more laissez-faire leadership behaviors.
Table 4-43: Pearson’s Product Moment Correlations Between Cognitive Function Variables and Laissez-faire Leadership Style
r Sig. Gender .07 .62 Ethnicity .14 .30 Age .07 .59 Yrs. Employed at College or University .03 .82 Yrs. in Formal Leadership Position .02 .91 Human Skills -.18 .19 Human Skills Proficiency -.09 .54 Conceptual Skills -.16 .24 Conceptual Skills Proficiency -.20 .14 Technical Skills .11 .41 Technical Skills Proficiency -.02 .87 Communication Skills -.01 .99 Communication Skills Proficiency .12 .39 Emotional Intelligence Skills -.28* .04 Emotional Intelligence Skills Proficiency -.12 .37 Industry Skills .20 .14 Industry Skills Proficiency .04 .79 KAI .01 .92 KAI-SO -.19 .17 KAI-E .11 .41 KAI-R -.03 .82 College Leadership Courses -.32* .02 Leadership Workshops -.09 .49 Other Leadership Training -.12 .37 * Correlation is significant at the 0.05 level (2-tailed). Transformational Leadership Style
Human Skills Proficiency, and Emotional Intelligence Skills Importance yield the
best model for explaining an academic program leader’s transformational leadership
style, (see table 4-44).
Using these variables the following data revealed:
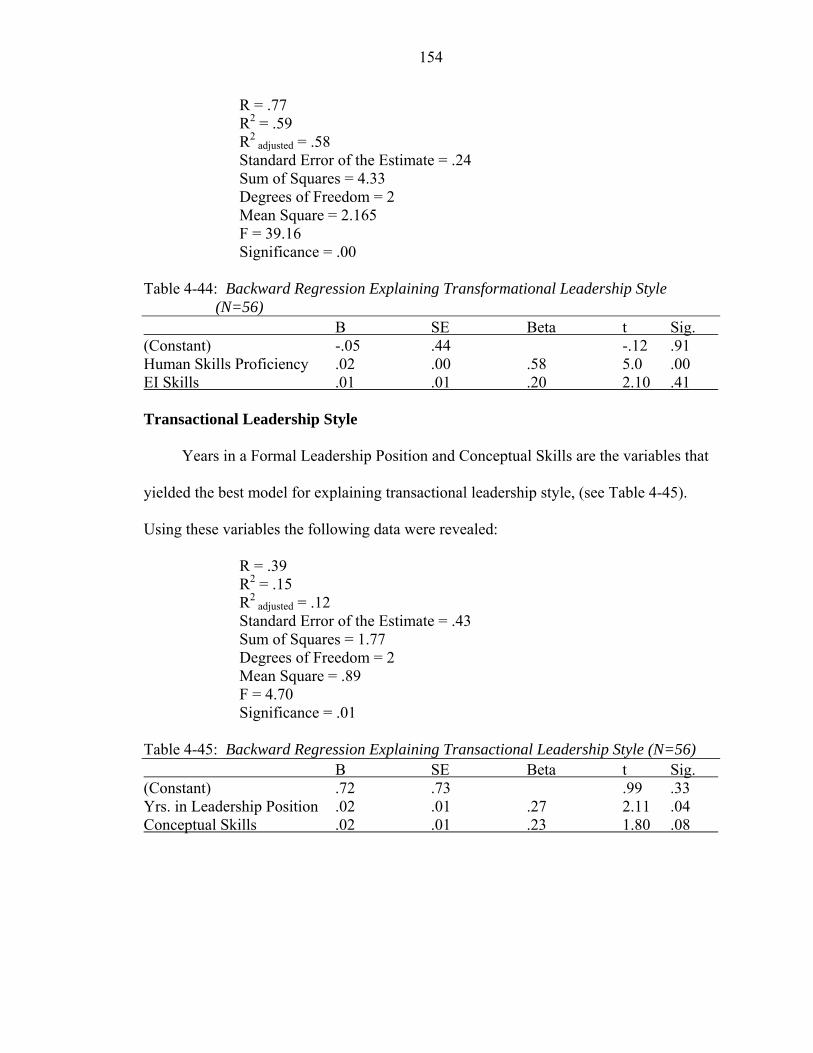
154
R = .77 R2 = .59 R2
adjusted = .58 Standard Error of the Estimate = .24 Sum of Squares = 4.33 Degrees of Freedom = 2 Mean Square = 2.165 F = 39.16 Significance = .00
Table 4-44: Backward Regression Explaining Transformational Leadership Style (N=56)
B SE Beta t Sig. (Constant) -.05 .44 -.12 .91 Human Skills Proficiency .02 .00 .58 5.0 .00 EI Skills .01 .01 .20 2.10 .41 Transactional Leadership Style
Years in a Formal Leadership Position and Conceptual Skills are the variables that
yielded the best model for explaining transactional leadership style, (see Table 4-45).
Using these variables the following data were revealed:
R = .39 R2 = .15 R2
adjusted = .12 Standard Error of the Estimate = .43 Sum of Squares = 1.77 Degrees of Freedom = 2 Mean Square = .89 F = 4.70 Significance = .01
Table 4-45: Backward Regression Explaining Transactional Leadership Style (N=56) B SE Beta t Sig. (Constant) .72 .73 .99 .33 Yrs. in Leadership Position .02 .01 .27 2.11 .04 Conceptual Skills .02 .01 .23 1.80 .08
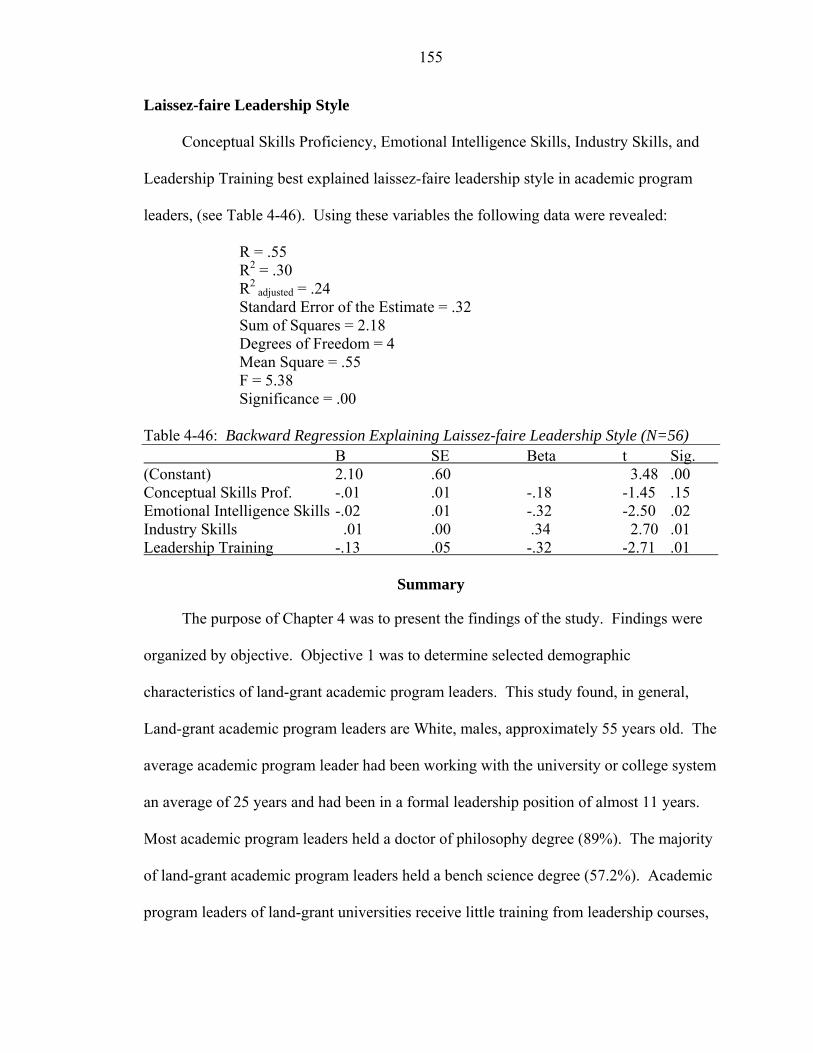
155
Laissez-faire Leadership Style
Conceptual Skills Proficiency, Emotional Intelligence Skills, Industry Skills, and
Leadership Training best explained laissez-faire leadership style in academic program
leaders, (see Table 4-46). Using these variables the following data were revealed:
R = .55 R2 = .30 R2
adjusted = .24 Standard Error of the Estimate = .32 Sum of Squares = 2.18 Degrees of Freedom = 4 Mean Square = .55 F = 5.38 Significance = .00
Table 4-46: Backward Regression Explaining Laissez-faire Leadership Style (N=56) B SE Beta t Sig. (Constant) 2.10 .60 3.48 .00 Conceptual Skills Prof. -.01 .01 -.18 -1.45 .15 Emotional Intelligence Skills -.02 .01 -.32 -2.50 .02 Industry Skills .01 .00 .34 2.70 .01 Leadership Training -.13 .05 -.32 -2.71 .01
Summary
The purpose of Chapter 4 was to present the findings of the study. Findings were
organized by objective. Objective 1 was to determine selected demographic
characteristics of land-grant academic program leaders. This study found, in general,
Land-grant academic program leaders are White, males, approximately 55 years old. The
average academic program leader had been working with the university or college system
an average of 25 years and had been in a formal leadership position of almost 11 years.
Most academic program leaders held a doctor of philosophy degree (89%). The majority
of land-grant academic program leaders held a bench science degree (57.2%). Academic
program leaders of land-grant universities receive little training from leadership courses,
156
leadership workshops. Most leadership training for academic program leaders comes
through other leadership training including the FFA, 4-H and military organizations.
Objective 2 assessed the importance of leadership skills, as determined by
academic program leaders. Academic program leaders answered questions related to
leadership skill areas including: 1) human skills, 2) conceptual skills, 3) technical skills,
4) communication skills, 5) emotional intelligence skills, and 6) industry knowledge
skills. Academic program leaders rated all leadership skill areas as important in the
fulfillment of their jobs.
Objective 3 was the self-perceived proficiency level of leadership skills by
academic program leaders. Academic program leaders indicated that they were
somewhat proficient in all leadership areas. Academic program leaders felt the least
proficient in the technical skills area while indicating they felt the most proficient in the
human skills area.
Objective 4 was to identify gaps in leadership skills and proficiency levels of
academic program leaders. Academic program leaders indicated there were gaps in all
leadership skill areas. The largest gap between perceived level of importance and
proficiency level was in the area of emotional intelligence. The smallest gap between
perceived importance and proficiency level was in the technical skills area. Findings
would indicate that academic program leaders value emotional intelligence while
believing they are not as proficient as they would like to be.
Objective 5 was to determine leadership behaviors of academic program leaders as
being transformational, transactional, and/or laissez-faire. Academic program leader’s
leadership style was determined using the Multifactor Leadership Questionnaire.
157
Participants of this study indicated using a transformational leadership style more often
then a transactional or laissez-faire style. This was the trend for both males and female
participants of this study. It was found that Whites and non-Whites shared similar
leadership styles.
Objective 6 was to identify academic program leader’s problem-solving style. The
KIA was used to measure each academic program leader’s preferred problem-solving
style. Academic program leaders had an overall mean score of 100.18, which indicates a
preferred problem-solving style, which is slightly innovative. Women academic program
leaders tended to have a slightly more innovative problem-solving style then the male
participants. White academic program leaders tended to have a more innovative
problem-solving style then non-White academic program leaders. This study found that
age showed no significant relationship in problem-solving preference.
Objective 7 was to explain leadership styles of academic program leaders. Using
stepwise backward multiple regression this study found that the best independent
variables to explain transformational leadership in academic program leaders were human
skills and emotional intelligence. Years in a formal leadership position and conceptual
skills were the variables that yielded the best model for explaining transactional
leadership style. Conceptual skills proficiency, emotional intelligence skills, industry
skills, and leadership training best explained laissez-faire leadership style in academic
program leaders.
Chapter 5 will present a more detailed discussion of these findings. Conclusions
and recommendations will be presented, as well as recommendations for future research.
158
CHAPTER 5 SUMMARY AND DISCUSSION
Chapter 1 introduced this study and described the background, purpose, and
objectives of the study. The significance of this study was also discussed. The founding
principles of the land-grant university system and colleges of agriculture and the roles
these systems play today were also presented. Definitions of key terms used in this study
were provided in Chapter 1, as well as limitations of this study.
This study was conducted to provide insight for academic program leaders and
administrators to assist with recruitment and professional leadership development. The
purpose was to identify, define, and describe the leadership skills and leadership styles of
colleges of agriculture academic program leaders. Demographic variables of the colleges
of agriculture academic program leaders were included and examined to draw a clearer
picture of those individuals who currently hold these positions, plus their training and
future training they feel would be most beneficial.
Chapter 2 discussed previous research related to this study. The theoretical
framework was evaluated and discussed. Chapter 2 reviewed the literature related to the
following 11 areas: (1) the nature of leadership; (2) definitions of leadership; (3) major
leadership theories; (4) leadership styles; (5) influence of demographics on leadership
styles; (6) leadership skills; (7) influence of demographics on leadership skills; (8)
leadership and change; (9) land-grant universities; (10) academic program leaders; and
(11) academic program leaders as change agents.
159
Methodology used to complete this study was explained in Chapter 3. The seven
research objectives identified were:
1. Determine selected demographic characteristics of land-grant academic program leaders.
2. Assess level of importance of leadership skills, as determined by academic program leaders.
3. Assess self-perceived proficiency of leadership skills of academic program leaders.
4. Identify gaps in leadership skills and proficiency level of academic program leaders.
5. Determine leadership styles of academic program leaders as being transformational, transactional and/or laissez-faire.
6. Identify an academic program leader’s problem-solving style.
7. Explain leadership styles of academic program leaders.
The research design, target populations, instrumentation, and method of data
collection and analysis, along with statistical procedures for analysis, were addressed in
Chapter 3. Methodologies used to reach the objectives of the study were also discussed.
The results and findings of this study were presented in Chapter 4.
This chapter summarizes the study and presents recommendations based on the
findings. In the final section of this chapter, specific conclusions drawn from the findings
are discussed. Implications of this study are detailed in this chapter. Future research
recommendations are also included in this chapter.
Study Summation
Statement of the Problem
Most individuals involved in higher education would agree that effective leadership
skills are important and desirable in academic leaders. Leadership studies and leadership
data are in abundant supply. However, little research has been conducted on specific
160
aspects of academic program leaders’ skills and problem-solving tendencies and also to
determine academic program leaders’ professional development needs.
A limited amount of research had been done to determine if age, gender, ethnicity,
tenure at a college or university, tenure in leadership position, or leadership training plays
a significant role in the leadership skills, leadership style and/or problem-solving style of
academic program leaders. Fewer studies exist that attempt to explain an academic
program leader’s behavior.
This research attempted to answer several questions regarding an academic
program leader’s leadership skills, leadership behaviors, and leadership styles, as well as
preferred problem-solving styles. In addition, this research sought to answer the question
of where academic program leaders believe gaps exist in their own knowledge of
leadership skill (proficiency) and those skills which they believe to be important for the
successful completion of their work.
Methodology
In order to accomplish the objectives of this study, the researchers conducted a
survey of academic program leaders, as identified in the NASULGC directory of Deans
and Directors of Academic Programs in Schools and Colleges of Agriculture, Agriculture
and Life Sciences, or Agriculture and Natural Resources. A total of 56 academic
program leaders or deans participated in this study for a response rate of 53%.
Data were collected by way of a mailed survey. Four leadership instruments were
used to collect data. The leadership skills instrument measured the academic program
leaders’ perception of the importance of specific leadership skills, as well as their self-
perceived proficiency in each of these leadership skill areas.
161
The second instrument, the Multifactor Leadership Questionnaire (MLQ),
measured the academic program leader’s leadership style as being transformational,
transactional and/or laissez-faire. This instrument also measured subscales of each of
these leadership styles, which included: Idealized Influence (attributed); Idealized
Influence (behavior); Inspirational Motivation; Intellectual Stimulation; Individualized
Consideration; Contingent Reward; Management-by-Exception (active); and
Management-by-Exception (passive).
The third instrument, Kirton’s Adaption-Innovation Inventory (KAI), measured the
preferred problem-solving style of the academic program leaders. This instrument also
measured problem-solving subcategories: Sufficiency of Originality, Efficiency, and
Rules/Group Conformity.
Finally, demographic information was collected in this study. Gender, ethnicity,
age, highest educational degree, tenure in the college or university system, and tenure in a
leadership position, as well as leadership training, were variables collected using the
demographic instrument.
The collection of data took place January 2006 through March 2006. Dillman’s
(2000) methodology of conducting survey research was followed. The population for
this study consisted of individuals listed in the NASULGC Directory of Deans and
Directors of Academic Programs in Schools and Colleges of Agriculture, Agriculture and
Life Sciences, or Agriculture and Natural Resources. The NASULGC Directory
identified 106 individuals as being academic program leaders, deans, or individuals who
held a similar position. Responses were obtained from 56 of the 106 individuals for a
response rate of 53%.
162
Data analysis consisted of descriptive statistics, frequencies, independent sample t-
tests, Pearson’s Product Moment correlations, one-way analysis of variance, and
backward-stepwise multiple regression. The SPSS™ statistical program was used for
analysis of the data.
Findings and Conclusions
The findings of this study are summarized for each of the seven objectives, as
outlined in Chapter 1.
Objective 1: To determine selected demographic characteristics of land-grant academic program leaders
Objective 1 sought to determine selected demographic characteristics of land-grant
academic program leaders. The demographic variables this study examined included
gender, age, ethnicity, tenure at a college or university, tenure in leadership position, and
previous leadership training. Findings of Objective 1 showed the majority of academic
program leaders were male, 76.8%, while 23.2% were female. Whites contributed to
76.8% of academic program leaders, 10.7% were Black or African American, 7.1% were
American Indian or Alaska Natives, 3.6% were Asian, and 1.8% were Hispanic or Latino.
These findings are supported by the literature (Chliwniak, 1997; Bartol, Evans, & Stith,
1978; Eagly & Johnson, 1990; Moore, 2003; Stedman, 2004).
Academic program leaders had a range of 28 years in terms of their age. The
youngest academic program leader was 40 years old and the oldest was 68. The mean
age of the current academic program leader was 55.11 years old. Length of time working
in the college or university system had a mean of 24.86 years. The most number of years
that an academic program leader worked or taught somewhere in the college or university
system was 40 years, while 6 years was the shortest number of years in the college or
163
university system, with a total range of 34 years. Academic program leaders holding a
formal leadership position, such as dean, assistant dean, associate dean, dean of academic
programs, or vice-president of academic programs, ranged in years from one year in their
position to a maximum of 30 years in that formal leadership position. This study concurs
with the findings of Wolverton et al. (2001) where deans are predominantly White males
in their mid-50s, holding a position of leadership for five to six years.
Currently, 89.2% of academic program deans who participated in this study held a
doctorate of philosophy degree, and 7.1% held a doctorate of education degree. The
remaining 3.4% of academic program leaders held a master’s degree. Bench science
degrees were held by 57.2% of the participants responding to this study. The remaining
42.8% of the respondents held a social science degree.
Previous research suggests academic program leaders receive little formal
leadership training (Gould, 1964). The literature suggests academic program leaders
were appointed with little or no input from faculty (Wolverton et al., 2001). Academic
program leaders received training from past leadership experiences, on-the-job training,
and institutional knowledge. College leadership courses and leadership workshops did
not have a significant impact on an academic program leader’s leadership style. The
findings of this research indicated nearly 50% of an academic program leader’s
leadership training came from a non-formal leadership experience or setting. Gould
(1964) reported similar findings when he studied administrative deans in liberal arts
colleges.
Leadership training for academic program leaders appeared to be conducted
through previous leadership training. Nearly 49% of academic program leaders received
164
training since high school to the present, not including college courses in leadership or
leadership workshops. Only 29% of an academic program leader’s training came from
leadership workshops, while the remaining 22% of leadership training was attained
through college leadership courses.
The literature reported the typical dean is a White, male between the ages of 50 and
60. The literature stated academic program leaders have little formal leadership training,
and they have typically risen to their position by working for a long period of time at the
college or university (Wolverton et al., 2001). The current study confirms these
findings.
Objective 2: To assess level of importance of leadership skills, as determined by academic program leaders
Academic program leaders were asked to assess the level of importance of specific
leadership skills from Not Important to Very Important. The possible scores for
perceived importance range from 20 to 100. Based on Moore’s (2003) study of extension
directors and administrators, scores falling between 80 and 100 are Important and Very
important. Scores falling between 60 and 80 are Somewhat Important. Scores falling
below 60 are of Little Importance to Not Important. Five of the six leadership skill areas
had means for perceived importance falling between 80 and 100 (Important and Very
Important) and the remaining leadership skill area fell in the Somewhat Important
category.
The leadership skills were divided into six leadership skill areas: (1) Human Skills;
(2) Conceptual Skills; (3) Technical Skills; (4) Communication Skills; (5) Emotional
Intelligence Skills; (6) and Industry Knowledge Skills. Academic program leaders rated
Human Skills as the most important leadership skills (M=94.18) followed by Emotional
165
Intelligence (M=92.18), Conceptual Skills (M=90.77), Communication Skills (M=85.26),
and Industry Knowledge Skills (M=83.11); Technical Skills was rated as least important
(M=76.94). These findings are similar to those that Moore (2003) found when studying
leaders in the extension system. Five of the six leadership skill areas are Important or
Very Important, while only one of the five skill areas was rated Somewhat Important.
Objective 3: To assess self-perceived proficiency of leadership skills of academic program leaders
Academic program leaders were asked to rate their self-perceived level of
proficiency for each of the skills in each leadership skills areas. The possible scores for
self-perceived proficiency range from 20 to 100. Scores that fall between 80 and 100 are
Above Average Proficiency and Very Proficient. Scores falling between 60 and 80 are
Average Proficiency. Scores falling below 60 are Below Average Proficiency (Moore,
2003).
Two of the six leadership skill areas had means for self-perceived proficiency that
fell between 80 and 100, and the remaining leadership skill proficiency areas fell in the
Average Proficiency category. Academic program leaders rated their proficiency in the
Human Skills and Conceptual Skills areas as Above Average Proficiency.
The Human Skills proficiency area of leadership ranked the highest with a mean
score (M=86.02) followed by Conceptual Skills (M=80.82), Emotional Intelligence Skills
(M=78.93), Communication Skills (M=77.19), and Industry Skills (M=74.29). Technical
Skills had the lowest mean (M=73.27). These data express academic program leaders
believe they have the least amount of proficiency in Technical Skills, but they believe
they have a great deal of proficiency in the leadership area of Human Skills. These
findings indicate academic program leaders realize human skills are important and place
166
little importance on tasks that can be performed for them, such as typing, data entry, and
so forth.
It is encouraging, if accurate, that academic program leaders believe they are Above
Average in the Human Skills area of leadership skills. Since Human Skills include
identifying personal strengths and weaknesses, respecting others, creating an
environment in which others believe you are approachable and open to new ideas, being
an effective team member, valuing the diversity of others, and creating an environment in
which team members are willing to share ideas, it is reassuring to know that academic
program leaders believe they are doing an Above Average job in this area.
Objective 4: To identify gaps in leadership skills and proficiency level of academic program leaders
The purpose of Objective 4 was to identify the gaps between what academic
program leaders felt to be important leadership skills and how proficient they perceived
themselves to be at those leadership skills. The largest and most significant difference
between perceived leadership skill importance and proficiency level occurred in the
leadership skill area of Emotional Intelligence, where the level of importance for the
skills were rated higher, and the level of proficiency for the skills was rated lower. The
difference in the Emotional Intelligence Leadership skill area was 13.25. The second
largest leadership skill area gap which demonstrated the difference between importance
and proficiency, was the Conceptual Skills area (difference=9.95), followed by Industry
Skills (difference=8.82), Human Skills (difference=8.16), and Communication Skills
(difference=8.07). The leadership skills area with the smallest gap between self-
perceived level of importance and self-perceived level of proficiency was the area of
Technical Skills, having the lowest difference (difference=3.67). These findings
167
therefore supported those found in Objective 2 and Objective 3 where academic program
leaders rated Technical Skills as Least Important of the six skill areas and rated
themselves as Least Proficient at Technical Skills.
The gap in Emotional Intelligence Proficiency and Emotional Intelligence Skills
Importance is an important finding. This study revealed that academic program leaders
believe Emotional Intelligence Skills are very important, but these skills are the least
proficient leadership skills area. Goleman (2002) stated Emotional Intelligence is one of
the strongest predictors of success for a leader. The findings of this study conclude
academic program leaders need professional development and training in the leadership
skills area of Emotional Intelligence in order to narrow or close the gap between
proficiency and perceived importance of Emotional Intelligence. Professional
development and training need to be conducted in this area for current academic program
leaders, as well as individuals who aspire to become academic program leaders.
Academic program leaders believe they have adequate technical leadership skills to
fulfill the job duties. Academic program leaders responding to this study noted they have
administrative assistants to perform many of the Technical Skills for them.
Objective 5: To determine leadership styles of academic program leaders, as being transformational, transactional, and/or laissez-faire
The purpose of Objective 5 was to determine the leadership style of academic
program leaders as being transformational, transactional and/or laissez-faire. Current
academic program leaders appear to have a more transformational leadership style, as
demonstrated by a mean score in transformational leadership (M=3.28), while exhibiting
some characteristics of transactional leadership (M=2.24). Laissez-faire leadership (non-
leadership) was minimally exhibited (M=.88), showing it is not a preferred leadership
168
style. These findings are a positive sign for colleges and universities. The literature
suggests the most effective and successful leaders use transformational leadership most
of the time followed by some transactional leadership with a minimum use of laissez-
faire leadership (Tichny & Devanna, 1990). The findings of this study concur with
Moore (2003), and it appears from this study that academic program leaders appear to be
using a proper mix of leadership styles for efficiency and success.
The findings of the research show males using specific leadership styles and
behaviors more often than their female counterparts. Males had a mean of 3.31, and
females had a mean of 3.20 in transformational leadership. Males had a mean of 2.26,
and females had a mean of 2.20 in transactional leadership. In laissez-faire leadership
style males had mean of .90, and females had a mean of .84. These research findings for
transformational leadership behavior oppose earlier research suggesting transformational
leadership is a more feminine behavior, demonstrated more often by females.
Transactional leadership is characteristically a male leadership style. The findings of this
study imply academic program leaders, both male and female, are using transformational
leadership styles more often than transactional or laissez-faire leadership behaviors. This
is a positive reflection of the current academic program leaders because the literature
states transformational leadership behaviors are more successful for attaining and
fulfilling goals (Tichny & Devanna, 1990).
The findings of the leadership scale scores followed the same pattern as the
leadership style scores. Males scored slightly above females in all leadership scales,
which included Contingent Reward, Intellectual Stimulation, Management-by-Exception
(passive), Management-by-Exception (active), Idealized Influence (behavior), Idealized
169
Influence (attributed), Individualized Consideration, and Inspirational Motivation. The
research showed gender had no significant effect on transformational, transactional, or
laissez-faire leadership styles or behaviors of academic program leaders. These findings
are similar to Moore’s (2003) research.
In terms of leadership style and ethnicity, it was found the Black or African
American population exhibited the highest transformational leadership style behaviors
(M=3.45), followed by Whites (M=3.27), American Indian or Alaska natives (M=3.20),
and concluding with Asians (M=2.97).
Similar to transformational leadership style, Black or African American
populations exhibited the highest transactional leadership style behaviors (M=2.68),
followed by Whites (M=2.22), and Asians (M=1.87). American Indian or Alaska natives
had the lowest transformational leadership style mean (M=1.84).
Laissez-faire leadership was the least demonstrated leadership style, but most often
by Whites (M=.901), followed by Black or African Americans (M=.895), Asians
(M=.812), and American Indian or Alaska natives (M=.656).
When relationships between gender, ethnicity, and leadership style were examined,
no significant relationships could be found. This finding concurs with other studies
examining demographic variables on similar populations (Gould, 1964; Wolverton et al.,
2001; Moore, 2003; Stedman, 2004).
Transformational leadership style had a significant low positive correlation with
age. This finding may indicate that as individuals mature, they use a more
transformational leadership style. Looking at the behaviors of a transformational leader,
these conclusions are not surprising. Transformational leaders use influence, motivation,
170
intellectual stimulation, and individualized consideration to successfully perform their
leadership roles. These behaviors are learned behaviors that may be enhanced over time
with practice and from life experiences and maturity.
No significant correlations were found between leadership style, leadership scale
scores, and tenure at a college or university. Significant correlations were found in the
number of years in a formal leadership position and leadership style and scale scores.
Tenure in a formal leadership position showed a significant effect toward both
transformational and transactional leadership styles. Contingent Reward, as well as
Individualized Consideration behaviors, were seen as being significant when correlated
with tenure in a formal leadership position. These findings suggest academic program
leaders having established themselves in their role as leaders, and are more willing to use
transformational behaviors with their followers.
The only significant correlation found in the data was between leadership style or
scale score and college leadership courses in regard to laissez-faire leadership where a
negative correlation was found. This finding is important because it shows that the fewer
leadership courses an academic program leader has taken, the more hands-off leadership
behaviors he or she exhibits.
Objective 6: To identify an academic program leader’s problem-solving style
Objective 6 was to identify the academic program leader’s problem-solving style.
The findings showed academic program leaders have a preferred problem-solving style
that is slightly innovative. Academic program leaders showed a problem-solving mean
of 100.18, where the lowest possible score is 32 and the highest possible score is 160.
The general population mean is 96. Those individuals scoring below 96 are more
adaptive in their preferred problem-solving style and those individuals scoring above 96
171
prefer a more innovative problem-solving style (Kirton, 1999). The problem-solving
style scores range from a low of 69 to a high of 137 for the academic program leaders
participating in this study. Females exhibited a slightly more innovative problem-
solving style (M=100.85), as compared to males (M=99.98). In the Sufficiency of
Originality subscore, the male mean was 46.98, compared to the female mean of 44.77,
where the Sufficiency of Originality scores range from 13 to 65. The female mean in the
Efficiency subscore was 19.23, just a bit more innovative than the male mean of 18.88,
where the Efficiency scores range from 7 to 35. A 1.8 point difference was found
between the mean score of males (M=35.05) and females (M=36.85) in the Rules/Group
Conformity subscore category of problem-solving style, where the Rules/Group
Conformity scores range from 12 to 60. The findings of this research are in line with the
findings of Kirton (1999), where in the KAI-SO subscore, the general population mean
was 41, the Efficiency subscore was 19, and the Rule/Group Conformity subscore was
35.
The findings suggest academic program leaders have a slightly innovative problem-
solving style. With the ever-changing nature of colleges and universities, the academic
program leader needs to be ready to adjust and handle changing situations as they arise.
With changing situations, academic program leaders need to be able to generate several
options or ideas (higher KAI-SO), need to be decisive, and need to choose appropriate
options. New and fresh ideas to old problems are traits of an innovative individual.
When comparing ethnicity and problem-solving style, the data showed that
American Indians or Alaska natives had the highest mean problem-solving style at
172
103.25, followed by Black or African Americans (M=101.67), Whites (M=100.14), and
Asians (M=93.00).
When comparing the demographic variables of age, gender, ethnicity, type of
degree, tenure at a college or university, tenure in a formal leadership position, and
problem-solving style, no significant correlations were found. The importance of this
finding is an academic program leader’s preferred problem-solving style is not
significantly dependent on standard demographics, contrary to Kirton’s environmental
elements of the Cognitive Function Schema model. The demographic variables such as
age, gender, ethnicity, and tenure, which do not play a role in problem-solving style,
allow for different hiring practices and procedures to be utilized.
A significant negative correlation was found in Sufficiency of Originality and
previous college leadership training. This means academic program leaders with less
college leadership training had a lower Sufficiency of Originality score. Academic
program leaders with a low KAI-SO score have fewer ideas, but they could be more
relevant, sound, safe, and well chosen. For innovators, the handling of ideas and the
preference to generate more ideas that are considered to be outside the box are risky, but
preferred. These two findings are interesting because they show that academic program
leaders use a slightly more innovative style, but their ideas could be useful, well
conceived, and chosen carefully.
Objective 7: Explain leadership styles of academic program leaders
This study sought to explain academic program leaders’ leadership style and
behaviors as being transformational, transactional, and/or laissez-faire. Cognitive effect,
cognitive resources, cognitive affect, and environmental variables were used to explain
the academic program leader’s leadership behaviors.
173
This research found the best model to explain transformational leadership behavior
in academic program leaders included the variables of Human Skills Proficiency and
Emotional Intelligence Skills. It is not surprising these variables are the best variables in
explaining transformational leadership. Transformational leaders “engage” the followers
by using the leadership skills mentioned previously. Human subskills include
relationship building, being open and approachable, being a team member or player,
being able to evaluate people, being a team leader, being culturally aware, being able to
identify talent, mentoring others, and being a coach. Emotional Intelligence skills
include time management, having empathy and respect, maturity, energy and enthusiasm,
honesty and integrity, being able to resolve conflict, negotiation and motivation, and
having a sense of humor. It is easy to understand how having these leadership skills
would engage followers to comply with the leader. An effective transformational leader
asks followers to go beyond their own self-interest for the good of the group or cause.
These skills make the transformational leader more effective and his or her followers
more empowered.
The variables most commonly associated with differences in leadership style, such
as age, gender, and ethnicity did not exhibit themselves as primary variables in
explaining transformational leadership of academic program leaders. These findings are
encouraging because it shows there are more significant explanatory variables of
transformational leadership than age, gender and ethnicity. But the researcher would
caution the reader that these were self-reported findings. Future research should be
conducted to determine if the leaders’ self-perception was accurate by examining what
followers say about their leaders.
174
Transactional leadership was best explained by the number of years in a formal
leadership position and by Conceptual Skills. Conceptual skills include having vision,
being able to strategically plan, being able to make good decisions, being able to think
critically and creatively, and setting and achieving goals. Because these characteristics or
behaviors are more task-oriented, it is not surprising they are included to explain
transactional leadership. The transactional leader is more concerned with getting the task
accomplished and less concerned with building relationships with followers (Northouse,
2004).
Laissez-faire leadership is best explained by a lack, or the negative relationship, of
Human Skills, Conceptual Skills Proficiency, Emotional Intelligence and Leadership
Training. Laissez-faire leadership, or hands off leadership, is best exhibited by leaders
who do nothing. Leaders taking little or no responsibility for decision-making and
leaders who are inactive, non-directive, or non-consultative are laissez-faire leaders (Bass
& Avolio, 1997). Leaders exhibiting laissez-faire leadership behaviors bury themselves
in paperwork, stay away from subordinates, set no clear goals, and do not help their
group make decisions (Bass, 1990).
Findings of this research show no significant relationships between problem-
solving styles in explaining leadership style. It has been argued that problem-solving
style and leadership style are related (Kirton, 1999). With the exception of the KAI-SO
and transformational leadership style, this study found no significant relationships. This
relationship is interesting to note because KAI-SO is how an individual deals with
differences in original ideas, and how an individual produces ideas. The adaptive
individual tends to produce fewer novel ideas, which are typically seen as being more
175
sound and reasonable. The innovative individual tends to create many ideas that are
more likely to be seen as risky or that break new ground. This being the case, having a
higher KAI-SO score shows academic program leaders prefer to generate many ideas.
Having more ideas and more options allows the academic program leader to choose from
several different ideas and make decisions or choices from these options.
Because the nature of this study was a census study of academic program leaders
(deans or individuals holding a similar leadership position within the land-grant system),
the ability to generalize the conclusions and recommendations of this study beyond the
population described should be considered. Keeping this limitation in mind, the
following conclusions resulted from the research.
Implications and Recommendations
Objective 1: To determine selected demographic characteristics of land-grant academic program leaders
The demographics of land-grant colleges and university academic program leaders
have changed little during the last few decades (Wolverton et al., 2001). The academic
program leaders continue to be White, 50 to 60-year-old males, as supported by this
research. However, the literature (Moore, 2003) and research findings suggest that age,
gender, and ethnicity do not play a significant role in the leadership style or behavior of
academic program leaders. With this finding, universities and colleges need to work
toward bringing in the best leaders, regardless of age, gender, ethnicity, or tenure in the
profession.
The study found that females and minorities are under-represented in academic
program leadership positions, compared to White males in this study. This finding leads
the researcher to ask the following questions: (1) Are minorities under-represented
176
compared to other academic program leaders in other university departments? (2) Are
minorities under-represented compared to minorities in other similar leadership positions
in industry, or better yet, compared to the percentage of minorities living and working in
the cross-section of America? (3) Are there less minorities than Whites to begin with?
There is some good news to the findings of this study. Clark (1992) found in his study of
Cooperative Extension Service directors from 1862 and 1890 land-grant institutions that
91.4% were male. In the current study, males accounted for 76.8%, which is similar to
what Moore (2003) found with her study in which males comprised 70.2% of the
leadership roles. Findings of this study suggest females are in leadership roles more now
than they were 14 years ago. These findings suggest universities are slowly becoming
more diverse, these institutions are becoming more gender diverse in the area of
academic program leaders. The researcher recommends continued university effort in
recruiting and hiring diverse populations regarding gender and ethnicity by encouraging
non-male, non-White individuals to apply for academic program leadership positions.
Objective 2: To assess level of importance of leadership skills, as determined by academic program leaders
and
Objective 3: To assess self-perceived proficiency of leadership skills, of academic program leaders
Academic program leaders responding to this study believe Human Skills,
Conceptual Skills, Technical Skills, Communication Skills, Emotional Intelligence Skills
and Industry Knowledge Skills are necessary. All leadership skills areas fell in the
Important to Very Important range with the only exception being the Technical Skills
area, which fell in the Somewhat Important category. It is encouraging to note that
academic program leaders place value in these leadership areas. Human skills are
177
relating to personnel, identifying personal strengths, evaluating the impact of personnel,
respecting others, creating an environment in which the leader is approachable and open
to new ideas, being an effective team member, valuing the diversity of others, and
creating an environment in which team members are willing to share ideas are known as
“people skills.” These skills deal with how people get along with each other. Kouzes
and Posner (2002) rated human skills as being extremely important for the effective
leader.
Conceptual skills are those skills a leader possesses which allows him or her to
create a long-term vision for the organization, think strategically, set goals, help others
support organizational change, be decisive, and achieve goals. Expressing the
importance of this set of leadership skills demonstrates the academic program leader’s
ability to see how critical his or her vision is to the success of the organization.
Conceptual skills are the “big picture” skills that express the leader’s dreams and desires.
It is evident from this research that academic program leaders wish to see the success of
their institution and believe conceptual skills are instrumental in that task.
Developing budgets, using computers and software, and using the Internet are
technical leadership skills. This is the only leadership skill area that fell into the
somewhat important area by the academic program leaders. Based on narrative
statements from participants of this study, these skills are often delegated to
administrative staff. Therefore, these technical skills are perceived by academic program
leaders as not being necessary for the fulfillment of their job and, consequently, not as
important as other leadership skills.
178
Academic program leaders rated Communication Skills as Important to Very
Important. The ability to interact with people, identify barriers to listening, write
effectively, reduce barriers to effective communication, and recognize nonverbal cues
and/or behaviors are all deemed important by the academic program leaders. The high
score of Communication skills may be a direct result of the need for academic program
leaders to be able to work with others in whom they are in contact on a daily basis, and
they find it necessary to express their point to those individuals clearly and efficiently.
Academic program leaders deemed Emotional Intelligence skills Very Important.
Being able to set priorities both personally and professionally, resolve conflict, use
constructive criticism, negotiate agreement, motivate individuals to perform their best, be
able to control emotions in emotional situations, and respect time commitments of others
are all Emotional Intelligence skills. Goleman, Boyatzis et al. (2002), believed that
Emotional Intelligence is the best predictor of a leader’s success. By valuing these skills,
academic program leaders are showing their support for the importance of these skills in
fulfilling their duties.
Industry Knowledge skills also fell into the Important to Very Important category.
Creating links within traditional and non-traditional audiences, having knowledge in a
content area, identifying needs of various client groups, and being able to build
relationships between programs are leadership skills that fall into the Industry Knowledge
skills category. Academic program leaders believe it is important to be able to “talk the
talk” in their profession. Being able to talk the talk is important if the academic program
leader is to build rapport with his or her constituents and perform his or her job
effectively.
179
With the exception of Human Skills and Conceptual Skills (barely), academic
program leaders’ self-perceived proficiency fell in the Average Proficiency category.
Academic program leaders rated leadership skills as being Very Important in almost all
areas, but believe they are not as proficient as they could be. It is important to remember
this is self-reported data, and self-reported data may suffer from bias because the
respondents report what they "want" the answers to be.
These findings have serious impacts for Objective 4.
Objective 4: To identify gaps in leadership skills and proficiency level of academic program leaders
This research identified gaps between leadership skill areas and proficiency level of
academic program leaders. The findings imply academic program leaders can use
professional development in all areas of leadership. However, findings of this study
point to the categories of Technical Skills and Emotional Intelligence for closer
examination.
In the Technical Skills area, the research found the smallest gap between
importance and proficiency. The findings indicate academic leaders rate Technical Skills
being Somewhat Important and being of Average Proficiency in this skill area. Several
academic program leaders in this study commented they had administrative staff to fulfill
the technical skills needed for their position. This research implies less need for technical
skills development at the academic program leader’s level. On further analysis of the
technical skills, the researcher questions the small gap between perceived importance and
perceived proficiency in the Technical Skills area. For Technical Skills area responses,
the gap difference can be accounted for in two different ways. The academic program
leaders are not proficient, therefore, the skills are not as important; or they are not
180
important, therefore, they are not as proficient in this technical area. For example, if an
academic program leader is not proficient in the technical skill of web design, it must not
be important or the academic program leader would become proficient in it. However, it
could be said if the academic program leader thought it was important, he or she would
place a higher value and set goals (conceptual) to become more proficient in the area.
The next area of research should examine whether knowing technical skills makes for a
more successful or efficient academic program leader.
The gap between Emotional Intelligence skills and self-perceived proficiency in the
Emotional Intelligence skills area was the greatest. This is an important finding.
Goleman, Boyatzis and McKee (2002) proposed that “great” leaders ignite passion and
inspire the best in people with their use of emotional intelligence. It can be reasoned that
emotional intelligence skills are very important to academic program leaders if they wish
to be successful, effective leaders. Academic program leaders have determined
Emotional Intelligence skills are important for fulfillment of their job responsibilities.
However, academic program leaders feel their proficiency in this skill area to be average.
This study determined professional development curriculum is needed to address the gap
between the proficiency level and perceived importance of Emotional Intelligence. It
has been found that Emotional Intelligence is among the areas in most need of
professional development, which implies that academic program leaders feel they need to
become more proficient in this area.
Emotional intelligence deals with emotions--one’s own emotions and others
persons’ emotions--and seeks to raise others to a higher sense of personal best. It is
ironic that academic program leaders feel they need the most amount of professional
181
development in this area because emotional intelligence behaviors are also behaviors of
transformational leaders--and this research found most academic program leaders to be
transformational. It is interesting that if they are displaying traits and behaviors of
emotional intelligence by being transformational leaders, there must be other reasons and
factors for this area to be the area of greatest need for professional development. The
four remaining leadership skill areas should also be taught. In fact, it would be in the
best interest of academic program leaders to also consider Conceptual Skills training.
Academic program leaders rated the importance of Conceptual Skills as Very Important
and their proficiency as only slightly higher than Somewhat Important for a difference of
(9.95). Considering that conceptual skills are the “big picture” skills, these skills also
appear to be very dependent on human skills relying on their followers to close the
conceptual skills gap. The implication for academic program leaders is that they must
develop professional conceptual skills because even conceptual skills appear to be leader-
driven, leader-centered, and less affected in origin by the followers. Having these skills
is dependent on the followers to make the vision a reality.
Objective 5: To determine leadership styles of academic program leaders as being transformational, transactional or laissez-faire
The findings of the current study found that academic program leaders in colleges
of agricultural and life sciences tend to use transformational leadership more often than
transactional or laissez-faire leadership. This is an important finding for academic
program leaders. Eagly et al., 2003) reported effective-successful leaders use
transformational leadership behaviors more often than transactional or laissez-faire
leadership. Bass (1990) stated that transformational leadership is the prototype of
leadership that people have in mind when they describe their ideal leader. He also stated
182
transformational leaders are more effective and successful. This is good news for land-
grant institutions. If these institutions’ academic program leaders are using
transformational leadership more often than transactional or laissez-faire leadership, the
chances for success are high.
Objective 6: To identify academic program leader’s problem-solving style
The KAI, which was used to measure the academic program leaders’ problem-
solving style, yielded interesting data. Academic program leaders are slightly more
innovative than the general population. This research also found a small but significant
relationship between the quantity of ideas (KAI-SO) and the transformational leadership
style of academic program deans. It is remarkable to note that preferred problem-solving
style and leadership style showed no other significant relationships. This finding
contradicts Kirton (1999) and his theory of Cognitive Function Schema where he
believed they have significant relationships to each other. This research suggests the
relationship to be minimal at best. In this population of academic program leaders, the
mean KAI score, (M=100.18) is representative of the academic program leader, which
also happens to fall in the same range of the general population mean (M=96). One of
the possible implications of these two populations having close KAI scores is similar
problem-solving styles. Relatability to each other, similar approaches to solving
problems, similar values about generating and contributing ideas, taking similar risks, and
displaying similar problem-solving tendencies when faced with new ideas and/or
problems. These common threads may yield high efficiency, more frequent group
consensus, and achievement of goals between the academic program leader and his or her
academic team, assuming that the members of the academic team represent the general
population.
183
Kirton (1999) termed individuals having an intermediate KAI score as being a
“bridger.” Kirton believed these individuals who happen to have this intermediate score
within the group could be very helpful in acting as a go-between for the innovator and the
adaptor. Coping behaviors allow people to successfully play the role to which they have
been assigned. The role of the academic program leaders necessitates them to become
successful at creating an atmosphere of collegiality and compromise. The academic
program leader must be able to get all types of people with different backgrounds and
experiences to work together. The ability to bridge the innovators and adaptors and the
subsequent problem-solving (KAI) scores of the academic program leaders of this study
would seem to indicate these academic program leaders are “bridgers” and have possibly
developed coping behaviors to enhance their success.
Kirton (1999) stated a difference of 20 points between individuals can lead to
communication problems and respect issues. An academic program leader who has the
skills and coping behaviors to minimize these issues will be more successful in his or her
position. A bridger is typically an individual who has these types of skills.
Objective 7: To explain leadership styles of academic program leaders
This research sought to explain the leadership styles and behaviors of academic
program leaders. The findings of this study conclude that academic program leaders use
transformational leadership more often than transactional or laissez-faire leadership. This
research found through backward regression the best model for transformational
leadership, given the 24 selected variables of the study, which included the three
leadership skills: (1) human skill proficiency; (2) emotional intelligence skills; and (3)
emotional intelligence proficiency. The research revealed that nearly 60% of the
variance of the transformational leadership styles and behaviors of the academic program
184
leader can be explained with these five variables. The review of literature determined
that Transformational leadership is the most desired form of leadership by followers.
Transformational leadership was determined to be the most effective and successful
leadership style for the completion of performance goals and objectives of an
organization. It is important to realize that these findings suggest nearly 60% of an
academic program leader’s leadership style and behavior can be predicted by these three
leadership skills.
Bass (1990) suggested a need for transactional leadership behaviors in the effective
leader. Academic program leaders showed transactional leadership behaviors in the
current research. The best explanatory model of transactional leadership included
number of years in a formal leadership position and the leader’s perceived importance of
conceptual skills. This is a positive note for academic program leaders. The research
suggests academic program leaders have the ability to use transactional leadership
behaviors if needed in the fulfillment of their tasks.
If current land-grant institutions desire fewer laissez-faire leaders, then professional
development for current academic program leaders should enhance the conceptual skills
proficiency, emotional intelligence skills, industry skills, and leadership training.
It is important to realize that none of the 24 variables used in this study explain
leadership style and behaviors, were demographic variables. This group of academic
program leaders exhibited no differences in leadership style regardless of age, gender, or
ethnicity. Generalizations about leadership capacities based on demographic differences
should be dismissed.
185
Since the variables contributing to transformational leadership behaviors are non-
demographic, another important implication is the possibility to “create” the best leader.
This research suggests that professional development to enhance human skills,
conceptual skills, emotional intelligence skills, and proficiency, as well as
communication skills, will lead to a more transformational leader and transformational
leadership style behaviors.
It is important to note that academic program leaders deemed five of the six
leadership areas as Important to Very Important. This suggests academic program
leaders believe these skill areas are important and valuable. The research suggests a gap
between all leadership skill areas and the proficiency of academic program leaders in
these areas. Professional development is needed in all six leadership skill areas in order
to minimize the gap between the perceived importance of the leadership skills and the
proficiency level of the leadership skills.
A final implication from this study suggests the need for a national professional
development program for academic program leaders and others in similar academic
leadership roles. This study found that little training occurs for academic program
leaders while they attended college or leadership workshops after they have attained their
leadership position. Currently, there are no national organizations in colleges of
agricultural and life sciences committed specifically to the professional leadership
development of academic program leaders or deans to offer assistance and/or guidance in
fulfilling their crucial role. The Experiment Station Committee on Organization and
Policy (ESCOP) has worked with limited success on developing and delivering
leadership programs for leaders at land-grant colleges and universities. Recently ESCOP
186
has developed LEAD21. The primary purpose of LEAD21 is to develop leaders in land-
grant institutions and others that others that conduct research, work in academics, and
extension services. The goal of LEAD21 is to get individuals in leadership positions to
lead more effectively and successfully. This is encouraging news.
Implications and Recommendations Summary
Based upon the findings and conclusions of this study, the following summary of
recommendations was made:
• These findings suggest minorities are under-represented compared to other academic program leaders in other university departments, or are under-represented compared to minorities in other similar leadership positions in industry, or better yet, compared to the percentage of minorities living and working in the cross-section of America. Are there fewer minorities than Whites to begin with?
• Based on the findings of this study, leadership professional development programs for academic program leaders in colleges of agricultural and life sciences should focus on developing all leadership skill areas, which include human skills, conceptual skills, technical skills, communication skills, emotional intelligence skills, and industry knowledge skills.
• Academic program leaders rated the importance of conceptual skills as very important and their proficiency as only slightly higher than somewhat important for a difference of (9.95). Considering that conceptual skills are the “big picture” skills, these skills appear to also be very dependent on human skills, relying on their followers to close the conceptual skills gap. The implication for academic program leaders is they must develop professional conceptual skills. Although conceptual skills appear to be leader-driven, leader-centered, and less affected in origin by the followers, having these skills is dependent on the followers to make the vision a reality.
• The demographic variable of age did not contribute any significant effect to an academic program leader’s leadership style. Generalizations about leadership capacities based on age differences should be dismissed.
• The demographic variable of gender did not contribute any significant effect to an academic program leader’s leadership style. Generalizations about leadership capacities based on gender differences should be dismissed.
• The demographic variable of ethnicity contributed no significant effect to an academic program leader’s leadership style. Generalizations about leadership capacities based on ethnic or cultural differences should be dismissed.
187
• Academic program leaders believe human skills and emotional intelligence skills are very important skills to fulfill their job responsibilities and should therefore be an integral part of professional development planning.
• Emotional Intelligence is among the areas in most need of professional development, which implies that academic program leaders feel they need to become more proficient in this area. However, emotional intelligence deals with emotions, one’s own emotions and others persons’ emotions, and seeks to raise others to a higher sense of personal best. It is ironic that academic program leaders feel they need the most amount of professional development in this area because emotional intelligence behaviors are also behaviors of transformational leaders of which this research found most academic program leaders to be. It is interesting that if these leaders are displaying traits and behaviors of emotional intelligence by being transformational leaders, there must be other reasons and factors for this area to be the area of greatest need for professional development.
• Tenure at the college or university showed little significant effect on the leadership style of academic program leaders. This being the case, generalizations about leadership capacities based on tenure at the college or university should be dismissed.
• Tenure in a formal leadership position showed little significant effect on the leadership style of academic program leaders. This being the case, generalizations about leadership capacities based in a formal leadership position should be dismissed.
• The average age of the academic program leader was 55.11 years old. This is nearing the age of retirement. A leadership void could be on the horizon for academic program leaders.
• Professional leadership training should be developed and encouraged in college of agricultural and life sciences academic program leaders. Since there are minimal programs designed specifically for this group, national programs should be developed specifically for academic program leaders and deans with topics key to the effectiveness as leaders.
• Since the problem-solving ability was not found to be a significant indicator of leadership style, therefore, generalizations about leadership capacities based on problem-solving ability should be dismissed.
Future Research Recommendations
Based upon the findings and conclusions of this study, the following suggestions
for additional research are made:
188
• The researcher believes participants were honest and accurate in their self-assessment of their leadership skills. But because this study was conducted only with the academic program leaders responding to their own self-perceived leadership skills, further research should be conducted to confidentially survey those individuals to find out how others perceive the academic program leaders’ leadership skills.
• Because Emotional Intelligence skills ranked the highest for need in terms of professional development and training, further studies should examine where and how leadership training should occur in order to facilitate Emotional Intelligence leadership characteristics. The next step is to prepare individuals to become academic program leaders who are proficient in Emotional Intelligence. If it were a skill developing or future academic program leader’s need, it would serve the profession to take a hard look at how we are going to fill this need.
• Because participants noted many of their leadership training experiences occurred in high school clubs, such as FFA, Boy Scouts, and the military, a study should be conducted to find out what particular leadership aspects of these organizations were key in developing their leadership style and behaviors. Additionally, how can these aspects be incorporated in future professional development and formal leadership training? Is the current level of training enough to be a successful academic program leader?
• In this study, American Indians or Alaska natives had the highest mean problem-solving style. A future study should examine cultural characteristics that might answer questions determining what this implies and what are some of the possible reasons that American Indians or Alaska natives are more innovative than other ethnic groups.
• If the literature is correct and land-grant universities are experiencing a time of change, it is crucial that they have effective, successful leadership. Future research of academic program leaders should look at institutions that have had positive, effective change to determine what characteristics those academic program leaders have that have made the change positive and effective.
• Academic program leaders perceive Human Skills as being important. It would be beneficial if a study were conducted on the leader’s team to determine if a team’s style and attitude are influenced by the academic program leader’s human skills.
• In this study, the 1994 Tribal Institutions had a very low response rate (.03%). Research needs to be conducted to determine why the response rate was so low. The research needs to include questions in regard to the acknowledgment of the land-grant mission of teaching, research, and extension and the tribal institutions’ perception of importance of this mission.
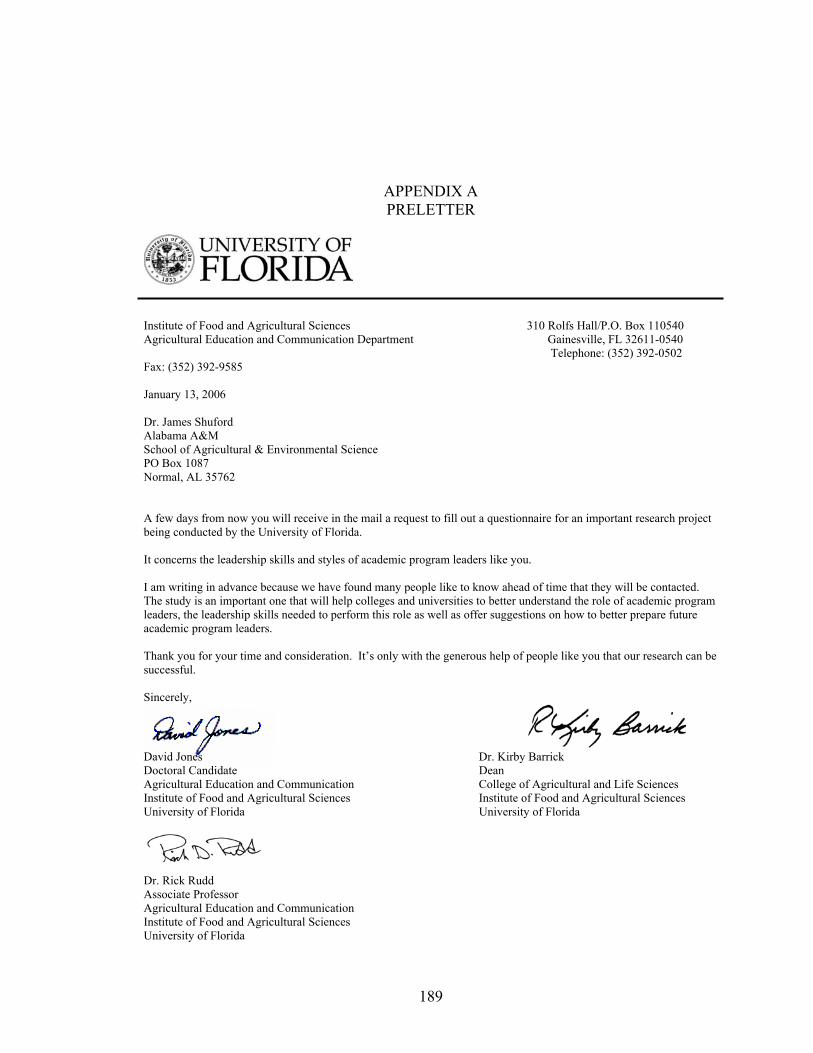
189
APPENDIX A PRELETTER
Institute of Food and Agricultural Sciences 310 Rolfs Hall/P.O. Box 110540 Agricultural Education and Communication Department Gainesville, FL 32611-0540 Telephone: (352) 392-0502 Fax: (352) 392-9585 January 13, 2006 Dr. James Shuford Alabama A&M School of Agricultural & Environmental Science PO Box 1087 Normal, AL 35762 A few days from now you will receive in the mail a request to fill out a questionnaire for an important research project being conducted by the University of Florida. It concerns the leadership skills and styles of academic program leaders like you. I am writing in advance because we have found many people like to know ahead of time that they will be contacted. The study is an important one that will help colleges and universities to better understand the role of academic program leaders, the leadership skills needed to perform this role as well as offer suggestions on how to better prepare future academic program leaders. Thank you for your time and consideration. It’s only with the generous help of people like you that our research can be successful. Sincerely,
David Jones Dr. Kirby Barrick Doctoral Candidate Dean Agricultural Education and Communication College of Agricultural and Life Sciences Institute of Food and Agricultural Sciences Institute of Food and Agricultural Sciences University of Florida University of Florida Dr. Rick Rudd Associate Professor Agricultural Education and Communication Institute of Food and Agricultural Sciences University of Florida
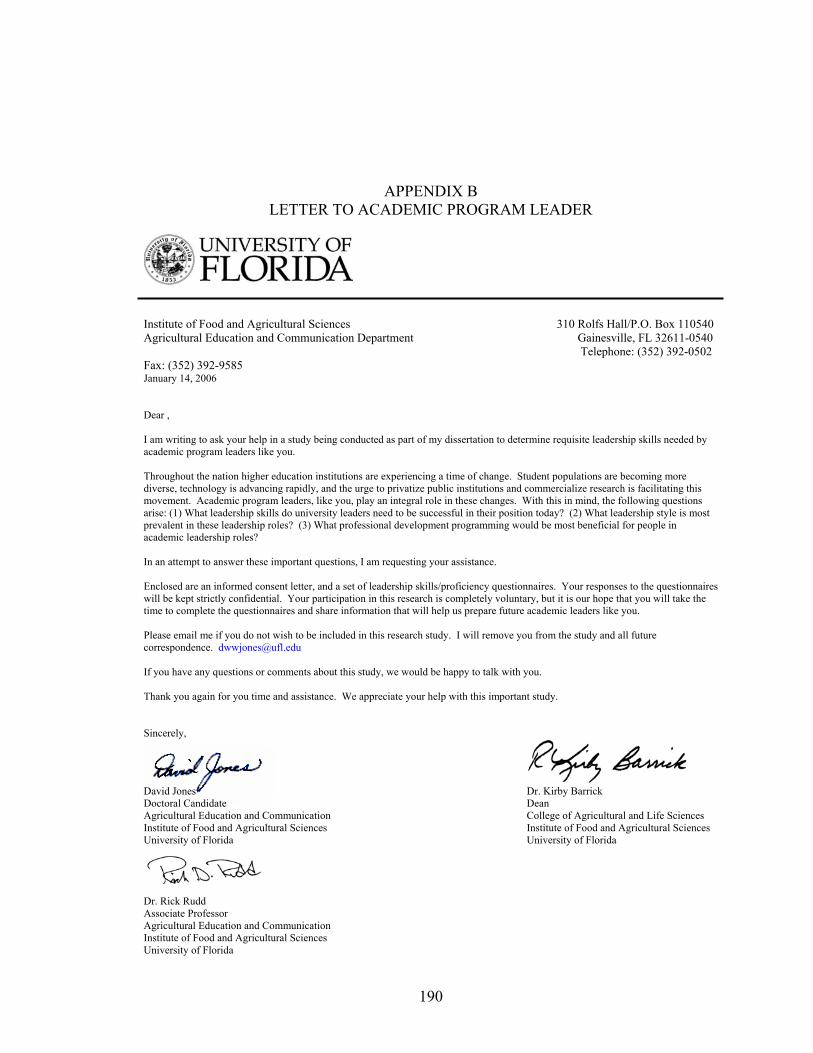
190
APPENDIX B LETTER TO ACADEMIC PROGRAM LEADER
Institute of Food and Agricultural Sciences 310 Rolfs Hall/P.O. Box 110540 Agricultural Education and Communication Department Gainesville, FL 32611-0540 Telephone: (352) 392-0502 Fax: (352) 392-9585 January 14, 2006 Dear , I am writing to ask your help in a study being conducted as part of my dissertation to determine requisite leadership skills needed by academic program leaders like you. Throughout the nation higher education institutions are experiencing a time of change. Student populations are becoming more diverse, technology is advancing rapidly, and the urge to privatize public institutions and commercialize research is facilitating this movement. Academic program leaders, like you, play an integral role in these changes. With this in mind, the following questions arise: (1) What leadership skills do university leaders need to be successful in their position today? (2) What leadership style is most prevalent in these leadership roles? (3) What professional development programming would be most beneficial for people in academic leadership roles? In an attempt to answer these important questions, I am requesting your assistance. Enclosed are an informed consent letter, and a set of leadership skills/proficiency questionnaires. Your responses to the questionnaires will be kept strictly confidential. Your participation in this research is completely voluntary, but it is our hope that you will take the time to complete the questionnaires and share information that will help us prepare future academic leaders like you. Please email me if you do not wish to be included in this research study. I will remove you from the study and all future correspondence. [email protected] If you have any questions or comments about this study, we would be happy to talk with you. Thank you again for you time and assistance. We appreciate your help with this important study. Sincerely,
David Jones Dr. Kirby Barrick Doctoral Candidate Dean Agricultural Education and Communication College of Agricultural and Life Sciences Institute of Food and Agricultural Sciences Institute of Food and Agricultural Sciences University of Florida University of Florida Dr. Rick Rudd Associate Professor Agricultural Education and Communication Institute of Food and Agricultural Sciences University of Florida
191
APPENDIX C POSTCARD REMINDER
January 20, 2006 Last week a questionnaire was mailed to you seeking your knowledge about leadership skills needed by academic program leaders. If you have already completed and returned the questionnaire to us, please accept our sincere appreciation. If not, thank you for taking the time to do that today. We are especially grateful for your help because it is only by your participation that we can understand the requisite leadership skills of academic program leaders. If you did not receive a questionnaire, or if it was misplaced, please call us at 1-352-392-0502 ext. 238 or email me at [email protected] and we will get another one in the mail to you today. Thank you, David Jones – Doctoral Candidate Agricultural Education and Communication - University of Florida
192
APPENDIX D INFORMED CONSENT LETTER
Institute of Food and Agricultural Sciences 310 Rolfs Hall/P.O. Box 110540
Agricultural Education and Communication Department Gainesville, FL 32611-0540
Telephone: (352) 392-0502
Leadership Skills and Styles of College of Agriculture Academic Program Leaders
Thank you for responding to this questionnaire. It is our hope that this information will help institutions assess and develop leadership training programs for College of Agriculture academic program leaders.
You do not have to answer any questions you do not wish to answer. Your identity will be kept confidential to the extent provided by law and your identity will not be revealed in any manuscript.
There are no anticipated risks, compensation or other direct benefits to you as a participant in this survey. You are free to withdraw your consent to participate and may discontinue your participation in the survey at any time without consequence.
If you have any questions about this research protocol, please contact David Jones at 392-0502 ext.238 or my faculty advisor, Dr. Rick Rudd, at 392-0502 ext. 239. Questions or concerns about your rights as a research participant rights may be directed to the UFIRB office, University of Florida, Box 112250, Gainesville, FL 32611; phone (352) 392-0433.
By completing this survey, you give permission to report your responses anonymously.
Printed Name: ________________________________
Signature: ___________________________________
Date: _____________________
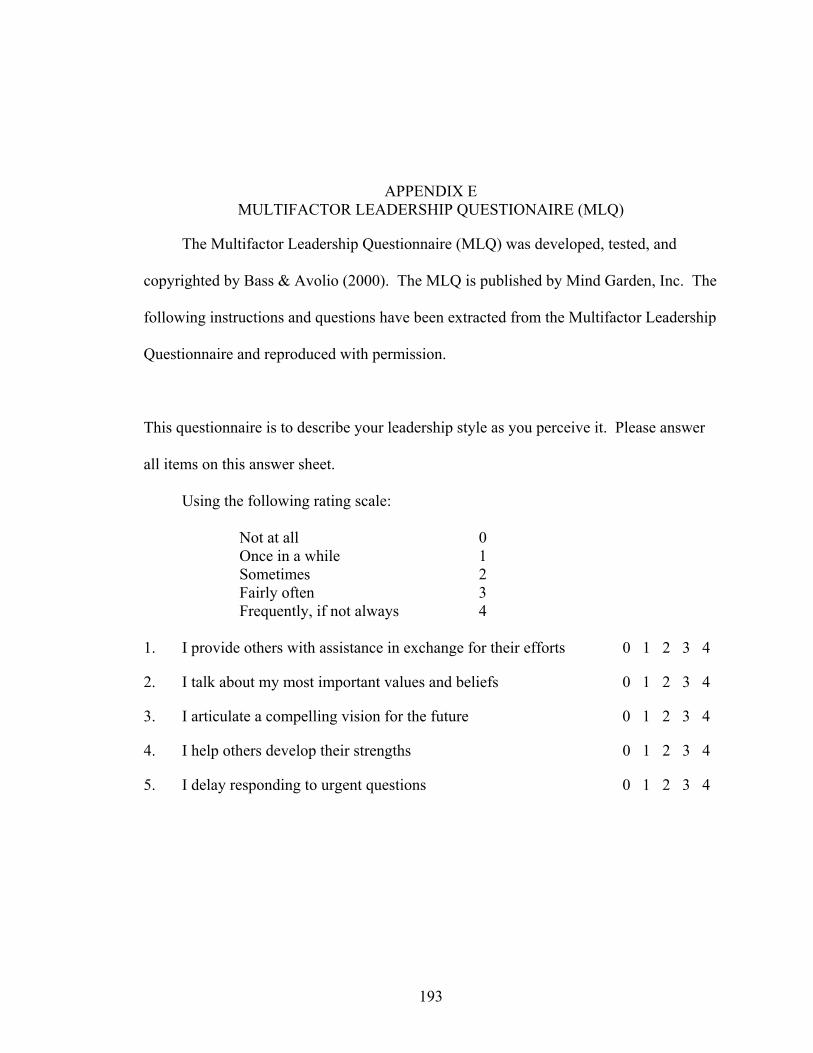
193
APPENDIX E MULTIFACTOR LEADERSHIP QUESTIONAIRE (MLQ)
The Multifactor Leadership Questionnaire (MLQ) was developed, tested, and
copyrighted by Bass & Avolio (2000). The MLQ is published by Mind Garden, Inc. The
following instructions and questions have been extracted from the Multifactor Leadership
Questionnaire and reproduced with permission.
This questionnaire is to describe your leadership style as you perceive it. Please answer
all items on this answer sheet.
Using the following rating scale:
Not at all 0 Once in a while 1 Sometimes 2 Fairly often 3 Frequently, if not always 4
1. I provide others with assistance in exchange for their efforts 0 1 2 3 4
2. I talk about my most important values and beliefs 0 1 2 3 4
3. I articulate a compelling vision for the future 0 1 2 3 4
4. I help others develop their strengths 0 1 2 3 4
5. I delay responding to urgent questions 0 1 2 3 4
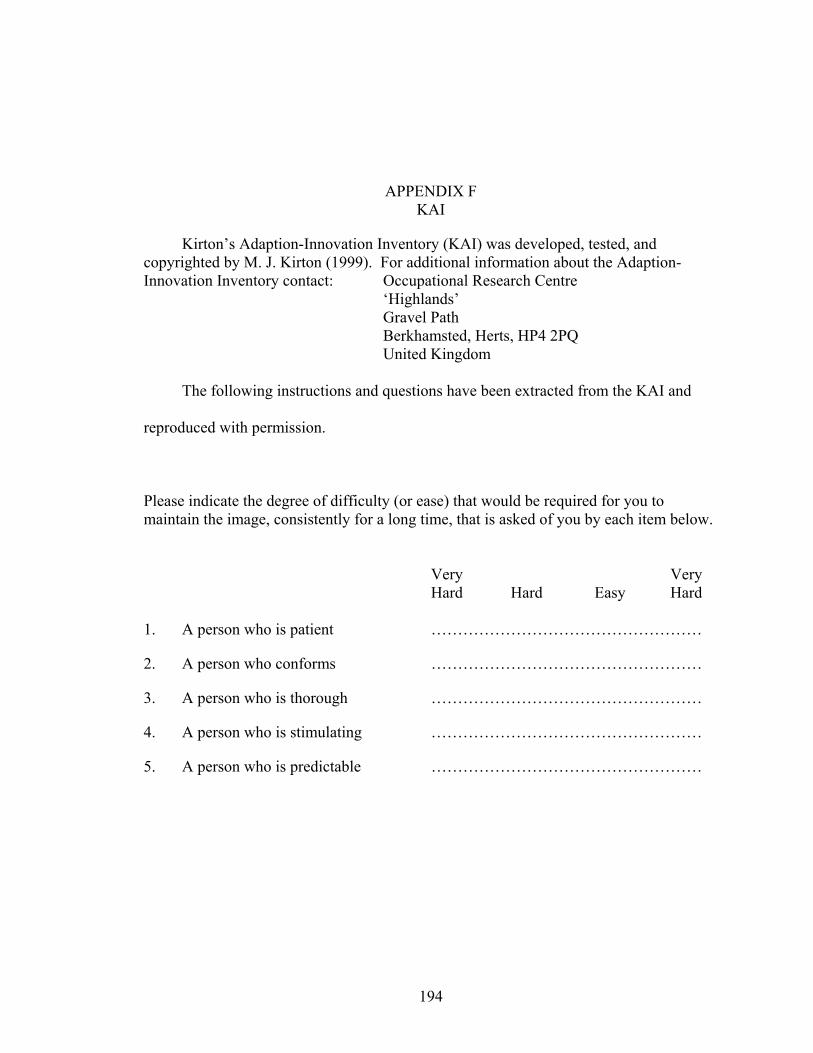
194
APPENDIX F KAI
Kirton’s Adaption-Innovation Inventory (KAI) was developed, tested, and copyrighted by M. J. Kirton (1999). For additional information about the Adaption-Innovation Inventory contact: Occupational Research Centre
‘Highlands’ Gravel Path Berkhamsted, Herts, HP4 2PQ United Kingdom The following instructions and questions have been extracted from the KAI and
reproduced with permission.
Please indicate the degree of difficulty (or ease) that would be required for you to maintain the image, consistently for a long time, that is asked of you by each item below.
Very Very Hard Hard Easy Hard
1. A person who is patient ……………………………………………
2. A person who conforms ……………………………………………
3. A person who is thorough ……………………………………………
4. A person who is stimulating ……………………………………………
5. A person who is predictable ……………………………………………
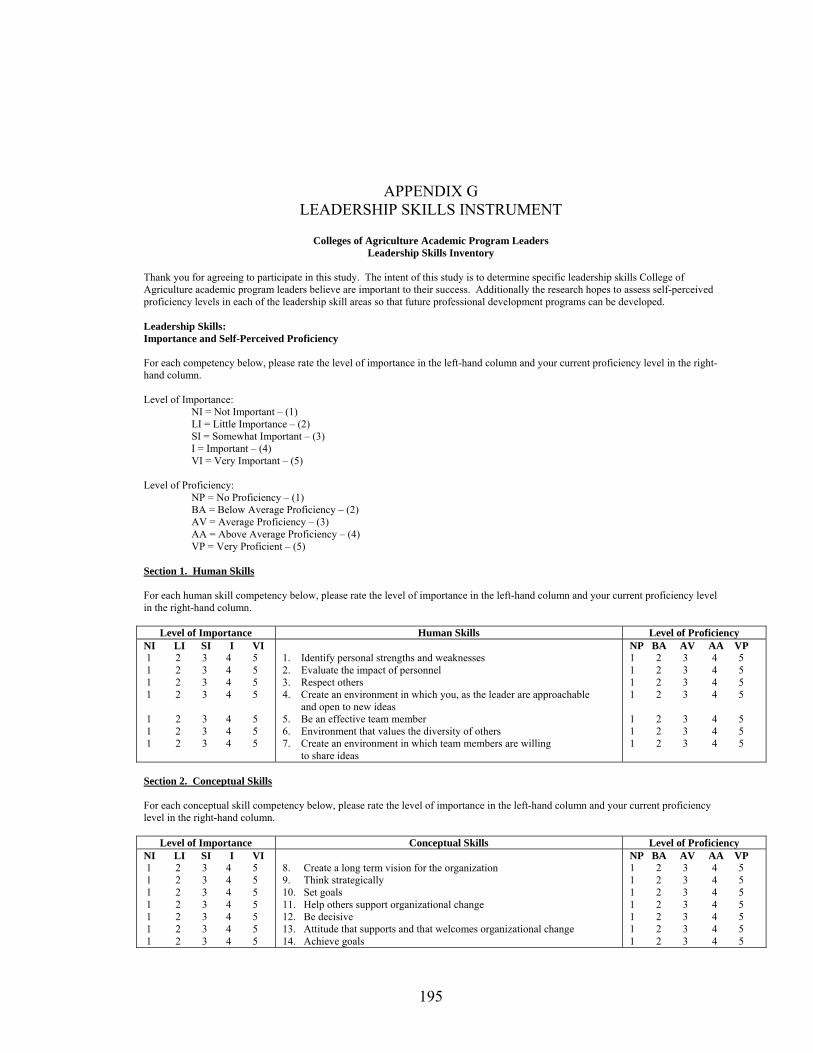
195
APPENDIX G LEADERSHIP SKILLS INSTRUMENT
Colleges of Agriculture Academic Program Leaders Leadership Skills Inventory
Thank you for agreeing to participate in this study. The intent of this study is to determine specific leadership skills College of Agriculture academic program leaders believe are important to their success. Additionally the research hopes to assess self-perceived proficiency levels in each of the leadership skill areas so that future professional development programs can be developed. Leadership Skills: Importance and Self-Perceived Proficiency For each competency below, please rate the level of importance in the left-hand column and your current proficiency level in the right-hand column. Level of Importance: NI = Not Important – (1) LI = Little Importance – (2) SI = Somewhat Important – (3) I = Important – (4) VI = Very Important – (5) Level of Proficiency: NP = No Proficiency – (1) BA = Below Average Proficiency – (2) AV = Average Proficiency – (3) AA = Above Average Proficiency – (4) VP = Very Proficient – (5) Section 1. Human Skills For each human skill competency below, please rate the level of importance in the left-hand column and your current proficiency level in the right-hand column.
Level of Importance Human Skills Level of Proficiency NI LI SI I VI 1 2 3 4 5 1 2 3 4 5 1 2 3 4 5 1 2 3 4 5 1 2 3 4 5 1 2 3 4 5 1 2 3 4 5
1. Identify personal strengths and weaknesses 2. Evaluate the impact of personnel 3. Respect others 4. Create an environment in which you, as the leader are approachable and open to new ideas 5. Be an effective team member 6. Environment that values the diversity of others 7. Create an environment in which team members are willing to share ideas
NP BA AV AA VP 1 2 3 4 5 1 2 3 4 5 1 2 3 4 5 1 2 3 4 5 1 2 3 4 5 1 2 3 4 5 1 2 3 4 5
Section 2. Conceptual Skills For each conceptual skill competency below, please rate the level of importance in the left-hand column and your current proficiency level in the right-hand column.
Level of Importance Conceptual Skills Level of Proficiency NI LI SI I VI 1 2 3 4 5 1 2 3 4 5 1 2 3 4 5 1 2 3 4 5 1 2 3 4 5 1 2 3 4 5 1 2 3 4 5
8. Create a long term vision for the organization 9. Think strategically 10. Set goals 11. Help others support organizational change 12. Be decisive 13. Attitude that supports and that welcomes organizational change 14. Achieve goals
NP BA AV AA VP 1 2 3 4 5 1 2 3 4 5 1 2 3 4 5 1 2 3 4 5 1 2 3 4 5 1 2 3 4 5 1 2 3 4 5
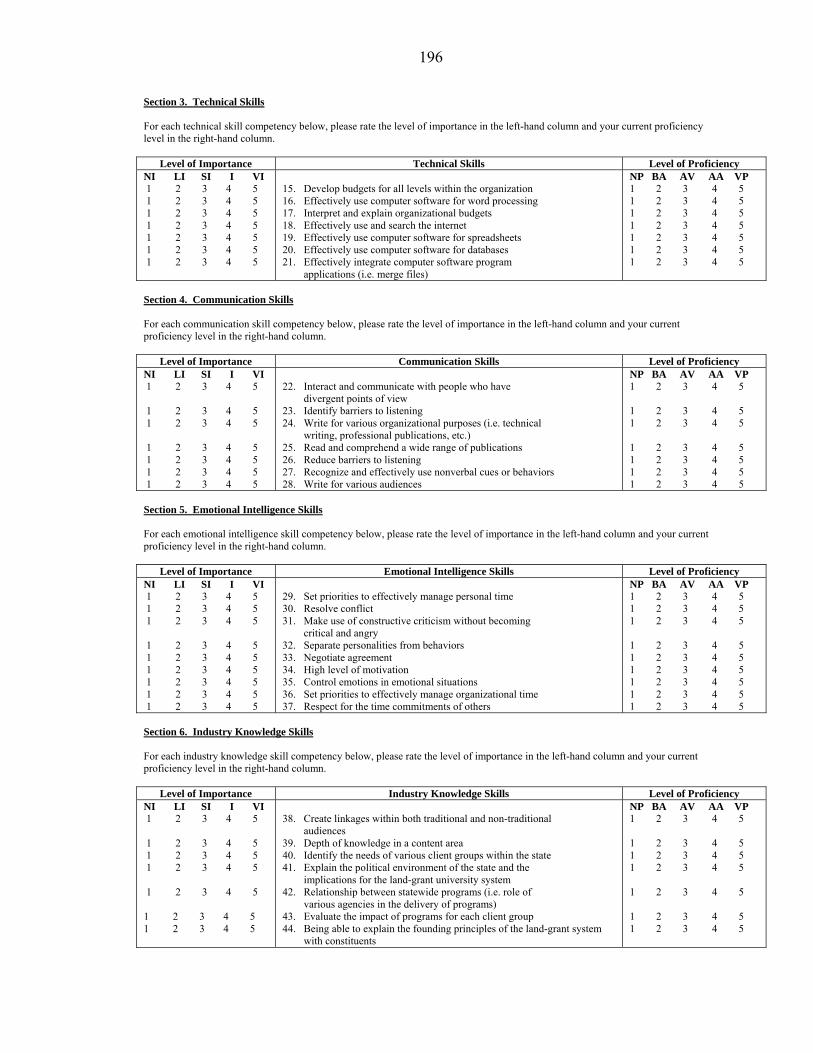
196
Section 3. Technical Skills For each technical skill competency below, please rate the level of importance in the left-hand column and your current proficiency level in the right-hand column.
Level of Importance Technical Skills Level of Proficiency NI LI SI I VI 1 2 3 4 5 1 2 3 4 5 1 2 3 4 5 1 2 3 4 5 1 2 3 4 5 1 2 3 4 5 1 2 3 4 5
15. Develop budgets for all levels within the organization 16. Effectively use computer software for word processing 17. Interpret and explain organizational budgets 18. Effectively use and search the internet 19. Effectively use computer software for spreadsheets 20. Effectively use computer software for databases 21. Effectively integrate computer software program applications (i.e. merge files)
NP BA AV AA VP 1 2 3 4 5 1 2 3 4 5 1 2 3 4 5 1 2 3 4 5 1 2 3 4 5 1 2 3 4 5 1 2 3 4 5
Section 4. Communication Skills For each communication skill competency below, please rate the level of importance in the left-hand column and your current proficiency level in the right-hand column.
Level of Importance Communication Skills Level of Proficiency NI LI SI I VI 1 2 3 4 5 1 2 3 4 5 1 2 3 4 5 1 2 3 4 5 1 2 3 4 5 1 2 3 4 5 1 2 3 4 5
22. Interact and communicate with people who have divergent points of view 23. Identify barriers to listening 24. Write for various organizational purposes (i.e. technical writing, professional publications, etc.) 25. Read and comprehend a wide range of publications 26. Reduce barriers to listening 27. Recognize and effectively use nonverbal cues or behaviors 28. Write for various audiences
NP BA AV AA VP 1 2 3 4 5 1 2 3 4 5 1 2 3 4 5 1 2 3 4 5 1 2 3 4 5 1 2 3 4 5 1 2 3 4 5
Section 5. Emotional Intelligence Skills For each emotional intelligence skill competency below, please rate the level of importance in the left-hand column and your current proficiency level in the right-hand column.
Level of Importance Emotional Intelligence Skills Level of Proficiency NI LI SI I VI 1 2 3 4 5 1 2 3 4 5 1 2 3 4 5 1 2 3 4 5 1 2 3 4 5 1 2 3 4 5 1 2 3 4 5 1 2 3 4 5 1 2 3 4 5
29. Set priorities to effectively manage personal time 30. Resolve conflict 31. Make use of constructive criticism without becoming critical and angry 32. Separate personalities from behaviors 33. Negotiate agreement 34. High level of motivation 35. Control emotions in emotional situations 36. Set priorities to effectively manage organizational time 37. Respect for the time commitments of others
NP BA AV AA VP 1 2 3 4 5 1 2 3 4 5 1 2 3 4 5 1 2 3 4 5 1 2 3 4 5 1 2 3 4 5 1 2 3 4 5 1 2 3 4 5 1 2 3 4 5
Section 6. Industry Knowledge Skills For each industry knowledge skill competency below, please rate the level of importance in the left-hand column and your current proficiency level in the right-hand column.
Level of Importance Industry Knowledge Skills Level of Proficiency NI LI SI I VI 1 2 3 4 5 1 2 3 4 5 1 2 3 4 5 1 2 3 4 5 1 2 3 4 5 1 2 3 4 5 1 2 3 4 5
38. Create linkages within both traditional and non-traditional audiences 39. Depth of knowledge in a content area 40. Identify the needs of various client groups within the state 41. Explain the political environment of the state and the implications for the land-grant university system 42. Relationship between statewide programs (i.e. role of various agencies in the delivery of programs) 43. Evaluate the impact of programs for each client group 44. Being able to explain the founding principles of the land-grant system with constituents
NP BA AV AA VP 1 2 3 4 5 1 2 3 4 5 1 2 3 4 5 1 2 3 4 5 1 2 3 4 5 1 2 3 4 5 1 2 3 4 5
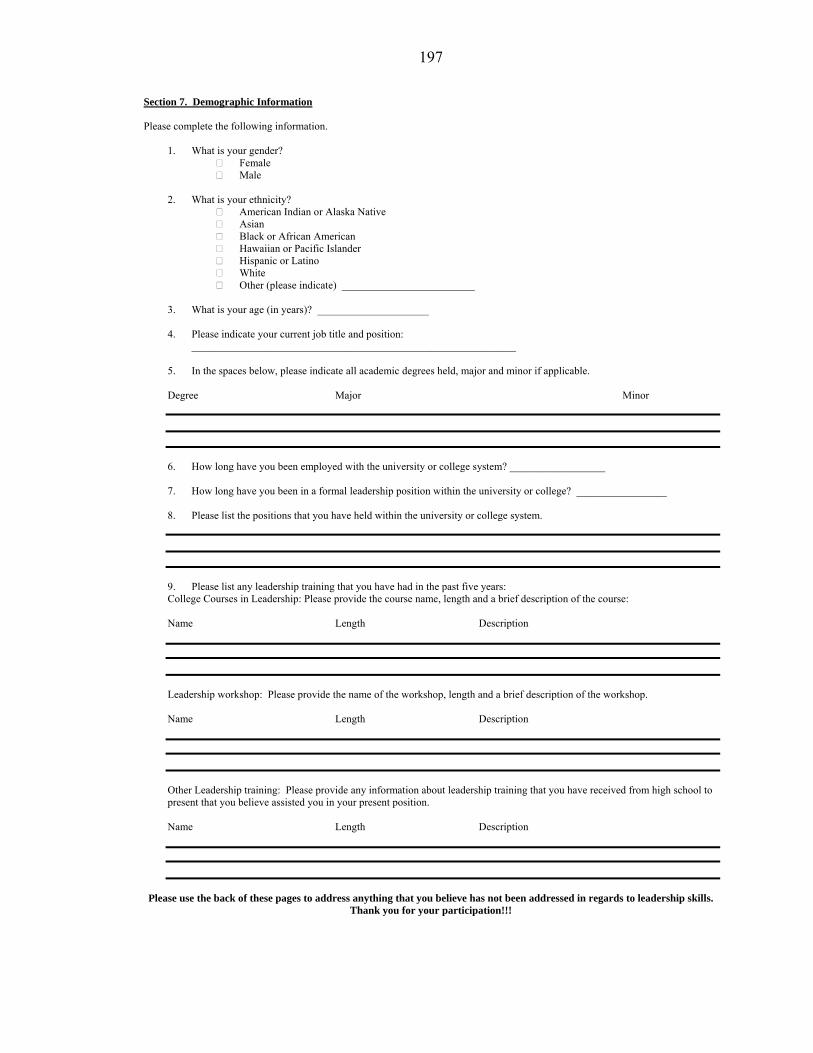
197
Section 7. Demographic Information Please complete the following information.
1. What is your gender? Female Male
2. What is your ethnicity?
American Indian or Alaska Native Asian Black or African American Hawaiian or Pacific Islander Hispanic or Latino White Other (please indicate) _________________________
3. What is your age (in years)? _____________________ 4. Please indicate your current job title and position:
_____________________________________________________________
5. In the spaces below, please indicate all academic degrees held, major and minor if applicable.
Degree Major Minor 6. How long have you been employed with the university or college system? __________________
7. How long have you been in a formal leadership position within the university or college? _________________
8. Please list the positions that you have held within the university or college system.
9. Please list any leadership training that you have had in the past five years: College Courses in Leadership: Please provide the course name, length and a brief description of the course: Name Length Description Leadership workshop: Please provide the name of the workshop, length and a brief description of the workshop.
Name Length Description Other Leadership training: Please provide any information about leadership training that you have received from high school to present that you believe assisted you in your present position. Name Length Description
Please use the back of these pages to address anything that you believe has not been addressed in regards to leadership skills. Thank you for your participation!!!
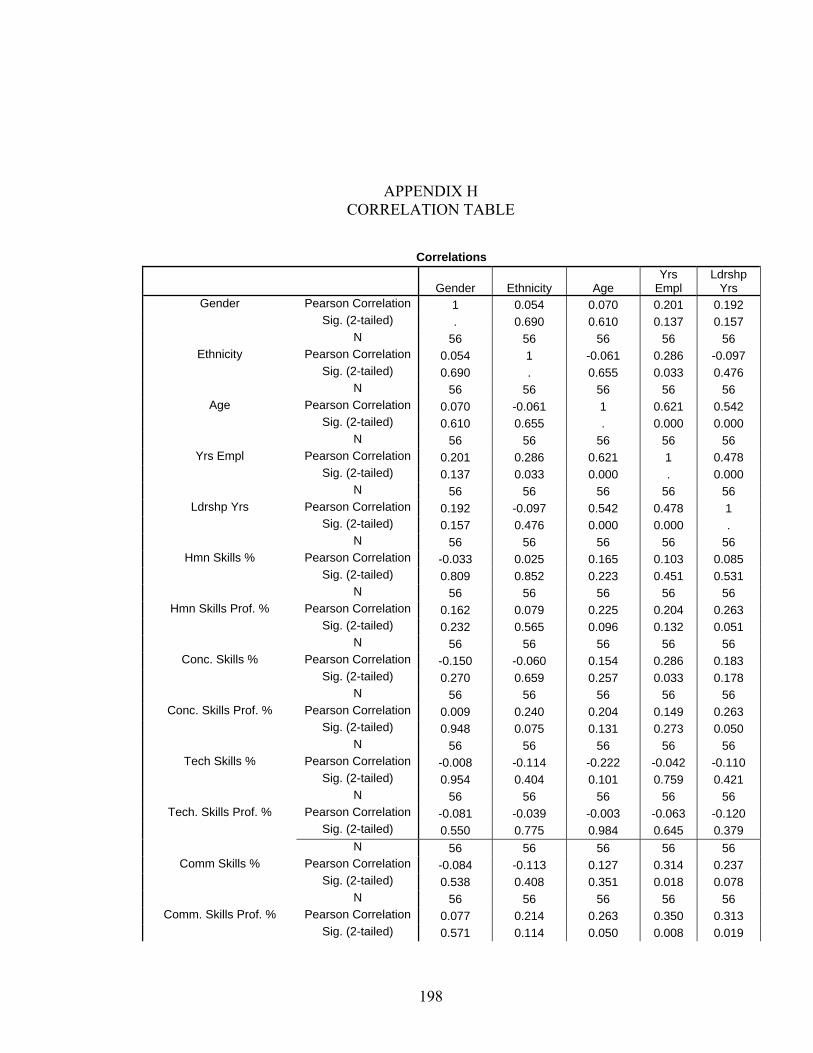
198
APPENDIX H CORRELATION TABLE
Correlations
Gender Ethnicity Age Yrs
Empl Ldrshp
Yrs Pearson Correlation 1 0.054 0.070 0.201 0.192
Sig. (2-tailed) . 0.690 0.610 0.137 0.157 Gender
N 56 56 56 56 56 Pearson Correlation 0.054 1 -0.061 0.286 -0.097
Sig. (2-tailed) 0.690 . 0.655 0.033 0.476 Ethnicity
N 56 56 56 56 56 Pearson Correlation 0.070 -0.061 1 0.621 0.542
Sig. (2-tailed) 0.610 0.655 . 0.000 0.000 Age
N 56 56 56 56 56 Pearson Correlation 0.201 0.286 0.621 1 0.478
Sig. (2-tailed) 0.137 0.033 0.000 . 0.000 Yrs Empl
N 56 56 56 56 56 Pearson Correlation 0.192 -0.097 0.542 0.478 1
Sig. (2-tailed) 0.157 0.476 0.000 0.000 . Ldrshp Yrs
N 56 56 56 56 56 Pearson Correlation -0.033 0.025 0.165 0.103 0.085
Sig. (2-tailed) 0.809 0.852 0.223 0.451 0.531 Hmn Skills %
N 56 56 56 56 56 Pearson Correlation 0.162 0.079 0.225 0.204 0.263
Sig. (2-tailed) 0.232 0.565 0.096 0.132 0.051 Hmn Skills Prof. %
N 56 56 56 56 56 Pearson Correlation -0.150 -0.060 0.154 0.286 0.183
Sig. (2-tailed) 0.270 0.659 0.257 0.033 0.178 Conc. Skills %
N 56 56 56 56 56 Pearson Correlation 0.009 0.240 0.204 0.149 0.263
Sig. (2-tailed) 0.948 0.075 0.131 0.273 0.050 Conc. Skills Prof. %
N 56 56 56 56 56 Pearson Correlation -0.008 -0.114 -0.222 -0.042 -0.110
Sig. (2-tailed) 0.954 0.404 0.101 0.759 0.421 Tech Skills %
N 56 56 56 56 56 Pearson Correlation -0.081 -0.039 -0.003 -0.063 -0.120
Sig. (2-tailed) 0.550 0.775 0.984 0.645 0.379 Tech. Skills Prof. %
N 56 56 56 56 56 Pearson Correlation -0.084 -0.113 0.127 0.314 0.237
Sig. (2-tailed) 0.538 0.408 0.351 0.018 0.078 Comm Skills %
N 56 56 56 56 56 Pearson Correlation 0.077 0.214 0.263 0.350 0.313 Comm. Skills Prof. %
Sig. (2-tailed) 0.571 0.114 0.050 0.008 0.019
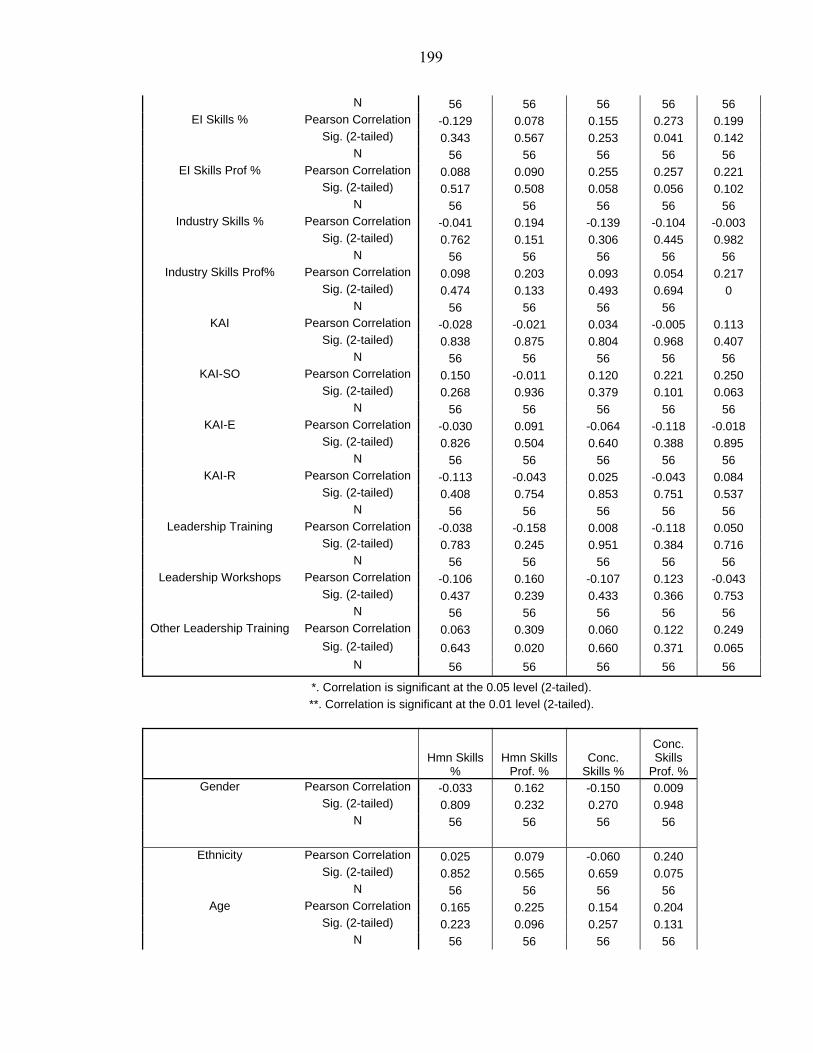
199
N 56 56 56 56 56 Pearson Correlation -0.129 0.078 0.155 0.273 0.199
Sig. (2-tailed) 0.343 0.567 0.253 0.041 0.142 EI Skills %
N 56 56 56 56 56 Pearson Correlation 0.088 0.090 0.255 0.257 0.221
Sig. (2-tailed) 0.517 0.508 0.058 0.056 0.102 EI Skills Prof %
N 56 56 56 56 56 Pearson Correlation -0.041 0.194 -0.139 -0.104 -0.003
Sig. (2-tailed) 0.762 0.151 0.306 0.445 0.982 Industry Skills %
N 56 56 56 56 56 Industry Skills Prof% Pearson Correlation 0.098 0.203 0.093 0.054 0.217
Sig. (2-tailed) 0.474 0.133 0.493 0.694 0 N 56 56 56 56
Pearson Correlation -0.028 -0.021 0.034 -0.005 0.113 Sig. (2-tailed) 0.838 0.875 0.804 0.968 0.407
KAI
N 56 56 56 56 56 Pearson Correlation 0.150 -0.011 0.120 0.221 0.250
Sig. (2-tailed) 0.268 0.936 0.379 0.101 0.063 KAI-SO
N 56 56 56 56 56 Pearson Correlation -0.030 0.091 -0.064 -0.118 -0.018
Sig. (2-tailed) 0.826 0.504 0.640 0.388 0.895 KAI-E
N 56 56 56 56 56 Pearson Correlation -0.113 -0.043 0.025 -0.043 0.084
Sig. (2-tailed) 0.408 0.754 0.853 0.751 0.537 KAI-R
N 56 56 56 56 56 Pearson Correlation -0.038 -0.158 0.008 -0.118 0.050
Sig. (2-tailed) 0.783 0.245 0.951 0.384 0.716 Leadership Training
N 56 56 56 56 56 Pearson Correlation -0.106 0.160 -0.107 0.123 -0.043
Sig. (2-tailed) 0.437 0.239 0.433 0.366 0.753 Leadership Workshops
N 56 56 56 56 56 Pearson Correlation 0.063 0.309 0.060 0.122 0.249
Sig. (2-tailed) 0.643 0.020 0.660 0.371 0.065 Other Leadership Training
N 56 56 56 56 56
*. Correlation is significant at the 0.05 level (2-tailed). **. Correlation is significant at the 0.01 level (2-tailed).
Hmn Skills
% Hmn Skills
Prof. % Conc.
Skills %
Conc. Skills
Prof. % Pearson Correlation -0.033 0.162 -0.150 0.009
Sig. (2-tailed) 0.809 0.232 0.270 0.948 Gender
N 56 56 56 56
Pearson Correlation 0.025 0.079 -0.060 0.240 Sig. (2-tailed) 0.852 0.565 0.659 0.075
Ethnicity
N 56 56 56 56 Pearson Correlation 0.165 0.225 0.154 0.204
Sig. (2-tailed) 0.223 0.096 0.257 0.131 Age
N 56 56 56 56
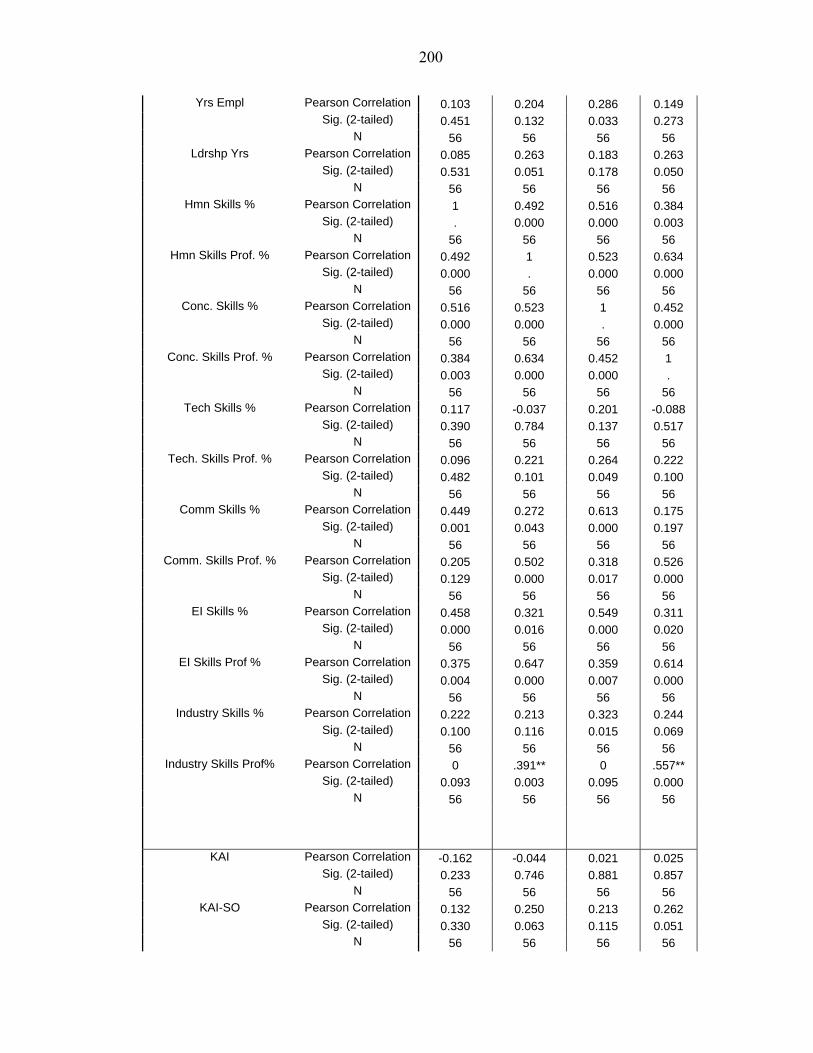
200
Pearson Correlation 0.103 0.204 0.286 0.149 Sig. (2-tailed) 0.451 0.132 0.033 0.273
Yrs Empl
N 56 56 56 56 Pearson Correlation 0.085 0.263 0.183 0.263
Sig. (2-tailed) 0.531 0.051 0.178 0.050 Ldrshp Yrs
N 56 56 56 56 Pearson Correlation 1 0.492 0.516 0.384
Sig. (2-tailed) . 0.000 0.000 0.003 Hmn Skills %
N 56 56 56 56 Pearson Correlation 0.492 1 0.523 0.634
Sig. (2-tailed) 0.000 . 0.000 0.000 Hmn Skills Prof. %
N 56 56 56 56 Pearson Correlation 0.516 0.523 1 0.452
Sig. (2-tailed) 0.000 0.000 . 0.000 Conc. Skills %
N 56 56 56 56 Pearson Correlation 0.384 0.634 0.452 1
Sig. (2-tailed) 0.003 0.000 0.000 . Conc. Skills Prof. %
N 56 56 56 56 Pearson Correlation 0.117 -0.037 0.201 -0.088
Sig. (2-tailed) 0.390 0.784 0.137 0.517 Tech Skills %
N 56 56 56 56 Pearson Correlation 0.096 0.221 0.264 0.222
Sig. (2-tailed) 0.482 0.101 0.049 0.100 Tech. Skills Prof. %
N 56 56 56 56 Pearson Correlation 0.449 0.272 0.613 0.175
Sig. (2-tailed) 0.001 0.043 0.000 0.197 Comm Skills %
N 56 56 56 56 Pearson Correlation 0.205 0.502 0.318 0.526
Sig. (2-tailed) 0.129 0.000 0.017 0.000 Comm. Skills Prof. %
N 56 56 56 56 Pearson Correlation 0.458 0.321 0.549 0.311
Sig. (2-tailed) 0.000 0.016 0.000 0.020 EI Skills %
N 56 56 56 56 Pearson Correlation 0.375 0.647 0.359 0.614
Sig. (2-tailed) 0.004 0.000 0.007 0.000 EI Skills Prof %
N 56 56 56 56 Pearson Correlation 0.222 0.213 0.323 0.244
Sig. (2-tailed) 0.100 0.116 0.015 0.069 Industry Skills %
N 56 56 56 56 Industry Skills Prof% Pearson Correlation 0 .391** 0 .557**
Sig. (2-tailed) 0.093 0.003 0.095 0.000 N 56 56 56 56
Pearson Correlation -0.162 -0.044 0.021 0.025
Sig. (2-tailed) 0.233 0.746 0.881 0.857 KAI
N 56 56 56 56 Pearson Correlation 0.132 0.250 0.213 0.262
Sig. (2-tailed) 0.330 0.063 0.115 0.051 KAI-SO
N 56 56 56 56
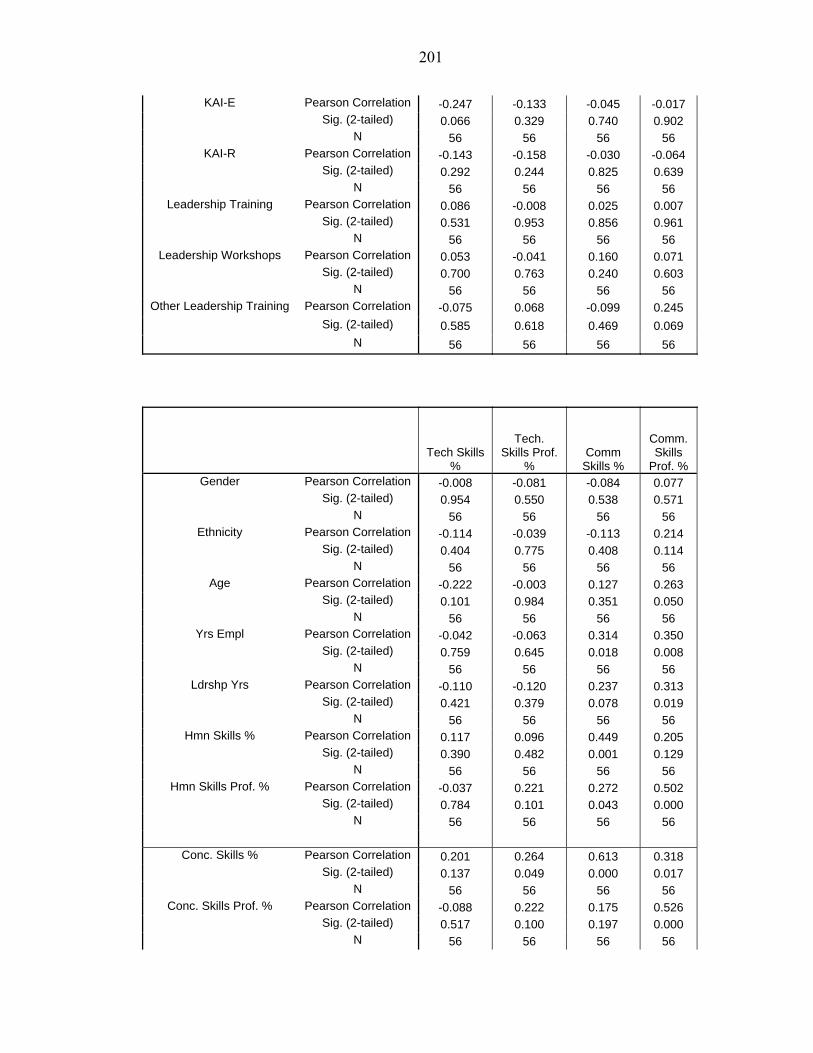
201
Pearson Correlation -0.247 -0.133 -0.045 -0.017 Sig. (2-tailed) 0.066 0.329 0.740 0.902
KAI-E
N 56 56 56 56 Pearson Correlation -0.143 -0.158 -0.030 -0.064
Sig. (2-tailed) 0.292 0.244 0.825 0.639 KAI-R
N 56 56 56 56 Pearson Correlation 0.086 -0.008 0.025 0.007
Sig. (2-tailed) 0.531 0.953 0.856 0.961 Leadership Training
N 56 56 56 56 Pearson Correlation 0.053 -0.041 0.160 0.071
Sig. (2-tailed) 0.700 0.763 0.240 0.603 Leadership Workshops
N 56 56 56 56 Pearson Correlation -0.075 0.068 -0.099 0.245
Sig. (2-tailed) 0.585 0.618 0.469 0.069 Other Leadership Training
N 56 56 56 56
Tech Skills
%
Tech. Skills Prof.
% Comm
Skills %
Comm. Skills
Prof. % Pearson Correlation -0.008 -0.081 -0.084 0.077
Sig. (2-tailed) 0.954 0.550 0.538 0.571 Gender
N 56 56 56 56 Pearson Correlation -0.114 -0.039 -0.113 0.214
Sig. (2-tailed) 0.404 0.775 0.408 0.114 Ethnicity
N 56 56 56 56 Pearson Correlation -0.222 -0.003 0.127 0.263
Sig. (2-tailed) 0.101 0.984 0.351 0.050 Age
N 56 56 56 56 Pearson Correlation -0.042 -0.063 0.314 0.350
Sig. (2-tailed) 0.759 0.645 0.018 0.008 Yrs Empl
N 56 56 56 56 Pearson Correlation -0.110 -0.120 0.237 0.313
Sig. (2-tailed) 0.421 0.379 0.078 0.019 Ldrshp Yrs
N 56 56 56 56 Pearson Correlation 0.117 0.096 0.449 0.205
Sig. (2-tailed) 0.390 0.482 0.001 0.129 Hmn Skills %
N 56 56 56 56 Pearson Correlation -0.037 0.221 0.272 0.502
Sig. (2-tailed) 0.784 0.101 0.043 0.000 Hmn Skills Prof. %
N 56 56 56 56
Pearson Correlation 0.201 0.264 0.613 0.318 Sig. (2-tailed) 0.137 0.049 0.000 0.017
Conc. Skills %
N 56 56 56 56 Pearson Correlation -0.088 0.222 0.175 0.526
Sig. (2-tailed) 0.517 0.100 0.197 0.000 Conc. Skills Prof. %
N 56 56 56 56
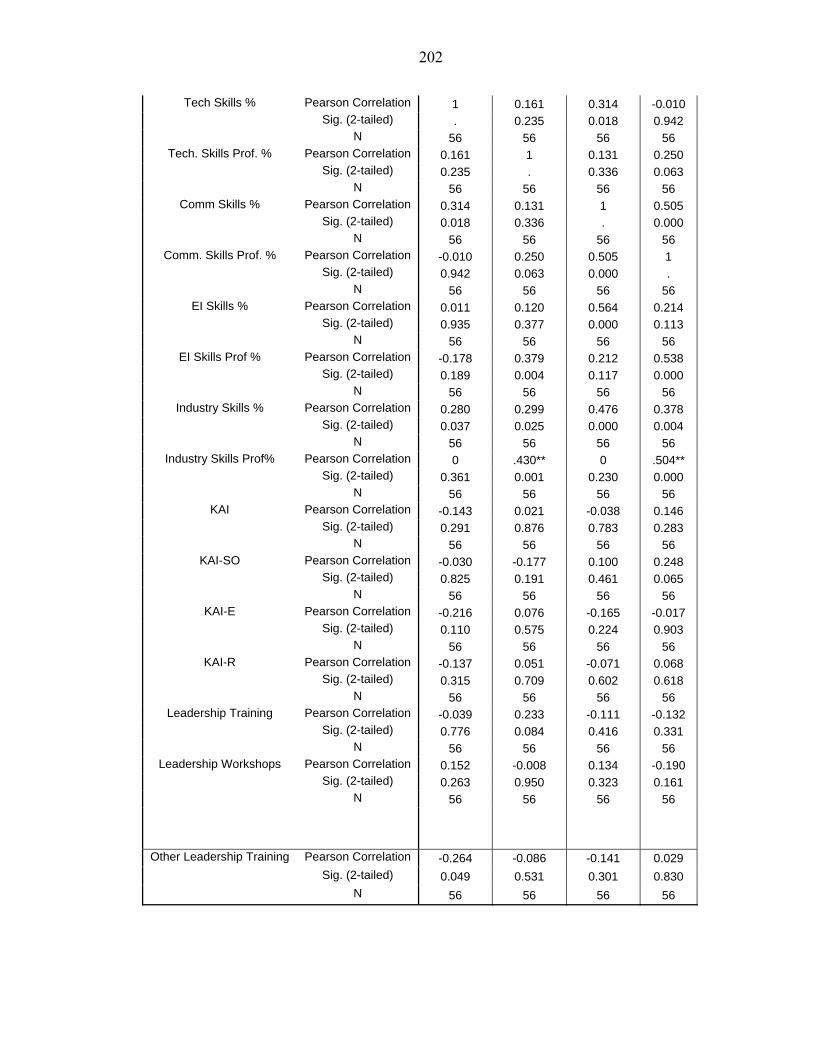
202
Pearson Correlation 1 0.161 0.314 -0.010 Sig. (2-tailed) . 0.235 0.018 0.942
Tech Skills %
N 56 56 56 56 Pearson Correlation 0.161 1 0.131 0.250
Sig. (2-tailed) 0.235 . 0.336 0.063 Tech. Skills Prof. %
N 56 56 56 56 Pearson Correlation 0.314 0.131 1 0.505
Sig. (2-tailed) 0.018 0.336 . 0.000 Comm Skills %
N 56 56 56 56 Pearson Correlation -0.010 0.250 0.505 1
Sig. (2-tailed) 0.942 0.063 0.000 . Comm. Skills Prof. %
N 56 56 56 56 Pearson Correlation 0.011 0.120 0.564 0.214
Sig. (2-tailed) 0.935 0.377 0.000 0.113 EI Skills %
N 56 56 56 56 Pearson Correlation -0.178 0.379 0.212 0.538
Sig. (2-tailed) 0.189 0.004 0.117 0.000 EI Skills Prof %
N 56 56 56 56 Pearson Correlation 0.280 0.299 0.476 0.378
Sig. (2-tailed) 0.037 0.025 0.000 0.004 Industry Skills %
N 56 56 56 56 Industry Skills Prof% Pearson Correlation 0 .430** 0 .504**
Sig. (2-tailed) 0.361 0.001 0.230 0.000 N 56 56 56 56
Pearson Correlation -0.143 0.021 -0.038 0.146 Sig. (2-tailed) 0.291 0.876 0.783 0.283
KAI
N 56 56 56 56 Pearson Correlation -0.030 -0.177 0.100 0.248
Sig. (2-tailed) 0.825 0.191 0.461 0.065 KAI-SO
N 56 56 56 56 Pearson Correlation -0.216 0.076 -0.165 -0.017
Sig. (2-tailed) 0.110 0.575 0.224 0.903 KAI-E
N 56 56 56 56 Pearson Correlation -0.137 0.051 -0.071 0.068
Sig. (2-tailed) 0.315 0.709 0.602 0.618 KAI-R
N 56 56 56 56 Pearson Correlation -0.039 0.233 -0.111 -0.132
Sig. (2-tailed) 0.776 0.084 0.416 0.331 Leadership Training
N 56 56 56 56 Pearson Correlation 0.152 -0.008 0.134 -0.190
Sig. (2-tailed) 0.263 0.950 0.323 0.161 Leadership Workshops
N 56 56 56 56
Pearson Correlation -0.264 -0.086 -0.141 0.029
Sig. (2-tailed) 0.049 0.531 0.301 0.830 Other Leadership Training
N 56 56 56 56
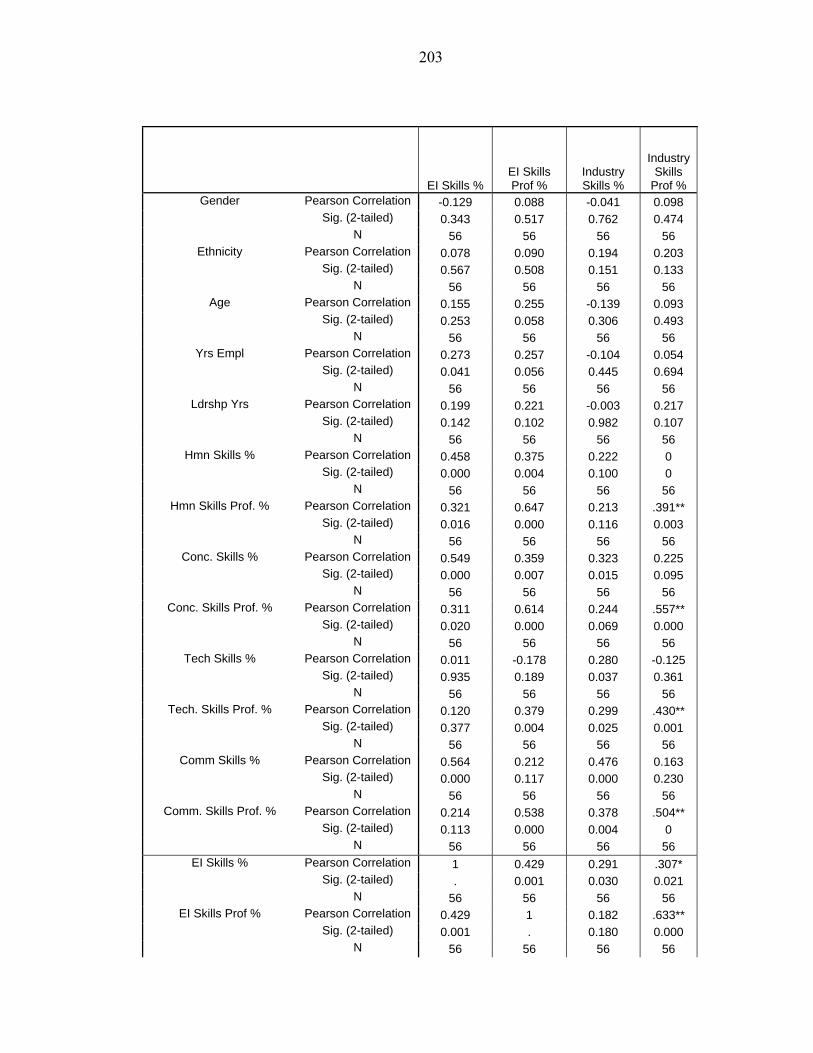
203
EI Skills % EI Skills Prof %
Industry Skills %
Industry Skills
Prof % Pearson Correlation -0.129 0.088 -0.041 0.098
Sig. (2-tailed) 0.343 0.517 0.762 0.474 Gender
N 56 56 56 56 Pearson Correlation 0.078 0.090 0.194 0.203
Sig. (2-tailed) 0.567 0.508 0.151 0.133 Ethnicity
N 56 56 56 56 Pearson Correlation 0.155 0.255 -0.139 0.093
Sig. (2-tailed) 0.253 0.058 0.306 0.493 Age
N 56 56 56 56 Pearson Correlation 0.273 0.257 -0.104 0.054
Sig. (2-tailed) 0.041 0.056 0.445 0.694 Yrs Empl
N 56 56 56 56 Pearson Correlation 0.199 0.221 -0.003 0.217
Sig. (2-tailed) 0.142 0.102 0.982 0.107 Ldrshp Yrs
N 56 56 56 56 Pearson Correlation 0.458 0.375 0.222 0
Sig. (2-tailed) 0.000 0.004 0.100 0 Hmn Skills %
N 56 56 56 56 Pearson Correlation 0.321 0.647 0.213 .391**
Sig. (2-tailed) 0.016 0.000 0.116 0.003 Hmn Skills Prof. %
N 56 56 56 56 Pearson Correlation 0.549 0.359 0.323 0.225
Sig. (2-tailed) 0.000 0.007 0.015 0.095 Conc. Skills %
N 56 56 56 56 Pearson Correlation 0.311 0.614 0.244 .557**
Sig. (2-tailed) 0.020 0.000 0.069 0.000 Conc. Skills Prof. %
N 56 56 56 56 Pearson Correlation 0.011 -0.178 0.280 -0.125
Sig. (2-tailed) 0.935 0.189 0.037 0.361 Tech Skills %
N 56 56 56 56 Pearson Correlation 0.120 0.379 0.299 .430**
Sig. (2-tailed) 0.377 0.004 0.025 0.001 Tech. Skills Prof. %
N 56 56 56 56 Pearson Correlation 0.564 0.212 0.476 0.163
Sig. (2-tailed) 0.000 0.117 0.000 0.230 Comm Skills %
N 56 56 56 56 Pearson Correlation 0.214 0.538 0.378 .504**
Sig. (2-tailed) 0.113 0.000 0.004 0 Comm. Skills Prof. %
N 56 56 56 56 Pearson Correlation 1 0.429 0.291 .307*
Sig. (2-tailed) . 0.001 0.030 0.021 EI Skills %
N 56 56 56 56 Pearson Correlation 0.429 1 0.182 .633**
Sig. (2-tailed) 0.001 . 0.180 0.000 EI Skills Prof %
N 56 56 56 56
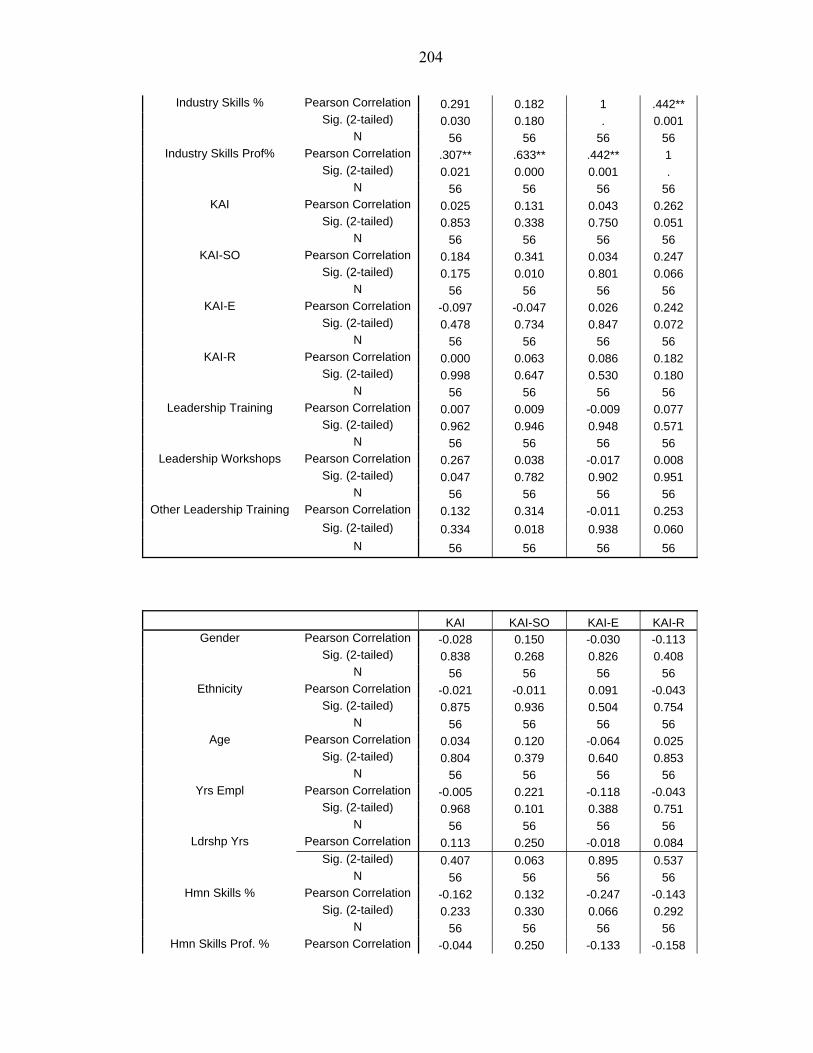
204
Pearson Correlation 0.291 0.182 1 .442** Sig. (2-tailed) 0.030 0.180 . 0.001
Industry Skills %
N 56 56 56 56 Industry Skills Prof% Pearson Correlation .307** .633** .442** 1
Sig. (2-tailed) 0.021 0.000 0.001 . N 56 56 56 56
Pearson Correlation 0.025 0.131 0.043 0.262 Sig. (2-tailed) 0.853 0.338 0.750 0.051
KAI
N 56 56 56 56 Pearson Correlation 0.184 0.341 0.034 0.247
Sig. (2-tailed) 0.175 0.010 0.801 0.066 KAI-SO
N 56 56 56 56 Pearson Correlation -0.097 -0.047 0.026 0.242
Sig. (2-tailed) 0.478 0.734 0.847 0.072 KAI-E
N 56 56 56 56 Pearson Correlation 0.000 0.063 0.086 0.182
Sig. (2-tailed) 0.998 0.647 0.530 0.180 KAI-R
N 56 56 56 56 Pearson Correlation 0.007 0.009 -0.009 0.077
Sig. (2-tailed) 0.962 0.946 0.948 0.571 Leadership Training
N 56 56 56 56 Pearson Correlation 0.267 0.038 -0.017 0.008
Sig. (2-tailed) 0.047 0.782 0.902 0.951 Leadership Workshops
N 56 56 56 56 Pearson Correlation 0.132 0.314 -0.011 0.253
Sig. (2-tailed) 0.334 0.018 0.938 0.060 Other Leadership Training
N 56 56 56 56
KAI KAI-SO KAI-E KAI-R Pearson Correlation -0.028 0.150 -0.030 -0.113
Sig. (2-tailed) 0.838 0.268 0.826 0.408 Gender
N 56 56 56 56 Pearson Correlation -0.021 -0.011 0.091 -0.043
Sig. (2-tailed) 0.875 0.936 0.504 0.754 Ethnicity
N 56 56 56 56 Pearson Correlation 0.034 0.120 -0.064 0.025
Sig. (2-tailed) 0.804 0.379 0.640 0.853 Age
N 56 56 56 56 Pearson Correlation -0.005 0.221 -0.118 -0.043
Sig. (2-tailed) 0.968 0.101 0.388 0.751 Yrs Empl
N 56 56 56 56 Pearson Correlation 0.113 0.250 -0.018 0.084
Sig. (2-tailed) 0.407 0.063 0.895 0.537 Ldrshp Yrs
N 56 56 56 56 Pearson Correlation -0.162 0.132 -0.247 -0.143
Sig. (2-tailed) 0.233 0.330 0.066 0.292 Hmn Skills %
N 56 56 56 56 Hmn Skills Prof. % Pearson Correlation -0.044 0.250 -0.133 -0.158
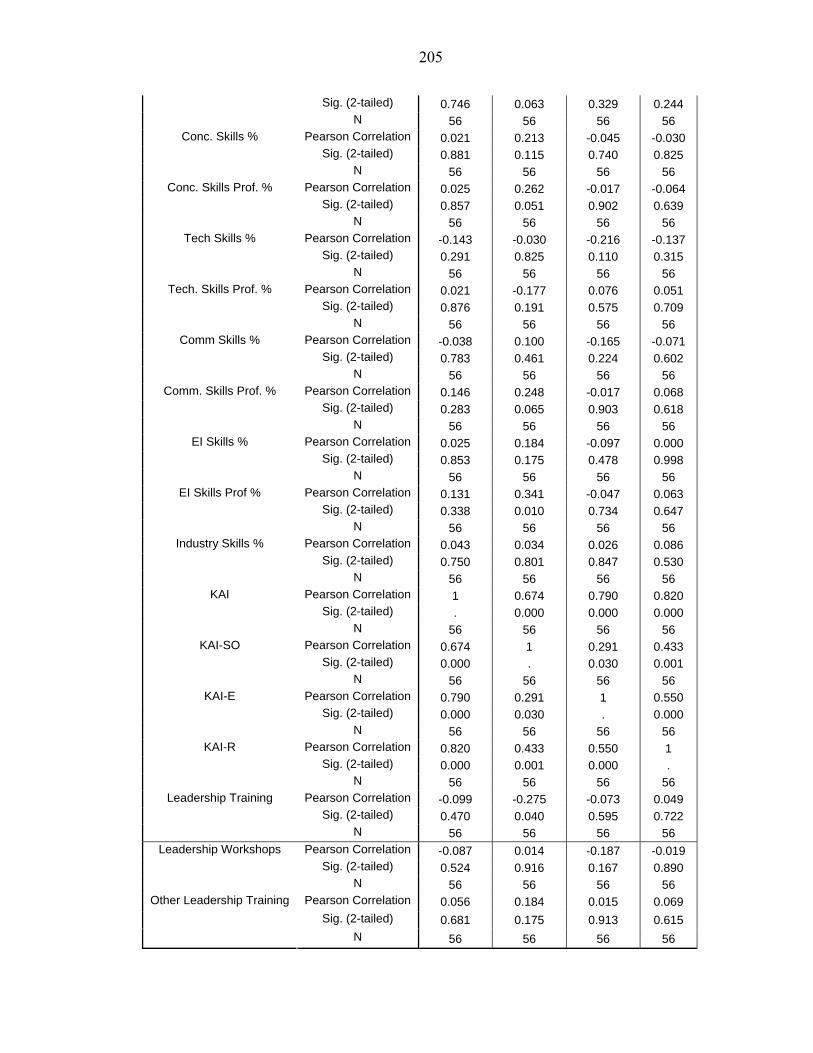
205
Sig. (2-tailed) 0.746 0.063 0.329 0.244 N 56 56 56 56
Pearson Correlation 0.021 0.213 -0.045 -0.030 Sig. (2-tailed) 0.881 0.115 0.740 0.825
Conc. Skills %
N 56 56 56 56 Pearson Correlation 0.025 0.262 -0.017 -0.064
Sig. (2-tailed) 0.857 0.051 0.902 0.639 Conc. Skills Prof. %
N 56 56 56 56 Pearson Correlation -0.143 -0.030 -0.216 -0.137
Sig. (2-tailed) 0.291 0.825 0.110 0.315 Tech Skills %
N 56 56 56 56 Pearson Correlation 0.021 -0.177 0.076 0.051
Sig. (2-tailed) 0.876 0.191 0.575 0.709 Tech. Skills Prof. %
N 56 56 56 56 Pearson Correlation -0.038 0.100 -0.165 -0.071
Sig. (2-tailed) 0.783 0.461 0.224 0.602 Comm Skills %
N 56 56 56 56 Pearson Correlation 0.146 0.248 -0.017 0.068
Sig. (2-tailed) 0.283 0.065 0.903 0.618 Comm. Skills Prof. %
N 56 56 56 56 Pearson Correlation 0.025 0.184 -0.097 0.000
Sig. (2-tailed) 0.853 0.175 0.478 0.998 EI Skills %
N 56 56 56 56 Pearson Correlation 0.131 0.341 -0.047 0.063
Sig. (2-tailed) 0.338 0.010 0.734 0.647 EI Skills Prof %
N 56 56 56 56 Pearson Correlation 0.043 0.034 0.026 0.086
Sig. (2-tailed) 0.750 0.801 0.847 0.530 Industry Skills %
N 56 56 56 56 Pearson Correlation 1 0.674 0.790 0.820
Sig. (2-tailed) . 0.000 0.000 0.000 KAI
N 56 56 56 56 Pearson Correlation 0.674 1 0.291 0.433
Sig. (2-tailed) 0.000 . 0.030 0.001 KAI-SO
N 56 56 56 56 Pearson Correlation 0.790 0.291 1 0.550
Sig. (2-tailed) 0.000 0.030 . 0.000 KAI-E
N 56 56 56 56 Pearson Correlation 0.820 0.433 0.550 1
Sig. (2-tailed) 0.000 0.001 0.000 . KAI-R
N 56 56 56 56 Pearson Correlation -0.099 -0.275 -0.073 0.049
Sig. (2-tailed) 0.470 0.040 0.595 0.722 Leadership Training
N 56 56 56 56 Pearson Correlation -0.087 0.014 -0.187 -0.019
Sig. (2-tailed) 0.524 0.916 0.167 0.890 Leadership Workshops
N 56 56 56 56 Pearson Correlation 0.056 0.184 0.015 0.069
Sig. (2-tailed) 0.681 0.175 0.913 0.615 Other Leadership Training
N 56 56 56 56
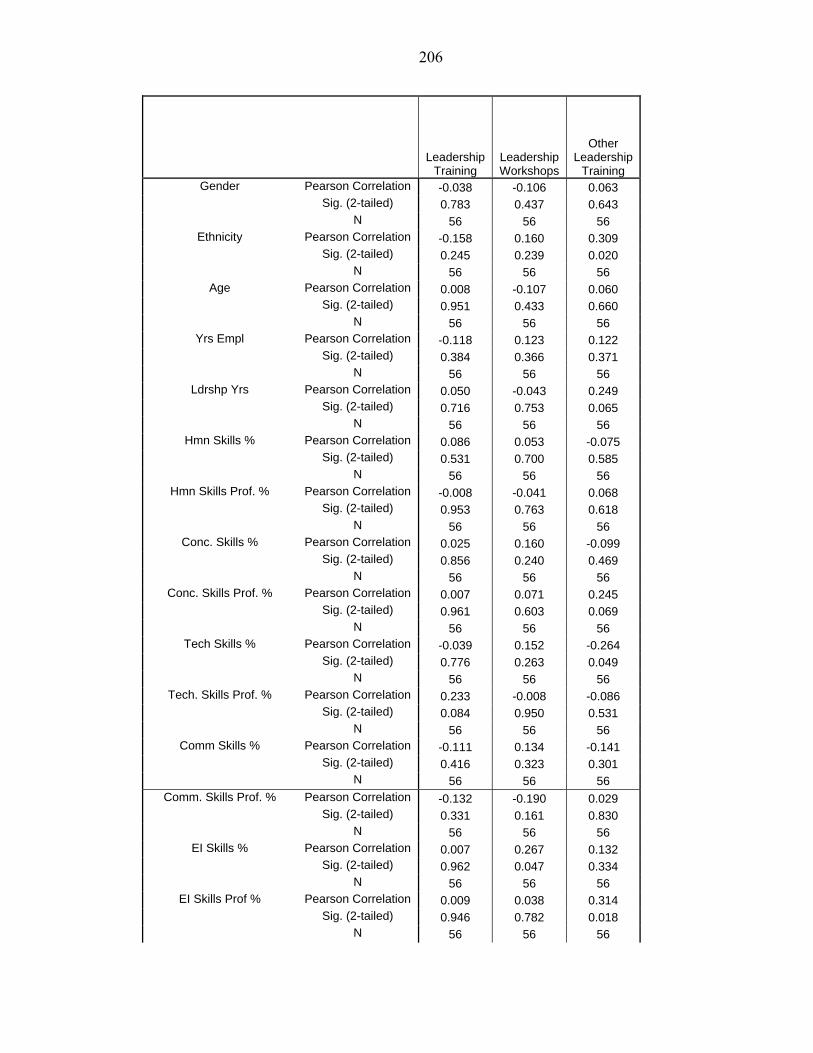
206
Leadership
Training Leadership Workshops
Other Leadership
Training Pearson Correlation -0.038 -0.106 0.063
Sig. (2-tailed) 0.783 0.437 0.643 Gender
N 56 56 56 Pearson Correlation -0.158 0.160 0.309
Sig. (2-tailed) 0.245 0.239 0.020 Ethnicity
N 56 56 56 Pearson Correlation 0.008 -0.107 0.060
Sig. (2-tailed) 0.951 0.433 0.660 Age
N 56 56 56 Pearson Correlation -0.118 0.123 0.122
Sig. (2-tailed) 0.384 0.366 0.371 Yrs Empl
N 56 56 56 Pearson Correlation 0.050 -0.043 0.249
Sig. (2-tailed) 0.716 0.753 0.065 Ldrshp Yrs
N 56 56 56 Pearson Correlation 0.086 0.053 -0.075
Sig. (2-tailed) 0.531 0.700 0.585 Hmn Skills %
N 56 56 56 Pearson Correlation -0.008 -0.041 0.068
Sig. (2-tailed) 0.953 0.763 0.618 Hmn Skills Prof. %
N 56 56 56 Pearson Correlation 0.025 0.160 -0.099
Sig. (2-tailed) 0.856 0.240 0.469 Conc. Skills %
N 56 56 56 Pearson Correlation 0.007 0.071 0.245
Sig. (2-tailed) 0.961 0.603 0.069 Conc. Skills Prof. %
N 56 56 56 Pearson Correlation -0.039 0.152 -0.264
Sig. (2-tailed) 0.776 0.263 0.049 Tech Skills %
N 56 56 56 Pearson Correlation 0.233 -0.008 -0.086
Sig. (2-tailed) 0.084 0.950 0.531 Tech. Skills Prof. %
N 56 56 56 Pearson Correlation -0.111 0.134 -0.141
Sig. (2-tailed) 0.416 0.323 0.301 Comm Skills %
N 56 56 56 Pearson Correlation -0.132 -0.190 0.029
Sig. (2-tailed) 0.331 0.161 0.830 Comm. Skills Prof. %
N 56 56 56 Pearson Correlation 0.007 0.267 0.132
Sig. (2-tailed) 0.962 0.047 0.334 EI Skills %
N 56 56 56 Pearson Correlation 0.009 0.038 0.314
Sig. (2-tailed) 0.946 0.782 0.018 EI Skills Prof %
N 56 56 56
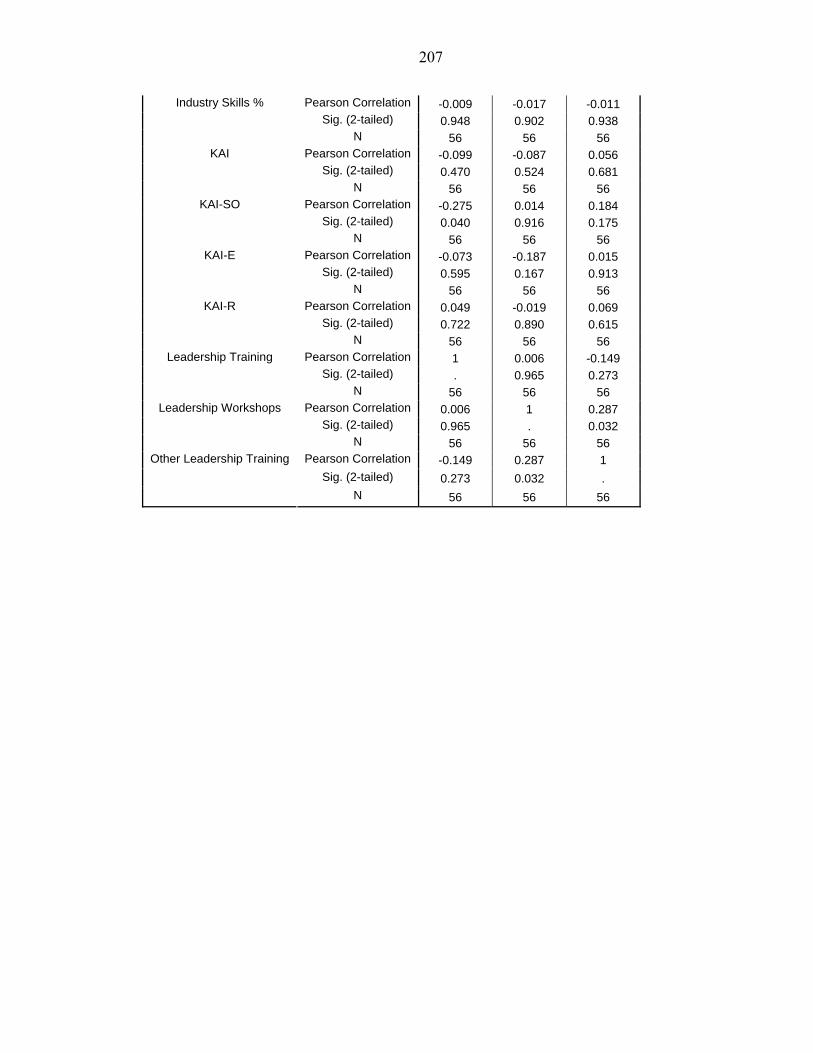
207
Pearson Correlation -0.009 -0.017 -0.011 Sig. (2-tailed) 0.948 0.902 0.938
Industry Skills %
N 56 56 56 Pearson Correlation -0.099 -0.087 0.056
Sig. (2-tailed) 0.470 0.524 0.681 KAI
N 56 56 56 Pearson Correlation -0.275 0.014 0.184
Sig. (2-tailed) 0.040 0.916 0.175 KAI-SO
N 56 56 56 Pearson Correlation -0.073 -0.187 0.015
Sig. (2-tailed) 0.595 0.167 0.913 KAI-E
N 56 56 56 Pearson Correlation 0.049 -0.019 0.069
Sig. (2-tailed) 0.722 0.890 0.615 KAI-R
N 56 56 56 Pearson Correlation 1 0.006 -0.149
Sig. (2-tailed) . 0.965 0.273 Leadership Training
N 56 56 56 Pearson Correlation 0.006 1 0.287
Sig. (2-tailed) 0.965 . 0.032 Leadership Workshops
N 56 56 56 Pearson Correlation -0.149 0.287 1
Sig. (2-tailed) 0.273 0.032 . Other Leadership Training
N 56 56 56
208
LIST OF REFERENCES
Abelson, P. H., (1997). Evolution of higher education. Science 8, 277(5327), 747.
Acker, J. (1990). Hierarchies, jobs, bodies: A theory of gendered organizations, Gender and Society, 4, 139–158.
Adler, N. J. (1984). Understanding the ways of understanding: Cross-cultural management methodology reviewed. Advanced International Company Management, 1, 31–67.
American Society of Association Executives. (2000). Leading effectively. Association ofManagement, 52, 23.
Anderson Consulting Institute for Strategic Change. Retrieved December 20, 2005, from http://www.anderson.ucla.edu/research/cmie/conf2001.htm
Anderson, M. S., & Louis, K. S. (1991). The changing locus of control over faculty research: From self-regulation to dispersed influence. In J. S. Smart (Ed.), Higher education: Handbook of theory and research, 7, 57-101. New York: Agathon Press.
Arends, R. (1998). Building capacity for change. In D. Thiessen, & K. R. Howey (Eds.),Agents, provocateurs: Reform-minded leaders for schools of education. Washington, DC: American Association of Colleges for Teacher Education.
Ary, D., Jacobs, L., & Razavieh, A. (1996). Introduction to research in education.(5th ed.). Fort Worth, TX: Harcourt Brace College Publishers.
Ary, D., Jacobs, L., & Razavieh, A. (2002). Introduction to research in education.(6th ed.). Belmont, CA: Wadsworth/Thomson Learning.
Astin, A., & Scherrei, R. (1980). Maximizing leadership effectiveness. San Francisco, Jossey-Bass.
Austin, A. E. (1984). The work experience of university and college administrators. American Association of University Administrators, 6(1), 1-6.
Avolio, G. J., & Bass, P. M. (1988). Transformational leadership, charisma, and beyond. In J. G. Hunt, B. R. Baliga, H. P. Dachler, and C. A. Schriesheim (Eds.), Emerging leadership vistas. Lexington, MA: Lexington Books.
209
Avolio, G. J., & Bass, P. M. (2002). Developing potential across a full range of leadership. Mahwah, NJ: Lawrence Erlbaum Associates.
Avolio, G. J., & Bass, P. M. (2004). Multifactor leadership questionnaire. Manual and sample set. (3rd ed.). Redwood City, CA: Mind Garden.
Avolio, B. J., Waldman, D. A., & Yammarino, F. J. (1991). Leading in the 1990s: The four I's of transformational leadership. Journal of European Industrial Training, 15(4), 9-16.
Ayman, R., & Chemers, M. M. (1983). Relationship of supervisory behavior ratings to work group effectiveness and subordinate satisfaction among Iranian managers. Journal of Applied Psychology, 68(2), 338–341.
Bartol, K., Evans. C., & Stith, M. (1978). Black versus white leaders: A comparative review of the literature. Academy of Management Review, 3, 293-304.
Bass, B. M. (1960). Leadership, psychology, and organizational behavior. New York:Harper.
Bass, B. M. (1975). PEX-a program of exercises in management and organizational development. Scottsville, NY: Transnational Programs.
Bass, B. M. (1981). Stogdill’s handbook of leadership (rev. ed) New York: The Free Press.
Bass, B. M. (1985). Leadership and performance beyond expectations, New York: The Free Press
Bass, B. M. (1990). Bass & Stogdill's handbook of leadership. Theory, research and managerial applications. (3rd ed.), New York: The Free Press
Bass, B. M. (1997). Does the transactional–transformational leadership paradigm transcend organizational and national boundaries? American Psychology, 52(2), 130–139.
Bass, B. M. (1998). Transformational leadership: Industry, military and educational impact. Mahway, NJ: Lawrence Erlbaum Associates.
Bass, B. M., & Avolio, B. J. (1997). Full range leadership development. Manual for themultifactor leadership questionnaire. Redwood City, CA: Mind Garden.
Bass, B. M., & Avolio, B. J. (2000). MLQ: Multifactor questionnaire: Third edition manual and sampler set. Redwood City, CA: Mind Garden.
Bass, B. M., Burger, P. C., Doktor, R., & Barrett, G. W. (1979). Assessment of Managers: An international comparison. New York: Free Press
210
Bass, B. M., & Steidlmeier, P. (1998). Ethics, character and authentic transformationalleadership. Center for Leadership Studies, School of Management, Binghamton University, Binghamton, NY.
Becker, B., & Gerhart, B. (1996). The impact of human resource management on organizational performance: progress and prospects. Academic Management Journal, 39(4), 779–801.
Bedeian, A. G., & Hunt, J. G. (2005). Academic amnesia and vestigial assumptions of our forefathers. Unpublished Manuscript, Area of Management, The Texas University Press.
Bell, D. J. (1975). Power, influence and authority. New York: Oxford University Press.
Bellows, R. M. (1959). Creative leadership. Englewood Cliffs, NJ: Prentice Hall.
Bennis, W. (1999). On becoming a leader. London, England: Arrow.
Bennis, W., & Nanus, B. (1985). Leaders: The strategies for taking charge. New York:Harper and Row Publishers, INC.
Bennis, W., Spreitzer, G. M., & Cummings, T. G. (Eds.) (2001). The future of leadership: Today’s top leadership thinkers speak of tomorrow’s leaders. San Francisco: Jossey-Bass.
Bensimon, E. M., Neumann, A., & Birnbaum, R. (1989). Making sense of administrative leadership: The “L” word in higher education. Washington DC: George Washington University Press.
Bess, J. L., & Goldman, P. (2001). Leadership ambiguity in universities and K–12schools and the limits of contemporary leadership theory. The Leadership Quarterly, 12(4), 419-450.
Bess, J. L. (2001). Disincentives to commitment to teaching in Japan: Toward a theory of normative discontinuity. In Smart, J. S., (Ed.) 2001. Higher education: Handbook of theory and research, New York: Agathon Press.
Blake, R. R., & Mouton, J. S. (1964). The managerial grid. Houston, TX: Gulf Publishing.
Boatwright, K. J., & Forrest, L. K. (2000). The influence of gender and needs for connection on workers’ ideal preferences for leadership behaviors. Journal of Leadership Studies, 7, 18-34.
Bogardis, E. S. (1918). Essentials of social psychology. Los Angeles: University of Southern California Press.
Bowden, B. V. (1962). The lesson of the cow colleges. The New Scientist, 16, 574.
211
Boyacigiller, N.A., Kleinberg, M.J., Phillips, M.E. and Sackmann, S.A. (1996). Conceptualizing culture. In Punnett, B.J. and Shenkar, O., (Eds.) (1996). Handbook for International Management Research (pp. 157–208). Cambridge, MA: Blackwell Publishing.
Boy Scouts of America. Retrieved December 12, 2005, from http://www.scouting.org/
Boy Scouts of America . The Leadership Skills Presented at Woodbadge. Retrieved on December 23, 2005, from www.woodbadge.org/Boyscout/wbsskill.htm
Bragg, D. D. (2000, Spring). Preparing community college deans to lead change. In Robillard, D. (Ed.), New Directions for Community Colleges (pp. 75-85). San Francisco: Jossey-Bass.
Brodbeck, F. C., Frese, M., Akerblom, S., Audia, G., Bakacsi, G., Bendova, H., et al. 2000. Cultural variation of leadership prototypes across 22 European countries. Journal of Occupational Organization Psychology, 73, 1–29.
Burns, J. M. (1978). Leadership. New York: Harper & Row.
Cameron, K. S., & Ulrich, D.O. (1986). Transformational leadership in colleges and universities. In Smart, J. S. (1986). Higher education: Handbook of theory and research, New York: Agathon Press.
Cullen, J. B. (2002). Multinational Management: A Strategic Approach. (2nd Ed.), Cincinnati, OH: South-Western Thomson Learning.
Chaffee, E. E., & Tierney, W. G. (1988). Collegiate culture and leadership strategies, American Council on Education, New York: Macmillan.
Chapman, J. D. (1998). Handbook of research on educational administration: A project of the American Educational Research Association. San Francisco: Jossey-Bass.
Chemers, M. (1993). An integrative theory of leadership. In Chemers, M. M. & Ayman, R. (Eds.), Leadership theory and research: perspectives and directions, 293-319. San Diego: Academic Press.
Chemers, M. M. (2001). Leadership effectiveness: An integrative review. In M. A. Hogg, & R. S. Tindale (Eds.) Blackwell handbook of social psychology: Group processes, Oxford, United Kingdom: Blackwell Publishing.
Chliwniak, L. (1997). Higher education leadership: Analyzing the gender gap. ASHE-ERIC Higher Education Report, 25, 4.
Clark, D. (1999). Leadership competency model or pyramid of leadership. Retrieved on December 23, 2005, from: http://nwlink.com/~donclark/hrd/case/chart1.html
212
Clark, R. W. (1992). Stress and turnover among Extension directors. Journal ofExtension, 30(2), Retrieved on March 10, 2006 from http://www.joe.org/joe/1992summer/rb1.html
Cohen, J. H. (1995). You can be a woman engineer. Culver City, CA: Cascade Press.
Cohen, J., & Cohen, P. (1983). Applied Multiple Regression/Correlation Analysis for the Behavioral Sciences. (2nd ed.), Mahwah, NJ: Lawrence Erlbaum Associates.
Conger, J. A. & Kanungo, R.N. (1998). Charismatic Leadership in Organizations Sage,Thousand Oaks, CA.
Conger, J. A. (1999). Charismatic and transformational leadership in organizations: an insider's perspective on these developing streams of research. Leadership Quarterly, 10(2), 145–180.
Cowley, W. (1928). Three distinctions in the study of leaders. Journal of AbnormalPsychology, 23, 144-157.
Davis, K. E. (1982). The status of black leadership: Implications for organizational competitiveness. Academy of Management Executive, 5(3), 45-56.
Davis, R. C. (1942). The fundamentals of top management. New York: Harper.
Day, D. V. (1998). Leadership sensemaking: parts, wholes, and beyond. In F. Dansereau, & F. J. Yammarino (Eds.), (1998). Leadership: The multiple-level approaches, contemporary and alternative, Stamford, CT: JAI Press.
Deaux, K., & Lewis, L. L. (1983). Components of gender stereotypes. Psychological Documents, 13.
De Cremer, D., & Tyler, T. R. (2005a). Am I respected or not? Inclusion and reputation as issues in group membership, Social Justice Research 18, 121–153.
De Cremer & Tyler, T. R. (2005b). Managing group behavior: The interplay between procedural justice, sense of self, and cooperation. In M. Zanna, Advances in Experimental Social Psychology, 37, 151-218. New York, NY: Academic Press.
Den Hartog, D., House, R.J., Hanges, P.J., Ruiz-Quintanilla, S. A. & GLOBE Associates
Desimone, R., Wener, J., & Harris, D. (2006). Human resource development. Fort Worth, TX: Harcourt College Publisher.
Dillman, D. A. (2000). Mail and internet surveys: The tailored design method (2nd ed.). New York: John Wiley & Sons, Inc.
DiPaolo, D. G. (2002). Voices of leadership. Ann Arbor, MI: University of Michigan.
213
Doh, J. P. (2003). Can leadership be taught. Academy of Management, Learning and Education, 2(1), 54-67.
Dorfman, P. W. (1996). International and cross-cultural leadership research. In B. J. Punnett, & O. Shenkar, (Eds.), Handbook for International Management Research, Oxford, United Kingdom: Blackwell Publishing.
Dorfman, P. W. (1999). Culture specific and cross culturally generalizable implicit leadership theories: Are attributes of charismatic/transformational leadership universally endorsed? Leadership Quarterly, 10, 219–256.
Dorfman, P., & Hanges, P. J. (2000). Culturally endorsed implicit theories of leadership: Does national culture really matter? Paper presented at the Western Academy of Management Conference, Waikoloa Beach, HI.
Dorfman, P. W. & Howell, J. P. (1988). Dimensions of national culture and effective leadership patterns. In R. N. Farmer, & E. G. McGoun, (Eds); 1988. Advances in International Comparative Management, 3, 127-149. London, England: JAI Press.
Dorfman, P. W., Howell, J. P., Hibino, S., Lee, J. K., Tate, U., & Bautista, A. (1997). Leadership in Western and Asian countries: Commonalities and differences in effective leadership processes across cultures. Leadership Quarterly, 8(3), 233–274.
Eagly, A. H., Johannesen-Schmidt, M. C., & Van Engen, M. (2003). Transformational, transactional, and laissez-faire leadership styles: A meta-analysis comparing women and men, Psychological Bulletin, 129, 569–591.
Eagly, A. H., & Johnson, B. (1990). Gender and leadership style: A meta-analysis. Psychological Bulletin, 108, 233-256
Eckman, R. (2003). Standing up when it matters. CIC Newsletter, April 2, 2003.
Elias, L. (1991). Who needs management skills in your maquila? Twin Plant News, 6, 37–39.
Elizur, D. (1994). Gender and work values: A comparative analysis. The Journal of Social Psychology, 134(2), 201-212.
Erez, M., 1997. A culture-based model of work motivation. In P. C. Earley, & M. Erez,(Eds.), New Perspectives on International Industrial/Organizational Psychology, San Francisco: New Lexington Press.
Etzioni, A. (1961). A comparative analysis of complex organizations: On power, involvement, and their correlates, New York: Free Press.
Felder, R., & Silverman L., Learning and teaching styles in engineering education.
214
Engineering Education, 78(7), 674-681 (1988).
Fiedler, F., & Garcia, J. (1987). New approaches to effective leadership: Cognitive resources and organizational performance. New York, John Wiley & Sons.
Forrest, L. (2000). The influence of gender and needs for connection on workers’ ideal preferences for leadership. Journal of Leadership Studies.
French, J. R., & Raven, B. (1959). The bases of social power. In D. Cartwright (Ed.), Studies in social power. Ann Arbor, MI: University of Michigan, Institute for Social Research.
Fullan, M. (1993). Change forces: Probing the depths of educational reform. London, England: Falmer Press.
Gall, M., Borg, W. R., & Gall, J. P. (1996). Educational research: An introduction (6th ed.). White Plains, NY: Longman Publishers USA.
Gardner, J. (1989). On leadership. New York: Free Press.
Gerth, H., & Mills, C. W. (1952). A sociological note on leadership. In J. E. Hulett & R.Stagner (Eds.), Problems in social psychology. Urbana, IL: University of Illinois Press.
Gmelch, W. (1999). Building leadership capacity for institutional reform. Proceedings of the Global Consortium of Higher Education and Research for Agriculture. Amsterdam, Netherlands.
Goldhor, H. (1974). The use of late respondents to estimate the nature of non-respondents. Washington, DC: U.S. Office of Education. (ERIC Document ED 083 309).
Goleman, D., (1998). What makes a leader. Harvard Business Review.
Goleman, D., Boyatzis, R., & McKee, A. (2002). Primal leadership: Realizing the power of emotional intelligence. Boston, MA: Harvard Business School of Publishing.
Gould, J. W. (1964). The academic deanship. New York, NY: Teachers College Press.
Green, M. F. (1981). Developing leadership: A paradox in academe. New Directions in Higher Education, 9, 11-17.
Gregory, R. L. (1987). The Oxford companion to the mind. Oxford, United Kingdom: Oxford Press University.
Hackman, M. Z., & Johnson, C. E. (1996). Leadership: A communication perspective. (2nd ed.). Prospect Heights, IL: Waveland Press.
215
Hains, S.C., Hogg, M.A., & Duck, J.M. (1997). Self-categorization and leadership: effects of group prototypicality and leader stereotypicality. Personal Society Psychology Bulletin, 23(10), 1087–1099.
Hambrick, D. C., & Mason, P. A. (1984). Upper echelons: The organization as areflection of its top managers. Academy of Management Review, 9(2), 193-206.
Hare, A. P., Borgatta, E. F., & Bales, R. F. (Eds.). (1995). Small groups. Studies in social interaction. New York: Knopf Publishing.
Haslam, S. A. (2001). Psychology in organizations: The social identity approach. London: Sage.
Hawkes, H. E. (1930, May). College administration. Journal of Higher Education, 1, 245.
Harrison, D., Price, K., & Bell, M. (1998). Beyond relational demography: time and the effects of surface- and deep-level diversity on work group cohesion. Academic Management Journal, 47(1), 96–107.
Heifetz, R.A. (1994). Leadership without easy answers. Cambridge, MA: Belknap Press.
Hersey, P., & Blanchard, L. H. (1969). Life cycle theory of leadership. Training and Development Journal (8th ed.). Upper Saddle River, NJ: Prentice Hall.
Hersey, P., & Blanchard, K. H. (1977). The management of organizational behavior. Upper Saddle River, NJ: Prentice Hall.
Herzog, L.A. (1990). Where North Meets South: Cities, Space and Politics on the U.S.–Mexico Border. Center for Mexican American Studies, University of Texas at Austin.
Hofstede, G. (1980). Culture's Consequences: International Differences in Work-Related Values. London: Sage.
Hofstede, G. (1991). Cultures and Organizations: The Software of the Mind. New York:McGraw-Hill.
Hofstede, G. (2001). Culture's Consequences: Comparing Values, Behaviors, Institutions, and Organizations Across Nations. Thousand Oaks, CA: Sage Publishing.
Holder, S. L. (1990). Leadership style and leadership behavior preferences of cooperative extension faculty. Unpublished doctoral dissertation, New Mexico State University, Las Cruces.
House, R. A. et al. (1998). The Globe Project. Address, International Congress of Psychology, San Francisco, CA.
216
House, R. J. (1971). A path-goal theory of leader effectiveness, Administrative Science Quarterly, 16, 321–339.
House, R. J. (1996). Path-Goal theory of leadership: Lessons, legacy, and a reformulated theory. Leadership Quarterly, in press.
House, R. J., & Aditya, R. N. (1997). The social scientific study of leadership: Quo Vadis? Journal of Management, 23, 409–473.
House, R. J., & Dessler, G. (1974). The path-goal theory of leadership: Some posthoc and a priori tests. In J. Hunt, & L. Larson (Eds.), Contingency approaches in leadership. Carbondale, IL: Southern Illinois University Press.
House , R. J., & Mitchell, T. R. (1974). Path-Goal theory of leadership: Journal of Contemporary Business, 5, 81-97.
House, R. J., Hanges, P. J., Javidan, M., & Dorfman, P. W. GLOBE Associates & Gupta,V. (2002). Cultures, Leadership, and Organizations: GLOBE, A 62 Nation Study, Thousand Oaks, CA: Sage Publishing.
House, R. J., Rizzo, J. R., & Lirtzman, S. I. (1970). Role conflict and ambiguity in complex organizations. Administrators Science Quarterly, 15(2), 150–163.
Howell, J. P., & Costley, D. L. (2006). Understanding behaviors for effective leadership. Upper Saddle River, NJ: Prentice-Hall.
Huffman-Joley, G. (1992). The role of the dean: Fostering teaching as scholarship inthe school of education learning community. Paper presented at the Annual Meeting of the American Association of Colleges for Teacher Education, San Antonio, TX.
Isaac, S., & Michael, W. (1971). Handbook in research and evaluation: For education and the behavioral sciences. San Diego, CA. EdITS publishers.
Jackson, J. (2000). Decanal work: Using role theory and the sociology of time to study the executive behavior of college education deans. Unpublished doctoral dissertation. Iowa State University, Ames.
Katz, R. L. (1955). Skills of an effective administrator. Harvard Business Review, 33(1), 33-42.
Katzenbach, J. R. (1998). Teams at the top: Unleashing the potential of both teams and individual leaders. Boston: Harvard Business School Press.
Kellogg, C. E. & Knapp, D. C. (1966). The College of Agriculture. New York: McGraw-Hill.
217
Kellogg Commission on the Future of State and Land-Grant Universities. (1996). Taking charge of change. Renewing the promise of state and land-grant universities. Washington DC.
Kellogg Commission on the Future of State and Land-Grant Universities (2000). Returning to our roots. Executive summaries of the reports of the Kellogg commission on the future of state and land-grant universities. Washington, DC.
Kirkpatrick, S., & Lock, E. (1991). Leadership: Do traits matter? The Executive, 5, 48-60.
Kirton, M.J. (1999). Retrieved on January 13, 2006 from: http//www.kaicentre.com/initiatives.htm
Kouzes, J. M., & Posner, B. Z. (2002). The leadership challenge. San Francisco: Jossey-Bass.
Kraatz, M. S., & Zajac, E. J. (2001). How organizational resources affect strategic change and performance in turbulent environments: Theory and evidence. Organization Science, 12(5), 632–657.
Krech, D., & Crutchfield, R. (1948). Theory and problems of social psychology. New York: McGraw-Hill.
Krishnan, H. A., & Park, D. (1998). The influence of top management team leadership on corporate refocusing: A theoretical framework. The Journal of Leadership Studies, 5(2), 50-61.
Lamborn, M. L. (1991). Motivation and job satisfaction of deans of schools of nursing. Journal of Professional Nursing, 7(1), 33-40.
Lebon, G. (1897). The crowd. New York: Macmillan.
Likert, R. (1967). The human organization. New York: McGraw-Hill. Lord, D. J. Brown, & Freiberg, S. J. (1999). Understanding the dynamics of leadership: The role of follower self-concepts in the leader/follower relationship, Organizational and Human Decision Processes, 78, 1–37.
Machen, B. J. (1995). A day in the life of a dean. Journal of Dental Education, 59(9), 869-873.
Mann, R. D. (1959). A review of the relationship between personality and performance in small groups. Psychological Bulletin, 66(4), 241-70.
Marlowe, H. A. (1987). Journal of Educational Psychology, 78(1), 52.
Maxwell, J. C. (1999). The 21 indispensable qualities of a leader. Nashville, TN: Thomas Nelson, Inc.
218
Maxwell, J. (2002). Leadership 101: What every leader needs to know. Nashville, TN: Thomas Nelson, Inc.
McGregor, D. M. (1960). The human side of enterprise. New York: McGraw-Hill.
McGregor, D. M. (1966). Leadership and motivation. Cambridge, MA: MIT Press.
McVey, R. S. (1995). Critical thinking skills for leadership development. Journal of Leadership Studies, 2(4), 90.
Meindl, J. (1993). Reinventing leadership: A radical, social psychological approach. In J. K. Murnighan (Ed.), Social psychology in organizations: Advances in theory and research, (pp. 89-118). Englewood Cliffs, NJ: Prentice Hall.
Mendl, J. R. (1990). The romance of leadership as a follower-centric theory: A Constructionist approach. Leadership Quarterly, 6(3), 329-341.
Meredith, G., Schewe, C. D., Hiam, A., & Karlovich, J. (2002). Managing by defining moments. New York: Hungry Minds.
Meyer, J. H. (1995). Transforming the land grant college of agriculture for the twenty-first century. Davis, CA: University of California.
Miller, P. M. (1989). A study of professional characteristics of deans of colleges of business. Higher Education Management, 1(2), 107-115.
Mintzberg, H. (1998, November-December). Covert leadership: Notes on managing professionals. Harvard Business Review, 140-147.
Morrill Land-Grant Act (1862 & 1887). Retrieved on January 5, 2006, from http://www.higher-ed.org/resources/morrill_acts.htm
Moore, L. L. (2003). Leadership in the cooperative extension system: An examination of leadership styles and skills of state directors and administrators. Unpublished doctoral dissertation, University of Florida, Gainesville.
Mott, P. E. (1972). The characteristics of effective organizations. New York: Harper & Row.
Mumford, M. D. Scott, G. M., Gaddis, B., & Strange, J. M. (2002). Leading creative people: Orchestrating expertise and relationships. The Leadership Quarterly, 13, 705–750.
Mumford, M. D., Marks, M. S., Connelly, M. S., Azccaro, S. J., & Reiter-Palmon, R.(2000). Development of leadership skills: Experience and timing. Leadership Quarterly, 11(1), 87-114.
219
National Association of State Universities and Land-Grant Colleges. Retrieved on January 7, 2006, from http://nasulgc.org
National Academy Press (1996). Colleges of agriculture at the land grant universities: public service and public policy/committee on the Future of Land Grant Colleges of Agriculture, Board on Agriculture, National Research Council.
National Research Council (1995). Committee on the Future of Land Grant Colleges of Agriculture.
National Research Council (1996). Committee on the Future of Land Grant Colleges of Agriculture.
Neil, G. I., & Kirby, S. L. (1985). Journal of Sport Behavior.
Neubert, M. J. (1999). Too much of a good thing or the more the merrier? Exploring the dispersion and gender composition of informal leadership in manufacturing teams. Small Group Research, 30(5), 635–646.
North Dakota State University. Retrieved on January 3, 2006, from http://www.ndus.edu/
Northouse, P. (2004). Leadership: theory and practice. Thousand Oaks, CA. Sage.
Organ, D. W. (1988). Organizational citizenship behavior: The good soldier syndrome, Lexington, MA: D.C. Heath Publishing.
Penfield, R. D. (2002). The fundamentals of survey-based research: The science ofcollecting information from humans about humans. Gainesville, FL: University of Florida.
Pfeffer, J. (1977). The ambiguity of leadership. Academy of Management Review, 2,104-112.
Pisapia, J., & Coukos-Semmel, E. (2002). Aligning assessment instruments with the sterling quality criteria: Technical report for the teaching and learning center at Florida Atlantic University. Educational Resources Information Center. U.S. Department of Education.
Pryor, R. G. (1983). Sex differences in the levels of generality of values/preferences related to work. Journal of Vocational Behavior, 23, 233-241.
Robillard, D. (2000, Spring). Toward a definition of deaning. In Robillard, D. (Ed.), New directions for community colleges (pp. 109), 3-8. San Franciso: Jossey Bass.
Rosen, R. (1996). Leading people: Transforming business from the inside out. New YorkNY: Viking Press.
Rosener, J. B. (2000). Ways women lead. Harvard Business Review, 68(6), 119-125.
220
Rosener, J. B. (1990). Ways women lead. Harvard Business Review, 68, 119-124.
Rost, J. C. (1991). Leadership for the 21st century. New York: Greenwood Publishing Group.
Rudolph, F. (1990). The American college and university: A history. Athens, GA: University of Georgia Press.
Sadler, P. J., & Hofstede, G. H. (1972). Leadership styles: Preferences and perceptions of employees of an international company in different countries. Mens en Ondernemnig, 26, 43-63.
Schenk, C. (1928). Leadership. Infantry Journal, 33, 111-122.
Schreiber, B., & Shannon, J. (2001). Developing library leaders for the 21st century. In Winston, M. D. (Ed.), Leadership in the Library and Information Science Professions: Theory and Practice (pp. 35-57). Bingamton, NY: Haworth Press.
Scholl, R. W. (2002). Leadership style. Kingston, RI: University of Rhode Island Press.
Shamir, R. J. House, & Arthur, M. B. (1993). The motivational effects of charismatic leadership: A self-concept based theory. Organization Science, 4, 577–594.
Singleton, S. E., Burack, C. A., & Hirsch, D. J. (1997). Faculty service enclaves. AAHE Bulletin, 49(8), 3-7.
Smircich, L. & Morgan, G. (1986). Leadership: the management of meaning. In T. Heller, J. Van Til, & L. A. Zurcher (Eds.), Leaders and followers: challenges for the future. Contemporary issues in applied behavioral science (pp. 43-62). Greenwich, CT: JAI Press.
Smith, M. L., & Glass, G. V. (1987). Research and evaluation in education and thesocial sciences. Englewood Cliffs, NJ: Prentice-Hall.
Stedman, N. P. (2004). Leadership, volunteer administration and 4-H: Leadership styles and volunteer administration competence of 4-H state volunteer specialists and county faculty. Unpublished doctoral dissertation, University of Florida, Gainesville.
Stinson, J. E., & Robertson, J. E. (1973). Follower-maturity and preference for leader-behavior style. Psychological Reports, 32(1), 247-250.
Stogdill, R. M. (1948). Personal factors associated with leadership: A survey of the literature. Journal of Psychology, 25, 35-71.
Stogdill, R. M. (1974). Hand book of leadership: A survey of theory and research. NewYork: Free Press.
221
Stogdill, R. M. (1981). Stogdill’s handbook of leadership. New York: The Free Press.
Tichny, N. M., & Devanna, M. A. (1990). The transformational leader. New York: John Wiley & Sons.
Trice, H.M., & Beyer, J.M. (1993). The cultures of work organizations, EnglewoodCliffs, NJ: Prentice-Hall.
Tucker, A., & Bryan, R. A. (1988). The academic dean: Dove, dragon and diplomat,New York: Macmillan.
Van Knippenberg, B., Van Knippenberg, De Cremer, D., & Hogg, M. A. (2004). Leadership, self, and identity: A review and research agenda. The Leadership Quarterly, 15, 825–856.
Vogt, W. (2005). Dictionary of statistics & methodology. (3rd ed.) Thousand Oaks, CA: SAGE.
Weick, K. E. (1995). Sense making in organizations. Thousand Oaks: Sage.
Weierter, S. J. (1997). Who wants to play follow the leader: a theory of charismatic relationships based on routinized charisma and follower characteristic. Leadership Quarterly, 8(2), 171–193.
Wilson, V. (1999). The department chair: Between a rock and a hard place. New Concord, OH: Muskingum College Press.
Wisniewski, R. (1998). The new Sisphus: The dean as change agent. In D. Thiessen & K.R. Howey (Eds.), Agents, provocateurs: Reform-minded leaders for schools of education. Washington, DC: American Association of Colleges for Teacher Education.
Walker, K. L. (2000). Facing challenges: Identifying the role of the community college dean. Retrieved from: http://ed.gov/databases/ERICDigests/ed441551.html
Wolfe, R. A. (1994). Organizational innovation: Review, critique and suggested research directions. Journal of Management Studies, 31(3), 405–431.
Wolverton, M., Gmelch, W., Montez, J., & Nies, C. (2001). The changing nature of the academic deanship, 28, (21). San Francisco, CA; Jossey Bass (ASHEERIC Higher Education Report No. ED 457 708).
Wright, P. (1996). Managerial Leadership. London: Routledge.
Wylie, J. C. (1996). Chances & choices: How women can succeed in today’s knowledge-based business. Vienna, VA: EBW Press.
222
Yates, J. O. (2005). Women in leadership positions in Tennessee public schools: A qualitative study of female directors of schools. Unpublished doctoral dissertation, East Tennessee State University, Johnson City.
Yukl, G. (1994). Leadership in organizations (3rd ed.), Englewood Cliffs, NJ: Prentice-Hall.
Yukl, G. (1999). An evaluation of conceptual weaknesses in transformational and charismatic leadership theories. The Leadership Quarterly, 10(2), 285–305.
Yukl, G. (2002). Leadership in Organizations. (5th ed.). Upper Saddle River, NJ: Prentice Hall.
Zaccaro, S. J., & Banks, D. J. (2001). Leadership, vision, and organizational effectiveness. In S. J. Zaccaro, & R. J. Klimoski (Eds.), The nature of organizational leadership, San Francisco: Jossey-Bass.
223
BIOGRAPHICAL SKETCH
David Jones earned a Bachelor’s of Science degree and secondary agriculture
teaching credential in agricultural education and communication from California
Polytechnic State University (Cal Poly, San Luis Obispo) in 1994. He received his
master’s degree in agricultural education from Cal Poly in 1995. Jones taught agriculture
at Atascadero High School in Atascadero, California, for seven years where he focused
on developing the school’s ornamental horticulture program.
Jones was hired as a lecturer in the Agricultural Education and Communication
Department at Cal Poly in the spring of 2002. While at Cal Poly, Jones taught courses on
teaching methods and strategies, as well as program planning. He pursued a doctorate
degree at the University of Florida starting in the fall of 2004. Jones studied leadership
and teacher education while attending the University of Florida. While enrolled in
graduate classes, he worked principally with the Agricultural Education and
Communication Oral Communication courses and the College of Agricultural and Life
Sciences Honors Program.
Jones married his college sweetheart and best friend, Jennifer, and they have two
daughters, Abbey and Kelsey.