Embed Size (px)
Citation preview

Invest in
Leadership
Brands
Double
Down on
International
Selective
& Strategic
M&A
Consumer
Centric
Unify &
Elevate the
Best People
Accelerate
Shared Service
Excellence
Maximize
Operating
Efficiency
Optimize
Capital
Deployment
Investor Presentation November 2019

Forward Looking Statements and Reconciliation of Non-GAAP Financial Measures
Forward Looking Statements:
Certain written and oral statements made by the Company and subsidiaries of the Company may constitute “forward-looking
statements” as defined under the Private Securities Litigation Reform Act of 1995. This includes statements made in this
presentation. Generally, the words “anticipates”, “believes”, “expects”, “plans”, “may”, “will”, “should”, “seeks”, “estimates”,
“project”, “predict”, “potential”, “continue”, “intends”, and other similar words identify forward-looking statements. All
statements that address operating results, events or developments that the Company expects or anticipates will occur in the
future, including statements related to sales, earnings per share (“EPS”) results, and statements expressing general
expectations about future operating results, are forward-looking statements and are based upon its current expectations and
various assumptions. The Company believes there is a reasonable basis for these expectations and assumptions, but there
can be no assurance that the Company will realize these expectations or that these assumptions will prove correct.
Forward-looking statements are subject to risks that could cause them to differ materially from actual results. Accordingly,
the Company cautions readers not to place undue reliance on forward-looking statements. The forward-looking statements
contained in this presentation should be read in conjunction with, and are subject to and qualified by, the risks described in
the Company’s Form 10-K for the year ended February 28, 2019, and in the Company's other filings with the SEC. Investors
are urged to refer to the risk factors referred to above for a description of these risks. Such risks include, among others, the
Company's ability to deliver products to its customers in a timely manner and according to their fulfillment standards, the
costs of complying with the business demands and requirements of large sophisticated customers, the Company's
relationships with key customers and licensors, its dependence on the strength of retail economies and vulnerabilities to any
prolonged economic downturn, its dependence on sales to several large customers and the risks associated with any loss or
substantial decline in sales to top customers, expectations regarding any proposed restructurings, its recent and future
acquisitions or divestitures, including its ability to realize anticipated cost savings, synergies and other benefits along with its
ability to effectively integrate acquired businesses or separate divested businesses, circumstances which may contribute to
future impairment of goodwill, intangible or other long-lived assets, the retention and recruitment of key personnel, foreign
currency exchange rate fluctuations, risks associated with weather conditions, the duration and severity of the cold and flu
season and other related factors, its dependence on foreign sources of supply and foreign manufacturing, and associated
operational risks including, but not limited to, long lead times, consistent local labor availability and capacity, and timely
availability of sufficient shipping carrier capacity, labor and energy on cost of goods sold and certain operating expenses, the
risks associated with significant tariffs or other restrictions on imports from China or any retaliatory trade measures taken by
China, the geographic concentration and peak season capacity of certain U.S. distribution facilities increases its exposure to
significant shipping disruptions and added shipping and storage costs, its projections of product demand, sales and net
income are highly subjective in nature and future sales and net income could vary in a material amount from such
projections, the risks associated with the use of trademarks licensed from and to third parties, its ability to develop and
introduce a continuing stream of new products to meet changing consumer preferences, trade barriers, exchange controls,
expropriations, and other risks associated with U.S. and foreign operations, the risks to its liquidity as a result of changes to
capital and credit market conditions, limitations under its financing arrangements and other constraints or events that impose
constraints on its cash resources and ability to operate its business, the costs, complexity and challenges of upgrading
and managing its global information systems, the risks associated with cybersecurity and information security breaches,
the risks associated with global legal developments regarding privacy and data security could result in changes to our
business practices, penalties, increased cost of operations, or otherwise harm our business, the risks associated with
product recalls, product liability, other claims, and related litigation against us, the risks associated with accounting for
tax positions, tax audits and related disputes with taxing authorities, the risks of potential changes in laws in the U.S. or
abroad, including tax laws, regulations or treaties, employment and health insurance laws and regulations, and laws
relating to environmental policy, personal data, financial regulation, transportation policy and infrastructure policy along
with the costs and complexities of compliance with such laws, its ability to continue to avoid classification as a
controlled foreign corporation, and legislation enacted in Bermuda and Barbados in response to the European Union’s
review of harmful tax competition could adversely affect our operations. The Company undertakes no obligation to
publicly update or revise any forward-looking statements as a result of new information, future events or otherwise.
Reconciliation of Non-GAAP Financial Measures:
This presentation includes non-GAAP financial measures. Adjusted operating income, adjusted income, adjusted
operating margin, adjusted effective tax rate, adjusted diluted EPS, and free cash flow (“Non-GAAP measures”) that are
discussed in this presentation or in the preceding tables may be considered non-GAAP financial information as
contemplated by SEC Regulation G, Rule 100. Accordingly, the Company is providing the tables within this
presentation which reconcile these measures to their corresponding GAAP-based measures. The Company believes
that these non-GAAP measures provide useful information to management and investors regarding financial and
business trends relating to its financial condition and results of operations. The Company believes that these non-
GAAP financial measures, in combination with the Company’s financial results calculated in accordance with GAAP,
provide investors with additional perspective regarding the impact of certain charges on applicable income, margin and
earnings per share measures. The Company also believes that these non-GAAP measures facilitate a more direct
comparison of the Company’s performance with its competitors. The Company further believes that including the
excluded charges would not accurately reflect the underlying performance of the Company’s continuing operations for
the period in which the charges are incurred, even though such charges may be incurred and reflected in the
Company’s GAAP financial results in the near future. Additionally, the non-GAAP measures are used by management
for measuring and evaluating the Company’s performance. The material limitation associated with the use of the non-
GAAP measures is that the non-GAAP measures do not reflect the full economic impact of the Company’s activities.
These non-GAAP measures are not prepared in accordance with GAAP, are not an alternative to GAAP financial
information, and may be calculated differently than non-GAAP financial information disclosed by other companies.
Accordingly, undue reliance should not be placed on non-GAAP information.
2

A leading global consumer products company
offering creative solutions for its customers
through a strong diversified portfolio of well-
recognized and widely-trusted brands in Health
& Home, Beauty and Housewares.
Highly Favorable Business Fundamentals
Powerful Global Brands
Exciting Growth Drivers
Track Record of Results
3
HELE Business Overview
BeautyFY19 Net Sales: $345.1 million (22.1% of total)
Health & Home FY19 Net Sales: $695.2 million (44.4% of total)
HousewaresFY19 Net Sales: $523.8 million (33.5% of total)
FY19 Total Consolidated Net Sales $1.564 Billion
We Believe We Have Strengths and Qualities That Set Us Apart
4
Strengths Qualities
Operational excellence
Strategic plan and operating company structure
Depth of business integration
Scalable acquisition platform and playbook
Ability to generate strong cash flow
Optimal debt structure for our strategy and risk profile
Tax efficiency and sustainability
Track record of consistent results
Above average returns with below average risk
High say-to-do ratio, credibility and transparency
Diversification, resiliency and risk management
Primed to deploy capital with low risk and leverage
Undervalued in comparison to most of our peers
Still in the “middle innings”; the best is yet to come

Our Business Today is Vastly Different From Where We Began
A beauty
company is born
1968
Beauty
Helen of Troy expands
beyond beauty
2004
Beauty Housewares
~$400M
Three divisions
powering our growth
Beauty Health & Home
Housewares
2019~$1.56B
5

• FY19 Net sales of $1.564B: built from acquisition and organic growth
• Bolting On: success adding new categories, geographies and channels
• Tucking In: new brands and adjacencies for additional growth
• Right Balance: of integration and independence
Divest
2003 2004 2007 2008 2009 2010 2010 2011 2014 2015 2016 2017
6
Proven Ability to Acquire and Integrate in Attractive Sectors
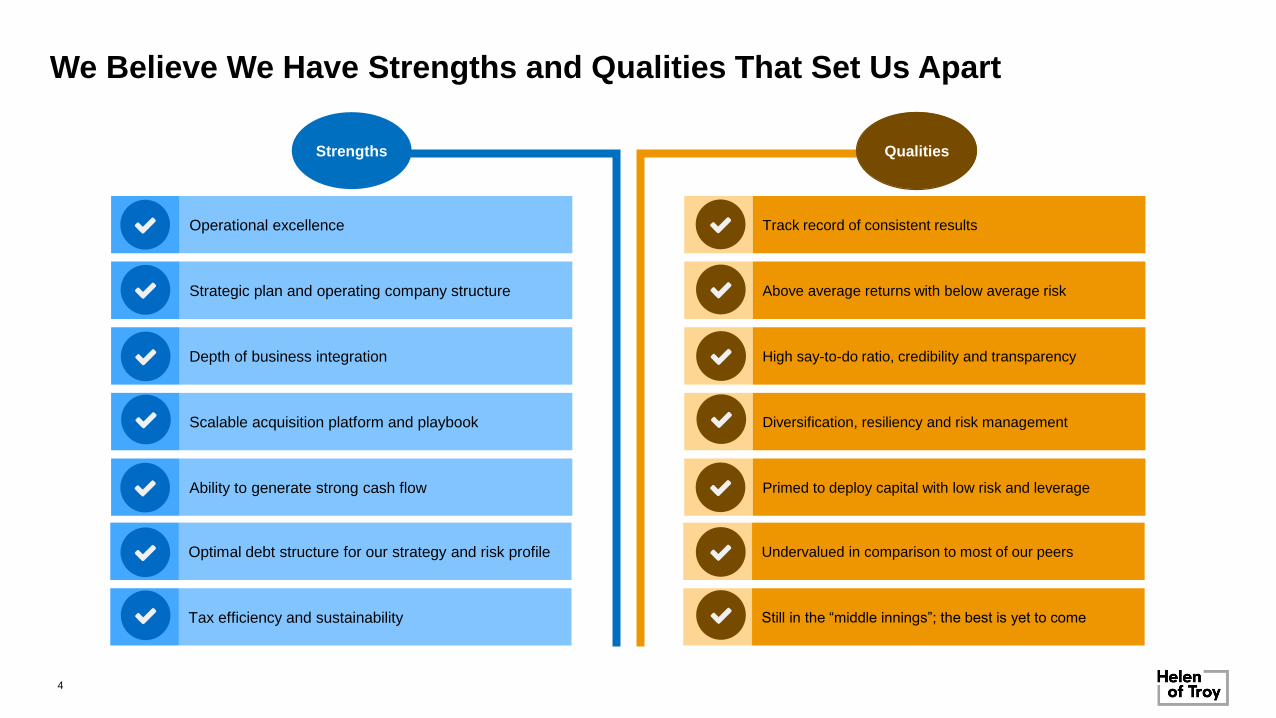
Optimizing Capital Deployment
7
1. Accessible,
Cost-Effective
Debt at Favorable
Terms
3. Strong
Cash Flow
Generation
2. Conservative
Approach to
Debt
Access
to
Capital
Capital Priorities
1. Infrastructure Investments
2. Accretive Acquisitions
3. Opportunistic Return of
Capital to Shareholders

Disciplined Acquisitions are Core to Our Strategy
Favor brands with #1 or
#2 market position
Accretive to cash flow and
Adjusted Diluted EPS
Enhances revenue growth
and sweetens the mix
HELE likely to add value
and operational efficiency
HELE can accelerate growth
of acquired business
Bias toward high margin,
proprietary consumables
Global potential
• Leading market share in category, or
• Leading position in niche, uniquely
differentiated subcategory.
• Accretive to earnings (in one or two
years).
• Impact of synergies.
• Return hurdle rate exceeds cost of
capital.
• Enhances revenue growth.
• Accretive to gross margin.
• Accretive to Operating and EBITDA
margin.
• Accretive to ROIC
• Delivers complementary scale or
scalability across our shared
services to leverage and enhance
efficiencies across sourcing,
purchasing, distribution,
warehousing, logistics, marketing,
R&D and other fixed costs.
• Target business at inflection point,
requiring additional resources,
expertise and/or capital to accelerate
growth. Target offers clear white space
for growth in core HELE channels,
geographies or adjacent categories.
• High frequency, disposable
products.
• Razor and blade model/recurring
revenue stream.
• Participation in attractive categories.
• Participating in categories with universal
appeal or relevance.
• Evidence of geographic and cultural
portability.
• Relatively few entrenched competitors.
• Global supply chain/transportation, etc.
Select M&A Criteria
• Tax implications
• Consumer trends
• Economic outlook
• Acquisition currency
• Pro forma leverage
• New channel or geography expansion
• Cost structure and synergy potential
• Regulatory issues
• Category competitiveness
Other
considerations
1 2 3 4
5 6 7
8

Our Global Footprint
9
Operating Segment Regional Market Organization
(RMO)
Shared Service
EMEA RMO
Lausanne, Switzerland
AP RMO
Hong Kong
China Shared Services
Shenzhen & Macao
Health & Home
Marlborough, MA
Beauty
Danbury, CT
Housewares
New York, NY
Canada RMO
Toronto
Shared Service DC’s
Mississippi
Latin America RMO
Mexico City Beauty
El Paso, TX
Hydro Flask
Bend, OR
Corporate HQ
Bermuda
Shared Services
El Paso, TX
Corporate Headquarters
9
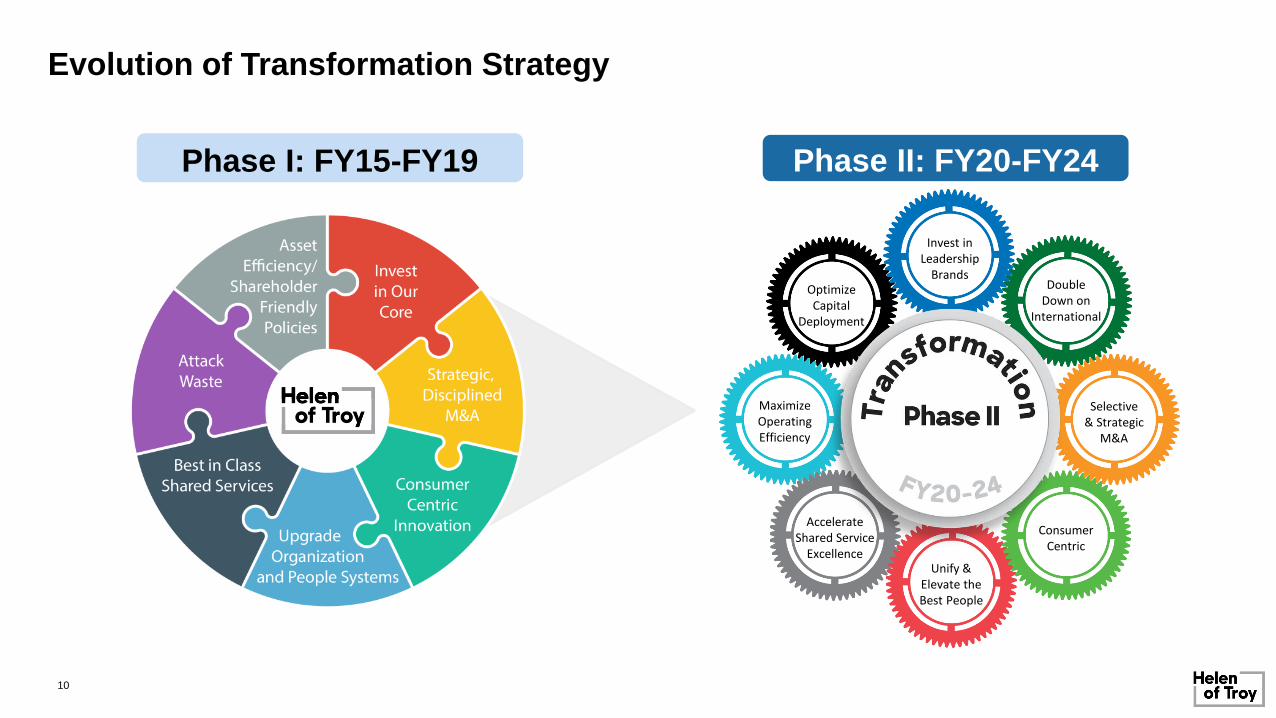
Phase II: FY20-FY24Phase I: FY15-FY19
10
Evolution of Transformation Strategy
Invest inLeadership
BrandsDouble
Down onInternational
Selective& Strategic
M&A
ConsumerCentric
Unify &Elevate theBest People
AccelerateShared Service
Excellence
MaximizeOperatingEfficiency
OptimizeCapital
Deployment

Key Elements of Phase I: FY15-FY19
Strategic Plan
Culture
More Efficient and
Collaborative
Operating Structure
Transformational
StrategyLeadership
Brands
++
11

#1 #1 #1 #1 #1 #1 #1
Higher Margin
Asset Efficient
Differentiated Market Leader
Growth Adjacencies
Consumer Ear
Thermometers
Faucet Mount
Purifiers
Pitcher
Purifiers
#2
Pharmacy
Humidifiers
Air Purifiers Premium
Kitchen
& Home
Gadgets
Outdoor
Thermal
Hydration
Stylist
Preferred
U.S.
Professional
Curling Iron
Phase I 11.1% Leadership Brand
Net Sales CAGR
FY19 +8.9% vs YAGO
~80% of total net sales
12
Strong Portfolio of Leadership Brands

Investments in Digital are Driving Online Sales
FY14 FY15 FY16 FY17 FY18
6% of
total
net sales
19%
of total
net sales
+28 %
YAGO
FY19
13
14
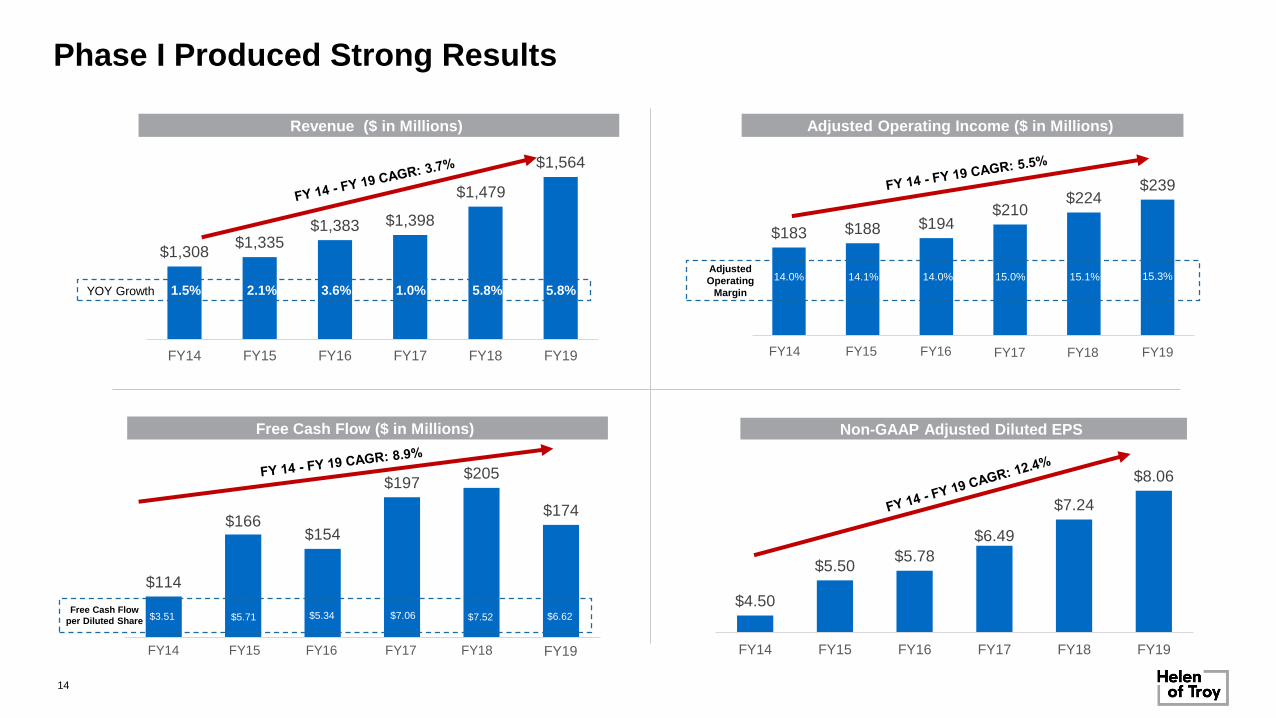
$1,308$1,335
$1,383 $1,398
$1,479
$1,564
FY14 FY15 FY16 FY17 FY18 FY19
Revenue ($ in Millions)
$4.50
$5.50$5.78
$6.49
$7.24
$8.06
FY14 FY15 FY16 FY17 FY18 FY19
Free Cash Flow ($ in Millions)
1.5% 2.1% 3.6% 1.0% 5.8%
Free Cash Flow
per Diluted Share
YOY Growth
Adjusted Operating Income ($ in Millions)
$183 $188 $194$210
$224$239
FY14 FY15 FY16 FY17 FY18 FY19
14.0% 14.1% 14.0% 15.0% 15.1%Adjusted
Operating
Margin
FY14 FY15 FY16 FY17 FY18
5.8%
FY19
15.3%
$114
$166$154
$197$205
$174
FY14 FY15 FY16 FY17 FY18 FY19FY14 FY15 FY16 FY17 FY18 FY19
$3.51 $5.71 $5.34 $7.06 $7.52 $6.62
Non-GAAP Adjusted Diluted EPS
Phase I Produced Strong Results

15
Phase I Adjusted Operating Margin and Growth Investment Progression
Drivers:
+ Leadership Brand Growth
+ New Product Development
+ Portfolio Enhancement
+ Project Refuel
+ Shared Service Efficiency
Investments:
- Growth investment CAGR of 11%
- Organizational investments
Headwinds:
- Unfavorable FY19 tariff impact of $4M
Margin Expansion Formula:
$194
$210
$224
$239
FY16 FY17 FY18 FY19
Adjusted OI Growth Investments % of Sales
3-Yr
CAGR
11%
14.0%
15.0%
15.3%
15.1%

Phase I Capital Deployment with Low Leverage and Risk
16
• Deployed a total of ~$1.2B of
capital without exceeding 2.6x
leverage
• Share repurchases of ~$750M
• Acquisition totaling ~$450M
• Ability to deploy over ~$1.3B of
capital in Phase II without
exceeding 3.0x leverage
• Low interest cost compared to
peers
• Higher leverage in FY16 due to pre-
borrowing at end of the year to fund
Hydro Flask acquisition at the
beginning of FY17
$474
$150
$285
$73
$218
1.9x
2.6x
2.1x
1.3x 1.3x
FY15 FY16 FY17 FY18 FY19
Capital Deployment vs Leverage Ratio
Share Repo $ Acquisition $ Leverage Ratio as of FYE

17
Phase I Generated Strong Return on Invested Capital
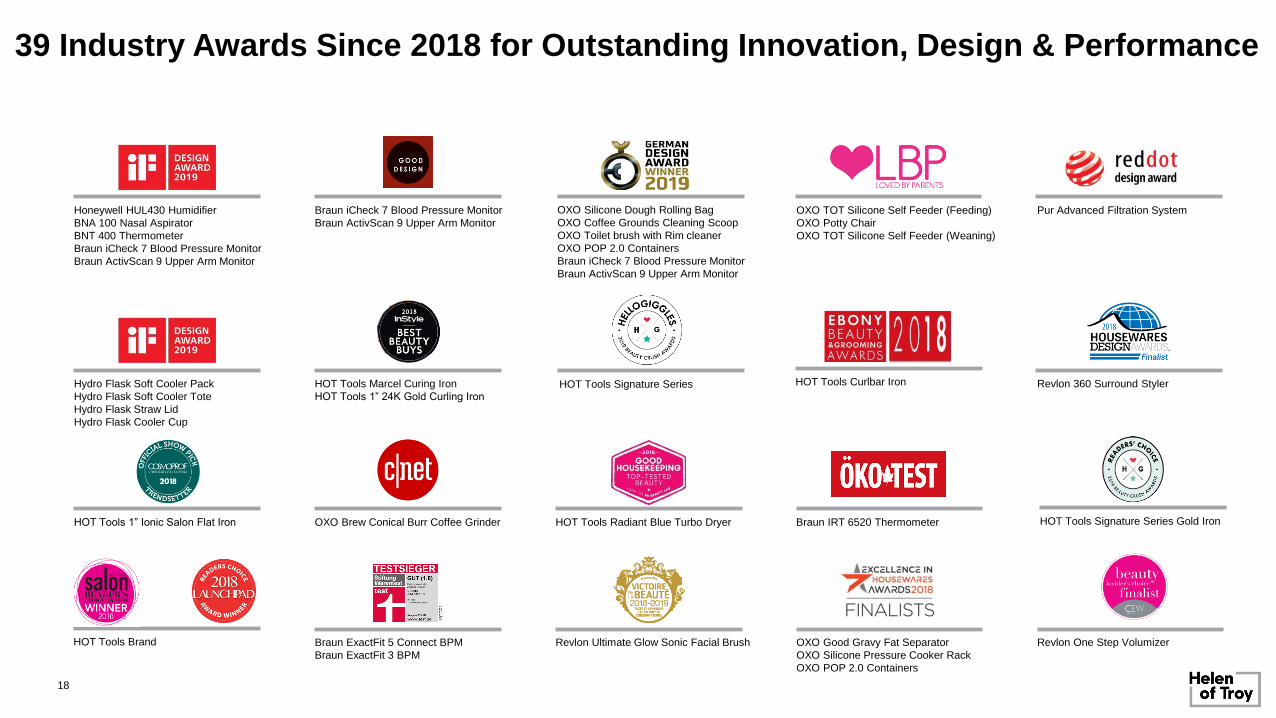
39 Industry Awards Since 2018 for Outstanding Innovation, Design & Performance
Honeywell HUL430 Humidifier
BNA 100 Nasal Aspirator
BNT 400 Thermometer
Braun iCheck 7 Blood Pressure Monitor
Braun ActivScan 9 Upper Arm Monitor
Braun iCheck 7 Blood Pressure Monitor
Braun ActivScan 9 Upper Arm Monitor
OXO TOT Silicone Self Feeder (Feeding)
OXO Potty Chair
OXO TOT Silicone Self Feeder (Weaning)
Pur Advanced Filtration System
HOT Tools Curlbar IronHydro Flask Soft Cooler Pack
Hydro Flask Soft Cooler Tote
Hydro Flask Straw Lid
Hydro Flask Cooler Cup
HOT Tools Marcel Curing Iron
HOT Tools 1” 24K Gold Curling Iron
Revlon 360 Surround Styler
OXO Silicone Dough Rolling Bag
OXO Coffee Grounds Cleaning Scoop
OXO Toilet brush with Rim cleaner
OXO POP 2.0 Containers
Braun iCheck 7 Blood Pressure Monitor
Braun ActivScan 9 Upper Arm Monitor
HOT Tools 1” Ionic Salon Flat Iron OXO Brew Conical Burr Coffee Grinder HOT Tools Radiant Blue Turbo Dryer
HOT Tools Brand Braun ExactFit 5 Connect BPM
Braun ExactFit 3 BPM
OXO Good Gravy Fat Separator
OXO Silicone Pressure Cooker Rack
OXO POP 2.0 Containers
Revlon One Step VolumizerRevlon Ultimate Glow Sonic Facial Brush
HOT Tools Signature Series Gold IronBraun IRT 6520 Thermometer
HOT Tools Signature Series
18
19
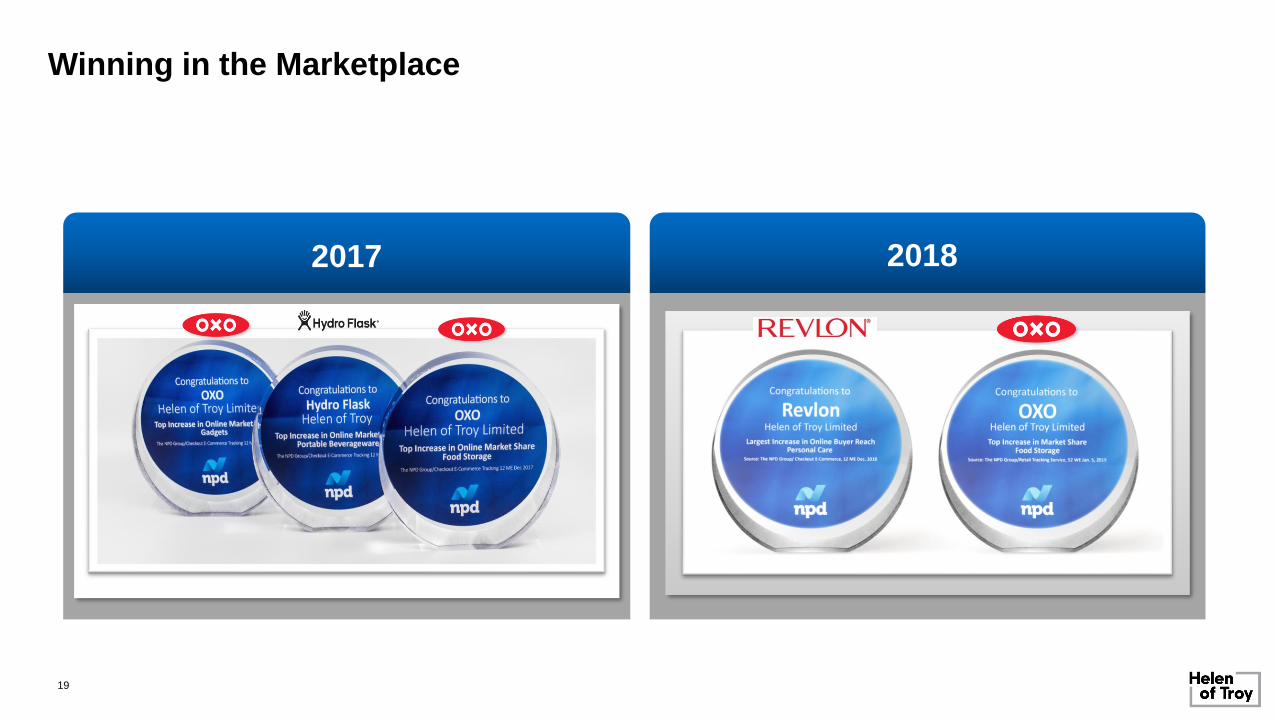
2018
2018
2017
Winning in the Marketplace
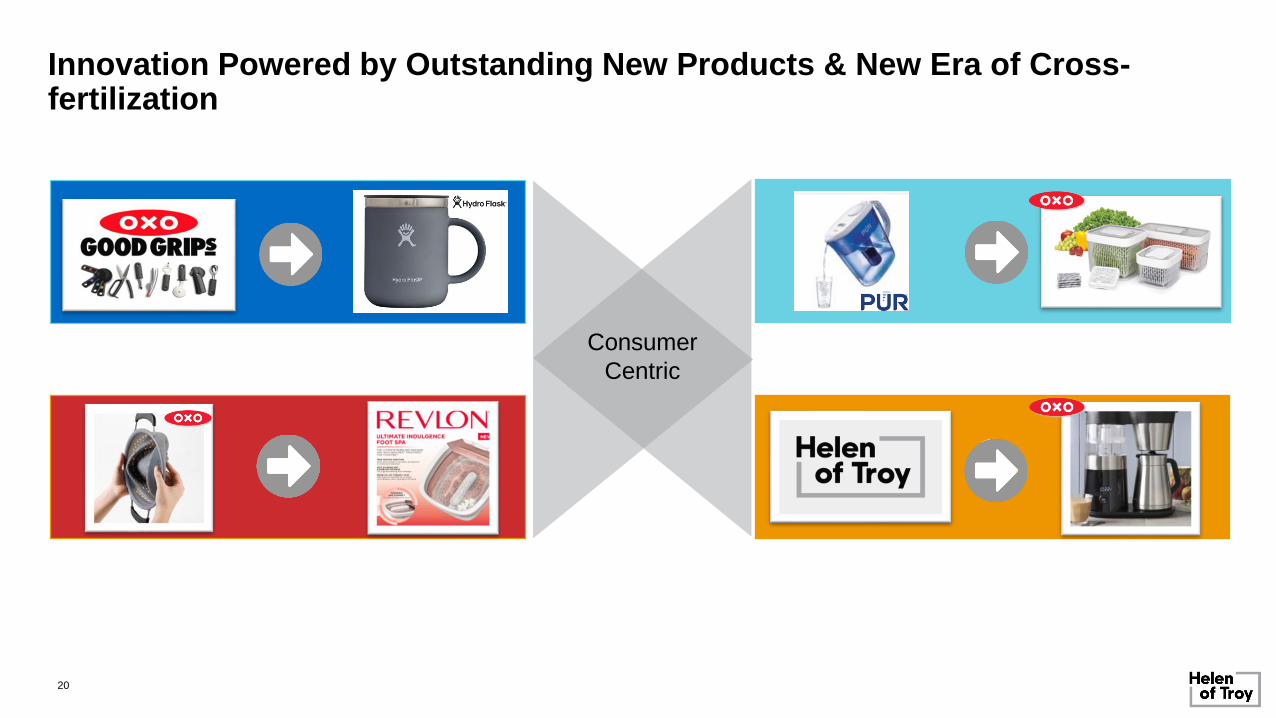
Innovation Powered by Outstanding New Products & New Era of Cross-fertilization
20
Consumer
Centric
21
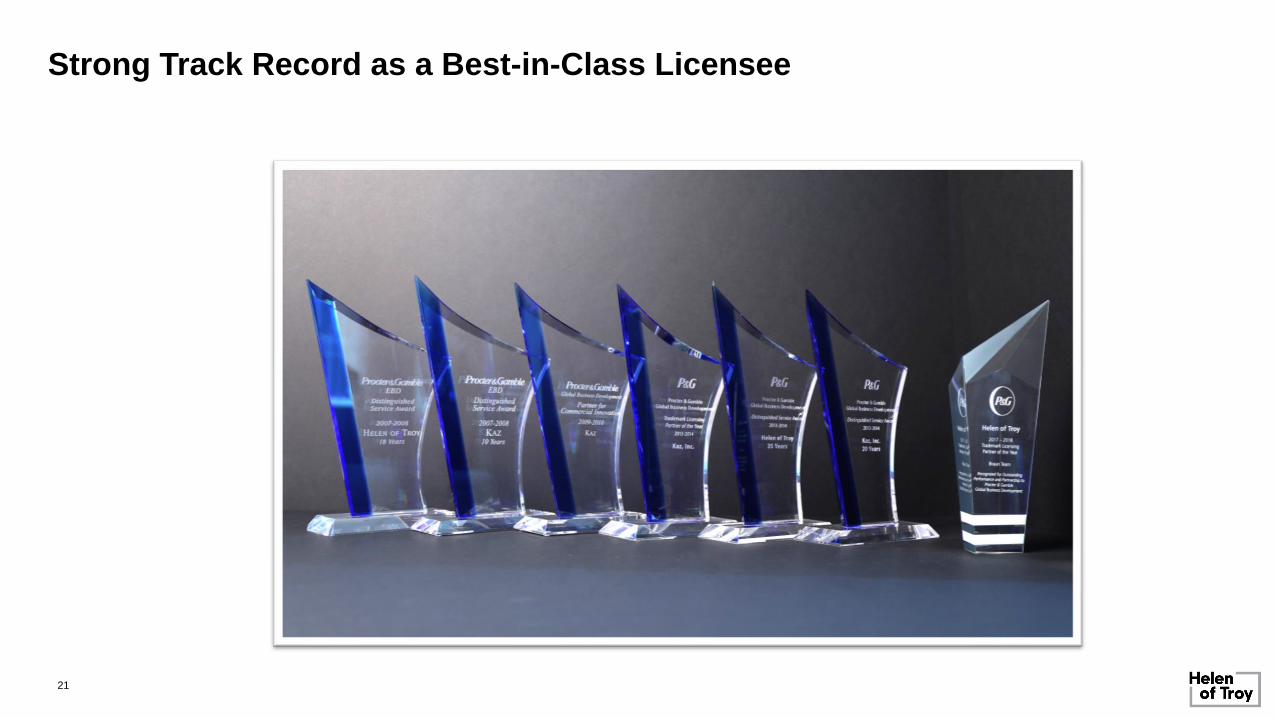
Strong Track Record as a Best-in-Class Licensee
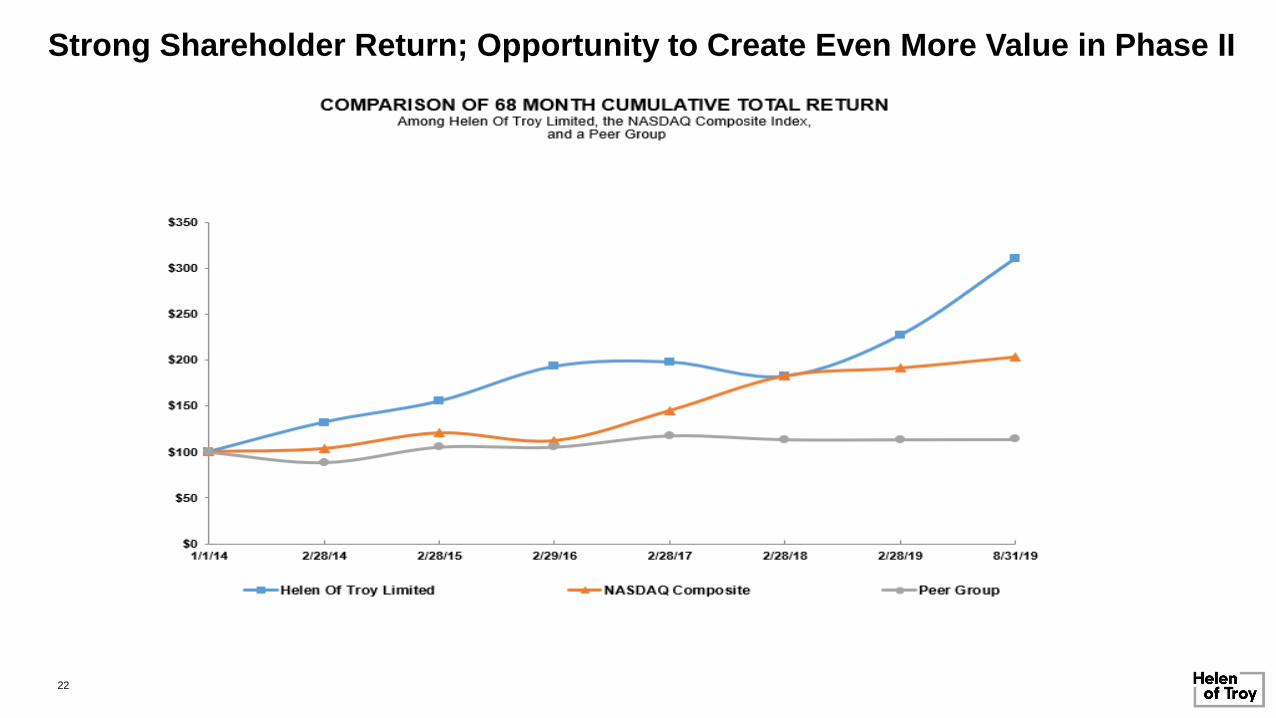
Strong Shareholder Return; Opportunity to Create Even More Value in Phase II
22

23
Phase II Transformation Began in FY20
Invest in
Leadership
BrandsDouble
Down on
International
Selective
& Strategic
M&A
Consumer
Centric
Unify &
Elevate the
Best People
Accelerate
Shared Service
Excellence
Maximize
Operating
Efficiency
Optimize
Capital
Deployment

Phase II is Designed to Deliver to All Key Stakeholders
ConsumersElevate lives every
day with high-quality
solutions from
trusted, compelling
brands
CustomersProvide Leadership
Brands that deliver
profitable growth
AssociatesElevate our culture and
management capability
to Attract, Retain, Unify
and Train the best
people for rewarding
long-term careers
ShareholdersStrive to deliver superior
long-term performance
24
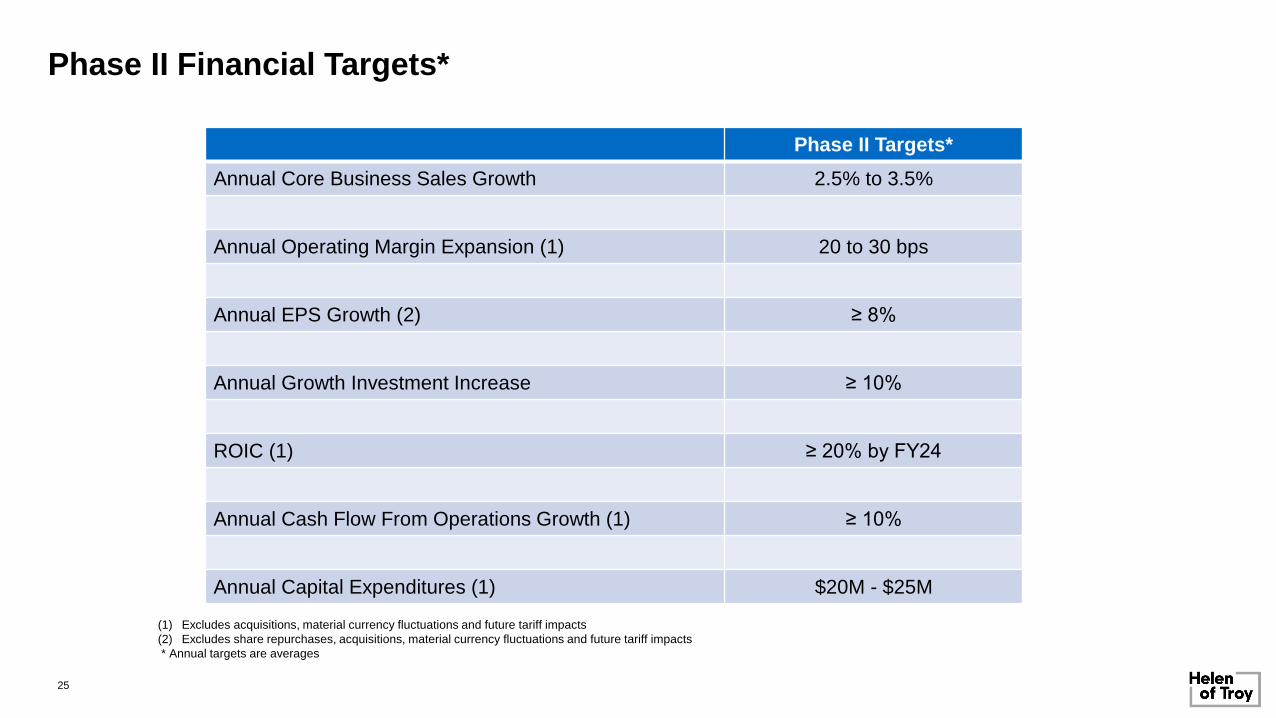
Phase II Targets*
Annual Core Business Sales Growth 2.5% to 3.5%
Annual Operating Margin Expansion (1) 20 to 30 bps
Annual EPS Growth (2) ≥ 8%
Annual Growth Investment Increase ≥ 10%
ROIC (1) ≥ 20% by FY24
Annual Cash Flow From Operations Growth (1) ≥ 10%
Annual Capital Expenditures (1) $20M - $25M
25
(1) Excludes acquisitions, material currency fluctuations and future tariff impacts
(2) Excludes share repurchases, acquisitions, material currency fluctuations and future tariff impacts
* Annual targets are averages
Phase II Financial Targets*

Culture is a Driver of Helen of Troy’s Phase II Plan
26
We are deeply
connected internally and
externally. Internally, we
understand each other
and are unified by a
common culture, shared
strategic plan, and
aligned goals.
Externally, our superior
understanding of
consumers, customers,
shareholders, partners
and competitors is a
source of competitive
advantage.
We treat each other as
each of us wants to be
treated—with integrity,
professionalism, and
transparency. At Helen
of Troy, what you see is
what you get. We listen
to each other and
always assume noble
intent. We are at our
strongest when we work
together, learn from
each other, and respect
what all parties bring to
the table.
I IR S EIn Touch Mutual Respect Ingenuity Shared Success Exceptional People
Our passion for
delighting consumers
keeps us ideating, and
inventing better ways to
elevate the lives of
people everywhere
every day. Our healthy
dissatisfaction with the
status quo drives
continuous improvement
in every corner of the
company.
Helen of Troy’s success
and that of our people
are linked. We soar
together. Our people
working in our Business
Units, RMOs and Shared
Services give their very
best individually and in
teams. Together, we
achieve what none of us
can do alone. We reward
winning results and
invest in the communities
where we live and work.
A great organization is
powered by people. Our
people feel and act like
passionate owners.
Their experience and
skills build our business
and the people around
them. Their passion for
excellence and winning
is contagious. We invest
in developing our
people and cultivating
rewarding careers.

Global Business SegmentsGlobal Shared Services
CEO
Julien Mininberg
27
Highly Experienced Global Leadership Team
Jack
Jancin
Corporate
Business
Development
Christophe
Coudray
President
Health
& Home
Larry
Witt
President
Housewares
Ronald
Anderskow
President
Beauty
Lisa
Kidd
Chief
People
Officer
Brian
Grass
Chief
Financial
Officer
Tessa
Judge
General
Counsel
Jay
Caron
Chief Supply
Chain Officer
Chief
Information
Officer
Harish
Ramani
Nicolas
Lanus
President
International

Most Recent Results
• Net sales +5.2%, including:
• Leadership Brands +3.8%
• Online channel +25%
• Core business +5.7%
Three-Months
Q2 FY 2020
Continued Sales
Momentum
Margin Expansion
Despite External
Challenges
• Adj. operating margin increased 0.8 percentage points
despite:
• Unfavorable impact from foreign currency fluctuations
on net sales and operating margin; and
• Increased tariffs
Increased Full
Year Outlook
• Now expect consolidated net sales revenue in the range of $1.610 to $1.640 billion, which implies growth of 2.9% to 4.8% vs.
prior expectation of 1.7% to 3.6%
• Now expect adjusted diluted EPS from continuing operations in the range of $8.50 to $8.75 vs. prior expectation of $8.40 to
$8.65
28
Six-Months
YTD FY 2020
• Net sales +5.6%, including:
• Leadership Brands +5.5%
• Online channel +26%
• Core business +6.2%
• Adj. operating margin increased 0.4 percentage points
despite:
• Unfavorable impact from foreign currency fluctuations
on net sales and operating margin
• Increased tariffs
Adjusted EPS
Growth
• Adj. diluted EPS from continuing operations increased
13.1% to $2.24• Adj. diluted EPS from continuing operations increased
11.7% to $4.30

Revised Fiscal 2020 Outlook and Key Assumptions
Revised FY20 Outlook
by Business Segment
Headwinds/
Tailwinds
Tailwinds
▪ New product and
category introductions
▪ Consumer-centric
investment in greatest
opportunities
Headwinds
▪ Tariff impact on COGS
▪ Variable softness at
certain brick and mortar
retailers
▪ Rising commodity &
logistics costs
▪ Unfavorable foreign
exchange rates
Assumptions Revised FY20 Outlook
▪ Consolidated net sales revenue of
$1.610 billon to $1.640 billion
▪ implies growth of 2.9% to 4.8%, on top of
growth of 5.8% in FY19
▪ Consolidated GAAP diluted EPS of $6.84
to $7.04
▪ Consolidated non-GAAP adjusted diluted
EPS of $8.50 to $8.75
▪ Implies YoY growth of 5.5% to 8.6% while
increasing growth investments
▪ Reported GAAP effective tax rate range
of 9.6% to 10.7%, and an adjusted
effective tax rate range of 9.0% to 10.0%
▪ Normal cold/flu season
▪ Incremental growth
investments of +13% to
+18% YOY
▪ September 2019 currency
rates hold for remainder of
year
▪ Cash flow hedges in place
for portion of FX exposure
▪ No additional share
repurchases, impairments
or acquisitions
Health & Home
Housewares13% to 15%
Beauty
LSD
Total2.9% to 4.8%
LSD = Low single digit
FY20 Sales
Growth
Outlook
29
LSD
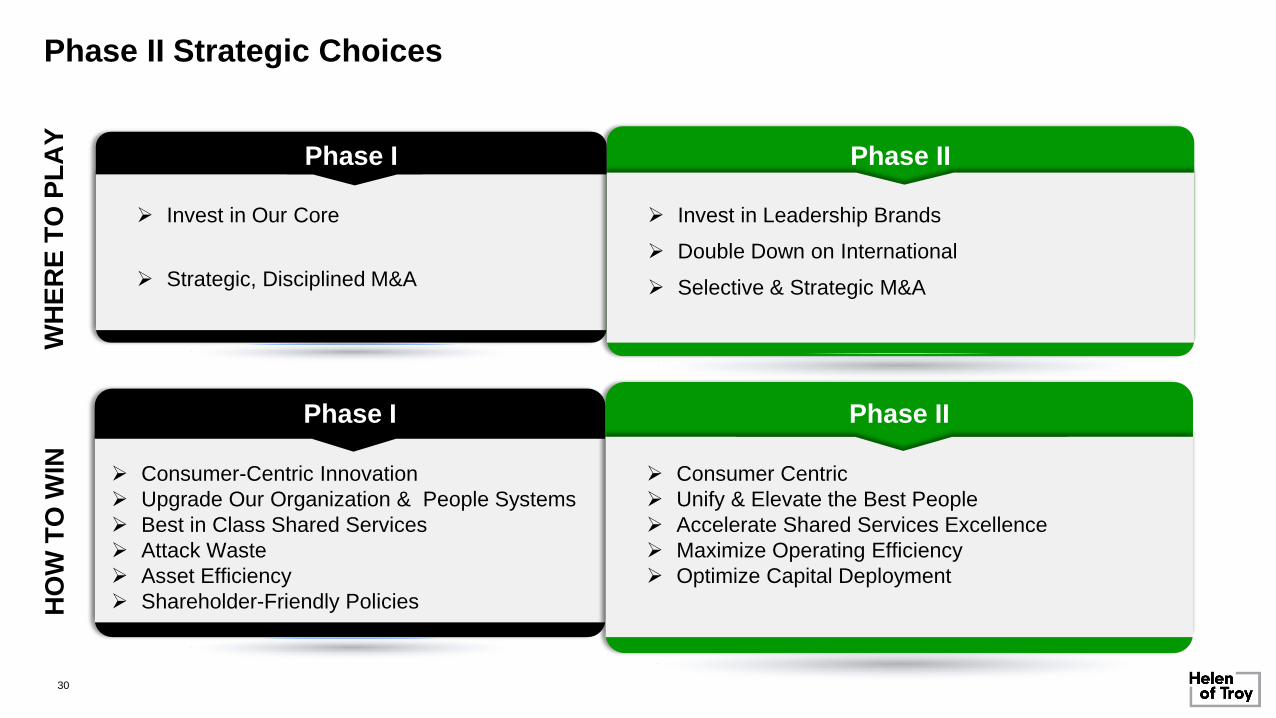
Phase II Strategic Choices
Phase IIPhase I
WH
ER
E T
O P
LA
Y
➢ Invest in Our Core
➢ Strategic, Disciplined M&A
➢ Invest in Leadership Brands
➢ Double Down on International
➢ Selective & Strategic M&A
Phase IIPhase I
HO
W T
O W
IN
➢ Consumer-Centric Innovation
➢ Upgrade Our Organization & People Systems
➢ Best in Class Shared Services
➢ Attack Waste
➢ Asset Efficiency
➢ Shareholder-Friendly Policies
➢ Consumer Centric
➢ Unify & Elevate the Best People
➢ Accelerate Shared Services Excellence
➢ Maximize Operating Efficiency
➢ Optimize Capital Deployment
30
31
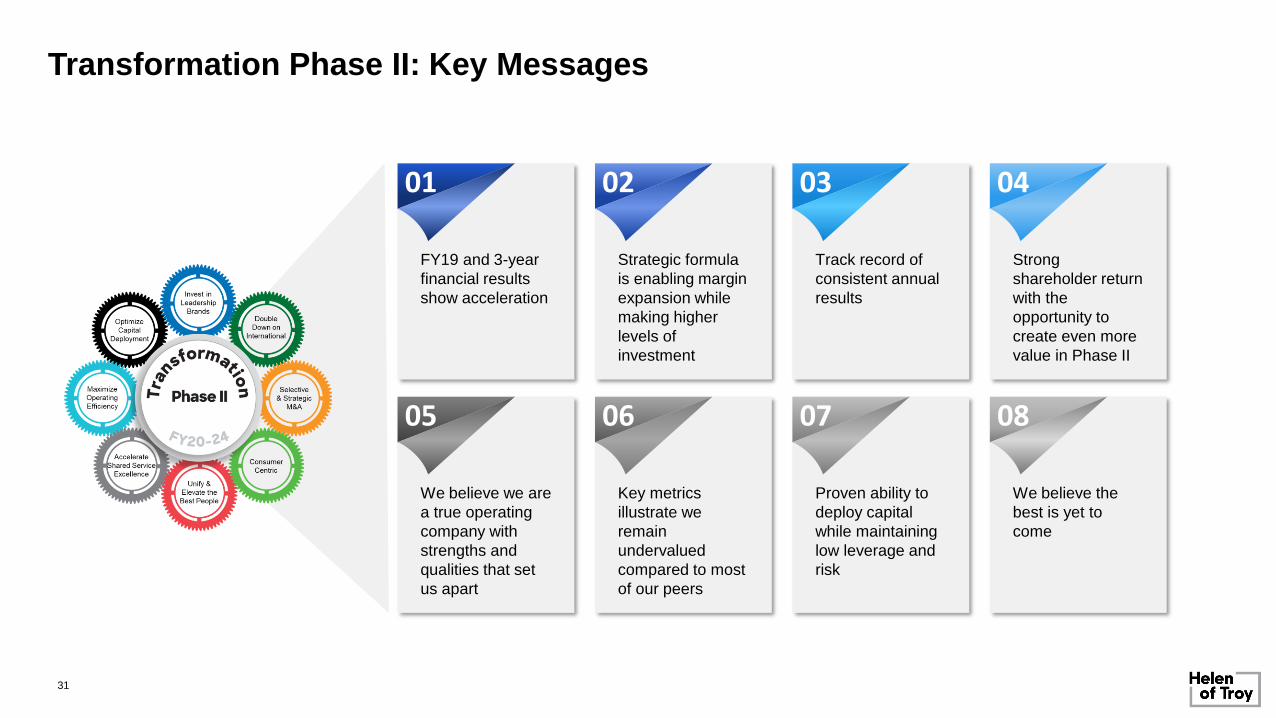
FY19 and 3-year
financial results
show acceleration
01
Strategic formula
is enabling margin
expansion while
making higher
levels of
investment
02
Track record of
consistent annual
results
03
Strong
shareholder return
with the
opportunity to
create even more
value in Phase II
04
We believe we are
a true operating
company with
strengths and
qualities that set
us apart
05
Key metrics
illustrate we
remain
undervalued
compared to most
of our peers
06
Proven ability to
deploy capital
while maintaining
low leverage and
risk
07
We believe the
best is yet to
come
08
Transformation Phase II: Key Messages

Value Creation Flywheel
32
Working Capital
ImprovementMargin Expansion
Organic Revenue
GrowthLow Capex
Accretive and Low Risk
Capital Deployment
Leadership Brand
Innovation and Investment
Debt and Tax
Efficiency

Business Segments
33

Health & HomeAward-winning, Global Branded, Consumer Device Business
Health Home
34
Delighting consumers with trusted solutions for healthy living and
peace of mind
35
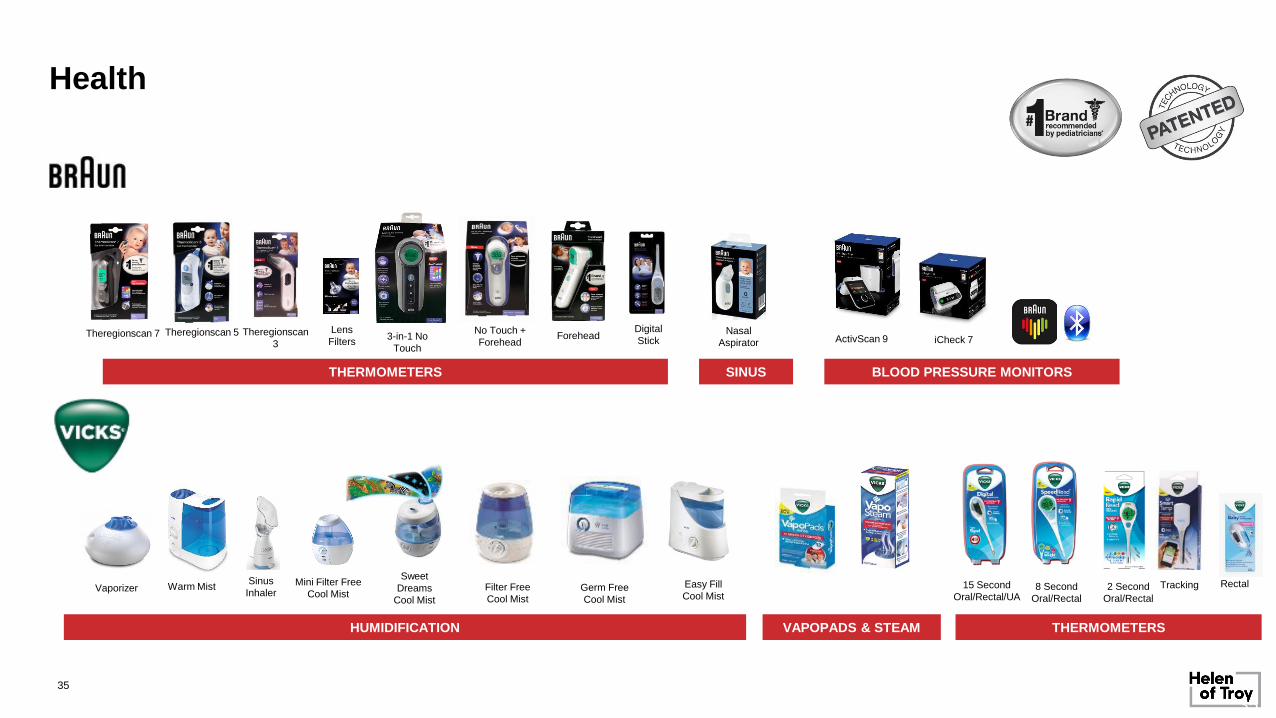
Health
HUMIDIFICATION
Mini Filter Free
Cool MistEasy Fill
Cool Mist
Sweet
Dreams
Cool Mist
Sinus
InhalerGerm Free
Cool Mist
Filter Free
Cool Mist
Warm MistVaporizer 15 Second
Oral/Rectal/UA8 Second
Oral/Rectal
2 Second
Oral/Rectal
Tracking Rectal
VAPOPADS & STEAM THERMOMETERS
No Touch +
Forehead
Digital
StickTheregionscan 7 ForeheadTheregionscan
3
Lens
Filters
THERMOMETERS BLOOD PRESSURE MONITORS
Nasal
Aspirator iCheck 7Theregionscan 5 3-in-1 No
Touch
SINUS
ActivScan 9
35

36
Home
AIR PURIFICATIONHUMIDIFIERS ACCESSORIES
Cool Mist
Tower Lg
Room
Cool Moisture
Med Room
Cool Moisture
Lg Room
Warm Mist
99.9% Germ-freeCool Mist
Ultrasonic
Cool
Moisture
Multi-room
Quiet Clean
TowerTrue HEPA True HEPA
Bluetooth
Connected
Ture HEPA
Professional
Series
Air Genius
Permanent
Compact
Air Genius
Permanent
Tower
Air Genius
Permanent
Bluetooth
Connected
Humidity
Monitors
Leadership
Brand
Classic Basic
CleanSensor™
Advanced
Mineral Clear ®
Ultimate
Bluetooth
PITCHERS/DISPENSERSFAUCET MOUNTS
7 Cup
Basic & Ultimate18 Cup
Classic & Ultimate
11 Cup
Classic & Ultimate
Leadership
Brand
True HEPA
Tower
36

Housewares
Source: Helen of Troy
* Proforma FY 2005 Sales – HOT acquired June 2004.
** Results for Fiscal 2018 and Fiscal 2019 have been recast for the adoption of ASU 2014-09, “Revenue from Contracts with Customers”.
2005 2006 2007 2008 2009 2010 2011 2012 2013 2014 2015 2016 2017 2018 2019
$98$128
$138$164 $175
$199$217
$237$259
$274$296 $310
$418
$459**
$524**
37
*
Make everyday better, every day.
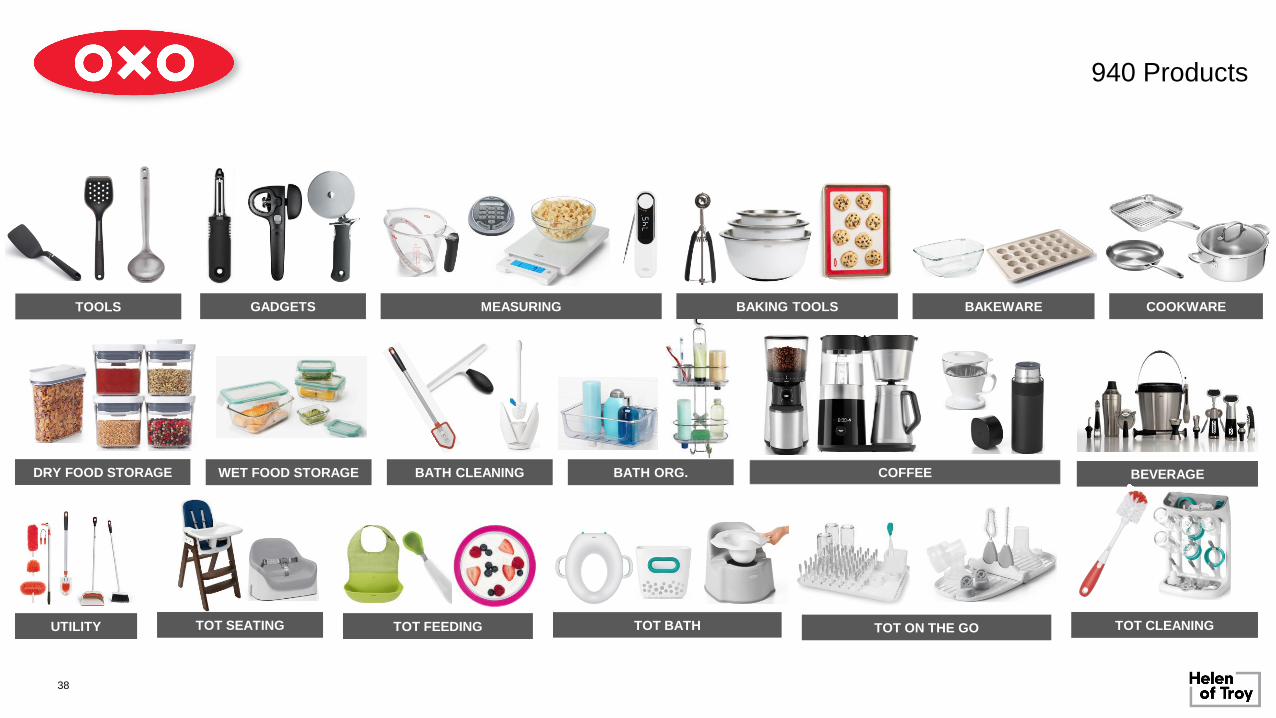
TOOLS GADGETS
TOT SEATING TOT FEEDING TOT BATH TOT ON THE GO TOT CLEANING
COFFEEDRY FOOD STORAGE WET FOOD STORAGE BATH CLEANING BATH ORG. BEVERAGE
BAKEWAREMEASURING BAKING TOOLS COOKWARE
UTILITY
940 Products
38

HYDRATION COFFEE DRINKWARE BEER WINE SPIRITS FOOD ACCESSORIES
SOFT COOLERS
Standard
Mouth
Wide
Mouth
Oasis Coffee
Flip Lid
Coffee
Mug
Cooler
Cup
Growler Wine
Bottle
RocksWine
Tumbler
Food
Flask
Tumbler Bottle
Sling
Bottle
Brush
Straw & Lid
Cleaning KitFlex
Boot
HYDRATION PACKS
Insulated
ToteSoft Cooler
Pack
Insulated Hydration Pack
NEW CATEGORIES
69 products
39

BeautyWe make everyone look and feel more beautiful
Dryers
Curing Irons
Specialty
PROFESSIONAL
Curling
Irons
BRUSHES COMBS & ACCESSORIES
RETAIL APPLIANCES PERSONAL CARE
Flat Irons
Flat IronsCuring Irons
Dryers
SpecialtyDryersFlat Irons
40

Appendix

Glossary of Terms
Adjusted Diluted Earnings per Share (EPS) – Non-GAAP Adjusted Income divided by
diluted shares outstanding
Adjusted Income – GAAP net income excluding Toys “R” Us bankruptcy charge, CEO
succession costs, acquisition-related expenses, tax reform, Venezuelan currency re-
measurement related charges, patent litigation charges, non-cash asset impairment charges,
restructuring charges, non-cash share-based compensation expense, and intangible asset
amortization expense (as applicable)
Adjusted Operating Income – GAAP operating income excluding TRU bankruptcy charge,
CEO succession costs, acquisition-related expenses, Venezuelan currency re-measurement
related charges, patent litigation charges, non-cash asset impairment charges, restructuring
charges, non-cash share-based compensation expense, and intangible asset amortization
expense(as applicable)
Adjusted Operating Margin – Non-GAAP Adjusted Operating Income divided by net sales
Capital Deployment – Combination of capital used to repurchase shares of common stock
and capital used in acquisitions
Compound Annual Growth Rate (CAGR) – Implied annual rate of return that would be
required for compounded growth from a beginning balance to an ending balance
Continuing Operations – All references to the Company’s continuing operations exclude the
Nutritional Supplements segment with the exception of stockholders’ equity for the periods
presented, which is presented on a consolidated basis and includes discontinued operations.
EBITDA – Earnings before interest, taxes, depreciation and amortization expense, as
reported
Free Cash Flow (FCF) – Trailing 12 months net cash provided by operating activities less
capital and intangible asset expenditures
Free Cash Flow per Share – Free cash flow divided by diluted share count as reported at
the end of the fiscal period
Growth Investment – Expenses included in SG&A consisting of selling (marketing and
advertising) expenses and new product development expenses
Leadership Brand Net Sales (LB) – Consists of revenue from the OXO, Honeywell, Braun,
PUR, Hydro Flask, Vicks, and Hot Tools brands
Leverage Ratio – Total current and long-term debt divided by EBITDA plus proforma effect
of acquisitions
Online Channel Net Sales – Net sales from pure-play online retailers and net sales made
direct to consumers through Company-owned websites
Peer Group – Derived from the Company’s compensation peer group for FY20, which
includes Church & Dwight Co. Inc., The Clorox Company, Coty Inc., Edgewell Personal Care
Company, Energizer Holdings, Inc., La-Z-Boy Incorporated, Libbey Inc., Lifetime Brands Inc.,
Newell Brands, Inc., Nu Skin Enterprises Inc., Prestige Consumer Healthcare, Inc., Revlon
Inc., Spectrum Brand Holdings Inc., Tempur Sealy International Inc., and Tupperware Brands
Corp.
Individual Peers - A subset of the Company’s compensation peer group was selected for
direct comparison on valuation metrics based on as-reported amounts in public filings. This
subset includes Church & Dwight Co. Inc., The Clorox Company, Edgewell Personal Care
Company, Prestige Consumer Healthcare, Inc., Lifetime Brands, Inc., and Newell Brands Inc.
42
Glossary of Terms
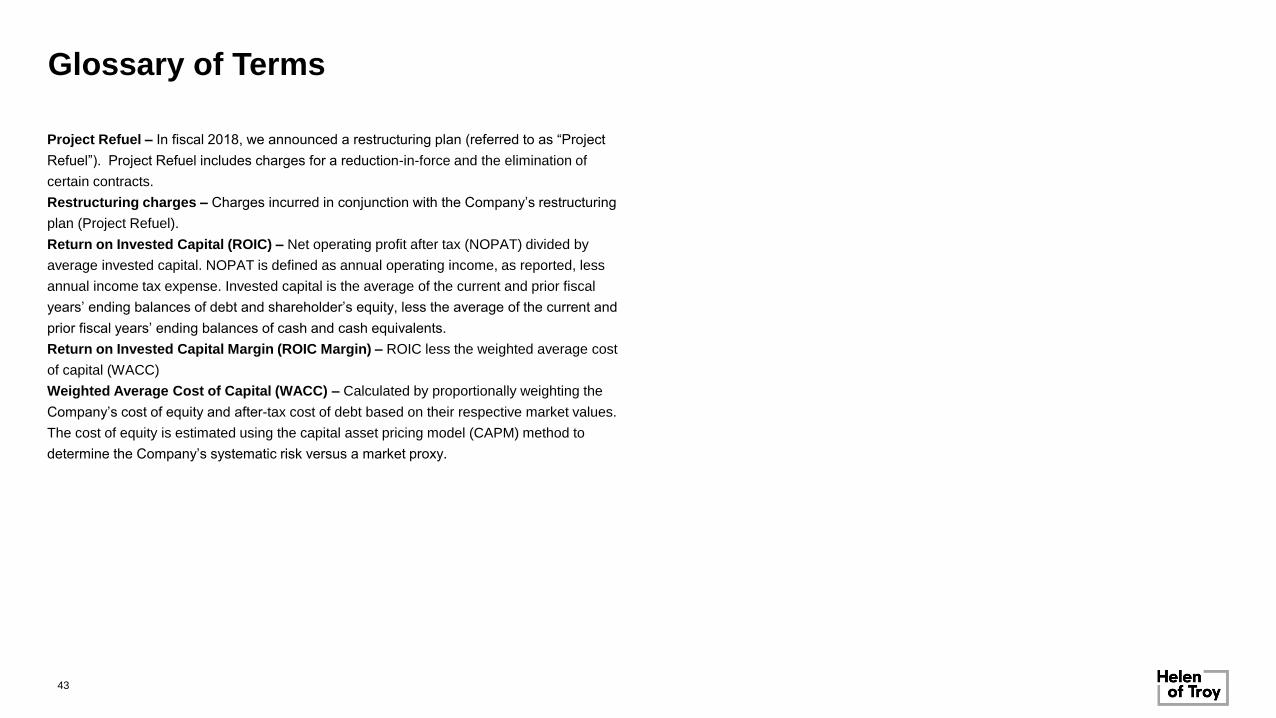
Project Refuel – In fiscal 2018, we announced a restructuring plan (referred to as “Project
Refuel”). Project Refuel includes charges for a reduction-in-force and the elimination of
certain contracts.
Restructuring charges – Charges incurred in conjunction with the Company’s restructuring
plan (Project Refuel).
Return on Invested Capital (ROIC) – Net operating profit after tax (NOPAT) divided by
average invested capital. NOPAT is defined as annual operating income, as reported, less
annual income tax expense. Invested capital is the average of the current and prior fiscal
years’ ending balances of debt and shareholder’s equity, less the average of the current and
prior fiscal years’ ending balances of cash and cash equivalents.
Return on Invested Capital Margin (ROIC Margin) – ROIC less the weighted average cost
of capital (WACC)
Weighted Average Cost of Capital (WACC) – Calculated by proportionally weighting the
Company’s cost of equity and after-tax cost of debt based on their respective market values.
The cost of equity is estimated using the capital asset pricing model (CAPM) method to
determine the Company’s systematic risk versus a market proxy.
43
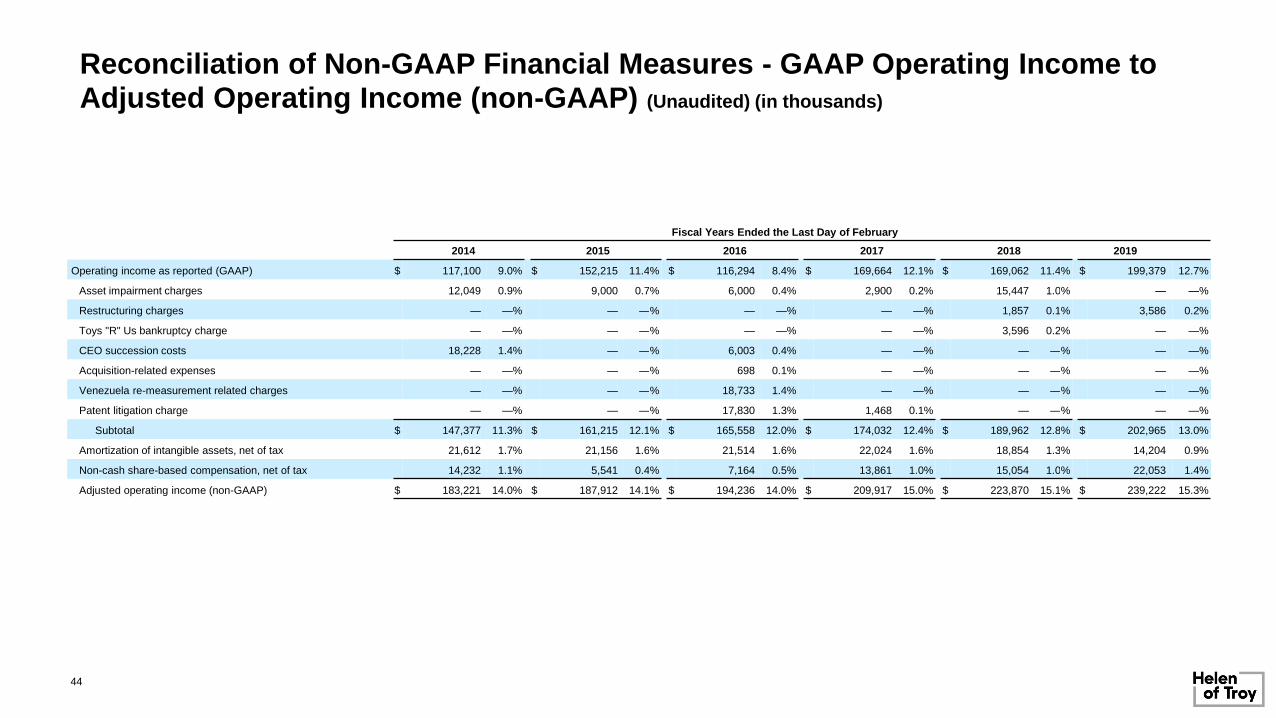
Reconciliation of Non-GAAP Financial Measures - GAAP Operating Income to Adjusted Operating Income (non-GAAP) (Unaudited) (in thousands)
44
Fiscal Years Ended the Last Day of February
2014 2015 2016 2017 2018 2019
Operating income as reported (GAAP) $ 117,100 9.0% $ 152,215 11.4% $ 116,294 8.4% $ 169,664 12.1% $ 169,062 11.4% $ 199,379 12.7%
Asset impairment charges 12,049 0.9% 9,000 0.7% 6,000 0.4% 2,900 0.2% 15,447 1.0% — —%
Restructuring charges — —% — —% — —% — —% 1,857 0.1% 3,586 0.2%
Toys "R" Us bankruptcy charge — —% — —% — —% — —% 3,596 0.2% — —%
CEO succession costs 18,228 1.4% — —% 6,003 0.4% — —% — —% — —%
Acquisition-related expenses — —% — —% 698 0.1% — —% — —% — —%
Venezuela re-measurement related charges — —% — —% 18,733 1.4% — —% — —% — —%
Patent litigation charge — —% — —% 17,830 1.3% 1,468 0.1% — —% — —%
Subtotal $ 147,377 11.3% $ 161,215 12.1% $ 165,558 12.0% $ 174,032 12.4% $ 189,962 12.8% $ 202,965 13.0%
Amortization of intangible assets, net of tax 21,612 1.7% 21,156 1.6% 21,514 1.6% 22,024 1.6% 18,854 1.3% 14,204 0.9%
Non-cash share-based compensation, net of tax 14,232 1.1% 5,541 0.4% 7,164 0.5% 13,861 1.0% 15,054 1.0% 22,053 1.4%
Adjusted operating income (non-GAAP) $ 183,221 14.0% $ 187,912 14.1% $ 194,236 14.0% $ 209,917 15.0% $ 223,870 15.1% $ 239,222 15.3%
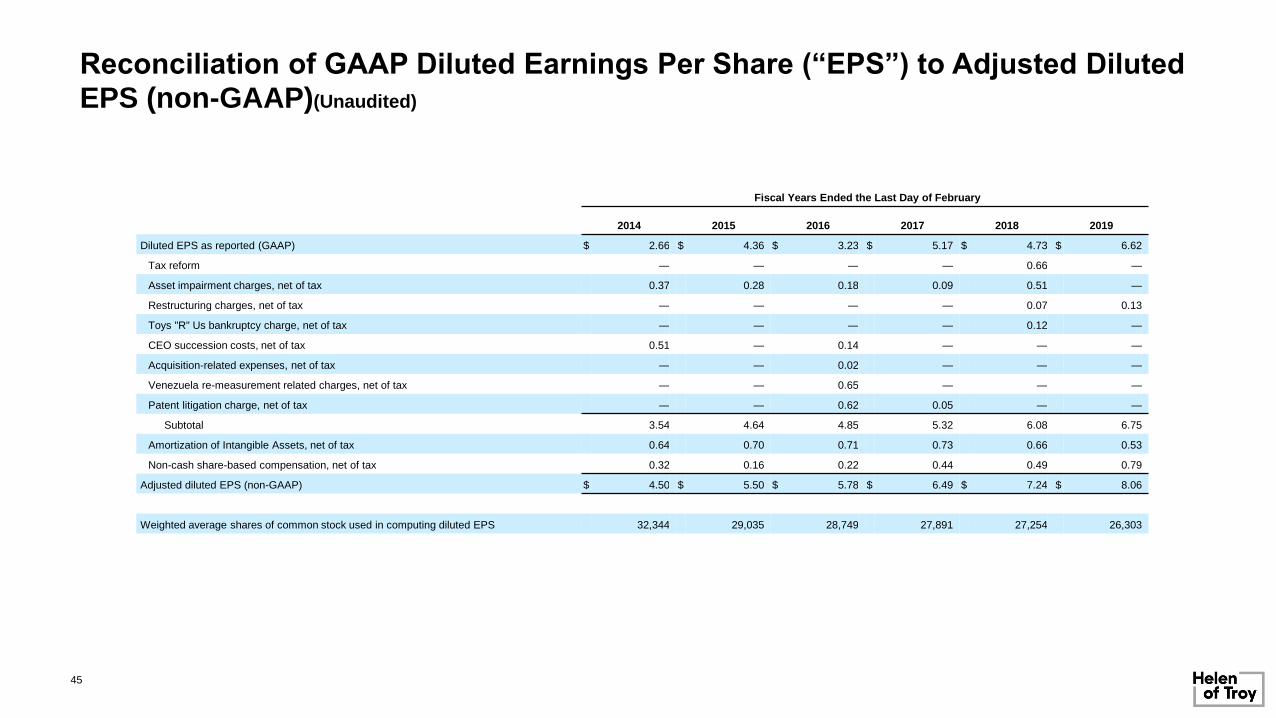
Reconciliation of GAAP Diluted Earnings Per Share (“EPS”) to Adjusted Diluted EPS (non-GAAP)(Unaudited)
45
Fiscal Years Ended the Last Day of February
2014 2015 2016 2017 2018 2019
Diluted EPS as reported (GAAP) $ 2.66 $ 4.36 $ 3.23 $ 5.17 $ 4.73 $ 6.62
Tax reform — — — — 0.66 —
Asset impairment charges, net of tax 0.37 0.28 0.18 0.09 0.51 —
Restructuring charges, net of tax — — — — 0.07 0.13
Toys "R" Us bankruptcy charge, net of tax — — — — 0.12 —
CEO succession costs, net of tax 0.51 — 0.14 — — —
Acquisition-related expenses, net of tax — — 0.02 — — —
Venezuela re-measurement related charges, net of tax — — 0.65 — — —
Patent litigation charge, net of tax — — 0.62 0.05 — —
Subtotal 3.54 4.64 4.85 5.32 6.08 6.75
Amortization of Intangible Assets, net of tax 0.64 0.70 0.71 0.73 0.66 0.53
Non-cash share-based compensation, net of tax 0.32 0.16 0.22 0.44 0.49 0.79
Adjusted diluted EPS (non-GAAP) $ 4.50 $ 5.50 $ 5.78 $ 6.49 $ 7.24 $ 8.06
Weighted average shares of common stock used in computing diluted EPS 32,344 29,035 28,749 27,891 27,254 26,303
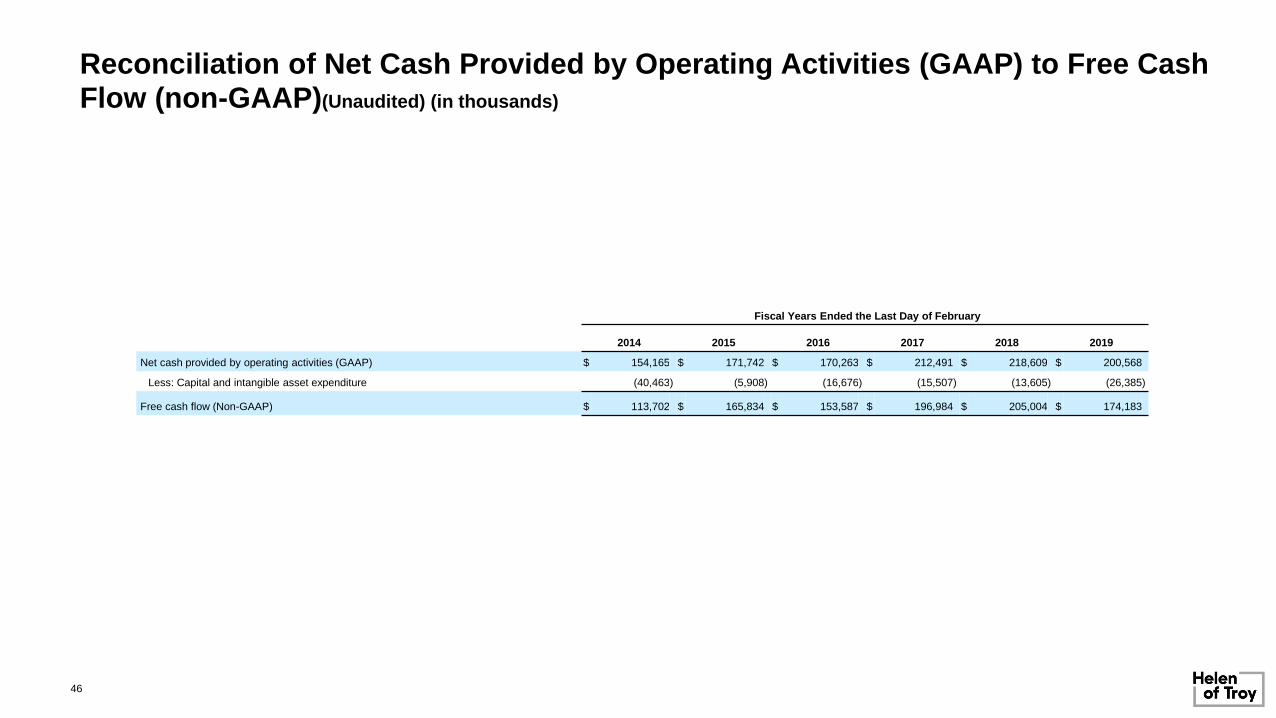
Reconciliation of Net Cash Provided by Operating Activities (GAAP) to Free Cash Flow (non-GAAP)(Unaudited) (in thousands)
46
Fiscal Years Ended the Last Day of February
2014 2015 2016 2017 2018 2019
Net cash provided by operating activities (GAAP) $ 154,165 $ 171,742 $ 170,263 $ 212,491 $ 218,609 $ 200,568
Less: Capital and intangible asset expenditure (40,463) (5,908) (16,676) (15,507) (13,605) (26,385)
Free cash flow (Non-GAAP) $ 113,702 $ 165,834 $ 153,587 $ 196,984 $ 205,004 $ 174,183

Condensed Consolidated Statements of Income and Reconciliation of Non-GAAP Financial Measures – Adjusted Operating Income, Adjusted Income from Continuing Operations and Adjusted Diluted Earnings Per Share (“EPS”) from Continuing Operations (Unaudited) (in thousands, except per share data)
47
(1) Amortization of intangible assets(2) Non-cash share-based compensation.
Three Months Ended August 31, 2019
As Reported (GAAP) Adjustments
Adjusted (Non-GAAP)
Sales revenue, net $ 413,995 100.0% $ — $ 413,995 100.0%
Cost of goods sold 235,844 57.0% — 235,844 57.0%
Gross profit 178,151 43.0% — 178,151 43.0%
SG&A 123,201 29.8% (4,463) (1) 112,357 27.1%
(6,381) (2)
Restructuring charges 430 0.1% (430) — —%
Operating income 54,520 13.2% 11,274 65,794 15.9%
Nonoperating income, net 89 —% — 89 —%
Interest expense (3,216) (0.8)% — (3,216) (0.8)%
Income before income tax 51,393 12.4% 11,274 62,667 15.1%
Income tax expense 5,298 1.3% 829 6,127 1.5%
Income from continuing operations 46,095 11.1% 10,445 56,540 13.7%
Diluted EPS from continuing operations $ 1.83 $ 0.41 $ 2.24
Weighted average shares of common stock used in computing diluted EPS 25,245 25,245

Condensed Consolidated Statements of Income and Reconciliation of Non-GAAP Financial Measures – Adjusted Operating Income, Adjusted Income from Continuing Operations and Adjusted Diluted Earnings Per Share (“EPS”) from Continuing Operations (Unaudited) (in thousands, except per share data)
48
(1) Amortization of intangible assets. (2) Non-cash share-based compensation.
Three Months Ended August 31, 2018
As Reported (GAAP) Adjustments
Adjusted (Non-GAAP)
Sales revenue, net $ 393,548 100.0% $ — $ 393,548 100.0%
Cost of goods sold 238,375 60.6% — 238,375 60.6%
Gross profit 155,173 39.4% — 155,173 39.4%
SG&A 103,654 26.3% (3,401)(1)
95,564 24.3%
(4,689) (2)
Restructuring charges 859 0.2% (859) — —%
Operating income 50,660 12.9% 8,949 59,609 15.1%
Nonoperating income, net 85—%
— 85 —%
Interest expense (2,755) (0.7)% — (2,755) (0.7)%
Income before income tax 47,990 12.2% 8,949 56,939 14.5%
Income tax expense 3,973 1.0% 434 4,407 1.1%
Income from continuing operations 44,017 11.2% 8,515 52,532 13.3%
Diluted EPS from continuing operations $ 1.66 $ 0.32 $ 1.98
Weighted average shares of common stock used in computing diluted EPS 26,557 26,557
Condensed Consolidated Statements of Income and Reconciliation of Non-GAAP Financial Measures – Adjusted Operating Income, Adjusted Income from Continuing Operations and Adjusted Diluted Earnings Per Share (“EPS”) from Continuing Operations (Unaudited) (in thousands, except per share data)
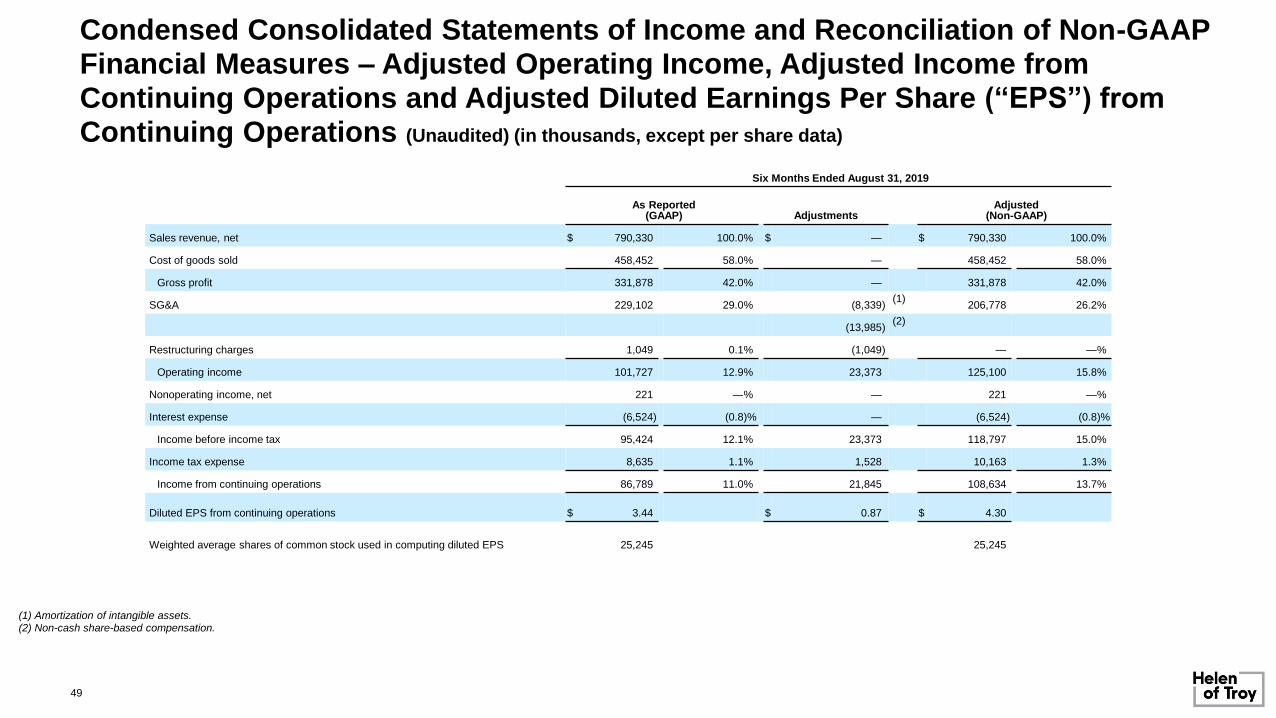
49
(1) Amortization of intangible assets. (2) Non-cash share-based compensation.
Six Months Ended August 31, 2019
As Reported (GAAP) Adjustments
Adjusted (Non-GAAP)
Sales revenue, net $ 790,330 100.0% $ — $ 790,330 100.0%
Cost of goods sold 458,452 58.0% — 458,452 58.0%
Gross profit 331,878 42.0% — 331,878 42.0%
SG&A 229,102 29.0% (8,339)(1)
206,778 26.2%
(13,985)(2)
Restructuring charges 1,049 0.1% (1,049) — —%
Operating income 101,727 12.9% 23,373 125,100 15.8%
Nonoperating income, net 221 —% — 221 —%
Interest expense (6,524) (0.8)% — (6,524) (0.8)%
Income before income tax 95,424 12.1% 23,373 118,797 15.0%
Income tax expense 8,635 1.1% 1,528 10,163 1.3%
Income from continuing operations 86,789 11.0% 21,845 108,634 13.7%
Diluted EPS from continuing operations $ 3.44 $ 0.87 $ 4.30
Weighted average shares of common stock used in computing diluted EPS 25,245 25,245

Condensed Consolidated Statements of Income and Reconciliation of Non-GAAP Financial Measures – Adjusted Operating Income, Adjusted Income from Continuing Operations and Adjusted Diluted Earnings Per Share (“EPS”) from Continuing Operations (Unaudited) (in thousands, except per share data)
50
(1) Amortization of intangible assets. (2) Non-cash share-based compensation.
Six Months Ended August 31, 2018
As Reported (GAAP) Adjustments
Adjusted (Non-GAAP)
Sales revenue, net $ 748,227 100.0% $ — $ 748,227 100.0%
Cost of goods sold 446,496 59.7% — 446,496 59.7%
Gross profit 301,731 40.3% — 301,731 40.3%
SG&A 205,160 27.4% (7,522)(1)
186,625 24.9%
(11,013)(2)
Restructuring charges 2,584 0.3% (2,584) — —%
Operating income 93,987 12.6% 21,119 115,106 15.4%
Nonoperating income, net 160 —% — 160 —%
Interest expense (5,442) (0.7)% — (5,442) (0.7)%
Income before income tax 88,705 11.9% 21,119 109,824 14.7%
Income tax expense 6,515 0.9% 979 7,494 1.0%
Income from continuing operations 82,190 11.0% 20,140 102,330 13.7%
Diluted EPS from continuing operations $ 3.09 $ 0.76 $ 3.85
Weighted average shares of common stock used in computing diluted EPS 26,612 26,612
Consolidated and Segment Net Sales, Operating Margin and Adjusted Operating Margin (non-GAAP) (Unaudited) (in thousands)
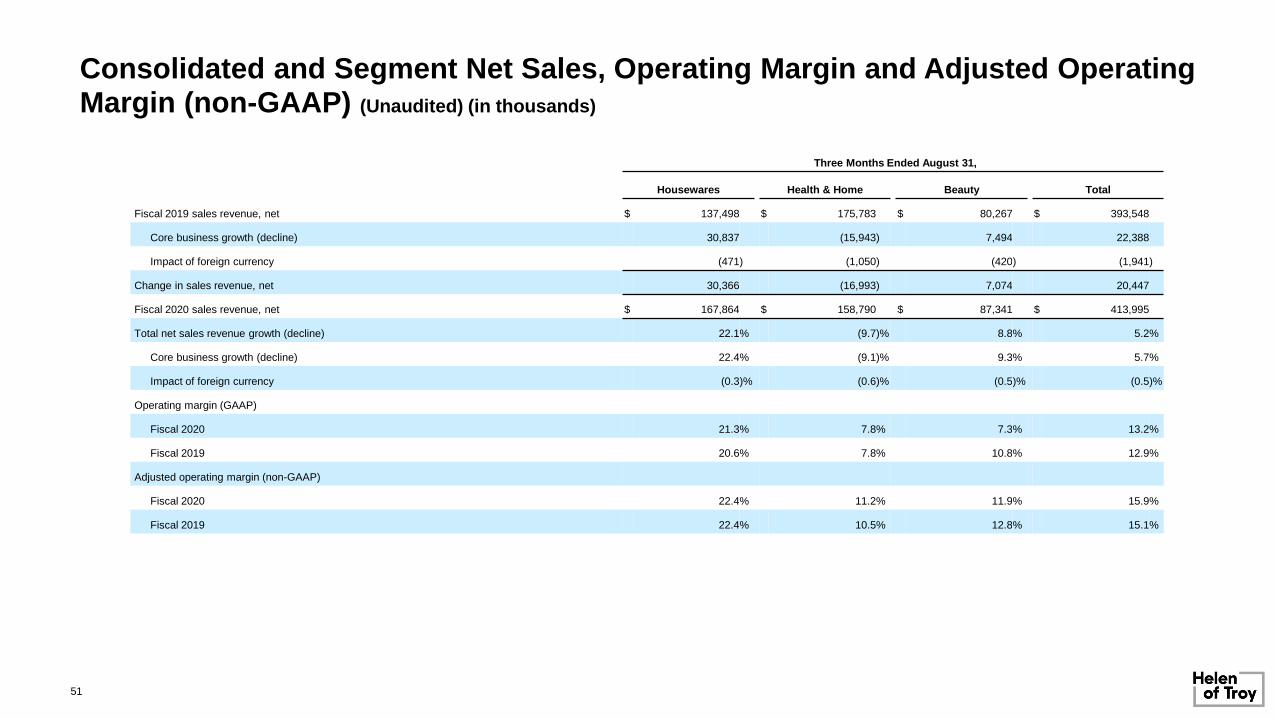
51
Three Months Ended August 31,
Housewares Health & Home Beauty Total
Fiscal 2019 sales revenue, net $ 137,498 $ 175,783 $ 80,267 $ 393,548
Core business growth (decline) 30,837 (15,943) 7,494 22,388
Impact of foreign currency (471) (1,050) (420) (1,941)
Change in sales revenue, net 30,366 (16,993) 7,074 20,447
Fiscal 2020 sales revenue, net $ 167,864 $ 158,790 $ 87,341 $ 413,995
Total net sales revenue growth (decline) 22.1% (9.7)% 8.8% 5.2%
Core business growth (decline) 22.4% (9.1)% 9.3% 5.7%
Impact of foreign currency (0.3)% (0.6)% (0.5)% (0.5)%
Operating margin (GAAP)
Fiscal 2020 21.3% 7.8% 7.3% 13.2%
Fiscal 2019 20.6% 7.8% 10.8% 12.9%
Adjusted operating margin (non-GAAP)
Fiscal 2020 22.4% 11.2% 11.9% 15.9%
Fiscal 2019 22.4% 10.5% 12.8% 15.1%
Consolidated and Segment Net Sales, Operating Margin and Adjusted Operating Margin (non-GAAP) (Unaudited) (in thousands)
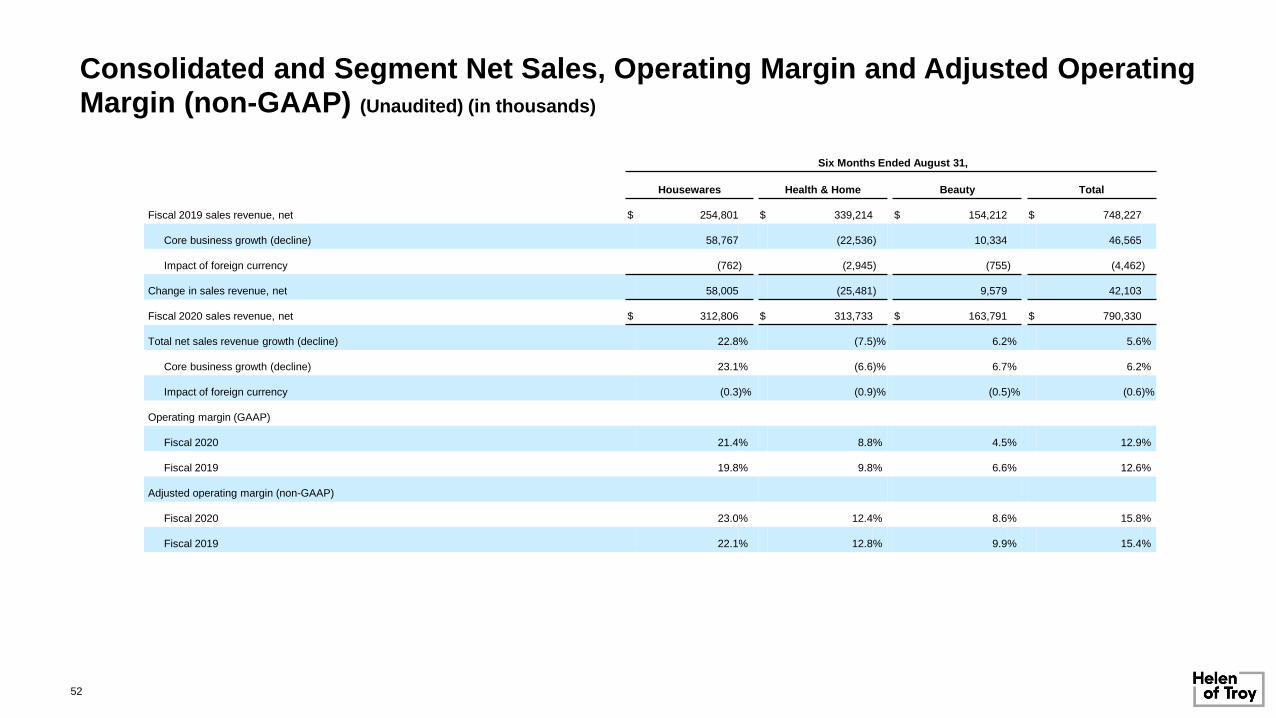
52
Six Months Ended August 31,
Housewares Health & Home Beauty Total
Fiscal 2019 sales revenue, net $ 254,801 $ 339,214 $ 154,212 $ 748,227
Core business growth (decline) 58,767 (22,536) 10,334 46,565
Impact of foreign currency (762) (2,945) (755) (4,462)
Change in sales revenue, net 58,005 (25,481) 9,579 42,103
Fiscal 2020 sales revenue, net $ 312,806 $ 313,733 $ 163,791 $ 790,330
Total net sales revenue growth (decline) 22.8% (7.5)% 6.2% 5.6%
Core business growth (decline) 23.1% (6.6)% 6.7% 6.2%
Impact of foreign currency (0.3)% (0.9)% (0.5)% (0.6)%
Operating margin (GAAP)
Fiscal 2020 21.4% 8.8% 4.5% 12.9%
Fiscal 2019 19.8% 9.8% 6.6% 12.6%
Adjusted operating margin (non-GAAP)
Fiscal 2020 23.0% 12.4% 8.6% 15.8%
Fiscal 2019 22.1% 12.8% 9.9% 15.4%

Leadership Brand Net Sales Revenue (Unaudited)(in thousands)
53
Three Months Ended August 31, Six Months Ended August 31,
2019 2018 2019 2018
Leadership Brand sales revenue, net $ 331,183 $ 319,045 $ 632,742 $ 599,804
All other sales revenue, net 82,812 74,503 157,588 148,423
Total sales revenue, net $ 413,995 $ 393,548 $ 790,330 $ 748,227
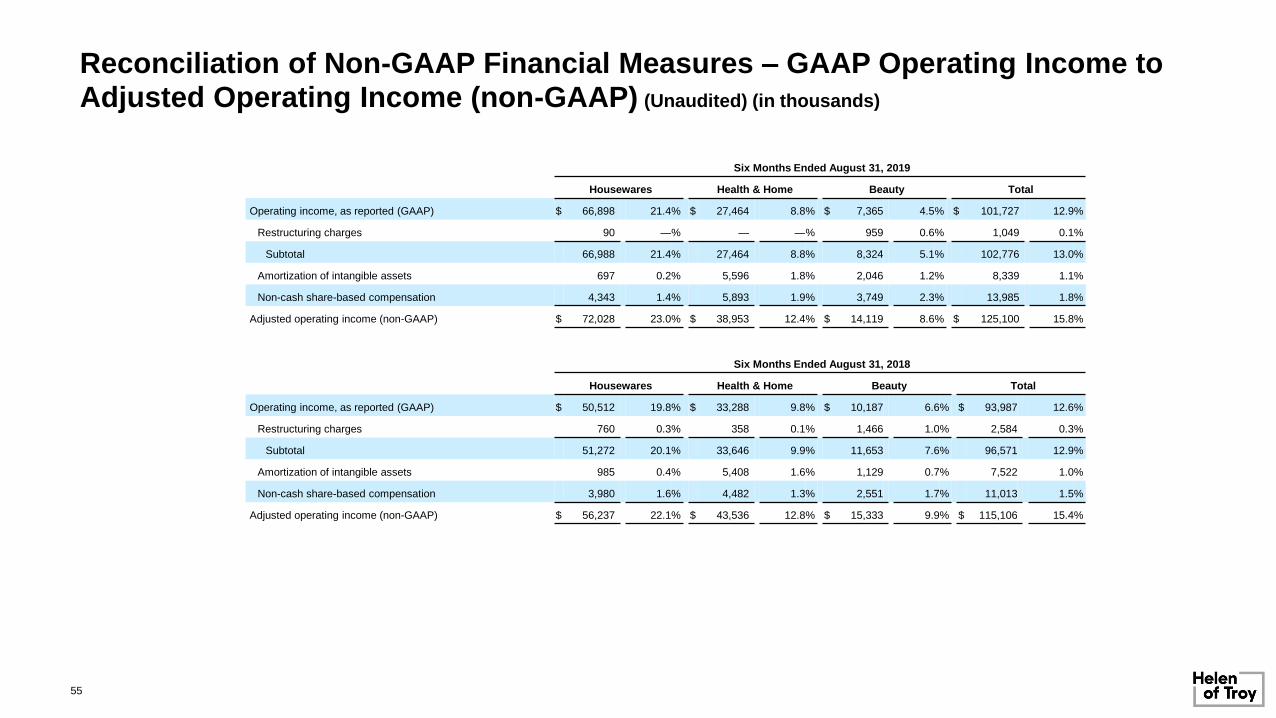
Reconciliation of Non-GAAP Financial Measures – GAAP Operating Income to Adjusted Operating Income (non-GAAP) (Unaudited) (in thousands)
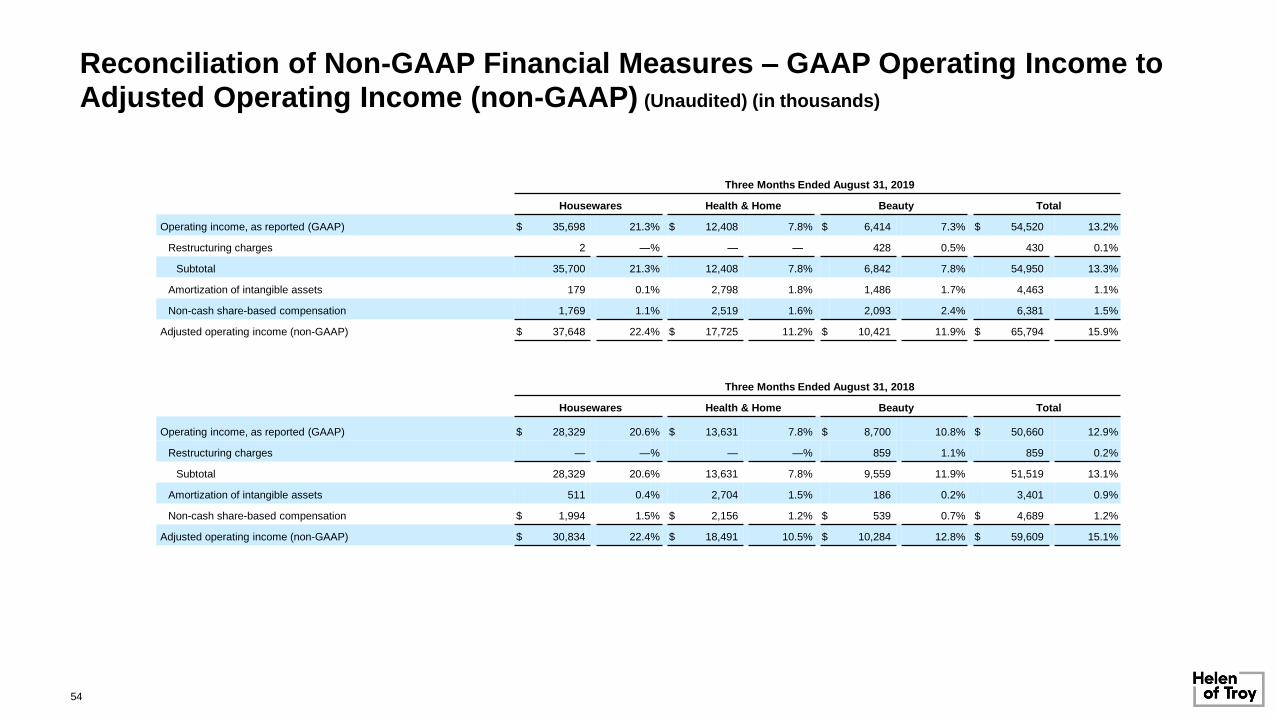
54
Three Months Ended August 31, 2019
Housewares Health & Home Beauty Total
Operating income, as reported (GAAP) $ 35,698 21.3% $ 12,408 7.8% $ 6,414 7.3% $ 54,520 13.2%
Restructuring charges 2 —% — — 428 0.5% 430 0.1%
Subtotal 35,700 21.3% 12,408 7.8% 6,842 7.8% 54,950 13.3%
Amortization of intangible assets 179 0.1% 2,798 1.8% 1,486 1.7% 4,463 1.1%
Non-cash share-based compensation 1,769 1.1% 2,519 1.6% 2,093 2.4% 6,381 1.5%
Adjusted operating income (non-GAAP) $ 37,648 22.4% $ 17,725 11.2% $ 10,421 11.9% $ 65,794 15.9%
Three Months Ended August 31, 2018
Housewares Health & Home Beauty Total
Operating income, as reported (GAAP) $ 28,329 20.6% $ 13,631 7.8% $ 8,700 10.8% $ 50,660 12.9%
Restructuring charges — —% — —% 859 1.1% 859 0.2%
Subtotal 28,329 20.6% 13,631 7.8% 9,559 11.9% 51,519 13.1%
Amortization of intangible assets 511 0.4% 2,704 1.5% 186 0.2% 3,401 0.9%
Non-cash share-based compensation $ 1,994 1.5% $ 2,156 1.2% $ 539 0.7% $ 4,689 1.2%
Adjusted operating income (non-GAAP) $ 30,834 22.4% $ 18,491 10.5% $ 10,284 12.8% $ 59,609 15.1%
Reconciliation of Non-GAAP Financial Measures – GAAP Operating Income to Adjusted Operating Income (non-GAAP) (Unaudited) (in thousands)
55
Six Months Ended August 31, 2019
Housewares Health & Home Beauty Total
Operating income, as reported (GAAP) $ 66,898 21.4% $ 27,464 8.8% $ 7,365 4.5% $ 101,727 12.9%
Restructuring charges 90 —% — —% 959 0.6% 1,049 0.1%
Subtotal 66,988 21.4% 27,464 8.8% 8,324 5.1% 102,776 13.0%
Amortization of intangible assets 697 0.2% 5,596 1.8% 2,046 1.2% 8,339 1.1%
Non-cash share-based compensation 4,343 1.4% 5,893 1.9% 3,749 2.3% 13,985 1.8%
Adjusted operating income (non-GAAP) $ 72,028 23.0% $ 38,953 12.4% $ 14,119 8.6% $ 125,100 15.8%
Six Months Ended August 31, 2018
Housewares Health & Home Beauty Total
Operating income, as reported (GAAP) $ 50,512 19.8% $ 33,288 9.8% $ 10,187 6.6% $ 93,987 12.6%
Restructuring charges 760 0.3% 358 0.1% 1,466 1.0% 2,584 0.3%
Subtotal 51,272 20.1% 33,646 9.9% 11,653 7.6% 96,571 12.9%
Amortization of intangible assets 985 0.4% 5,408 1.6% 1,129 0.7% 7,522 1.0%
Non-cash share-based compensation 3,980 1.6% 4,482 1.3% 2,551 1.7% 11,013 1.5%
Adjusted operating income (non-GAAP) $ 56,237 22.1% $ 43,536 12.8% $ 15,333 9.9% $ 115,106 15.4%

Reconciliation of GAAP Income and Diluted Earnings Per Share (“EPS”) from Continuing Operations to Adjusted Income and Adjusted EPS from Continuing Operations (non-GAAP)(Unaudited) (dollars in thousands, except per share data)
56
Three Months Ended August 31, 2019
Income from Continuing Operations Diluted EPS from Continuing Operations
Before Tax Tax Net of Tax Before Tax Tax Net of Tax
As reported (GAAP) $ 51,393 $ 5,298 $ 46,095 $ 2.04 $ 0.21 $ 1.83
Restructuring charges 430 66 364 0.02 — 0.01
Subtotal 51,823 5,364 46,459 2.05 0.21 1.84
Amortization of intangible assets 4,463 248 4,215 0.18 0.01 0.17
Non-cash share-based compensation 6,381 515 5,866 0.25 0.02 0.23
Adjusted (non-GAAP) $ 62,667 $ 6,127 $ 56,540 $ 2.48 $ 0.24 $ 2.24
Weighted average shares of common stock used in computing diluted EPS 25,245
Three Months Ended August 31, 2018
Income from Continuing Operations Diluted EPS from Continuing Operations
Before Tax Tax Net of Tax Before Tax Tax Net of Tax
As reported (GAAP) $ 47,990 $ 3,973 $ 44,017 $ 1.81 $ 0.15 $ 1.66
Restructuring charges 859 41 818 0.03 — 0.03
Subtotal 48,849 4,014 44,835 1.84 0.15 1.69
Amortization of intangible assets 3,402 56 3,346 0.13 — 0.13
Non-cash share-based compensation 4,689 337 4,352 0.18 0.01 0.16
Adjusted (non-GAAP) $ 56,940 $ 4,407 $ 52,533 $ 2.14 $ 0.17 $ 1.98
Weighted average shares of common stock used in computing diluted EPS 26,557

Reconciliation of GAAP Income and Diluted Earnings Per Share (“EPS”) from Continuing Operations to Adjusted Income and Adjusted EPS from Continuing Operations (non-GAAP) (Unaudited) (dollars in thousands, except per share data)
57
Six Months Ended August 31, 2019
Income from Continuing Operations Diluted EPS from Continuing Operations
Before Tax Tax Net of Tax Before Tax Tax Net of Tax
As reported (GAAP) $ 95,424 $ 8,635 $ 86,789 $ 3.78 $ 0.34 $ 3.44
Restructuring charges 1,049 68 981 0.04 — 0.04
Subtotal 96,473 8,703 87,770 3.82 0.34 3.48
Amortization of intangible assets 8,339 369 7,970 0.33 0.01 0.32
Non-cash share-based compensation 13,985 1,091 12,894 0.55 0.04 0.51
Adjusted (non-GAAP) $ 118,797 $ 10,163 $ 108,634 $ 4.71 $ 0.40 $ 4.30
Weighted average shares of common stock used in computing diluted EPS 25,245
Six Months Ended August 31, 2018
Income from Continuing Operations Diluted EPS from Continuing Operations
Before Tax Tax Net of Tax Before Tax Tax Net of Tax
As reported (GAAP) $ 88,705 $ 6,515 $ 82,190 $ 3.33 $ 0.24 $ 3.09
Restructuring charges 2,584 183 2,401 0.10 0.01 0.09
Subtotal 91,289 6,698 84,591 3.43 0.25 3.18
Amortization of intangible assets 7,522 190 7,332 0.28 0.01 0.28
Non-cash share-based compensation 11,013 606 10,407 0.41 0.02 0.39
Adjusted (non-GAAP) $ 109,824 $ 7,494 $ 102,330 $ 4.13 $ 0.28 $ 3.85
Weighted average shares of common stock used in computing diluted EPS 26,612

Selected Consolidated Balance Sheet, Cash Flow and Liquidity Information (Unaudited) (in thousands)
58
August 31,
2019 2018
Balance Sheet:
Cash and cash equivalents $ 17,031 $ 19,915
Receivables, net 310,377 313,615
Inventory, net 370,915 284,828
Total assets, current 711,371 636,367
Total assets 1,775,953 1,694,588
Total liabilities, current 317,857 298,007
Total long-term liabilities 370,721 320,841
Total debt 301,193 301,076
Consolidated stockholders' equity 1,087,375 1,075,740
Liquidity:
Working capital $ 393,514 $ 338,360
Six Months Ended August 31,
2019 2018
Cash Flow from continuing operations:
Depreciation and amortization $ 16,116 $ 15,295
Net cash provided by operating activities 38,211 37,311
Capital and intangible asset expenditures 8,861 13,061
Net debt proceeds (repayments) (20,100) 10,700
Payments for repurchases of common stock 9,131 42,240

Effective Tax Rate (GAAP) and Adjusted Effective Tax Rate (non-GAAP) (Unaudited)
Fiscal Year 2020 Updated Outlook
Reconciliation of Fiscal 2020 Updated Outlook for GAAP Diluted Earnings Per Share (“EPS”) from Continuing Operations to Adjusted Diluted EPS from Continuing Operations (non-GAAP) (Unaudited)
Fiscal 2020 Updated Outlook for Net Sales Revenue (Unaudited) (in thousands)
59
Fiscal Fiscal 2019 Updated Outlook for Fiscal 2020
Net sales revenue $ 1,564,151 $ 1,610,000 — $ 1,640,000
2.9% — 4.8%
Six Months Ended August 31, 2019
Outlook for theBalance of the
Fiscal Year(Six Months) Updated Outlook Fiscal 2020
Diluted EPS from continuing operations, as reported (GAAP) $ 3.44 $ 3.40 — $ 3.60 $ 6.84 — $ 7.04
Restructuring charges, net of tax 0.04 0.01 — 0.02 0.05 — 0.06
Subtotal 3.48 3.41 — 3.62 6.89 — 7.10
Amortization of intangible assets, net of tax 0.32 0.36 — 0.38 0.68 — 0.70
Non-cash share-based compensation, net of tax 0.51 0.43 — 0.45 0.94 — 0.96
Adjusted diluted EPS from continuing operations (non-GAAP) $ 4.30 $ 4.20 — $ 4.45 $ 8.50 — $ 8.75
Six Months Ended August 31, 2019
Outlook for the Balance of the
Fiscal Year (Six Months) Updated Outlook Fiscal 2020
Effective tax rate, as reported (GAAP) 9.0% 10.3% — 12.1% 9.6% — 10.7%
Restructuring charges —% —% — —% —% — —%
Subtotal 9.0% 10.3% — 12.1% 9.6% — 10.7%
Amortization of intangible assets (0.4)% (0.5)% — (0.7)% (0.4)% — (0.5)%
Non-cash share based compensation (0.1)% (0.2)% — (0.3)% (0.2)% — (0.2)%
Adjusted effective tax rate 8.6% 9.5% — 11.1% 9.0% — 10.0%