Embed Size (px)
Citation preview

Leaders in the sustainable
use of natural resources
Corporate Presentation
September 2020
80 Overall ESG Score

2
Disclaimer
The information contained in this presentation has been prepared by Ence Energía y Celulosa, S.A. (hereinafter, "Ence").
This presentation includes data relating to future forecasts. Any data included in this presentation which differ from other data based on historical information,including, in a merely expository manner, those which refer to the financial situation of Ence, its business strategy, estimated investments, management plans, andobjectives related to future operations, as well as those which include the words "anticipate", "believe", "estimate", "consider", "expect" and other similar expressions,are data related to future situations and therefore have various inherent risks, both known and unknown, and possess an element of uncertainty, which can lead to thesituation and results both of Ence and its sector differing significantly from those expressly or implicitly noted in said data relating to future forecasts.
The aforementioned data relating to future forecasts are based on numerous assumptions regarding the current and future business strategy of Ence and theenvironment in which it expects to be situated in the future. There is a series of important factors which could cause the situation and results of Ence to differsignificantly from what is expounded in the data relating to future forecasts, including fluctuation in the price of wood pulp or wood, seasonal variations in business,regulatory changes to the electricity sector, fluctuation in exchange rates, financial risks, strikes or other kinds of action carried out by the employees of Ence,competition and environmental risks, as well as any other factors described in the document. The data relating to future forecasts solely refer to the date of thispresentation without Ence being under any obligation to update or revise any of said data, any of the expectations of Ence, any modification to the conditions orcircumstances on which the related data are based, or any other information or data included in this presentation.
The information contained in this document has not been verified by independent experts and, therefore, Ence neither implicitly nor explicitly gives any guarantee onthe impartiality, precision, completeness or accuracy of the information, opinions and statements expressed herein.
This document does not constitute an offer or invitation to acquire or subscribe to shares, in accordance with the provisions of Royal Legislative Decree 4/2015, of 23October, approving the consolidated text of the Securities Market Act. Furthermore, this document does not constitute a purchase, sale or swap offer, nor a requestfor a purchase, sale or swap offer for securities, or a request for any vote or approval in any other jurisdiction.

Ence at a glance
Resilient business model, strong CF generation potential & sustainable growth
3
Global demand growth for wood pulp driven by increasing living standards in emerging countries and the
substitution of plastics and synthetic fibers
Strong competitive position in Europe: highly efficient facilities, JIT service and differentiated offering
Spanish Renewable Energy Plan 2020 – 2030: to double the national renewable energy capacity in 10
years
Renewable Energy earnings secured by stable regulation and Ence´s strong expertise
2019 – 2023 Strategic Plan focused on growth, diversification and excellence in sustainability. Stepwise
investment plan subject to financial discipline
Leaders in the sustainable use of natural resources for the eco-efficient production of special pulp and
renewable energy.
Our activity contributes to tackle upcoming global challenges and it is an important driver for
employment and wealth in rural areas
A reference in sustainable agro-forestry management, circular economy, safety, community
involvement and equality
Leading European eucalyptus pulp (BHKP) producer with 1.2 Mn tons of installed capacity and largest
Spanish renewable energy generator with agroforestry biomass with 316 MW of installed capacity

4
Leaders in the sustainable use of natural resourcesFor the eco-efficient production of special pulp and renewable energy
Eco-efficient production
of special pulp
Ence is the leading European eucalyptus
pulp producer, with 1.2 Mn tons of installed
capacity
Wood used for pulp production is 100%
locally sourced
Its production process is environmentally
friendly and constitutes a great example of
energy efficiency (100% self-generated
renewable energy) and circular economy
(less than 1% of the waste generated is sent
to landfill)
The environmental parameters of our
biomills are well beyond those of European
regulations (BREF)
We produce natural, renewable and
biodegradable materials, substitutes for
plastic
Renewable energy generation
Ence is the largest renewable energy
producer with forestry and agricultural
biomass in Spain, with an installed capacity
of 316 MW and a 405 MW pipeline
Our biomass plants are fully manageable and
contribute to the EU’s decarbonisation goals
We draw upon local agricultural and forest
by-products, mitigating their environmental
impact and reducing fire risk
The new plants are an example of fair
energy transition, by reusing sites previously
occupied by other industrial activities and
maintaining local employment
Sustainable forestry
and biomass
Ence is a reference regarding the
responsible and sustainable management
of the agricultural and forestry sector in
Spain
2.7 Mn tons of wood acquired in the
surroundings of our biomills from certified
responsible sources: 80% are FSC® (Licence
code: FSC-C081854) / PEFC certified
1.5 Mn tons of biomass acquired in the
surroundings of our power plants, while
applying our voluntary decalogue that
guarantees its sustainable use in energy
generation
Ence manages ca.66,000 hectares of forest
land in the Iberian Peninsula: 85% of them are
FSC® (Licence code: FSC-C099970) / PEFC
certified and 22% are dedicated to
protecting and preserving ecosystems

5
Sustainability as a competitive advantageSustainability Plan
Priority Goal 1H20 Highlights Contribution to the SDG
80% wood inputs certified
Wood bought from small producers
>84%Sustainable
agro-forestry
management
Promote responsible forest and agricultural
management as a driver for sustainable
socio-economic development in rural areas
10% of Pulp Sales
EcolabelDevelop sustainable products as a key for
generating value
Sustainable
products
0% Gender Salary Gap
69% of hires < 30y are women
Promote talent development, ensure equal
opportunities and commitment to sustainability
in the entire Ence team
People
& values
Investments in the community
+3,2M€ More than 400organized visits to our plants
Commitment to
communities
Proactively contribute to the economic and social
development of the environment in which we
operate
GovernanceRobust corporate governance with long-term
vision
Long-term incentive plan linked to ESG targets
25%Women present in the Board of Directors vs. 2017
22%
AENOR “0 Waste”
Certification
Industry reference Covid-19 Prevention Protocols
Safely development of our activities with
exemplary environmental performance
Safe and
ecologically
efficient operations

6
Our activity contributes to tackle upcoming global challengesIt is an important driver for employment and wealth in rural areas
Global challenges
Climate change
Plastic pollution
Increased social awareness on sustainability
Biodiversity loss and deforestation
Rural exodus
Deindustrialisation
Waste management
Ence’s solution
Renewable energy
Special pulp products
Lower environmental footprint products
Circular economy
Sustainable forest management
Opportunities for rural areas
Fair transition
Contribution to the SDG
(2030 Agenda)

Juan Luis Arregui, Honorary Chairman and largest shareholder is founder of Gamesa and former Vice Chairman of Iberdrola
Shareholding Structure Board of Directors
Supportive shareholder base
And strong corporate governance
7
Juan Luis
Arregui
Honorary
Chairman
Ignacio
de Colmenares
Chairman &
CEO
Amaia
GorostizaIsabel
Tocino
José Carlos
del Álamo
Irene
Hernández
Rosa María
García
Javier
Echenique
José Ignacio
Comenge
Gorka
Arregui
Óscar
Arregui
Víctor
Urrutia
Fernando
Abril-Martorell
José Guillermo
Zubía
Audit
Committee
Chairwoman
Sustainability
Committee
Chairman
Nominating &
Compensation
Committee chairman
Independent Directors
External Proprietary Directors
Other External Directors
As of June 2020
Lead
Independent Director
6.4% D. Jose Ignacio Comenge
29.4% D. Juan Luis Arregui
7.3% D. Víctor Urrutia
1.4% Autocartera
55.5% Free Float

8
Pulp & Renewable Energy
Two businesses financially and operationally complementary & independent
Regulated Renewable Energy
business provides stability and
high visibility of revenues
Cyclical pulp business,
dependent on the global pulp price
in dollars
Long-term financing without maintenance
covenants and ample liquidity
Both business are
independently financed and
reported
Long-term financing and
ample liquidity
Net Debt to EBITDA limit of 4.5xNet Debt to EBITDA target below 2.5x
Leading European producer with
1.2 Mn tons of installed capacity:
Navia: 685,000 t
Pontevedra: 515,000 t
Largest biomass operator in Spain with
316 MW of Renewable Energy installed
capacity & 405 MW pipeline with access
to the grid
Based on Ence’s wood supply
management expertise
Based on Ence`s agroforestry biomass
supply management expertise
25%EBITDA
75%EBITDA
Pulp
Business
Renewable Energy
Business
1H 2020
Pontevedra
Navia
Huelva
JaénCórdoba
Mérida
Ciudad Real

Pulp
Business1.

10
Ence is a leading European hardwood pulp producer with 1.2 Mn tons of installed capacity,
competing in the global Chemical Market Pulp industry
435 Mn Tons
Fiber Source Pulp Processing Integrated vs.
Market Pulp
Pulp Type
Recycled
Fiber &
Non Wood Pulp:
258 Mnt
Virgin Pulp:
177 Mnt Chemical:
149 Mnt
Mechanical:
28 Mnt
Source: RISI – Jan 2020; PPPC G-100 Dec 2019
Market:
64 Mnt
Integrated:
85 MntSoftwood and other
28 Mnt
36 Mnt Hardwood
Chemical Market Pulp industry
Total Paper & Board
consumption
422 Mn Tons
Packaging
Paper
& Board
173 Mnt
Printing &
Writing:
97 Mnt
Tissue: 39 Mnt
Newsprint:
19 Mnt
Specialties:
94 Mnt
Market Pulp industry
64 million tons in 2019
CAGR
2008 – 2018
-6.3%
2.9%
-1.8%
3.3%
1.6%

Fastest growing tissue & hygienic products segments
Account for close to 50% of global market pulp demand
11
26
16 16
12
7 76
43 1
0,1
North
America
Western
Europe
Japan Oceania Latam Eastern
Europe
China Middle
East
Other
Asia
Africa India
of world population
Source: RISI 2018
13% 87%
Tissue paper per-capita consumption Kg/year
Tissue annual consumption growth ‘000 t
57
8
97
2
1.1
21
76
6
1.1
33
92
2
1.3
70
1.3
01
1.1
97
83
6
1.0
16
2009 2010 2011 2012 2013 2014 2015 2016 2017 2018 2019
Source: PPPC
3.3%CAGR
2009-19
Driven by urban population growth and increasing living standards in emerging countries

12
Eucalyptus only grows under specific climate conditions, usually in warm subtropical regions
More abundant pines are better adapted to cold climates
Hardwood pulp vs. Softwood pulp
Eucalyptus pulp is cheaper to produce and best suited for tissue production
Hardwood pulp (BHKP)
Softwood pulp (BSKP)
Most hardwood pulp comes from eucalyptus wood
Best suited for paper products with high smoothness, opacity and
uniformity (i.e. tissue)
Low production cost
IBERIAN GLOBULUS
Forestry yield: 12 -18 m3 / ha / year
Harvesting cycle: 12 - 15 years
Industrial yield: 2.6 - 3.0 m3 / ton of pulp
High production cost
Most softwood pulp comes from pine wood
Best suited for paper requiring higher durability and strength
(i.e. printing & writing)
NORDIC SCOTS PINES
Forestry yield: 2 - 4 m3 / ha / year
Harvesting cycle: 50 - 70 years
Industrial yield: 4.8 - 5.2 m3 / ton of pulp
Substitutive
materials
Long Term net
average spread of
100 $/t

13
Eucalyptus only grows under specific climatic conditions
Iberia is amongst the most efficient locations for pulp production
Chile /Uruguay
Belgium &
France
Other Asia
IberiaChile
East Europe
Finland
SwedenUS
Sweden
Other Europe
US
China
East Canada
Other World
Indonesia
Brazil*
Interior West
Canada
Japan
Coastal BC
Mn t
Source: “Outlook for Market Pulp August 2020 report”. Hawkins Wright
Japan
Canada
East Europe
Finland
Global Market Pulp Cash Cost Curve by geography (CIF Europe)US$ / t
* Brazil only includes the cost of wood harvesting and transportation plus third party wood purchases. On a like for like basis, Brazilian cash cost would be around 50 US$ / t higher
USD
Hardwood Pulp (BHKP)
Softwood Pulp (BSKP)

14
0
10
20
30
40
50
60
2009 2010 2011 2012 2013 2014 2015 2016 2017 2018 2019
Softwood (BSKP):
+2.1% CAGR
Source: PPPC G-100
Hardwood (BHKP):
+3.7% CAGR
+ 2.7% CAGR
Mn tons
0
5
10
15
20
25
30
35
2009 2010 2011 2012 2013 2014 2015 2016 2017 2018 2019
Eucalyptus pulp (BEKP): +4.8%
CAGR
Source: PPPC G-100
Mn tons
Other Hardwood (BHKP): 1.4%
CAGR Other : -2.4% CAGR
Average annual pulp demand growth of 1.5 Mn t during the last 10 years
The more efficient and best suited eucalyptus pulp is gaining market share against other hardwood and softwood pulp
Superior demand growth for Eucalyptus pulp
Which is leading global market pulp demand growth
Total market pulp demand evolutionLast 10 years
Hardwood pulp demand evolution Last 10 years

14
10
15
Rest of the
World
8 7
6 4
Demand Supply
1411
Softwood pulp (BSKP)
Hardwood pulp (BHKP)
Source: PPPC G-100; RISI
China
Demand
24
Western Europe
94
610
Supply
14
3 25
15
Demand Supply
North America
8
17
Mn Tons
Demand
15
Supply
3
China, Europe and North America are net importers of hardwood pulp (BHKP)
2
23
1
3
Demand Supply
3
South America
26
Tight global Market Pulp supply and demand balance
Global demand reached 90% of capacity in 2019

16
Source: RISI 2018Source: RISI 2018
International Paper: 12%
Georgia-Pacific: 8%
Metsä: 8%
Domtar: 6%
Illim: 5%
All other: 33%
Arauco: 6%Paper Excellence: 5%
Stora Enso: 4%
Sodra: 6%
Mercer: 6%
Top 10 softwood pulp producers account for
67%of global BSKP market share
Top 10 hardwood pulp producers account for
76% of global BHKP market share
Suzano: 29%
APP: 7%
April: 8%
Arauco: 6%
All other: 21%
UPM: 5%
Cenibra: 3%
Ence: 3%
Altri: 3%
CMPC: 8%
Klabin: 3%
Concentrated supply markets with high entry barriers
Next capacity increases are managed by incumbents
Global market shareSoftwood pulp (BSKP)
Global market share Hardwood pulp (BHKP)
El Dorado: 4%
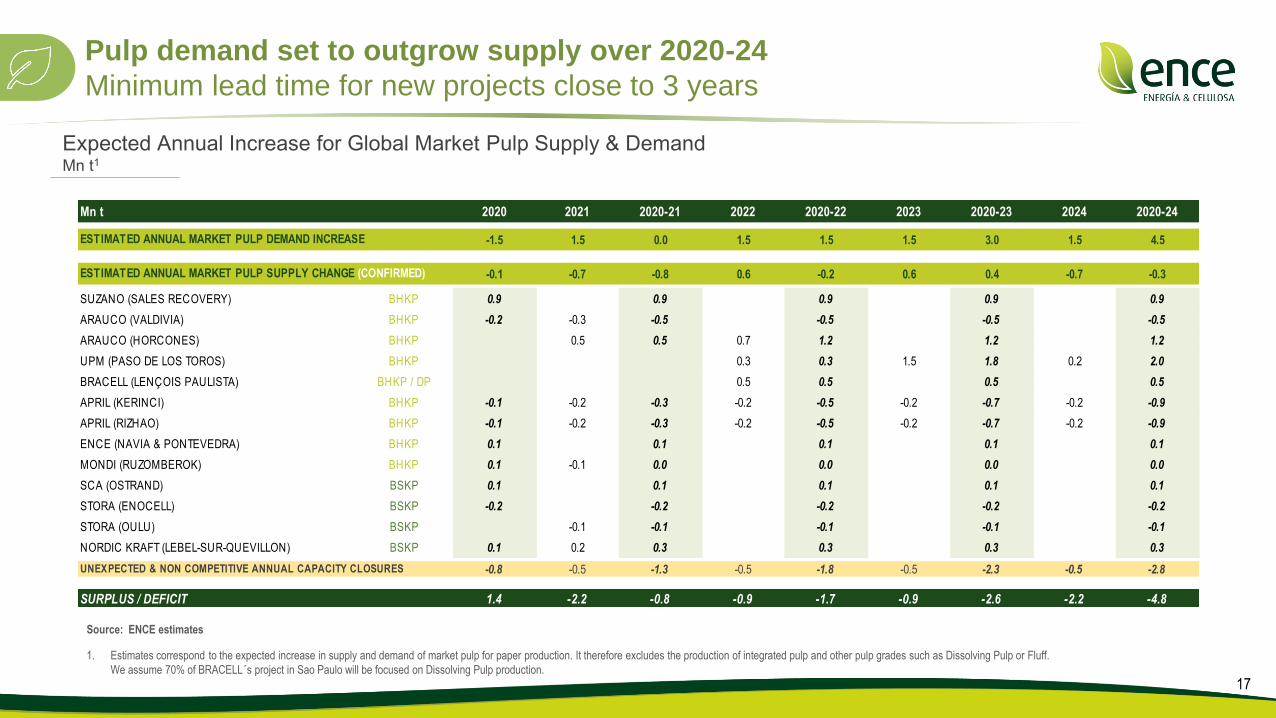
Pulp demand set to outgrow supply over 2020-24
Minimum lead time for new projects close to 3 years
Expected Annual Increase for Global Market Pulp Supply & Demand Mn t1
17
Mn t 2020 2021 2020-21 2022 2020-22 2023 2020-23 2024 2020-24
-1.5 1.5 0.0 1.5 1.5 1.5 3.0 1.5 4.5
-0.1 -0.7 -0.8 0.6 -0.2 0.6 0.4 -0.7 -0.3
SUZANO (SALES RECOVERY) BHKP 0.9 0.9 0.9 0.9 0.9
ARAUCO (VALDIVIA) BHKP -0.2 -0.3 -0.5 -0.5 -0.5 -0.5
ARAUCO (HORCONES) BHKP 0.5 0.5 0.7 1.2 1.2 1.2
UPM (PASO DE LOS TOROS) BHKP 0.3 0.3 1.5 1.8 0.2 2.0
BRACELL (LENÇOIS PAULISTA) BHKP / DP 0.5 0.5 0.5 0.5
APRIL (KERINCI) BHKP -0.1 -0.2 -0.3 -0.2 -0.5 -0.2 -0.7 -0.2 -0.9
APRIL (RIZHAO) BHKP -0.1 -0.2 -0.3 -0.2 -0.5 -0.2 -0.7 -0.2 -0.9
ENCE (NAVIA & PONTEVEDRA) BHKP 0.1 0.1 0.1 0.1 0.1
MONDI (RUZOMBEROK) BHKP 0.1 -0.1 0.0 0.0 0.0 0.0
SCA (OSTRAND) BSKP 0.1 0.1 0.1 0.1 0.1
STORA (ENOCELL) BSKP -0.2 -0.2 -0.2 -0.2 -0.2
STORA (OULU) BSKP -0.1 -0.1 -0.1 -0.1 -0.1
NORDIC KRAFT (LEBEL-SUR-QUEVILLON) BSKP 0.1 0.2 0.3 0.3 0.3 0.3
-0.8 -0.5 -1.3 -0.5 -1.8 -0.5 -2.3 -0.5 -2.8
SURPLUS / DEFICIT 1.4 -2.2 -0.8 -0.9 -1.7 -0.9 -2.6 -2.2 -4.8
ESTIMATED ANNUAL MARKET PULP DEMAND INCREASE
ESTIMATED ANNUAL MARKET PULP SUPPLY CHANGE (CONFIRMED)
UNEXPECTED & NON COMPETITIVE ANNUAL CAPACITY CLOSURES
Source: ENCE estimates
1. Estimates correspond to the expected increase in supply and demand of market pulp for paper production. It therefore excludes the production of integrated pulp and other pulp grades such as Dissolving Pulp or Fluff.
We assume 70% of BRACELL´s project in Sao Paulo will be focused on Dissolving Pulp production.

Ence’s competitive advantages in the pulp business
JIT service and differentiated offering to European clients
18
Access to eucalyptus
plantations around our
pulp biomills
Eucalyptus only grows
under specific climatic
conditions
Diversification into pine
Unique supply chain
High client
diversification
Sales force capillarity
>100 customers
Top customer service
Privileged access to
the European market
Just in time service
(5-7 days delivery vs.
40 days for Latam
deliveries)
Lower logistics costs
High quality pulp
and differentiated
offering
Totally chlorine free
7 de-commoditized
products, not easy to
replicate with commodity
pulp
Eucalyptus Pulp is
cheaper to produce than
softwood Pulp
80% of Softwood products
can be produced with
Hardwood pulp
Technical team dedicated to
pulp usage transformation
TCF

19
Ence’s revenue breakdown
Focus on European market and on higher growing segments
Source: Ence 1H20Source: Ence 1H20 Source: Ence 1H20
Most of the pulp produced by Ence is
sold in Europe
94% of revenue from pulp sales
Tissue & Specialties paper remain the main
end uses given to the pulp sold by Ence
84%of revenue from pulp sales
Ence's differentiated products already
account for
10% of revenue from pulp sales
Geographical distribution of sales% of pulp sales
Breakdown by end product% of pulp sales
Europe 94%6% Other
Tissue 57% 27% Specialties
9% P&W
7% Packaging
Differentiated products % of pulp sales
10%
vs. 82% in 2019vs. 6% in 2019
vs. 58% in 2019 vs. 31% in 2019
vs. 8% in 2019
vs. 3% in 2019

0
100
200
300
400
500
600
700
800
Au
g-1
0
Au
g-1
1
Au
g-1
2
Au
g-1
3
Au
g-1
4
Au
g-1
5
Au
g-1
6
Au
g-1
7
Au
g-1
8
Au
g-1
9
Au
g-2
0
818
1.037
862
677
766
850806
855
635
760
568
451
522
596
541
600
400
500
600
700
800
900
1.000
2017 2018 2019 2020e 2021e 2022e 2023e 2024e
Gross Price (Europe) Net Price (China)
20
Pulp prices bottoming out in 2020
From their lowest levels in the last 10 years
BHKP Price Consensus as of August 2020$/t
Source: RISI, Hawkins Wright, Brian McClay
BHKP prices as of 25/08/2020: 443 $/t, Net (China); 680 $/t Gross (Europe)
Source: FOEX
Net BHKP Price China$/t
Avg. Net PriceHW China L10Y631 $/t
Net PriceHW China443 $/tas of 25/08/20
Global pulp demand recovered by 9% vs. the first six months of 2019,
which were affected by the destocking of pulp in the paper industry. Its
restocking in 1H20 together with higher demand for tissue paper and
hygiene products has offset lower demand for P&W papers during the
lockdown.

Pulp business stepwise investment plan
Subject to our financial discipline
21
€75 Mn80,000 t expansion in
Navia
€40 - 50 Mn120,000 t adaptation for
hygienic absorbent
products in Navia
(Fluff pulp)
€30 Mn20,000 t expansion in
Pontevedra
Up to 200,000 t
Dissolving Pulp
for viscose fiber
products
March 2019 4Q 2019
Up to 340,000 t
Hardwood Paper
Grade Pulp (BHKP)
Start-up date
New Swing line at Navia
Flexible
production
€450 Mn
or
Stepwise investment plan with 4 independent projects€ Mn
Gradual reduction of BHKP cash cost €/t
Cost optimization program launched in 3Q19, in order
to achieve the Strategic Plan’s annual cash cost
targets
372
370
367
365
2020 2021 2022 2023
Executed Pulp Pending Investments
The Board has confirmed the postponement of Strategic Plan
Investments pending in the Pulp business, aiming at a Net
Debt to EBITDA ratio below 2.5 times at average cycle prices
Navia 80.000 t and Pontevedra 20.000
t capacity expansions successfully
executed in 2019

22
Pontevedra’s biomill legal statusThe first resolution of the National Court is expected in the coming months
On January 2016 the National Directorate
of Coasts granted the extension of
Pontevedra´s concession until 2073
The 1958 biomill's original concession was extended for 60 years (starting November 8th 2013) by the National Directorate of
Coasts via a resolution dated January 20th 2016 by virtue of: (i) Law 2/2013, on coastal protection and sustainability and
amending the Coastal Act (22/1988); & (ii) General Coast Regulations enacted (Royal Decree 876/2014).
We expect a first resolution from the
National Court in the coming months
The legal case against the extension could
last for up to 4 years, including appeals to
higher courts
3 appeals presented by Pontevedra’s City Council and by two environmental associations to the National Court´s Chamber for
Contentious Administrative Proceedings against the Jan. 20th 2016 resolution.
On March 8th 2019, the National Directorate of Coasts accepted all 3 appeals, despite having previously argued at all stages that
the Ministerial Order Resolution of January 20th 2016 was totally legal.
On April 10th 2019, the National Court´s Chamber for Contentious Administrative allowed Ence to defend the case.
The court case is now in its final stage. COVID-19 may delay the National Court’s first resolution.
€130 Mn invested in the biomill since the
extension of the concession in 2016
Investments carried out or committed since the extension of the concession for the period of 2016 – 2019 amount to approx. €130
Mn.
In the unlikely event of operations being discontinued, the cash impact would amount to €74 Mn (€43 Mn corresponding to
dismantling actions, €15 Mn to the cost of staff reductions and €16 Mn to the cancellation of existing contracts).
Given the uncertainty, the Board of Directors
decided to concentrate the investments of the
Business Plan in Navia’s biomill
Investments of €250 Mn initially planned to increase capacity in Pontevedra will be reallocated to Navia’s biomill, in order to double
the initially planned swing line by up to 340,000 t of BHKP or 200,000 t of dissolving pulp.

Renewable Energy
Business2.

24
Largest Spanish renewable energy generator with agroforestry biomass316 MW of installed capacity
Solar thermal power plant50 MW
Biomass power plants170 MW
Current Power Plants Portfolio
New biomass power plants commissioned in 1Q 202096MW
HUELVA
41 MW
HUELVA
50 MW
HUELVA
46 MW
MÉRIDA
20 MW
JAÉN
16 MW
CÓRDOBA
27 MW
CIUDAD REAL
16 MW
CIUDAD REAL
50 MW
CIUDAD REAL
50 MW

25
A regulated business which adds stability to the Group€ 63 Mn annual return on investment and regulated sales price
Annual return on investment (€ Mn)
The regulated annual return on investment of our power plants was confirmed at 7.4% for 2020 – 2031 by Spanish Royal Decree-Law 17/2019.
Implies an annual revenue of € 63 Mn subject to a minimum operation of just 3.000 hours per biomass power plant.
Regulated sales price: Pool price + Return on the operations (Ro) + Regulatory Collar (€/MWh)
Our renewable energy sales price is supported by its regulatory minimum, that covers all the operating costs of a standard biomass power plant
Ro and regulatory collar applicable during the sanitary crisis will be reviewed, according to Spanish Royal Decree-Law 23/2020.
€ 63 Mn
Annual Return
on Investment
0
20
40
60
80
100
120
140
Jun-15 Dec-15 Jun-16 Dec-16 Jun-17 Dec-17 Jun-18 Dec-18 Jun-19 Dec-19 Jun-20
Pool price (€/MWh) - 30 days average Pool price + Weighted Average Ro (€/MWh)
Regulatory Cap Regulatory Floor

New biomass power plants are more efficientDue to fuel flexibility, higher efficiency factor and fixed costs dilution
26
Biomass
power plant
location
Capacity MW
End of
regulatory
life
Construction
Capex € Mn / MW
Boiler
technology
Efficiency
factor
Fuel
flexibility
BIO
MA
SS
PO
WE
R P
LA
NT
S
PR
E 2
01
4
Huelva 41 2025 Fluidized bed 26% Limited
Ciudad Real 16 2027Pulverized fuel
boiler + stoker
grate24% Inflexible
Jaén 16 2027Pulverized fuel
boiler + stoker
grate24% Inflexible
Córdoba 14 2031Reciprocating
grate 26% Inflexible
Huelva 50 2037 2.6 Fluidized bed 30% Limited
Mérida 20 2039 3.3 Vibrating grate 32% Flexible
NE
W
BIO
MA
SS
PL
AN
TS Huelva 46 2044
2.2
Vibrating grate 35%Full
Flexibility
Ciudad Real 50 2044 Vibrating grate 35%Full
Flexibility
Net Selling Price
Variable Costs
Fixed Costs
Operating Margin
RI
New biomass power
plants: 96 MW
170 MW biomass power
plants pre 2014
€/MWh

HUELVA 10 MW
Solar PV
Renewables pipeline: 405 MW with grid access and locations securedAwaiting upcoming public auctions of the National Renewable Energy Plan
HUELVA 40 MW
Solar PV
ALMERÍA 40 MW
Biomass
CIUDAD REAL 25 MW
Biomass Hybridization
27
CIUDAD REAL 50 MW
Biomass
SEVILLA 90 MW
Solar PV
JAÉN 100 MW
Solar PV
CÓRDOBA 50 MW
Biomass
RTB in 3Q21
RTB in 4Q21
RTB in 3Q21
RTB in 4Q21
RTB in 4Q21
RTB in 1Q22
RTB in 3Q21
RTB in 3Q21
RTB = Ready to build
Annual actions 2020 – 2025
Specific by technology
Price mechanism: Pay as bid
(€/MWh)
National Renewable Energy Plan
2020 – 2030
Upcoming Auctions Scheme Spanish Royal Decree-Law 23/2020
Solar PV: +30.1 GW
CSP: +5.0 GW
Wind: +22.3 GW
Biomass: +0.8 GW
Hydro: +3.5 GW

1S 2020 Results
Summary3.

29
1H 2020 Financial ResultsDriven by lower pulp and energy prices
1H19 1H20
€27 Mn EBITDA in the Renewable business:
+5% vs. 1H19 driven by 27% higher energy
sales
Offsetting a 7% decline in the average sales
price down to its regulatory minimum
Renewable Energy Business EBITDA (€ Mn)
+4.7%
2726
1H19 1H20
Pulp Renewable Energy
Net consolidated result of €-25 Mn following:
€57 Mn Depreciation and other
€13 Mn Net financing costs
+ €9 Mn Income tax
-25
25
Group Net Income (€ Mn)
€9 Mn EBITDA in the Pulp business:
-87% vs.1H19 driven by a 29% decrease in
the average sales price
Partially offset by a 19% increase in pulp sales
and 5% reduction in cash cost
1H19 1H20
Pulp Business EBITDA (€ Mn)
-86.7%
9
67

30
€29 Mn Normalized FCF and €42 Mn carry-over payments in 1H20€342 Mn cash in balance, long-term debt maturities and no covenants
1. FCF before Strategic Plan investments, divestments & dividend payment
Lease
contracts
€55 Mn
€540Mn Net Debt (+ €27 Mn vs. Dec.19):
Including €55 Mn related to lease contracts
(+ €2 Mn vs. Dec.19)
€342 Mn cash in balance (+ €116 Mn vs.
Dec.19)
Long-term maturities in both businesses and
covenant free in the Pulp business
Net Debt (€ Mn)
2019 1H20
Renewable Energy Pulp Operating Leases
540513
Normalized Free Cash Flow generation of
€29 Mn
Lower EBITDA vs. 1H19 partially offset by:
Working capital reduction
Lower taxes
Normalized FCF1 (€ Mn)
1H19 1H20
Renewable Energy Pulp
29
69
-54.2%
1H19 1H20
Renewable Energy Pulp
Strategic Plan carry over payments of €42 Mn:
€31 Mn carry-over payments in the Pulp business
from capacity expansions and sustainability
improvements in 2019
€11 Mn carry over payments in the Renewable
Energy business from two new biomass plants
commissioned in 1Q20 and sustainability
improvements
Strategic Plan Capex (€ Mn)
172
42
-75.8% +5.3%

590
418
1H19 1H20
Pulp Business 1H 2020 results driven by lower pulp prices
31
437,950
519,820
1H19 1H20
Avg. Net Pulp Price (€/t) Pulp Sales Volume (t)
-29.3%
Avg. Cash Cost (€/t) EBITDA (€ Mn)
396 378
1H19 1H20
67
9
1H19 1H20
86.7% EBITDA decrease vs. 1H19:
Resulted from the 29% drop in the average
sales price.
Partially offset by 19% higher sales and 5%
lower cash cost following the 100,000 t
capacity increase carried out in 2019
Annual maintenance shutdowns delayed to
3Q20 due to COVID-19
-86.7%-4.7%
+18.7%

32
1,00
1,05
1,10
1,15
1,20
1,25
1,30
1,35
1,40
31-12-13 31-12-14 31-12-15 31-12-16 31-12-17 31-12-18 31-12-19 31-12-20 31-12-21
Current HedgesDollar/Euro Exchange Rate Evolution
Ence has secured an average cap of $1.19/€ and an average floor of $1.14/€ for 73% of its dollar exposure in 2H20
Assuming a flat 1.14 $/€ for 2S20, full year FX settlements would amount to €10 Mn
Ongoing FX hedging programTo mitigate FX volatility in the Pulp Business
Q3 2020: 84% revenues
Avg. cap: $ 1.20 €
Avg. floor: $ 1.14 €
Q4 2020: 63% revenues
Avg. cap: $ 1.19 €
Avg. floor: $ 1.13 €
Q1 2021: 53% revenues
Avg. cap: $ 1.17 €
Avg. floor: $ 1.09 €
Q2 2021: 23% revenues
Avg. cap: $ 1.17 €
Avg. floor: $ 1.10 €

45.7 234
Gross debt Cash Net debt
Leverage as of June 30th 2020 (€ Mn)
322.1
Lease
contracts
556.0
33
€ 234 Mn cash in balance, long-term maturities and no covenants
Financial liability of €45.7 Mn in the Pulp business related to the application of IFRS16 on leases
1. €152 Mn accounted as gross debt and €8 Mn accounted as equity as of June 30th 2020, according to IAS 32
Pulp Business High liquidity and long-term financing without covenants
151.9
18.1 28.459.6
82.2
39.23.9 3.3
5.8
8.1
39.8
70.0
1.32.1
1.9
1.7
38.7
2020 2021 2022 2023 2024<
Debt Maturity Calendar (€ Mn)
23.333.8
67.4
313.8
117.7
€152 Mn Convertible bond 1
€228 Mn Bilateral loans
€70 Mn RCF
€46 Mn IFRS16
€61 Mn Public sector financing

4.7% EBITDA increase was driven by:
27.0% higher energy sales from new
biomass power plants commissioned in
1Q20
Which has offset a 7.1% decline in the
average sale price, down to its regulatory
minimum
Note that the average sale price of 101.7 €/MWh
in 1H19 included an adjustment of 3.8 €/MWh
related to the temporary suspension of the
electricity generation tax in 1Q19 and the attendant
adjustment to the plants Ro with no effect on
EBITDA. Comparable sale price decline would
have been 7.1% or 7.5 €/MWh.
1H20 revenues include € 4.1 Mn from the energy
sales of the new biomass plants during their testing
phase in 1Q20, which have been capitalized
together with their corresponding expenses,
neutralizing their impact in EBITDA
Renewable Energy Business Higher contribution of new biomass power plants offset lower electricity prices
34
EBITDA (€ Mn)
31.7 31.7
49.1 56.0
4.1
1H19 1H20
Ri Pool + Collar + Ro Capitalized
1
101.7 98.0
3.8
1H19 1H20
Average sale price (€/MWh)
2
Revenues (€ Mn)
482,652
612,945
1H19 1H20
Energy Volume (MWh)
+27.0%
25.7 26.9
1H19 1H20
-7.1%
+4.7%+18.7%
1
2

35
Renewable Energy Business Long-term green financing and high liquidity
Energy business leverage at 4.1x Net Debt / LTM EBITDA as of June 2020
Financial liability of €8.9 Mn in the Renewable Energy business related to the application of IFRS16 on leases
8.9108.3
Gross debt Cash Net debt
Leverage:
4.1 x
Leverage as of June 30th 2020 (€ Mn)
217.9
Lease
contracts
326.6
10.1 26.2 27.0 24.9
132.0
4.0 7.9 7.1 8.2
70.0
0.4 0.7 0.3 0.3
7.2
2020 2021 2022 2023 2024<
Debt Maturity Calendar (€ Mn)
€20 Mn RCF – Fully available
€220 Mn Energy parent corporate financing
€97 Mn solar thermal plant project financing
€9 Mn IFRS 16
14.534.8 34.5 33.5
209.1

36
Alternative Performance Measures (APMs)
Pg.1
Ence presents its results in accordance with generally accepted accounting principles, specifically IFRS. In addition, its quarterly earnings report provides certain other
complementary metrics that are not defined or specified in IFRS and are used by management to track the company's performance. The alternative performance measures (APMs)
used in this presentation are defined, reconciled and explained in the corresponding quarterly earnings report publicly available through the investor section of our web page
www.ence.es.
CASH COST
The production cost per tonne of pulp produced, or cash cost, is the key measure used by management to measure its efficiency as a pulp maker.
Cash cost includes of the expenses incurred to produce pulp: timber, conversion costs, corporate overhead, sales and marketing expenses and logistics costs. It excludes fixed-
asset depreciation and forest depletion charges, impairment charges and gains/losses on non-current assets, finance costs/income, income tax and certain operating expenses
which management deems to be non-recurring, such as ad-hoc consultancy projects, Ence's long-term remuneration plan, the termination benefits agreed with staff or certain social
expenses.
As a result, the difference between the average sales price and the cash cost applied to the total sales volume in tonnes yields a figure that is a very close proxy for the EBITDA
generated by the Pulp business.
EBITDA
EBITDA is a measure of operating profit before depreciation, amortization and forestry depletion charges, non-current asset impairment charges, gains or losses on non-current
assets and specific non-ordinary income and expenses unrelated to the ordinary operating activities of the company, which alter their comparability in different periods.
EBITDA is a measure used by the Ence´s management to compare the ordinary results of the company over time. It provides an initial approximation of the cash generated by the
company's ordinary operating activities, before interest and tax payments, and is a measure that is widely used in the capital markets to compare the earnings performances of
different companies.
NORMALISED FREE CASH FLOW
Ence reports normalised free cash flow within the cash flow metrics for each of its two business units in its quarterly earnings report. Normalised FCF is the sum of EBITDA, the
change in working capital, maintenance capital expenditure, net interest payments and income tax payments.

37
Alternative Performance Measures (APMs)
Pg.2
Normalised free cash flow provides a proxy for the cash generated by the company's operating activities before collection of proceeds from asset sales; this cash represents the
amount available for investments other than maintenance capex, for shareholder remuneration and for debt repayment.
MAINTENANCE, EFFICIENCY & GROWTH AND SUSTAINABILITY CAPEX
Ence provides the breakdown of its capital expenditure related cash outflows for each of its business units in its quarterly earnings report, distinguishing between maintenance,
efficiency & growth and sustainability capex.
Maintenance capex are recurring investments designed to maintain the capacity and productivity of the company's assets. Efficiency & growth capex, meanwhile, are investments
designed to increase these assets' capacity and productivity. Lastly, sustainability capex covers investments made to enhance quality standards, occupational health and safety, to
improve the environment and to prevent contamination.
Ence's 2019-2023 Business Plan includes a schedule of the amounts it expects to invest annually in efficiency & growth and sustainability capex in order to attain the strategic
targets set. The disclosure of capex cash flows broken down by area of investment facilitates oversight of execution of the published 2016-2020 Business Plan.
FREE CASH FLOW
Ence reports free cash flow as the sum of its net cash flows from operating activities and its net cash flows from investing activities of its quarterly earnings report.
Free cash flow provides information about the cash generated by the Group's operating activities that is left over after its investing activities for the remuneration of shareholders and
repayment of debt.
NET DEBT
The borrowings recognized on the balance sheet, as detailed in its quarterly earnings report, include bonds and other marketable securities, bank borrowings and other financial
liabilities. They do not however include the measurement of financial derivatives.
Net debt is calculated as the difference between current and non-current borrowings on the liability side of the balance sheet and the sum of cash and cash equivalents and short-
term financial investments on the asset side.
Net debt provides a proxy for the company's indebtedness and is a metric that is widely used in the capital markets to compare the financial position of different companies.

Delivering value
Delivering commitments
80 Overall ESG Score