Embed Size (px)
Citation preview
LEADER INFLUENCE BEHAVIOR FROM THE TARGET’S PERSPECTIVE: A TWO-FACTOR MODEL
BY
KEVIN MULLANEY
THESIS
Submitted in partial fulfillment of the requirements for the degree of Master of Arts in Psychology
in the Graduate College of the University of Illinois at Urbana-Champaign, 2011
Urbana, Illinois
Adviser: Professor Daniel Newman
ABSTRACT
This thesis presents 3 studies that examine the factor structure underlying a target’s perception of
downward influence. Drawing on meta-categorizations of influence tactics previously presented
in the influence literature, Study 1 constructed a set of possible higher-order factor models and
subjected them to competitive tests of model-data fit. The best fitting model was a two factor
model of influence, consisting of: (a) a hard influence factor that includes legitimating, coalition,
and pressure tactics, and (b) a soft influence factor that includes rational persuasion, consultation,
ingratiating, inspirational appeals, exchange, and personal appeals. This factor structure supports
the assertions of previous studies that hard tactics and soft tactics can be differentiated by the
degree to which they either reinforce or threaten the target’s autonomy to choose to comply with
the agent’s request. Study 2 analyzed the incremental validity of the hard factor versus the soft
factor in predicting behavioral outcomes of influence (i.e., soft tactics predict commitment, hard
tactics predict resistance), and further supported the existence of two distinct factors. Study 3
analyzed specific validity of the individual influence tactics in predicting outcome criteria when
controlling for the higher-order factors. This analysis showed that the higher-order factors
accounted for the lion’s share of the predictive validity for behavioral outcomes of influence.
Areas for future modification of the two-factor (hard/autonomy-threatening vs. soft/autonomy-
reinforcing) model of influence tactics are discussed.
ii
To my wife, who does all the hard work and lets me play with ideas
iii
TABLE OF CONTENTS
LIST OF TABLES…………………………………………………………………………. …….v LIST OF FIGURES………………………………………………………………………………vi CHAPTER 1: REVIEW OF INFLUENCE TACTICS RESEARCH………………….…... ……..1
1.1 Early Investigations of Influence Tactics……………………………………… ……..1 1.2 Refining the Structure of Influence……………………………………………..……..3 1.3 Meta-Categories of Influence………………………………………………….. ……..9 1.4 Direction of Influence………………………………………………………………..14 1.5 The Target Perspective of Influence…………………………………………………16
CHAPTER 2: HYPOTHESIZED TWO-FACTOR MODEL OF TARGET PERCEPTIONS
OF LEADER INFLUENCE……………………………………………………….. ……20 CHAPTER 3: OUTCOMES OF INFLUENCE………………………………………………….22 CHAPTER 4: STUDY 1: TESTING META-ANALYTIC FACTOR MODELS OF
TARGET-REPORTED DOWNWARD INFLUENCE……………………………. ……26 4.1 Literature Review and Inclusion Criteria………………………………………. ……26 4.2 Analytic Strategy………………………………………………………………. ……27 4.3 Results………………………………………………………………………….. ……32
CHAPTER 5: STUDY 2: INCREMENTAL VALIDITY OF HARD AND SOFT
INFLUENCE FACTORS………………………………………………………….. ……37 5.1 Method…………………………………………………………………………. ……37 5.2 Data Analysis……………………….………………………………………….. ……38 5.3 Results………………………………………………………………………….. ……39
CHAPTER 6: STUDY 3: ANALYSIS OF THE SPECIFIC VALIDITY OF INDIVIDUAL INFLUENCE TACTICS BEYOND THE TWO HIGHER-ORDER FACTORS…. ……45 6.1 Method…………………………………………………………………………. ……45 6.2 Data analysis…………………………………………………………………… ……45 6.3 Results………………………………………………………………………….. ……46
CHAPTER 7: CONCLUSIONS…………………………………………………………… ……49 7.1 Future Directions………………………………………………………………. ……51 LIST OF REFERENCES…………………………………………………………………... ……53 APPENDIX A……………………………………………………………………………… ……68
iv
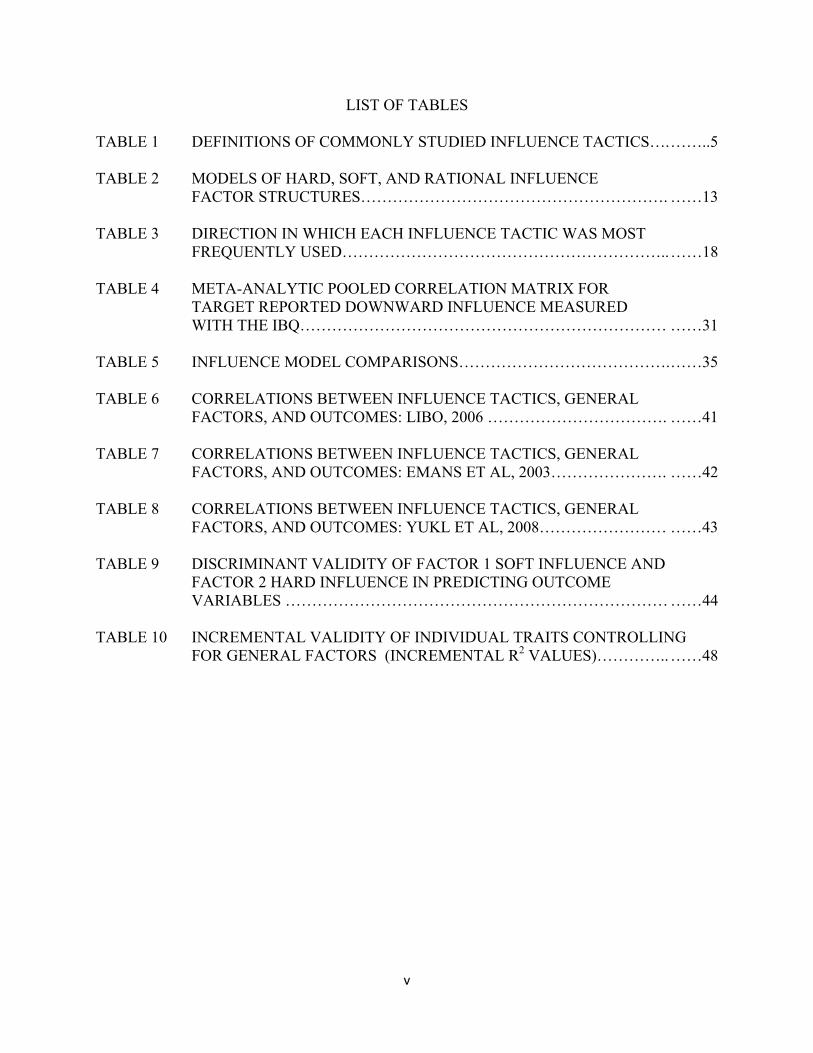
LIST OF TABLES TABLE 1 DEFINITIONS OF COMMONLY STUDIED INFLUENCE TACTICS…. ……..5 TABLE 2 MODELS OF HARD, SOFT, AND RATIONAL INFLUENCE
FACTOR STRUCTURES…………………………………………………. ……13 TABLE 3 DIRECTION IN WHICH EACH INFLUENCE TACTIC WAS MOST FREQUENTLY USED…………………………………………………….. ……18 TABLE 4 META-ANALYTIC POOLED CORRELATION MATRIX FOR
TARGET REPORTED DOWNWARD INFLUENCE MEASURED WITH THE IBQ…………………………………………………………… ……31
TABLE 5 INFLUENCE MODEL COMPARISONS…………………………………. ……35 TABLE 6 CORRELATIONS BETWEEN INFLUENCE TACTICS, GENERAL
FACTORS, AND OUTCOMES: LIBO, 2006 ……………………………. ……41 TABLE 7 CORRELATIONS BETWEEN INFLUENCE TACTICS, GENERAL
FACTORS, AND OUTCOMES: EMANS ET AL, 2003…………………. ……42 TABLE 8 CORRELATIONS BETWEEN INFLUENCE TACTICS, GENERAL
FACTORS, AND OUTCOMES: YUKL ET AL, 2008…………………… ……43 TABLE 9 DISCRIMINANT VALIDITY OF FACTOR 1 SOFT INFLUENCE AND
FACTOR 2 HARD INFLUENCE IN PREDICTING OUTCOME VARIABLES ……………………………………………………………… ……44
TABLE 10 INCREMENTAL VALIDITY OF INDIVIDUAL TRAITS CONTROLLING
FOR GENERAL FACTORS (INCREMENTAL R2 VALUES)………….. ……48
v
vi
LIST OF FIGURES FIGURE 1 THE EVOLUTION OF INFLUENCE TACTICS…. ……………………………..7 FIGURE 2 TWO-FACTOR MODEL OF TARGET-REPORTED DOWNWARD
INFLUENCE ……………………………………………………………………36
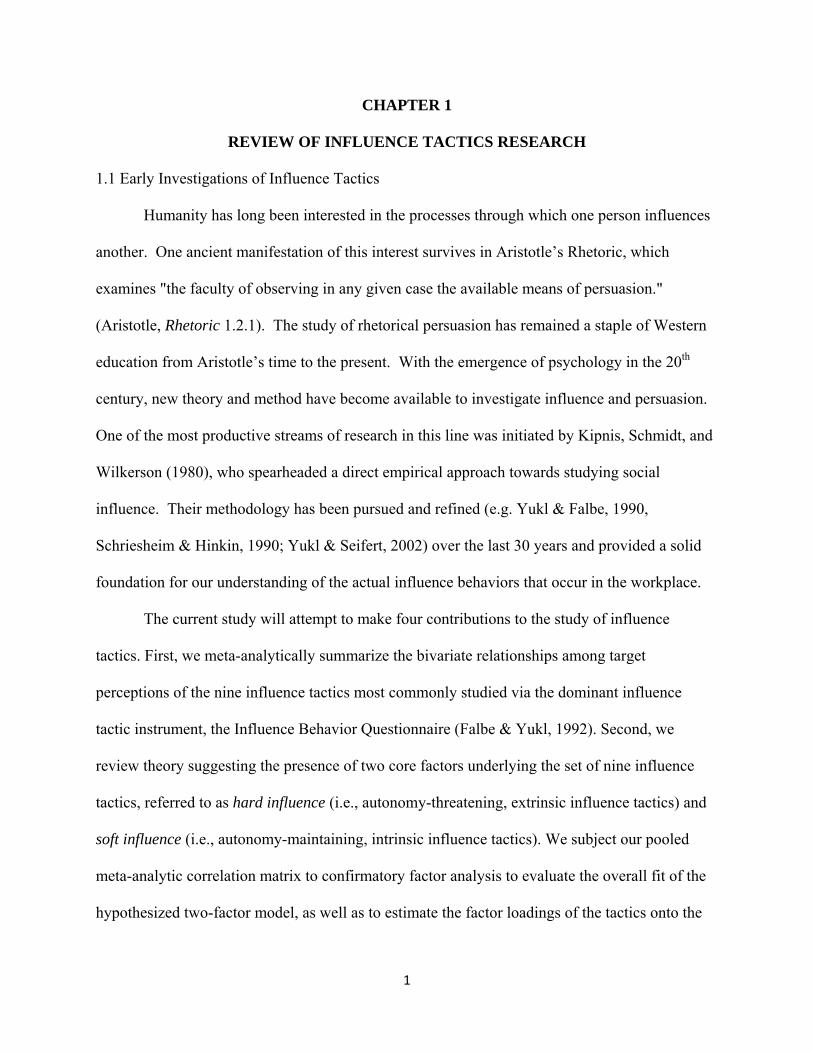
CHAPTER 1
REVIEW OF INFLUENCE TACTICS RESEARCH
1.1 Early Investigations of Influence Tactics
Humanity has long been interested in the processes through which one person influences
another. One ancient manifestation of this interest survives in Aristotle’s Rhetoric, which
examines "the faculty of observing in any given case the available means of persuasion."
(Aristotle, Rhetoric 1.2.1). The study of rhetorical persuasion has remained a staple of Western
education from Aristotle’s time to the present. With the emergence of psychology in the 20th
century, new theory and method have become available to investigate influence and persuasion.
One of the most productive streams of research in this line was initiated by Kipnis, Schmidt, and
Wilkerson (1980), who spearheaded a direct empirical approach towards studying social
influence. Their methodology has been pursued and refined (e.g. Yukl & Falbe, 1990,
Schriesheim & Hinkin, 1990; Yukl & Seifert, 2002) over the last 30 years and provided a solid
foundation for our understanding of the actual influence behaviors that occur in the workplace.
The current study will attempt to make four contributions to the study of influence
tactics. First, we meta-analytically summarize the bivariate relationships among target
perceptions of the nine influence tactics most commonly studied via the dominant influence
tactic instrument, the Influence Behavior Questionnaire (Falbe & Yukl, 1992). Second, we
review theory suggesting the presence of two core factors underlying the set of nine influence
tactics, referred to as hard influence (i.e., autonomy-threatening, extrinsic influence tactics) and
soft influence (i.e., autonomy-maintaining, intrinsic influence tactics). We subject our pooled
meta-analytic correlation matrix to confirmatory factor analysis to evaluate the overall fit of the
hypothesized two-factor model, as well as to estimate the factor loadings of the tactics onto the
1
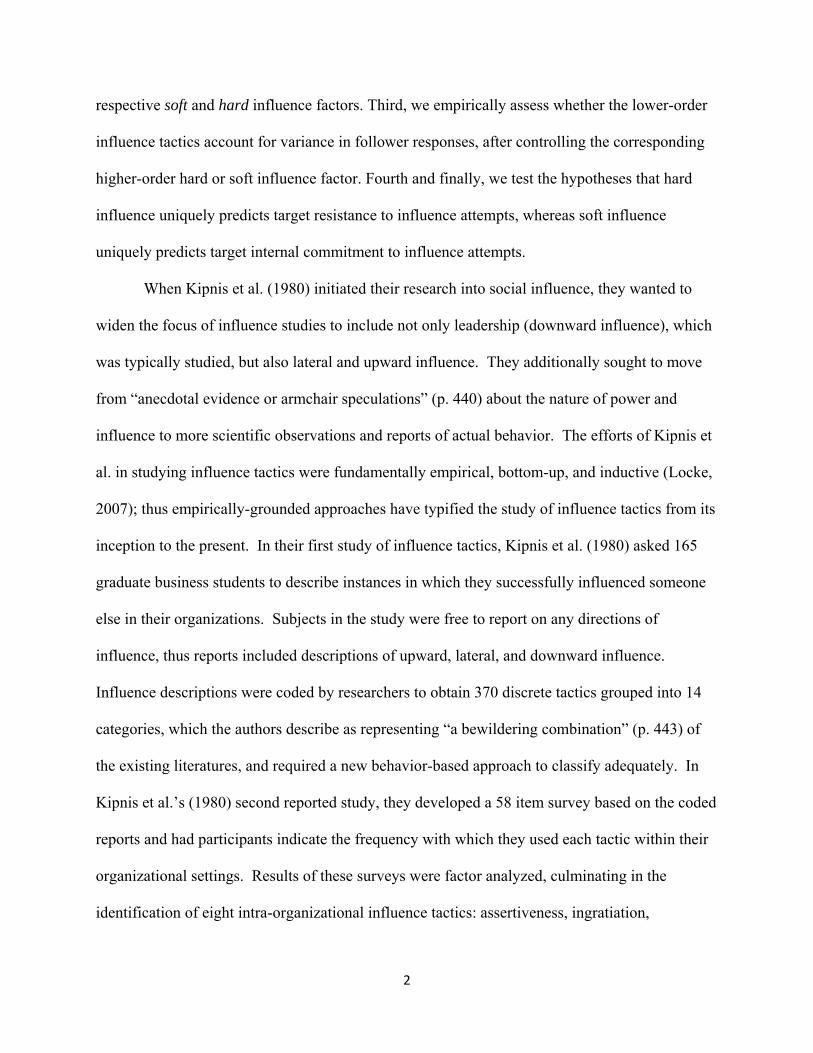
respective soft and hard influence factors. Third, we empirically assess whether the lower-order
influence tactics account for variance in follower responses, after controlling the corresponding
higher-order hard or soft influence factor. Fourth and finally, we test the hypotheses that hard
influence uniquely predicts target resistance to influence attempts, whereas soft influence
uniquely predicts target internal commitment to influence attempts.
When Kipnis et al. (1980) initiated their research into social influence, they wanted to
widen the focus of influence studies to include not only leadership (downward influence), which
was typically studied, but also lateral and upward influence. They additionally sought to move
from “anecdotal evidence or armchair speculations” (p. 440) about the nature of power and
influence to more scientific observations and reports of actual behavior. The efforts of Kipnis et
al. in studying influence tactics were fundamentally empirical, bottom-up, and inductive (Locke,
2007); thus empirically-grounded approaches have typified the study of influence tactics from its
inception to the present. In their first study of influence tactics, Kipnis et al. (1980) asked 165
graduate business students to describe instances in which they successfully influenced someone
else in their organizations. Subjects in the study were free to report on any directions of
influence, thus reports included descriptions of upward, lateral, and downward influence.
Influence descriptions were coded by researchers to obtain 370 discrete tactics grouped into 14
categories, which the authors describe as representing “a bewildering combination” (p. 443) of
the existing literatures, and required a new behavior-based approach to classify adequately. In
Kipnis et al.’s (1980) second reported study, they developed a 58 item survey based on the coded
reports and had participants indicate the frequency with which they used each tactic within their
organizational settings. Results of these surveys were factor analyzed, culminating in the
identification of eight intra-organizational influence tactics: assertiveness, ingratiation,
2
rationality, sanctions, exchange of benefits, upward appeal, blocking, and coalitions (tactic
definitions are provided in Table 1 and the history of tactic development is presented in Figure
1). Scales were constructed for these eight tactics for use in future research and were eventually
consolidated into the Profile of Organizational Influence Strategies (POIS; Kipnis & Schmidt,
1982), which became the predominant measure of organizational influence in psychology
through the rest of that decade.
In the decade after Kipnis et al. (1980) established the baseline set of influence tactics
included in the POIS, several researchers extended their work primarily focusing on the
contextual and individual antecedents of the various tactics of influence. Contextual antecedents
of influence tactics considered in these studies included company ownership, size of company,
position (Erez & Rim, 1982), organizational goals (Kipnis & Schmidt, 1982; Ansaria & Kapoor,
1987), leadership style (Ansaria & Kapoor, 1987; Deluga, 1988 and 1988a), organizational
interdependency (Kale, 1989), and subordinate performance (Ansari, 1989). Individual
antecedents of influence tactics considered in these studies included individual goals (Kipnis &
Schmidt, 1982), gender (Benson & Hornsby, 1988; Ansari, 1989), need for dominance, and self
esteem (Benson & Hornsby, 1988). In addition, Kipnis and Schmidt (1988) consolidated
influence strategies into a typology of four influence types (Shotgun, Tactician, Ingratiator, and
Bystander) and investigated the relationship between these influence types and performance,
salaries, and stress.
1.2 Refining the Structure of Influence
In 1990 there was an inflection point in the study of organizational influence with the publication
of two influential reviews and revisions of the Kipnis et al. (1980) work: Schriesheim and Hinkin
(1990), and Yukl and Falbe (1990). Schriesheim and Hinkin (1990) reviewed the factor structure
3
of the agent-reported upward influence version of Kipnis and Schmidt’s (1982) POIS scale. This
review involved expert ratings of influence dimensionality, and a factor analysis from a new
survey sample in which the authors measured the frequency that subordinates used certain
influence tactics on their bosses. The study concluded that Kipnis et al.’s (1980) original
research may have suffered from distortion due to mixed perspectives of influence (i.e.,
upward/downward/lateral), poor content validity, and poor factor-analytic distinctiveness. To
address these purported weaknesses, Schriesheim and Hinkin (1990) developed a reduced
instrument that eliminated the sanctions and blocking tactics, resulting in a revised POIS
instrument comprising six tactics with three items per tactic. Although they called for additional
research into the POIS using other directions and perspectives, that research call remains largely
unanswered (Yukl, Seifert, & Chavez, 2008). Subsequent studies, especially those reporting
upward influence, have routinely used Schriesheim and Hinkin’s revised POIS scales to study
influence tactics both individually and collectively. Some more recent studies have questioned
the revised scale’s reliability, factor structure (Hochwarter, Harrison, Ferris, Perrewe, & Ralston,
2000), and use of self reports of behavior (Yukl et al., 2008).
Yukl and Falbe (1990) revisited Kipnis et al. (1980) in order to replicate the earlier results using
a different methodology and to incorporate four additional influence behaviors (consultation,
inspirational appeals, personal appeals, and legitimating) taken from the leadership and power
literatures (Yukl et al., 2008). Instead of validating or revising the POIS scale, Yukl and Falbe
(1990) developed an original scale consisting of items derived from Kipnis et al.’s (1980) work
plus the four additional influence behaviors. Using both target and agent reports and the full
range of influence directions (upward, downward, and lateral), their study found stronger
4
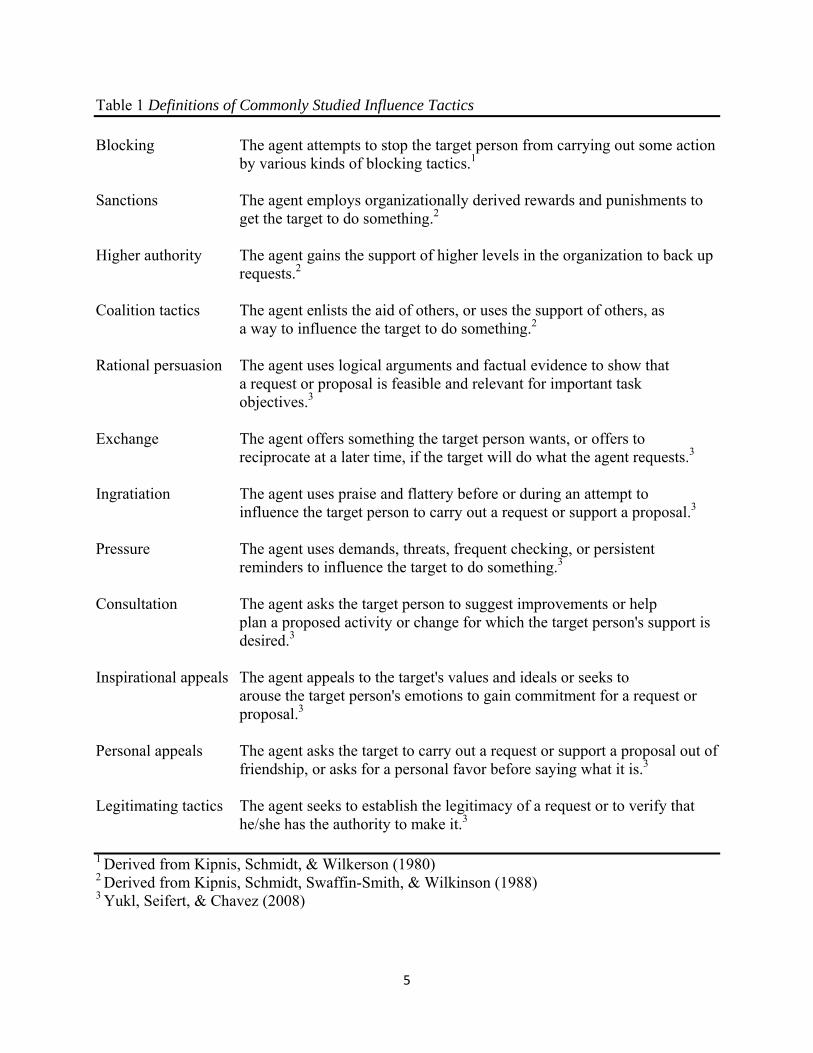
Table 1 Definitions of Commonly Studied Influence Tactics Blocking The agent attempts to stop the target person from carrying out some action
by various kinds of blocking tactics.1
Sanctions The agent employs organizationally derived rewards and punishments to
get the target to do something.2
Higher authority The agent gains the support of higher levels in the organization to back up
requests.2 Coalition tactics The agent enlists the aid of others, or uses the support of others, as
a way to influence the target to do something.2
Rational persuasion The agent uses logical arguments and factual evidence to show that
a request or proposal is feasible and relevant for important task objectives.3
Exchange The agent offers something the target person wants, or offers to
reciprocate at a later time, if the target will do what the agent requests.3
Ingratiation The agent uses praise and flattery before or during an attempt to
influence the target person to carry out a request or support a proposal.3
Pressure The agent uses demands, threats, frequent checking, or persistent
reminders to influence the target to do something.3
Consultation The agent asks the target person to suggest improvements or help
plan a proposed activity or change for which the target person's support is desired.3
Inspirational appeals The agent appeals to the target's values and ideals or seeks to
arouse the target person's emotions to gain commitment for a request or proposal.3
Personal appeals The agent asks the target to carry out a request or support a proposal out of
friendship, or asks for a personal favor before saying what it is.3
Legitimating tactics The agent seeks to establish the legitimacy of a request or to verify that
he/she has the authority to make it.3
1 Derived from Kipnis, Schmidt, & Wilkerson (1980) 2 Derived from Kipnis, Schmidt, Swaffin-Smith, & Wilkinson (1988) 3 Yukl, Seifert, & Chavez (2008)
5
replication of Kipnis et al.’s (1980) results using agent reports and found general consistency in
the frequency of reported tactics used across influence directions. Subsequent studies by Yukl
and colleagues validated the new scale while collapsing the two tactics of upward appeals and
coalitions into a single tactic (Yukl, Lepsinger & Lucia, 1992). Yukl and colleagues’ new scale
was consolidated into the Influence Behavior Questionnaire (IBQ), and has been widely used in
influence research, particularly in studies investigating target reports of downward influence.
The IBQ was later revised to include two additional tactics, apprising and collaboration, based on
the results of exploratory factor analysis of reported tactic use (Yukl & Siefert, 2002). This
evolution of influence tactics is summarized in Figure 1.
Using the IBQ and revised IBQ , Yukl and colleagues investigated a wide variety of the
situational factors affecting influence tactic use and effectiveness, to include direction of
influence (Yukl & Tracey, 1992, Yukl, Falbe, & Yuon, 1993, Yukl, Guinan, & Sottolano, 1995),
patterns of tactic use based on sequencing of attempts (Yukl, Falbe, & Yuon, 1993),
combinations of tactics (Falbe & Yukl (1992), Yukl, Falbe, & Yuon, 1993), objectives of
influence (Yukl, Guinan, & Sottolano, 1995), agent power, situational content factors (Yukl,
Kim, & Falbe, 1996), agent and target perceptions of task importance and feasibility (Yukl, Kim,
& Chavez, 1999), subordinate and multi-source feedback on influence behavior (Seifert, Yukl, &
McDonald, 2003, Seifert & Yukl, 2010), influence behavior coaching (Kochanowski, Seifert, &
Yukl, 2010), leader-member exchange (LMX) (Yukl & Michel, 2006), and variations in
influence tactic effectiveness across cultures (Fu & Yukl, 2000, Yukl, Fu, & McDonald, 2003,
Kennedy, Fu, & Yukl, 2003, Fu, Peng, Kennedy, & Yukl, 2004). These studies employed a wide
variety of methods to study influence, including field studies (e.g. Yukl & Tracey, 1992), lab
studies (e.g. Yukl, Kim, & Chavez, 1999), rater perceptions of influence effectiveness in
6
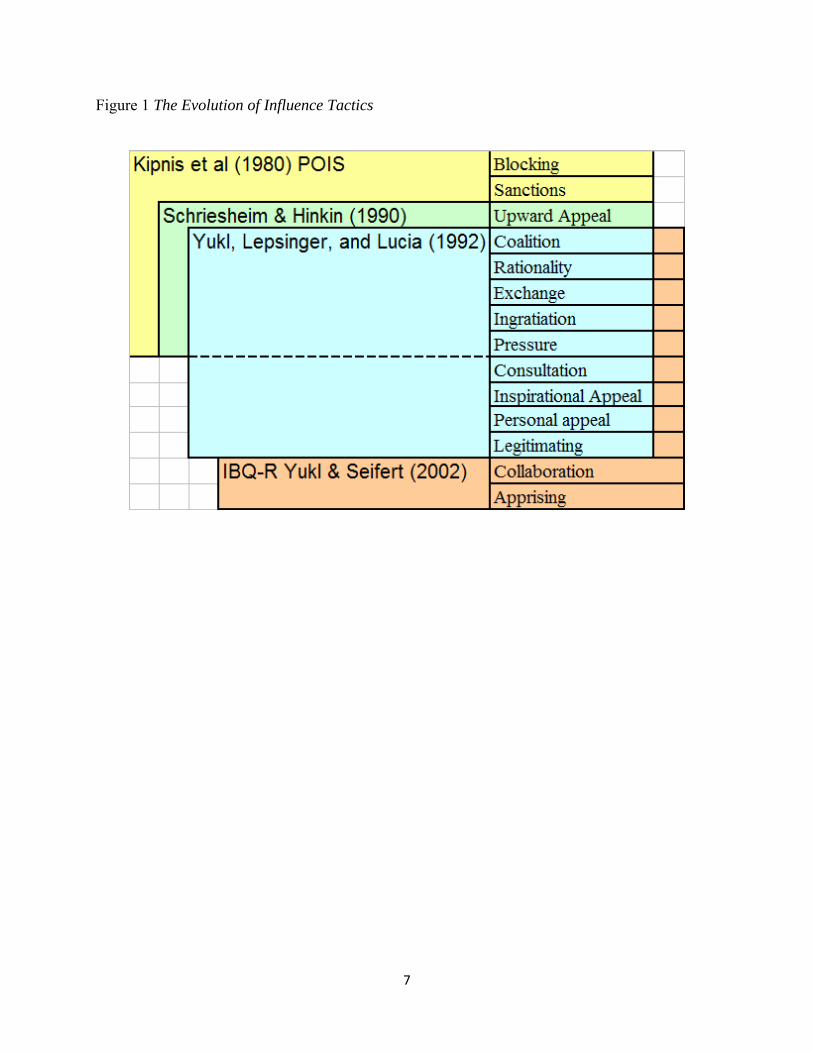
Figure 1 The Evolution of Influence Tactics
7

descriptions of scenarios (e.g. Fu & Yukl, 2000), and frequency surveys (e.g. Yukl, Falbe, &
Youn, 1993).
Influence effectiveness was measured using dependent variables such as target task
commitment and the manager's effectiveness (Yukl & Tracey, 1992), as well as a spectrum of
possible target response behaviors (commitment, compliance, resistance) (Yukl, et al., 1996) and
rater perceptions of expected effectiveness (Fu & Yukl, 2000).
Aside from the aforementioned body of research by Yukl and colleagues, the
measurement of influence tactics since 1990 can be roughly split into four categories: (a) studies
of agent reports of upward influence using Schriesheim and Hinkin’s (1990) variation on the
POIS, (b) studies of target-reported downward influence using the IBQ, (c) studies that select
only a subset of tactics to meet the needs of their particular research, and (d) studies that develop
independent, novel measures of influence. Of the independent measures developed since 1990,
none have gained traction in psychological research to the extent of being used by authors other
than the original developer. The most prominent in this fourth group is a German language
survey developed by Blickle and Gonner (1999) and used in 5 subsequent studies (Blickle,
2000a, 2000b, 2000c, 2003a, 2003b).
Influence tactic research to date has benefitted from a great deal of consistency in the
measures and methods used to conduct the studies. As noted by Yukl and Chavez (2002),
however, one thing this body or research lacks is a comprehensive theory that describes the
underlying psychological processes at work in influence tactics. A key question is whether
influences tactics are perceived to reflect nearly a dozen distinct constructs (e.g., Kipnis et al.,
1980), or rather whether a more parsimonious perspective (e.g., Kelman, 1958 could also be used
to augment our understanding of the downward influence process). Identifying additional tactics
8
that have only local relevance will likely offer only diminishing returns. To advance a theory
explaining the underlying psychological constructs that contribute to the selection and efficacy of
influence tactics, we will attempt a consolidation of the considerable empirical data on influence
tactics that has accrued over the last 30 years. The current study seeks to advance this
consolidation by investigating the higher-order factor structure underlying a specific domain of
influence, namely target-reported downward influence.
1.3 Meta-Categories of Influence
Some work towards consolidating influence tactics into a higher-order structure can be
seen in the use of “meta-categories” of influence (Yukl and Chavez, 2002), which seek to group
subsets of influence tactics into higher-order meta-categories. Several such studies have parsed
influence tactics on theoretical grounds. For instance, Clarke and Ward (2006) grouped
influence tactics on the basis of whether they represented transformational or transactional
leadership behavior. In their estimation, inspirational appeals, consultation, and ingratiation
were transformational whereas rational persuasion, exchange, coalitions, upward appeals, and
pressure where transactional. Tjosvold and Sun (2001) sorted their self-generated list of
influence tactics on the basis of whether they were Gentle Persuasion or Contingent Control. The
most prevalent meta-categorization of influence tactics divides the tactics into categories called
hard, soft and rational strategies, in accordance with research done by Kipnis and Schmidt
(1985). Several explanations have been given to justify the distinction between hard, soft, and
rational categories of influence, ranging from differences between intrinsic and extrinsic
motivation to differences in target empowerment (Yukl & Chavez, 2002). The movement
toward consensus categorization of hard, soft, and rational influence strategies has been
9
somewhat problematic, though, because there is not a dominant theory of influence to guide
consistent tactic assignment to different categories (Yukl & Chavez, 2002).
At first, meta-categories were delineated based on how different tactics grouped together
when measured in various contexts using a variety of dependent variables. Kipnis and Schmidt
(1985) grouped the tactics that they had identified and consolidated in the POIS as hard, soft, and
rational: assertive tactics were hard strategies, friendliness and ingratiation were soft strategies,
while rationality and exchange were rational strategies. Barry and Shapiro (1992) adopted this
categorization scheme in studying the effect of combined tactics on target compliance. Deluga
(1991) modified the categories slightly by adding upward appeals and coalitions to the hard
category. He justified the hard, soft, and rational delineation based on the aims and power bases
available to the agent (e.g., agents use soft tactics when they have little power and are seeking
personal benefits). Falbe and Yukl (1992) provided a clearer description of the differences
between hard and soft tactics. In their description, hard influence tactics employ positional
power and authority, and tend to be used in an impersonal and manipulative way; whereas soft
tactics employ personal power and promote power sharing. They left rationality to be its own
category. Falbe and Yukl used these categories to simplify their analysis of influence tactics
utilized in combinations (they analyzed category combinations instead of individual tactic
combinations). McFarland, Ryan, and Kriska (2002) employed Falbe and Yukl’s (1992) hard,
soft, and rational categories to investigate the use of influence tactics in the course of job
interviews. They asserted that some tactics force compliance while others flatter or convince, but
the relationships between their underlying constructs of positional/personal power,
manipulation/power sharing, and forcing/flattering were not explicitly theorized. Additionally,
10
they claimed that exchange, coalition, and legitimating tactics are neither hard nor soft, yet
provided no additional explanation of how these tactics are related to the identified categories.
Yet another line of research has meta-categorized influence tactics based on empirical
judgments of tactic “strength.” Tepper and Schriesheim (1991) analyzed influence tactics based
on their strength, which they defined as “the extent to which using each of the tactics takes
control over the situation and the target by compelling them to comply and not allowing them the
opportunity to decline.” (Tepper, Brown, & Hunt, 1993, p 1910) Strong tactics thus minimize
the target’s ability to choose freely whether to comply with a request. Based on their analysis,
they rated the tactics from soft to hard in the following order: friendliness (ingratiation), showing
the target what to do, offering to initiate an exchange, rationality, upward appeal, coalitions, and
punitive threats and actions (pressure). Bruins (1999) used a similar categorization logic in
explaining his Power Use Model. He argued that agents select influence tactics mainly based on
the tactic’s softness versus hardness, which is a notion of how much freedom the tactic allows
the target in deciding either to yield or to resist the influence attempt. Although Bruins
conducted and presented empirical investigations that supported this assertion, he unfortunately
died before his results were published. Van Knippenberg, van Eijbergen, & Wilke (1999)
empirically derived hard and soft categories of influence tactics based on a similar concept of
tactic strength. To differentiate hard from soft tactics for their study, they had independent raters
rate the revised POIS tactics in terms of hardness and softness and in terms of friendliness and
unfriendliness. They defined hard tactics as strong tactics that minimize the target’s freedom in
choosing to comply. Assertiveness, blocking and coalition tactics were rated as both hard and
unfriendly; and differed significantly from rational, ingratiation, and exchange tactics, which
were rated as both soft and friendly.
11

12
One of the more theoretically-grounded approaches to influence tactic meta-
categorization was exemplified by Farmer, Maslyn, Fedor, and Goodman (1997), who parsed the
upward influence tactics of the revised POIS into hard, soft, and rational meta-categories based
on Kelman’s (1958) theory of influence outcomes (compliance, internalization, and
identification). They argued that hard tactics (assertiveness, coalition, and upward appeals) are
used when the influencer expects compliance, soft tactics (ingratiation and exchange) are used
when the influencer desires identification (i.e., reinforcement of the target’s role relationship
with the influencer), and rational tactics (rationality) are used when the influencer desires
internalization (i.e., “when an individual accepts influence from another in order to maintain the
congruence of actions and beliefs with his or her own value system”, Kelman, 2006, p 4). They
suggested that exchange can be a hard, soft, or rational tactic depending on the context in which
it is used, and argued that exchange used in upward influence is most appropriately a soft tactic.
Despite the various explanations for grouping tactics into meta-categories, there has been
a good deal of consistency in grouping the tactics into categories labeled hard, soft, and rational.
The tactics that have been consistently grouped as soft tactics are inspirational appeal,
consultation, ingratiation, and personal appeals. The tactics that are consistently identified as
hard tactics are coalitions, legitimating, and pressure. The two ‘wild card’ tactics are rational
persuasion and exchange—which are categorized differently by different researchers. Rational
persuasion is sometimes identified as a category in and of itself, and sometimes it is included as a
soft tactic. Exchange has been variously grouped as a rational tactic, a soft tactic, and a hard
tactic, as was explicated by Farmer et al. (1997). Table 2 provides a summary of the ways that
the influence tactics have been categorized as hard, soft and rational in various studies.

Table 2 Models of Hard, Soft, and Rational Influence Factor Structures Model Rational Tactics Soft Tactics Hard Tactics Representative Studies 1 N/A Inspirational Appeal, Coalitions, van Knippenberg et al. (1999)*
Consultation, Ingratiation, Legitimating, Somech & Drach-Zahavy(2002) Personal appeal, Pressure Emans et al. (2003) Rational Persuasion, Exchange
2 N/A Inspirational Appeal, Coalitions, Consultation, Ingratiation, Legitimating,
Personal appeal, Pressure, Rational Persuasion Exchange
3 Rational Persuasion, Inspirational Appeal, Coalitions, Kipnis & Schmidt (1985)* Exchange Consultation, Ingratiation, Legitimating, Deluga (1991)*
Personal appeal Pressure Barry & Shapiro (1992)* Clarke and Ward (2006)
Berson & Sosik (2007) 4 Rational Persuasion Inspirational Appeal, Coalitions, Farmer et al. (1997)*
Consultation, Ingratiation, Legitimating, Personal appeal, Pressure
Exchange 5 Rational Persuasion Inspirational Appeal, Coalitions, Falbe & Yukl (1992)
Consultation, Ingratiation, Legitimating, Tepper et al. (1998) Personal appeal Pressure, Exchange Enns & McFarlin (2005)
* Study uses only tactics from revised POIS: assertiveness (pressure), exchange, ingratiation, rationality, coalition, and upward appeal (coalition)
13
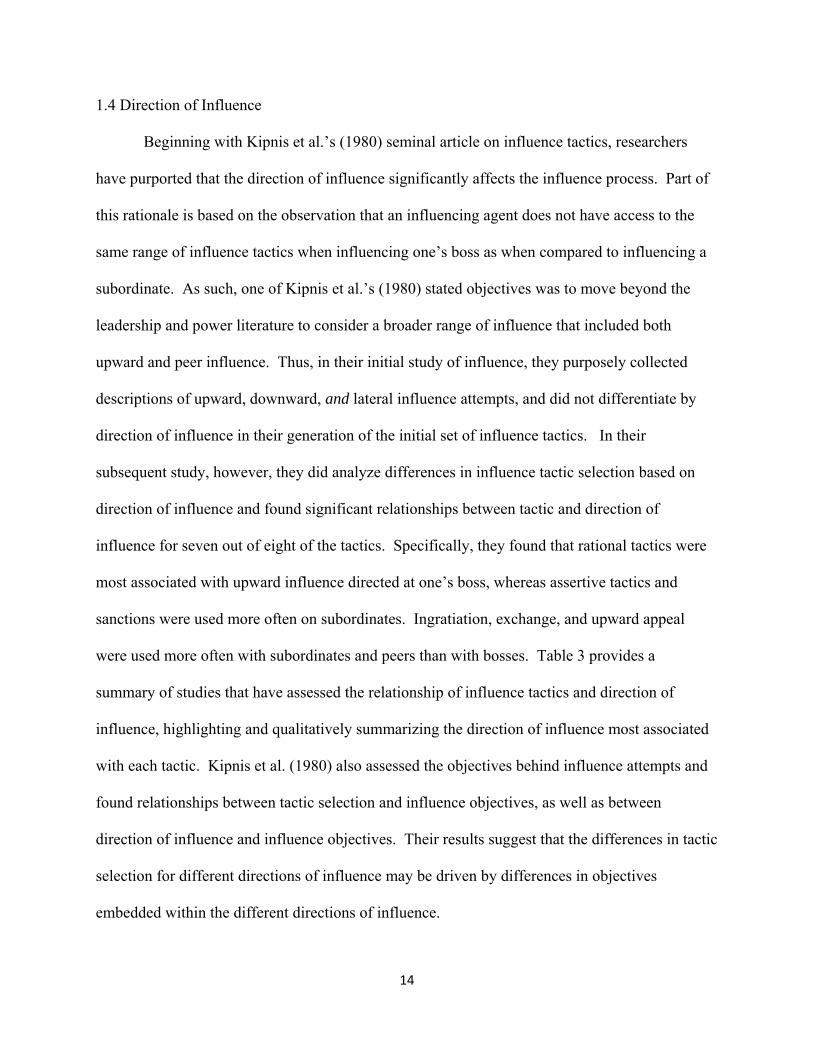
1.4 Direction of Influence
Beginning with Kipnis et al.’s (1980) seminal article on influence tactics, researchers
have purported that the direction of influence significantly affects the influence process. Part of
this rationale is based on the observation that an influencing agent does not have access to the
same range of influence tactics when influencing one’s boss as when compared to influencing a
subordinate. As such, one of Kipnis et al.’s (1980) stated objectives was to move beyond the
leadership and power literature to consider a broader range of influence that included both
upward and peer influence. Thus, in their initial study of influence, they purposely collected
descriptions of upward, downward, and lateral influence attempts, and did not differentiate by
direction of influence in their generation of the initial set of influence tactics. In their
subsequent study, however, they did analyze differences in influence tactic selection based on
direction of influence and found significant relationships between tactic and direction of
influence for seven out of eight of the tactics. Specifically, they found that rational tactics were
most associated with upward influence directed at one’s boss, whereas assertive tactics and
sanctions were used more often on subordinates. Ingratiation, exchange, and upward appeal
were used more often with subordinates and peers than with bosses. Table 3 provides a
summary of studies that have assessed the relationship of influence tactics and direction of
influence, highlighting and qualitatively summarizing the direction of influence most associated
with each tactic. Kipnis et al. (1980) also assessed the objectives behind influence attempts and
found relationships between tactic selection and influence objectives, as well as between
direction of influence and influence objectives. Their results suggest that the differences in tactic
selection for different directions of influence may be driven by differences in objectives
embedded within the different directions of influence.
14
In their review of Kipnis et al. (1980), Yukl and Falbe (1990) found similar patterns of
directional effects (i.e., mean differences in tactic use across directions of influence) for
ingratiation, upward appeal, exchange and pressure. Yukl and Tracey (1992) verified the
directional results of Yukl and Falbe (1990) with a larger sample that allowed for more
resolution to better discriminate differences in tactic use. As a result, they found that rational
persuasion was used significantly more often in upward influence than downward or lateral, that
ingratiation was used most in downward influence, and that personal appeals, coalitions, upward
appeals, and exchange were used most in lateral influence. Yukl, Guinan, and Sottolano (1995)
extended the original Kipnis et al. (1980) studies by examining the relationships between
influence tactics, influence objectives, and directions of influence. They found a complex
relationship between tactics, objectives, and directions of influence. Tactics such as pressure
were used for different reasons in different directions (i.e., pressure was used to obtain personal
benefits from bosses, but was used to assign work to and to change the behavior of subordinates).
Thus, differences in tactic use between directions of influence cannot be completely explained by
the objective of the influence attempt.
Although studies of influence have consistently found similar effects of the direction of
influence on tactic selection (see Table 3), these effects pale in comparison to the unconditional
differences in frequency of use between tactics. As Yukl and Falbe (1990) found and Yukl and
Tracey (1992) reiterated, some tactics are used much more frequently than other tactics
regardless of the direction of influence. Specifically, rational persuasion, consultation,
inspirational appeals, and ingratiation were used far more frequently than other tactics, regardless
of direction of influence. Yukl, Falbe, and Yuon (1993) provide a clear demonstration of the
significant preeminence of some tactics over others. In their study of 1,094 influence incidents,
15
rational persuasion was used in 52% of all downward influence attempts, 56% of all lateral
influence attempts, and 74% of all upward influence attempts. The highest percentage that any
other tactic was used in any direction was the downward use of pressure, which was used in 22%
of downward influence attempts. So, while it is true that rational persuasion is used more often
in upward influence than downward influence, and pressure is used more often in downward
influence than upward influence, one cannot lose sight of the fact that rational persuasion is used
more than twice as often as pressure, even in downward influence. One must resist the urge to
over-interpret the results of direction of influence on tactic selection, and avoid concluding, for
instance, that upward influence typically employs rational persuasion and downward influence
typically employs pressure. Instead, the results of Yukl, Falbe and Youn (1993) suggest that
most influence attempts employ rational persuasion, regardless of direction.
Thus, Kipnis et al.’s (1980) desire to expand the domain of influence research has yielded
fruit in that we now know quite a bit that we didn’t know about specific influence behaviors and
when they are used (e.g., tactic choice differs depending on the direction of influence). Bundling
all directions of influence into a single research domain of “influence tactics” is sometimes
effective as an empirical approach, but it is not necessarily useful when attempting to theorize a
model to explain how various tactics are perceived by, and affect the attitudes and behaviors of,
the targets of influence. The current study will limit its focus to a single direction of influence:
downward influence on a subordinate. This approach hopes to isolate the specific psychological
constructs relevant to subordinates who experience influence.
1.5 The Target Perspective of Influence
Erez, Rim, and Keider (1986) identified that, in addition to direction of influence,
researchers must account for the perspective of the person being influenced. Their work
16
supported the hypothesis that targets of influence are motivated to maintain their sense of
agency. Their study collected reports of influence from both agents and targets of influence
using Kipnis et al.’s (1980) influence tactics and additional data on five possible reasons that the
influence attempts were made. They then factor analyzed the items from Kipnis et al. (1980) and
derived nine factors that are not entirely in line with the POIS, but are generally interpretable in
the current discussion. They found that both agents and targets of influence focus on their own
agency when describing which influence tactics are used and why. Agents described using
strong tactics (rationality, assertiveness, blocking, and sanctions) and saw themselves as the
prime mover in the influence event. Thus, they described the reason for influence as ‘getting
targets to do their job,’ ‘improving performance’ and ‘initiating change’ (p. 30). Targets
similarly highlighted their own autonomy in describing influence attempts. Targets were more
likely to describe agents as using weaker tactics (ingratiation/manipulation, exchange, and
passive blocking) that are more dependent on target acquiescence. Likewise, targets saw
themselves as the central reason for the influence attempt and were more likely to describe the
reasons for influence as ‘to be asked for assistance on agent’s job’ (p. 30).
Xin and Tsui (1996) found similar results as Erez et al. (1986). They investigated
matched pairs of agents and targets rating the same influence relationship from dual perspectives.
Comparisons of agent and target reports of influence behavior in the study indicated that agents
felt that they had used influence tactics more often than their targets perceived, and this was true
for 5 of the 6 influence tactics measured. In other words, agents felt as though they were actively
influencing targets when targets did not feel as though they were being influenced. Targets did
not credit the agent as being the cause of their actions. Blickle (2003) likewise demonstrated low
17

Table 3 Direction In Which Each Influence Tactic Was Most Frequently Used Erez, Yukl, Kipnis Rim, & Yukl & Yukl & Falbe, Xin &
et al, Keider, Falbe, Tracey, & Youn, Tsui, Influence Tactic 1980 1986 1990 1992 1993 1996* Rational Persuasion ↑ ↑ ↑ ↑ Inspirational Appeal ↓ ↓ ↓ Consultation ↓/↔ Ingratiation ↓/↔ ↓, ↔ ↓ ↓/↔ ↓ Personal appeal ↔ ↔ Coalition ↔ ↔ ↔/↑ ↑ Upward Appeal ↓/↔ ↓/↔ ↓/↔ ↑ Legitimating ↔ ↓/↔ Exchange ↓/↔ ↔/↑ ↓/↔ ↔ ↓/↔ ↓ Pressure ↓ ↓ ↓
Assertiveness ↓ ↓ ↓ Sanctions ↓ ↓ Blocking ↔
Arrows indicate that the given tactic was used significantly more often in the indicated direction * Xin & Tsui (1996) sample only included upward and downward influence attempts
18
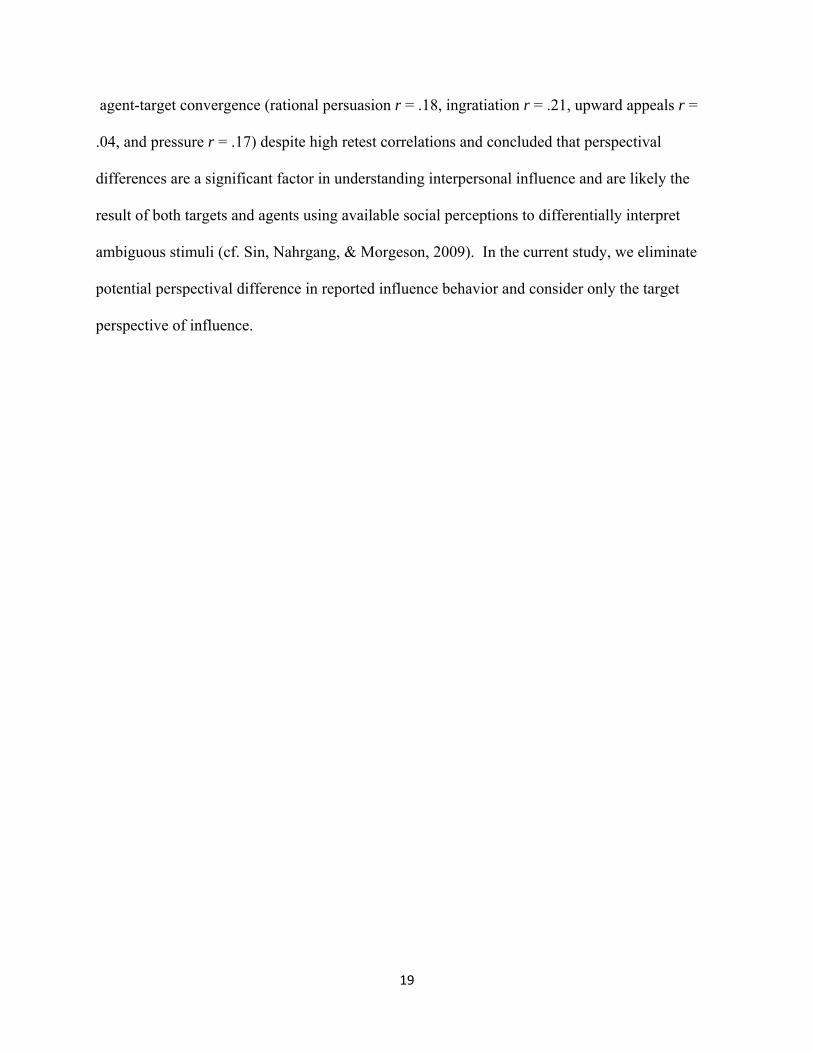
agent-target convergence (rational persuasion r = .18, ingratiation r = .21, upward appeals r =
.04, and pressure r = .17) despite high retest correlations and concluded that perspectival
differences are a significant factor in understanding interpersonal influence and are likely the
result of both targets and agents using available social perceptions to differentially interpret
ambiguous stimuli (cf. Sin, Nahrgang, & Morgeson, 2009). In the current study, we eliminate
potential perspectival difference in reported influence behavior and consider only the target
perspective of influence.
19
CHAPTER 2
HYPOTHESIZED TWO-FACTOR MODEL OF TARGET PERCEPTIONS OF LEADER
INFLUENCE
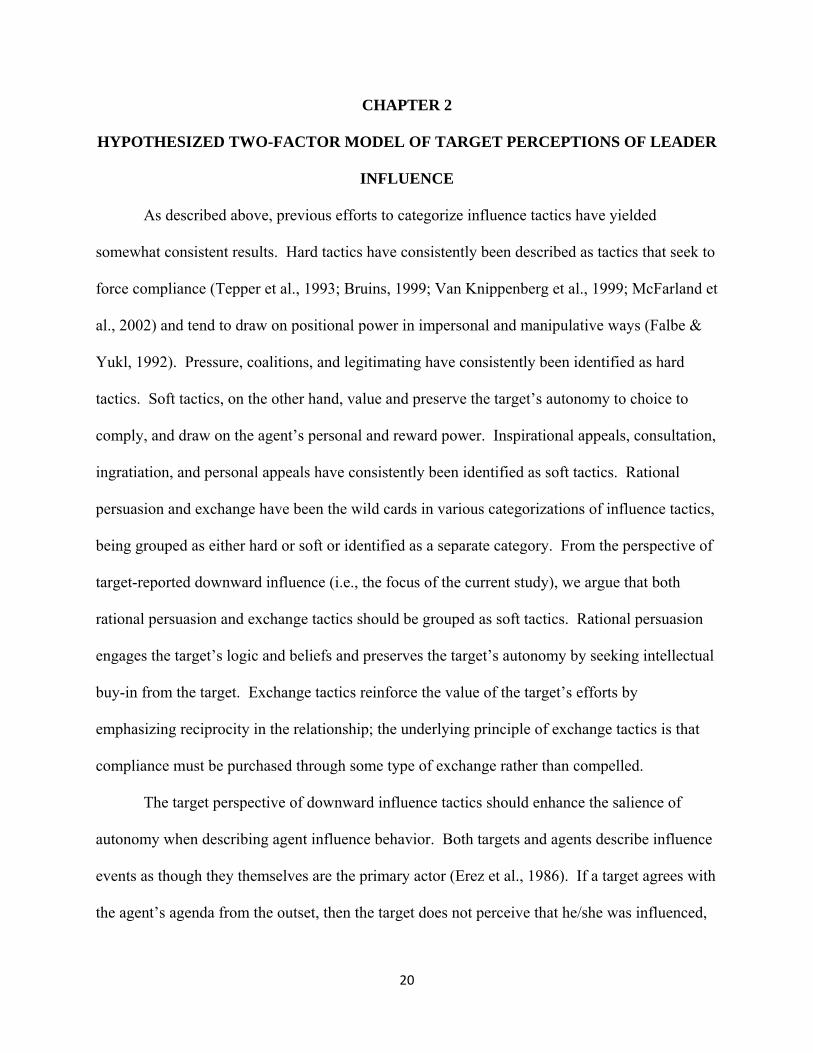
As described above, previous efforts to categorize influence tactics have yielded
somewhat consistent results. Hard tactics have consistently been described as tactics that seek to
force compliance (Tepper et al., 1993; Bruins, 1999; Van Knippenberg et al., 1999; McFarland et
al., 2002) and tend to draw on positional power in impersonal and manipulative ways (Falbe &
Yukl, 1992). Pressure, coalitions, and legitimating have consistently been identified as hard
tactics. Soft tactics, on the other hand, value and preserve the target’s autonomy to choice to
comply, and draw on the agent’s personal and reward power. Inspirational appeals, consultation,
ingratiation, and personal appeals have consistently been identified as soft tactics. Rational
persuasion and exchange have been the wild cards in various categorizations of influence tactics,
being grouped as either hard or soft or identified as a separate category. From the perspective of
target-reported downward influence (i.e., the focus of the current study), we argue that both
rational persuasion and exchange tactics should be grouped as soft tactics. Rational persuasion
engages the target’s logic and beliefs and preserves the target’s autonomy by seeking intellectual
buy-in from the target. Exchange tactics reinforce the value of the target’s efforts by
emphasizing reciprocity in the relationship; the underlying principle of exchange tactics is that
compliance must be purchased through some type of exchange rather than compelled.
The target perspective of downward influence tactics should enhance the salience of
autonomy when describing agent influence behavior. Both targets and agents describe influence
events as though they themselves are the primary actor (Erez et al., 1986). If a target agrees with
the agent’s agenda from the outset, then the target does not perceive that he/she was influenced,
20
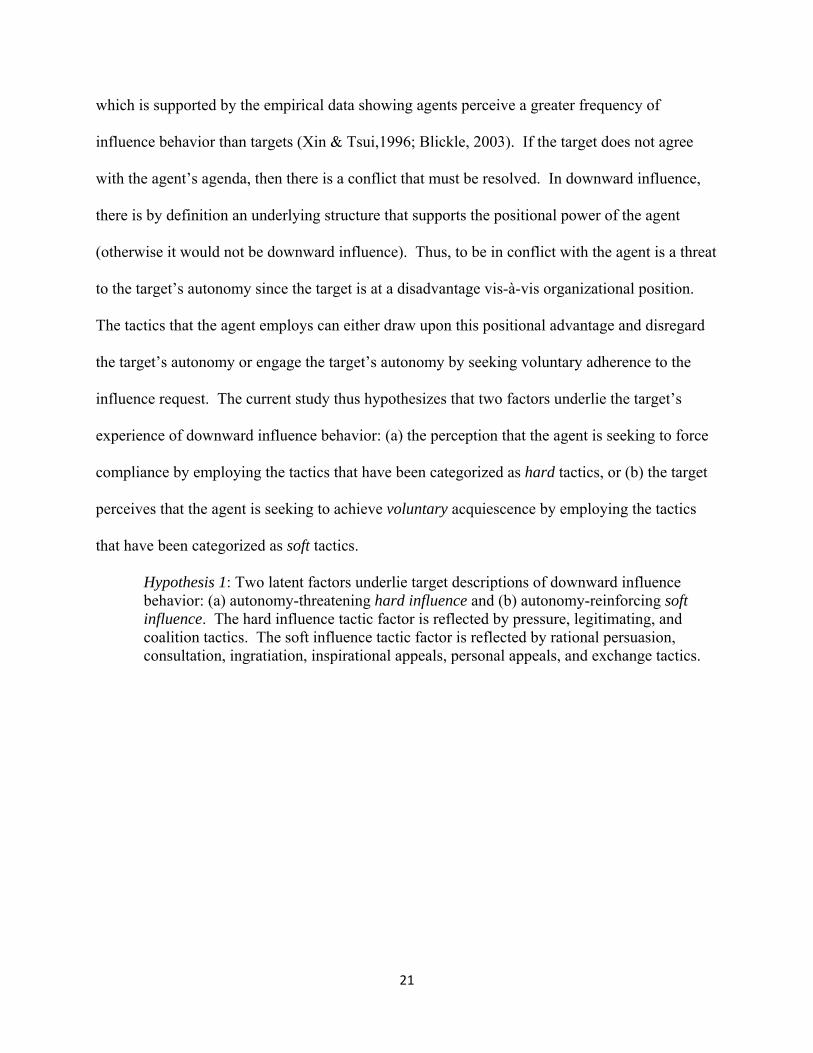
which is supported by the empirical data showing agents perceive a greater frequency of
influence behavior than targets (Xin & Tsui,1996; Blickle, 2003). If the target does not agree
with the agent’s agenda, then there is a conflict that must be resolved. In downward influence,
there is by definition an underlying structure that supports the positional power of the agent
(otherwise it would not be downward influence). Thus, to be in conflict with the agent is a threat
to the target’s autonomy since the target is at a disadvantage vis-à-vis organizational position.
The tactics that the agent employs can either draw upon this positional advantage and disregard
the target’s autonomy or engage the target’s autonomy by seeking voluntary adherence to the
influence request. The current study thus hypothesizes that two factors underlie the target’s
experience of downward influence behavior: (a) the perception that the agent is seeking to force
compliance by employing the tactics that have been categorized as hard tactics, or (b) the target
perceives that the agent is seeking to achieve voluntary acquiescence by employing the tactics
that have been categorized as soft tactics.
Hypothesis 1: Two latent factors underlie target descriptions of downward influence behavior: (a) autonomy-threatening hard influence and (b) autonomy-reinforcing soft influence. The hard influence tactic factor is reflected by pressure, legitimating, and coalition tactics. The soft influence tactic factor is reflected by rational persuasion, consultation, ingratiation, inspirational appeals, personal appeals, and exchange tactics.
21

CHAPTER 3
OUTCOMES OF INFLUENCE
Theory about the outcomes of leader influence tactics (Falbe & Yukl, 1992; Yukl, 1994;
Yukl & Tracey, 1992; Yukl et al., 1996; Aguinis & Adams, 1998) has repeatedly emphasized
three key responses to an influence attempt. These three behavioral responses to influence are
labeled commitment, compliance, and resistance. Commitment occurs “when a target person
agrees internally with an action or decision, is enthusiastic about it, and is likely to exercise
initiative and demonstrate unusual effort and persistence in order to carry out the request
successfully” (Falbe & Yukl, 1992, p. 639). Compliance occurs “when an individual accepts
influence from another person or a group in order to attain a favorable reaction from the other—
either to gain a specific reward or avoid a specific punishment controlled by the other, or to gain
approval or avoid disapproval from the other” (Kelman, 2006, p. 3). Resistance occurs “when
the target person is opposed to the requested action and tries to avoid doing it by refusing,
arguing, delaying, or seeking to have the request nullified” (Falbe & Yukl, 1992, p. 640).
Given our above hypothesis that leader downward influence tactics are perceived by
target subordinates as reflecting two underlying factors—autonomy-reinforcing soft influence
and autonomy-threatening hard influence—we now theorize that these two higher-order
influence factors will relate differentially to the tripartite model of influence outcomes
(commitment, compliance, and resistance; Falbe & Yukl, 1992).
If targets of downward influence perceive that their autonomy is being undermined, they
are more likely to act to protect and preserve that autonomy (Lawrence & Robinson, 2007)).
Because targets of downward influence are positionally subordinated, when they experience hard
tactics, the only means through which they can exert their autonomy is by resisting the agent’s
22
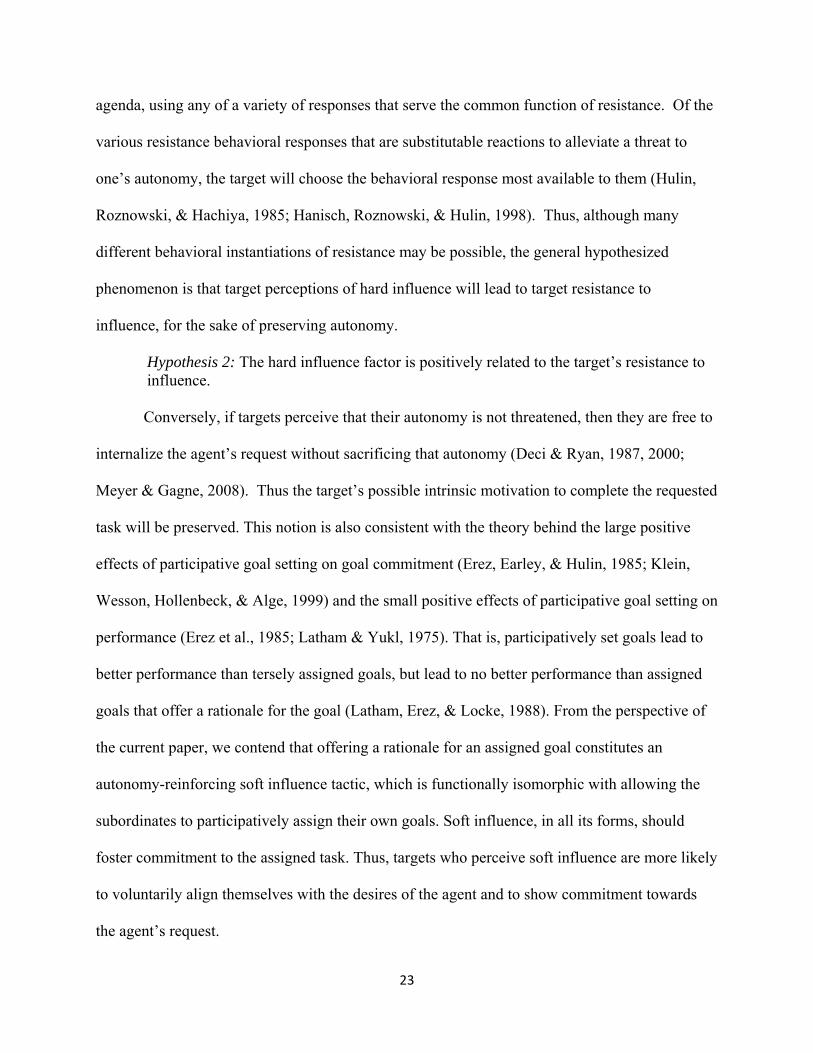
agenda, using any of a variety of responses that serve the common function of resistance. Of the
various resistance behavioral responses that are substitutable reactions to alleviate a threat to
one’s autonomy, the target will choose the behavioral response most available to them (Hulin,
Roznowski, & Hachiya, 1985; Hanisch, Roznowski, & Hulin, 1998). Thus, although many
different behavioral instantiations of resistance may be possible, the general hypothesized
phenomenon is that target perceptions of hard influence will lead to target resistance to
influence, for the sake of preserving autonomy.
Hypothesis 2: The hard influence factor is positively related to the target’s resistance to influence.
Conversely, if targets perceive that their autonomy is not threatened, then they are free to
internalize the agent’s request without sacrificing that autonomy (Deci & Ryan, 1987, 2000;
Meyer & Gagne, 2008). Thus the target’s possible intrinsic motivation to complete the requested
task will be preserved. This notion is also consistent with the theory behind the large positive
effects of participative goal setting on goal commitment (Erez, Earley, & Hulin, 1985; Klein,
Wesson, Hollenbeck, & Alge, 1999) and the small positive effects of participative goal setting on
performance (Erez et al., 1985; Latham & Yukl, 1975). That is, participatively set goals lead to
better performance than tersely assigned goals, but lead to no better performance than assigned
goals that offer a rationale for the goal (Latham, Erez, & Locke, 1988). From the perspective of
the current paper, we contend that offering a rationale for an assigned goal constitutes an
autonomy-reinforcing soft influence tactic, which is functionally isomorphic with allowing the
subordinates to participatively assign their own goals. Soft influence, in all its forms, should
foster commitment to the assigned task. Thus, targets who perceive soft influence are more likely
to voluntarily align themselves with the desires of the agent and to show commitment towards
the agent’s request.
23
Hypothesis 3: The soft influence tactic factor is positively related to the target’s commitment to the influence attempt. In contrast to target resistance and commitment, target compliance in response to an
agent’s influence attempt will likely vary based on the situation, specifically the factors that
render the situation more or less favorable for the leader (Festinger, 1953; Raven, 1993). Strong
positional power of the agent, good relations between the leader and the member, and a well-
defined task would likely promote target compliance, whereas weak positional power, poor
relations and an ill defined task would likely promote non-compliance (Fiedler, 1971). Since
these situational variables have not been consistently measured in influence tactic research, it is
likely that any group of influence tactic studies represents a range of possible situations which
afford various levels of compliance in response to either hard or soft influence. Further, because
attaining target compliance is the putative primary function of all influence tactics, it makes
sense that any tactic consistently in use by agents would attain some level of compliance, lest it
become extinguished due to ineffectiveness. That is, reinforcement theory would explain that for
an influence tactic to attain repeated use it would need to garner some threshold level of target
compliance. Thus, both hard and soft influence are likely capable of achieving target compliance,
although the magnitude of the relationship is likely dependent upon unmeasured situational
variables.
Hypothesis 4: Both (a) the hard influence factor and (b) the soft influence factor predict target compliance with the influence attempt. Although both hard and soft influence should successfully achieve target compliance, soft
influence demonstrates greater respect for the target’s autonomy and thereby supports the
formation of a reciprocal working relationship. Thus, target perceptions of soft influence should
predict a positive (more caring and autonomy-reinforcing, less coercive) working relationship.
24
One common measure of working relationships in leader-follower dyads is Leader Member
Exchange (LMX: Dulebohn, Bommer, Liden, Brouer, & Ferris, in press; Scandura & Graen,
1984). LMX theory argues that relationships between leaders and subordinates are generated
through social exchanges (Cashman, Dansereau, Graen, & Haga, 1976; Liden, Wayne, &
Stilwell, 1993). High quality relationships are typified by healthy exchange relationships that are
based on trust and do not require exacting and immediate compliance (Tepper, Uhl-Bien, Kohut,
et al., 2006). Soft influence includes tactics engage in the exchange of ideas (rational persuasion,
consultation), values (inspirational appeals), social esteem (ingratiation, personal appeals), and
material goods (exchange); whereas hard influence foregoes exchange and instead employs
social force (coalitions) and legal/formal force (legitimating, pressure) to achieve conformity.
Thus, soft influence should positively predict LMX relationships.
Hypothesis 5: The soft influence factor positively predicts positive LMX relationship
quality.
25
CHAPTER 4
STUDY 1: TESTING META-ANALYTIC FACTOR MODELS OF TARGET-
REPORTED DOWNWARD INFLUENCE
The current study uses meta-analysis to assess the higher-order factors underlying how
targets perceive downward influence behavior, as measured by the Influence Behavior
Questionnaire (IBQ: Yukl & Falbe, 1990). The IBQ assesses nine different influence tactics:
rational persuasion, inspirational appeal, consultation, ingratiation, exchange, personal appeal,
coalitions, legitimating, and pressure (see Table 1 for definitions of each tactic). Two tactics
(apprising and collaboration) were more recently added to the IBQ (Yukl, Chavez, & Seifert,
2005), and could not be included in this analysis due to the paucity of data including these
tactics.
4.1 Literature Review and Inclusion Criteria
To identify studies appropriate for this meta-analytic study, a search was conducted using
PsycINFO with PsycARTICLES for all articles with the keyword “influence tactics”, resulting in
a total of 287 articles identified. Because we were targeting studies that used the Influence
Behavior Questionnaire (IBQ), an additional search for all articles that cited key papers by Yukl
and colleagues (Yukl & Falbe, 1990; Falbe & Yukl, 1992; Yukl, Lepsinger, Lucia, 1992; Yukl, &
Tracey, 1992; Yukl, & Seifert, 2002; Yukl, Chavez, & Seifert, 2005) was conducted using the Social
Sciences Citation Index, identifying a total of 177 articles. All articles identified by these
searches were thoroughly reviewed for necessary information. Articles that reported inter-
correlations among influence tactics were coded for direction of reported influence (upward,
downward, or lateral), perspective of report (agent or target of influence), and influence tactic
measure employed. Articles were included in the meta-analysis if they contained at least three
26
tactics measured by the IBQ. Sixteen studies were identified that provided correlations of target-
reported downward influence using the IBQ.
4.2 Analytic Strategy
A meta-analysis of the inter-correlations amongst the nine IBQ leader influence tactics
(rational persuasion, consultation, inspirational appeal, ingratiation, personal appeal, coalitions,
exchange, legitimating, and pressure) was conducted. This meta-analysis was based upon the 16
articles that used the IBQ to measure target reports of downward influence, and entailed the
meta-analytic calculation of 36 separate bivariate correlations, corresponding to the associations
amongst the nine influence tactics enumerated above. Our goal was to use these 36 meta-analytic
effects as input for multi-variable/structural equation modeling—a practice recommended by
Viswesvaran and Ones (1995) and Shadish (1996), and exemplified by Bhaskar-Shrinivas,
Harrison, Shaffer, and Luk (2005); Colquitt, Conlon, Wesson, Porter, & Ng (2001); Colquitt,
Lepine, and Noe (2000); Conway (1999); LePine, Podsakoff, and LePine (2005); Meriac,
Hoffman, Woehr, and Fleisher (2008); Podsakoff, Whiting, Podsakoff, and Blume (2009);
Thoresen, Kaplan, Barsky, Warren, and De Chermont (2003); and many others.
One possible complication with performing multi-variable analyses and/or structural
equation modeling on a meta-analytic correlation matrix is the pairwise deletion problem: each
bivariate correlation in the correlation matrix is based on a different subsample, usually with a
different sample size (Marsh, 1998; Newman, Jacobs, & Bartram, 2007). So if a meta-analytic
factor analysis involves 9 variables, there are 36 different bivariate meta-analyses included, each
with a different N (i.e., 36 different N’s). By choosing any particular sample size for the overall
analysis (e.g., harmonic mean N, Viswesvaran & Ones, 1995), the researcher is by necessity
misrepresenting the precision of some of the bivariate effects (this issue has been discussed by
27
Furlow & Beretvas, 2005; Marsh, 1998; Newman, 2003; and Viswesvaran & Ones, 1995).
Fortunately, Cheung and Chan (2005, 2009) have recently demonstrated an elegant solution to
the problem of meta-analytic SEM. The approach, known as Two Stage Structural Equation
Modeling (TSSEM), maximizes the benefits of both univariate and multivariate meta-analytic
approaches. A univariate approach is first used to estimate pooled correlations, which are like
sample-size weighted average correlations across the datasets. These pooled correlations are
estimated by imposing equality constraints on each correlation across the primary study samples,
using the LISREL 8.7 (Joreskog & Sorbom, 2004) multigroup SEM routine. The input data file
and syntax for this routine are available in Appendix A.
Further, an asymptotic covariance matrix is estimated that corresponds to the meta-
analytic pooled correlation matrix. This asymptotic covariance matrix captures the variation and
covariation resulting from disparate sample sizes of the various correlations. This asymptotic
covariance matrix is then used as the weighting matrix in the second stage of analysis when
fitting the structural equation model. In other words, the program treats each meta-analytic
correlation as though it is based upon a different sample size (which, in fact, it is). Using this
approach eliminates inflation of the chi squared statistic and allows for more accurate model
fitting (Cheung & Chan, 2005, 2009). The TSSEM software that facilitates this analysis is
provided by Cheung (http://courses.nus.edu.sg/course/psycwlm/internet/tssem.zip). An intuitive
example of this approach was provided by Fan, Jackson, Yang, Tang, & Zhang (2010), who also
conducted confirmatory factor analysis on meta-analytic subscale correlations from a standard
psychometric instrument, as done in the current paper.
28
4.2.1 Homogeneity of Correlation Matrices
Using the TSSEM technique, the homogeneity of correlation matrices across all studies was first
tested. This technique accounts for missing correlation data and calculates the pooled correlation
and covariance matrices for all groups using the TSSEM software and LISREL 8.7. For this
analysis, the sixteen data sets collected from the identified studies were formatted as symmetric
correlation matrices in a single data file. Syntax was prepared for TSSEM input which identified
the number of subjects and subset of variables in each data set (note: TSSEM can accept either
symmetric or full matrices as input). Using this input, the TSSEM program generated the
LISREL syntax required to calculate the pooled correlation matrix by constraining the
standardized correlations across studies. The pooled common correlation matrix was then used
as the constrained model to test the homogeneity of constituent matrices (the unconstrained
models), using a chi-square difference test and the comparative fit index (CFI; Bentler, 1990). In
addition to the pooled correlation matrix, LISREL generates the asymptotic covariance matrix,
which is used as the weighting matrix when fitting the pooled correlation matrix to the factor
model in the second stage.
4.2.2 Plausible Alternative Factor Structures
As discussed above, Yukl and Chavez (2002) outlined the various ways in which
influence tactics have been parsed into the categories of hard, soft, and rational tactics (Table 2).
Inspirational appeal, consultation, ingratiation, and personal appeals have consistently been
identified as soft tactics. Pressure, legitimating, and coalitions have consistently been identified
as hard tactics. Rational persuasion has been sometimes treated as a separate category, and it has
sometimes been grouped with Soft tactics. Exchange has variously been grouped with all three
tactic categories: hard, soft, and rational. These various constructions of tactic meta-categories
29
suggest potential higher-order factor structures underlying the influence tactics. Based on Yukl
and Chavez’s (2002) outline of tactic meta-categories, a set of five plausible structural models
were summarized, as shown in Table 2. These 5 models were used as the basis for analyzing the
higher-order factor structure of target-reported downward influence.
4.2.3 Model Testing
Confirmatory factor analysis (CFA) was conducted on the pooled correlation matrix with the
asymptotic covariance matrix as a weighting matrix using LISREL 8.7 to test each of the
proposed models of target-reported downward influence. The pooled covariance matrix,
corresponding numbers of studies (k) and sample sizes (N) are reported in Table 4, and the
asymptotic covariance matrix is reported in the Appendix along with annotated LISREL syntax
that produced the CFA results under the TSSEM routine.
The TSSEM procedures outlined here are advantageous in that correlation-specific
sample sizes are used to calculate the pooled correlation matrix, thus best accounting for missing
variables in the sample data sets. The asymptotic covariance matrix is calculated based on the
actual sample sizes for each pair of correlations. The fit of the proposed CFA models was
evaluated using absolute close fit and incremental close fit. The Root Mean Square Error of
Approximation (RMSEA; Steiger, 1990) and Standardized Root Mean Square Residual (SRMR)
were used to assess absolute close fit, and the comparative fit index (CFI; Bentler, 1990) and
Tucker-Lewis index (TLI; Tucker & Lewis, 1973; also known as the non-normed fit index,
NNFI) were used to assess incremental close fit. Acceptable model fit is suggested by RMSEA
values less than 0.08 (Browne & Cudeck, 1992; Hu & Bentler, 1999). For the NNFI and CFI
indices, acceptable model fit is suggested by values greater than 0.90 (Bentler, 1990; Hu &
Bentler, 1995; cf. Hu & Bentler, 1999; Marsh, Hau, & Wen, 2004).
30
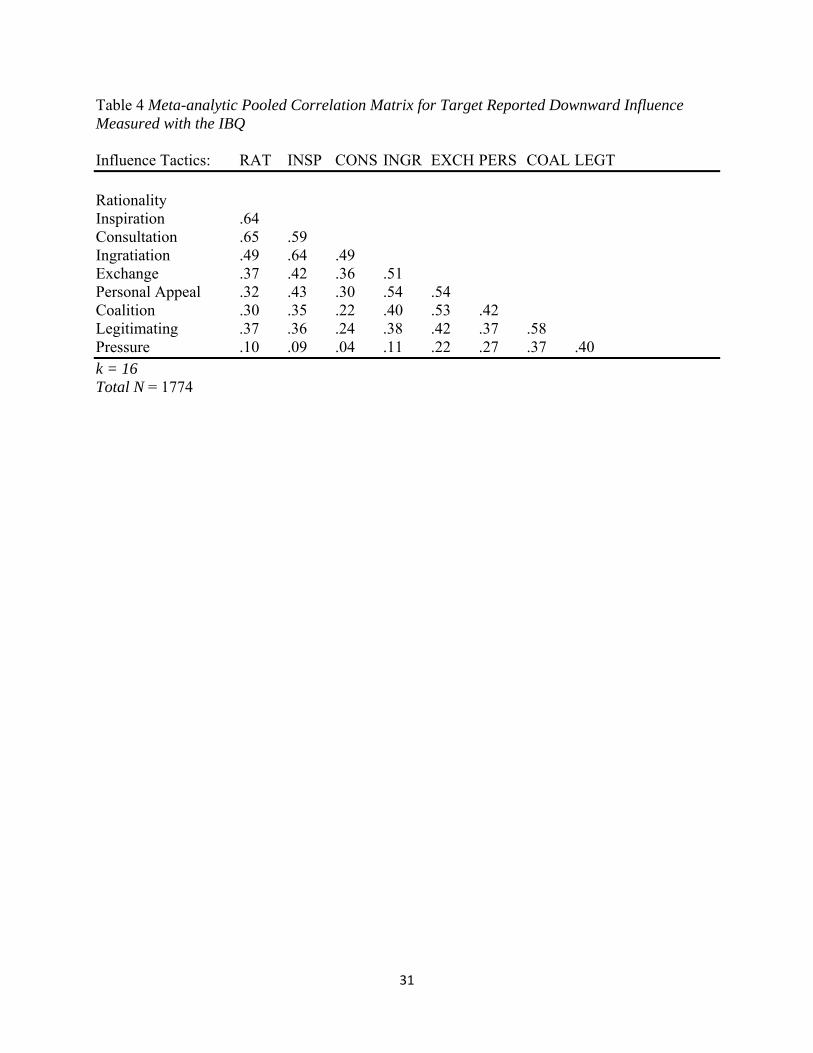
Table 4 Meta-analytic Pooled Correlation Matrix for Target Reported Downward Influence Measured with the IBQ Influence Tactics: RAT INSP CONS INGR EXCH PERS COAL LEGT Rationality Inspiration .64 Consultation .65 .59 Ingratiation .49 .64 .49 Exchange .37 .42 .36 .51 Personal Appeal .32 .43 .30 .54 .54 Coalition .30 .35 .22 .40 .53 .42 Legitimating .37 .36 .24 .38 .42 .37 .58 Pressure .10 .09 .04 .11 .22 .27 .37 .40 k = 16 Total N = 1774
31
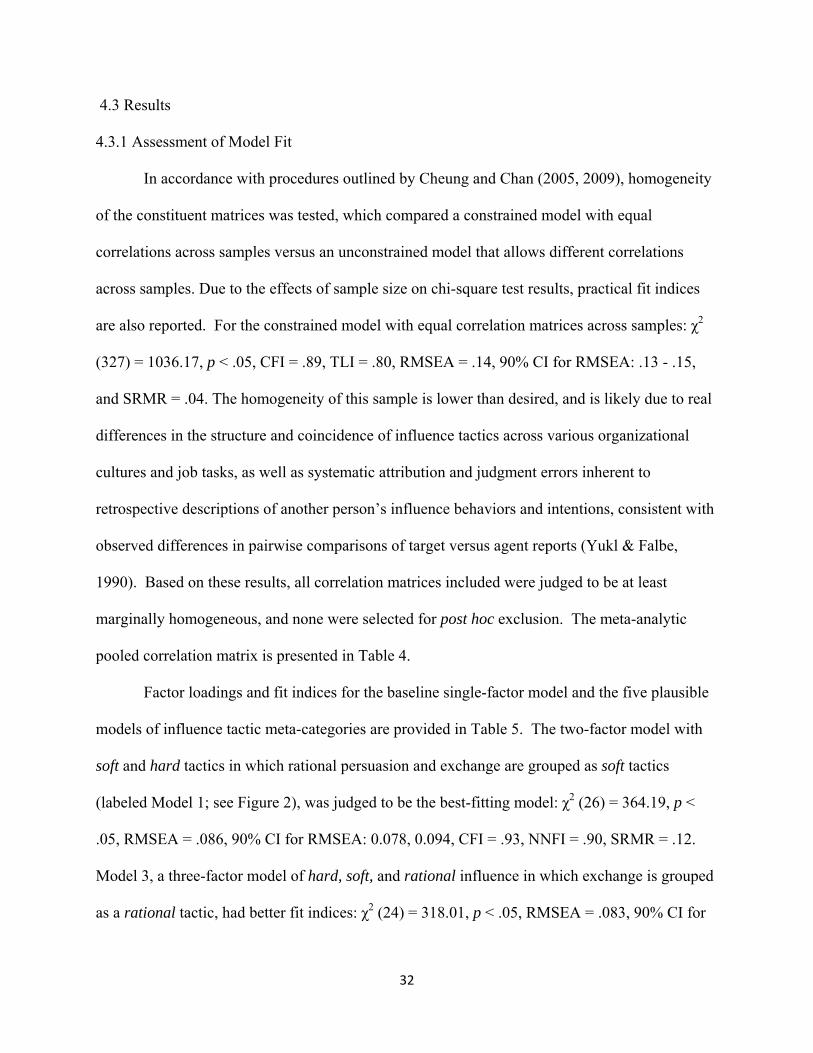
4.3 Results
4.3.1 Assessment of Model Fit
In accordance with procedures outlined by Cheung and Chan (2005, 2009), homogeneity
of the constituent matrices was tested, which compared a constrained model with equal
correlations across samples versus an unconstrained model that allows different correlations
across samples. Due to the effects of sample size on chi-square test results, practical fit indices
are also reported. For the constrained model with equal correlation matrices across samples: χ2
(327) = 1036.17, p < .05, CFI = .89, TLI = .80, RMSEA = .14, 90% CI for RMSEA: .13 - .15,
and SRMR = .04. The homogeneity of this sample is lower than desired, and is likely due to real
differences in the structure and coincidence of influence tactics across various organizational
cultures and job tasks, as well as systematic attribution and judgment errors inherent to
retrospective descriptions of another person’s influence behaviors and intentions, consistent with
observed differences in pairwise comparisons of target versus agent reports (Yukl & Falbe,
1990). Based on these results, all correlation matrices included were judged to be at least
marginally homogeneous, and none were selected for post hoc exclusion. The meta-analytic
pooled correlation matrix is presented in Table 4.
Factor loadings and fit indices for the baseline single-factor model and the five plausible
models of influence tactic meta-categories are provided in Table 5. The two-factor model with
soft and hard tactics in which rational persuasion and exchange are grouped as soft tactics
(labeled Model 1; see Figure 2), was judged to be the best-fitting model: χ2 (26) = 364.19, p <
.05, RMSEA = .086, 90% CI for RMSEA: 0.078, 0.094, CFI = .93, NNFI = .90, SRMR = .12.
Model 3, a three-factor model of hard, soft, and rational influence in which exchange is grouped
as a rational tactic, had better fit indices: χ2 (24) = 318.01, p < .05, RMSEA = .083, 90% CI for
32
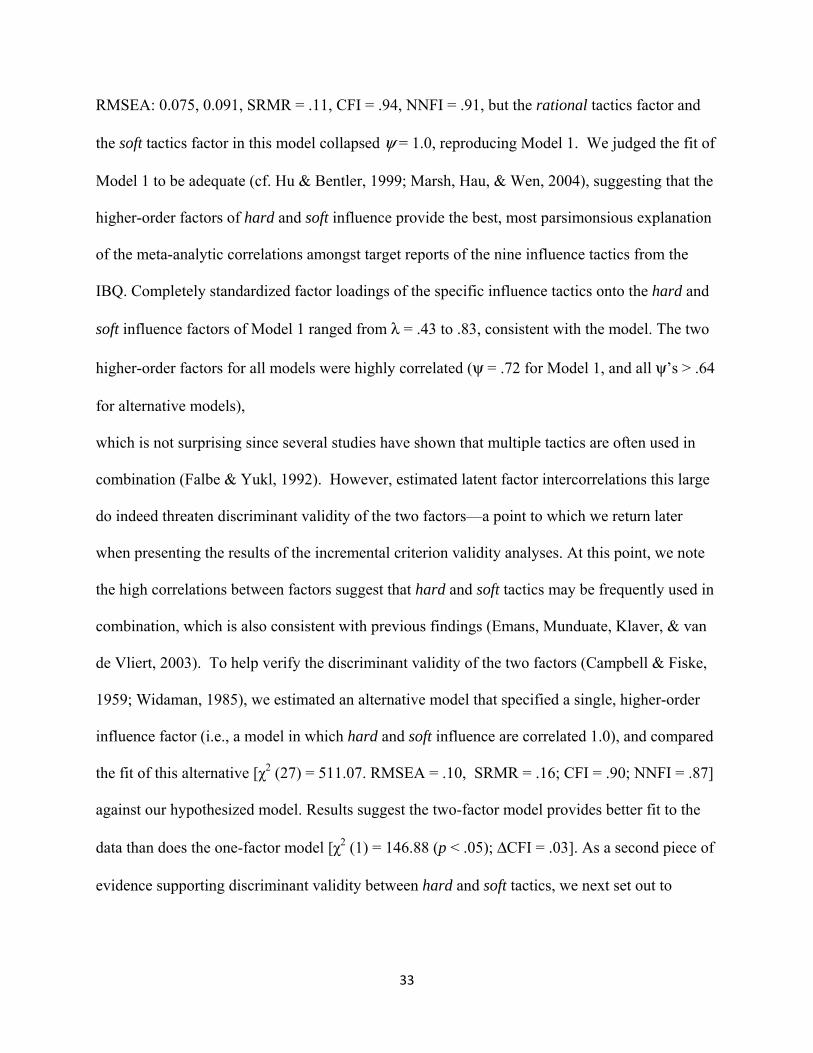
RMSEA: 0.075, 0.091, SRMR = .11, CFI = .94, NNFI = .91, but the rational tactics factor and
the soft tactics factor in this model collapsed ψ = 1.0, reproducing Model 1. We judged the fit of
Model 1 to be adequate (cf. Hu & Bentler, 1999; Marsh, Hau, & Wen, 2004), suggesting that the
higher-order factors of hard and soft influence provide the best, most parsimonsious explanation
of the meta-analytic correlations amongst target reports of the nine influence tactics from the
IBQ. Completely standardized factor loadings of the specific influence tactics onto the hard and
soft influence factors of Model 1 ranged from λ = .43 to .83, consistent with the model. The two
higher-order factors for all models were highly correlated (ψ = .72 for Model 1, and all ψ’s > .64
for alternative models),
which is not surprising since several studies have shown that multiple tactics are often used in
combination (Falbe & Yukl, 1992). However, estimated latent factor intercorrelations this large
do indeed threaten discriminant validity of the two factors—a point to which we return later
when presenting the results of the incremental criterion validity analyses. At this point, we note
the high correlations between factors suggest that hard and soft tactics may be frequently used in
combination, which is also consistent with previous findings (Emans, Munduate, Klaver, & van
de Vliert, 2003). To help verify the discriminant validity of the two factors (Campbell & Fiske,
1959; Widaman, 1985), we estimated an alternative model that specified a single, higher-order
influence factor (i.e., a model in which hard and soft influence are correlated 1.0), and compared
the fit of this alternative [χ2 (27) = 511.07. RMSEA = .10, SRMR = .16; CFI = .90; NNFI = .87]
against our hypothesized model. Results suggest the two-factor model provides better fit to the
data than does the one-factor model [χ2 (1) = 146.88 (p < .05); ΔCFI = .03]. As a second piece of
evidence supporting discriminant validity between hard and soft tactics, we next set out to
33

34
determine whether each factor (hard and soft influence) would predict hypothesized follower
outcomes while controlling for the other factor. These analyses are described in Study 2.
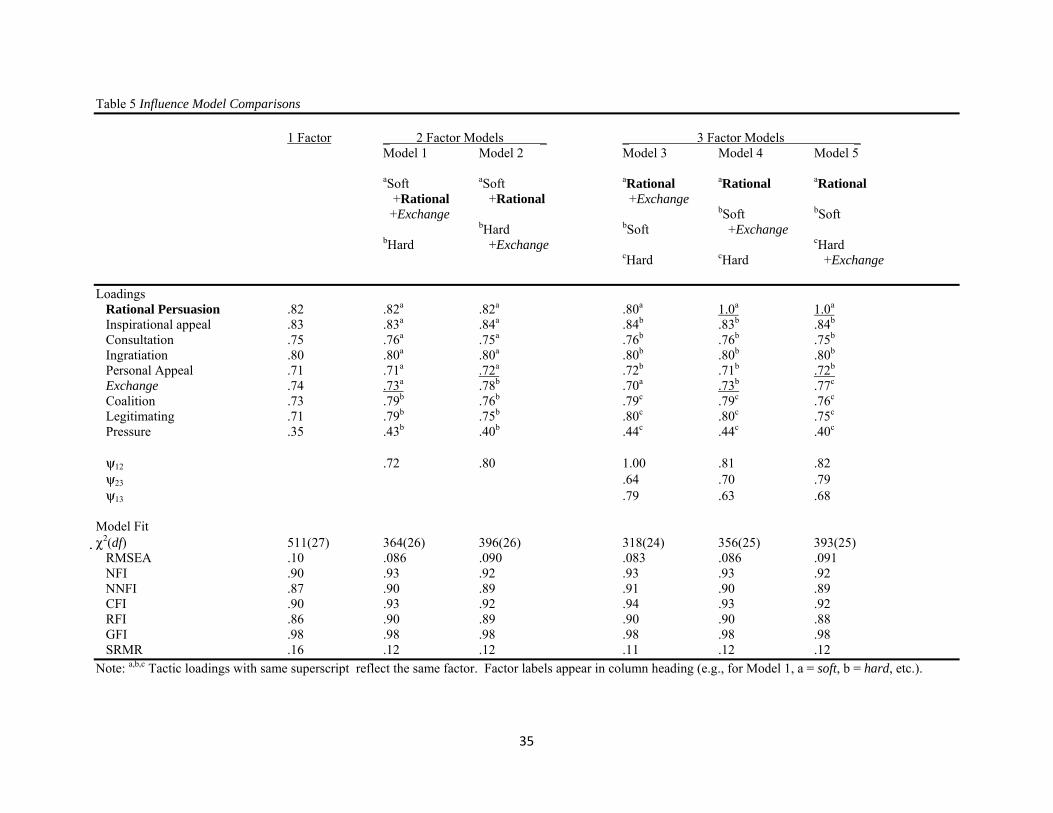
Table 5 Influence Model Comparisons 1 Factor _ 2 Factor Models _ _ 3 Factor Models _ Model 1 Model 2 Model 3 Model 4 Model 5
aSoft aSoft aRational aRational aRational +Rational +Rational +Exchange +Exchange bSoft bSoft
bHard bSoft +Exchange bHard +Exchange cHard cHard cHard +Exchange Loadings Rational Persuasion .82 .82a .82a .80a 1.0a 1.0a
Inspirational appeal .83 .83a .84a .84b .83b .84b Consultation .75 .76a .75a .76b .76b .75b
Ingratiation .80 .80a .80a .80b .80b .80b
Personal Appeal .71 .71a .72a .72b .71b .72b Exchange .74 .73a .78b .70a .73b .77c Coalition .73 .79b .76b .79c .79c .76c
Legitimating .71 .79b .75b .80c .80c .75c
Pressure .35 .43b .40b .44c .44c .40c
ψ12 .72 .80 1.00 .81 .82 ψ23 .64 .70 .79 ψ13 .79 .63 .68 Model Fit χ2(df) 511(27) 364(26) 396(26) 318(24) 356(25) 393(25) RMSEA .10 .086 .090 .083 .086 .091 NFI .90 .93 .92 .93 .93 .92 NNFI .87 .90 .89 .91 .90 .89 CFI .90 .93 .92 .94 .93 .92 RFI .86 .90 .89 .90 .90 .88 GFI .98 .98 .98 .98 .98 .98 SRMR .16 .12 .12 .11 .12 .12 Note: a,b,c Tactic loadings with same superscript reflect the same factor. Factor labels appear in column heading (e.g., for Model 1, a = soft, b = hard, etc.).
35

Figure 2 Two-Factor Model of Target-Reported Downward Influence
36
CHAPTER 5
STUDY 2: INCREMENTAL VALIDITY OF HARD AND SOFT INFLUENCE FACTORS
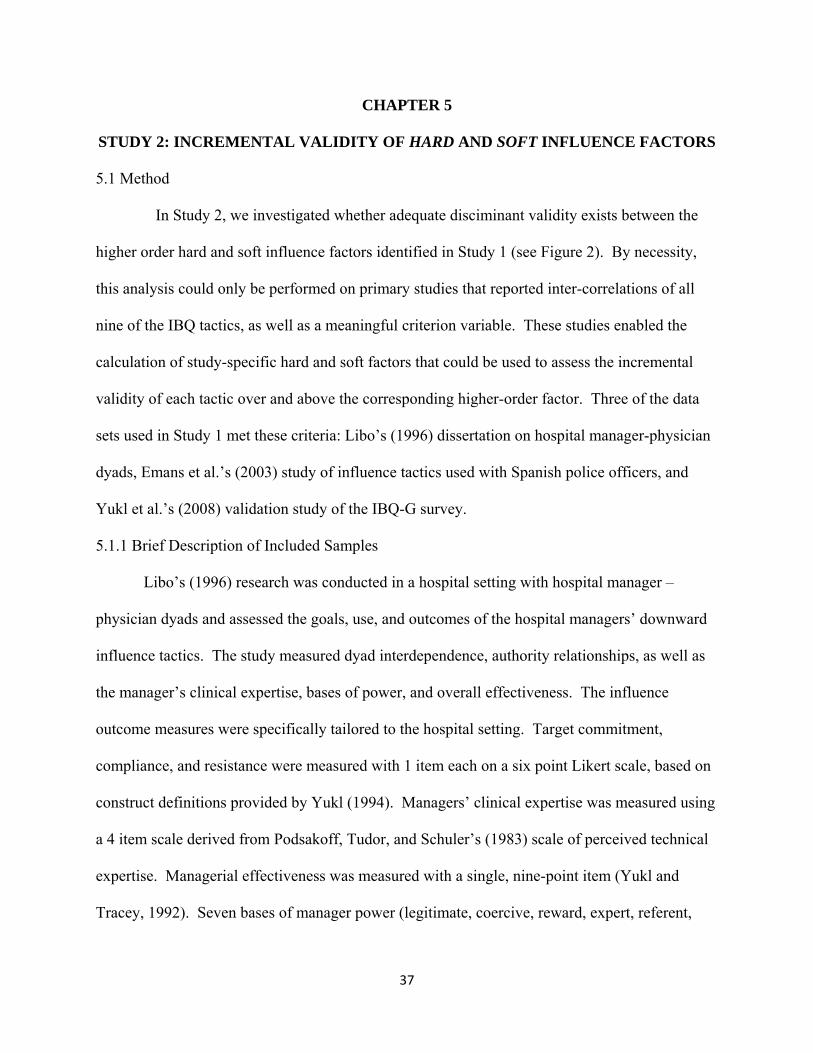
5.1 Method
In Study 2, we investigated whether adequate disciminant validity exists between the
higher order hard and soft influence factors identified in Study 1 (see Figure 2). By necessity,
this analysis could only be performed on primary studies that reported inter-correlations of all
nine of the IBQ tactics, as well as a meaningful criterion variable. These studies enabled the
calculation of study-specific hard and soft factors that could be used to assess the incremental
validity of each tactic over and above the corresponding higher-order factor. Three of the data
sets used in Study 1 met these criteria: Libo’s (1996) dissertation on hospital manager-physician
dyads, Emans et al.’s (2003) study of influence tactics used with Spanish police officers, and
Yukl et al.’s (2008) validation study of the IBQ-G survey.
5.1.1 Brief Description of Included Samples
Libo’s (1996) research was conducted in a hospital setting with hospital manager –
physician dyads and assessed the goals, use, and outcomes of the hospital managers’ downward
influence tactics. The study measured dyad interdependence, authority relationships, as well as
the manager’s clinical expertise, bases of power, and overall effectiveness. The influence
outcome measures were specifically tailored to the hospital setting. Target commitment,
compliance, and resistance were measured with 1 item each on a six point Likert scale, based on
construct definitions provided by Yukl (1994). Managers’ clinical expertise was measured using
a 4 item scale derived from Podsakoff, Tudor, and Schuler’s (1983) scale of perceived technical
expertise. Managerial effectiveness was measured with a single, nine-point item (Yukl and
Tracey, 1992). Seven bases of manager power (legitimate, coercive, reward, expert, referent,
37
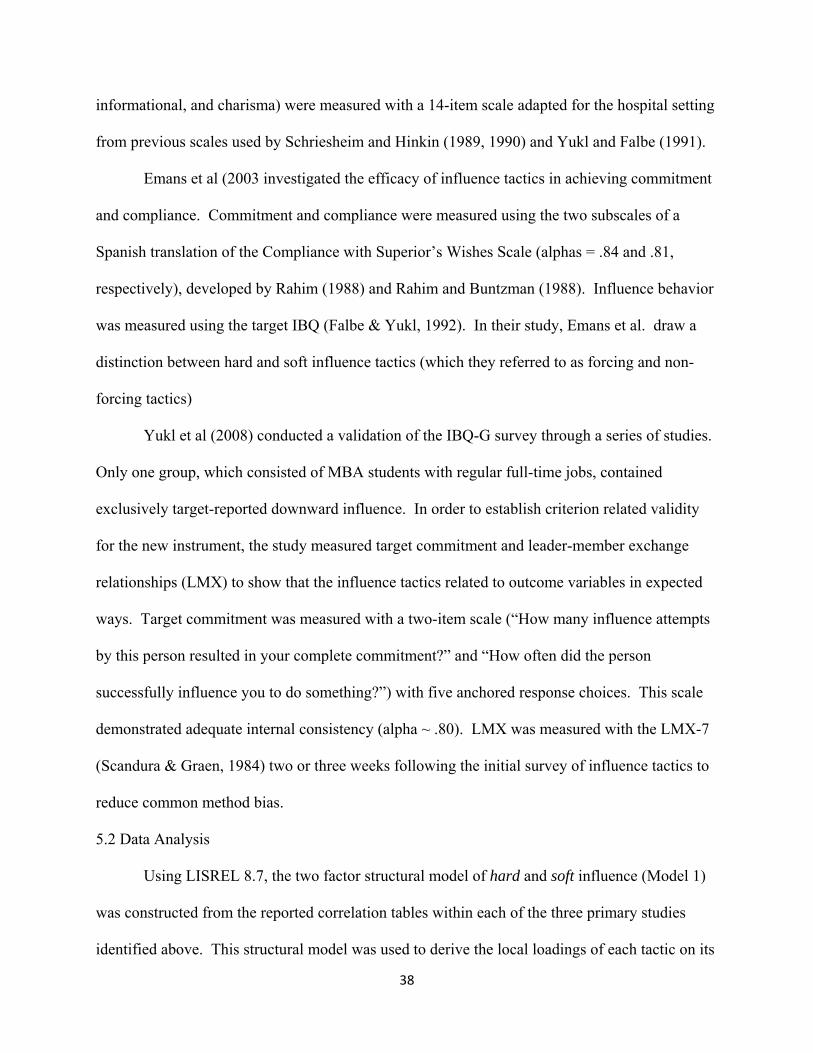
informational, and charisma) were measured with a 14-item scale adapted for the hospital setting
from previous scales used by Schriesheim and Hinkin (1989, 1990) and Yukl and Falbe (1991).
Emans et al (2003 investigated the efficacy of influence tactics in achieving commitment
and compliance. Commitment and compliance were measured using the two subscales of a
Spanish translation of the Compliance with Superior’s Wishes Scale (alphas = .84 and .81,
respectively), developed by Rahim (1988) and Rahim and Buntzman (1988). Influence behavior
was measured using the target IBQ (Falbe & Yukl, 1992). In their study, Emans et al. draw a
distinction between hard and soft influence tactics (which they referred to as forcing and non-
forcing tactics)
Yukl et al (2008) conducted a validation of the IBQ-G survey through a series of studies.
Only one group, which consisted of MBA students with regular full-time jobs, contained
exclusively target-reported downward influence. In order to establish criterion related validity
for the new instrument, the study measured target commitment and leader-member exchange
relationships (LMX) to show that the influence tactics related to outcome variables in expected
ways. Target commitment was measured with a two-item scale (“How many influence attempts
by this person resulted in your complete commitment?” and “How often did the person
successfully influence you to do something?”) with five anchored response choices. This scale
demonstrated adequate internal consistency (alpha ~ .80). LMX was measured with the LMX-7
(Scandura & Graen, 1984) two or three weeks following the initial survey of influence tactics to
reduce common method bias.
5.2 Data Analysis
Using LISREL 8.7, the two factor structural model of hard and soft influence (Model 1)
was constructed from the reported correlation tables within each of the three primary studies
identified above. This structural model was used to derive the local loadings of each tactic on its
38
associated factor (lambda matrix) as well as the factor and criterion variable inter-correlations
(phi matrix). These loadings and inter-correlations were then used to construct a total correlation
table, which included all lower-order influence tactics, both higher-order influence factors, and
the criterion variable(s) included in the each study under consideration. For instance, from the
Libo (1997) study, a two factor (hard and soft influence) model predicting target commitment
was constructed. The correlation tables for each study are reported in Tables 6 through 8.
Regression analysis was conducted on the resulting model to assess the regression coefficients
and R2 values for each higher-order factor, controlling for the other higher-order factor.
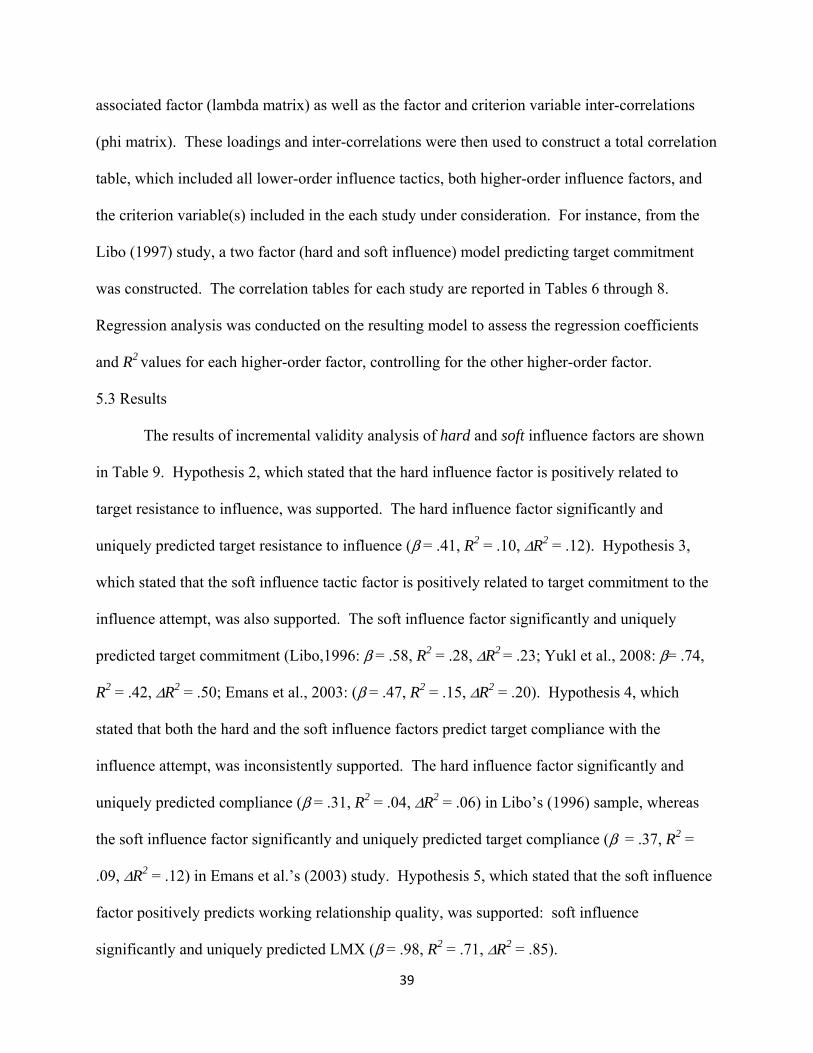
5.3 Results
The results of incremental validity analysis of hard and soft influence factors are shown
in Table 9. Hypothesis 2, which stated that the hard influence factor is positively related to
target resistance to influence, was supported. The hard influence factor significantly and
uniquely predicted target resistance to influence (β = .41, R2 = .10, ΔR2 = .12). Hypothesis 3,
which stated that the soft influence tactic factor is positively related to target commitment to the
influence attempt, was also supported. The soft influence factor significantly and uniquely
predicted target commitment (Libo,1996: β = .58, R2 = .28, ΔR2 = .23; Yukl et al., 2008: β= .74,
R2 = .42, ΔR2 = .50; Emans et al., 2003: (β = .47, R2 = .15, ΔR2 = .20). Hypothesis 4, which
stated that both the hard and the soft influence factors predict target compliance with the
influence attempt, was inconsistently supported. The hard influence factor significantly and
uniquely predicted compliance (β = .31, R2 = .04, ΔR2 = .06) in Libo’s (1996) sample, whereas
the soft influence factor significantly and uniquely predicted target compliance (β = .37, R2 =
.09, ΔR2 = .12) in Emans et al.’s (2003) study. Hypothesis 5, which stated that the soft influence
factor positively predicts working relationship quality, was supported: soft influence
significantly and uniquely predicted LMX (β = .98, R2 = .71, ΔR2 = .85).
39
40
Based on the incremental validity results reported above, we continue to assert that two,
oblique latent factors (hard and soft) underlie target descriptions of downward influence
behavior. Hard (autonomy-threatening) influence uniquely predicts target resistance, whereas
soft (autonomy-reinforcing) influence uniquely predicts target commitment and LMX. The
analysis of incremental validity supports the presence of two distinct factors that uniquely predict
influence outcomes.
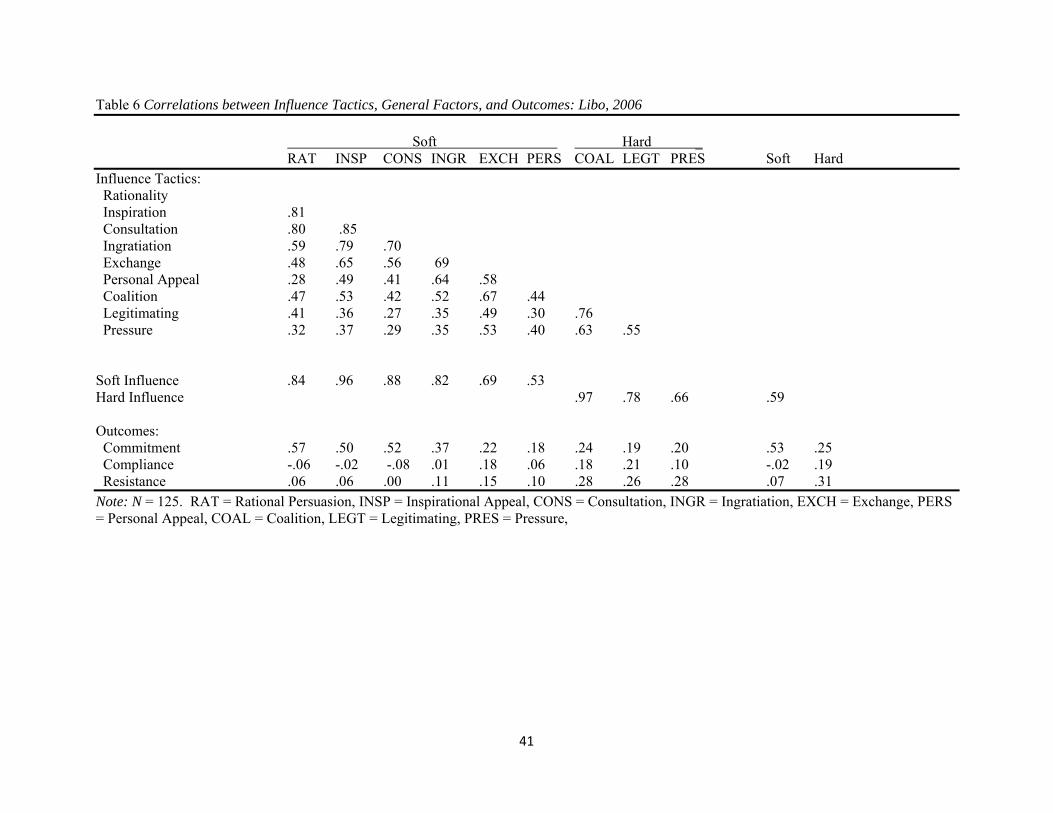
Table 6 Correlations between Influence Tactics, General Factors, and Outcomes: Libo, 2006 Soft Hard _ RAT INSP CONS INGR EXCH PERS COAL LEGT PRES Soft Hard Influence Tactics: Rationality Inspiration .81 Consultation .80 .85 Ingratiation .59 .79 .70 Exchange .48 .65 .56 69 Personal Appeal .28 .49 .41 .64 .58 Coalition .47 .53 .42 .52 .67 .44 Legitimating .41 .36 .27 .35 .49 .30 .76 Pressure .32 .37 .29 .35 .53 .40 .63 .55 Soft Influence .84 .96 .88 .82 .69 .53 Hard Influence .97 .78 .66 .59 Outcomes: Commitment .57 .50 .52 .37 .22 .18 .24 .19 .20 .53 .25 Compliance -.06 -.02 -.08 .01 .18 .06 .18 .21 .10 -.02 .19 Resistance .06 .06 .00 .11 .15 .10 .28 .26 .28 .07 .31 Note: N = 125. RAT = Rational Persuasion, INSP = Inspirational Appeal, CONS = Consultation, INGR = Ingratiation, EXCH = Exchange, PERS = Personal Appeal, COAL = Coalition, LEGT = Legitimating, PRES = Pressure,
41

Table 7 Correlations between Influence Tactics, General Factors, and Outcomes: Emans et al, 2003 _ Soft _ _ Hard _ RAT INSP CONS INGR EXCH PERS COAL LEGT PRES Soft Hard Influence Tactics: Rationality Inspirational Appeal .63 Consultation .76 .63 Ingratiation .38 .68 .38 Exchange .49 .55 .47 .56 Personal Appeal .38 .61 .48 .68 .57 Coalition .01 .27 .10 .26 .36 .29 Legitimating .13 .20 .01 .31 .29 .15 .44 Pressure -.20 .01 -.27 .13 .01 .07 .31 .46 Soft Influence .72 .86 .73 .73 .69 .71 Hard Influence .57 .77 .57 .28 Outcomes Commitment .48 .29 .44 .20 .20 .14 -.03 -.08 -.26 .39 -.16 Compliance .32 .24 .28 .17 .20 .14 -.08 -.05 -.23 .30 -.14 Note: N = 125. RAT = Rational Persuasion, INSP = Inspirational Appeal, CONS = Consultation, INGR = Ingratiation, EXCH = Exchange, PERS = Personal Appeal, COAL = Coalition, LEGT = Legitimating, PRES = Pressure.
42
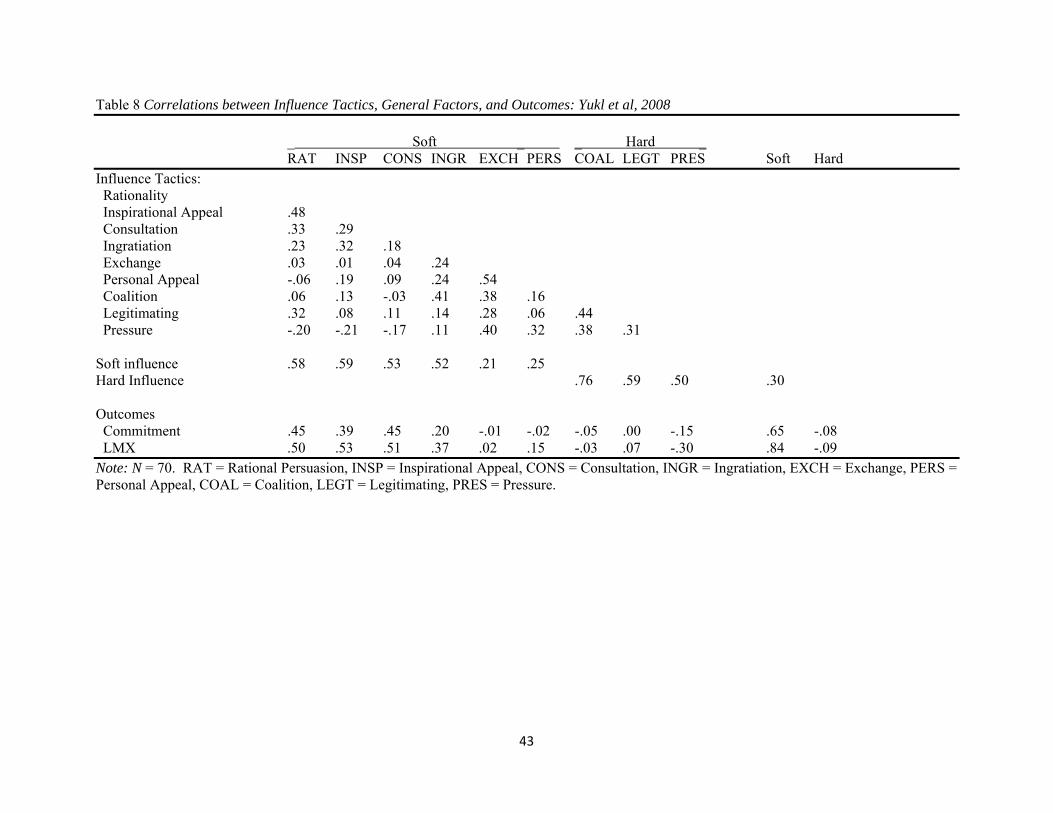
43
Table 8 Correlations between Influence Tactics, General Factors, and Outcomes: Yukl et al, 2008 _ Soft _ _ Hard _ RAT INSP CONS INGR EXCH PERS COAL LEGT PRES Soft Hard Influence Tactics: Rationality Inspirational Appeal .48 Consultation .33 .29 Ingratiation .23 .32 .18 Exchange .03 .01 .04 .24 Personal Appeal -.06 .19 .09 .24 .54 Coalition .06 .13 -.03 .41 .38 .16 Legitimating .32 .08 .11 .14 .28 .06 .44 Pressure -.20 -.21 -.17 .11 .40 .32 .38 .31 Soft influence .58 .59 .53 .52 .21 .25 Hard Influence .76 .59 .50 .30 Outcomes Commitment .45 .39 .45 .20 -.01 -.02 -.05 .00 -.15 .65 -.08 LMX .50 .53 .51 .37 .02 .15 -.03 .07 -.30 .84 -.09 Note: N = 70. RAT = Rational Persuasion, INSP = Inspirational Appeal, CONS = Consultation, INGR = Ingratiation, EXCH = Exchange, PERS = Personal Appeal, COAL = Coalition, LEGT = Legitimating, PRES = Pressure.

Table 9 Incremental Validity of Soft Influence Factor and Hard Influence Factor in Predicting Outcome Variables
Soft Influence Hard Influence Overall R2(ΔR2, β) R2(ΔR2, β) R2 Libo 1996, N = 125 Commitment .28(.23, .58) .06(.01, -.09) .29 Compliance .00(.02, -.20) .04(.06, .31) .06 Resistance .00(.02, -.17) .10(.12, .41) .12 Emans et al., 2003, N = 140 Commitment .15(.20, .47) .03(.08, -.29) .23 Compliance .09(.12, .37) .02(.05, -.24) .14 Yukl et al., 2008, N = 70 Commitment .42(.50, .74) .01(.09, -.30) .51 LMX .71(.85, .98) .01(.15, -.41) .86 Note: Items in bold are significant p < .05. Strong negative regression coefficients (β) are likely caused by multicollinearity due to strong relationship between factor 1 and factor 2.
44
CHAPTER 6
STUDY 3: ANALYSIS OF THE SPECIFIC VALIDITY OF INDIVIDUAL
INFLUENCE TACTICS BEYOND THE TWO HIGHER-ORDER FACTORS
6.1 Method
In Study 3, we investigate whether the criterion validity of the higher-order hard and soft
influence factors identified in Study 1 accounts for the entire relationship between lower-order
tactics and various outcome variables. That is, we next sought to assess whether lower-order
tactics retained any unique relationships with outcome variables, after the higher-order effects
were partialled out. This analysis follows the regression procedures outlined in Sanders,
Lubinski, and Benbow (1995) and Judge, Erez, Thoreson, & Bono (2002). As in Study 2, this
analysis could only be performed on primary studies that reported inter-correlations of all nine of
the IBQ tactics as well as a meaningful criterion variable. We used the study-specific hard and
soft factors estimated in Study 2 to assess the incremental validity of each tactic over and above
the corresponding higher-order factor. All three data sets from Study 2 provided useful criterion
variables for analysis: Libo’s (1996) dissertation on hospital manager-physician dyads, Emans et
al.’s (2003) study of influence tactics used with Spanish police officers, and Yukl et al.’s (2008)
validation study of the IBQ-G survey.
6.2 Data Analysis
As in Study 2, the two factor structural model of hard and soft influence (Model 1) was
constructed from the reported correlation tables within each of three primary studies identified
above using LISREL 8.7. This structural model was used to derive the local loadings of each
tactic on its associated factor (lambda matrix) as well as the factor and criterion variable inter-
correlations (phi matrix). These loadings and inter-correlations were then used to construct a
45
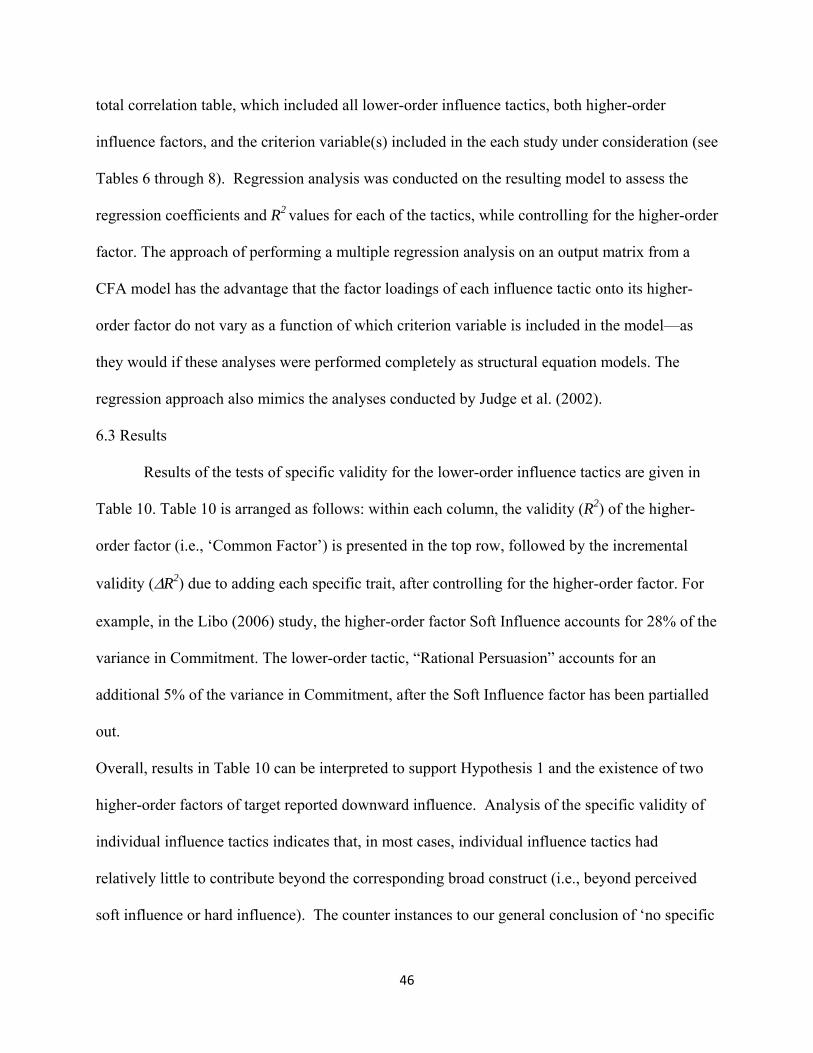
total correlation table, which included all lower-order influence tactics, both higher-order
influence factors, and the criterion variable(s) included in the each study under consideration (see
Tables 6 through 8). Regression analysis was conducted on the resulting model to assess the
regression coefficients and R2 values for each of the tactics, while controlling for the higher-order
factor. The approach of performing a multiple regression analysis on an output matrix from a
CFA model has the advantage that the factor loadings of each influence tactic onto its higher-
order factor do not vary as a function of which criterion variable is included in the model—as
they would if these analyses were performed completely as structural equation models. The
regression approach also mimics the analyses conducted by Judge et al. (2002).
6.3 Results
Results of the tests of specific validity for the lower-order influence tactics are given in
Table 10. Table 10 is arranged as follows: within each column, the validity (R2) of the higher-
order factor (i.e., ‘Common Factor’) is presented in the top row, followed by the incremental
validity (ΔR2) due to adding each specific trait, after controlling for the higher-order factor. For
example, in the Libo (2006) study, the higher-order factor Soft Influence accounts for 28% of the
variance in Commitment. The lower-order tactic, “Rational Persuasion” accounts for an
additional 5% of the variance in Commitment, after the Soft Influence factor has been partialled
out.
Overall, results in Table 10 can be interpreted to support Hypothesis 1 and the existence of two
higher-order factors of target reported downward influence. Analysis of the specific validity of
individual influence tactics indicates that, in most cases, individual influence tactics had
relatively little to contribute beyond the corresponding broad construct (i.e., beyond perceived
soft influence or hard influence). The counter instances to our general conclusion of ‘no specific
46

47
validity’ are found for the following specific tactics: (a) rational persuasion uniquely predicts
commitment, beyond soft influence, (b) exchange uniquely predicts commitment, compliance,
and LMX, beyond soft influence, (c) consultation and personal appeal uniquely predict
commitment, beyond soft influence, and (d) pressure tactics uniquely predict commitment,
compliance, and LMX, beyond hard influence.
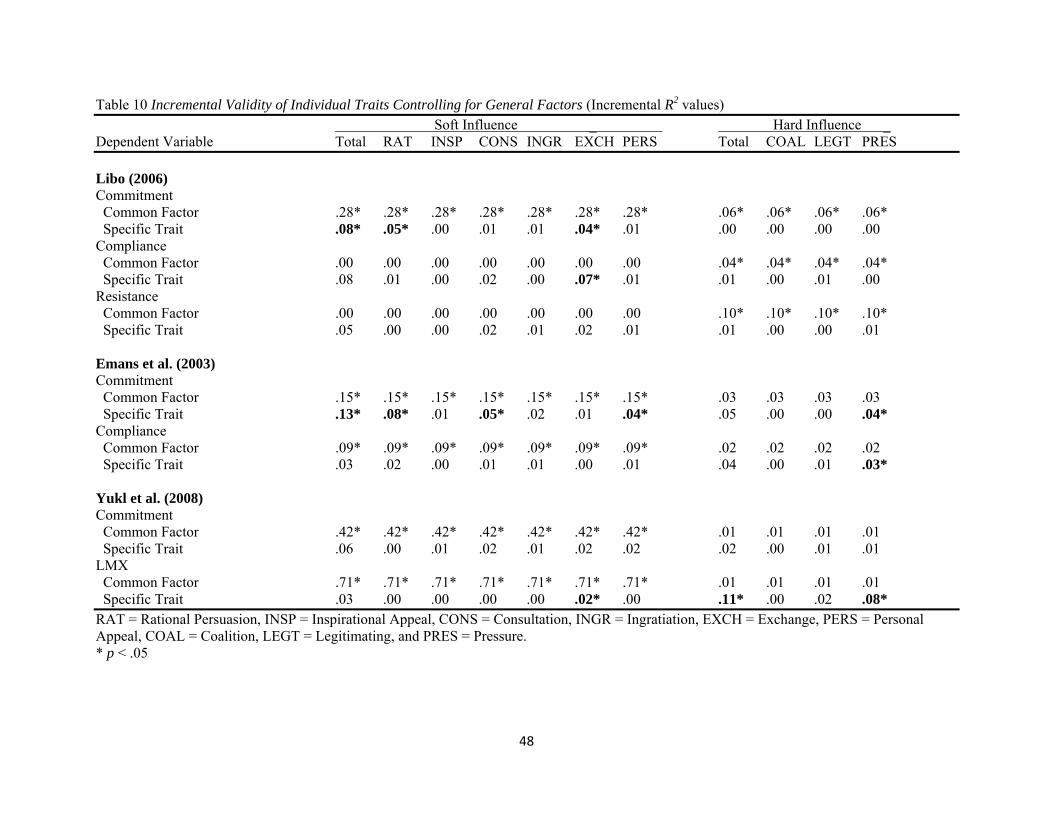
Table 10 Incremental Validity of Individual Traits Controlling for General Factors (Incremental R2 values) Soft Influence _ Hard Influence _ Dependent Variable Total RAT INSP CONS INGR EXCH PERS Total COAL LEGT PRES Libo (2006) Commitment Common Factor .28* .28* .28* .28* .28* .28* .28* .06* .06* .06* .06* Specific Trait .08* .05* .00 .01 .01 .04* .01 .00 .00 .00 .00 Compliance Common Factor .00 .00 .00 .00 .00 .00 .00 .04* .04* .04* .04* Specific Trait .08 .01 .00 .02 .00 .07* .01 .01 .00 .01 .00 Resistance Common Factor .00 .00 .00 .00 .00 .00 .00 .10* .10* .10* .10* Specific Trait .05 .00 .00 .02 .01 .02 .01 .01 .00 .00 .01 Emans et al. (2003) Commitment Common Factor .15* .15* .15* .15* .15* .15* .15* .03 .03 .03 .03 Specific Trait .13* .08* .01 .05* .02 .01 .04* .05 .00 .00 .04* Compliance Common Factor .09* .09* .09* .09* .09* .09* .09* .02 .02 .02 .02 Specific Trait .03 .02 .00 .01 .01 .00 .01 .04 .00 .01 .03* Yukl et al. (2008) Commitment Common Factor .42* .42* .42* .42* .42* .42* .42* .01 .01 .01 .01 Specific Trait .06 .00 .01 .02 .01 .02 .02 .02 .00 .01 .01 LMX Common Factor .71* .71* .71* .71* .71* .71* .71* .01 .01 .01 .01 Specific Trait .03 .00 .00 .00 .00 .02* .00 .11* .00 .02 .08* RAT = Rational Persuasion, INSP = Inspirational Appeal, CONS = Consultation, INGR = Ingratiation, EXCH = Exchange, PERS = Personal Appeal, COAL = Coalition, LEGT = Legitimating, and PRES = Pressure. * p < .05
48
CHAPTER 7
CONCLUSIONS
In all, the current paper described three studies that examined the factor structure
underlying a target’s perception of downward influence. Drawing on meta-categorizations of
influence tactics previously presented in the influence literature (Yukl & Chavez, 2002), this
study constructed a set of possible factor models and tested them, head to head. The best fitting
model was a two factor model of influence consisting of a hard influence factor manifest by
legitimating, coalition, and pressure tactics, and a soft influence factor that includes rational
persuasion, consultation, ingratiating, inspirational appeals, exchange, and personal appeals.
This two-factor solution supports the assertions of previous theorists that hard and soft tactics
can be differentiated by the degree to which they either reinforce or threaten the target’s
autonomy to choose to comply with the agent’s request. An analysis of incremental validity in
predicting outcomes of influence events supported the existence of the two distinct hard and soft
influence factors, with hard influence predicting resistance, soft influence predicting
commitment, and both hard and soft influence predicting compliance. An analysis of specific
validity showed that the hard and soft factors accounted for the lion’s share of the predictive
validity for outcomes of influence. Pressure tactics had a significantly more negative
relationship with the positive outcomes of commitment, compliance, and LMX beyond the
general hard influence factor. Exchange tactics had a significantly more negative relationship
with commitment and LMX, and more positive relationship with compliance, beyond the soft
influence factor. Rational persuasion had a significantly more positive relationship with the
positive outcome of commitment, beyond the general soft influence factor.
49
The study of influence tactics has been an empirically-driven, inductive endeavor since
its inception in the 1980’s (Kipnis et al., 1980) and has remained one of the least theory-laden
lines of research in industrial/organizational psychology. To date, the psychological constructs
driving tactic selection and perceptions of others’ influence behavior have been under-theorized
and under-investigated (Yukl & Chavez, 2002). The current study confirms a theoretical two-
factor model that effectively compares and coalesces the various conceptualizations of tactic
meta-categoization expressed in past literature.
Primary studies selected for inclusion in the current meta-analysis were parsed to isolate
a single direction and perspective of influence, i.e. the target perspective of downward influence.
There are good reasons to expect that the psychological constructs underlying agent descriptions
of influence behavior are very different from target perceptions of the agent’s behavior. From
the agent perspective, influence behavior likely starts with a concept of a desired outcome and
ends with the execution of an influence strategy that is calculated to be effective based on the
agent’s perception of target and situational factors such as sources of power. From the target
perspective, the influence event begins with interaction with the agent. The agent’s influence
behavior may serve as a stimulus for an affective event in which the target’s assessment of the
impact of the request elicits an emotional reaction (Weiss & Cropanzano, 1996). This reaction
likely colors the perception of influence behavior. In downward influence, the agent has some
degree of legitimate power to draw upon in making the request. The agent can either leverage
this power to influence the target or attempt to elicit voluntary compliance from the target. The
findings of the current study suggest that a subordinate target’s perception of a threat to their
autonomy is the major driver of the target’s perception of the influence event as a whole. Tactics
50
that preserve the target’s autonomy are perceived as soft influence, whereas tactics that threaten
the target’s autonomy are perceived as hard influence.
7.1 Future directions
Achieving greater clarity with regard to the empirical and theoretical structure underlying
perceptions of influence should help connect influence tactic research with other domains of
organizational psychology. How, for example, do these two factors underlying target
perceptions of a leader’s influence relate to more general behavioral constructs such as target
counterproductive work behavior (CWB) and organizational citizenship behavior (OCB), or does
the effectiveness of hard versus soft influence depend upon preexisting LMX relations?. Is LMX
an antecedent, an outcome, or both an antecedent and outcome of target perceptions of soft
influence? Conceptualizing the target’s experience of an influence event within the broader
domain of affective events may further allow for better theorized relationships between influence
behaviors and constructs such as job satisfaction and affective disposition. Additionally,
identifying two factors of target perceptions of downward influence opens the door to
investigating interactions between the target’s personality and these perceptual factors. Which
sort of followers receive rational persuasion tactics, and which receive exchange and pressure
tactics?
The ambiguous relationships between the two influence factors and the influence
outcome of compliance remains to be explained. It would be useful to identify the contextual
factors that moderate the relationship between hard and soft influence factors and target
compliance. Fiedler’s (1971) contingency model may well provide the situational factors
moderating this relationship. A better measure of commitment, compliance, and resistance would
also contribute to this endeavor. As it is, several studies of influence tactic outcomes have used
51
simple, single item measures of commitment, compliance and resistance (e.g. Libo, 1997) that
are unlikely to fully capture these constructs. It is an open question as well whether these
behaviors represent a continuum of response behaviors, as is suggested by their
operationalization in some studies (e.g. Yukl et al., 1996), or if they are separate constructs.
Lastly, future studies need to consider agent and leader perspectives of influence in the
same way that the current study has focused on target perspectives of downward influence.
There is evidence that targets and agents experience influence events differently, and that
different tactics are used in upward, downward, and lateral influence (Kipnis et al., 1980; Yukl &
Falbe, 1990; Yukl & Tracey, 1992). Future studies should extend this work and investigate the
psychological phenomena driving these differences.
52
LIST OF REFERENCES
*References marked with an asterisk indicate studies included in the meta-analysis.
Aguinis, H & Adams, S. K. R. (1998). Social-Role versus Structural Models of Gender and
Influence Use in Organizations: A strong inference approach. Group & Organization
Management, 23, 414-446.
Ansari, M. A. & Kapoor, A. (1987). Organizational context and upward influence tactics.
Organizational Behavior and Human Decision Processes, 40, 39–49.
Ansari, M. (1989). Effects of leader sex, subordinate sex, and subordinate performance on
the use of influence strategies. Sex Roles, 20, 283–293.
Baird, I. S., Lyles, M. A., & Wharton R. (1990). Attitudinal differences between American
and Chinese managers regarding joint venture management. Management International
Review, 30, 53-68.
Bhaskar-Shrinivas, P., Harrison, D. A., Shaffer, M. A., & Luk, D. M. (2005). Input-based
and time-based models of international adjustment; Meta-analytic evidence and
theoretical extensions. Academy of Management Journal, 48, 257–280.
Benson, P.G. & Hornsby, J.S. (1988). The politics of pay: the use of influence tactics in
job evaluation committees. Group & Organization Studies, 13(2), 208-24.
Bentler, P. (1990). Comparative fit indexes in structural models. Psychological Bulletin, 107,
238–246.
*Berson, Y., & Sosik, J. J. (2007). The relationship between self-other rating agreement
and influence tactics and organizational processes. Group & Organization Management,
32(6), 675-698.
53
Blickle, G. (1995). Wie beeinflussen Personen erfolgreich Vorgesetzte, KolegInnen und
Untergebene? – Skalenentwicklung und -validierung. Diagnostica, 41, 245–260.
Blickle, G. (2000a). Do work values predict the use of intraorganizational influence
strategies? Journal of Applied Social Psychology, 30, 196-205.
Blickle, G. (2000b). Influence tactics used by subordinates: An empirical analysis
of the Kipnis and Schmidt subscales. Psychological Reports, 86, 143- 154.
Blickle, G. (2000c) Intraorganisationale Einflussnahme: Perspektivenabhangige
Beschreibung und ihre Beziehung zur Selbst- und Fremdwahmehmung [Influencing
others in organizations: Self- and other-reports] (Research Report No. 21). Landau,
Germany: Psychological Department at the University of Koblenz-Landau.
Blickle, G. (2003). Convergence of agents' and targets' reports on intraorganizational
influence attempts. European Journal of Psychological Assessment, 19, 40-53.
Blickle, G., & Gonner, S. (1999). Studien zur Validierung eines Inventars zur
Erfassung intraorganisationaler Einflurjstrategien [Validating an inventory to
assess intraorganizational influence strategies]. Diagnostica, 45, 35-46.
Browne, M.W., & Cudeck, R. (1992). Alternative ways of assessing model fit. Sociological
Methods and Research, 21, 230–258.
Bruins, J. (1999). Social power and influence tactics: A theoretical introduction. Journal of
Social Issues, 55, 7–14.
Campbell, D. T., & Fiske, D.W. (1959). Convergent and discriminant validation by the
multitrat-multimethod matrix. Psychological Bulletin 56, 81–105.
54
Cashman, J., Dansereau, F., Graen, G. B., & Haga, W. J. (1976). Organizational
understructure and leadership: A longitudinal investigation of the managerial role-making
process. Organizational Behavior and Human Performance, 15, 278–296.
Chang, S. K. C. (1985). American and Chinese managers in U. S. companies in Taiwan: A
comparison. California Management Review, 27(4), 144-156.
*Chen, D. L. (1996). Factors determining the success of expatriate managers
in multinational corporations. Dissertation Abstracts International 56(4-B) 2363.
Cheung, M. W. L., & Chan, W. (2005). Meta-analytic structural equation modeling: A
two-stage approach. Psychological Methods, 10, 40–64.
Cheung, M. W. L., & Chan, W. (2009). A two-stage approach to synthesizing
covariance matrices in meta-analytic structural equation modeling. Structural
Equation Modeling, 16, 28–53.
Clarke, S. (1998). Organizational factors affecting the incident reporting of train drivers.
Work & Stress, 12, 6-16.
* Clarke, S., & Ward, K. (2006). The role of leader influence tactics and safety climate in
engaging employees’ safety participation. Risk Analysis, 26, 1175–1185.
Colquitt, J. A., Conlon, D. E., Wesson, M. J., Porter, C., & Ng, K. Y. (2001). Justice at the
millennium: A meta-analytic review of 25 years of organizational justice research.
Journal of Applied Psychology, 86: 425–445.
Colquitt, J. A., LePine, J. A., & Noe, R. A. (2000). Toward an integrative theory of training
motivation: a meta-analytic path analysis of 20 years of research. Journal of Applied
Psychology, 85(5), 678–707.
55

Conway, J.M. (1999). Distinguishing contextual performance from task performance for
managerial jobs. Journal of Applied Psychology, 84: 3–13.
Cropanzano, R., & James, K. (1990). Some methodological considerations for the behavioral
genetic analysis of work attitudes. Journal of Applied Psychology, 75, 433-439.
Deci, E. L., & Ryan, R. M. (1987). The support of autonomy and the control of behavior.
Journal of Personality and Social Psychology, 53, 1024-1037.
Deci, E. L., & Ryan, R. M. (2000). The “what” and “why” of goal pursuits: Human needs
and the self-determination of behavior. Psychological Inquiry, 11, 227–268.
Deluga, R. J. (1988). Relationship of transformational and transactional leadership with
employee influencing strategies. Group & Organization Studies, 13(4),
456−467.
Deluga, R. J. (1988a). The politics of leadership: The relationship between task–
people leadership and subordinate influence. Journal of Organizational Behavior,
9, 359–366.
*Douglas, C. J. (1998). The effects of self-directed work teams (sdwts) on managerial
influence. Dissertation Abstracts International 58(11-A) 4342.
*Douglas, C. J. & Gardner, W. L. (2004). Transition to self-directed work teams:
implications of transition time and self-monitoring for managers' use of influence tactics.
Journal of Organizational Behavior, 25, 47-65.
Dorfman, P. W., & Howell, J. P. (1989). Dimensions of national culture and effective
leadership patterns: Hofstede revisited. Advanced International Comparative
Management, 3, 127–150.
56
Dulebohn, J. H., Bommer, W. H., Liden, R. C., Brouer, R. L., & Ferris, G. R. (in press). A Meta
Analysis of Antecedents and Consequences of Leader-Member Exchange: Integrating the
Past with an Eye toward the Future. Journal of Management, 0149206311415280, first
published on July 19, 2011.
*Emans, B. J. M., Munduate, L., Klaver, E. & van de Vliert, E. (2003). Constructive
consequences of leaders' forcing influence styles. Applied Psychology: International
Review, 52(1), 36-54.
Erez, M, Earley, P. C, & Hulin, C. L. (1985). The impart of participation on goal acceptance and
performance: A two step model. Academy of Management, 28, 50-66.
Erez, M., & Rim, Y. (1982). The relationship between goals, influence tactics, and personnel
and organizational variables. Human Relations, 35, 871−878.
Erez, M., Rim, Y., & Keider, I. (1986). The two sides of the tactics of influence: Agent vs.
target. Journal of Occupational Psychology, 59, 25–39.
Falbe, C. M., & Yukl, G. (1992). Consequences to managers of using single influence tactics
and combinations of tactics. Academy of Management Journal, 35, 638−653.
Farmer, S. M., Maslyn, J. M., Fedor, D. B., & Goodman, J. S. (1997). Putting upward influence
strategies in context. Journal of Organizational Behavior, 18, 17–42.
Festinger, L. A. (1953). An analysis of compliant behavior. In M. Sherif & M. O. Wilson (Eds.),
Group relations at the crossroads (pp. 232–256). New York: Harper.
Fiedler, F. E. (1971). Validation and extension of the contingency model of leadership
effectiveness: A review of empirical findings. Psychological Bulletin, 76: 128–148.
57
French, J. R. P., Jr,, & Raven, B. H. (1959). The bases of social power. In D. Cartwright
(Ed.), Studies in social power (pp. 150-167). Ann Arbor, MI: Institute for Social
Research.
Fu, P. P., Peng, T. K., Kennedy J. C., & Yukl, G. (2004). Examining the Preferences of
Influence Tactics in Chinese Societies: A Comparison of Chinese Managers in Hong
Kong, Taiwan and Mainland China. Organizational Dynamics 33(1), 32–46.
Fu, P. P., & Yukl, G. (2000). Perceived effectiveness of influence tactics in the United States
and China. Leadership Quarterly, 11, 251–266.
Furlow, C.F., Beretvas, S.N., (2005). Meta-analytic methods of pooling correlation matrices
for structural equation modeling under different patterns of missing data. Psychological
Methods 10, 227– 254.
*Furst, S. A., (2004). An expectancy-based model of managerial influence tactics and
employee commitment to organizational change. Dissertation Abstracts International
65(4-A), 1442.
*Furst, S. A. & Cable, D. M. (2008). Employee resistance to organizational change:
Managerial influence tactics and leader-member exchange. Journal of Applied
Psychology, 93, 453-462.
Hanisch, K. A., Hulin, C. A., & Roznowski, M. (1998). The importance of individuals’
repertoires of behaviors: The scientific appropriateness of studying multiple behaviors
and general attitudes. Journal of Organizational Behavior, 19, 463–480.
Hochwarter, W. A., Harrison, A. W., Ferris, G. R., Perrewe, P. L., & Ralston, D. A. (2000).
A re-examination of Schriesheim and Hinkin's (1990) measure of upward
influence. Educational and Psychological Measurement, 60(5), 751−771.
58
Hu, L., & Bentler, P.M. (1995). Evaluating model fit. In R. H. Hoyle (Ed.), Structural
equation modeling: Concepts, issues and applications. Thousand Oaks, CA: Sage.
Hu, L., & Bentler, P. M. (1999). Cutoff criteria for fit indices in covariance structure
analyses: Conventional criteria versus new alternatives. Structural Equation
Modeling, 6, 1−55.
*Hubej Olesinski, Nina M. (1992). Influence tactics related to leadership styles of chief
nurse executives. Dissertation Abstracts International 53(5-B) 2246.
Hulin, C. L., Roznowski, M, & Hachiya, D. (1985). Alternative opportunities and withdrawal
decisions: Empirical and theoretical discrepancies and an integration. Journal of Applied
Psychology, 97, 233-250.
Joreskog K, Sorbom D. (1996). LISREL 8: User’s reference guide. Chicago: Scientific Software
International.
Judge, T. A., Erez, A., Thoreson, C. J., & Bono, J. E. (2002). Are measures of
self-esteem, neuroticism, locus of control, and generalized self-efficacy
indicators of a common core construct? Journal of Personality and Social
Psychology, 83, 693−710.
Kale, S. (1989) Dealer dependence and influence strategies in a manufacturer-dealer dyad.
Journal of Applied Psychology, 74(3), 379–84.
Kelman, H. C. (1958). Compliance, identification, and internalization: three processes of
attitude change. Journal of Conflict Resolution 2, 51–60.
Kelman, H. C. (2006). Interests, Relationships, Identities: Three central issues for individuals
and groups negotiating their social environment. Annual Review of Psychology, 57, 1–26
59
Kennedy, J., Fu, P. P., & Yukl, G. (2003). Influence tactics across twelve cultures. In W.
Mobley, & P. Dorfman (Eds.), Advances in global leadership, Vol. 3. (pp. 127−148):
JAI Press.
Kipnis, D., Schmidt, S. M., & Wilkinson, I. (1980). Intra-organizational influence tactics:
Explorations in getting one's way. Journal of Applied Psychology, 65, 440−452.
Kipnis, D., & Schmidt, S. M. (1982). Profiles of organizational influence strategies. San
Diego: University Associates.
Kipnis, D., & Schmidt, S. M. (1985). The Language of Persuasion. Psychology Today, 04
40-46.
Kipnis, D., & Schmidt, S. M., (1983) An influence perspective on bargaining. In Max
Bazerman and Roy Lewicki (Eds.), Negotiating in Organizations (303-319). Beverly
Hills, CA: Sage.
Kipnis, D., & Schmidt, S. M. (1988). Upward-influence styles: Relationship with
performance evaluations, salary, and stress. Administrative Science Quarterly, 33, 528-
542.
Klein, H., Wesson, M., Hollenbeck, J., & Alge, B. (1999). Goal commitment and the goal-setting
process: Conceptual clarification and empirical synthesis. Journal of Applied Psychology,
84, 885–896.
*Kochanowski, S. M., (2009). Coaching as a facilitator of the effects of behavioral
feedback to managers. Dissertation Abstracts International 70(2-A) 613.
Kochanowski, S. M., Seifert, C.F., & Yukl, G. (2010). Using coaching to enhance the effects
of behavioral feedback to managers. Journal of Leadership & Organizational Studies
17(4), 363-369.
60
Latham, G. P, Erez, M, & Locke, E. A. (1988). Resolving scientific disputes by the joint design
of crucial experiments by antagonists: Application of the Latham-Erez dispute regarding
participation in goal setting. Journal of Applied Psychology, 73, 753-772.
Latham, G. P., & Yukl, G. A. A review of research on the application of goal setting in
organizations. Academy of Management Journal, 1975, 18, 824-845.
Lawrence, T. B., & Robinson, S. L. (2007). Ain’t misbehavin: Workplace deviance as
organizational resistance. Journal of Management, 33, 378– 394.
Lehman, W. E. K., & Simpson, D. D. (1992). Employees substance use and on the job
behaviors. Journal of Applied Psychology, 77(3), 309-321.
LePine, J. A., Podsakoff, N. P., & LePine, M. A. (2005). A meta-analytic test of the
challenge stressor-hindrance stressor framework: An explanation for inconsistent
relationships among stressors and performance. Academy of Management Journal, 48,
764−775.
Liden, R. C., Wayne, S. J., & Stilwell, D. (1993). A longitudinal study on the early development
of leader-member exchanges. Journal of Applied Psychology, 78, 662-674.
*Libo, G. M. (1997). The use and effectiveness of influence tactics in hospital manager-
physician relationships. Dissertation Abstracts International, 57(11-A), pp. 4820.
Locke, E. A. (2007). The case for inductive theory building. Journal of Management, 33,
867–890.
Marsh, H. W. (1998). Simulation study of non-equivalent group-matching and regression
discontinuity designs: Evaluations of gifted and talented programs. Journal of
Experimental Education, 66, 163-192.
61
Marsh, H. W., Wen, Z., & Hau, K. (2004) Structural equation models of latent interactions:
Evaluation of alternative strategies and indicator construction. Psychological Methods, 9,
275–300.
McFarland, L. A., Ryan, A. M., & Kriska, S. D. (2002). Field study investigation of applicant
use of influence tactics in a selection interview. Journal of Psychology, 136, 383–398.
Meriac, J. P., Hoffman, B. J.,Woehr, D. J., & Fleisher, M. S. (2008). Further evidence for the
validity of assessment center dimensions: A meta-analysis of the incremental criterion
related validity of dimension ratings. Journal of Applied Psychology, 93, 1042–1052.
Meyer, J. P., & Gagne´, M. (2008). Employee engagement from a selfdetermination theory
perspective. Industrial and Organizational Psychology, 1, 60–62.
Newman, D. A. (2003). Longitudinal modeling with randomly and systematically missing
data: A simulation of ad hoc, maximum likelihood, and multiple imputation techniques.
Organizational Research Methods, 6, 328–362.
Newman, D. A., Jacobs, R. R., & Bartram, D. (2007). Choosing the best method for local
validity estimation: Relative accuracy of meta-analysis versus a local study versus Bayes-
analysis. Journal of Applied Psychology, 92, 1394-1413.
Podsakoff, P. M., Todor, W. D., & Schuler, R. S. (1983). Leader expertise as a moderator of
the effects of instrument and supportive leader behaviors. Journal of Management, 9,
173–185.
Podsakoff, N. P., Whiting, S. W., Podsakoff, P. M., & Blume, B. D. (2009). Individual-and
organizational-level consequences of organizational citizenship behaviors: A meta-
analysis. Journal of Applied Psychology, 94(1), 122–141.
62
Rahim, M.A. (1988). The development of a leader power inventory. Multivariate
Behavioral Research, 23, 491-502.
Rahim, M.A., & Buntzman, G.F. (1988). Supervisory power bases, tactics of handling
conflict with subordinates, and subordinate compliance and satisfaction. The
Journal of Psychology, 133, 611-625.
Raven, B. H. (1993). The Bases of Power: Origins and Recent Developments. Journal of
Social Issues, 49(4), 227-251
Sanders, C. E., Lubinski, D., & Benbow, C. P. (1995). Does the Defining Issues Test
measure psychological phenomena distinct from verbal ability?: An examination of
Lykken's query. Journal of Personality and Social Psychology, 69, 498-504.
Scandura, T. A., & Graen, G. B. (1984). Moderating effects of initial leader–member
exchange status on the effects of a leadership intervention. Journal of Applied
Psychology, 69, 428−436.
Schechter, D. S. (1985). Value and continuance commitment: A field test of dual
conceptualizations of organizational commitment. (Unpublished Master’s Thesis).
University of Maryland, College Park.
Schriesheim, C. A., & Hinkin, T. R. (1990). Influence tactics used by subordinates: A
theoretical and empirical analysis and refinement of the Kipnis, Schmidt, and
Wilkinson subscales. Journal of Applied Psychology, 75, 246−257.
Seifert, C., & Yukl, G. (2010). Effects of repeated multisource feedback on the influence
behavior and effectiveness of managers: A field experiment. Leadership
Quarterly, 21, 856–866.
63
Seifert, C., Yukl, G., & McDonald, R. (2003). Effects of multisource feedback and a
feedback facilitator on the influence behavior of managers towards subordinates.
Journal of Applied Psychology, 88, 561−569.
Shadish, W. R. (1996). Meta-analysis and the exploration of causal mediating processes: a
primer of examples, methods, and issues. Psychological Methods, 1, 47–65.
Sin, H. P., Nahrgang, J. D., & Morgeson, F. P. (2009). Understanding why they don’t see eye to
eye: An examination of leader–member exchange (LMX) agreement. Journal of Applied
Psychology, 94, 1048–1057.
Smith, P. C., Kendall, L. M., & Hulin, C. L. (1969). The measurement of satisfaction in work
and retirement: A strategy for the study of attitudes. Chicago: Rand McNally.
*Sparrowe, R. T., Soetjipto, B.W., & Kraimer, M. L. (2006). Do leader's influence tactics
relate to member's helping behavior? It depends on the relationship. Academy
of Management Journal, 49(6), 1194−1208.
Tepper, B., Brown, S., & Hunt, M. 1993. Strength of subordinates' upward influence tactics and
gender congruency effects. Journal of Applied Social Psychology, 23, 1903-1919.
Tepper, B. J., Eisenbach, R. A., Kirby, S. L., & Potter, P. W. (1998). Test of a justice based
model of subordinates' resistance to downward influence attempts. Group and
Organization Management, 23, 144-160.
Tepper, B. J., & Schriesheim, C. A. (1991). Charismatic leadership, influence tactic
controllingness, and follower conformity: An empirical investigation. In D. F. Ray (Ed.),
Proceedings of the Southern Management Association Annual Meeting (pp. 249-25 1).
Atlanta, GA: Southern Management Association
64
Tepper, B. J., Uhl-Bien, M., Kohut, G. F., Rogelberg, S. G., Lockhart, D. E., & Ensley, M.
D. (2006). Subordinates’ resistance and managers’ evaluations of subordinates’
performance. Journal of Management, 32, 185–209.
Thoresen, C. J., Kaplan, S. A., Barsky, A. P., Warren, C. R. & De Chermont, K. (2003).
The affective underpinnings of job perceptions and attitudes: A meta-analytic review and
integration. Psychological Bulletin, 129, 914–945.
Tucker, L. R., & Lewis, C. (1973). A reliability coefficient for maximum likelihood factor
analysis. Psychometrika, 38, 1–10.
Van Knippenberg, B., van Eijbergen, R. & Wilke, H. (1999) ‘The Use of Hard and Soft
Influence Tactics in Cooperative Task Groups’, Group Processes & Intergroup Relations
2(3), 231–44.
Viswesvaran, C., & Ones, D. (1995). Theory testing: Combing psychometric meta-analysis
and structural equation modeling. Personnel Psychology, 48, 865–885.
Weiss, H. M., & Cropanzano, R. (1996). Affective events theory: A theoretical discussion of
the structure, causes and consequences of affective experiences at work.
Research in organizational behavior, 18, 1–74.
Widaman, K.F., 1985. Hierarchically nested covariance structure models for multitrait-
multimethod data. Applied Psychological Measurement, 9, 1–26.
Xin, K. R., & Tsui, A. S. (1996). Different strokes for different folks? Influence tactics by
Asian-American and Caucasian-American managers. Leadership Quarterly, 7, 109−132.
Yukl, G. (1994). Leadership in Organizations. (3rd ed.) Englewood Cliffs, NJ: Prentice Hall.
65
Yukl, G., & Chavez, C. (2002). Influence tactics and leader effectiveness. In L. Neider & C.
Schriesheim (Eds.), Leadership: Research in management, vol. 2. (pp.139−165).
Greenwich, CT: Information Age Publishing.
Yukl, G., Chavez, C., & Seifert, C. F. (2005). Assessing the construct validity and utility of
two new influence tactics. Journal of Organizational Behavior, 26(6), 705−725.
Yukl, G., & Falbe, C. M. (1990). Influence tactics in upward, downward, and lateral
influence attempts. Journal of Applied Psychology, 75(2), 132–140.
Yukl, G., Falbe, C. M., & Youn, J. Y. (1993). Patterns of influence behavior for managers.
Group and Organization Management, 18, 5−28.
Yukl, G., Fu, P. P., & McDonald, R. (2003). Cross-cultural differences in perceived
effectiveness of influence tactics for initiating or resisting change. Applied
Psychology: An international review, 52, 68−82.
Yukl, G., Guinan, P. J., & Sottolano, D. (1995). Influence tactics used for different objectives
with subordinates, peers, and superiors. Group and Organization
Management, 20, 272−296.
Yukl, G., Kim, H., & Falbe, C. M. (1996). Antecedents of influence outcomes. Journal of
Applied Psychology, 81, 309−317.
Yukl, G., Lepsinger, R., & Lucia, A. (1992). Preliminary report on development and
validation of the influence behavior questionnaire. In K. Clark, M. B. Clark, & D.
Campbell (Eds.), Impact of leadership (pp. 417−427). Greensboro, NC: Center For
Creative Leadership.
66
Yukl, G., & Michel, J. (2006). Proactive influence tactics and leader–member exchange. In
C. A. Schriesheim & L. Neider (Eds.), Power and influence in organizations:
Research in management (pp. 87−103). Greenwich, CT: Information Age Publishing.
Yukl, G., & Tracey, B. (1992). Consequences of influence tactics used with subordinates,
peers, and the boss. Journal of Applied Psychology, 77, 525−535.
*Yukl, G., Seifert, C., & Chavez, C. (2008). Validation of the extended influence behavior
questionnaire. Leadership Quarterly, 19(5), 609-621.
Zeira, Y., & Banai, M. (1980). Selection of expatriate managers in MNCs: The host country
point of view. International Studies of Management in Organizations, 33-51.
67
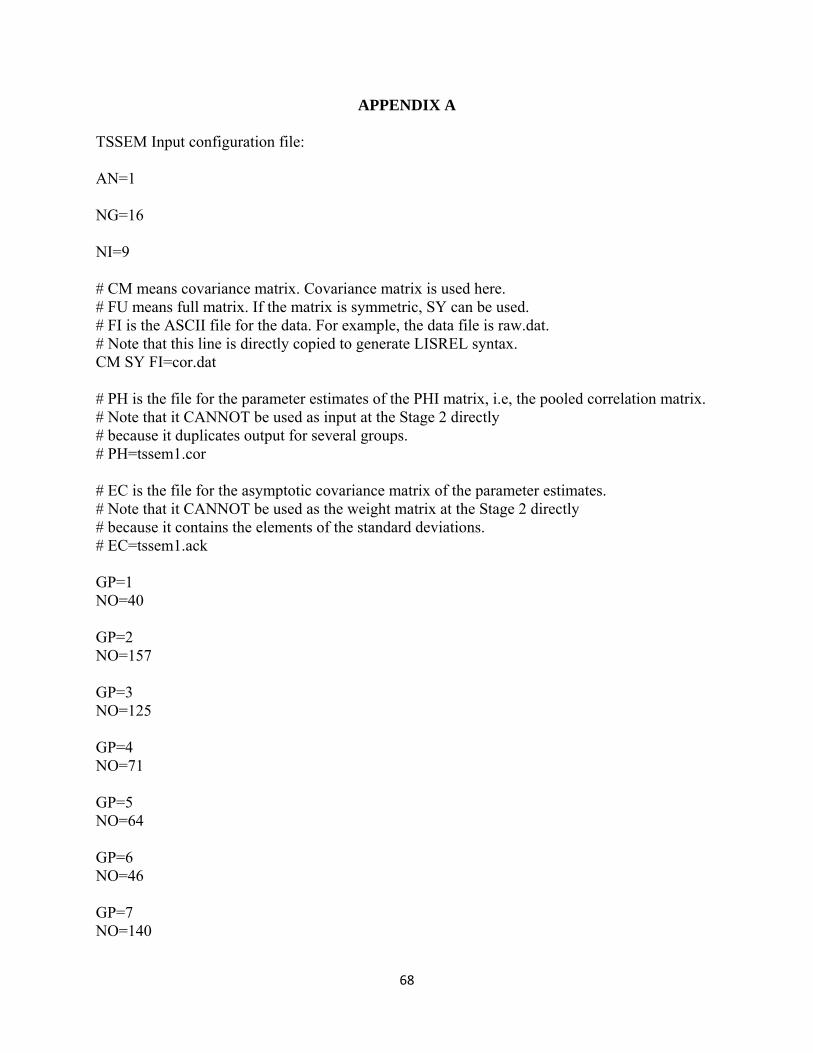
APPENDIX A
TSSEM Input configuration file: AN=1
NG=16 NI=9 # CM means covariance matrix. Covariance matrix is used here. # FU means full matrix. If the matrix is symmetric, SY can be used. # FI is the ASCII file for the data. For example, the data file is raw.dat. # Note that this line is directly copied to generate LISREL syntax. CM SY FI=cor.dat # PH is the file for the parameter estimates of the PHI matrix, i.e, the pooled correlation matrix. # Note that it CANNOT be used as input at the Stage 2 directly # because it duplicates output for several groups. # PH=tssem1.cor # EC is the file for the asymptotic covariance matrix of the parameter estimates. # Note that it CANNOT be used as the weight matrix at the Stage 2 directly # because it contains the elements of the standard deviations. # EC=tssem1.ack GP=1 NO=40 GP=2 NO=157 GP=3 NO=125 GP=4 NO=71 GP=5 NO=64 GP=6 NO=46 GP=7 NO=140
68
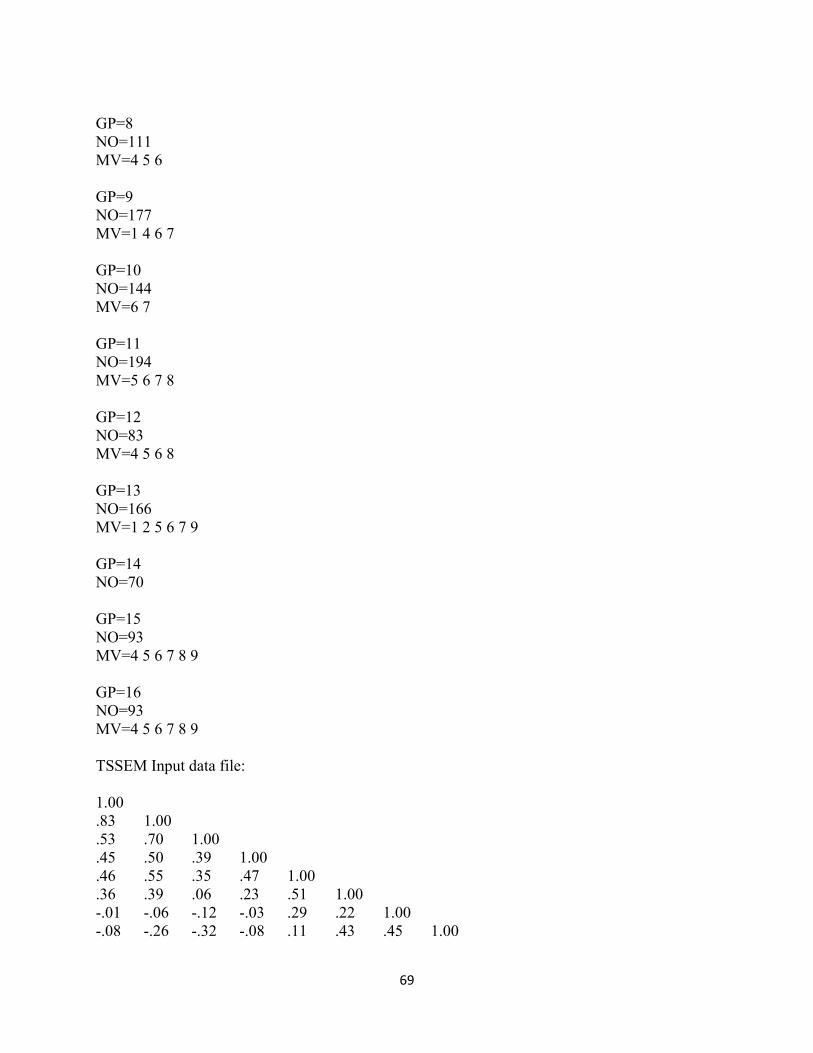
GP=8 NO=111 MV=4 5 6 GP=9 NO=177 MV=1 4 6 7 GP=10 NO=144 MV=6 7 GP=11 NO=194 MV=5 6 7 8 GP=12 NO=83 MV=4 5 6 8 GP=13 NO=166 MV=1 2 5 6 7 9 GP=14 NO=70 GP=15 NO=93 MV=4 5 6 7 8 9 GP=16 NO=93 MV=4 5 6 7 8 9 TSSEM Input data file: 1.00 .83 1.00 .53 .70 1.00 .45 .50 .39 1.00 .46 .55 .35 .47 1.00 .36 .39 .06 .23 .51 1.00 -.01 -.06 -.12 -.03 .29 .22 1.00 -.08 -.26 -.32 -.08 .11 .43 .45 1.00
69
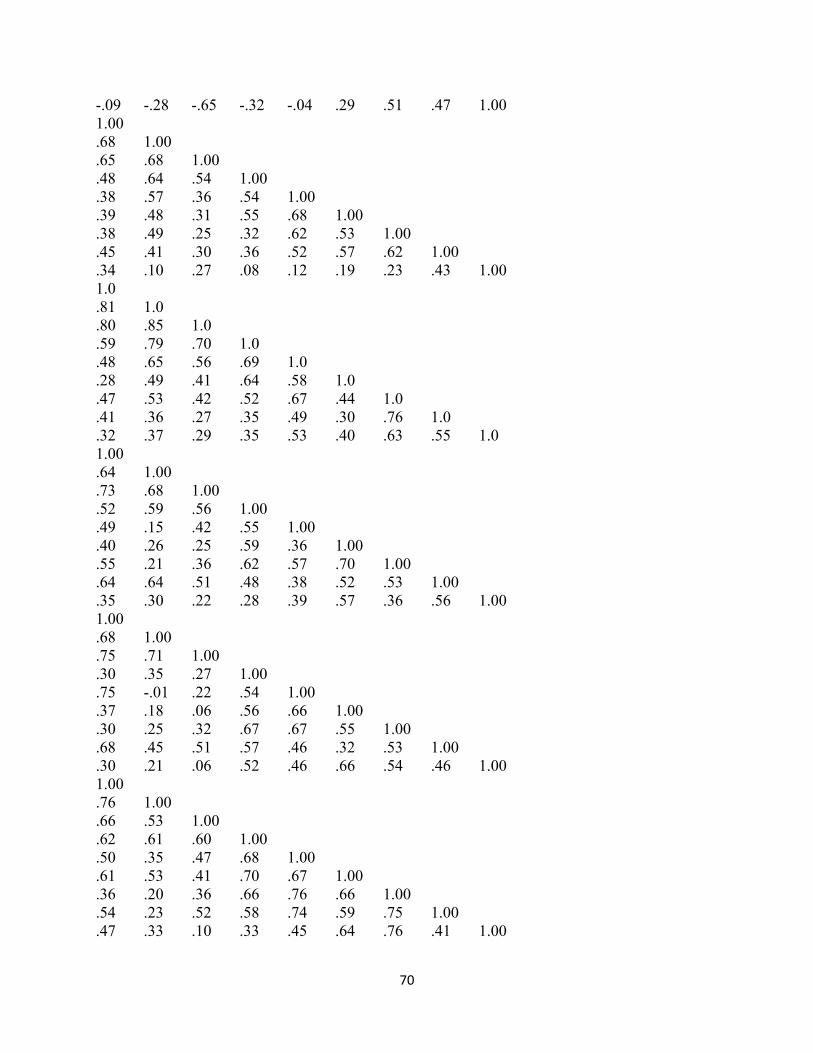
-.09 -.28 -.65 -.32 -.04 .29 .51 .47 1.00 1.00 .68 1.00 .65 .68 1.00 .48 .64 .54 1.00 .38 .57 .36 .54 1.00 .39 .48 .31 .55 .68 1.00 .38 .49 .25 .32 .62 .53 1.00 .45 .41 .30 .36 .52 .57 .62 1.00 .34 .10 .27 .08 .12 .19 .23 .43 1.00 1.0 .81 1.0 .80 .85 1.0 .59 .79 .70 1.0 .48 .65 .56 .69 1.0 .28 .49 .41 .64 .58 1.0 .47 .53 .42 .52 .67 .44 1.0 .41 .36 .27 .35 .49 .30 .76 1.0 .32 .37 .29 .35 .53 .40 .63 .55 1.0 1.00 .64 1.00 .73 .68 1.00 .52 .59 .56 1.00 .49 .15 .42 .55 1.00 .40 .26 .25 .59 .36 1.00 .55 .21 .36 .62 .57 .70 1.00 .64 .64 .51 .48 .38 .52 .53 1.00 .35 .30 .22 .28 .39 .57 .36 .56 1.00 1.00 .68 1.00 .75 .71 1.00 .30 .35 .27 1.00 .75 -.01 .22 .54 1.00 .37 .18 .06 .56 .66 1.00 .30 .25 .32 .67 .67 .55 1.00 .68 .45 .51 .57 .46 .32 .53 1.00 .30 .21 .06 .52 .46 .66 .54 .46 1.00 1.00 .76 1.00 .66 .53 1.00 .62 .61 .60 1.00 .50 .35 .47 .68 1.00 .61 .53 .41 .70 .67 1.00 .36 .20 .36 .66 .76 .66 1.00 .54 .23 .52 .58 .74 .59 .75 1.00 .47 .33 .10 .33 .45 .64 .76 .41 1.00
70
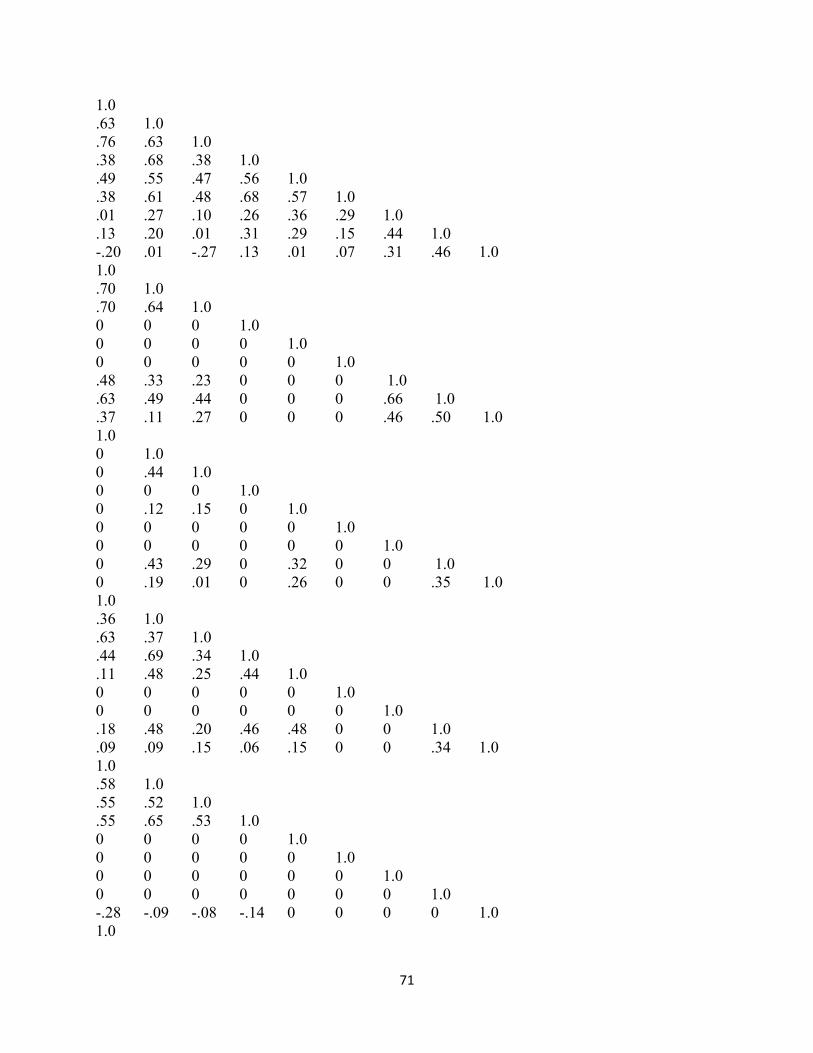
1.0 .63 1.0 .76 .63 1.0 .38 .68 .38 1.0 .49 .55 .47 .56 1.0 .38 .61 .48 .68 .57 1.0 .01 .27 .10 .26 .36 .29 1.0 .13 .20 .01 .31 .29 .15 .44 1.0 -.20 .01 -.27 .13 .01 .07 .31 .46 1.0 1.0 .70 1.0 .70 .64 1.0 0 0 0 1.0 0 0 0 0 1.0 0 0 0 0 0 1.0 .48 .33 .23 0 0 0 1.0 .63 .49 .44 0 0 0 .66 1.0 .37 .11 .27 0 0 0 .46 .50 1.0 1.0 0 1.0 0 .44 1.0 0 0 0 1.0 0 .12 .15 0 1.0 0 0 0 0 0 1.0 0 0 0 0 0 0 1.0 0 .43 .29 0 .32 0 0 1.0 0 .19 .01 0 .26 0 0 .35 1.0 1.0 .36 1.0 .63 .37 1.0 .44 .69 .34 1.0 .11 .48 .25 .44 1.0 0 0 0 0 0 1.0 0 0 0 0 0 0 1.0 .18 .48 .20 .46 .48 0 0 1.0 .09 .09 .15 .06 .15 0 0 .34 1.0 1.0 .58 1.0 .55 .52 1.0 .55 .65 .53 1.0 0 0 0 0 1.0 0 0 0 0 0 1.0 0 0 0 0 0 0 1.0 0 0 0 0 0 0 0 1.0 -.28 -.09 -.08 -.14 0 0 0 0 1.0 1.0
71
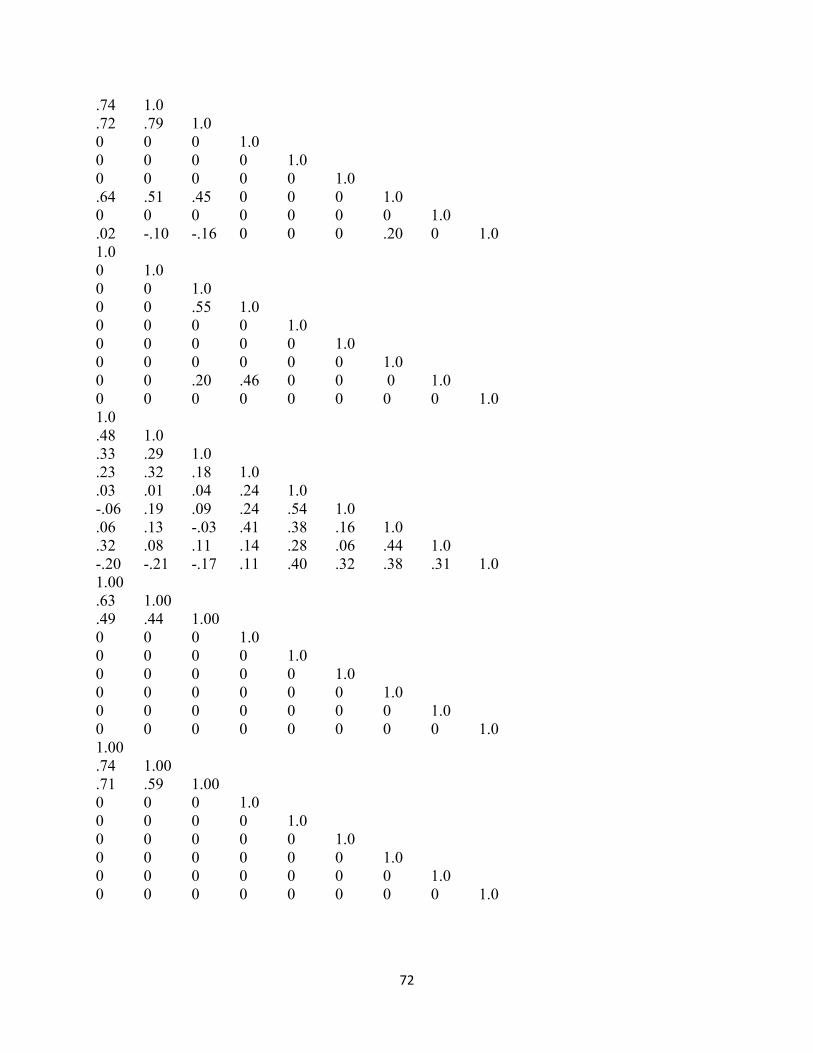
.74 1.0
.72 .79 1.0 0 0 0 1.0 0 0 0 0 1.0 0 0 0 0 0 1.0 .64 .51 .45 0 0 0 1.0 0 0 0 0 0 0 0 1.0 .02 -.10 -.16 0 0 0 .20 0 1.0 1.0 0 1.0 0 0 1.0 0 0 .55 1.0 0 0 0 0 1.0 0 0 0 0 0 1.0 0 0 0 0 0 0 1.0 0 0 .20 .46 0 0 0 1.0 0 0 0 0 0 0 0 0 1.0 1.0 .48 1.0 .33 .29 1.0 .23 .32 .18 1.0 .03 .01 .04 .24 1.0 -.06 .19 .09 .24 .54 1.0 .06 .13 -.03 .41 .38 .16 1.0 .32 .08 .11 .14 .28 .06 .44 1.0 -.20 -.21 -.17 .11 .40 .32 .38 .31 1.0 1.00 .63 1.00 .49 .44 1.00 0 0 0 1.0 0 0 0 0 1.0 0 0 0 0 0 1.0 0 0 0 0 0 0 1.0 0 0 0 0 0 0 0 1.0 0 0 0 0 0 0 0 0 1.0 1.00 .74 1.00 .71 .59 1.00 0 0 0 1.0 0 0 0 0 1.0 0 0 0 0 0 1.0 0 0 0 0 0 0 1.0 0 0 0 0 0 0 0 1.0 0 0 0 0 0 0 0 0 1.0
72
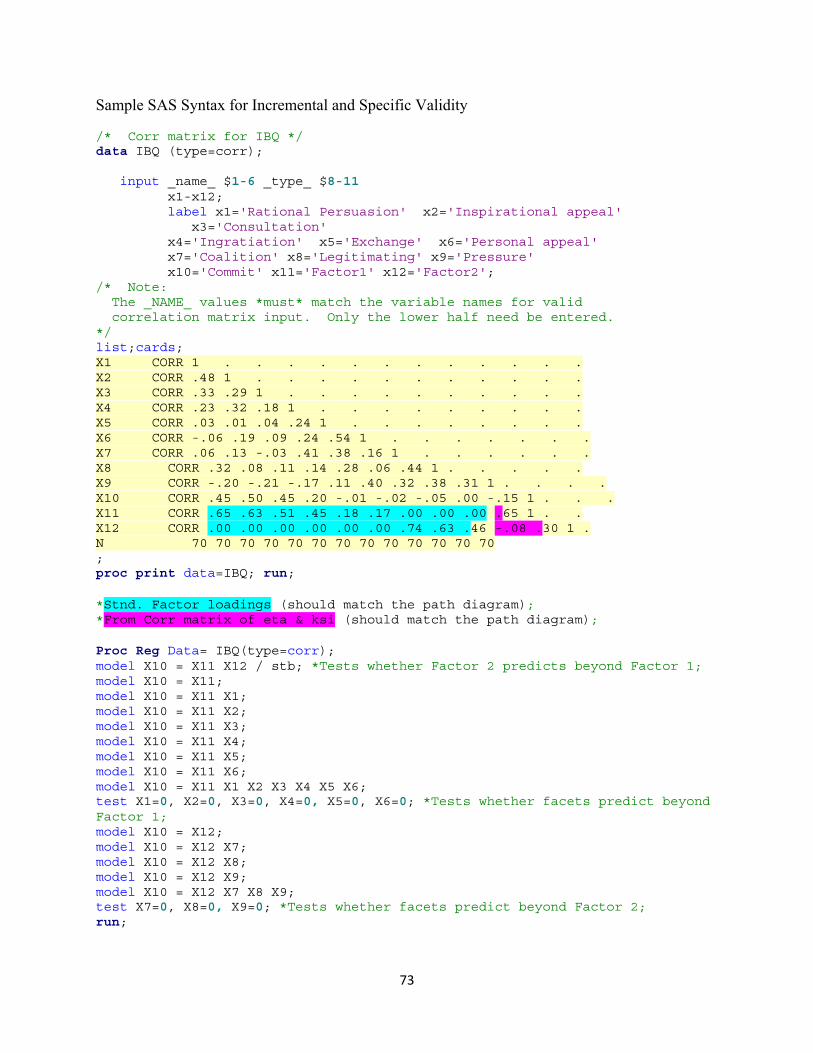
Sample SAS Syntax for Incremental and Specific Validity /* Corr matrix for IBQ */ data IBQ (type=corr); input _name_ $1-6 _type_ $8-11 x1-x12;
label x1='Rational Persuasion' x2='Inspirational appeal' x3='Consultation'
x4='Ingratiation' x5='Exchange' x6='Personal appeal' x7='Coalition' x8='Legitimating' x9='Pressure' x10='Commit' x11='Factor1' x12='Factor2'; /* Note: The _NAME_ values *must* match the variable names for valid correlation matrix input. Only the lower half need be entered. */ list;cards; X1 CORR 1 . . . . . . . . . . . . X2 CORR .48 1 . . . . . . . . . . . X3 CORR .33 .29 1 . . . . . . . . . . X4 CORR .23 .32 .18 1 . . . . . . . . . X5 CORR .03 .01 .04 .24 1 . . . . . . . . X6 CORR -.06 .19 .09 .24 .54 1 . . . . . . . X7 CORR .06 .13 -.03 .41 .38 .16 1 . . . . . . X8 CORR .32 .08 .11 .14 .28 .06 .44 1 . . . . . X9 CORR -.20 -.21 -.17 .11 .40 .32 .38 .31 1 . . . . X10 CORR .45 .50 .45 .20 -.01 -.02 -.05 .00 -.15 1 . . . X11 CORR .65 .63 .51 .45 .18 .17 .00 .00 .00 .65 1 . . X12 CORR .00 .00 .00 .00 .00 .00 .74 .63 .46 -.08 .30 1 . N 70 70 70 70 70 70 70 70 70 70 70 70 70 ; proc print data=IBQ; run; *Stnd. Factor loadings (should match the path diagram); *From Corr matrix of eta & ksi (should match the path diagram); Proc Reg Data= IBQ(type=corr); model X10 = X11 X12 / stb; *Tests whether Factor 2 predicts beyond Factor 1; model X10 = X11; model X10 = X11 X1; model X10 = X11 X2; model X10 = X11 X3; model X10 = X11 X4; model X10 = X11 X5; model X10 = X11 X6; model X10 = X11 X1 X2 X3 X4 X5 X6; test X1=0, X2=0, X3=0, X4=0, X5=0, X6=0; *Tests whether facets predict beyond Factor 1; model X10 = X12; model X10 = X12 X7; model X10 = X12 X8; model X10 = X12 X9; model X10 = X12 X7 X8 X9; test X7=0, X8=0, X9=0; *Tests whether facets predict beyond Factor 2; run;
73
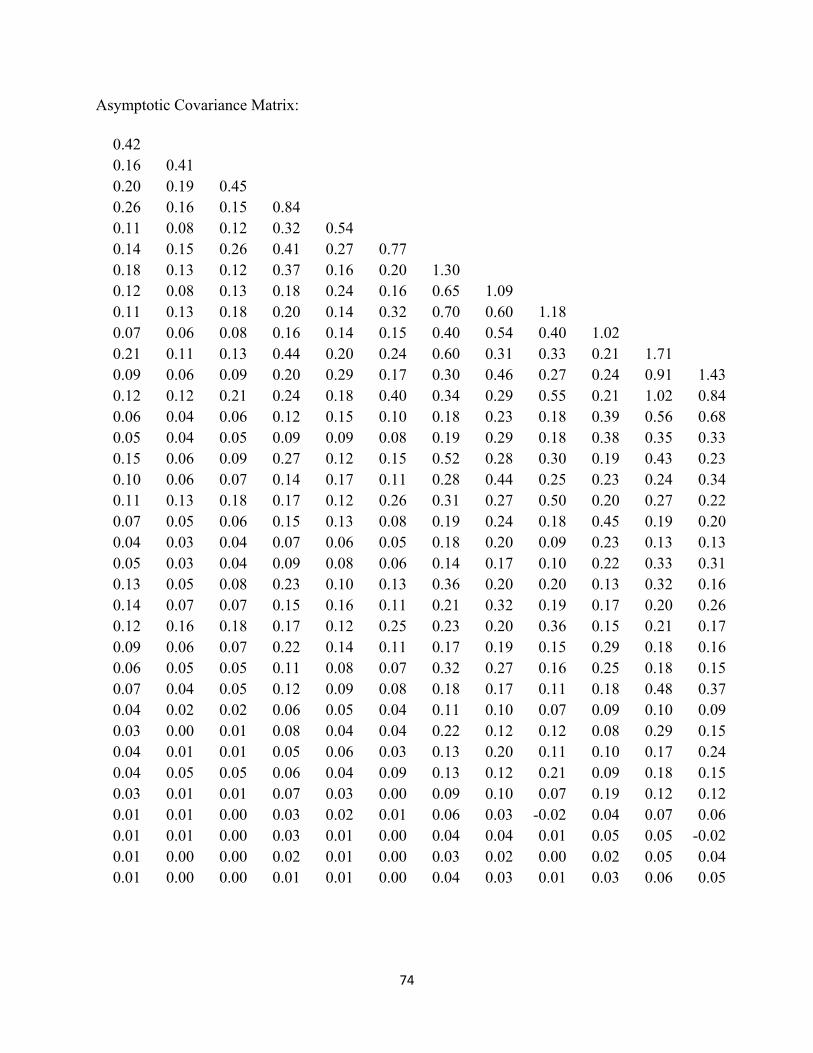
Asymptotic Covariance Matrix:
0.42 0.16 0.41 0.20 0.19 0.45 0.26 0.16 0.15 0.84 0.11 0.08 0.12 0.32 0.54 0.14 0.15 0.26 0.41 0.27 0.77 0.18 0.13 0.12 0.37 0.16 0.20 1.30 0.12 0.08 0.13 0.18 0.24 0.16 0.65 1.09 0.11 0.13 0.18 0.20 0.14 0.32 0.70 0.60 1.18 0.07 0.06 0.08 0.16 0.14 0.15 0.40 0.54 0.40 1.02 0.21 0.11 0.13 0.44 0.20 0.24 0.60 0.31 0.33 0.21 1.71 0.09 0.06 0.09 0.20 0.29 0.17 0.30 0.46 0.27 0.24 0.91 1.430.12 0.12 0.21 0.24 0.18 0.40 0.34 0.29 0.55 0.21 1.02 0.840.06 0.04 0.06 0.12 0.15 0.10 0.18 0.23 0.18 0.39 0.56 0.680.05 0.04 0.05 0.09 0.09 0.08 0.19 0.29 0.18 0.38 0.35 0.330.15 0.06 0.09 0.27 0.12 0.15 0.52 0.28 0.30 0.19 0.43 0.230.10 0.06 0.07 0.14 0.17 0.11 0.28 0.44 0.25 0.23 0.24 0.340.11 0.13 0.18 0.17 0.12 0.26 0.31 0.27 0.50 0.20 0.27 0.220.07 0.05 0.06 0.15 0.13 0.08 0.19 0.24 0.18 0.45 0.19 0.200.04 0.03 0.04 0.07 0.06 0.05 0.18 0.20 0.09 0.23 0.13 0.130.05 0.03 0.04 0.09 0.08 0.06 0.14 0.17 0.10 0.22 0.33 0.310.13 0.05 0.08 0.23 0.10 0.13 0.36 0.20 0.20 0.13 0.32 0.160.14 0.07 0.07 0.15 0.16 0.11 0.21 0.32 0.19 0.17 0.20 0.260.12 0.16 0.18 0.17 0.12 0.25 0.23 0.20 0.36 0.15 0.21 0.170.09 0.06 0.07 0.22 0.14 0.11 0.17 0.19 0.15 0.29 0.18 0.160.06 0.05 0.05 0.11 0.08 0.07 0.32 0.27 0.16 0.25 0.18 0.150.07 0.04 0.05 0.12 0.09 0.08 0.18 0.17 0.11 0.18 0.48 0.370.04 0.02 0.02 0.06 0.05 0.04 0.11 0.10 0.07 0.09 0.10 0.090.03 0.00 0.01 0.08 0.04 0.04 0.22 0.12 0.12 0.08 0.29 0.150.04 0.01 0.01 0.05 0.06 0.03 0.13 0.20 0.11 0.10 0.17 0.240.04 0.05 0.05 0.06 0.04 0.09 0.13 0.12 0.21 0.09 0.18 0.150.03 0.01 0.01 0.07 0.03 0.00 0.09 0.10 0.07 0.19 0.12 0.120.01 0.01 0.00 0.03 0.02 0.01 0.06 0.03 -0.02 0.04 0.07 0.060.01 0.01 0.00 0.03 0.01 0.00 0.04 0.04 0.01 0.05 0.05 -0.020.01 0.00 0.00 0.02 0.01 0.00 0.03 0.02 0.00 0.02 0.05 0.040.01 0.00 0.00 0.01 0.01 0.00 0.04 0.03 0.01 0.03 0.06 0.05
74
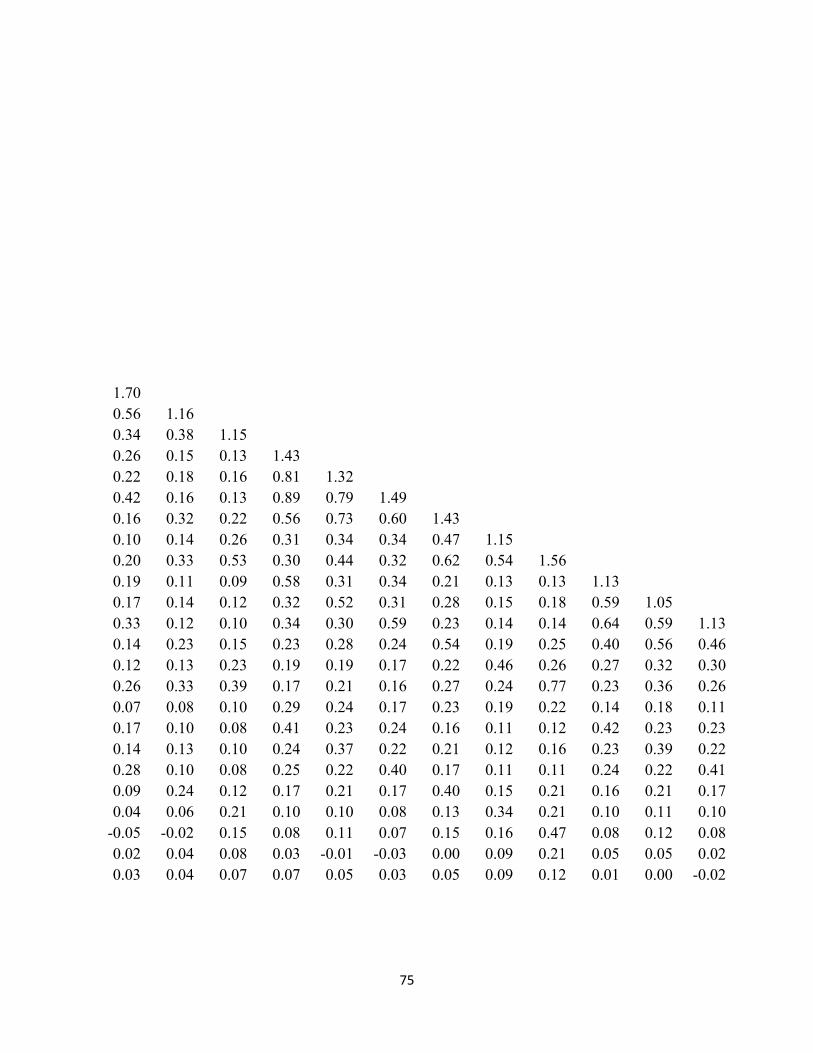
1.70 0.56 1.16 0.34 0.38 1.15 0.26 0.15 0.13 1.43 0.22 0.18 0.16 0.81 1.32 0.42 0.16 0.13 0.89 0.79 1.49 0.16 0.32 0.22 0.56 0.73 0.60 1.43 0.10 0.14 0.26 0.31 0.34 0.34 0.47 1.15 0.20 0.33 0.53 0.30 0.44 0.32 0.62 0.54 1.56 0.19 0.11 0.09 0.58 0.31 0.34 0.21 0.13 0.13 1.13 0.17 0.14 0.12 0.32 0.52 0.31 0.28 0.15 0.18 0.59 1.05 0.33 0.12 0.10 0.34 0.30 0.59 0.23 0.14 0.14 0.64 0.59 1.130.14 0.23 0.15 0.23 0.28 0.24 0.54 0.19 0.25 0.40 0.56 0.460.12 0.13 0.23 0.19 0.19 0.17 0.22 0.46 0.26 0.27 0.32 0.300.26 0.33 0.39 0.17 0.21 0.16 0.27 0.24 0.77 0.23 0.36 0.260.07 0.08 0.10 0.29 0.24 0.17 0.23 0.19 0.22 0.14 0.18 0.110.17 0.10 0.08 0.41 0.23 0.24 0.16 0.11 0.12 0.42 0.23 0.230.14 0.13 0.10 0.24 0.37 0.22 0.21 0.12 0.16 0.23 0.39 0.220.28 0.10 0.08 0.25 0.22 0.40 0.17 0.11 0.11 0.24 0.22 0.410.09 0.24 0.12 0.17 0.21 0.17 0.40 0.15 0.21 0.16 0.21 0.170.04 0.06 0.21 0.10 0.10 0.08 0.13 0.34 0.21 0.10 0.11 0.10
-0.05 -0.02 0.15 0.08 0.11 0.07 0.15 0.16 0.47 0.08 0.12 0.080.02 0.04 0.08 0.03 -0.01 -0.03 0.00 0.09 0.21 0.05 0.05 0.020.03 0.04 0.07 0.07 0.05 0.03 0.05 0.09 0.12 0.01 0.00 -0.02
75
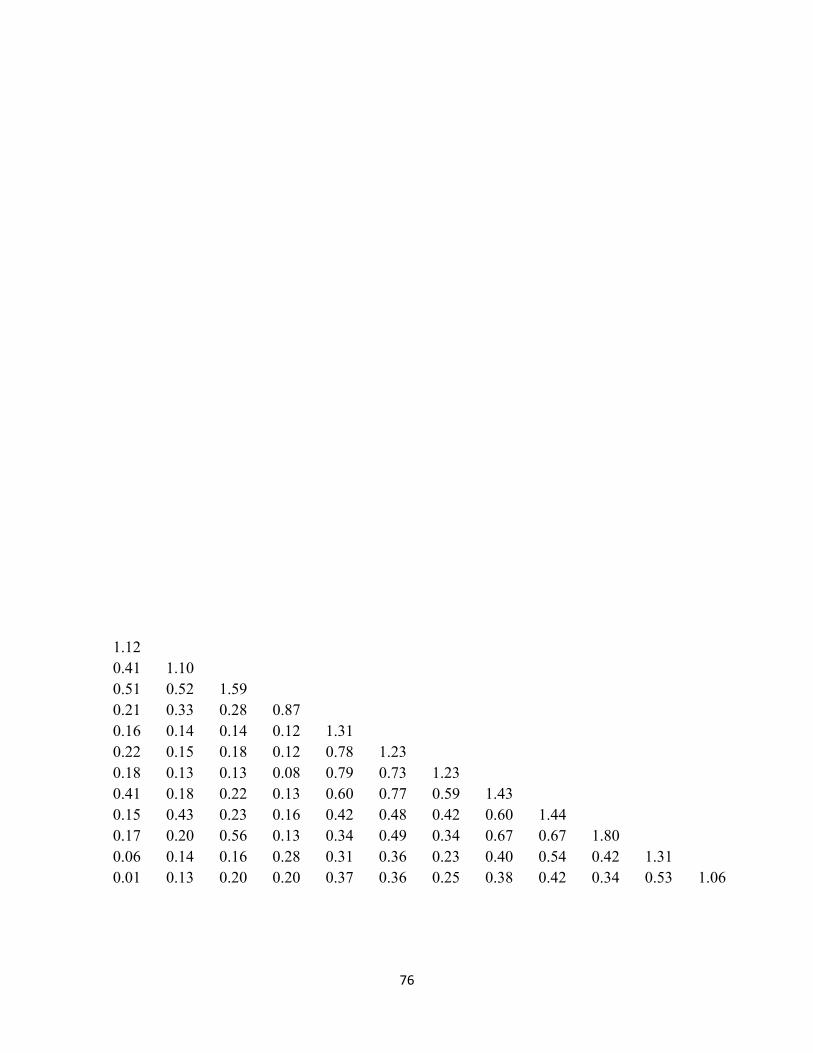
76
1.12 0.41 1.10 0.51 0.52 1.59 0.21 0.33 0.28 0.87 0.16 0.14 0.14 0.12 1.31 0.22 0.15 0.18 0.12 0.78 1.23 0.18 0.13 0.13 0.08 0.79 0.73 1.23 0.41 0.18 0.22 0.13 0.60 0.77 0.59 1.43 0.15 0.43 0.23 0.16 0.42 0.48 0.42 0.60 1.44 0.17 0.20 0.56 0.13 0.34 0.49 0.34 0.67 0.67 1.80 0.06 0.14 0.16 0.28 0.31 0.36 0.23 0.40 0.54 0.42 1.31 0.01 0.13 0.20 0.20 0.37 0.36 0.25 0.38 0.42 0.34 0.53 1.06