Embed Size (px)
Citation preview
REPORT NO. 5-1
LEAD PROGRAMME IN TECHNOLOGIES FOR ENHANCED ENVIRONMENTAL MANAGEMENT
OUTPUT TRACKING SHEET Project Phase: Phase 5 Title: Report on Human Health Risk Assessment of
Exposure to Sulphur Dioxide and Nitrogen Dioxide in the Greater Cato Manor - Durban.
Author: Mamopeli Matooane Version: Final Reviewer: Michelle Binedell (CSIR) & Roseanne Diab
(University of Natal) Date of finalisation: December 2000 Referenced as: Matooane, M (2000): Report on Human Health Risk
Assessment of Exposure to Sulphur Dioxide and Nitrogen Dioxide in the Greater Cato Manor-Durban. University of Natal, Durban. Lead Programme in
Technologies for Enhanced Environmental
Management, Report no. P5-1, Durban.
Sign-off:………………………………… Project manager
THE LEAD PROGRAMME IS FUNDED BY THE DEPARTMENT OF ARTS, CULTURE, SCIENCE AND TECHNOLOGY

2
REPORT ON
HUMAN HEALTH RISK ASSESSMENT OF EXPOSURE TO
SULPHUR DIOXIDE AND NITROGEN DIOXIDE IN THE
GREATER CATO MANOR – DURBAN
2000
Prepared by Prepared for
`Mamopeli Matooane CSIR - Durban
University of Natal-Durban Environmentek Division
Department of Geography and P.O. Box 17001
Environmental Sciences Durban
Memorial Tower Building (3rd floor) 4013
Durban
4041

3
EXECUTIVE SUMMARY
Air pollution particularly in developing countries is a major problem due to the many
and varied health effects associated with different forms of air pollution.
Understanding the link between air pollution and health is fundamental to the
development of appropriate control strategies aimed at improving the health of
people. South Africa, like many countries is affected by high levels of air pollution
with particular areas forming hot spots South Durban Industrial Basin. Sulphur
dioxide and Nitrogen dioxide are the main pollutants with which extensive monitoring
has been done. Poor communities such as Cato Manor are also faced with air
pollution problems given the types of fuels used within the homes for cooking and
space heating as well as external sources such as vehicles. This means that people
residing in poor communities are likely to develop air pollution associated health
problems.
The objective of this study was to quantitatively assess the health risk of sulphur
dioxide and nitrogen dioxide in Cato Manor. The methodology adopted in carrying
out the study was that of the U.S. EPA Human Health Risk Assessment Method,
which comprise of hazard assessment, dose-response assessment, exposure
characterisation, and risk characterisation. Both acute and chronic exposure
assessment were performed. The assessment was performed for only ambient
exposures for sulphur dioxide, and for both indoor and outdoor exposures for
nitrogen dioxide. Exposure assessment and risk calculation were done using the
equations adopted from the U.S. EPA model.
The assessment involved the use of monitored sulphur dioxide data for one year
1999/2000. For nitrogen dioxide, data from Wentworth monitoring station was used
since there were no data available for Cato Manor. This attaches some uncertainty to
the nitrogen dioxide results. Sulphur dioxide data results show that exposure
concentrations for sulphur dioxide are very low, 11.3 µg/m3 for short-term exposures,
and 0.67 µg/m3 for long-term exposures. Exposure concentrations for nitrogen
dioxide for short-term and long-term were 153.0 µg/m3 and 33.1 µg/m3 respectively.
4
Exposure scenarios used in the study were based on assumptions made by the
researcher which were deemed appropriate for Cato Manor. The assumptions and
lack of Cato Manor specific data create uncertainties with regard to the results of the
study. Therefore interpretation of the results of the study should be done with
caution.
The results of the assessment show that all the receptors at different exposures are
unlikely to develop sulphur dioxide associated health problems. For the nitrogen
dioxide assessment all receptors except one, infants, are unlikely to develop health
problems. Infants under 23-hour exposure to nitrogen dioxide indoors are likely to
develop health problems (under both scenario 3 and 4). Based on this outcome it is
therefore imperative that appropriate strategies are adopted to protect the health of the
infants in Cato Manor.
5
TABLE OF CONTENTS 1. BACKGROUND 1 1.1 Introduction 1 1.2 Aims and objectives of the study 1 1.3 Contextual background to Cato Manor 2 1.4 Environmental Management 2 2. RISK ASSESSMENT 4 2.1 Human Health Risk Assessment 4 3. METHODOLOGY 7 3.1 Hazard Assessment 7 3.2 Dose-Response Assessment 8 3.3 Exposure Assessment 8 3.4 Risk Characterisation 9 3.5 Uncertainty Analysis 9 4. RESULTS 10 4.1 Hazard Assessment, Sulphur dioxide and Nitrogen dioxide 10 4.2 Dose-Response – Sulphur dioxide and Nitrogen dioxide 12 4.3 Exposure Assessment 16 4.3.1 Exposure Setting Characterisation 17 4.3.2 Exposure Scenario Identification 20 4.4 Exposure Scenario Results 26 4.5 Risk Characterisation 34 4.6 Other findings 35 5. UNCERTAINTY ANALYSIS 36 5.1 Decision Rule Uncertainty 36 5.2 Model Uncertainty 37 5.3 Variable Uncertainty 38 6. DISCUSSION 38 6.1 Acute Exposure 38 6.2 Chronic exposure 38 7. CONCLUSION 45 8. RECOMMENDATIONS 45 REFERENCES 47 APPENDIX 1 CALCULATION OF EXPOSURE DURATION 49 APPENDIX 2 RISK CALCULATION 53 APPENDIX 3 LIST OF ACRONYMS AND DEFINITIONS
6
1. BACKGROUND 1.1 Introduction
The study on human health risk assessment of exposure to air pollutants in Cato
Manor is a part of the Lead Programme in Technologies for Enhanced Environmental
Management funded by the Department of Arts, Culture, Science and Technology
(DACST). The project was awarded to the Council for Scientific and Industrial
Research (CSIR). The main objective of the project is to produce a toolbox that will
be used to identify appropriate technologies and actions to satisfy community needs
and environmental quality in a cost-effective manner. The project is active in two
areas, Alexandra in Johannesburg and Cato Manor in Durban. Several studies have
been conducted to supply the needed and relevant information to the understanding of
environmental problems and associated consequences in the two study areas.
This report is a contribution to the Cato Manor-Durban studies phase 4. It focuses on
the analysis of the air pollution data in relation to human health. This is done through
the use of human health risk assessment of exposure to air pollutants, sulphur dioxide
and nitrogen dioxide. The report discusses the environmental health hazards
associated with two pollutants, sulphur dioxide and Nitrogen dioxide, dose-response
relationships, exposure assessments and lastly the characterization of the health risks.
This is done through the following study objectives.
1.2 Study Aims and Objectives
The main aims of the study are to quantitatively assess:
(1) The human health risk of exposure to sulphur dioxide in Cato Manor.
(2) The human health risk of exposure to nitrogen dioxide in Cato Manor.
The above broad aims are supported by the following objectives:
� Identification of associated health problems with SO2 and NO2 exposure
� Investigate the levels of exposure at which the target population is expected to
develop the SO2 and NO2 associated health problems.
� Investigate the exposure scenarios for Cato Manor.
� Risk characterization
7
1.3 Contextual background of Cato Manor
Cato Manor is considered one of South Africa's poor communities. The events that
have shaped the present day Cato Manor are rooted in the past apartheid political
regime's socio-economic and political issues. These issues were characterized by
forced removals, racial segregation and racially based development. These and other
events left most of the disadvantaged communities poor. Most of Cato Manor has
been developed and is being serviced with exceptions to few other areas like Cato
Crest. It is characterized by poor housing, overcrowding, inadequate safe water
supply and sanitation, improper waste management, poor infrastructure, which are
traditional environmental health problems and modern environmental health problems
due to considerable levels of pollution. Air pollution is of particular relevance to the
study (Hindson and Makhathini, 1993).
Due to the lack of subsistence facilities such as electricity, the people of Cato Manor
rely on the use of fuels such as paraffin, gas and wood for cooking and space heating.
The problem with these types of energy sources is that they pose health hazards to the
inhabitants of Cato Manor. The people exposed to these hazards are likely to develop
respiratory problems associated with pollutants emitted by the fuels used.
1.4 Environmental Management through governmental policies South Africa relies on the use of various pieces of legislation to ensure the protection on the environment and public health. Various governmental departments administer the laws according to the goals of each ministry. The overall body of legislation that sets the trends to be followed is the constitution. The South African constitution through the Bill of Rights states that:
Every one has a right to:
� An environment that is not harmful to their health or well being; and
� To have the environment protected, for the benefit of present and future
generations, through reasonable legislative and other measures…”
The policies developed in South Africa based on the constitutional mandate that bear
particular relevance to the protection of the environment, air quality and public health
are: Atmospheric Air Pollution Prevention Act, 45 of 1965 and the Health Act, 63 of
the 1977 and integrated waste management and pollution in South Africa. The air

8
pollution legislation regulates various pollutants, which include noxious or offensive
gases, smoke, dust and fumes emitted by vehicles. The approach adopted in the
legislation is that South Africa is a controlled region for which a permit is required for
each scheduled process to occur. South Africa has developed air quality guidelines
for the criteria pollutants administered by the Department of Environment Affairs and
Tourism. Table 1 shows the South African guidelines for SO2 and NO2 together with
the WHO guidelines and U.S. EPA standards.
Table 1: Air pollution Standards and Guidelines µµµµg/m3
Pollutant Averaging
Time
EPA
Standard
WHO
Guideline
DEAT
Guideline
SO2 1 year
24 hours
10 minutes
80
365
-
50
125
500
86
286
1716
NO2 1 year
24 hours
1 hour
100
-
-
40
-
200
94
187
374
Source: DEAT 1998.
Environmental Defence Chemical Scorecard 1999.
The Health Act regulates the conditions that are dangerous to health. The law
prohibits any trade or occupation that is deemed harmful to health. It also advocates
the adoption of prevention measures to ensure the safety and health of the peoples of
South Africa.
2. HUMAN HEALTH RISK ASSESSMENT PROCESS
HAZARD IDENTIFICATION
9
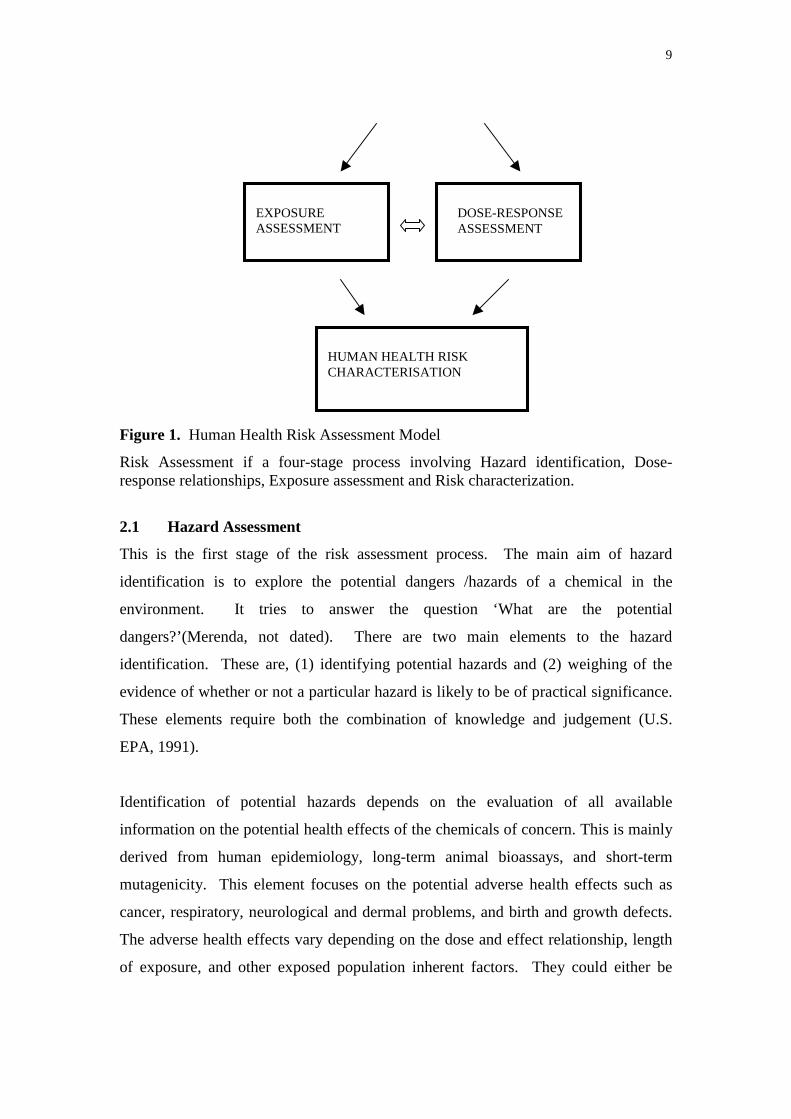
Figure 1. Human Health Risk Assessment Model
Risk Assessment if a four-stage process involving Hazard identification, Dose-response relationships, Exposure assessment and Risk characterization.
2.1 Hazard Assessment
This is the first stage of the risk assessment process. The main aim of hazard
identification is to explore the potential dangers /hazards of a chemical in the
environment. It tries to answer the question ‘What are the potential
dangers?’(Merenda, not dated). There are two main elements to the hazard
identification. These are, (1) identifying potential hazards and (2) weighing of the
evidence of whether or not a particular hazard is likely to be of practical significance.
These elements require both the combination of knowledge and judgement (U.S.
EPA, 1991).
Identification of potential hazards depends on the evaluation of all available
information on the potential health effects of the chemicals of concern. This is mainly
derived from human epidemiology, long-term animal bioassays, and short-term
mutagenicity. This element focuses on the potential adverse health effects such as
cancer, respiratory, neurological and dermal problems, and birth and growth defects.
The adverse health effects vary depending on the dose and effect relationship, length
of exposure, and other exposed population inherent factors. They could either be
DOSE-RESPONSE ASSESSMENT
EXPOSURE ASSESSMENT
HUMAN HEALTH RISK CHARACTERISATION
10
acute following short-term exposure or chronic following long-term exposure (U.S.
EPA, 1991).
The weight of evidence allows the researcher to make assumptions about the linkage
of chemical exposure to observed health effects. The studies that show positive link
to the hazard-observed health effects are favoured over the studies showing the
negative results (Mazurek, 1996). However, hazard identification is associated with
some form of uncertainty. It relates to the lack of complete scientific information and
understanding of (1) all the variables affecting exposure, (2) fate of pollutants in the
environment, (3) the inability to know it all (U.S. EPA, 1999).
2.2 Dose-Response Assessment
This stage of the risk assessment tries to answer the question ‘What are the health
problems at different exposures?’ The dose-response relationship is a description of
the association of exposure magnitude, frequency, and duration to the observed health
effects (US EPA, 1991; Rodricks, 1994).
Dose-response relationship uses two approaches, the reference levels and unit risk.
The reference level approach assumes that health effects are observable after exposure
to a certain dose or concentration. This approach applies to the dose-response
relationships for non-cancer effects. It assumes a threshold amount of exposure below
which no health effects are visible. The doses below the threshold value are
considered low and any health effects occurring from such exposures are remedied by
the body’s defence mechanism (Merenda, not dated; US EPA, 1991).
The second approach of the unit risk refers to the dose-response relationship for
cancer. The assumption here is that exposure to any dose/concentration of chemicals
known or suspected to cause cancer poses a health risk. The unit risk approach
suggests that every unit of increase in exposure, results in the increase of cancer
response (U.S. EPA, 1991).
The uncertainty of both approaches stems from the data type and quality, the
qualitative and quantitative differences between test species and target species, and
the mathematical models used to extrapolate results. Firstly, due to the little
11
epidemiological data available, dose-response relationships rely mostly on
extrapolation of results from laboratory studies involving animals to human
populations. The uncertainty surrounds the assumption that health effects observed in
test species, administered high doses reflects the actual human-environmental-
exposure-effect relationship. Secondly, humans and animals absorb, metabolise or
biologically respond differently to the exposure chemical due to their differences in
size, weight, and other factors. Lastly the mathematical models used to extrapolate
are limited to a range of carcinogenesis resulting from ionising radiation doses or on
one particular class of chemicals known as genotoxins (Mazurek, 1996; Merenda, not
dated).
2.3 Exposure Assessment
Exposure assessment answers the question ‘How much of the pollutant do people
inhale during a specific time period?’ The focus of this stage is to identify how much
the population is exposed to and how many people are exposed. Due to the many
sources of pollutants, the first step is to identify and locate all the possible sources of
the pollutant of concern. The second step is to determine the amount of the toxic
substance released by the sources, taking the time factor into consideration. The
movement of the pollutant from the source into the environment has to be ascertained.
The concentration of the pollutant at different distances away from the source has to
be taken into account as well. The last step is to determine the exposed population
and its attributes (U.S.EPA, 1991; Rodricks, 1994).
The uncertainty surrounding this stage is the use of sometimes overly conservative
assumptions. In the US when regulators attempt to discern effects to individuals the
assumptions are based on the most exposed to a particular chemical. This approach
marginalizes the possibility of having people who are infrequently exposed to small
concentrations in the everyday environment. There is also no absolute certainty in the
results supplied by computer/mathematical models and monitors used to estimate the
accurate exposure (Mazurek, 1996; U.S. EPA, 1999).
2.4 Risk Characterization
This is the fourth and last stage of the risk assessment process. Risk characterization
integrates results from all the first three stages. The integration of results needs to be

12
done in a way that accurately reflects the severity of the health risks, the associated
uncertainties and lastly the assumptions used throughout the process (Mazurek, 1996).
Attached to the risk characterization is the full exposition of the scientific degree of
certainty that can be attached to the risk knowledge. The risk characterization should
provide a base for risk management and communication (Rodricks, 1994; U.S. EPA,
1995).
3. METHODOLOGY
The U.S. EPA human health risk assessment methodology is adopted in this study.
The risk assessment is used to determine the actual risks to the exposed population to
environmental pollutants SO2 and NO2 in Cato Manor, Durban. The process follows
four steps as outlined below:
3.1 Hazard Identification
SO2 and NO2 are considered as pollutants and as such are considered as potential
health hazards in the environment. The hazard identification explores the SO2 and
NO2 health associated problems. This information is derived from literature review.
This process establishes the SO2 and NO2 relationship to adverse health effects
associated with them. The type of adverse health effects is also explored for both
acute and chronic exposures.
3.2 Dose-Response Assessment
This is the second stage of the risk assessment process. The aim of this stage is to
ascertain the relationship of the level of exposure to the severity of observed health
effects. The information used in the report is derived from quantitative
epidemiological and laboratory animal studies from WHO and U.S. EPA and other
sources. SO2 and NO2 dose-response relationships are explored.
3.3 Exposure Assessment
The exposure assessment identifies the exposure pathways, rates of movements,
chemical transformations for both SO2 and NO2. Exposure concentrations and the
target organs for the two pollutants are also identified. The target population and its
attributes, and the conditions under which the exposures take place are explored.
These include the magnitude, frequency and duration of exposure, time-activity
13
patterns, the size and geographic distribution of the population in Cato Manor. There
are three steps to accomplishment of the exposure assessment and these are: (1)
exposure setting characterization; (2) exposure scenario identification; and (3)
exposure location identification (U.S. EPA, 1999).
The calculation of the Average Daily Dose (ADD) follows for both SO2 and NO2.
The ADD is then used to calculate the Hazard Quotient (HQ) in stage four. The ADD
is calculated for only one exposure route, inhalation and one exposure medium, air,
for both pollutants. The calculations exclude the cancer exposure assessment
calculation because both SO2 and NO2 are not carcinogenic. The calculations are done
using the following equations:
Acute exposure Chronic exposure ADD = C IR ADD = C IR ED BW BW AT Where, ADD = Average Daily Dose (g/kg/hr) C= concentration (µg/m3) IR= Inhalation Rate (m3/day) BW= Body Weight (kg) ED= Exposure Duration (days) AT= Averaging Time (days)
3.4 Risk characterization
The ADD determined above is factored into the risk calculation to determine the
Hazard Quotient (HQ), which is an expression for non-cancer health effects. The
calculation of HQ follows the equation outlined below for both acute and chronic
HQs.
HQ = ADD REL
Where, HQ = Hazard Quotient ADD = Average Daily Dose REL = Reference Exposure Level (equivalent to the Reference Exposure Concentration -RfC)
3.5 Uncertainty in Risk Assessment Methodology
As it has been mentioned earlier uncertainty is inherent in every step of the risk
assessment process and in particular to this study uncertainty analysis of the
14
assumptions, models and variables used in the study is reflected in the results section.
The uncertainty is discussed as decision-rule, model and variable uncertainty.
The methodology outlined above sets out steps to be followed in order to realize the
study objectives. Through the use of this method several facts were discovered and
these are discussed the following section.
4. RESULTS
4.1 Hazard Assessment - Sulphur dioxide Sulphur dioxide belongs to the family of sulphur oxide gases. It is a highly reactive,
colourless, irritating, pungent and water-soluble gas. It emanates from both
anthropogenic and natural sources. The anthropogenic sources of SO2 include
burning of fuels with high sulphur content (U.S. EPA, 1999; WHO, 1999). In South
Africa the main sources of sulphur dioxide include power plants and vehicular
emissions, and burning of coal as an energy source in many homes across the country.
The most affected population is the one staying in close proximity to these sources.
The industrial emissions of SO2 in South Africa are estimated to be 1.2 million tons a
year (Grange, 1991).
It is classified as one of the criteria pollutants due to its association with the onset or
aggravation of respiratory tract symptoms in immuno-compromised people. Health
effects due to sulphur dioxide are noticeable after a few minutes of exposure to high
concentrations. The severity of the effects is also influenced by human and other
environmental factors (WHO, 1999; U.S. EPA, 1998).
The human factors include age, presence of debilitating disease, and these groups of
people comprise risk groups. The risk groups to SO2 exposure are the elderly,
children, asthmatics, and people with chronic lung diseases or cardiovascular diseases
(U.S. EPA, 1998; WHO 1999). The environmental factors include the concentration
and fate of SO2 in the environment, and the time and length of exposure.
High concentrations of SO2 in the atmosphere result in the increase and/or
exacerbation of health effects. The high concentrations are associated with poor
meteorological conditions that play an important role in the dispersion of air
15
pollutants. Poor wind conditions coupled with flat terrain and presence of
temperature inversions result in high local concentrations of pollutants. This gives
rise to high concentrations and associated health risks to the exposed population
(WHO, 1999).
Various environmental pathways determine the fate of SO2 in the environment. SO2 is
a precursor to acidic deposition that is associated with the acidification of soils, lakes
and streams. It is also related to the accelerated corrosion of buildings and other
material. The acidic deposition occurs through the atmospheric transformations of
SO2 to create sulphuric acid (H2SO4) and other acid aerosols. Thermal action aids the
transformation of SO2 to SO3 in the atmosphere. SO3 a hygroscopic gas, then reacts
with water to form sulphuric acid mists. The H2SO4 reacts with other chemicals such
as ammonia to produce ammonium bisulphate (NH4HSO4) and ammonium sulphate
((NH4)2SO4). These components are constituents to the SMP and are associated with
visibility reduction. H2SO4 is suspected to be the actual cause of ill effects observed
in epidemiological studies. This is based on premise that adverse health effects have
been observed from aerosols in the absence of sulphur (Scwhela, 1996; U.S. EPA,
1998; WHO 1999).
4.1.2 Hazard Assessment- Nitrogen dioxide
Nitrogen dioxide belongs to the family of nitrogen oxides (NOx). It is a reddish-
brown gas with a pungent odour. It is highly reactive but relatively insoluble in water.
It is one of the smog forming chemicals. Nitrogen dioxide occurs naturally in the
atmosphere. The anthropogenic sources of the gas include the burning of gasoline,
coal, oil and other fuels (U.S. EPA, 1999). In South Africa the main sources of
nitrogen dioxide include power plants and vehicular emissions, and burning of coal as
an energy source in many homes across the country. The high levels of NO2 are
prevalent in areas with high industrial activity. Grange (1991) estimates that power
plants alone in South Africa emit 0.4 million tons of NOx per annum.
The high ambient concentrations of nitrogen dioxide are influenced by
meteorological conditions prevalent in South Africa. Like in the case of SO2, wind
speed, temperature inversions and precipitation all influence the ambient levels of
NO2. High wind speed and precipitation result in reduced levels of NO2 while low
16
wind speed and temperature inversions result in high episodes of localized NO2 levels.
The high levels of ambient NO2 result in both environmental and health effects
(Grange 1991; WHO, 1999).
The NO2 undergoes atmospheric transformation to create nitric acid. The major
environmental effect of NO2 is acidic deposition. The NO2 acts as an ingredient to the
formation of acid aerosols, which damage water bodies and vegetation, as well as
buildings. It is also associated with visibility degradation.
The health effects of exposure to NO2 are categorized into the short-term and long-
term effects depending on the type of exposure. The short-term effects of NO2
include irritation of the eyes, skin and the respiratory system. Lung oedema may
result from non-irritant concentrations. Under occupational exposures NO2 results in
headache, dizziness, cough, sweating, laboured breathing, nausea, sore throat,
vomiting and weakness, wheezing and shortness of breath (WHO/IPCS/ILO, 1999).
The long-term environmental exposure to NO2 affects the immune system resulting in
low resistance to infection and cause genetic damage in humans. It also results in
increased sensitivity to broncho-constrictors and airway resistance.
4.2 Dose-Response Assessment
4.2.1 Dose-Response Assessment - Sulphur dioxide
Sulphur dioxide is considered a toxicant according to the toxicity data from the
Environmental Defence Chemical Scorecard. Therefore sulphur dioxide dose-
response relationship assumes a threshold value above which health effects may start
to be experienced. The threshold values and observed health effects vary with
duration of exposure (U.S. EPA, 1991;Genthe, 1998). SO2 has threshold values for
both acute and chronic exposures. These are the Reference Exposure Levels (RELs)
taken from the Environmental Defence Chemical Scorecard and the Office of
Environmental Health Hazard Assessment RELs summary tables. It is 660 µg/m3 for
acute exposure. There is no long term SO2 exposure reference level (OEHHA, 1997;
EDCS, 2000), therefore the WHO mean annual standard of 50 µg/m3 will be used.
The health end point of SO2 is the respiratory system. The toxicity of SO2 in the
17
respiratory system results in lesions of the lower respiratory tissue that lead to
increased airflow resistance (Scwhela, 1996).
The types of health effects observed due to SO2 are found to be dose, time and length of exposure dependent (WHO, 1999). Under the short-term exposure periods, i.e. <24 hours, the observed health effects include reduction in the mean forced expiratory volume over one second (FEV1), increases in specific airway resistance (sRAW) and symptoms such as wheezing or shortness of breath particularly in asthmatics. These results were noted from controlled chamber experiments on volunteers exposed to SO2 for periods ranging from a few minutes up to one hour (WHO, 1999; U.S. EPA, 1997,1998).
Epidemiological studies have been used to provide information on health effects
resulting from exposure duration periods over 24 hours. The noted effects were
observed when SO2 concentrations were above 250 µg/m3 in the presence of
suspended particulate matter (SPM). Studies conducted in Europe on ambient
concentrations of SO2 revealed that at mean annual concentrations below 50 µg/m3,
with daily levels not exceeding 125 µg/m3 observed health effects included total
cardiovascular and respiratory effects that led to sometimes emergency hospital
admissions and chronic obstructive pulmonary disease (COPD) (WHO, 1999).
Evidence on long-term exposure to SO2, over one year, reveals that lowest observed adverse health effect level is 100 µg/m3 in the presence of SPM. However, health effects have been observed below this level in studies related to industrial sources of SO2 or to changed urban mixtures of air pollutants (WHO, 1999). The health effects observed includes alterations in the lung’s defence mechanism and premature death. The major problem with interpretation of results from SO2 health effects studies lies with its association to SMP. Literature explains that there is some uncertainty associated with the linkage of SO2 to observed health effects. There is a possibility that SO2 acts only as a surrogate for SMP of PM10 and PM2.5. This is because similar health effects are observable in the absence of SO2 (WHO, 1999; U.S.EPA, 1998).
4.2.2 Dose-Response Relationship - Nitrogen dioxide
Nitrogen dioxide is a toxicant not a carcinogen, therefore the dose-response
relationship of this pollutant assumes a threshold levels for health effects. These
threshold values are considered to be levels above which health effects may occur due
to exposure to NO2. There are acute and chronic threshold values for NO2 exposure.
From literature the threshold values are either referred to as Reference Exposure
18
Levels (RELs) or Reference Concentration (RfC). The RELs used are obtained from
the Office of Environmental Health Hazard Assessment RELs summary tables. NO2
has a threshold value of 470 µg/m3 for acute exposures and 20 µg/m3 for chronic
exposures (OEHHA). The relationship of the threshold values with the type of effects
is dose and length of exposure dependent.
The toxicity of NO2 is reflected through the ability of NO2 to be absorbed into the
lower respiratory tract thereby being distributed to the other parts of the body.
Schwela (1996) shows that the major NO2 dose is delivered into the centricinar
region. The NO2 then reacts with various body fluids to form various toxicants
through various chemical reactions. It can either react with water to form nitrous
acid (HNO2) and nitric acid (HNO3-). The first order of reactions produces an acid,
which induce cell injury. NO2 can also react with readily oxidisable tissue material
such as proteins and lipids to form nitrates (NO2-) and nitrites (NO3
-). These reactions
give rise to products that are rapidly oxidized by the blood and these products are
carried to the other body tissues through the blood. The type of reactions described
above and the health effects thereof are affected by the time factor.
At short-term exposure < 24 hours, observed health effects include skin, eye and
respiratory system irritation. The inhalation of the toxicant may also result in oedema
of the lungs, which may not show immediately following exposure. The onset of the
oedema is aggravated by physical effort, therefore rest and medical attention is
advised. Short-term exposure at high concentrations can lead to premature death
(EDCS, 2000; OEHHA, 1997). Animals exposed to 1880 µg/m3 of NO2 do not
produce observable effects. Healthy human subjects exposed to concentrations below
1880 µg/m3 NO2 do not develop any observed health effects. Exposure of humans at
rest to 4700 µg/m3 NO2 concentrations, for less than two hours, results in
pronounced decrease in pulmonary function (WHO, 1999).
Exposure to 560 µg/m3 NO2 for 3.75 hours affects the lung function of people with
chronic obstructive pulmonary disease (COPD). Asthmatics are considered the most
sensitive group to NO2 exposure. Laboratory studies conducted on mild asthmatics
during intermittent exercise reported the lowest NO2 concentration that affects the
19
lung function to be 565 µg/m3 for 30 to 110 minutes. A study involving a larger mild
asthmatic population could not produce the same results (WHO, 1999).
In studies conducted on both healthy subjects and asthmatics, NO2 was found to
increase bronchial reactivity. The application of pharmacological bronchoconstrictor
agents to these subjects affected the pulmonary function. The effects were observed
at NO2 levels that do not affect the lung function in the absence of
bronchoconstrictors. Other studies reflect an increased responsiveness to
bronchoconstrictors at NO2 levels as low as 376-565 µg/m3, while others involving the
use of allergens did not show any effects at concentrations as low as 188 µg/m3. The
NO2 mechanisms of effects on bronchoconstrictors are not yet fully understood and
there are no repetitive results of exposures to the more sensitive asthmatics (WHO,
1999).
Long-term exposure >1year, noted effects include effects on the immune system,
which makes the body more susceptible to infection. NO2 may also cause genetic
damage in humans. Based on animal studies, NO2 is likely to cause toxic effects upon
human reproduction. NO2 is also considered toxicant to the endocrine, neurological,
cardiovascular, and developmental (Environ Defense 1999).
WHO (1999) reports that there are no epidemiological studies that can be confidently
used to quantify the long-term health effects of NO2 exposure. A range of effects in
NO2 animal exposure studies has been reported. NO2 has been found to cause
structural changes in cells type in the pulmonary area and emphysema at a
concentration of 640 µg/m3. Cellular alterations have been observed at concentrations
as low as 380 µg/m3 to 750 µg/m3. At exposure levels of 950 µg/m3 NO2 increases
bacterial and viral infection susceptibility.
The available indoor epidemiological evidence on infants and adults shows that there
is no significant correlation of the use of gas cooking appliances to pulmonary
illnesses. The studies further show that children of ages 5-12 years are estimated to
have a higher risk of developing respiratory problems at each increase of 28 µg/m3
20
NO2 on a 2-week average where the weekly average of NO2 levels are in the range 12
–128 µg/m3 or more.
The outdoor NO2 epidemiological studies also show that there is little evidence that
chronic NO2 exposure of children and adults produces health effects. However most
results show that children exposed to chronic ambient NO2 are likely to develop
health problems. This evidence is contradictory to the evidence from other outdoor
studies which, show that the children exposed to long-term ambient NO2 showed
increased symptoms of respiratory illnesses and decreased lung function (WHO,
1999). Other factors such as the exposure characteristics influence the magnitude and
duration of exposure. Exposure parameters are very important in the formation of
health effects. Different exposure parameters affect the type of response observed.
4.3 Exposure Assessment
The purpose of this exercise is to identify exposure scenarios that are to be evaluated,
estimation of the type and magnitude of exposure to air pollution. There are three
basic approaches to accomplish this task and these are: (1) exposure setting
characterization (2) identification of recommended exposure scenarios (3) selection of
exposure scenario locations (U.S. EPA, 1998).
4.3.1 Exposure setting characterization
The population of Cato Manor changes from time to time due to the continuous influx
of squatters into this area and most of the squatters are found in Cato Crest that is the
largest informal and most vulnerable settlement in this area. In 1994 Cato Crest had
4300 shacks and each household comprised of an estimated 5 members, which made
the total population in this settlement 22 000. Of the 22 000 squatters 20% are below
the age of 20, 37% between the age range 20 – 40 years, and only 2% are above the
age of 60. The ratio of men to women in the population is found to be equal (Bigss et
al., 1994).
The recent population figures suggest that at present Cato Manor has the total
population of 85378. The population projections show that in future the expected
population in the study area will be 142990. The projected figures show a decrease in
the informal settlement of Cato Crest from 19525 to 11440 (CMDA, 2000). This
21
could be attributed to the ongoing relocation of the squatters to formal housing
sections in other areas within Cato Manor.
Unemployment in Cato Manor is very high. 41% of the economically active
population is unemployed, 10% are employed in the informal activities, 38% are
employed in the formal sector and 11% have occasional work. On the overall 50 –
75% of the population in Cato Manor is unemployed (Hindson and Byerley, 1992;
Obrien, 1993). Those employed in the formal sector are mostly labourers and
domestic workers. The averages are 36 and 17 respectively. The informal economic
activities in this area include street vending, small producer, shebeen, construction,
spaza, taxi transportation, and other activities. The first three activities have the
highest averages with 23.5, 10.9, and 102 respectively (Crookes, 2000).
The high rate of unemployment in Cato Manor can also be attributed to the low level
of education in this area. The education profile of Cato Manor shows that the
majority (78%) of the residents have a standard 3 qualification, which does not place
them in a good position for the job market. 67% of school going age children attend
school, however, based on the literacy level and other factors within the community it
is unlikely that all of these children will complete their studies/ reach tertiary
institutions (Hindson and Makhathini, 1993; Biggs et al., 1994).
Cato Manor comprises both formal and informal housing sections. The formal housing section has access to subsistence services such as electricity and that lessens the use and burning of high sulphur content fuels. The informal housing section lacks subsistence facilities. These areas have no access to adequate solid waste removal services, electricity, and water and sanitation facilities.
The people living in the informal settlements resort to other means of disposing of
their wastes. Solid waste collected in black litterbags is usually found lying around
the streets in these areas. Due to the congested nature of these areas and lack of
adequate and appropriate infrastructure, it becomes difficult for the Durban Metro
waste removal services to supply satisfactory services to these areas. The residents
then resort to burning their waste and this practice results in the clouds of black smoke
visible in Cato Crest (pers. survey of the area). Also contributing to the air pollution
problem in Cato Crest is the burning of firewood for cooking purposes. Automobile
22
traffic is likely to increase the air pollution problem in Cato Manor. Residents living
adjacent to the major traffic routes are likely to be highly exposed (Crookes, 2000).
Air Quality in Cato Manor
Air quality in Cato Manor is expected to be generally good. This is based on the
knowledge that there are not many polluting sources in this area. However this view
is likely to change with the proposed future land use of the area, particularly with
regards to industrial development. The proposed industrial nodes are the Booth West
Industrial Park, Booth Road Central and Edwin Swales / Bellair Road Industrial Site.
With the prevailing SW and NE winds, the sea and land breezes, adjacent areas such
as the Carrington Heights, which is approximately 0.8km NE, Glenwood and
Westridge at approximately 2-3km SW and Bellair which is approximately 2km SW
are at a high air pollution potential from the planned industries. This is bound to
occur if industries with high pollution levels are developed in the area (WEC
Walmsley Environmental Consultants, 1999; Marriott Property Services MPS, 1999;
WBB 1999).
For a long time there has not been measurement of ambient air quality in Cato Manor.
Studies relating to air quality are based on the general characteristics of air pollution
in the Greater Durban Area (Diab, 1997). The measurement of air quality in Cato
Manor started in 1999 and is done by the Durban Metropolitan, which supplied all the
data used in this study. The monitoring stations are placed at the Ekuphelini clinic.
The pollutants that are monitored to date are SO2 and smoke. The available air
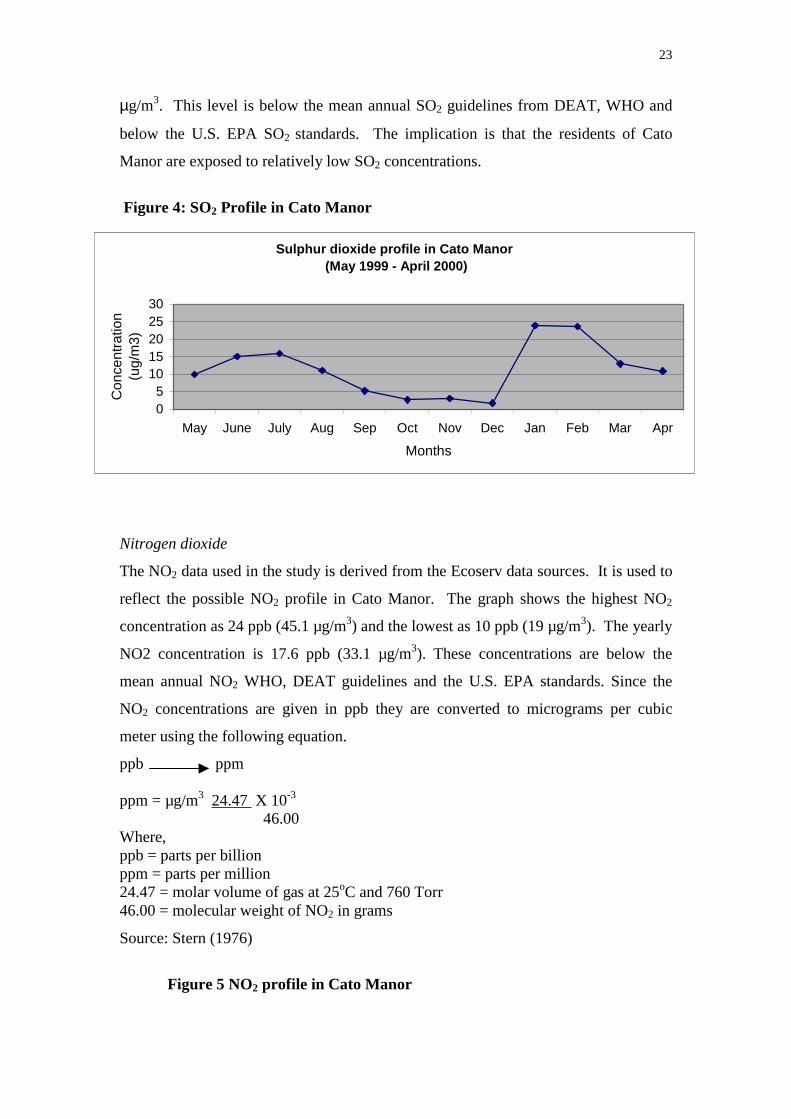
quality data for Cato Manor is for only twelve months, from May 1999 to April 2000.
Figure 4 shows the SO2 profile in Cato Manor. There are no data available on NO2 in
the study area and the data used in the study is taken from the NO2 data from the
Ecoserv. The NO2 data may not reflect the present NO2 conditions in Cato Manor,
but the assumption is that with the future planned industrial development in this area
the Durban International Airport figures are relevant.
Sulphur dioxide
From the graph below it can be seen that the highest recorded concentration is 24
µg/m3 while the lowest is 0.2µg/m3. The mean annual SO2 concentration is 11.3
23
µg/m3. This level is below the mean annual SO2 guidelines from DEAT, WHO and
below the U.S. EPA SO2 standards. The implication is that the residents of Cato
Manor are exposed to relatively low SO2 concentrations.
Figure 4: SO2 Profile in Cato Manor
Nitrogen dioxide
The NO2 data used in the study is derived from the Ecoserv data sources. It is used to
reflect the possible NO2 profile in Cato Manor. The graph shows the highest NO2
concentration as 24 ppb (45.1 µg/m3) and the lowest as 10 ppb (19 µg/m3). The yearly
NO2 concentration is 17.6 ppb (33.1 µg/m3). These concentrations are below the
mean annual NO2 WHO, DEAT guidelines and the U.S. EPA standards. Since the
NO2 concentrations are given in ppb they are converted to micrograms per cubic
meter using the following equation.
ppb ppm ppm = µg/m3 24.47 X 10⁻³ 46.00 Where, ppb = parts per billion ppm = parts per million 24.47 = molar volume of gas at 25oC and 760 Torr 46.00 = molecular weight of NO2 in grams
Source: Stern (1976)
Figure 5 NO2 profile in Cato Manor
Sulphur dioxide profile in Cato Manor (May 1999 - April 2000)
05
1015202530
May June July Aug Sep Oct Nov Dec Jan Feb Mar Apr
Months
Con
cent
ratio
n (u
g/m
3)

24
Expected NO2 Profile in Cato Manor (ppb)
0
5
1015
20
25
30
May-98 Jun-98 Jul-98 Aug-98 Sep-98 Oct-98 Nov-98 Dec-98 Jan-99 Feb-99 Mar-99 Apr-99
Months
Con
cent
ratio
n (p
pb)
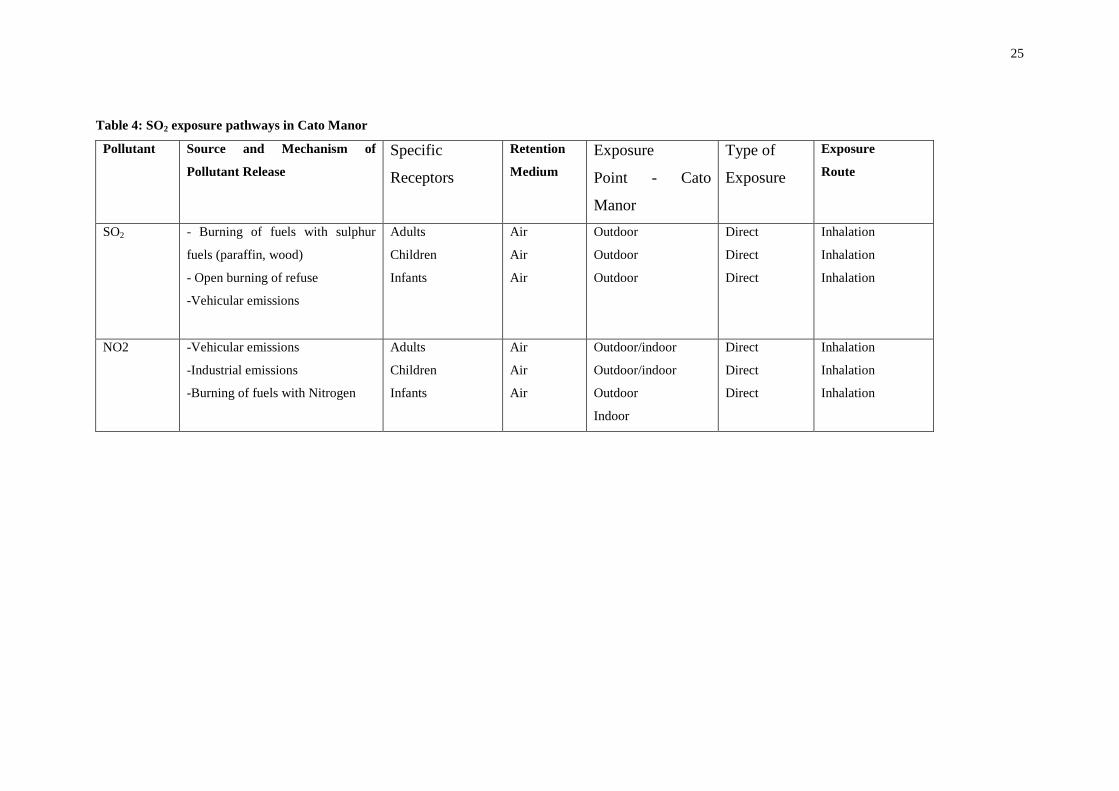
4.3.2 Exposure scenario identification
Exposure scenario refers to a combination of exposure pathways to which a single
receptor may be subjected. It could be through direct or indirect exposure. The
exposure pathway consists of (1) exposure route, (2) a source and mechanism of
emissions release, (3) a retention medium, and (4) a point of potential human contact
with the contaminated medium / exposure point (U.S. EPA, 1998). These variables
were identified for Cato Manor and they are shown in Table 2.
25
Table 4: SO2 exposure pathways in Cato Manor
Pollutant Source and Mechanism of
Pollutant Release Specific
Receptors
Retention
Medium Exposure
Point - Cato
Manor
Type of
Exposure
Exposure
Route
SO2 - Burning of fuels with sulphur
fuels (paraffin, wood)
- Open burning of refuse
-Vehicular emissions
Adults
Children
Infants
Air
Air
Air
Outdoor
Outdoor
Outdoor
Direct
Direct
Direct
Inhalation
Inhalation
Inhalation
NO2 -Vehicular emissions
-Industrial emissions
-Burning of fuels with Nitrogen
Adults
Children
Infants
Air
Air
Air
Outdoor/indoor
Outdoor/indoor
Outdoor
Indoor
Direct
Direct
Direct
Inhalation
Inhalation
Inhalation
26
To complement the above information the following exposure scenarios were selected
on the basis of the information supplied in exposure setting characterization. The
scenarios were used to calculate the average daily dose (ADD). The following
assumptions were made to create the exposure scenarios.
� Acute exposure
Scenario 1: All the receptors are exposed to both ambient SO2 and NO2
concentrations for 1 hour. The scenarios were selected according to the groups of
receptors. Scenario 1 represents adult receptors exposed to the mean ambient hourly
concentrations of SO2 and NO2. Scenario 2 represents the child receptor exposed to
the mean annual ambient SO2 and NO2. Scenario 3 represents the infant receptors
exposed to the mean annual ambient SO2 and NO2 concentrations over 1 hour period
of exposure.
� Chronic exposure
Scenario 2: For the adult receptor the researcher assumes that due to the high level of
unemployment in Cato Manor, the time activity patterns of these people vary from
day to day. The time activity patterns result in some people spending long hours
outdoors while others spend relatively little time in the study area due to their work
and other commitments. Therefore four daily exposure periods are used to describe
the daily exposure patterns of adults in Cato Manor. These exposure periods are
applicable to both SO2 and NO2 and are 3, 16, and 16 hours each day. � Adult receptor
Full time employed adult: The 3 hours exposure period is likely to hold for the full
time employed people. The assumption is that the full time employed person spends 3
hours outdoors, approximately 10 hours away from home, 11 hours indoors. This
person is exposed to the mean annual ambient SO2 and NO2 concentrations.
Occasionally employed or unemployed adult: The 16 hours is for the occasionally
employed and or the unemployed adult. The assumption is that this person spends 16
hours outdoors and 8 indoors in the study area. The person is exposed to the mean
annual ambient SO2 and NO2 concentrations.
27
Worst exposure scenario: The 16 hours exposure period is a worst exposure scenario.
The adult is exposed to the mean annual SO2 and NO2 concentrations in the study
area.
� Child receptor
The following is the assumption of exposure scenario for a child 1-6 years of age: School going child: The child spends 7 hours outdoors, exposed to the mean annual
ambient SO2 and NO2 concentrations. This is based on the assumption that the child
either spends part of his day at school outside the study area or indoors at school
(approximately 5 hours) and the rest of the day indoors (12 hours).
The non-school going child: This child spends 12 hours outdoors and 12 hours
indoors. This child is exposed to the mean annual ambient concentrations of both SO2
and NO2.
� Receptor - Infant
An infant (<1 year) spends 1hour outdoors and 23 hours indoors is exposed to the
mean annual concentration of SO2 and NO2.
The health risk assessment of chemical pollutants investigates all the possible points
of exposure to derive the total dose the population under investigation is exposed.
The exposure points in the study area are outdoors and indoors. Both exposure points
need to be assessed to show the total amount of exposure-dose the population is
receiving daily. There is no available literature to support the determination of SO2
exposure indoors and the following scenarios apply only to NO2 exposure. The
assumptions made in the derivation of the exposure scenarios are based on
Quackenboss et al., (1986) NO2 indoor exposure report. NO2 concentrations indoors
have been found to be much higher than the outdoor concentrations. It is therefore
important that during the health risk assessment of NO2 exposure the indoor
concentrations are taken into account.
Scenario 3: Quackenboss et al., (1986) explain that summers in informal settlements
are marked by higher concentrations of NO2 indoors than outdoors. In summer the
NO2 concentrations are explained to be higher than outdoor concentrations by a factor
28
of 2. This is found to be true in informal settlements where other fuel types other than
electricity are used as energy sources. The NO2 concentrations have been found to
higher by a factor of 2,3 or more.
� Adult receptor
Full-time employed adult: The assumption is that adult receptors in Cato Manor are
exposed to mean annual ambient NO2 concentration for 3 hours each day outdoors,
and indoors the same receptor is exposed to an increased NO2 concentration by 100 %
for 11 hours. This is assumed to be a typical summer exposure scenario in informal
settlements.
Occasionally employed or unemployed adult: The assumption is that this adult is
exposed to the mean annual ambient NO2 concentration outdoors for 16 hours a day
and to a 100% higher concentration of NO2 indoors for 8 hours. Given the small
shacks and houses in Cato Manor the assumption is that the adult is expected to spend
more time outdoors than indoors. This assumption differs from the view of
Quackenboss et al., (1986) that homemakers spend 95% of their time indoors, and the
researcher feels this view does not hold for the adult in the study area.
The worst exposure scenario (indoors): The adult is assumed to be exposed to the
mean annual ambient NO2 for 8 hours outdoors and to increased NO2 indoors by
100% for 16 hours. Most risk assessment studies use 24-hour exposure scenario as
the worst exposure scenario for any receptor to be exposed to a pollutant (Binedell
and Van Voort 1998; Law, 1998). However the researcher feels the 24-hour exposure
scenario is not applicable to the receptors in the study area.
� Child receptor
School going child: The assumption is that the child is exposed to the mean annual
ambient NO2 concentrations outdoors for 7 hours and to increased NO2 concentrations
by 100% indoors for 12 hours. This scenario applies to a child who goes to school
within the study area and outside the study area.
29
Non-school going child: The assumption is that the child is exposed to the mean
annual ambient NO2 concentration for 12 hours outdoors and to the increased NO2 by
100% indoors for the same period.
� Infant receptor
The infant is assumed to be exposed to the mean annual ambient NO2 concentration
for 1 hour each day outdoors and to an increased NO2 concentration by 100% for 23
hours.
Scenario 4: This scenario is based on Quackenboss et al., (1986) and represents
typical winter conditions in informal settlements. The exposure periods remain the
same for all the receptors. Increased levels of NO2 characterize the winter exposure
scenario in informal settlements. The NO2 levels are higher by a factor of 3.
� Adult receptor
Full-time employed adult: The assumption is that the adult is exposed to the mean
annual ambient NO2 concentration outdoors and indoors the concentration is higher
by 200%. The adult is exposed for 3 hours outdoors and 11 hours indoors.
Occasionally employed and or unemployed adult: The adult is exposed to the mean annual ambient NO2 concentration and is exposed to a higher NO2 indoor concentration by 200%. The adult spends 16 hours outdoors and 8 hours indoors. Worst exposure scenario (indoors): The adult is exposed to the mean annual ambient NO2 concentration outdoors and to an increased NO2 concentration by 200%. The adult is exposed to these concentrations for 8 hours outdoors and 16 hours indoors.
� Child receptor
School going child: The assumption is that the child is exposed to the mean annual
ambient NO2 concentration for 7 hours outdoors and to the increased NO2
concentration by 200% indoors for 12 hours.
Non-school going child: The assumption is that the child is exposed to the mean
annual ambient NO2 concentration outdoors and to an increased indoor NO2
concentration by 200%. The exposure times are 12 hours outdoors and 12 hours
indoors.
30
� Infant receptor
The infant is exposed to the mean annual ambient NO2 concentration for 1 hour
outdoors and to the 200% increased NO2 concentration indoors for 23 hours.
There is some part of the population that does not spend all their weekends in the
study area. Biggs et al., (1994 Cato Crest) mention that men interviewed in their
survey explained that they visit their homes (farms) every three months, which is a
period they need to raise enough money to be able to afford the trip’s expenses.
Based on this, the assumption made is that the exposed population spends 4 weekends
outside the study area. This pattern makes their exposure frequency roughly the same
as the U.S. EPA default value of 350 days a year. The default values for body weight
and inhalation rate used in the study are taken from the Exposure Factors Handbook
which shows that the EPA default values for these factors are not representative of the
U.S. population. Other standard default values taken from the U.S. EPA remain
unchanged throughout the study. For the calculation of the average Daily Dose (ADD)
refer to Tables 3- 10 and for exposure duration calculation refer to appendix 1.
4.4 Exposure scenario results – Average Daily Dose
The variables derived above in the scenarios have been factored into the ADD
calculation. The ADD represents the average daily dose received by all the receptors
under the different scenarios. The ADDs are reflected in the following tables: 3-10.
31
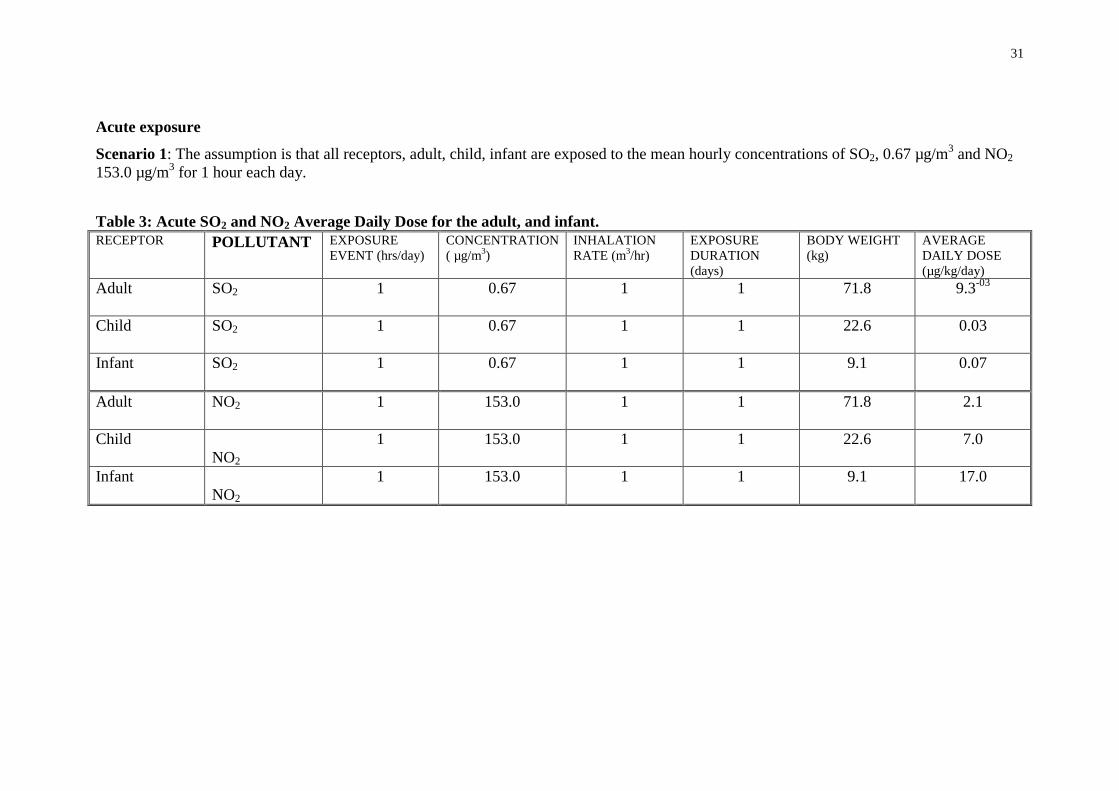
Acute exposure
Scenario 1: The assumption is that all receptors, adult, child, infant are exposed to the mean hourly concentrations of SO2, 0.67 µg/m3 and NO2 153.0 µg/m3 for 1 hour each day. Table 3: Acute SO2 and NO2 Average Daily Dose for the adult, and infant. RECEPTOR POLLUTANT EXPOSURE
EVENT (hrs/day) CONCENTRATION ( µg/m3)
INHALATION RATE (m3/hr)
EXPOSURE DURATION (days)
BODY WEIGHT (kg)
AVERAGE DAILY DOSE (µg/kg/day)
Adult SO2
1 0.67 1 1 71.8 9.3-03
Child SO2
1 0.67 1 1 22.6 0.03
Infant SO2
1 0.67 1 1 9.1 0.07
Adult NO2
1 153.0 1 1 71.8 2.1
Child NO2
1 153.0 1 1 22.6 7.0
Infant NO2
1 153.0 1 1 9.1 17.0
32
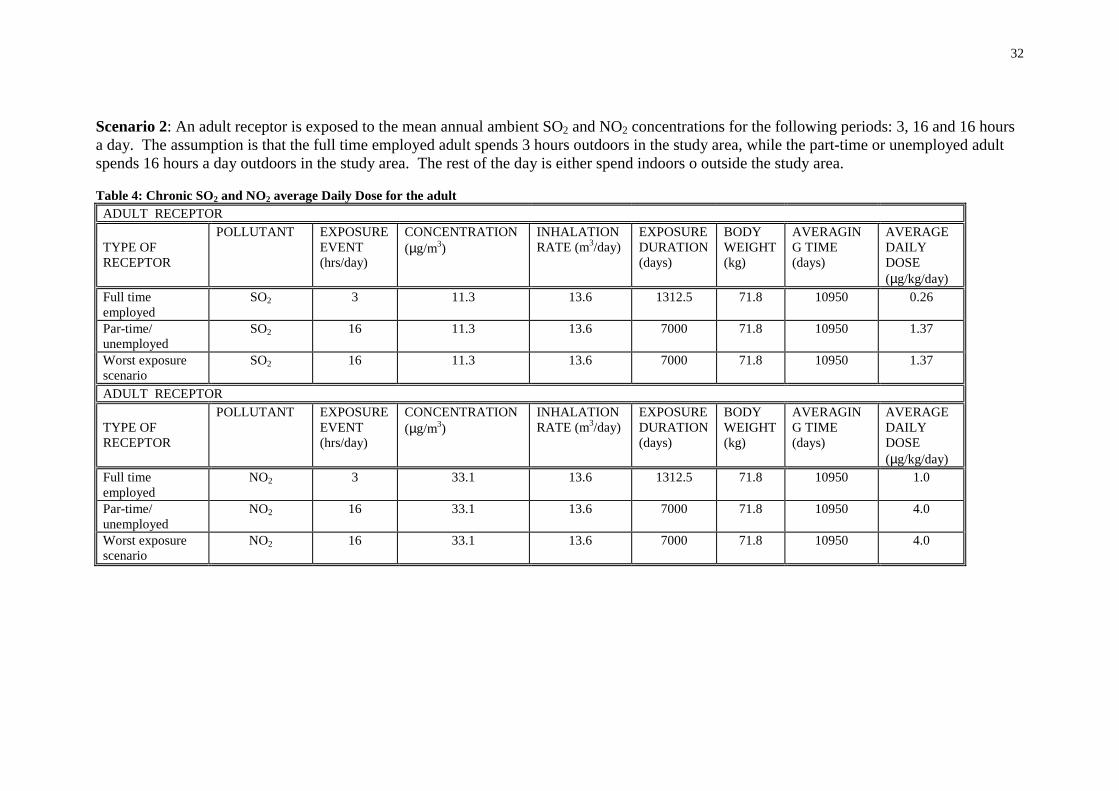
Scenario 2: An adult receptor is exposed to the mean annual ambient SO2 and NO2 concentrations for the following periods: 3, 16 and 16 hours a day. The assumption is that the full time employed adult spends 3 hours outdoors in the study area, while the part-time or unemployed adult spends 16 hours a day outdoors in the study area. The rest of the day is either spend indoors o outside the study area. Table 4: Chronic SO2 and NO2 average Daily Dose for the adult
ADULT RECEPTOR TYPE OF RECEPTOR
POLLUTANT EXPOSURE EVENT (hrs/day)
CONCENTRATION (µg/m3)
INHALATION RATE (m3/day)
EXPOSURE DURATION (days)
BODY WEIGHT (kg)
AVERAGING TIME (days)
AVERAGE DAILY DOSE (µg/kg/day)
Full time employed
SO2 3 11.3 13.6 1312.5 71.8 10950 0.26
Par-time/ unemployed
SO2 16 11.3 13.6 7000 71.8 10950 1.37
Worst exposure scenario
SO2 16 11.3 13.6 7000 71.8 10950 1.37
ADULT RECEPTOR TYPE OF RECEPTOR
POLLUTANT EXPOSURE EVENT (hrs/day)
CONCENTRATION (µg/m3)
INHALATION RATE (m3/day)
EXPOSURE DURATION (days)
BODY WEIGHT (kg)
AVERAGING TIME (days)
AVERAGE DAILY DOSE (µg/kg/day)
Full time employed
NO2 3 33.1 13.6 1312.5 71.8 10950 1.0
Par-time/ unemployed
NO2 16 33.1 13.6 7000 71.8 10950 4.0
Worst exposure scenario
NO2 16 33.1 13.6 7000 71.8 10950 4.0

33
Scenario 2: A child is exposed to the mean annual ambient concentration of SO2 and NO2. The assumption is that the child who goes to school in Cato Manor is exposed to
the pollutants concentrations for 8 hours each day while the child who attends school outside Cato Manor is exposed to the pollutants for 12 hours each day.
Table 5: Chronic SO2 and NO2 Average Daily dose for the child
CHILD RECEPTOR
Group Pollutant
Exposure Event (hrs/day)
Concentration (µg/m3)
Inhalation Rate (m3/day)
Exposure Duration (days)
Body Weight (kg)
Averaging Time (days)
Average Daily Dose (µg/kg/day)
School going child SO2
8 11.3 8.7 700 22.6 2190 1.39
Non-school going child
SO2
12 11.3 8.7 1050 22.6 2190 2.09
CHILD RECEPTOR
Pollutant
Exposure Event (hrs/day)
Concentration (µg/m3)
Inhalation Rate (m3/day)
Exposure Duration (days)
Body Weight (kg)
Averaging Time (days)
Average Daily Dose (µg/kg/day)
School going child NO2
8 17.6 8.7 700 22.6 2190 2.17
Non-school going child
NO2
12 17.6 8.7 1050 22.6 2190 3.25
34
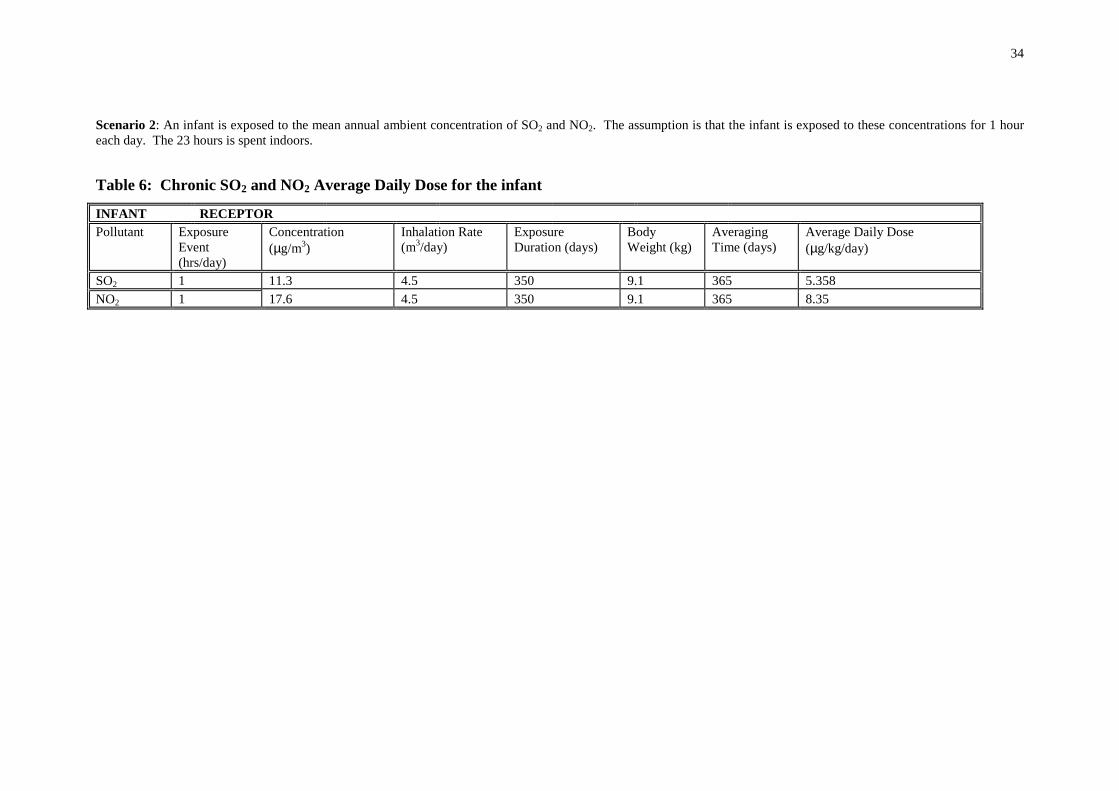
Scenario 2: An infant is exposed to the mean annual ambient concentration of SO2 and NO2. The assumption is that the infant is exposed to these concentrations for 1 hour each day. The 23 hours is spent indoors.
Table 6: Chronic SO2 and NO2 Average Daily Dose for the infant
INFANT RECEPTOR Pollutant Exposure
Event (hrs/day)
Concentration (µg/m3)
Inhalation Rate (m3/day)
Exposure Duration (days)
Body Weight (kg)
Averaging Time (days)
Average Daily Dose (µg/kg/day)
SO2 1 11.3 4.5 350 9.1 365 5.358 NO2 1 17.6 4.5 350 9.1 365 8.35
35
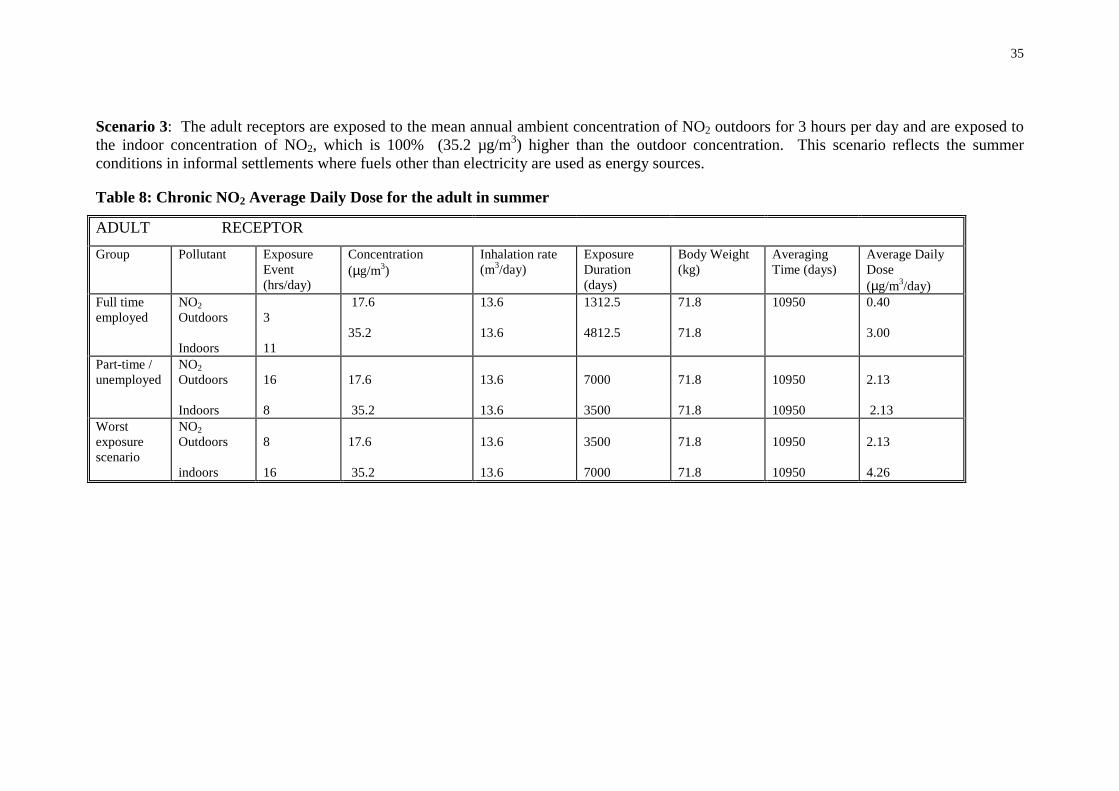
Scenario 3: The adult receptors are exposed to the mean annual ambient concentration of NO2 outdoors for 3 hours per day and are exposed to the indoor concentration of NO2, which is 100% (35.2 µg/m3) higher than the outdoor concentration. This scenario reflects the summer conditions in informal settlements where fuels other than electricity are used as energy sources. Table 8: Chronic NO2 Average Daily Dose for the adult in summer
ADULT RECEPTOR
Group Pollutant Exposure Event (hrs/day)
Concentration (µg/m3)
Inhalation rate (m3/day)
Exposure Duration (days)
Body Weight (kg)
Averaging Time (days)
Average Daily Dose (µg/m3/day)
Full time employed
NO2 Outdoors Indoors
3 11
17.6 35.2
13.6 13.6
1312.5 4812.5
71.8 71.8
10950 0.40 3.00
Part-time / unemployed
NO2 Outdoors Indoors
16 8
17.6 35.2
13.6 13.6
7000 3500
71.8 71.8
10950 10950
2.13 2.13
Worst exposure scenario
NO2 Outdoors indoors
8 16
17.6 35.2
13.6 13.6
3500 7000
71.8 71.8
10950 10950
2.13 4.26
36
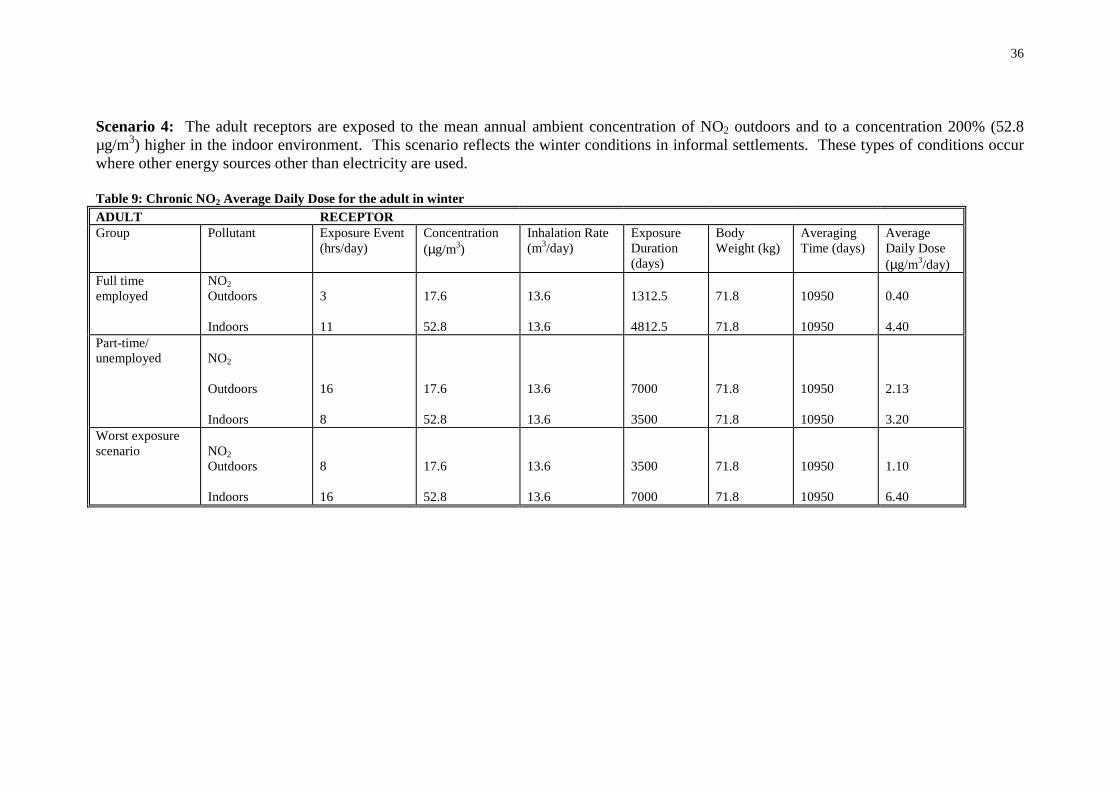
Scenario 4: The adult receptors are exposed to the mean annual ambient concentration of NO2 outdoors and to a concentration 200% (52.8 µg/m3) higher in the indoor environment. This scenario reflects the winter conditions in informal settlements. These types of conditions occur where other energy sources other than electricity are used. Table 9: Chronic NO2 Average Daily Dose for the adult in winter ADULT RECEPTOR Group Pollutant Exposure Event
(hrs/day) Concentration (µg/m3)
Inhalation Rate (m3/day)
Exposure Duration (days)
Body Weight (kg)
Averaging Time (days)
Average Daily Dose (µg/m3/day)
Full time employed
NO2 Outdoors Indoors
3 11
17.6 52.8
13.6 13.6
1312.5 4812.5
71.8 71.8
10950 10950
0.40 4.40
Part-time/ unemployed
NO2 Outdoors Indoors
16 8
17.6 52.8
13.6 13.6
7000 3500
71.8 71.8
10950 10950
2.13 3.20
Worst exposure scenario
NO2 Outdoors Indoors
8 16
17.6 52.8
13.6 13.6
3500 7000
71.8 71.8
10950 10950
1.10 6.40

37
Scenario 4: The child and infant receptors are exposed to the mean annual ambient concentration of NO2 outdoors and to a concentration 200% higher (52.8 µg/m3) in the indoor environment. This scenario reflects the winter conditions in informal settlements. The types of conditions occur where other energy sources other than electricity are used. Table 10: Chronic NO2 Average Daily Dose for the child and infant in winter CHILD RECEPTOR
Group Pollutant Exposure Event (hrs/day)
Concentration (µg/m3)
Inhalation Rate (m3/day)
Exposure Duration (days)
Body Weight (kg)
Averaging Time (days)
Average Daily Dose (µg/m3/day)
School Going child
NO2 Outdoors Indoors
8 12
17.6 52.8
8.7 8.7
700 1050
22.6 22.6
2190 2190
2.17 9.745
Non- School going Child
NO2 Outdoors Indoors
12 12
17.6 52.8
8.7 8.7
1050 1050
22.6 22.6
2190 2190
3.248 9.745
INFANT RECEPTOR Pollutant
Exposure Event (hrs/day)
Concentration (µg/m3)
Inhalation Rate (m3/day)
Exposure Duration (days)
Body Weight (kg)
Averaging Time (days)
Average Daily Dose (µg/m3/day)
NO2 Outdoors Indoors
1 23
17.6 52.8
4.5 4.5
14.6 335.4
9.1 9.1
365 365
0.348 24.000
38
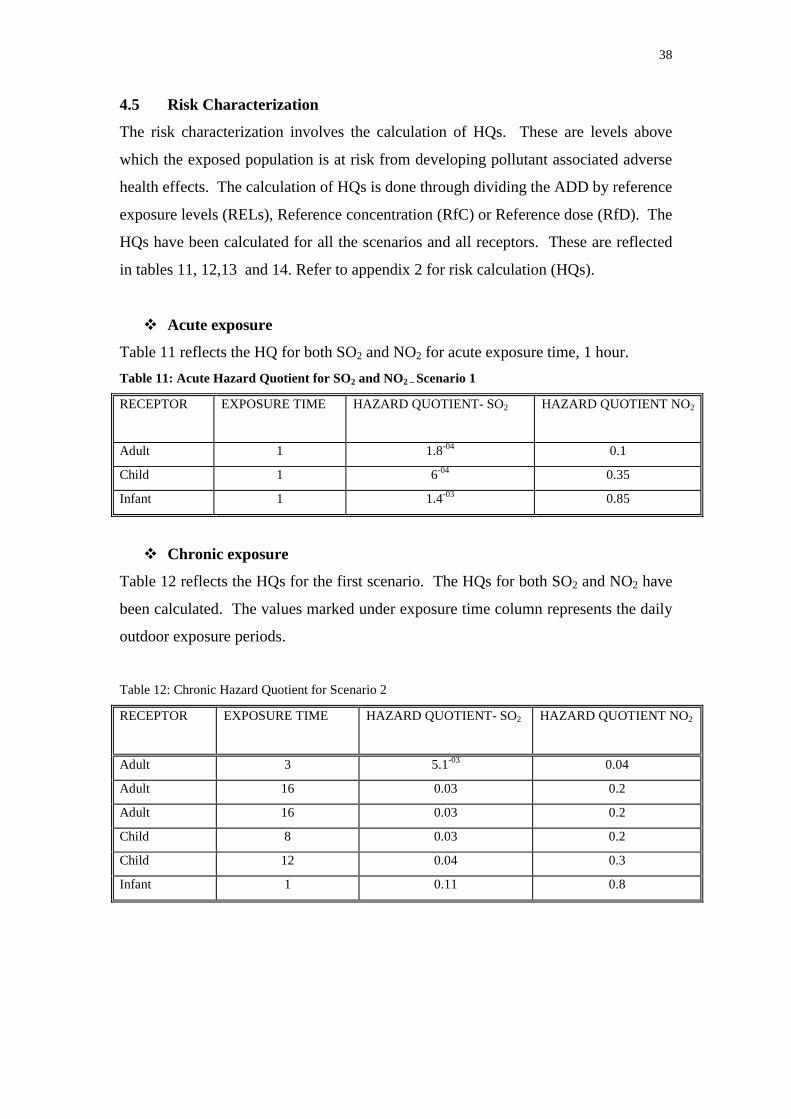
4.5 Risk Characterization
The risk characterization involves the calculation of HQs. These are levels above
which the exposed population is at risk from developing pollutant associated adverse
health effects. The calculation of HQs is done through dividing the ADD by reference
exposure levels (RELs), Reference concentration (RfC) or Reference dose (RfD). The
HQs have been calculated for all the scenarios and all receptors. These are reflected
in tables 11, 12,13 and 14. Refer to appendix 2 for risk calculation (HQs).
� Acute exposure
Table 11 reflects the HQ for both SO2 and NO2 for acute exposure time, 1 hour. Table 11: Acute Hazard Quotient for SO2 and NO2 – Scenario 1
RECEPTOR EXPOSURE TIME HAZARD QUOTIENT- SO2 HAZARD QUOTIENT NO2
Adult 1 1.8-04 0.1
Child 1 6-04 0.35
Infant 1 1.4-03 0.85
� Chronic exposure
Table 12 reflects the HQs for the first scenario. The HQs for both SO2 and NO2 have
been calculated. The values marked under exposure time column represents the daily
outdoor exposure periods.
Table 12: Chronic Hazard Quotient for Scenario 2
RECEPTOR EXPOSURE TIME HAZARD QUOTIENT- SO2 HAZARD QUOTIENT NO2
Adult 3 5.1-03 0.04
Adult 16 0.03 0.2
Adult 16 0.03 0.2
Child 8 0.03 0.2
Child 12 0.04 0.3
Infant 1 0.11 0.8

39
Table 13 reflects the Hazard Quotient for the child and infant receptors. Table 13 Chronic Hazard Quotient for scenario 3
RECEPTOR EXPOSURE TIME HAZARD QUOTIENT NO2
OUTDOORS
HAZARD QUOTIENT NO2
INDOORS
Adult 3 / 11* 0.04 0.3
Adult 16 / 8* 0.2 0.2
Adult 8/ 16* 0.1 0.4
Child 8 / 12* 0.2 0.6
Child 12 / 12* 0.3 0.6
Infant 1 / 23* 0.03 1.5
*outdoors
Table 14 below reflects the HQs for both outdoor and indoor exposure scenarios
Table 14: Hazard Quotients for outdoor / indoor NO2 exposure – Scenario 4
* outdoors
4.6 Other findings
� Placement of the monitor
The monitoring equipment for SO2 is placed at the clinic and is south facing. There is
a possibility that the monitor fails to detect the Cato Manor SO2 concentrations
adequately since its position puts it at a disadvantage in relation to the sources of
pollution. The monitor is placed at the rear side of the building. At this location the
building obstructs the monitor to detect SO2 concentrations adequately. This is likely
to hold particularly during the presence of drainage winds in the valley at night.
RECEPTOR EXPOSURE TIME
HAZARD QUOTIENT NO2
OUTDOORS
HAZARD QUOTIENT NO2
INDOORS
Adult 3 / 11* 0.04 0.4
Adult 16 / 8* 0.2 0.3
Adult 8 / 16* 0.1 0.6
Child 8 / 12* 0.2 0.9
Child 12 / 12* 0.3 0.9
Infant 1 /23* 0.03 2.3
40
Therefore there is a high possibility that SO2 concentrations in Cato Manor are higher
than the actual recorded concentrations.
� Data quality
Based on the meteorological conditions in Durban the expectation is that the pollutant
concentrations will be highest in winter. However there were episodes of high SO2 in
summer in January and February that changed the expected pattern. The reason for
this change has not yet been established, as there could be various sources to this
change.
5. UNCERTAINTY ANALYSIS
As mentioned earlier uncertainty analysis in this study focuses on assumptions
undertaken throughout the process, the models and variables used in the study.
5.1 Decision-rule uncertainty
Researcher’s Assumptions
The researcher made assumptions with regard to daily exposure periods. Based on the
literature on the socio-economic profile of Cato Manor the exposure periods used in
the study for different receptors are assumed to be relevant to the study area. The
selected daily exposure periods cover a wide range of time-activity patterns of the
dynamic population groups in Cato Manor. A medium confidence level is placed on
these assumptions.
The use of animal toxicological studies in relation to human populations
The NO2 animal toxicological studies have been used to reflect the possible human
health effects to similar NO2 exposures. This is with particular reference to the NO2
observed health effects on the rodent’s reproductive system. The assumption is that
the rodents have similar reproductive systems to humans and any effects observed in
rodents are likely to be observed in humans. A medium degree of confidence is
placed on this assumption. The other studies used for NO2 health effects are derived
from epidemiological studies and that places a high degree of confidence on the
results.
41
The use of air quality data obtained from Ecoserv
The assumption with the use of NO2 data from the Durban International airport is that
the area is relatively close to Cato Manor and both areas fall within the Greater
Durban Area, therefore the NO2 concentrations are suitable to Cato Manor. A low
degree of confidence is placed on this assumption because physically the areas are
different and also have different sources of NO2 pollution. The Durban airport area is
situated close to industrial activity while Cato Manor has no major industrial
processes within it.
The use of WHO SO2 guideline for reference exposure level
SO2 has no chronic reference exposure level and the researcher used the WHO annual
SO2 guideline instead. The WHO guideline is regarded as the safest in terms of
human health protection therefore a high degree of confidence is associated with this
guideline.
5.2 Model uncertainty
Dose-response models use to determine Reference Exposure Levels
The models used by the U.S. EPA and its various offices such as the Office of Health
Hazard Assessment use standardized models to determine the reference exposure
levels for health effects. These models have a high degree of certainty since the
cumulative uncertainty factors of both the acute and chronic reference exposure level
threshold values is 1.
Quantification of exposure and health effects
The U.S. EPA uses standardized equations to derive the exposure parameters and
health risks. The equations make use of default factors such as body weight,
inhalation rate and averaging time. The associated confidence to these equations is
high.
5.3 Variable uncertainty
Sulphur dioxide and nitrogen dioxide data
The SO2 data for Cato Manor is considered fairly accurate since there were no
incidences of equipment problems during the monitoring. However the location of
the monitoring equipment leaves some uncertainty in relation to the detection of the
42
actual concentrations of SO2. Refer to section 4.6 above. The NO2 data obtained from
the Ecoserv Pty (Ltd) is also considered fairly accurate. There is some uncertainty
associated with the use of industrially derived concentrations for use in poor
communities.
The use of U.S. EPA default values
The U.S. EPA default values are derived from extensive research and the confidence
level associated with these values is high. The default values may not be necessarily
exact for the South African situation particularly the body weight. This may be due to
differences in population dynamics such as diet and lifestyle.
6. DISCUSSION
6.1 Acute exposure – (Ambient conditions) scenario 1
For all the acute scenarios the HQs are far below 1. Therefore the receptors are
considered safe from acute SO2 and NO2 exposures. The exposure concentrations for
both SO2 and NO2 are 0.67 µg/m3 and 153 µg/m3. The adult receptor receives an
ADD of 0.009 µg/kg/day for SO2 and 2.1 µg/kg/day for NO2. The HQs are 1.8-04 and
0.1 for both SO2 and NO2 respectively. For the child receptor the ADD is 0.03
µg/kg/day for SO2 and 7.0 µg/kg/day for NO2. The HQs for the child is 6-04 and 0.35
for both SO2 and NO2 respectively. The ADD for the infant receptor is 0.07
µg/kg/day for SO2 and 7.0 µg/kg/day for NO2. The HQs for the infant are 1.4-03 and
0.85 for both SO2 and NO2 respectively. Based on the above information all the
receptors are highly unlikely to develop any associated SO2 and NO2 adverse health
effects. 6.2 Chronic Exposure - Ambient conditions
Scenario 2: The assumption is that the receptors are exposed to the mean annual
ambient SO2 and NO2 concentrations outdoors. The indoor concentration is assumed
to be zero. The exposure times for all the receptors are: adult 3, 16 and 16 hours,
child 8 and 12 hours and the infant 1hour outdoors. � Adult receptor
Full time employed adult – SO2: It is assumed that the adult is exposed to the mean
annual concentration of SO2 at 11 µg/m3. The period of contact with the chemical
43
pollutant is 3 hours. This scenario reflects the daily exposure of the adult for 30
years. The ADD for SO2 scenario is 0.26 µg/kg/day and the HQ is 0.01. The 11µg/m3
concentration is far lower than the WHO and DEAT guidelines and U.S. EPA
standards for SO2. The calculated HQ is well below 1. This shows that the adult is
highly unlikely to develop SO2 associated health problems.
Full time employed adult NO2: The assumption for NO2 exposure is that the adult is
exposed to similar conditions except for the concentration. The NO2 concentration is
33.1 µg/m3 and this is far below the WHO and DEAT guidelines and U.S. EPA NO2
standards. The adult receives an ADD of 0.75 µg/kg/day. The calculated HQ 0.04,
shows that the adult is highly unlikely to develop NO2 associated adverse health
effects.
Occasionally employed or unemployed adult – SO2: The assumption is that the adult
is exposed to the mean annual ambient SO2 concentrations of 11 µg/m3 for 16 hours
each day. This concentration is far lower than the mean annual ambient SO2
guidelines from WHO and DEAT and U.S. EPA standards. The adult receives an
ADD of 1.37 µg/kg/day. The adult in this category is not expected to develop any
SO2 associated adverse health effects. Based on the HQ calculation of 0.03 for this
scenario the adult is considered safe at the SO2 levels in Cato Manor.
Occasionally employed or unemployed adult - NO2: The assumption is that the adult
is exposed to the mean annual ambient NO2 concentration of 33.1 µg/m3 for 16 hours
a day. The level of NO2 in Cato Manor of 33.1 µg/m3 is below the WHO and DEAT
mean annual ambient NO2 guidelines and mean annual ambient NO2 US EPA
standards. The adult in this category receives an ADD of 4.0 and is expected not to
develop conditions associated with NO2 exposure. Based on the HQ calculation of
0.2, which is below 1, the adult is considered safe from the NO2 exposure.
SO2 Worst exposure scenario: The assumption is that the adult is exposed to the mean
annual ambient SO2 concentration. This is the worst exposure scenario the adult
could be exposed to the SO2. The adult is exposed to 11 µg/m3 of SO2 for 16 hours a
day outdoors. The adult receives an ADD of 1.37 µg/kg/day. Based on the HQ of
44
0.03, which is below 1 the adult is not expected to develop any SO2 associated
respiratory problems.
NO2 Worst exposure scenario: The assumption is that the adult is exposed to the mean
annual ambient NO2 concentrations. The mean annual ambient NO2 concentration is
33.1 µg/m3 and the adult is exposed to this concentration for 24 hours each day. The
ADD for the adult in this category is 4.0 µg/kg/day and the HQ is 0.2 The HQ
calculation, which is below 1, shows that the adult is highly unlikely to develop NO2
associated health problems.
� Child receptor
School going child – SO2: The assumption is that a child aged 1-6 years of age is
exposed to the mean annual ambient concentration of SO2 for 8 hours a day. The
child is exposed to 11 µg/m3 of SO2, which is far below the WHO, DEAT SO2
guidelines and US EPA SO2 standards. The ADD for the child is 1.39 µg/kg/day.
Based on the HQ calculation of 0.03 the child is considered unlikely to develop
adverse health effects associated with SO2 exposure.
Non-school going child – SO2: The assumption is that the child is exposed to the
mean annual ambient SO2 concentration of 11 µg/m3 for 12 hours each day. The child
receives an ADD of 2.1 µg/kg/day and the HQ for this scenario is 0.04. Based on the
calculation of the HQ the child is unlikely to develop the SO2 associated respiratory
problems.
School going child – NO2: The child is exposed to the mean annual ambient NO2
concentration of 33.1 µg/m3 for 8 hours outdoors. The child receives an ADD of 4.1
µg/kg/day. The HQ calculation of 0.2 shows that the child is highly unlikely to
develop NO2 associated adverse health effects under the present levels.
Non-school going child NO2: The assumption is that the child is exposed to the mean
annual ambient NO2 concentration of 33.1 µg/m3 for 12 hours each day. The child
receives an ADD of 6.1 µg/kg/day. The HQ calculation of 0.3 shows that he child is
unlikely to develop NO2 associated health problems.
45
� Infant receptor
The assumption is that an infant is exposed to the mean annual ambient SO2
concentration for 1 hour on a daily basis. The infant is the most sensitive individual
within the target population. This is as a result of the infant not having a fully
developed immune system, which makes him/her more vulnerable and susceptible to
onset of diseases. The infant is exposed to 11 µg/m3 SO2 that is well below the mean
annual ambient SO2 WHO and DEAT guidelines and U.S. EPA standards. The infant
receives an ADD of 5.4 µg/kg/day. The HQ calculation shows that the infant is
unlikely to develop the SO2 associated adverse health problems. The HQ for the
infant is 0.1, which is well below 1. For NO2 the infant is exposed to 33.1 µg/m3 and
receives an ADD of 16.0 µg/kg/day. The HQ for NO2 exposure is 0.8 which is well
below 1. The infant in this exposed to NO2 under these conditions is unlikely to
develop NO2 associated health problems.
Scenario 3: This scenario is based mainly on the assumption that the receptors are exposed to an increased indoor concentration by 100%. The exposure times for the receptors remain unchanged. This scenario represents the summer conditions in informal settlements where kerosene and gas are used as energy sources.
� Adult receptors
Full time employed adult – NO2: The assumption is that the adult is exposed to the
mean annual ambient NO2 concentration of 33.1 µg/m3 for 3 hours outdoors and to an
increased NO2 concentration of 66.2 µg/m3 indoors for 11 hours. The adult receives
an ADD of 0.75 µg/kg/day outdoors and 5.5 µg/kg/day indoors. Based on the HQ
calculations of 0.04 and 0.3 for both outdoors and indoors respectively the adult is
highly unlikely to develop NO2 associated adverse health effects.
Occasionally employed and or unemployed adult – NO2: The assumption is that the
adult is exposed to the mean annual ambient NO2 concentration 33.1 µg/m3 for 16
hours outdoor and to NO2 concentration of 66.2 µg/m3 for 8 hours indoors. The adult
receives the ADD of 4.0 µg/kg/day for both outdoors and indoors. The HQ
calculation is 0.2 for both exposure times. The HQs show that the adult is unlikely to
46
develop NO2 associated adverse health effects. The 16 hour exposure period could
also be taken to represent the longest exposure outdoors of the adult in Cato manor.
Worst exposure scenario (indoors): This scenario reflects the longest time that an
adult can stay indoors each day. The assumption is that the adult is exposed to the
mean annual ambient NO2 concentration outdoors and to an increased NO2 indoors at
66.2 µg/m3 for 16 hours. The adult receives the ADD of 2.0 µg/kg/day and 8.0
µg/kg/day at both outdoors and indoors exposure points. The HQs of 0.1 and 04 for
both outdoors and indoors respectively, show that the adult is unlikely to develop NO2
associated adverse health effects.
� Child receptors
School going child- NO2: The assumption is that the child is exposed to the mean
annual ambient NO2 concentration of 33.1 µg/m3 for 8 hours outdoors and to 66.2
µg/m3 NO2 concentration indoors for 12 hours. The child receives the ADD of 4.1
µg/kg/day outdoors and 12.2 µg/kg/day indoors. The HQ calculations of 0.2 and 0.6
for both outdoors and indoors respectively, show that the child is highly unlikely to
develop NO2 associated adverse health effects.
Non-school going child – NO2: The assumption is that the child is exposed to the
mean annual ambient NO2 concentration of 33.1 µg/m3 for 12 hours outdoors and
66.2 µg/m3 for 12 hours indoors. The child receives the ADD of 6.1 µg/kg/day
outdoors and 12.2 µg/kg/day indoors. The HQ for both outdoor and indoor exposure
points are 0.3 and 0.6 respectively. Based on the HQs the child is highly unlikely to
develop NO2 associated adverse health effects.
� Infant receptors
The assumption is that the infant is exposed to the mean annual ambient NO2
concentration of 33.1 µg/m3 for 1-hour outdoors and 66.2 µg/m3 for 23 hours indoors.
The infant receives the ADD of 0.7 µg/kg/day outdoors and 30.1 µg/kg/day indoors.
The HQ calculations are 0.03 and 1.5 for both outdoors and indoors respectively.
Based on the HQs the infant is unlikely to develop NO2 associated adverse health
effects.

47
Scenario 4: This scenario represents winter conditions in informal settlements. The indoor NO2 concentration is higher by 200%. The exposure times for all the receptors remain the same. � Adult receptors Full time employed adult – NO2: The assumption is that the adult is exposed to the
mean annual ambient NO2 concentration of 33.1 µg/m3 for 3 hours outdoors and 99.3
µg/m3 for 11 hours indoors. The adult receives the ADD of 0.8 µg/kg/day outdoors
and 8.3 µg/kg/day indoors. The HQ calculations of 0.04 outdoors and 0.4 indoors
reflect that the adult is highly unlikely to develop NO2 associated adverse health
effects.
Occasionally employed and or unemployed adult – NO2: The assumption is that the
adult is exposed to the mean annual ambient NO2 concentration of 33.1 µg/m3 for 16
hours outdoors and 99.3 µg/m3 for 8 hours indoors. The adult receives the outdoor
and indoor ADD of 4.0 µg/kg/day and 6.0 µg/kg/day respectively. The HQ
calculations of 0.2 and 0.3 for both outdoor and indoor exposure points show that the
adult is highly unlikely to develop NO2 associated adverse health effects. The 16
hours outdoors could be taken to represent the longest exposure time for the adult in
Cato Manor.
Worst exposure scenario- NO2 (indoors): The assumption is that the adult is exposed
to the mean annual ambient NO2 concentration of 33.1 µg/m3 for 8 hours outdoors
and 99.3 µg/m3 for 16 hours indoors. The adult receives the outdoor and indoor ADD
of 2.0 µg/kg/day and 12.0 µg/kg/day respectively. The HQ calculations of 0.1
outdoors and 0.6 indoors show that the adult is unlikely to develop NO2 associate
adverse health effects.
� Child receptors
School going child – NO2: The assumption is that the child is exposed to the mean
annual ambient NO2 concentration of 33.1 µg/m3 for 8 hours outdoors and 99.3 µg/m3
for 12 hours indoors. The child receives the ADD of 4.1 µg/kg/day outdoors and 18.3
µg/kg/day indoors. The HQ calculations of 0.2 and 0.9 for both outdoors and indoors

48
respectively, show that the child is unlikely to develop NO2 associated adverse health
effects.
Non-school going child – NO2: The assumption is that the child is exposed to the
mean annual ambient NO2 concentration of 33.1 µg/m3 for 12 hours outdoors and
99.3 µg/m3 for 12 hours indoors. The child receives the outdoor and indoor ADD of
6.11 µg/kg/day and 18.3 µg/kg/day respectively. Based on the HQ of 0.3 and 0.9 for
both outdoors and indoors respectively the child is unlikely to develop NO2 associated
adverse health effects.
� Infant receptors The assumption is that the infant is exposed to the mean annual ambient NO2
concentration of 33.1 µg/m3 for 1 hour outdoors and to 99.3 µg/m3 for 23 hours
indoors. The infant receives the outdoor and indoor ADD of 0.66 µg/kg/day and 45.1
µg/kg/day respectively. Based on the HQ calculations of 0.03 and 2.3 for both
outdoors and indoors respectively. The infant is highly likely to develop NO2
associated adverse health effects from outdoor exposure but with indoor exposure the
infant is at risk of developing adverse health effects.
From the hazard quotients calculated above it can be seen that most of them are well
below the risk level of 1. This implies that the SO2 and NO2 exposure in Cato Manor
do not pose a health risk to the risk groups except for the 23 hours infant exposure to
NO2 indoors under both exposure scenario 3 and 4. based on these findings the infants
could be considered as the risk group in Cato Manor. The expectation is that for the
other population groups, the effects of the low doses of SO2 and NO2 can be repaired
by the body’s defence mechanisms. This mainly applies to healthy
individuals/populations. Given the history of environmental health hazards and
exposures in Cato Manor, it is likely that the exposed population may not cope
adequately with the low exposures to SO2 and NO2. The people are already exposed
to other health hazards and the SO2 and NO2 exposure magnifies the problems and
makes community’s resilience low.

49
7. CONCLUSION
Based on the findings of the study the residents of Cato Manor are exposed to
relatively low concentrations of SO2 and NO2. The low ambient SO2 and NO2 levels
make their associated health risk to the residents negligible. Their body defence
mechanism is expected to cope with the low levels of SO2 and NO2 in Cato Manor.
The residents who may develop respiratory conditions similar to the ones outlined in
the study are likely to be exposed to other environmental toxicants other than the two
pollutants. This means that there could be other factors at play that result in the health
effects outline in the study.
Having said that air pollution is not the only sources of health hazards and risks in
Cato Manor. There are other health dangers, which may work to the disadvantage of
the exposed. These other health hazards may actually contribute to the people in Cato
Manor not being able to cope with the little ambient SO2 and NO2 concentrations.
One particular health hazard is the overcrowding which is associated with respiratory
infections like TB.
8. RECOMMENDATIONS
With the intended industrial development in Cato Manor there is a high possibility
that ambient concentrations of SO2 and NO2 will increase. It is therefore
recommended that predictive air pollution modeling be done prior to the development
of the industries to ascertain the caring capacity of Cato Manor. The siting of
industries should also take into account the adjacent land uses particularly residential.
The residential development should be planned such that it provides room for housing
that is not in close proximity to major thoroughfares to prevent exposure of residents
to high levels to vehicular emissions.
The positioning of the monitoring equipment at the Ekuphelini clinic is highly likely
that it does not record the actual concentrations in Cato Manor. The placement of the
monitors needs to be revised to ensure that the whole area of Cato Manor is covered.
Environmental health education programmes need to be designed and implemented in
Cato Manor. Emphasis should be placed on the use of fuels other than electricity and

50
their possible adverse health effects. The importance of ventilation should be also
emphasized. Infants should be given priority to prevent the plausible infant
morbidities.
Qualitative human health risk assessment studies for Cato Manor need to be done.
This study would serve as important tools in decision-making regarding the
prioritisation of health risks in Cato Manor.
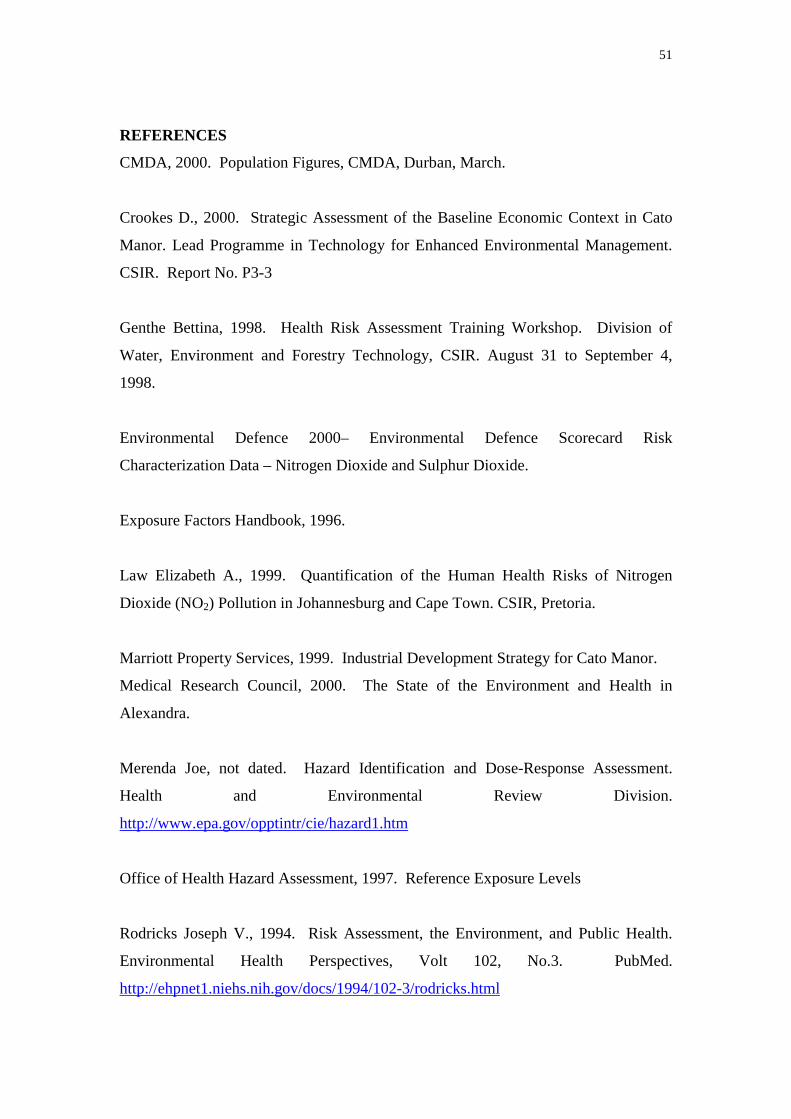
51
REFERENCES
CMDA, 2000. Population Figures, CMDA, Durban, March.
Crookes D., 2000. Strategic Assessment of the Baseline Economic Context in Cato
Manor. Lead Programme in Technology for Enhanced Environmental Management.
CSIR. Report No. P3-3
Genthe Bettina, 1998. Health Risk Assessment Training Workshop. Division of
Water, Environment and Forestry Technology, CSIR. August 31 to September 4,
1998.
Environmental Defence 2000– Environmental Defence Scorecard Risk
Characterization Data – Nitrogen Dioxide and Sulphur Dioxide.
Exposure Factors Handbook, 1996.
Law Elizabeth A., 1999. Quantification of the Human Health Risks of Nitrogen
Dioxide (NO2) Pollution in Johannesburg and Cape Town. CSIR, Pretoria.
Marriott Property Services, 1999. Industrial Development Strategy for Cato Manor.
Medical Research Council, 2000. The State of the Environment and Health in
Alexandra.
Merenda Joe, not dated. Hazard Identification and Dose-Response Assessment.
Health and Environmental Review Division.
http://www.epa.gov/opptintr/cie/hazard1.htm
Office of Health Hazard Assessment, 1997. Reference Exposure Levels
Rodricks Joseph V., 1994. Risk Assessment, the Environment, and Public Health.
Environmental Health Perspectives, Volt 102, No.3. PubMed.
http://ehpnet1.niehs.nih.gov/docs/1994/102-3/rodricks.html

52
Science Policy Council, 1995. Science Policy Council: Risk Characterization Policy.
http://www.epa.gov/ORD/spc/rcpolicy.htm
U.S. EPA, 1991. Risk Assessment for Toxic Air Pollutants: A Citizen’s Guide.
Office of Air and Radiation. EPA 450/3-90-024.
Http://www.epa.gov/ttnuatw1/3_90_024.html
U.S.EPA, 1999. Air Pollution and Health Risk. Air Risk Information Support
Centre. http://www.epa.gov/ttn/uatw/3_90_022.html
U.S. EPA, 1999. The Plain English Guide to the Clean Air Act. Office of Air Quality
Planning and Standards. http://www.epa.gov/oar/oaqps/peg_caa/pegcaa10.html
Walmsley Environmental Consultants, 1999. Environmental Scoping Assessment
Report for the Development node on the Corner of Edwin Swales Drive and Bellair
Road.
Weerts, Butler and Bulman cc, 1999. Report on Environmental Scoping of the
Proposed Booth Road West Industrial Park.

53
ACKNOWLEDGEMENTS
I would like to thank the CSIR management for providing me with an internship placement within the organisation. I would also like to thank Ms. Michell Binedell for her supervision and support throughout the project. Thanks also goes to the rest of the EMAPs team for their support during the internship, as well as the Durban Metro for the provision of data. Thanks also to Elizabeth Law for her advice and support throughout the project. Lastly I wish to thank Prof. Roseanne Diab for her support as my academic supervisor and for allowing me to undertake the internship with the CSIR.
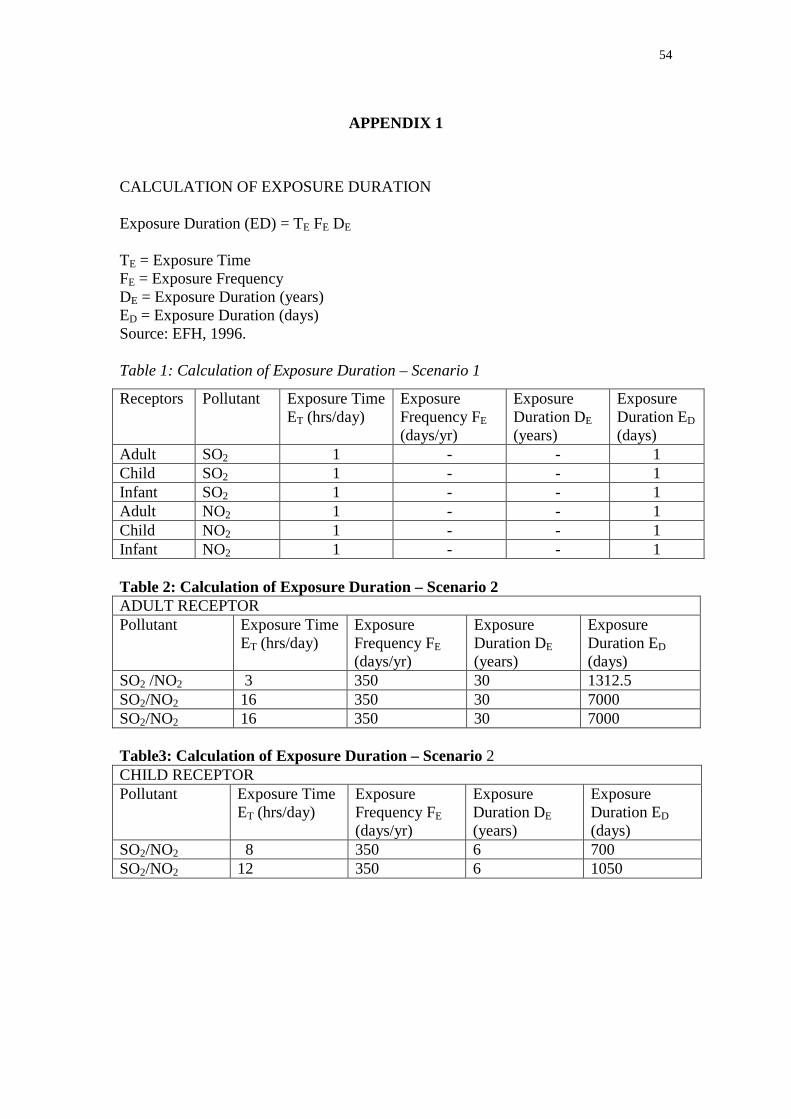
54
APPENDIX 1
CALCULATION OF EXPOSURE DURATION Exposure Duration (ED) = TE FE DE
TE = Exposure Time FE = Exposure Frequency DE = Exposure Duration (years) ED = Exposure Duration (days) Source: EFH, 1996. Table 1: Calculation of Exposure Duration – Scenario 1
Receptors Pollutant Exposure Time ET (hrs/day)
Exposure Frequency FE (days/yr)
Exposure Duration DE (years)
Exposure Duration ED (days)
Adult SO2 1 - - 1 Child SO2 1 - - 1 Infant SO2 1 - - 1 Adult NO2 1 - - 1 Child NO2 1 - - 1 Infant NO2 1 - - 1 Table 2: Calculation of Exposure Duration – Scenario 2 ADULT RECEPTOR Pollutant Exposure Time
ET (hrs/day) Exposure Frequency FE (days/yr)
Exposure Duration DE (years)
Exposure Duration ED (days)
SO2 /NO2 3 350 30 1312.5 SO2/NO2 16 350 30 7000 SO2/NO2 16 350 30 7000 Table3: Calculation of Exposure Duration – Scenario 2 CHILD RECEPTOR Pollutant Exposure Time
ET (hrs/day) Exposure Frequency FE (days/yr)
Exposure Duration DE (years)
Exposure Duration ED (days)
SO2/NO2 8 350 6 700 SO2/NO2 12 350 6 1050

55
Table 4: Calculation of Exposure Duration – Scenario 2
INFANT RECEPTOR Pollutant Exposure Time
ET (hrs/day) Exposure Frequency FE (days/yr)
Exposure Duration DE (years)
Exposure Duration ED (days)
SO2 /NO2 1 350 1 14.6
Table 5: Calculation of Exposure Duration – Scenario 3 ADULT RECEPTOR Pollutant Exposure Time
ET (hrs/day) Exposure Frequency FE (days/yr)
Exposure Duration DE (years)
Exposure Duration ED (days)
NO2 Outdoors Indoors
3 11
350 350
30 30
1312.5 4812.5
NO2 Outdoor Indoor
16 8
350 350
30 30
7000 3500
NO2 Outdoor Indoor
8 16
350 350
30 30
3500 7000
Table 6: Calculation of Exposure Duration – Scenario 3
CHILD RECEPTOR Pollutant Exposure Time
ET (hrs/day) Exposure Frequency FE (days/yr)
Exposure Duration DE (years)
Exposure Duration ED (days)
NO2 Outdoor Indoor
8 12
350 350
6 6
700 1050
NO2 Outdoor Indoor
12 12
350 350
6 6
1050 1050
INFANT RECEPTOR NO2 Outdoor Indoor
1 23
350 350
1 1
14.6 335.4
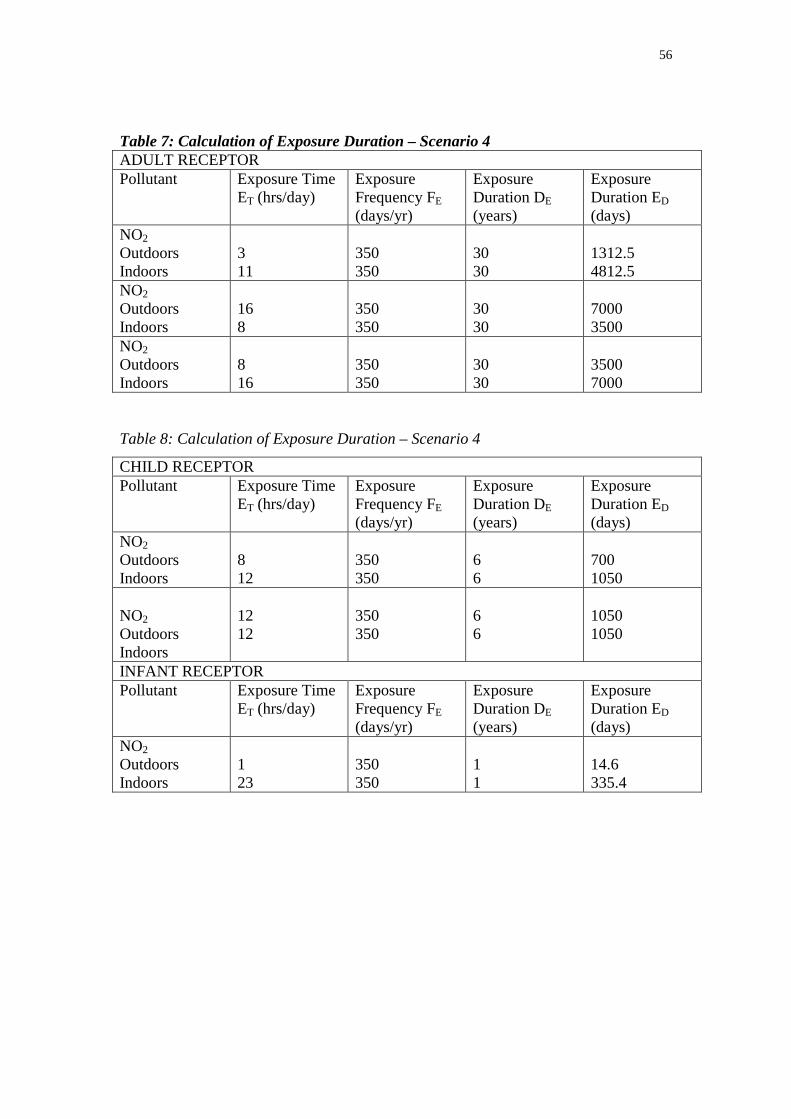
56
Table 7: Calculation of Exposure Duration – Scenario 4 ADULT RECEPTOR Pollutant Exposure Time
ET (hrs/day) Exposure Frequency FE (days/yr)
Exposure Duration DE (years)
Exposure Duration ED (days)
NO2 Outdoors Indoors
3 11
350 350
30 30
1312.5 4812.5
NO2 Outdoors Indoors
16 8
350 350
30 30
7000 3500
NO2 Outdoors Indoors
8 16
350 350
30 30
3500 7000
Table 8: Calculation of Exposure Duration – Scenario 4
CHILD RECEPTOR Pollutant Exposure Time
ET (hrs/day) Exposure Frequency FE (days/yr)
Exposure Duration DE (years)
Exposure Duration ED (days)
NO2 Outdoors Indoors
8 12
350 350
6 6
700 1050
NO2 Outdoors Indoors
12 12
350 350
6 6
1050 1050
INFANT RECEPTOR Pollutant Exposure Time
ET (hrs/day) Exposure Frequency FE (days/yr)
Exposure Duration DE (years)
Exposure Duration ED (days)
NO2 Outdoors Indoors
1 23
350 350
1 1
14.6 335.4


58
APPENDIX 2 Table 1: Risk Calculation – Scenario 1 RECEPTOR ADD SO2
(µg/m3/day) REL SO2 (µg/m3)
HAZARD QOUTIENT SO2
ADD NO2
(µg/m3) REL NO2
(µg/m3/day) HAZARD QOUTIENT NO2
Adult 0.009 660 0.00001 2.1 470 0.004 Child 0.03 660 0.00004 7.0 470 0.01 Infant 0.07 660 0.0001 17.0 470 0.03 Table 2: Risk Calculation – Scenario 2 RECEPTOR ADD SO2
(µg/m3/day) REL SO2
(µg/m3) HAZARD QOUTIENT SO2
ADD NO2
(µg/m3) REL NO2
(µg/m3/day) HAZARD QOUTIENT NO2
Adult 0.26 50 0.005 1.0 20 0.05 Adult 1.37 50 0.03 4.0 20 0.2 Adult 1.37 50 0.03 4.0 20 0.2 Child 1.39 50 0.03 4.1 20 0.2 Child 2.09 50 0.04 6.1 20 0.3 Infant 0.22 50 0.01 0.65 20 0.03

59
Table 3: Risk Calculation – Scenario 3 RECEPTOR ADD NO2
(µg/m3/day) Outdoors
ADD NO2
(µg/m3) Indoors
REL NO2 (µg/m3/day) HAZARD QOUTIENT NO2 Outdoors
HAZARD QOUTIENT NO2 Indoors
Adult 0.1 5.5 20 0.05 0.3 Adult 4.0 4.0 20 0.2 0.2 Adult 2.0 8.0 20 0.1 0.4 Child 4.1 12.2 20 0.2 0.6 Child 6.1 12.2 20 0.3 0.6 Infant 0.7 30.1 20 0.03 1.5 Table 4: Risk Calculation – Scenario 4 RECEPTOR ADD NO2
(µg/m3/day) Outdoors
ADD NO2
(µg/m3) Indoors
REL NO2 (µg/m3/day) HAZARD QOUTIENT NO2 Outdoors
HAZARD QOUTIENT NO2 Indoors
Adult 0.8 8.3 20 0.04 0.4 Adult 4.0 6.0 20 0.2 0.3 Adult 2.0 12.0 20 0.1 0.6 Child 4.1 18.3 20 0.2 0.9 Child 6.1 18.3 20 0.3 0.9 Infant 15.0 45.1 20 0.75 2.3

60
ABBREVIATIONS AND DEFINITIONS Acute Short-term exposure, typically 1-hour ADD Average Daily Dose AT Averaging Time BW Body Weight C Concentration COPC Chemical of potential concern COPD Chronic obstructive pulmonary disease Chronic Long-term exposure, typically annual DEAT Department of Environment and Tourism ED Exposure Duration EDCS Environmental Defence Chemical Scorecard EPA United States Environmental Protection Agency FEV1 One second mean forced expiratory flow µg/kg/hr gram per kilogram per hour HQ Hazard Quotient IPCS International P of Chemical Safety ILO International Labour Organisation IR Inhalation rate NO2 Nitrogen Dioxide OEHHA Office of Environmental Health Hazard Assessment REL Reference Exposure Levels RfC Reference Concentration SO2 Sulphur dioxide SMP Suspended particulate matter sRAW Specific airway resistance µg/m3 microgram per cubic meter WHO World Health Organisation