Embed Size (px)
Citation preview
Poster Presented at HPLC 2008, Baltimore, MD, USA, May 13–15, 2008 LC/MS/UV Data Reduction in Purity and Stability-Indicating HPLC Method Development Rudy Sneyers and Willy Janssens Johnson and Johnson Mike McBrien ACD/Labs
ABSTRACT The systematic parameter investigation and hyphenated (LC/UV and LC/MS) data collection associated with chromatographic method development tends to result in considerable data overload. Increased rigor of development inherently implies more data, and thus even more data processing requirements. Nowhere is this phenomenon more evident than in the development of chromatographic methods for stability measurements. In these situations, it is typical to have several individual samples that represent the overall elution profile of the expected compounds associated with the project. The amount of data collected increases proportionally to the number of samples, which can result in a vast array of files that must be fully processed before experimental design can be effective. This poster will detail an approach to the effective extraction of key elution information for compounds associated with degradation of pharmaceutical compounds based on targeted selection of samples to include in the study, scientific design of appropriate method design space, chemometric data reduction, and other novel data reduction approaches. The result is fast availability of key elution data to method design tools. The approach will be illustrated with several real-world examples.
INTRODUCTION One of the most challenging problems in chromatographic method development is the development of purity and stability-indicating methods for pharmaceutical and other organic compounds. Typically samples consist of multiple unknown compounds such that development of methods is a simultaneous problem of sample investigation and method design. In addition, the complexity of the samples tends to necessitate the investigation of a large
chromatographic method space, such that there tends to be a great deal of data interpretation required. Screening of orthogonal generic methods, faster chromatography, and hyphenated detection are powerful tools in the chromatographers’ arsenal; however, the increase in data results in a considerable workload associated with extraction of chromatographic knowledge. In this work, we investigated the effectiveness of new automated information extraction tools using a simulated stability sample containing known compounds. It was processed as if there were no advance knowledge of the contents of the mixture.
EXPERIMENTAL “The Twins”—all experiments were performed using two Waters Alliance HPLCs with ZQ MS detection. The instruments’ dead volumes were “tuned” in order to generate consistent retention times. ACD/Method Development Suite for LC/MS 11.03 beta software provided project management, and information extraction tools. For purposes of this poster, pre-release software was used. It is important to note that processing was done as if there was no prior knowledge of the contents of the sample. The chromatographic conditions employed were chosen for robustness and maximum orthogonality. The 20 sets of conditions are summarized in table 1.

HPLC 2008 LC/MS/UV Data Reduction in Purity and Stability-Indicating HPLC Method Development
2
Table 1: The Column/Buffer screening wave experiments in wave 1 of method development.
Table 2: The components in S1.
Table 3: The compounds in S2.
Table 2 shows the compounds contained in the first subsample. Table 3 contains the components for the second subsample. It is significant to note that one structure was shared between the samples—Ketaconazole was chosen to mimic the active pharmaceutical ingredient.
COMPOSITE SAMPLES It is common practice for method development chromatographers to inject more than one vial (subsample) per set of chromatographic conditions. These subsamples may contain blanks, standards, “pure” samples, and/or stressed samples. In all cases, it is important to detect all significant components, and determine which components are unique, or shared between the subsamples. For purposes of method design, it is typical to treat all components as being part of one overall sample.
COMPOSITE CHROMATOGRAMS Composite chromatograms are a construct that is extremely useful for the method development chromatographer. The composite chromatogram can summarize all subsamples, and detectors in one single artificial trace that represents the overall response of the components of interest to the chromatographic conditions.
HPLC 2008 LC/MS/UV Data Reduction in Purity and Stability-Indicating HPLC Method Development
3
2422201816141210864Retention Time (min)
403.
27 +
403
.26
288.
32 +
288
.32_
1
391.
25 +
391
.25_
136
9.22
463.
08
383.
2227
9.23
414.
94 +
313
.16
399.
21 +
399
.244
4.27
532.
32_1
452.
26 +
452
.27
620.
3870
5.23416.
1245
9.21
253.
2731
1.1
529.
1 +
W_1
129
7.11
385.
231
1.07
245.
2453
1.09
+ 5
31.0
9_1
W_1
045
7.11
448.
0349
7.12
380.
1424
5.24
_144
3.1
411.
1830
0.07
426.
1132
9.07
+ 3
29.0
7_1
257.
1320
3.2
241.
1732
3.13
223.
2244
2.1
564.
2452
0.26
476.
2543
2.23
388.
2
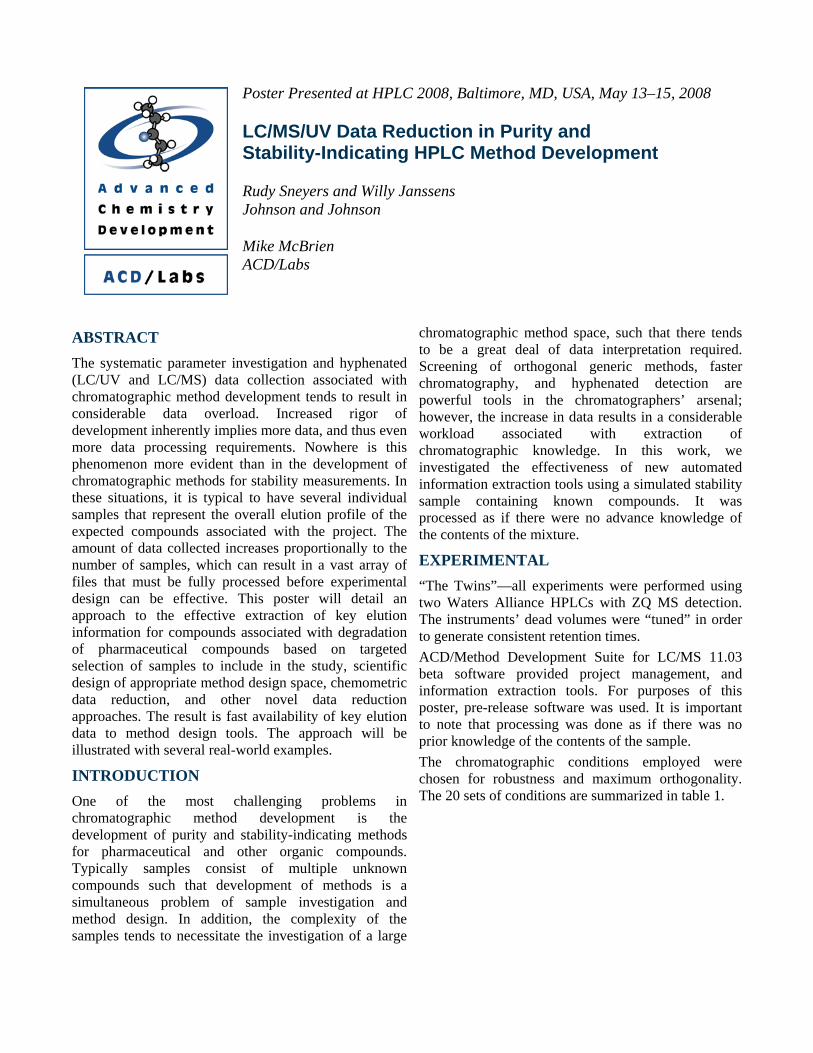
Figure 1: A composite chromatogram for the sample in the project prior to filtration based on UV signal (see below). Note that 84 peaks on the chromatogram represent a summary of elution data from 2 detectors and 2 subsamples; 4 chromatographic curves have been condensed into one overall trace.
METHOD DEVELOPMENT PROJECTS The method development project is a collection of all of the chromatographic data associated with the workflow. For large projects, as much as 4 GB of data can be summarized in this system. All of the hyphenated data is connected directly to chemometric and decision-making tools.
Figure 2: The data architecture in the method development project.
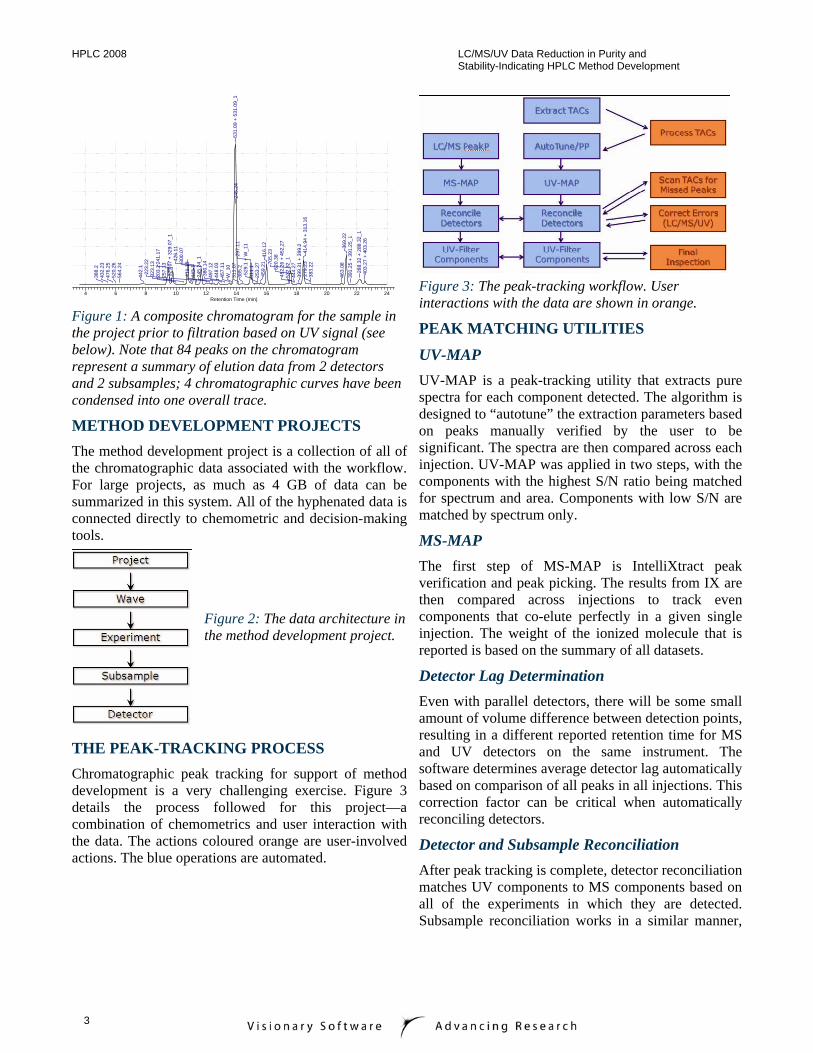
THE PEAK-TRACKING PROCESS Chromatographic peak tracking for support of method development is a very challenging exercise. Figure 3 details the process followed for this project—a combination of chemometrics and user interaction with the data. The actions coloured orange are user-involved actions. The blue operations are automated.
Figure 3: The peak-tracking workflow. User interactions with the data are shown in orange.
PEAK MATCHING UTILITIES
UV-MAP UV-MAP is a peak-tracking utility that extracts pure spectra for each component detected. The algorithm is designed to “autotune” the extraction parameters based on peaks manually verified by the user to be significant. The spectra are then compared across each injection. UV-MAP was applied in two steps, with the components with the highest S/N ratio being matched for spectrum and area. Components with low S/N are matched by spectrum only.
MS-MAP The first step of MS-MAP is IntelliXtract peak verification and peak picking. The results from IX are then compared across injections to track even components that co-elute perfectly in a given single injection. The weight of the ionized molecule that is reported is based on the summary of all datasets.
Detector Lag Determination Even with parallel detectors, there will be some small amount of volume difference between detection points, resulting in a different reported retention time for MS and UV detectors on the same instrument. The software determines average detector lag automatically based on comparison of all peaks in all injections. This correction factor can be critical when automatically reconciling detectors.
Detector and Subsample Reconciliation After peak tracking is complete, detector reconciliation matches UV components to MS components based on all of the experiments in which they are detected. Subsample reconciliation works in a similar manner,
HPLC 2008 LC/MS/UV Data Reduction in Purity and Stability-Indicating HPLC Method Development
4
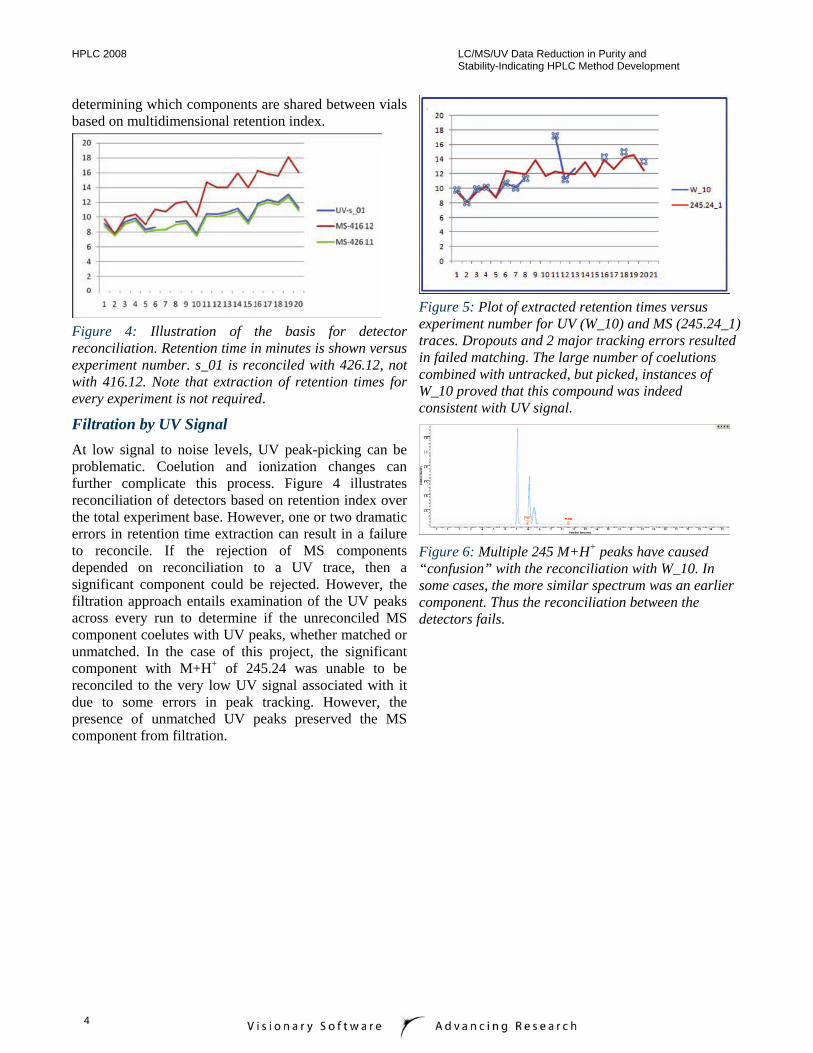
determining which components are shared between vials based on multidimensional retention index.
Figure 4: Illustration of the basis for detector reconciliation. Retention time in minutes is shown versus experiment number. s_01 is reconciled with 426.12, not with 416.12. Note that extraction of retention times for every experiment is not required.
Filtration by UV Signal At low signal to noise levels, UV peak-picking can be problematic. Coelution and ionization changes can further complicate this process. Figure 4 illustrates reconciliation of detectors based on retention index over the total experiment base. However, one or two dramatic errors in retention time extraction can result in a failure to reconcile. If the rejection of MS components depended on reconciliation to a UV trace, then a significant component could be rejected. However, the filtration approach entails examination of the UV peaks across every run to determine if the unreconciled MS component coelutes with UV peaks, whether matched or unmatched. In the case of this project, the significant component with M+H+ of 245.24 was unable to be reconciled to the very low UV signal associated with it due to some errors in peak tracking. However, the presence of unmatched UV peaks preserved the MS component from filtration.
Figure 5: Plot of extracted retention times versus experiment number for UV (W_10) and MS (245.24_1) traces. Dropouts and 2 major tracking errors resulted in failed matching. The large number of coelutions combined with untracked, but picked, instances of W_10 proved that this compound was indeed consistent with UV signal.
Figure 6: Multiple 245 M+H+ peaks have caused “confusion” with the reconciliation with W_10. In some cases, the more similar spectrum was an earlier component. Thus the reconciliation between the detectors fails.
HPLC 2008 LC/MS/UV Data Reduction in Purity and Stability-Indicating HPLC Method Development
5
Simulated Degradation Sample
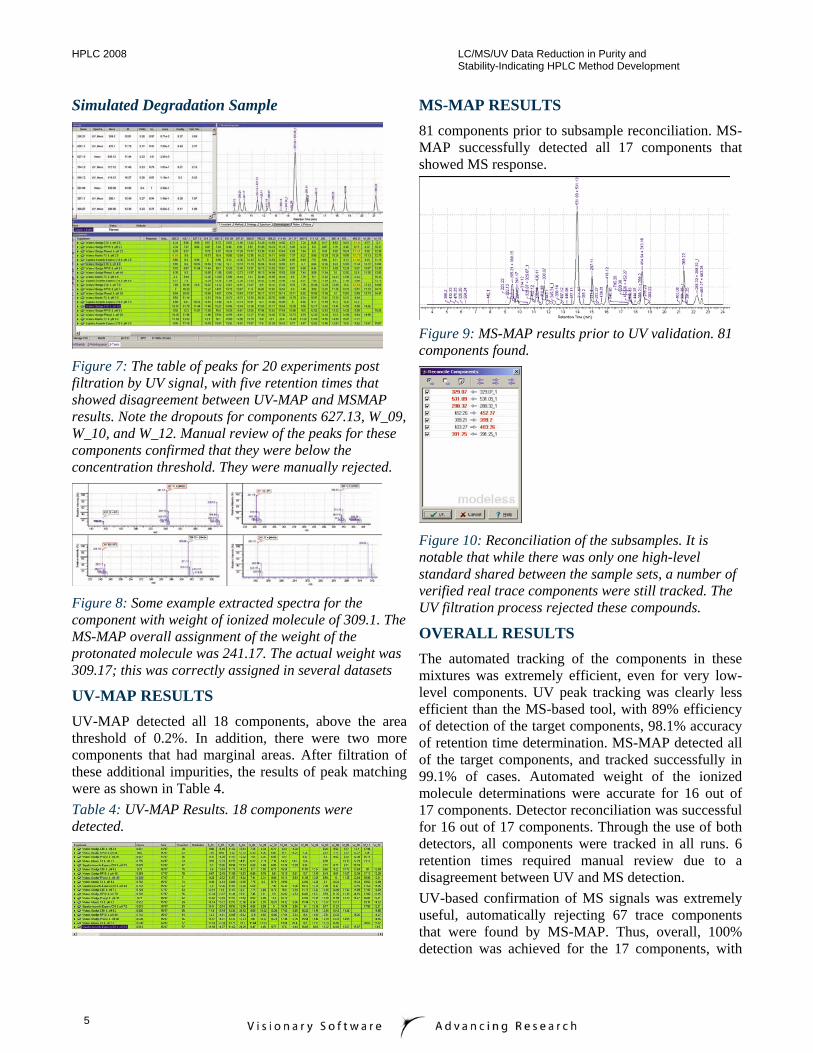
Figure 7: The table of peaks for 20 experiments post filtration by UV signal, with five retention times that showed disagreement between UV-MAP and MSMAP results. Note the dropouts for components 627.13, W_09, W_10, and W_12. Manual review of the peaks for these components confirmed that they were below the concentration threshold. They were manually rejected.
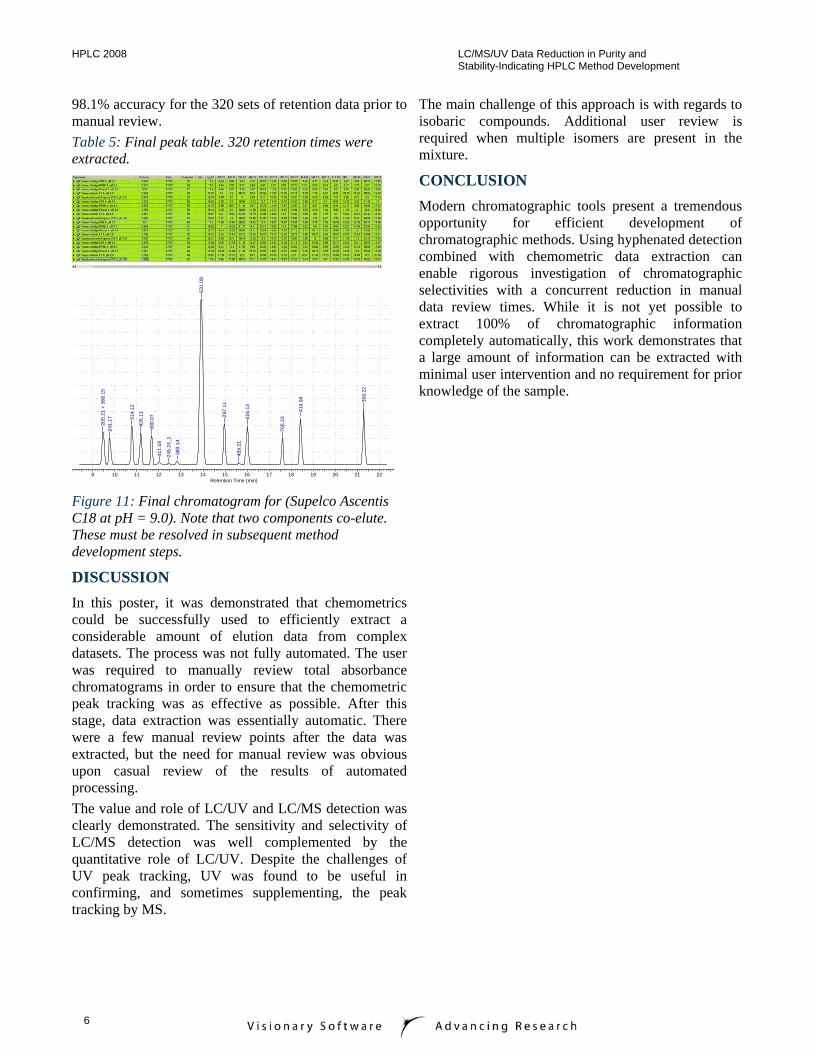
Figure 8: Some example extracted spectra for the component with weight of ionized molecule of 309.1. The MS-MAP overall assignment of the weight of the protonated molecule was 241.17. The actual weight was 309.17; this was correctly assigned in several datasets
UV-MAP RESULTS UV-MAP detected all 18 components, above the area threshold of 0.2%. In addition, there were two more components that had marginal areas. After filtration of these additional impurities, the results of peak matching were as shown in Table 4. Table 4: UV-MAP Results. 18 components were detected.
MS-MAP RESULTS 81 components prior to subsample reconciliation. MS-MAP successfully detected all 17 components that showed MS response.
Figure 9: MS-MAP results prior to UV validation. 81 components found.
Figure 10: Reconciliation of the subsamples. It is notable that while there was only one high-level standard shared between the sample sets, a number of verified real trace components were still tracked. The UV filtration process rejected these compounds.
OVERALL RESULTS The automated tracking of the components in these mixtures was extremely efficient, even for very low-level components. UV peak tracking was clearly less efficient than the MS-based tool, with 89% efficiency of detection of the target components, 98.1% accuracy of retention time determination. MS-MAP detected all of the target components, and tracked successfully in 99.1% of cases. Automated weight of the ionized molecule determinations were accurate for 16 out of 17 components. Detector reconciliation was successful for 16 out of 17 components. Through the use of both detectors, all components were tracked in all runs. 6 retention times required manual review due to a disagreement between UV and MS detection. UV-based confirmation of MS signals was extremely useful, automatically rejecting 67 trace components that were found by MS-MAP. Thus, overall, 100% detection was achieved for the 17 components, with
HPLC 2008 LC/MS/UV Data Reduction in Purity and Stability-Indicating HPLC Method Development
6
98.1% accuracy for the 320 sets of retention data prior to manual review. Table 5: Final peak table. 320 retention times were extracted.
222120191817161514131211109Retention Time (min)
369.
22
414.
94
705.
23416.
12
459.
21
297.
11
531.
09
380.
14
245.
24_1
411.
1830
0.07
426.
11314.
12
241.
1720
5.21
+ 3
68.1
5
Figure 11: Final chromatogram for (Supelco Ascentis C18 at pH = 9.0). Note that two components co-elute. These must be resolved in subsequent method development steps.
DISCUSSION In this poster, it was demonstrated that chemometrics could be successfully used to efficiently extract a considerable amount of elution data from complex datasets. The process was not fully automated. The user was required to manually review total absorbance chromatograms in order to ensure that the chemometric peak tracking was as effective as possible. After this stage, data extraction was essentially automatic. There were a few manual review points after the data was extracted, but the need for manual review was obvious upon casual review of the results of automated processing. The value and role of LC/UV and LC/MS detection was clearly demonstrated. The sensitivity and selectivity of LC/MS detection was well complemented by the quantitative role of LC/UV. Despite the challenges of UV peak tracking, UV was found to be useful in confirming, and sometimes supplementing, the peak tracking by MS.
The main challenge of this approach is with regards to isobaric compounds. Additional user review is required when multiple isomers are present in the mixture.
CONCLUSION Modern chromatographic tools present a tremendous opportunity for efficient development of chromatographic methods. Using hyphenated detection combined with chemometric data extraction can enable rigorous investigation of chromatographic selectivities with a concurrent reduction in manual data review times. While it is not yet possible to extract 100% of chromatographic information completely automatically, this work demonstrates that a large amount of information can be extracted with minimal user intervention and no requirement for prior knowledge of the sample.


![Stability-indicating Analytical Method Development using ... · MS detectors. The ICH Q1A (R2)[20] guideline entitled “Stability testing of new drug substances a nd products”](https://img.pdfslide.us/doc/110x75/5f0629487e708231d416996c/stability-indicating-analytical-method-development-using-ms-detectors-the-ich.jpg)