Embed Size (px)
Citation preview
Eurasian Journal of Analytical Chemistry, 2016, 11(4), 197-210
Copyright © 2016 by authors, Terms and conditions of Creative Commons Attribution 4.0 International (CC BY 4.0) apply. ISSN: 1306-3057
A Validated Stability Indicating RP-HPLC Method for Determination of Phenobarbital and Acefylline Piperazine in Bulk Drug and Combined Dosage Form Gamal Ragab, Hanaa Saleh, Magda el-Henawee & Omnia F. Elsayed Zagazig University, Faculty of Pharmacy, Sharkia, EGYPT Received 03 March 2016 Revised 29 March 2016 Accepted 01 April 2016
A simple, sensitive, precise and stability indicating RP-HPLC method was developed for determination of Phenorbarbital and Acefylline Piperazine in bulk drug and in combined syrup. Isocratic, HPLC method , using Thermo Hypersil C18 gold column with mobile phase of Acetonitrile - 0.1% orthophosphoric acid (30:70,v/v) was investigated to separate the drugs from their stressed degredation products. The flow rate was 1.5 ml/min. Detection was carried out at a wavelength of 240 nm. The method was validated for precision, accuracy, robustness and recovery. Phenobarbital and Acefylline Piperazine were exposed to acidic, basic, neutral, oxidative and photolytic stress conditions and the stressed samples were analyzed by the proposed method. Good linear relationship in the concentration range of (1-100) µg/ml and (4-250) µg/ml for Phenobarbital and Acefylline Piperazine respectively with correlation coefficient of 0.9999 for both drugs. Intra- and inter-day precision were less than 1% for both analytes. the method was tested for specifity for determination of target analytes in presence of excipients like Methylparaben and Propylparaben also The stressed sample chromatograms demonstrate the specificity of the proposed method for the determination of target analytes in presence of degradants.
Keywords: stability indicating , HPLC, Phenobarbital, Acefylline Piperazine
INTRODUCTION
Phenobarbital (PHB) is 5-Ethyl-5-phenylpyrimidine-2,4,6(1H,3H,5H)-trione [1]. which is a is a long-acting barbiturate and the most widely used anticonvulsant worldwide[2], and the oldest still commonly used. It also has sedative and hypnotic properties. Acefylline Piperazine (AC), salt of 7-theophyllineacetic acid is a xanthine bronchodilator used as antiasthmatic agent, cardiac stimulant and diuretic[3], ACP is usually associated with Phenobarbital
Correspondence: Omnia F. Elsayed, Zagazig University, Faculty of Pharmacy, 44519 Sharkia, EGYPT E-mail: [email protected] doi: 10.12973/ejac.2016.132a
OPEN
ACCESS
G. Ragab et. al.
198 © 2016 by authors, Eurasian J Anal Chem, 11(4), 197-210
(PHB) and The combination of the drugs is used for treating of bronchial spasm and chronic bronchitis.
Different analytical methods were used for determination of PHB with bronchodilators and other drugs such as diprophylline and papaverine hydrochloride [4], theophylline, theobromine, aminopyrine, caffeine,ephedrine, phenacetin [5], theophylline, amylobarbitone, carbamazepine [6], using HPLC. Other chromatographic methods for PH [7-12], other techniques such as: capillary electrophoresis method [13], ion-selective electrode potentiometric method [14] and spectrophotometric methods [15, 16]. Different methods reported for AC ,HPLC methods with PHB and papaverine HCL [12], Methylparaben and propylparaben [17], assay in plasma [18] and [19], spectrophotometric method [20]. The developed method is a stability indicating method for determination of Phenorbarbital and acefylline Piperazine in pure form and in commercial syrups, without interference of excipients or degradation prouducts resulted from stress conditions.
EXPERIMENTAL
Chemicals and reagents
PHB, ACP, Methylparaben and Propylparaben were obtained from Egyptian Int. Pharmaceutical Industries Co., EIPICO, (10th of Ramadan city, Egypt). Etaphylline pheno® syrup labeled to contain 2 gm/100mL ACP and 66 mg/mL PHB from Egyptian market.
HPLC grade Acetonitrile Poch S.A (Avantor Performance Materials, Gliwice Poland) and Orthophosphoric acid from Burdick & Jackson (Sleeze, Germany). Analytical grade of sodium hydroxide, hydrochloric acid and 30 % hydrogen peroxide were purchased from Sigma–Aldrich (St. Louis, MO, USA) and high purity distilled water was used.
Instrumentation
The HPLC (Agilent 1100 series) instrument equipped with G1310A isocratic quaternary pump with solvent cabinet, G1322A vacuum degasser, G1313A autosampler injector, G1314A variable wavelength detector (VWD) connected to a computer loaded with Agilent Chemstation software. Hypersil gold C18, 5 µ (150 mm x 4.6 mm ID) column was used. UV lamp with short wave length 254 nm was obtained from Desaga (Waldbronn, Germany).
Chromatographic conditions
The isocratic mobile phase consisted of Acetonitrile and 0.1% orthophosphoric acid (30:70,v/v) (pH 2.3). The autosampler utilized Acetonitrile as a rinse solution. The injection volume was 10μl Flow rate of mobile phase was 1.5 mL min-1. The variable wavelength UV–visible detector was set at 240 nm. All analyses were performed at ambient temperature. Conditions are summarized in Table (1).
Preparation of standard stock solution
Stock standard solution of PHB was prepared by dissolving 10 mg of PHB in least amount of ethanol and complete to 100 mL with double distilled water. ACP stock solution prepared by dissolving 30 mg of ACP in double distilled water and complete to 100 mL water. The working standard solutions were prepared by diluting aliquots of each stock solution to obtain concentrations ranging from 1 to 100 μg
Determination of phenobarbital and acefylline piperazine
© 2016 by authors, Eurasian J Anal Chem, 11(4), 197-210 199
mL-1 and from 4 to 250 μg mL-1 for PHB and ACP, respectively. Working solutions of both drugs were stable for one week.
General procedures
Construction of calibration curves
Aliquots of standard solution ranging from (1-100 μg mL-1) for PHB and (4-250 μg mL-1) for ACP were prepared in a series of 10 mL volumetric flasks, 10 µl were injected to the instrument. Detection was performed at 240 nm. Analyses were performed in triplicate and the responses were measured as peak area. The calibration curves were obtained by plotting peak area against concentration. 100 μg mL-1 of both MP and PP were injected with ACP and PHB to ensure separation of ACP and PHB from these preservatives that found in syrup dosage form.
Procedure for dosage forms
A volume of Etaphylline pheno® syrup (labeled to contain 2gm/100mL AC and 66mg/100mL PHB) equivalent to 30 mg of ACP, 10 mg of PHB, was diluted to 100 mL with double distilled water. Further dilution was carried out to reach the calibration range of each compound.
Forced degradation studies
Forced degradation studies were performed to provide an indication of the stability-indicating properties and specificity of the method on both pure drugs and combined syrup dosage form.
Intentional degradation was attempted using acid, base, neutral hydrogen peroxide, and UV-radiation. From the previously mentioned stock solutions (10 mg/100mL) of standard drugs solutions, aliquots of 10 mL were transferred to each of four 50mL round bottomed flasks to perform the first four degradation tests. To the first flask 10mL of 1M HCl was added for acidic degradation. To the second flask 10 mL of 1M NaOH was added for basic degradation. To the third flask 10 mL of neutral water only added. To the fourth flask 10mL of 30% H2O2 was added for oxidative degradation. All 4 flasks were refluxed for about 1 hr. After completing the degradation treatment, samples were allowed to cool to room temperature and treated as follows. The pH values of the first and second flasks were neutralized with 1N NaOH and 1N HCl, respectively. The volume of all the four flasks was adjusted to 50 mL to give final concentration of 20 µg mL-1 for both ACP and PHB. For photo degradation study, the sample solutions were left in UV radiation for 1 hr then the radiated solution was diluted to 10 mL, Samples were injected and analyzed against control samples (lacking of degradation treatment).
Application of degradation study on Etaphylline pheno® syrup was also performed to ensure specifity of the method without interference of additives found in syrup. 0.5 mL of Etaphylline pheno® syrup was transferred to a 50 mL round bottomed flask and procedures were done as mentioned before for pure standard drugs as in basic, acidic, neutral, oxidative and photodegradation studies. After degradation, the volumes were adjusted to give final concentration equivalent to 200 µg/mL ACP and 6.6 µg/mL PHB. Finally, Samples were injected and analyzed against control samples (lacking of degradation treatment).
G. Ragab et. al.
200 © 2016 by authors, Eurasian J Anal Chem, 11(4), 197-210
RESULTS AND DISCUSSION
Method development
Different chromatographic conditions were studied to obtain an acceptable chromatographic resolution between target analytes and their main degradation products.
Mobile phase composition
A buffer free method was developed by using Acetonitrile-0.1% O-phosphoric acid (30:70, v/v). Initial study was performed by using Acetonitrile-0.1% O-phosphoric acid in percent of (10 : 90,v/v), the retention time of ACP was 6.6 min and PHB was delayed at 38.5 min. the percentage of Acetonitrile increased to be (40: 60, v/v) , the retention times were 3.5 min and 4.9 min for ACP and PHB, respectively but there was inference with MP ( added with authentic drugs) which gave peak at 3.8 min , so the mobile phase was adjusted to be (30: 70, v/v). At these conditions the retention times were 3.75, 4.5, 6.25, and 14.87 min for ACP, PHB, MP and PP respectively.
Column oven temperature
Column oven temperature was also studied (at room temperature, 30 0C) and it was found that, there was no need to increase temperature and that good separation could be obtained at room temperature.
Choice of detection wavelength
Different wavelength was studied at 230, 240, 250 nm. It was found that 240 nm
to be optimum for detection at which the highest detector response was obtained
Choice of flow rate
The effect of flow rate was studied to optimize the chromatographic efficiency of the proposed method and improve the resolution of the eluted peaks. The flow rate was changed over the range of 1-3 mL min-1 and a flow rate of 1.5 mL min-1 was optimal for good separation in a reasonable time.
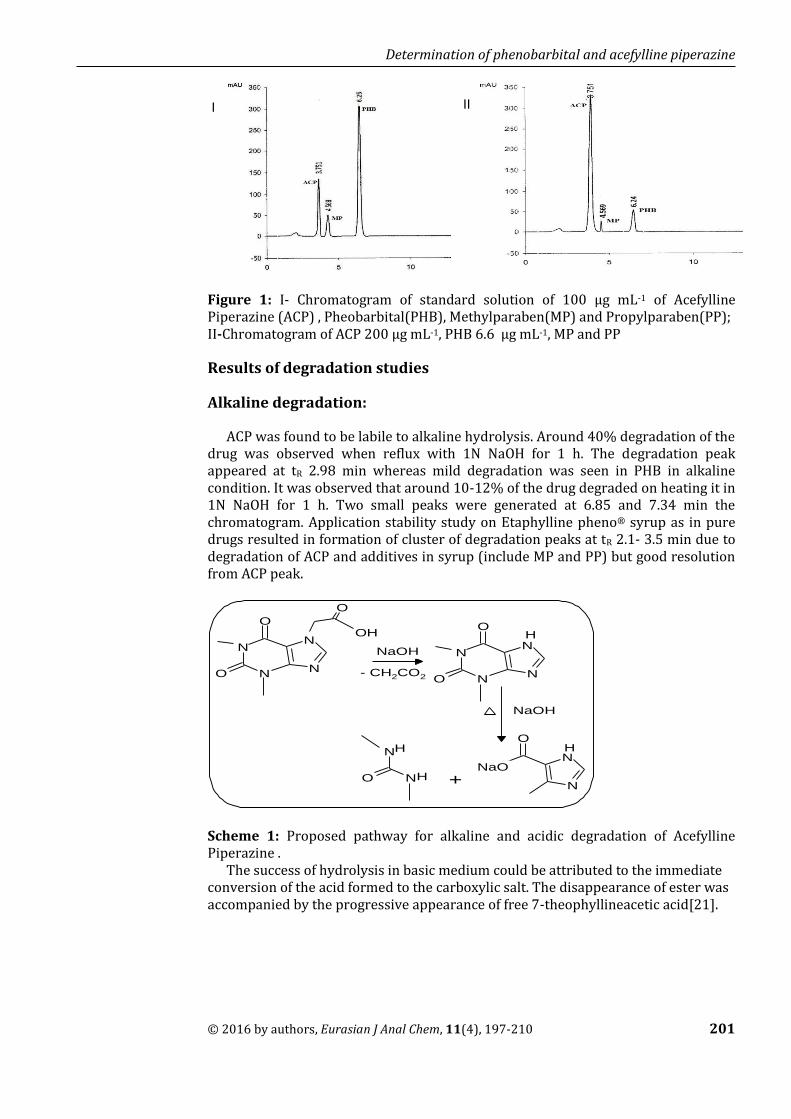
So, the optimum chromatographic performances were achieved when using isocratic mobile phase composed of Acetonitrile - 0.1% O-phosphoric acid (30:70,v/v) pH 2.3, injection volume 10 μl, column temperature at ambient temperature, detection wavelength 240 nm and flow rate 1.5 mL min-1. Symmetrical peak shape (Fig.1) was obtained under the proposed chromatographic conditions; ACP and PHB were separated within 3.75 and 6.25, minutes respectively.
Determination of phenobarbital and acefylline piperazine
© 2016 by authors, Eurasian J Anal Chem, 11(4), 197-210 201
Figure 1: I- Chromatogram of standard solution of 100 µg mL-1 of Acefylline Piperazine (ACP) , Pheobarbital(PHB), Methylparaben(MP) and Propylparaben(PP); II-Chromatogram of ACP 200 µg mL-1, PHB 6.6 µg mL-1, MP and PP
Results of degradation studies
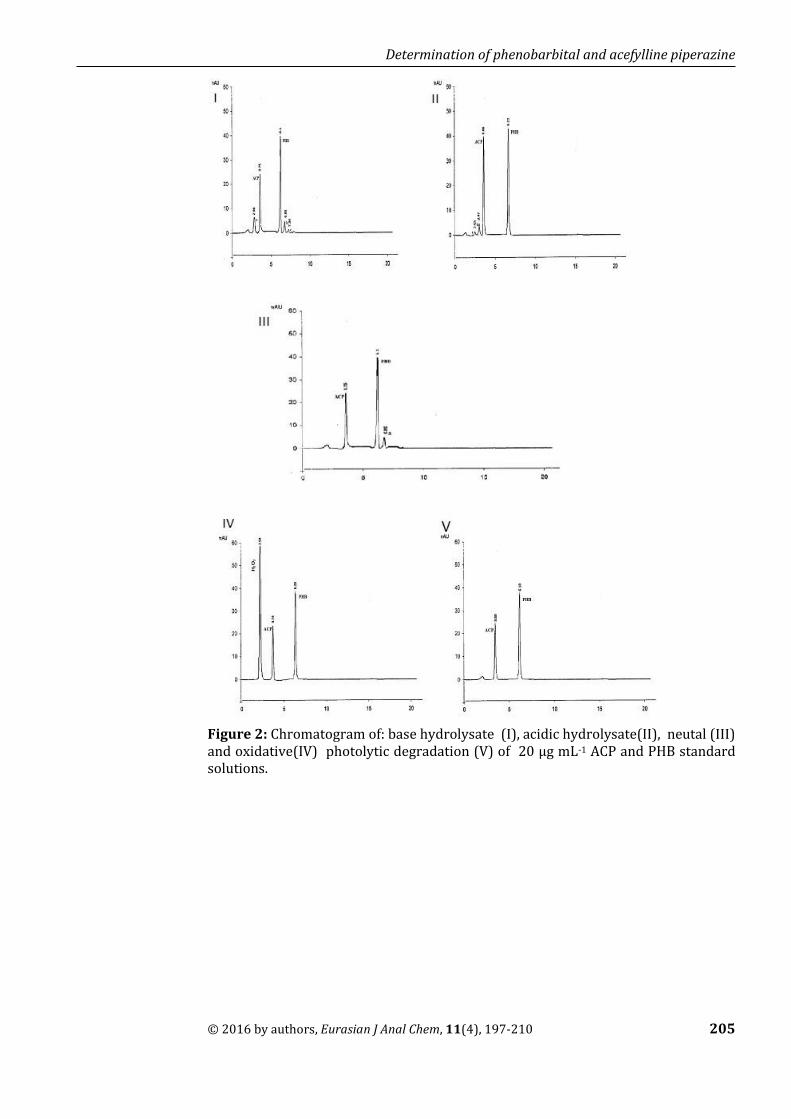
Alkaline degradation:
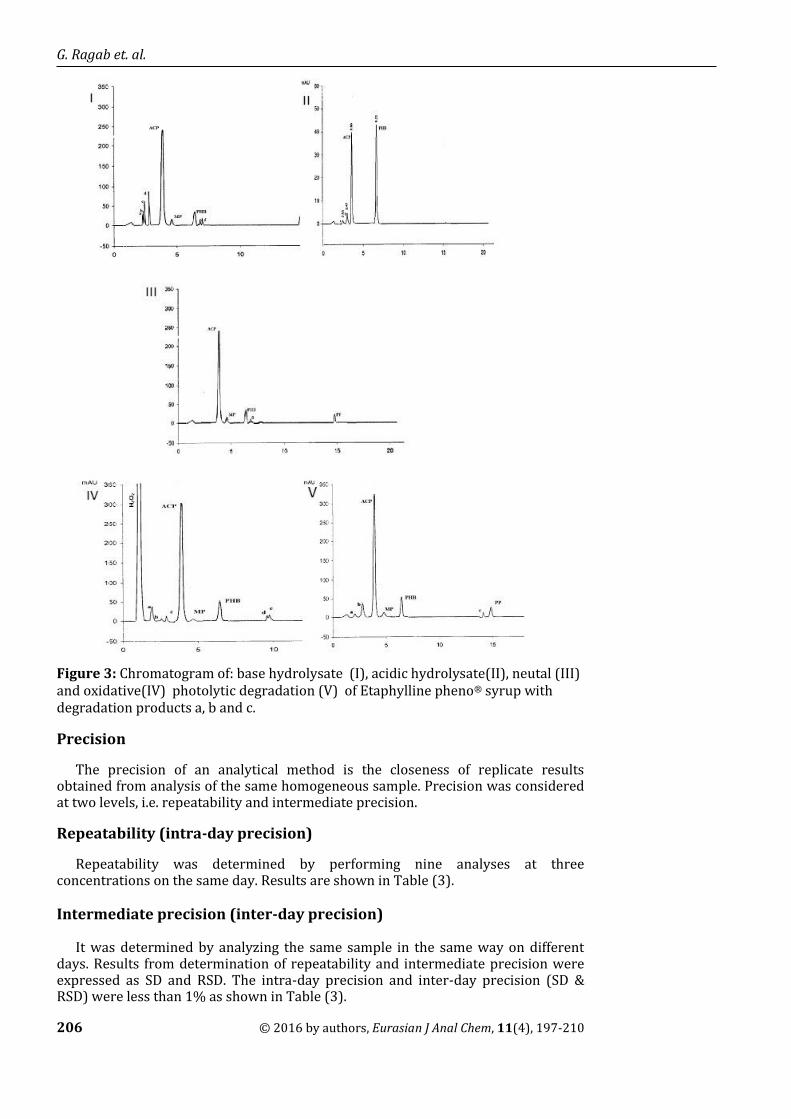
ACP was found to be labile to alkaline hydrolysis. Around 40% degradation of the drug was observed when reflux with 1N NaOH for 1 h. The degradation peak appeared at tR 2.98 min whereas mild degradation was seen in PHB in alkaline condition. It was observed that around 10-12% of the drug degraded on heating it in 1N NaOH for 1 h. Two small peaks were generated at 6.85 and 7.34 min the chromatogram. Application stability study on Etaphylline pheno® syrup as in pure drugs resulted in formation of cluster of degradation peaks at tR 2.1- 3.5 min due to degradation of ACP and additives in syrup (include MP and PP) but good resolution from ACP peak.
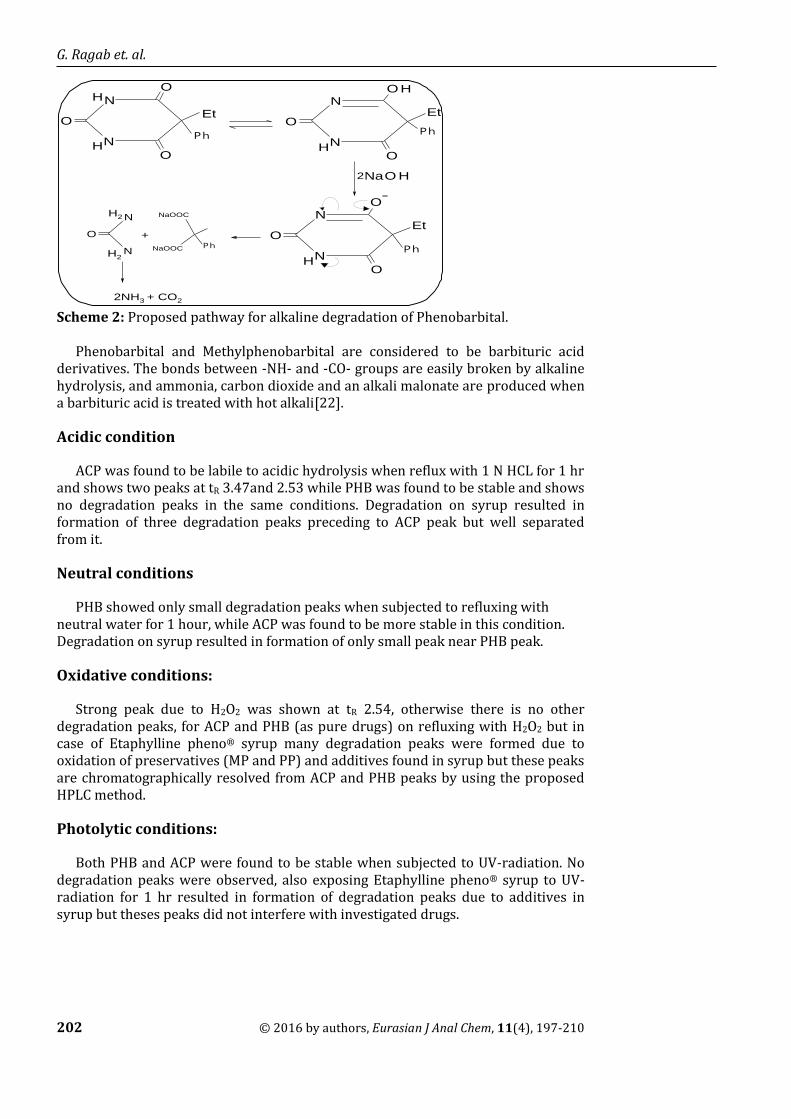
Scheme 1: Proposed pathway for alkaline and acidic degradation of Acefylline Piperazine .
The success of hydrolysis in basic medium could be attributed to the immediate conversion of the acid formed to the carboxylic salt. The disappearance of ester was accompanied by the progressive appearance of free 7-theophyllineacetic acid[21].
N
NN
O N
O
N
NN
O N
OOH
O
N
N
O
H
HN
O N
H
H
- CH2CO2
NaOH
NaOH
NaO
+
I II
G. Ragab et. al.
202 © 2016 by authors, Eurasian J Anal Chem, 11(4), 197-210
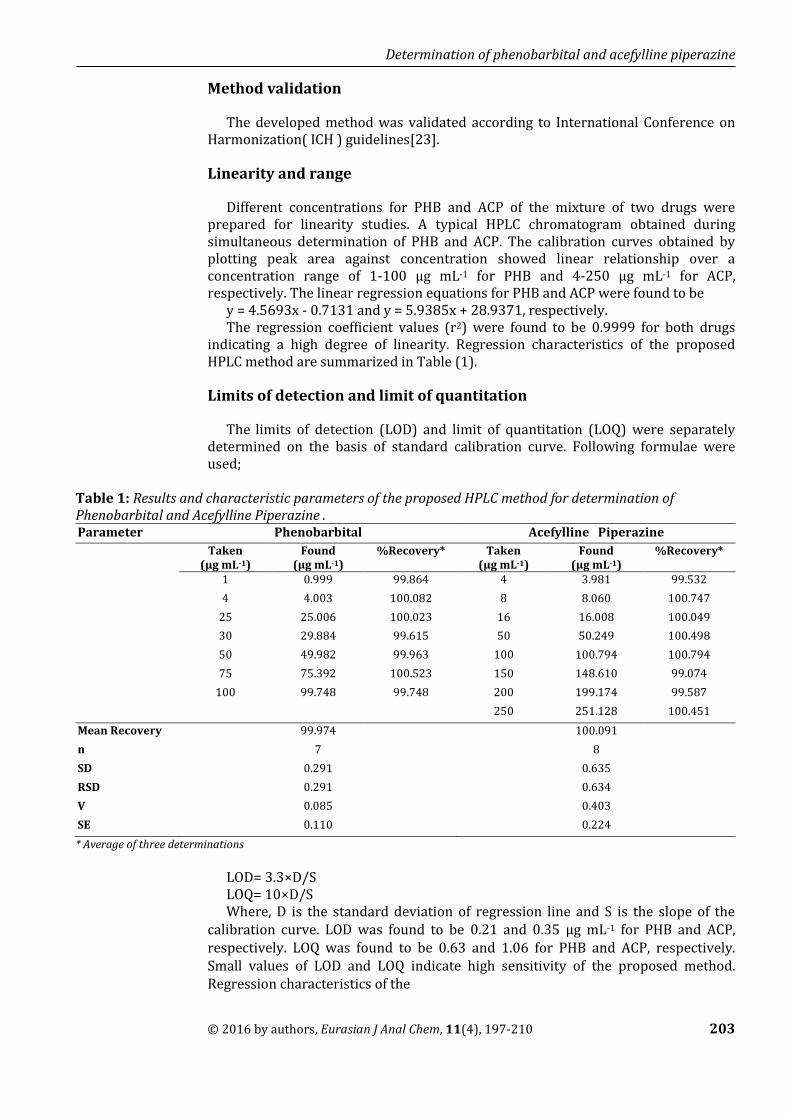
Scheme 2: Proposed pathway for alkaline degradation of Phenobarbital.
Phenobarbital and Methylphenobarbital are considered to be barbituric acid
derivatives. The bonds between -NH- and -CO- groups are easily broken by alkaline hydrolysis, and ammonia, carbon dioxide and an alkali malonate are produced when a barbituric acid is treated with hot alkali[22].
Acidic condition
ACP was found to be labile to acidic hydrolysis when reflux with 1 N HCL for 1 hr and shows two peaks at tR 3.47and 2.53 while PHB was found to be stable and shows no degradation peaks in the same conditions. Degradation on syrup resulted in formation of three degradation peaks preceding to ACP peak but well separated from it.
Neutral conditions
PHB showed only small degradation peaks when subjected to refluxing with neutral water for 1 hour, while ACP was found to be more stable in this condition. Degradation on syrup resulted in formation of only small peak near PHB peak.
Oxidative conditions:
Strong peak due to H2O2 was shown at tR 2.54, otherwise there is no other degradation peaks, for ACP and PHB (as pure drugs) on refluxing with H2O2 but in case of Etaphylline pheno® syrup many degradation peaks were formed due to oxidation of preservatives (MP and PP) and additives found in syrup but these peaks are chromatographically resolved from ACP and PHB peaks by using the proposed HPLC method.
Photolytic conditions:
Both PHB and ACP were found to be stable when subjected to UV-radiation. No degradation peaks were observed, also exposing Etaphylline pheno® syrup to UV-radiation for 1 hr resulted in formation of degradation peaks due to additives in syrup but theses peaks did not interfere with investigated drugs.
N
N
O
O
O
H
H
N
N
O
O
O
H
H
NaO H
H
N
N
O
O
O
N
N
O
Et Et
Et
Ph Ph
Ph
2
Ph
NaOOC
NaOOC
H2
H2
+
2NH3 + CO2
Determination of phenobarbital and acefylline piperazine
© 2016 by authors, Eurasian J Anal Chem, 11(4), 197-210 203
Method validation
The developed method was validated according to International Conference on Harmonization( ICH ) guidelines[23].
Linearity and range
Different concentrations for PHB and ACP of the mixture of two drugs were prepared for linearity studies. A typical HPLC chromatogram obtained during simultaneous determination of PHB and ACP. The calibration curves obtained by plotting peak area against concentration showed linear relationship over a concentration range of 1-100 µg mL-1 for PHB and 4-250 µg mL-1 for ACP, respectively. The linear regression equations for PHB and ACP were found to be
y = 4.5693x - 0.7131 and y = 5.9385x + 28.9371, respectively. The regression coefficient values (r2) were found to be 0.9999 for both drugs
indicating a high degree of linearity. Regression characteristics of the proposed HPLC method are summarized in Table (1).
Limits of detection and limit of quantitation
The limits of detection (LOD) and limit of quantitation (LOQ) were separately determined on the basis of standard calibration curve. Following formulae were used;
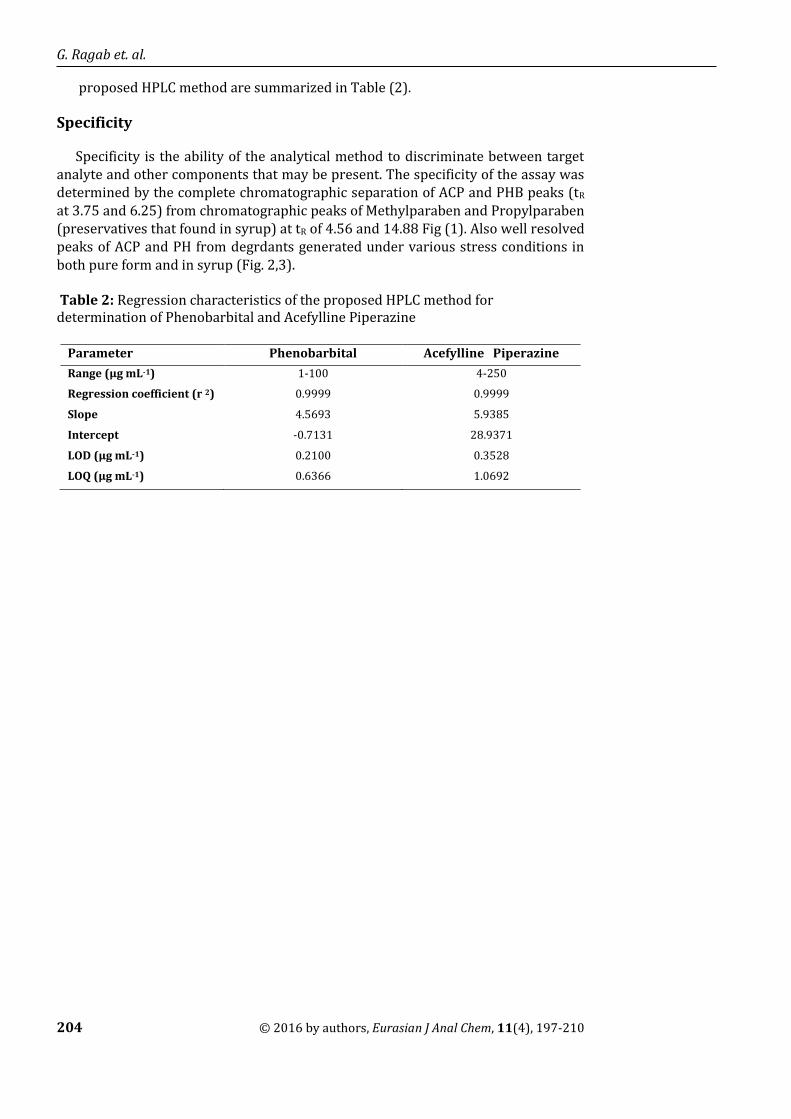
Table 1: Results and characteristic parameters of the proposed HPLC method for determination of Phenobarbital and Acefylline Piperazine . Parameter Phenobarbital Acefylline Piperazine
Taken (μg mL-1)
Found (μg mL-1)
%Recovery* Taken (μg mL-1)
Found (μg mL-1)
%Recovery*
1 0.999 99.864 4 3.981 99.532
4 4.003 100.082 8 8.060 100.747
25 25.006 100.023 16 16.008 100.049
30 29.884 99.615 50 50.249 100.498
50 49.982 99.963 100 100.794 100.794
75 75.392 100.523 150 148.610 99.074
100 99.748 99.748 200 199.174 99.587
250 251.128 100.451
Mean Recovery 99.974 100.091
n 7 8
SD 0.291 0.635
RSD 0.291 0.634
V 0.085 0.403
SE 0.110 0.224
* Average of three determinations
LOD= 3.3×D/S LOQ= 10×D/S Where, D is the standard deviation of regression line and S is the slope of the
calibration curve. LOD was found to be 0.21 and 0.35 µg mL-1 for PHB and ACP, respectively. LOQ was found to be 0.63 and 1.06 for PHB and ACP, respectively. Small values of LOD and LOQ indicate high sensitivity of the proposed method. Regression characteristics of the
G. Ragab et. al.
204 © 2016 by authors, Eurasian J Anal Chem, 11(4), 197-210
proposed HPLC method are summarized in Table (2).
Specificity
Specificity is the ability of the analytical method to discriminate between target analyte and other components that may be present. The specificity of the assay was determined by the complete chromatographic separation of ACP and PHB peaks (tR at 3.75 and 6.25) from chromatographic peaks of Methylparaben and Propylparaben (preservatives that found in syrup) at tR of 4.56 and 14.88 Fig (1). Also well resolved peaks of ACP and PH from degrdants generated under various stress conditions in both pure form and in syrup (Fig. 2,3). Table 2: Regression characteristics of the proposed HPLC method for determination of Phenobarbital and Acefylline Piperazine
Parameter Phenobarbital Acefylline Piperazine
Range (μg mL-1) 1-100 4-250
Regression coefficient (r 2) 0.9999 0.9999
Slope 4.5693 5.9385
Intercept -0.7131 28.9371
LOD (μg mL-1) 0.2100 0.3528
LOQ (μg mL-1) 0.6366 1.0692
Determination of phenobarbital and acefylline piperazine
© 2016 by authors, Eurasian J Anal Chem, 11(4), 197-210 205
Figure 2: Chromatogram of: base hydrolysate (I), acidic hydrolysate(II), neutal (III) and oxidative(IV) photolytic degradation (V) of 20 µg mL-1 ACP and PHB standard solutions.
G. Ragab et. al.
206 © 2016 by authors, Eurasian J Anal Chem, 11(4), 197-210
Figure 3: Chromatogram of: base hydrolysate (I), acidic hydrolysate(II), neutal (III) and oxidative(IV) photolytic degradation (V) of Etaphylline pheno® syrup with degradation products a, b and c.
Precision
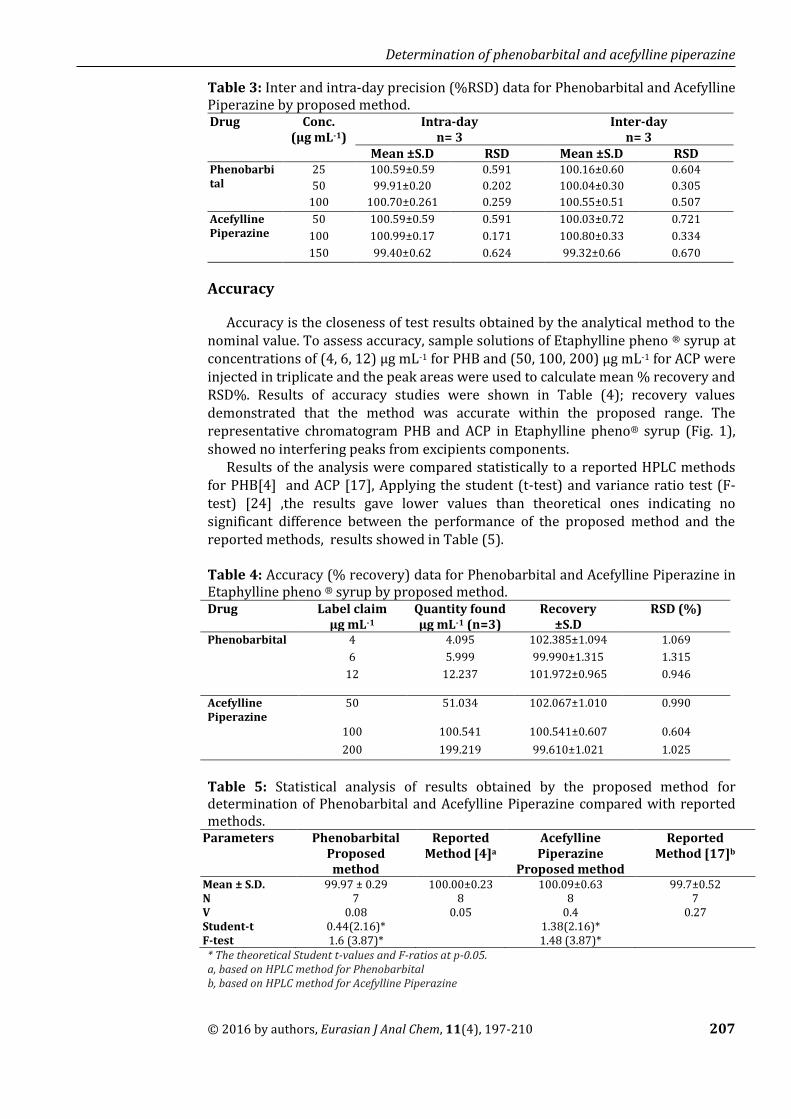
The precision of an analytical method is the closeness of replicate results obtained from analysis of the same homogeneous sample. Precision was considered at two levels, i.e. repeatability and intermediate precision.
Repeatability (intra-day precision)
Repeatability was determined by performing nine analyses at three concentrations on the same day. Results are shown in Table (3).
Intermediate precision (inter-day precision)
It was determined by analyzing the same sample in the same way on different days. Results from determination of repeatability and intermediate precision were expressed as SD and RSD. The intra-day precision and inter-day precision (SD & RSD) were less than 1% as shown in Table (3).
Determination of phenobarbital and acefylline piperazine
© 2016 by authors, Eurasian J Anal Chem, 11(4), 197-210 207
Table 3: Inter and intra-day precision (%RSD) data for Phenobarbital and Acefylline Piperazine by proposed method. Drug Conc.
(µg mL-1) Intra-day
n= 3 Inter-day
n= 3 Mean ±S.D RSD Mean ±S.D RSD
Phenobarbital
25 100.59±0.59 0.591 100.16±0.60 0.604
50 99.91±0.20 0.202 100.04±0.30 0.305
100 100.70±0.261 0.259 100.55±0.51 0.507
Acefylline Piperazine
50 100.59±0.59 0.591 100.03±0.72 0.721
100 100.99±0.17 0.171 100.80±0.33 0.334
150 99.40±0.62 0.624 99.32±0.66 0.670
Accuracy
Accuracy is the closeness of test results obtained by the analytical method to the nominal value. To assess accuracy, sample solutions of Etaphylline pheno ® syrup at concentrations of (4, 6, 12) µg mL-1 for PHB and (50, 100, 200) µg mL-1 for ACP were injected in triplicate and the peak areas were used to calculate mean % recovery and RSD%. Results of accuracy studies were shown in Table (4); recovery values demonstrated that the method was accurate within the proposed range. The representative chromatogram PHB and ACP in Etaphylline pheno® syrup (Fig. 1), showed no interfering peaks from excipients components.
Results of the analysis were compared statistically to a reported HPLC methods for PHB[4] and ACP [17], Applying the student (t-test) and variance ratio test (F-test) [24] ,the results gave lower values than theoretical ones indicating no significant difference between the performance of the proposed method and the reported methods, results showed in Table (5).
Table 4: Accuracy (% recovery) data for Phenobarbital and Acefylline Piperazine in Etaphylline pheno ® syrup by proposed method. Drug Label claim
µg mL-1 Quantity found µg mL-1 (n=3)
Recovery ±S.D
RSD (%)
Phenobarbital 4 4.095 102.385±1.094 1.069
6 5.999 99.990±1.315 1.315
12 12.237 101.972±0.965 0.946
Acefylline Piperazine
50 51.034 102.067±1.010 0.990
100 100.541 100.541±0.607 0.604
200 199.219 99.610±1.021 1.025
Table 5: Statistical analysis of results obtained by the proposed method for determination of Phenobarbital and Acefylline Piperazine compared with reported methods.
Parameters Phenobarbital Proposed method
Reported Method [4]a
Acefylline Piperazine
Proposed method
Reported Method [17]b
Mean ± S.D. 99.97 ± 0.29 100.00±0.23 100.09±0.63 99.7±0.52 N 7 8 8 7 V 0.08 0.05 0.4 0.27 Student-t 0.44(2.16)* 1.38(2.16)* F-test 1.6 (3.87)* 1.48 (3.87)* * The theoretical Student t-values and F-ratios at p-0.05. a, based on HPLC method for Phenobarbital b, based on HPLC method for Acefylline Piperazine
G. Ragab et. al.
208 © 2016 by authors, Eurasian J Anal Chem, 11(4), 197-210
Robustness
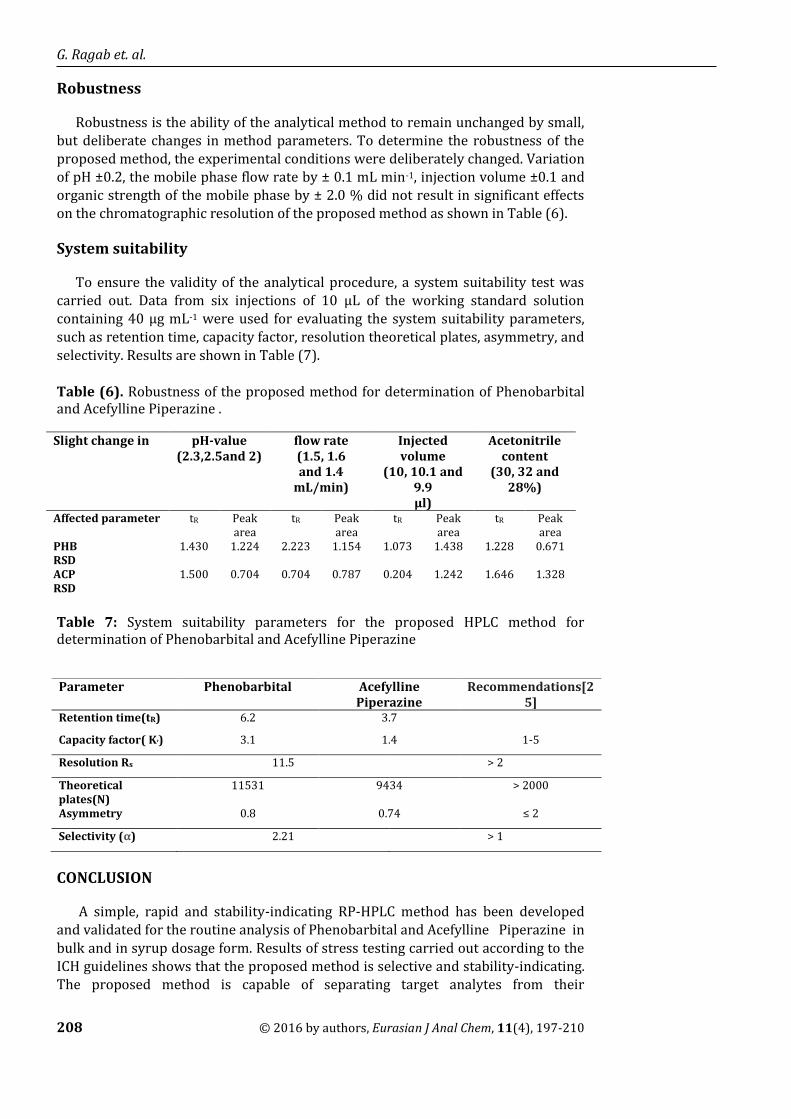
Robustness is the ability of the analytical method to remain unchanged by small, but deliberate changes in method parameters. To determine the robustness of the proposed method, the experimental conditions were deliberately changed. Variation of pH ±0.2, the mobile phase flow rate by ± 0.1 mL min-1, injection volume ±0.1 and organic strength of the mobile phase by ± 2.0 % did not result in significant effects on the chromatographic resolution of the proposed method as shown in Table (6).
System suitability
To ensure the validity of the analytical procedure, a system suitability test was carried out. Data from six injections of 10 μL of the working standard solution containing 40 μg mL-1 were used for evaluating the system suitability parameters, such as retention time, capacity factor, resolution theoretical plates, asymmetry, and selectivity. Results are shown in Table (7).
Table (6). Robustness of the proposed method for determination of Phenobarbital and Acefylline Piperazine .
Table 7: System suitability parameters for the proposed HPLC method for determination of Phenobarbital and Acefylline Piperazine
CONCLUSION
A simple, rapid and stability-indicating RP-HPLC method has been developed and validated for the routine analysis of Phenobarbital and Acefylline Piperazine in bulk and in syrup dosage form. Results of stress testing carried out according to the ICH guidelines shows that the proposed method is selective and stability-indicating. The proposed method is capable of separating target analytes from their
Slight change in pH-value (2.3,2.5and 2)
flow rate (1.5, 1.6 and 1.4
mL/min)
Injected volume
(10, 10.1 and 9.9 μl)
Acetonitrile content
(30, 32 and 28%)
Affected parameter tR Peak area
tR Peak area
tR Peak area
tR Peak area
PHB RSD
1.430
1.224
2.223
1.154
1.073
1.438
1.228
0.671
ACP RSD
1.500 0.704 0.704 0.787 0.204 1.242 1.646 1.328
Parameter Phenobarbital Acefylline Piperazine
Recommendations[25]
Retention time(tR) 6.2 3.7
Capacity factor( K,) 3.1 1.4 1-5
Resolution Rs 11.5 > 2
Theoretical plates(N)
11531 9434 > 2000
Asymmetry 0.8 0.74 ≤ 2
Selectivity (α) 2.21 > 1
Determination of phenobarbital and acefylline piperazine
© 2016 by authors, Eurasian J Anal Chem, 11(4), 197-210 209
degradation products without interference from excipients and additives that found
in syrup dosage form.
REFERENCES
1. Majesty’s, H. and Stationery Office, The British Pharmacopoeia. 2013: London, UK.
2. Kwan, P. and M.J. Brodie (2004) Phenobarbital for the treatment of epilepsy in the 21st century: a critical review. Epilepsia, 45(9), 1141-1149.
3. (2011) Kinetex®Core-Shell Technology Ultra-High Performance from HPLC to UHPLC.
4. El-Gindy, A. (2005). HPLC and chemometric assisted spectrophotometric methods for simultaneous determination of diprophylline, phenobarbitone and papaverine hydrochloride. Il Farmaco, 60(9), 745-753.
5. Xia, W., L. Daojie, and S. Jiling (2003) Simultaneous Determination of Seven Ingredients in Compound Theophylline Tablets by Reversed Phase High Performance Liquid Chromatography Gradient Elution. Chinese Journal of Analytical Chemistry, 31(5), 577-579.
6. Fu, S., S. Duan, and Q. Ren (1997) Simultaneous analysis of theophylline, phenobarbital, amobarbital and carbamazepine in serum by high performance liquid chromatography. Se pu= Chinese journal of chromatography/Zhongguo hua xue hui, 15(2), 178-179.
7. Hashem, H., A.A. Gouda, and H. Saleh (2013) Development And Validation Of Rapid Stability Indicating Hplc-Determinations Of Antiepileptic Drugs Phenobarbital In Suppositories And Phenytoin In Capsules As Well As In Urine Sample. Journal of Liquid Chromatography & Related Technologies, 36(16), 2292-2306.
8. Pandey, S., A.K. Yadav, S. Singh, H. Gautam, and S. Sharma (2012). Bio-analytical method development and its validation for estimation of phenobarbital in human plasma using liquid chromatography coupled with tandem mass. Int. J. Pharm. Pharm. Sci, 4(5): p. 288-92.
9. Dalmora, S.L., M.d.S. Sangoi, D.R. Nogueira, F.B. D'Avila, R.A. Moreno, C.E. Sverdloff, R.A.d. Oliveira, and N.C. Borges (2010). Determination of phenobarbital in human plasma by a specific liquid chromatography method: application to a bioequivalence study. Química Nova, 33(1): p. 124-129.
10. Johnson, L.L. and U. Garg (2010). Quantitation of amobarbital, butalbital, pentobarbital, phenobarbital, and secobarbital in urine, serum, and plasma using gas chromatography-mass spectrometry (GC-MS), in Clinical Applications of Mass Spectrometry. Springer. p. 65-74.
11. TANG, L. and J.-b. YING (2012). GC-MS/MS Determination of Barbiturate Drugs in Blood with Accelerated Solvent Extraction [J]. Physical Testing and Chemical Analysis (Part B: Chemical Analysis), 7, 030.
12. El-Gindy, A., S. Emara, and G.M. Hadad (2003). Determination of two ternary mixtures containing phenobarbitone by second derivative of the ratio spectrum-zero-crossing and HPLC methods. Il Farmaco, 58(5), 377-390.
13. Haque, A., X. Xu, and J.T. Stewart (1999). Determination of ephedrine, theophylline and phenobarbital in a tablet dosage form by capillary electrophoresis. Journal of pharmaceutical and biomedical analysis, 21(5), 1063-1067.
14. Lima, J.L., M.C. BSM Montenegro, and A. Da Silva (1990) A phenobarbital ion-selective electrode without an inner reference solution, and its application to pharmaceutical analysis. Journal of pharmaceutical and biomedical analysis, 8(8), 701-704.
G. Ragab et. al.
210 © 2016 by authors, Eurasian J Anal Chem, 11(4), 197-210
15. Ni, Y., C. Liu, and S. Kokot (2000) Simultaneous kinetic spectrophotometric determination of acetaminophen and phenobarbital by artificial neural networks and partial least squares. Analytica chimica acta, 419(2), 185-196.
16. Boeris, M., J. Luco, and R. Olsina (2000) Simultaneous spectrophotometric determination of phenobarbital, phenytoin and methylphenobarbital in pharmaceutical preparations by using partial least-squares and principal component regression multivariate calibration. Journal of pharmaceutical and biomedical analysis, 24(2), 259-271.
17. El-Gindy, A., S. Emara, and H. Shaaban (2007) Development and validation of chemometrics-assisted spectrophotometric and liquid chromatographic methods for the simultaneous determination of two multicomponent mixtures containing bronchodilator drugs. Journal of pharmaceutical and biomedical analysis, 43(3), 973-982.
18. Sved, S., I. McGilveray, and N. Beaudoin (1981) The assay and absorption kinetics of oral theophylline− 7‐acetic acid in the human. Biopharmaceutics & drug disposition, 2(2), 177-184.
19. Rabouan-Guyon, S., P. Courtois, and D. Barthes (1996). Determination of acefylline heptaminol in pharmaceutical preprarations by high performance liquid chromatography. Il Farmaco, 51(11), 739-746.
20. Owen, J. and K. Nakatsu (1978) Spectrophotometry of theophylline-7-acetic acid and theophylline. Clinical chemistry, 24(2), 367-368.
21. Tsvetkova, B., J. Tencheva, and P. Peikov (2003) Alkaline, Enzymatic Hydrolysis and Physicochemical Properties of 7-Theophyllineacetic Acid Derivatives. Journal of Food and Drug Analysis, 11(3), 191-194.
22. Levi, L. (1957) The Barbituric-Acids, Their Chemical-Structure, Synthesis And Nomenclature. Bulletin on Narcotics, 9(1), 30-40.
23. ICH, Validation of analytical procedures , Text and Methodology. 2005, Geneva: International conference on harmonization.
24. Miller, J.N. and J.C. Miller, (2005). Statistics and chemometrics for analytical chemistry. Pearson Education.
25. Guidance, R., (1994). Validation of chromatographic methods. Center for Drug Evaluation and Research, Food and Drug Administration. 669, 671.