Embed Size (px)
Citation preview
Lattice-Based Model of Ductal Carcinoma In SituSuggests Rules for Breast Cancer Progression to anInvasive StateEline Boghaert1, Derek C. Radisky2, Celeste M. Nelson1,3*
1 Department of Chemical and Biological Engineering, Princeton University, Princeton, New Jersey, United States of America, 2 Department of Cancer Biology, Mayo Clinic,
Jacksonville, Florida, United States of America, 3 Department of Molecular Biology, Princeton University, Princeton, New Jersey, United States of America
Abstract
Ductal carcinoma in situ (DCIS) is a heterogeneous group of non-invasive lesions of the breast that result from abnormalproliferation of mammary epithelial cells. Pathologists characterize DCIS by four tissue morphologies (micropapillary,cribriform, solid, and comedo), but the underlying mechanisms that distinguish the development and progression of thesemorphologies are not well understood. Here we explored the conditions leading to the emergence of the differentmorphologies of DCIS using a two-dimensional multi-cell lattice-based model that incorporates cell proliferation, apoptosis,necrosis, adhesion, and contractility. We found that the relative rates of cell proliferation and apoptosis governed which ofthe four morphologies emerged. High proliferation and low apoptosis favored the emergence of solid and comedomorphologies. In contrast, low proliferation and high apoptosis led to the micropapillary morphology, whereas highproliferation and high apoptosis led to the cribriform morphology. The natural progression between morphologies cannotbe investigated in vivo since lesions are usually surgically removed upon detection; however, our model suggests probabletransitions between these morphologies during breast cancer progression. Importantly, cribriform and comedo appear tobe the ultimate morphologies of DCIS. Motivated by previous experimental studies demonstrating that tumor cells behavedifferently depending on where they are located within the mammary duct in vivo or in engineered tissues, we examinedthe effects of tissue geometry on the progression of DCIS. In agreement with our previous experimental work, we foundthat cells are more likely to invade from the end of ducts and that this preferential invasion is regulated by cell adhesion andcontractility. This model provides additional insight into tumor cell behavior and allows the exploration of phenotypictransitions not easily monitored in vivo.
Citation: Boghaert E, Radisky DC, Nelson CM (2014) Lattice-Based Model of Ductal Carcinoma In Situ Suggests Rules for Breast Cancer Progression to an InvasiveState. PLoS Comput Biol 10(12): e1003997. doi:10.1371/journal.pcbi.1003997
Editor: Feilim Mac Gabhann, Johns Hopkins University, United States of America
Received June 5, 2014; Accepted October 20, 2014; Published December 4, 2014
Copyright: � 2014 Boghaert et al. This is an open-access article distributed under the terms of the Creative Commons Attribution License, which permitsunrestricted use, distribution, and reproduction in any medium, provided the original author and source are credited.
Data Availability: The authors confirm that all data underlying the findings are fully available without restriction. All relevant data are within the paper and itsSupporting Information files.
Funding: This work was supported in part by grants from the NIH (GM083997, HL110335, HL118532, HL120142, and CA116201), the David and Lucile PackardFoundation, the Alfred P. Sloan Foundation, and the Camille and Henry Dreyfus Foundation. CMN holds a Career Award at the Scientific Interface from theBurroughs Wellcome Fund. EB was supported in part by a predoctoral fellowship from the New Jersey Commission on Cancer Research. The funders had no rolein study design, data collection and analysis, decision to publish, or preparation of the manuscript.
Competing Interests: The authors have declared that no competing interests exist.
* Email: [email protected]
Introduction
Ductal carcinoma in situ (DCIS)The mammary gland is a highly organized, branched ductal
network of luminal epithelial cells surrounded by myoepithelium
and basement membrane embedded in stroma [1,2]. Reciprocal
signaling between the cells and their surrounding microenviron-
ment maintains the organization and function of the mammary
epithelium. Disruption of these cues and the resulting architecture
leads to ductal carcinoma in situ (DCIS) and invasive ductal
carcinoma (IDC) [1–3]. DCIS is defined as increased proliferation
of ductal epithelial cells in the absence of basement membrane
degradation [4–6]. Whereas DCIS is not life-threatening, some of
these lesions may progress to IDC if left untreated [7,8].
Pathologists classify DCIS by four morphologies: micropapillary,
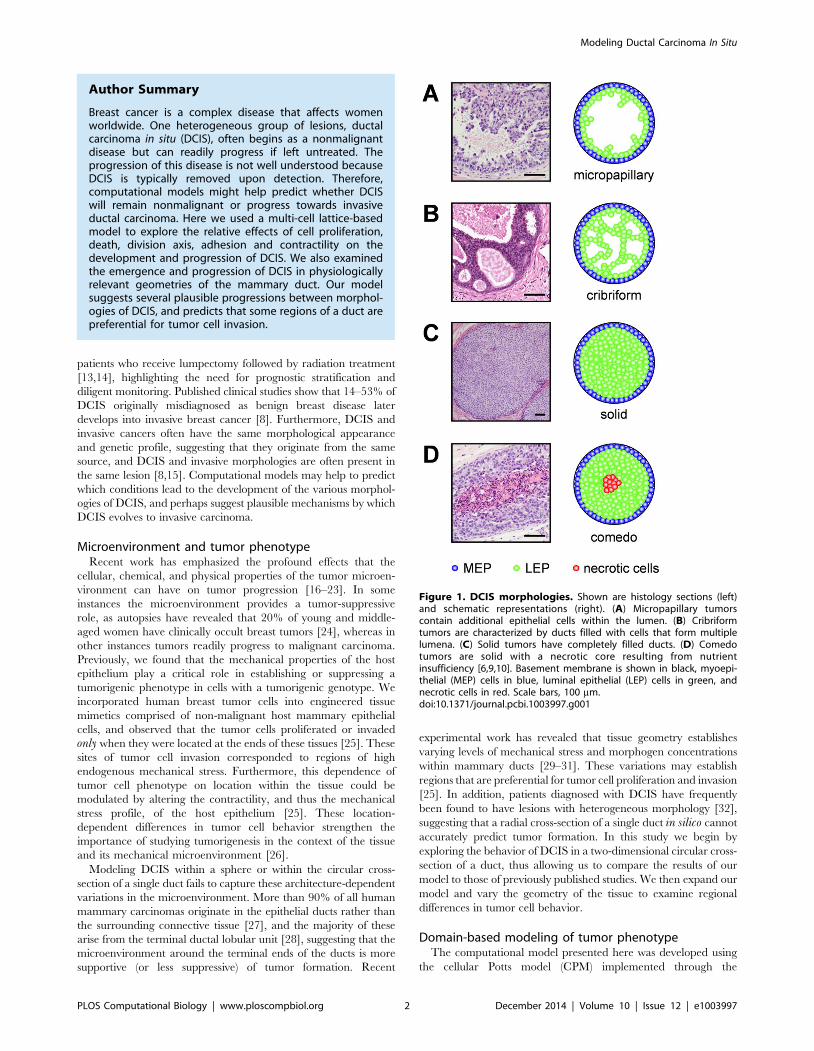
cribriform, solid, and comedo. Micropapillary tumors contain
additional epithelial cells within the lumen of the duct (Fig. 1A).
Cribriform tumors are characterized by ducts filled with cells that
form multiple lumena (Fig. 1B). Solid tumors have completely
filled ducts (Fig. 1C). Comedo tumors are solid with a necrotic
core resulting from nutrient insufficiency (Fig. 1D) [6,9,10]. Of
these four morphologies, comedo lesions have the greatest risk for
recurrence after breast-conserving surgery [11]. Due to the
increased use of mammographic screening, the number of
observed incidences of DCIS has increased dramatically, by
500% and 290% between 1983 and 2003 for women over 50 and
under 50, respectively [12]. DCIS currently accounts for ,20% of
all breast cancers diagnosed in the U.S. [8].
It remains unclear how DCIS evolves into invasive breast cancer.
In most cases, DCIS is detected by mammography in an otherwise
asymptomatic patient; the lesions are then removed surgically after
detection and so the natural history of the lesion cannot be
monitored in vivo [5]. Of these lesions, invasive carcinomas develop
more frequently in patients treated with biopsy alone than in
PLOS Computational Biology | www.ploscompbiol.org 1 December 2014 | Volume 10 | Issue 12 | e1003997
patients who receive lumpectomy followed by radiation treatment
[13,14], highlighting the need for prognostic stratification and
diligent monitoring. Published clinical studies show that 14–53% of
DCIS originally misdiagnosed as benign breast disease later
develops into invasive breast cancer [8]. Furthermore, DCIS and
invasive cancers often have the same morphological appearance
and genetic profile, suggesting that they originate from the same
source, and DCIS and invasive morphologies are often present in
the same lesion [8,15]. Computational models may help to predict
which conditions lead to the development of the various morphol-
ogies of DCIS, and perhaps suggest plausible mechanisms by which
DCIS evolves to invasive carcinoma.
Microenvironment and tumor phenotypeRecent work has emphasized the profound effects that the
cellular, chemical, and physical properties of the tumor microen-
vironment can have on tumor progression [16–23]. In some
instances the microenvironment provides a tumor-suppressive
role, as autopsies have revealed that 20% of young and middle-
aged women have clinically occult breast tumors [24], whereas in
other instances tumors readily progress to malignant carcinoma.
Previously, we found that the mechanical properties of the host
epithelium play a critical role in establishing or suppressing a
tumorigenic phenotype in cells with a tumorigenic genotype. We
incorporated human breast tumor cells into engineered tissue
mimetics comprised of non-malignant host mammary epithelial
cells, and observed that the tumor cells proliferated or invaded
only when they were located at the ends of these tissues [25]. These
sites of tumor cell invasion corresponded to regions of high
endogenous mechanical stress. Furthermore, this dependence of
tumor cell phenotype on location within the tissue could be
modulated by altering the contractility, and thus the mechanical
stress profile, of the host epithelium [25]. These location-
dependent differences in tumor cell behavior strengthen the
importance of studying tumorigenesis in the context of the tissue
and its mechanical microenvironment [26].
Modeling DCIS within a sphere or within the circular cross-
section of a single duct fails to capture these architecture-dependent
variations in the microenvironment. More than 90% of all human
mammary carcinomas originate in the epithelial ducts rather than
the surrounding connective tissue [27], and the majority of these
arise from the terminal ductal lobular unit [28], suggesting that the
microenvironment around the terminal ends of the ducts is more
supportive (or less suppressive) of tumor formation. Recent
experimental work has revealed that tissue geometry establishes
varying levels of mechanical stress and morphogen concentrations
within mammary ducts [29–31]. These variations may establish
regions that are preferential for tumor cell proliferation and invasion
[25]. In addition, patients diagnosed with DCIS have frequently
been found to have lesions with heterogeneous morphology [32],
suggesting that a radial cross-section of a single duct in silico cannot
accurately predict tumor formation. In this study we begin by
exploring the behavior of DCIS in a two-dimensional circular cross-
section of a duct, thus allowing us to compare the results of our
model to those of previously published studies. We then expand our
model and vary the geometry of the tissue to examine regional
differences in tumor cell behavior.
Domain-based modeling of tumor phenotypeThe computational model presented here was developed using
the cellular Potts model (CPM) implemented through the
Figure 1. DCIS morphologies. Shown are histology sections (left)and schematic representations (right). (A) Micropapillary tumorscontain additional epithelial cells within the lumen. (B) Cribriformtumors are characterized by ducts filled with cells that form multiplelumena. (C) Solid tumors have completely filled ducts. (D) Comedotumors are solid with a necrotic core resulting from nutrientinsufficiency [6,9,10]. Basement membrane is shown in black, myoepi-thelial (MEP) cells in blue, luminal epithelial (LEP) cells in green, andnecrotic cells in red. Scale bars, 100 mm.doi:10.1371/journal.pcbi.1003997.g001
Author Summary
Breast cancer is a complex disease that affects womenworldwide. One heterogeneous group of lesions, ductalcarcinoma in situ (DCIS), often begins as a nonmalignantdisease but can readily progress if left untreated. Theprogression of this disease is not well understood becauseDCIS is typically removed upon detection. Therefore,computational models might help predict whether DCISwill remain nonmalignant or progress towards invasiveductal carcinoma. Here we used a multi-cell lattice-basedmodel to explore the relative effects of cell proliferation,death, division axis, adhesion and contractility on thedevelopment and progression of DCIS. We also examinedthe emergence and progression of DCIS in physiologicallyrelevant geometries of the mammary duct. Our modelsuggests several plausible progressions between morphol-ogies of DCIS, and predicts that some regions of a duct arepreferential for tumor cell invasion.
Modeling Ductal Carcinoma In Situ
PLOS Computational Biology | www.ploscompbiol.org 2 December 2014 | Volume 10 | Issue 12 | e1003997
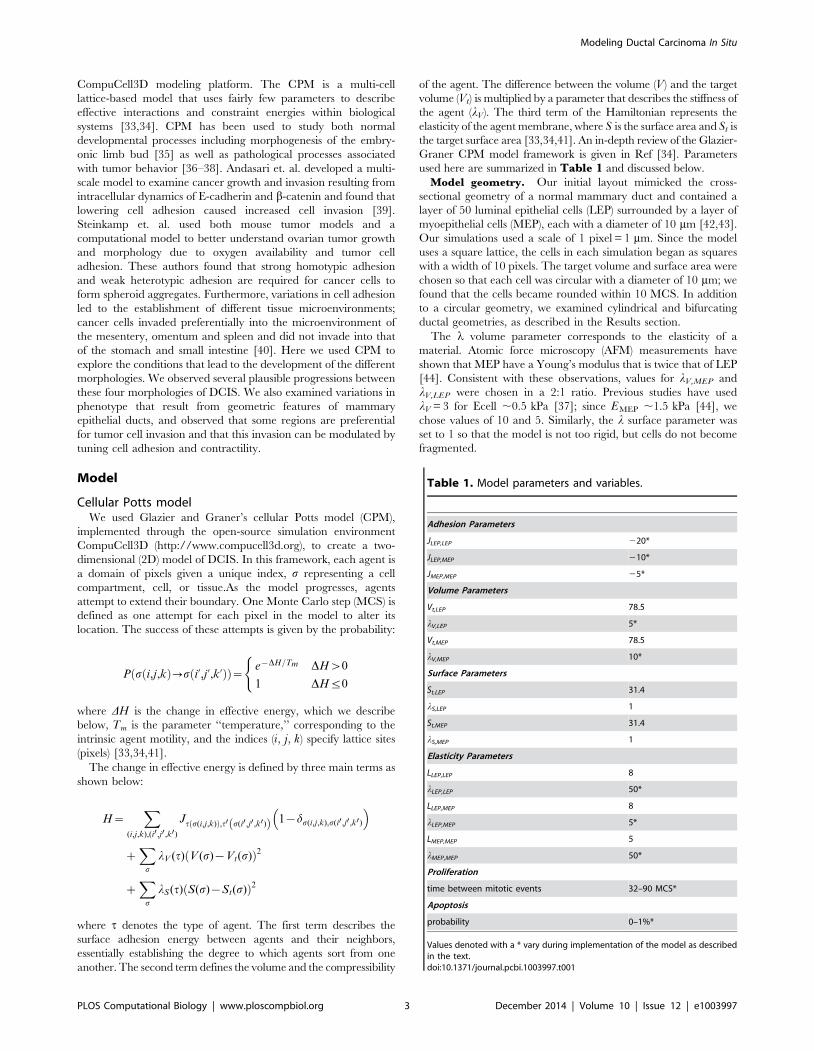
CompuCell3D modeling platform. The CPM is a multi-cell
lattice-based model that uses fairly few parameters to describe
effective interactions and constraint energies within biological
systems [33,34]. CPM has been used to study both normal
developmental processes including morphogenesis of the embry-
onic limb bud [35] as well as pathological processes associated
with tumor behavior [36–38]. Andasari et. al. developed a multi-
scale model to examine cancer growth and invasion resulting from
intracellular dynamics of E-cadherin and b-catenin and found that
lowering cell adhesion caused increased cell invasion [39].
Steinkamp et. al. used both mouse tumor models and a
computational model to better understand ovarian tumor growth
and morphology due to oxygen availability and tumor cell
adhesion. These authors found that strong homotypic adhesion
and weak heterotypic adhesion are required for cancer cells to
form spheroid aggregates. Furthermore, variations in cell adhesion
led to the establishment of different tissue microenvironments;
cancer cells invaded preferentially into the microenvironment of
the mesentery, omentum and spleen and did not invade into that
of the stomach and small intestine [40]. Here we used CPM to
explore the conditions that lead to the development of the different
morphologies. We observed several plausible progressions between
these four morphologies of DCIS. We also examined variations in
phenotype that result from geometric features of mammary
epithelial ducts, and observed that some regions are preferential
for tumor cell invasion and that this invasion can be modulated by
tuning cell adhesion and contractility.
Model
Cellular Potts modelWe used Glazier and Graner’s cellular Potts model (CPM),
implemented through the open-source simulation environment
CompuCell3D (http://www.compucell3d.org), to create a two-
dimensional (2D) model of DCIS. In this framework, each agent is
a domain of pixels given a unique index, s representing a cell
compartment, cell, or tissue.As the model progresses, agents
attempt to extend their boundary. One Monte Carlo step (MCS) is
defined as one attempt for each pixel in the model to alter its
location. The success of these attempts is given by the probability:
P s i,j,kð Þ?s i’,j’,k’ð Þð Þ~ e{DH=Tm DHw0
1 DHƒ0
(
where DH is the change in effective energy, which we describe
below, Tm is the parameter ‘‘temperature,’’ corresponding to the
intrinsic agent motility, and the indices (i, j, k) specify lattice sites
(pixels) [33,34,41].
The change in effective energy is defined by three main terms as
shown below:
H~X
(i,j,k),(i0,j0 ,k0)Jt s(i,j,k)ð Þ,t0 s(i0 ,j0,k0)ð Þ 1{ds(i,j,k),s(i0 ,j0 ,k0)
� �
zX
s
lV (t) V (s){Vt(s)ð Þ2
zX
s
lS(t) S(s){St(s)ð Þ2
where t denotes the type of agent. The first term describes the
surface adhesion energy between agents and their neighbors,
essentially establishing the degree to which agents sort from one
another. The second term defines the volume and the compressibility
of the agent. The difference between the volume (V) and the target
volume (Vt) is multiplied by a parameter that describes the stiffness of
the agent (lV). The third term of the Hamiltonian represents the
elasticity of the agent membrane, where S is the surface area and St is
the target surface area [33,34,41]. An in-depth review of the Glazier-
Graner CPM model framework is given in Ref [34]. Parameters
used here are summarized in Table 1 and discussed below.
Model geometry. Our initial layout mimicked the cross-
sectional geometry of a normal mammary duct and contained a
layer of 50 luminal epithelial cells (LEP) surrounded by a layer of
myoepithelial cells (MEP), each with a diameter of 10 mm [42,43].
Our simulations used a scale of 1 pixel = 1 mm. Since the model
uses a square lattice, the cells in each simulation began as squares
with a width of 10 pixels. The target volume and surface area were
chosen so that each cell was circular with a diameter of 10 mm; we
found that the cells became rounded within 10 MCS. In addition
to a circular geometry, we examined cylindrical and bifurcating
ductal geometries, as described in the Results section.
The l volume parameter corresponds to the elasticity of a
material. Atomic force microscopy (AFM) measurements have
shown that MEP have a Young’s modulus that is twice that of LEP
[44]. Consistent with these observations, values for lV,MEP and
lV,LEP were chosen in a 2:1 ratio. Previous studies have used
lV = 3 for Ecell ,0.5 kPa [37]; since EMEP ,1.5 kPa [44], we
chose values of 10 and 5. Similarly, the l surface parameter was
set to 1 so that the model is not too rigid, but cells do not become
fragmented.
Table 1. Model parameters and variables.
Adhesion Parameters
JLEP,LEP 220*
JLEP,MEP 210*
JMEP,MEP 25*
Volume Parameters
Vt,LEP 78.5
lV,LEP 5*
Vt,MEP 78.5
lV,MEP 10*
Surface Parameters
St,LEP 31.4
lS,LEP 1
St,MEP 31.4
lS,MEP 1
Elasticity Parameters
LLEP,LEP 8
lLEP,LEP 50*
LLEP,MEP 8
lLEP,MEP 5*
LMEP,MEP 5
lMEP,MEP 50*
Proliferation
time between mitotic events 32–90 MCS*
Apoptosis
probability 0–1%*
Values denoted with a * vary during implementation of the model as describedin the text.doi:10.1371/journal.pcbi.1003997.t001
Modeling Ductal Carcinoma In Situ
PLOS Computational Biology | www.ploscompbiol.org 3 December 2014 | Volume 10 | Issue 12 | e1003997
Cell adhesionMechanical links between cells were established through the
adhesion coefficient, which is defined as the adhesion energy per
unit contact area and lowers the effective energy of the system
when bonds form between cells. A hierarchy of surface adhesion
coefficients leads to cell sorting [45]. Experimentally, it has been
shown that the physiological organization of LEP surrounded by a
layer of MEP results from differential expression of E-cadherin
[44]. We modeled strong cellular adhesion using negative values
for the adhesion coefficients and modeled the differential
expression of E-cadherin by setting JLEP,LEP,JMEP,LEP,JMEP,-
MEP. Adhesion coefficients for agent pairs that include culture
medium or necrotic cells were set to zero, since cells that undergo
necrosis continue to occupy space as debris, but no longer bind
with other cells. This is equivalent to placing the cells in a very
deformable stroma, which was not included per se in the current
model.
Additionally, cell attraction and repulsion were modeled using
the focal point plasticity (FPP) plugin, which creates a link between
the centers of mass of neighboring agents. The energy term is
defined as E~P
lij lij{Lij
� �2, where Lij is the target distance
between the agents’ centers of mass, lij is the actual distance, and
lij is equivalent to a spring constant. We established cell polarity
by allowing epithelial cells to form links with only two neighbors
[10]. We set the lij parameter for homotypic cellular interactions
to be 10-fold greater than the lij parameter for heterotypic cellular
interactions [10]. In order to mimic cell contraction, the target
length between cells was set to be less than the resting length. For
the more contractile MEP, we set the target length at 5 pixels
while for LEP we set the target length at 8 pixels. When FPP
parameters are set too high, cells achieve their target length by
becoming fragmented. FPP parameters for agent pairs that include
culture medium or necrotic cells were set to zero.
Cell proliferation. In normal ducts, luminal epithelial cells
are polarized and enter a state of growth arrest [46]. Two
explanations for this phenomenon have been proposed and
validated computationally. In one, normal luminal epithelial cells
lose the ability to proliferate when they form tight junctions with
their neighbors [47,48]. In the other, cells continue to proliferate
but progeny that enter the lumen subsequently undergo apoptosis
[49]. These normal control mechanisms are subverted during
DCIS [5]. Here, one quarter of the luminal epithelial cells were
chosen randomly and set to proliferate at a given time step, with
the axis of cell division perpendicular to the epithelial cell layer
(Fig. 2C). In the Results section we discuss the effect of changing
the orientation of cell division. We varied the frequency of cell
proliferation during the simulation from 10–30 mitotic divisions
during 1000 MCS to examine the effects of proliferation on the
emergence and progression of DCIS. It has been suggested that
cells proliferate more rapidly when located at the outer rim of the
lesion [50,51] which would be expected to alter the pattern of
mechanical stresses within the duct; such proliferation patterns
have not been widely documented and were not modeled here.
Cell deathWe considered two types of cell death, apoptosis and necrosis.
During normal development a luminal epithelial cell undergoes
apoptosis when it experiences mechanical stress from being
overcrowded, and is then extruded from the tissue [52,53]. In
our model, we first checked whether a cell was overcrowded by
counting the number of neighbors that were within 2.5 cell
diameters. If there were 10 cells in this vicinity, the luminal
epithelial cell was specified as overcrowded and apoptosis was
inscribed with a given probability ranging from 0 to 1%. When a
cell underwent apoptosis it was removed from the simulation.
Necrosis results from a lack of nutrient availability. Since DCIS
does not involve angiogenesis into the duct [54,55], the closest
nutrient source would be immediately adjacent to the duct itself.
Here we specified that a cell would undergo necrosis when it was
ten or more cell diameters away from the myoepithelial layer ($
100 mm), a distance roughly equal to the diffusion limit of oxygen.
When a cell became necrotic, it no longer interacted with other
cells and all cell-cell adhesion parameters were set to zero;
however, the necrotic cell continued to occupy space.
Results
Morphology of DCIS depends on the relative rates ofproliferation and apoptosis
We first explored the changes in mammary ductal morphology
that resulted from altering rates of cell proliferation and apoptosis
(Fig. 2). To determine the predominant morphology, we ran each
simulation at least 20 times. If 80% or more of these simulations
led to the same morphology, we classified it as such. Otherwise, we
concluded that the conditions led to a mixed morphology. We
found that the micropapillary morphology emerged under most
conditions, with notable exceptions. In the absence of apoptosis
(Fig. 2A, left column), we observed both the solid and comedo
morphology, depending on the frequency of cell division. For 10
mitotic events, the LEP completely filled the lumen. As the cells
divided they imposed an outward force on the walls of the duct
causing the duct to expand. When there were 15 or more mitotic
events, the contractility of the myoepithelial layer could not
balance this outward force, and we observed gaps in the MEP
layer as well as the presence of a necrotic core. Notably, even
though the LEP breached through the MEP layer, the duct still
maintained a circular cross-sectional morphology; such gaps in the
MEP layer have been observed in histological sections of human
breast tumors diagnosed as DCIS [56,57]. Similarly, when the
probability of apoptosis was set to 0.5% (Fig. 2A, center column),
solid and comedo morphologies were established under conditions
of high proliferation (25 or 30 mitotic events) whereas the
micropapillary morphology emerged under conditions of low
proliferation (20 or fewer mitotic events). When the probability of
apoptosis was increased to 1% (Fig. 2A, right column), micro-
papillary morphologies were established. The cribriform morphol-
ogy was observed in a few simulations; however, it was not the
predominant morphology under any of these conditions. For
example, with 1% probability of apoptosis and 25 mitotic events,
one in twenty simulations resulted in a cribriform morphology
(Fig. 2B). This result was surprising, given that 16–20% of all
cases of DCIS have been described as cribriform in morphology
[58,59]. These data suggest that the morphology of DCIS may
depend on the balance between cell division and apoptosis, which
is supported by collapsing the data into a single ratio of
proliferation to apoptosis (S1 Figure). The lumen fills and
eventually becomes necrotic when this balance is shifted toward
proliferation. The lumen remains patent, albeit abnormal, when
this balance is shifted toward apoptosis. The low incidence of
cribriform morphology observed in these simulations suggests that
additional cellular behaviors are required to generate this
architecture.
Development of multiple lumena depends on celldivision axis
As described above, there are two possible mechanisms by
which cells in a normal duct can undergo growth arrest. In one,
Modeling Ductal Carcinoma In Situ
PLOS Computational Biology | www.ploscompbiol.org 4 December 2014 | Volume 10 | Issue 12 | e1003997
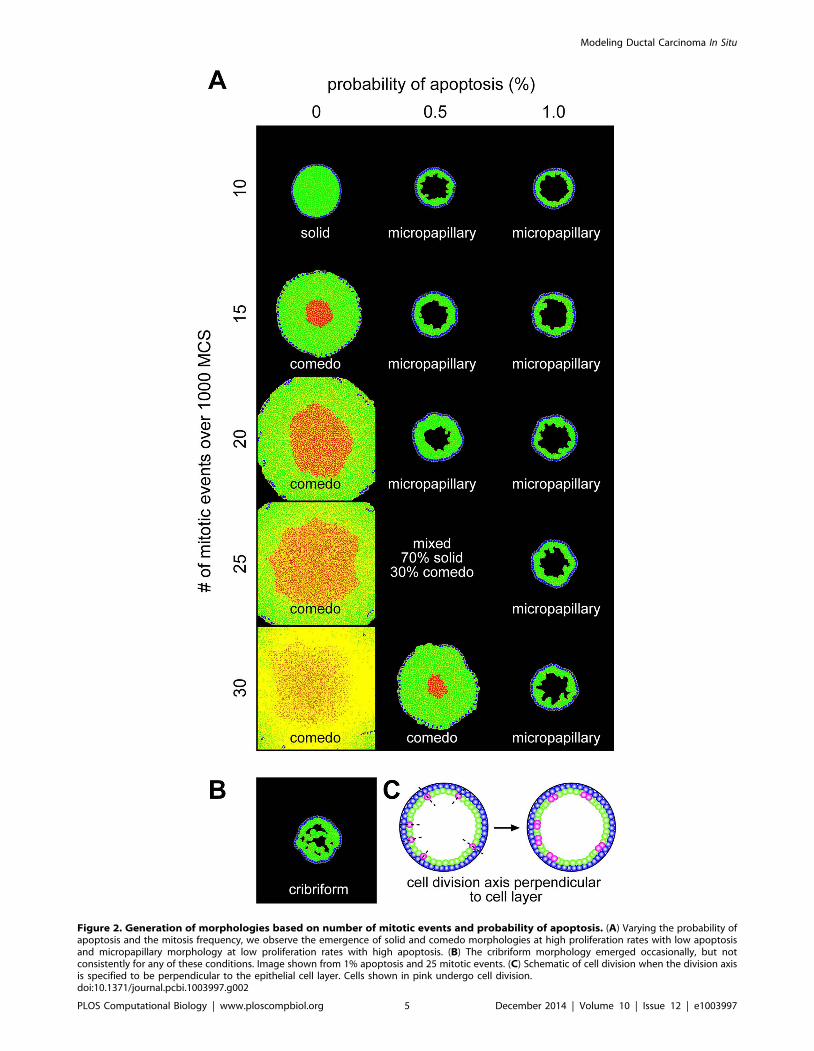
Figure 2. Generation of morphologies based on number of mitotic events and probability of apoptosis. (A) Varying the probability ofapoptosis and the mitosis frequency, we observe the emergence of solid and comedo morphologies at high proliferation rates with low apoptosisand micropapillary morphology at low proliferation rates with high apoptosis. (B) The cribriform morphology emerged occasionally, but notconsistently for any of these conditions. Image shown from 1% apoptosis and 25 mitotic events. (C) Schematic of cell division when the division axisis specified to be perpendicular to the epithelial cell layer. Cells shown in pink undergo cell division.doi:10.1371/journal.pcbi.1003997.g002
Modeling Ductal Carcinoma In Situ
PLOS Computational Biology | www.ploscompbiol.org 5 December 2014 | Volume 10 | Issue 12 | e1003997
normal epithelial cells lose the ability to proliferate when they form
tight junctions with their neighbors [47,48]. In the other, cells
continue to proliferate but any daughter progeny that occupy the
lumen immediately undergo apoptosis [49]. Thus, we next
explored how the axis of cell division affects the morphology of
the simulated duct. In the simulations described above (Fig. 2), we
had specified the axis of cell division to be perpendicular to the
epithelial cell layer (Fig. 2C); next we investigated the effects of
cell divisions that introduced progeny into the lumen which were
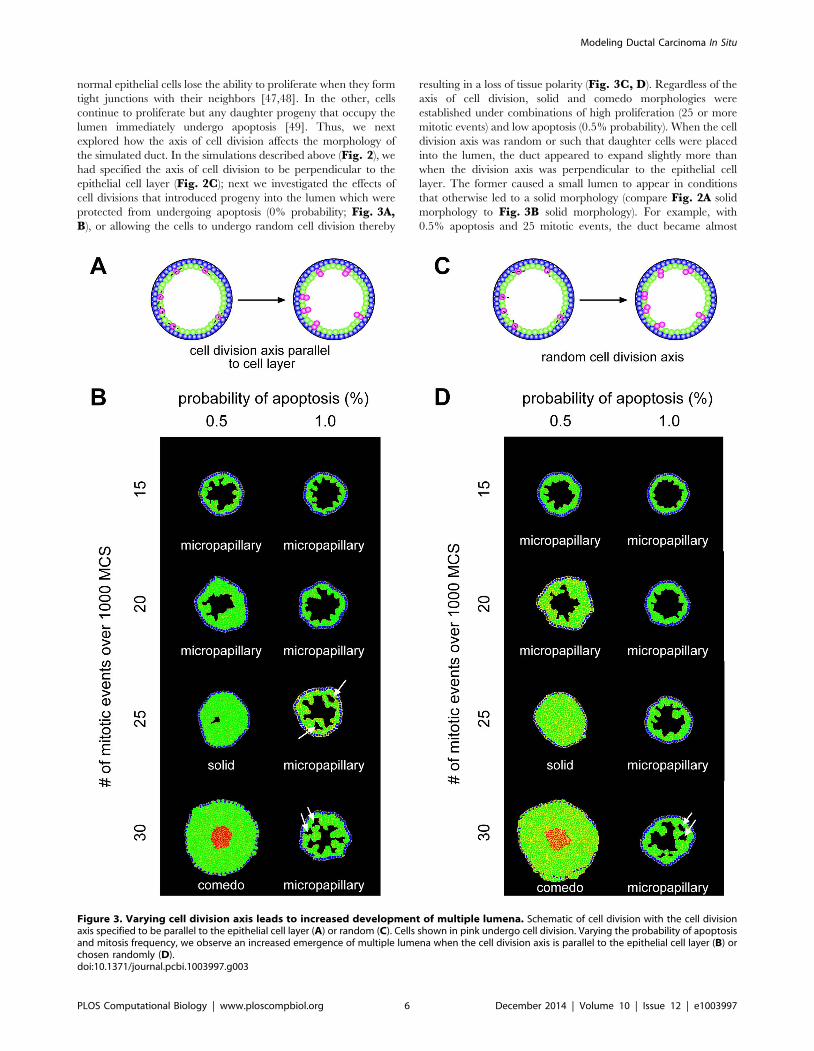
protected from undergoing apoptosis (0% probability; Fig. 3A,B), or allowing the cells to undergo random cell division thereby
resulting in a loss of tissue polarity (Fig. 3C, D). Regardless of the
axis of cell division, solid and comedo morphologies were
established under combinations of high proliferation (25 or more
mitotic events) and low apoptosis (0.5% probability). When the cell
division axis was random or such that daughter cells were placed
into the lumen, the duct appeared to expand slightly more than
when the division axis was perpendicular to the epithelial cell
layer. The former caused a small lumen to appear in conditions
that otherwise led to a solid morphology (compare Fig. 2A solid
morphology to Fig. 3B solid morphology). For example, with
0.5% apoptosis and 25 mitotic events, the duct became almost
Figure 3. Varying cell division axis leads to increased development of multiple lumena. Schematic of cell division with the cell divisionaxis specified to be parallel to the epithelial cell layer (A) or random (C). Cells shown in pink undergo cell division. Varying the probability of apoptosisand mitosis frequency, we observe an increased emergence of multiple lumena when the cell division axis is parallel to the epithelial cell layer (B) orchosen randomly (D).doi:10.1371/journal.pcbi.1003997.g003
Modeling Ductal Carcinoma In Situ
PLOS Computational Biology | www.ploscompbiol.org 6 December 2014 | Volume 10 | Issue 12 | e1003997
completely filled with LEP; however, in half of the simulations a
very small lumen remained.
Although the cribriform morphology did not arise as the
predominant morphology under any of these conditions, we found
many ducts containing small lumena, particularly when the axis of
cell division was parallel to the epithelial layer (see white arrows in
Fig. 3B and 3D). These results are consistent with observations
that cells maintain apicobasal polarity in cribriform lesions [60].
We did not characterize the duct as cribriform unless cells
extended completely across the diameter of the duct (Fig. 2B). As
the number of mitotic events increased, the number of ducts with
cribriform morphology also increased. With 1% apoptosis, the
percentage of cribriform ducts increased from 2% to 6% to 18%
for 20, 25 and 30 mitotic events respectively. This suggests that the
cribriform morphology may occur more readily over a longer time
span with more cell divisions. These data again suggest that the
morphology of DCIS depends on the balance between cell division
and apoptosis.
Progression of DCIS morphologiesWhereas it is difficult to explore the transitions between DCIS
morphologies in intact tumors in vivo, this is readily achieved insilico. Examining intermediate time steps and running simulations
for up to 3000 MCS, we observed multiple transitions between
morphologies. As LEP accumulated in the lumen, the micro-
papillary morphology was the first to emerge. In the absence of
apoptosis, or at low levels of apoptosis (0.5% probability) with high
proliferation, the micropapillary morphology progressed to solid
and ultimately to comedo as the force of proliferating cells caused
the duct to expand outward (Fig. 4A). At higher levels of apoptosis
(1% probability) and high levels of proliferation, the micropapil-
lary morphology progressed to cribriform (Fig. 4B). With low
levels of proliferation, the morphology remained micropapillary
(Fig. 4C, D). Increasing apoptosis from 0.5% probability to 1%
probability did not affect the outcome of these simulations.
Notably, high levels of apoptosis or low levels of apoptosis
balancing low levels of proliferation caused the duct to remain
fairly uniform in size (Fig. 4B–D). Given that the cells continued
to proliferate, we had anticipated that the lumen would fill
completely and the cribriform morphology would ultimately
progress to a solid morphology. Surprisingly, however, the
morphology remained cribriform even after 3000 MCS under
conditions of 1% probability of apoptosis and high proliferation
(Fig. 4B). This suggests that over longer periods of time, comedo
and cribriform may be the ultimate morphological outcomes of
DCIS, with apoptosis being the deciding factor. Importantly, we
found that LEP were able to break through the MEP layer into the
surroundings from any of the four morphologies (Fig. 4E–H). For
our purposes here we refer to this phenotype as invasion; however,
we note that physiological invasion in vivo requires deterioration
of the basement membrane, which is not included in the present
model.
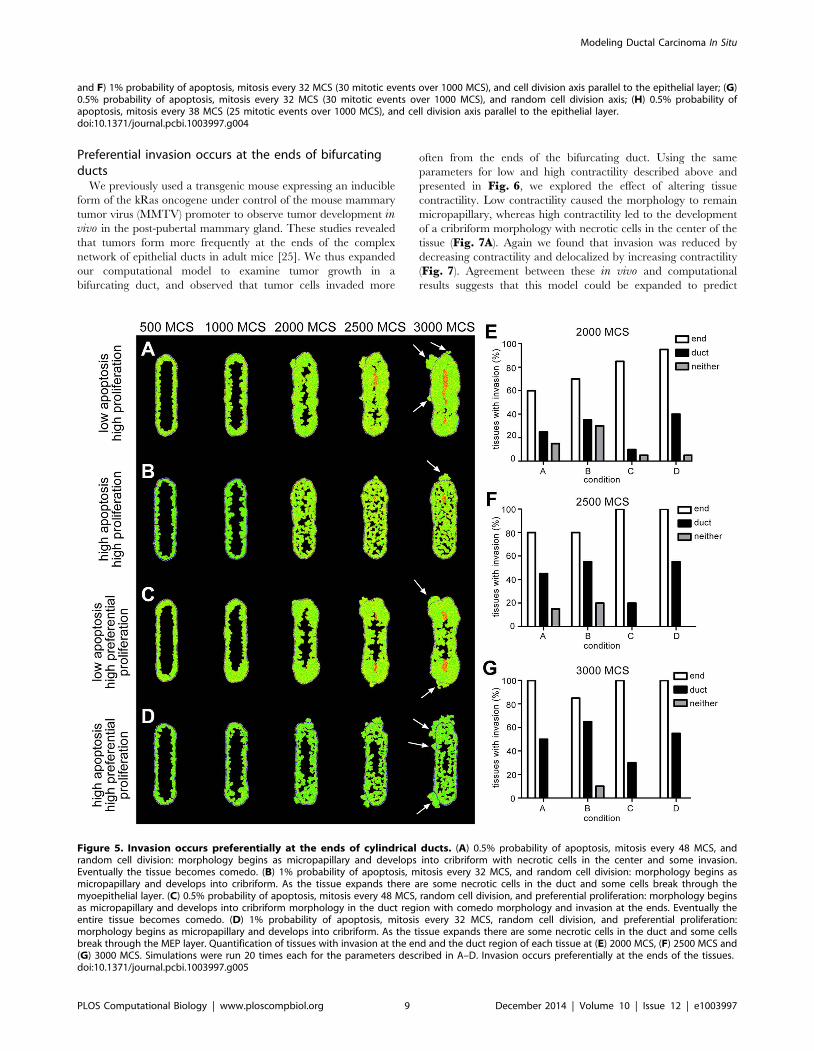
Asymmetric tissue geometry establishes regionspreferential for invasion
Experiments in culture have revealed that asymmetries in tissue
geometry lead to regional differences in endogenous mechanical
stress, which result from the concentration of mechanical stresses
by otherwise isotropically contracting cells in the tissue [29,30].
Furthermore, tumor cells have been observed to proliferate and
invade preferentially from regions of high mechanical stress both
in culture and in vivo [25]. We next explored whether tissue
geometry affected the morphology that emerged by modeling a
cross-section through a cylindrical (ductal) tissue. Throughout the
tissue, the morphology of DCIS that emerged appeared to be fairly
consistent; however, we observed that cells invaded more
frequently from the ends than from the center of the duct
(Fig. 5A, B, E–G). Previously, we found experimentally that
tumor cells proliferate almost twice as frequently when they are
located at the ends of ducts engineered in culture [25]. When we
included this pattern of proliferation in our model, we observed an
increase in the number of tissues in which cells invaded from the
ends (Fig. 5C, D, E–G). We also noticed some differences in
morphology. For example, in the simulations shown in Fig. 5C,
the duct region of the tissue develops into a cribriform morphology
while the end region becomes comedo with invasion. Experimen-
tally, preferential invasion has been attributed to elevated levels of
mechanical stress [25], possibly due to mechanical regulation of
YAP/TAZ [61]. When cells push and pull on each other within a
tissue, varying levels of endogenous mechanical stress will emerge
across the tissue due to asymmetries in the tissue geometry [29,31].
Therefore, we next explored the effect of altering tissue
contractility in this model.
Cell adhesion and tissue contractility control preferentialinvasion
In our model, the ability of cells to adhere to each other is
regulated by the cell adhesion and FPP parameters. In the absence
of proliferation, changing these parameters did not significantly
alter the structure of the tissue (Fig. 6A, B). However, as cells
proliferated and produced an outward force, the roles of these
parameters became more significant. When the value of the cell
adhesion parameter was decreased, the cells no longer adhered to
each other and invasion was observed around the entire periphery
of the tissue (Fig. 6C, E). When the value of the cell adhesion
parameter was increased, the strength of cell adhesion prevented
invasion (Fig. 6D, E). Notably, high adhesion caused the
morphology to remain micropapillary, whereas low adhesion led
to the development of a cribriform morphology (Fig. 6D, E).
In addition to controlling cell adhesion, the FPP parameter also
modulates tissue contractility. In our model, tissue contractility was
approximated by a balance of FPP and lv parameters. The FPP
parameter connects the centers of each cell with a spring, the
target length of which is set to be less than the resting length,
thereby creating an attractive pull between two cells. As the cells
are pulled together, the lv parameter creates an outward push by
imposing a penalty when the cell deviates from its target volume.
When these two forces are balanced, the result is a tissue in a state
of tension (Fig. 6B, center tissue). When we lowered these
parameters, essentially eliminating contractility from our model,
the cells did not invade (Fig. 6F, H). We did observe breaks in the
myoepithelial layer in most tissues; however, since the LEP cells
did not extend past the periphery of the tissue, we did not
characterize these breaks as invasion. Increasing the value of these
parameters caused cells to invade from the entire periphery of the
tissue (Fig. 6G, H). These results are in agreement with our
previously published experimental results, in which we found that
reducing tissue contractility eliminates tumor cell invasion,
whereas increasing contractility permits tumor cells to invade
from the duct region of the tissue [25]. Again there were notable
differences in DCIS morphology. Low contractility caused the
morphology to remain micropapillary, whereas high contractility
led to the development of a cribriform morphology with necrotic
cells in the center of the tissue (Fig. 6F, G). The increased
accumulation of cells in the interior of the tissue is in agreement
with a recent agent-based model that showed that clusters of
tumor cells grow faster as the lv parameter is increased [62].
Modeling Ductal Carcinoma In Situ
PLOS Computational Biology | www.ploscompbiol.org 7 December 2014 | Volume 10 | Issue 12 | e1003997
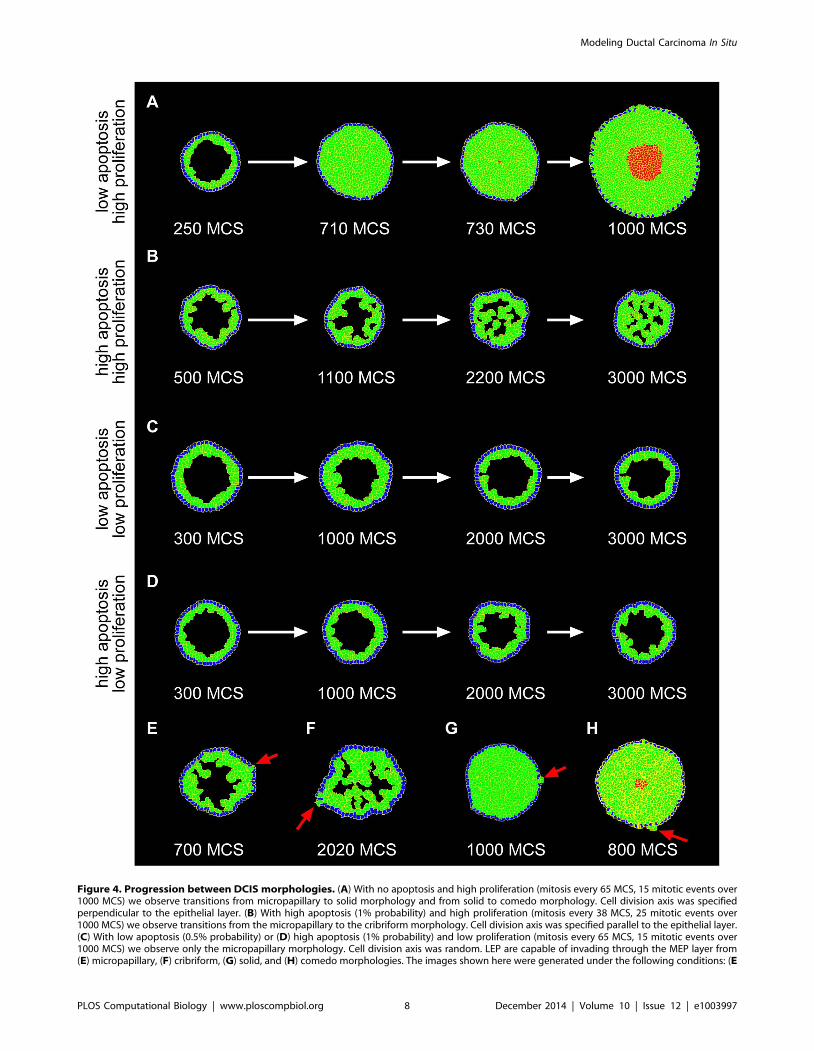
Figure 4. Progression between DCIS morphologies. (A) With no apoptosis and high proliferation (mitosis every 65 MCS, 15 mitotic events over1000 MCS) we observe transitions from micropapillary to solid morphology and from solid to comedo morphology. Cell division axis was specifiedperpendicular to the epithelial layer. (B) With high apoptosis (1% probability) and high proliferation (mitosis every 38 MCS, 25 mitotic events over1000 MCS) we observe transitions from the micropapillary to the cribriform morphology. Cell division axis was specified parallel to the epithelial layer.(C) With low apoptosis (0.5% probability) or (D) high apoptosis (1% probability) and low proliferation (mitosis every 65 MCS, 15 mitotic events over1000 MCS) we observe only the micropapillary morphology. Cell division axis was random. LEP are capable of invading through the MEP layer from(E) micropapillary, (F) cribriform, (G) solid, and (H) comedo morphologies. The images shown here were generated under the following conditions: (E
Modeling Ductal Carcinoma In Situ
PLOS Computational Biology | www.ploscompbiol.org 8 December 2014 | Volume 10 | Issue 12 | e1003997
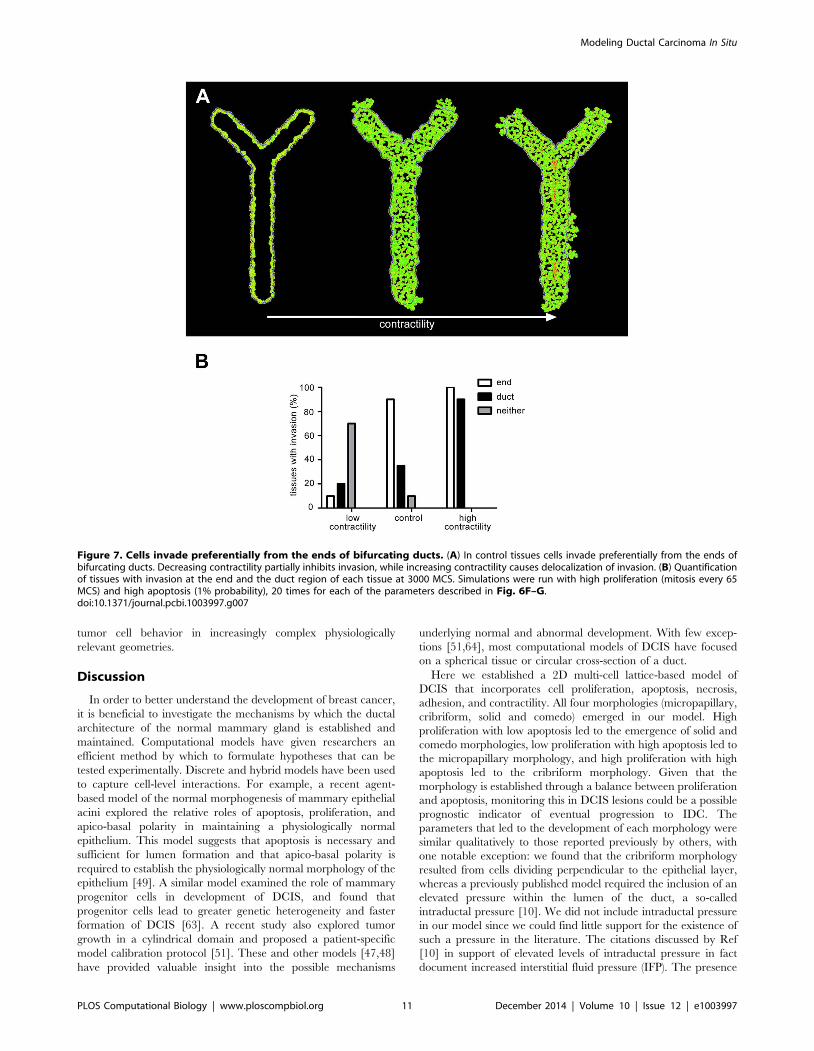
Preferential invasion occurs at the ends of bifurcatingducts
We previously used a transgenic mouse expressing an inducible
form of the kRas oncogene under control of the mouse mammary
tumor virus (MMTV) promoter to observe tumor development invivo in the post-pubertal mammary gland. These studies revealed
that tumors form more frequently at the ends of the complex
network of epithelial ducts in adult mice [25]. We thus expanded
our computational model to examine tumor growth in a
bifurcating duct, and observed that tumor cells invaded more
often from the ends of the bifurcating duct. Using the same
parameters for low and high contractility described above and
presented in Fig. 6, we explored the effect of altering tissue
contractility. Low contractility caused the morphology to remain
micropapillary, whereas high contractility led to the development
of a cribriform morphology with necrotic cells in the center of the
tissue (Fig. 7A). Again we found that invasion was reduced by
decreasing contractility and delocalized by increasing contractility
(Fig. 7). Agreement between these in vivo and computational
results suggests that this model could be expanded to predict
and F) 1% probability of apoptosis, mitosis every 32 MCS (30 mitotic events over 1000 MCS), and cell division axis parallel to the epithelial layer; (G)0.5% probability of apoptosis, mitosis every 32 MCS (30 mitotic events over 1000 MCS), and random cell division axis; (H) 0.5% probability ofapoptosis, mitosis every 38 MCS (25 mitotic events over 1000 MCS), and cell division axis parallel to the epithelial layer.doi:10.1371/journal.pcbi.1003997.g004
Figure 5. Invasion occurs preferentially at the ends of cylindrical ducts. (A) 0.5% probability of apoptosis, mitosis every 48 MCS, andrandom cell division: morphology begins as micropapillary and develops into cribriform with necrotic cells in the center and some invasion.Eventually the tissue becomes comedo. (B) 1% probability of apoptosis, mitosis every 32 MCS, and random cell division: morphology begins asmicropapillary and develops into cribriform. As the tissue expands there are some necrotic cells in the duct and some cells break through themyoepithelial layer. (C) 0.5% probability of apoptosis, mitosis every 48 MCS, random cell division, and preferential proliferation: morphology beginsas micropapillary and develops into cribriform morphology in the duct region with comedo morphology and invasion at the ends. Eventually theentire tissue becomes comedo. (D) 1% probability of apoptosis, mitosis every 32 MCS, random cell division, and preferential proliferation:morphology begins as micropapillary and develops into cribriform. As the tissue expands there are some necrotic cells in the duct and some cellsbreak through the MEP layer. Quantification of tissues with invasion at the end and the duct region of each tissue at (E) 2000 MCS, (F) 2500 MCS and(G) 3000 MCS. Simulations were run 20 times each for the parameters described in A–D. Invasion occurs preferentially at the ends of the tissues.doi:10.1371/journal.pcbi.1003997.g005
Modeling Ductal Carcinoma In Situ
PLOS Computational Biology | www.ploscompbiol.org 9 December 2014 | Volume 10 | Issue 12 | e1003997
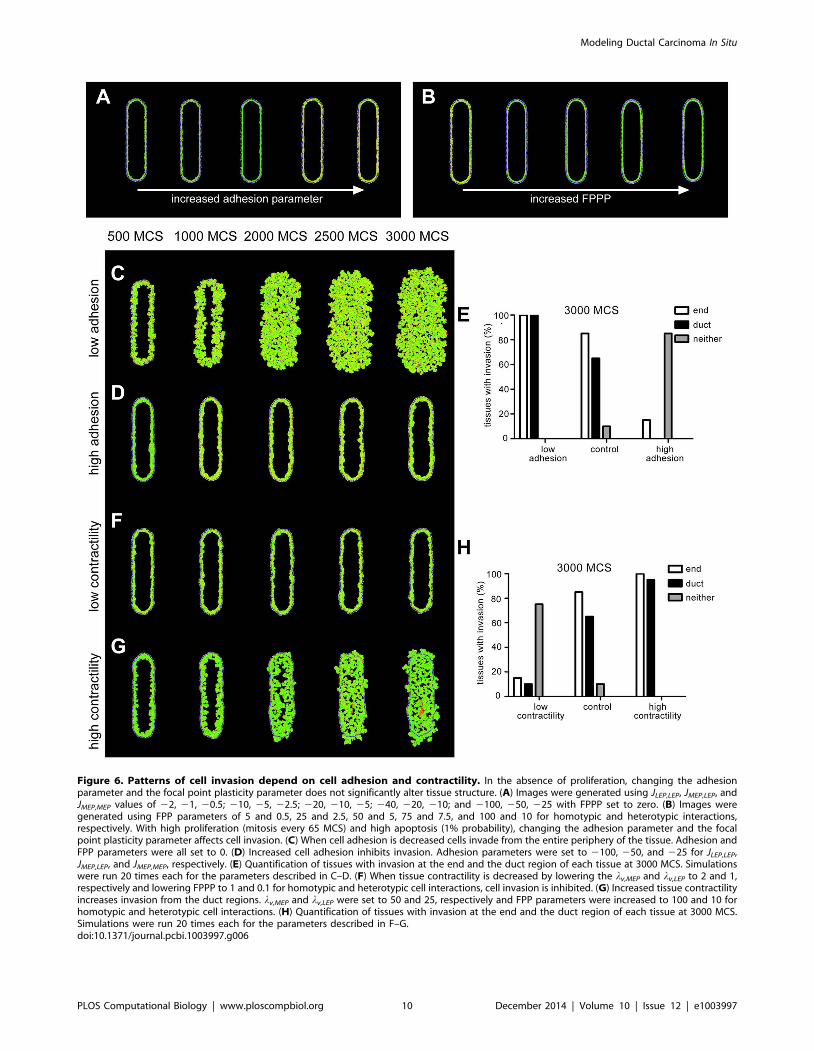
Figure 6. Patterns of cell invasion depend on cell adhesion and contractility. In the absence of proliferation, changing the adhesionparameter and the focal point plasticity parameter does not significantly alter tissue structure. (A) Images were generated using JLEP,LEP, JMEP,LEP, andJMEP,MEP values of 22, 21, 20.5; 210, 25, 22.5; 220, 210, 25; 240, 220, 210; and 2100, 250, 225 with FPPP set to zero. (B) Images weregenerated using FPP parameters of 5 and 0.5, 25 and 2.5, 50 and 5, 75 and 7.5, and 100 and 10 for homotypic and heterotypic interactions,respectively. With high proliferation (mitosis every 65 MCS) and high apoptosis (1% probability), changing the adhesion parameter and the focalpoint plasticity parameter affects cell invasion. (C) When cell adhesion is decreased cells invade from the entire periphery of the tissue. Adhesion andFPP parameters were all set to 0. (D) Increased cell adhesion inhibits invasion. Adhesion parameters were set to 2100, 250, and 225 for JLEP,LEP,JMEP,LEP, and JMEP,MEP, respectively. (E) Quantification of tissues with invasion at the end and the duct region of each tissue at 3000 MCS. Simulationswere run 20 times each for the parameters described in C–D. (F) When tissue contractility is decreased by lowering the lv,MEP and lv,LEP to 2 and 1,respectively and lowering FPPP to 1 and 0.1 for homotypic and heterotypic cell interactions, cell invasion is inhibited. (G) Increased tissue contractilityincreases invasion from the duct regions. lv,MEP and lv,LEP were set to 50 and 25, respectively and FPP parameters were increased to 100 and 10 forhomotypic and heterotypic cell interactions. (H) Quantification of tissues with invasion at the end and the duct region of each tissue at 3000 MCS.Simulations were run 20 times each for the parameters described in F–G.doi:10.1371/journal.pcbi.1003997.g006
Modeling Ductal Carcinoma In Situ
PLOS Computational Biology | www.ploscompbiol.org 10 December 2014 | Volume 10 | Issue 12 | e1003997
tumor cell behavior in increasingly complex physiologically
relevant geometries.
Discussion
In order to better understand the development of breast cancer,
it is beneficial to investigate the mechanisms by which the ductal
architecture of the normal mammary gland is established and
maintained. Computational models have given researchers an
efficient method by which to formulate hypotheses that can be
tested experimentally. Discrete and hybrid models have been used
to capture cell-level interactions. For example, a recent agent-
based model of the normal morphogenesis of mammary epithelial
acini explored the relative roles of apoptosis, proliferation, and
apico-basal polarity in maintaining a physiologically normal
epithelium. This model suggests that apoptosis is necessary and
sufficient for lumen formation and that apico-basal polarity is
required to establish the physiologically normal morphology of the
epithelium [49]. A similar model examined the role of mammary
progenitor cells in development of DCIS, and found that
progenitor cells lead to greater genetic heterogeneity and faster
formation of DCIS [63]. A recent study also explored tumor
growth in a cylindrical domain and proposed a patient-specific
model calibration protocol [51]. These and other models [47,48]
have provided valuable insight into the possible mechanisms
underlying normal and abnormal development. With few excep-
tions [51,64], most computational models of DCIS have focused
on a spherical tissue or circular cross-section of a duct.
Here we established a 2D multi-cell lattice-based model of
DCIS that incorporates cell proliferation, apoptosis, necrosis,
adhesion, and contractility. All four morphologies (micropapillary,
cribriform, solid and comedo) emerged in our model. High
proliferation with low apoptosis led to the emergence of solid and
comedo morphologies, low proliferation with high apoptosis led to
the micropapillary morphology, and high proliferation with high
apoptosis led to the cribriform morphology. Given that the
morphology is established through a balance between proliferation
and apoptosis, monitoring this in DCIS lesions could be a possible
prognostic indicator of eventual progression to IDC. The
parameters that led to the development of each morphology were
similar qualitatively to those reported previously by others, with
one notable exception: we found that the cribriform morphology
resulted from cells dividing perpendicular to the epithelial layer,
whereas a previously published model required the inclusion of an
elevated pressure within the lumen of the duct, a so-called
intraductal pressure [10]. We did not include intraductal pressure
in our model since we could find little support for the existence of
such a pressure in the literature. The citations discussed by Ref
[10] in support of elevated levels of intraductal pressure in fact
document increased interstitial fluid pressure (IFP). The presence
Figure 7. Cells invade preferentially from the ends of bifurcating ducts. (A) In control tissues cells invade preferentially from the ends ofbifurcating ducts. Decreasing contractility partially inhibits invasion, while increasing contractility causes delocalization of invasion. (B) Quantificationof tissues with invasion at the end and the duct region of each tissue at 3000 MCS. Simulations were run with high proliferation (mitosis every 65MCS) and high apoptosis (1% probability), 20 times for each of the parameters described in Fig. 6F–G.doi:10.1371/journal.pcbi.1003997.g007
Modeling Ductal Carcinoma In Situ
PLOS Computational Biology | www.ploscompbiol.org 11 December 2014 | Volume 10 | Issue 12 | e1003997
of an IFP would impose forces directing inward on the epithelial
duct, and not a force from the lumen that pushes outward as
proposed by Ref [10]. In addition to suggesting regimes of
parameters that lead to the four morphologies of DCIS, our model
suggests probable transitions between these morphologies during
breast cancer progression. Our model is unique in that, unlike
most computational models of DCIS which examine cells
arranged in a circular or spherical geometry, we also explored
cell behavior in more physiologically relevant cylindrical and
bifurcating duct geometries.
The results of our model are consistent with immunohisto-
chemical studies that show high proliferation in comedo and solid
morphologies compared to micropapillary and cribriform mor-
phologies [58,60,65,66]. As an example, Albonico et al found that
65% of cells in comedo lesions were positive for the proliferation
marker Ki67, whereas only 3% of cells in cribriform lesions were
Ki67-positive. Furthermore, we found that when proliferation was
balanced by apoptosis, these lesions did not advance over time and
remained either micropapillary or cribriform. Consistently, 100% of
cells in cribriform lesions were found to express the apoptosis
regulator Bcl-2, whereas this was reduced to 36% of cells in comedo
lesions [65]. Our results are also consistent with clinical data
showing that less than 50% of low-grade DCIS (lesions with a low
proliferation rate) develop into invasive breast cancer over 25–30
years [67]. Similar to a recent computational study, we observed
that increases in cell proliferation lead to the development of
aberrant phenotypes and that disrupting proper cell division
alignment can cause multiple lumena to form [68]. These results
are congruent with those of a recent computational model that
found that the ratio of tumor cell proliferation to apoptosis was a
strong predictor of tumor volume [50], although this parameter
does not correlate with histological grade. In the cylindrical and
bifurcating duct geometries, the patterns that emerge in our model
are consistent with our previously reported experimental results that
show increased invasion from regions of high mechanical stress,
more specifically from the ends of these tissues. The ability of cells to
invade can be modulated by altering cell adhesion or contractility.
Experimentally we have observed increased proliferation at the ends
of these tissues. Interestingly our model showed increased invasion
from the ends of tissues with and without preferential proliferation.
This suggests that enhanced proliferation at the ends is not the cause
of the invasion in these regions; experimental testing of this
hypothesis would require the ability to spatially modulate cell
proliferation, which is not yet possible. Importantly, we also
observed that more than one morphology emerged simultaneously
in these asymmetric tissue geometries, but not in the circular tissues.
Different morphologies of DCIS have been frequently observed in
histological sections of individual lesions [32], suggesting that future
computational models of the mammary duct should incorporate
more complex tissue geometries.
In order to accurately model the transition to invasive breast
cancer in future simulations, it will be necessary to include loss of
basement membrane integrity as a parameter. Furthermore, it
would be beneficial to include extracellular matrix (ECM) regions
to more rigorously incorporate cell-ECM interactions and explore
the effect of heterogeneity in the ECM microenvironment on
tumor cell invasion; early models that treat the ECM as a
continuum have suggested an important role for crosstalk between
the tumor cell and its surrounding stroma in tumor development
[69], consistent with experimental results from mouse models of
breast cancer [70,71]. Here we assumed that cells become necrotic
when they are 10 cell diameters away from the MEP layer. While
this is a good average approximation based on clinical observa-
tions, it is important to note that cells do not always become
necrotic at a given distance. Cells become hypoxic due to
limitations in oxygen diffusion; however, ducts with diameters
up to 500 mm have been observed without a necrotic core [42].
Furthermore, necrotic regions of tumors are heterogeneous and
although apoptosis and necrosis are considered to be distinct
modes of cell death, recent studies have suggested that they may lie
on a continuum [72].
We focused on the morphology or architectural pattern of
DCIS, which is characterized in the clinic using histology. It is
important to note, however, that histological characterization
(micropapillary, cribriform, solid, comedo) is not as accurate of a
prognostic indicator of disease progression as classification systems
that also take into account nuclear morphology or mitotic index
(for example, the Nottingham [73] or Van Nuys [74] prognostic
index). Ultimately, it would be beneficial to develop a multi-scale
model of breast cancer that includes both cellular and subcellular
features and behaviors. The mechanism by which cells and the
ECM transmit mechanical cues and establish the mechanical
profile of a tissue is incredibly complex [75]. To capture this
complexity an ideal model would link lattice-based cellular
behaviors with continuum biomechanical models and the subcel-
lular machinery of the cytoskeleton to provide valuable insight into
both normal and aberrant tissue behavior. Combining such
computational models with recently developed engineered tumor
models [76] may permit the successful integration of theoretical
predictions with experimental validation. Our findings that tissue
geometry-related mechanical stress plays a major role in the
phenotypic evolution of DCIS point to the need to incorporate
tissue structure information into individualized risk assessments,
which could be accomplished with advances in high-resolution X-
ray tomographic imaging.
Supporting Information
S1 Figure One-dimensional parameter of ratio ofproliferation to apoptosis governs finally morphology.(A) Varying the ratio of mitosis frequency divided by probability of
apoptosis, we observe the emergence of solid and comedo
morphologies at the highest ratio, and micropapillary morphology
at the lowest ratio. (B) A similar trend is observed when cells can
divide parallel to the outer layer of the duct or with a random
orientation.
(TIF)
Acknowledgments
We thank members of the Biocomplexity Institute at Indiana University for
providing valuable training and technical support in the use of
CompuCell3D.
Author Contributions
Conceived and designed the experiments: EB CMN. Performed the
experiments: EB DCR. Analyzed the data: EB CMN. Wrote the paper: EB
CMN DCR.
References
1. Nelson CM, Bissell MJ (2005) Modeling dynamic reciprocity: Engineering three-
dimensional culture models of breast architecture, function, and neoplastic
transformation. Semin Cancer Biol 15: 342–352.
2. Nelson CM, Bissell MJ (2006) Of extracellular matrix, scaffolds, and signaling:
Tissue architecture regulates development, homeostasis, and cancer. Annu Rev
Cell Dev Biol 22: 287–309.
Modeling Ductal Carcinoma In Situ
PLOS Computational Biology | www.ploscompbiol.org 12 December 2014 | Volume 10 | Issue 12 | e1003997
3. Debnath J, Brugge JS (2005) Modelling glandular epithelial cancers in three-
dimensional cultures. Nat Rev Cancer 5: 675–688.
4. Tavassoli FA (1998) Ductal carcinoma in situ: introduction of the concept of
ductal intraepithelial neoplasia. Mod Pathol 11: 140–154.
5. Burstein HJ, Polyak K, Wong JS, Lester SC, Kaelin CM (2004) Ductal
carcinoma in situ of the breast. N Engl J Med 350: 1430–1441.
6. Silverstein MJ (2000) Ductal carcinoma in situ of the breast. Annu Rev Med 51:
17–32.
7. Sanders ME, Schuyler PA, Dupont WD, Page DL (2005) The natural history of
low-grade ductal carcinoma in situ of the breast in women treated by biopsy only
revealed over 30 years of long-term follow-up. Cancer 103: 2481–2484.
8. Erbas B, Provenzano E, Armes J, Gertig D (2006) The natural history of ductal
carcinoma in situ of the breast: a review. Breast Cancer Res Treat 97: 135–144.
9. Jaffer S, Bleiweiss IJ (2002) Histologic classification of ductal carcinoma in situ.
Microsc Res Tech 59: 92–101.
10. Norton KA, Wininger M, Bhanot G, Ganesan S, Barnard N, et al. (2010) A 2D
mechanistic model of breast ductal carcinoma in situ (DCIS) morphology and
progression. J Theor Biol 263: 393–406.
11. Kerlikowske K, Molinaro A, Cha I, Ljung BM, Ernster VL, et al. (2003)
Characteristics associated with recurrence among women with ductal carcinoma
in situ treated by lumpectomy. J Natl Cancer Inst 95: 1692–1702.
12. Kerlikowske K (2010) Epidemiology of ductal carcinoma in situ. J Natl Cancer
Inst Monogr 2010: 139–141.
13. Page DL, Dupont WD, Rogers LW, Jensen RA, Schuyler PA (1995) Continued
local recurrence of carcinoma 15–25 years after a diagnosis of low grade ductal
carcinoma in situ of the breast treated only by biopsy. Cancer 76: 1197–1200.
14. Fisher B, Dignam J, Wolmark N, Mamounas E, Costantino J, et al. (1998)
Lumpectomy and radiation therapy for the treatment of intraductal breast
cancer: findings from National Surgical Adjuvant Breast and Bowel Project B-
17. J Clin Oncol 16: 441–452.
15. Kricker A, Goumas C, Armstrong B (2004) Ductal carcinoma in situ of the
breast, a population-based study of epidemiology and pathology. Br J Cancer
90: 1382–1385.
16. Camps JL, Chang SM, Hsu TC, Freeman MR, Hong SJ, et al. (1990)
Fibroblast-mediated acceleration of human epithelial tumor growth in vivo. Proc
Natl Acad Sci U S A 87: 75–79.
17. Levental KR, Yu H, Kass L, Lakins JN, Egeblad M, et al. (2009) Matrix
crosslinking forces tumor progression by enhancing integrin signaling. Cell 139:
891–906.
18. Paszek MJ, Zahir N, Johnson KR, Lakins JN, Rozenberg GI, et al. (2005)
Tensional homeostasis and the malignant phenotype. Cancer Cell 8: 241–254.
19. Provenzano PP, Eliceiri KW, Campbell JM, Inman DR, White JG, et al. (2006)
Collagen reorganization at the tumor-stromal interface facilitates local invasion.
BMC Med 4: 38.
20. Radisky DC, Przybylo JA (2008) Matrix metalloproteinase-induced fibrosis and
malignancy in breast and lung. P Am Thorac Soc 5: 316–322.
21. Samuel MS, Lopez JI, McGhee EJ, Croft DR, Strachan D, et al. (2011)
Actomyosin-mediated cellular tension drives increased tissue stiffness and beta-
catenin activation to induce epidermal hyperplasia and tumor growth. Cancer
Cell 19: 776–791.
22. Weaver VM, Petersen OW, Wang F, Larabell CA, Briand P, et al. (1997)
Reversion of the malignant phenotype of human breast cells in three-
dimensional culture and in vivo by integrin blocking antibodies. J Cell Biol
137: 231–245.
23. Nelson CM, Khauv D, Bissell MJ, Radisky DC (2008) Change in cell shape is
required for matrix metalloproteinase-induced epithelial-mesenchymal transition
of mammary epithelial cells. J Cell Biochem 105: 25–33.
24. Nielsen M, Thomsen JL, Primdahl S, Dyreborg U, Andersen JA (1987) Breast
cancer and atypia among young and middle-aged women: A study of 110
medicolegal autopsies. Br J Cancer 56: 814–819.
25. Boghaert E, Gleghorn JP, Lee K, Gjorevski N, Radisky DC, et al. (2012) Host
epithelial geometry regulates breast cancer cell invasiveness. Proc Natl Acad
Sci U S A 109: 19632–19637.
26. Soto AM, Sonnenschein C (2011) The tissue organization field theory of cancer:
A testable replacement for the somatic mutation theory. BioEssays 33: 332–340.
27. Silberstein GB (2001) Tumour-stromal interactions: Role of the stroma in
mammary development. Breast Cancer Res 3: 218–223.
28. Simpson PT, Reis-Filho JS, Gale T, Lakhani SR (2005) Molecular evolution of
breast cancer. J Pathol 205: 248–254.
29. Gjorevski N, Nelson CM (2010) Endogenous patterns of mechanical stress are
required for branching morphogenesis. Integr Biol 2: 424–434.
30. Nelson CM, Vanduijn MM, Inman JL, Fletcher DA, Bissell MJ (2006) Tissue
geometry determines sites of mammary branching morphogenesis in organo-
typic cultures. Science 314: 298–300.
31. Gjorevski N, Nelson CM (2012) Mapping of mechanical strains and stresses
around quiescent engineered three-dimensional epithelial tissues. Biophys J 103:
152–162.
32. Lennington WJ, Jensen RA, Dalton LW, Page DL (1994) Ductal carcinoma in
situ of the breast. Heterogeneity of individual lesions. Cancer 73: 118–124.
33. Swat MH, Hester SD, Balter AI, Heiland RW, Zaitlen BL, et al. (2009) Multicell
simulations of development and disease using the CompuCell3D simulation
environment. Methods Mol Biol 500: 361–428.
34. Swat MH, Thomas GL, Belmonte JM, Shirinifard A, Hmeljak D, et al. (2012)
Multi-scale modeling of tissues using CompuCell3D. Methods Cell Biol 110:325–366.
35. Poplawski NJ, Swat M, Gens JS, Glazier JA (2007) Adhesion between cells,
diffusion of growth factors, and elasticity of the AER produce the paddle shapeof the chick limb. Physica A 373: 521–532.
36. Poplawski NJ, Agero U, Gens JS, Swat M, Glazier JA, et al. (2009) Front
instabilities and invasiveness of simulated avascular tumors. Bull Math Biol 71:
1189–1227.
37. Giverso C, Scianna M, Preziosi L, Buono N, Funaro A (2010) Individual cell-based model for in vitro mesothelial invasion of ovarian cancer. Math Model
Nat Phenom 5: 203–223.
38. Shirinifard A, Gens JS, Zaitlen BL, Poplawski NJ, Swat M, et al. (2009) 3Dmulti-cell simulation of tumor growth and angiogenesis. PLoS One 4: e7190.
39. Andasari V, Roper RT, Swat MH, Chaplain MA (2012) Integrating intracellular
dynamics using CompuCell3D and Bionetsolver: applications to multiscale
modelling of cancer cell growth and invasion. PLoS One 7: e33726.
40. Steinkamp MP, Winner KK, Davies S, Muller C, Zhang Y, et al. (2013) Ovariantumor attachment, invasion, and vascularization reflect unique microenviron-
ments in the peritoneum: insights from xenograft and mathematical models.Front Oncol 3: 97.
41. Swat M, Hester SD, Heiland RW, Zaitlen BL, Glazier JA, et al., CompuCell3DManual and Tutorial Version 3.6.0. 2011, Biocomplexity Institute and
Department of Physics, Indiana University: Bloomington, IN.
42. Bussolati G, Bongiovanni M, Cassoni P, Sapino A (2000) Assessment of necrosisand hypoxia in ductal carcinoma in situ of the breast: basis for a new
classification. Virchows Arch 437: 360–364.
43. Man YG, Tai L, Barner R, Vang R, Saenger JS, et al. (2003) Cell clustersoverlying focally disrupted mammary myoepithelial cell layers and adjacent cells
within the same duct display different immunohistochemical and geneticfeatures: implications for tumor progression and invasion. Breast Cancer Res 5:
R231–241.
44. Chanson L, Brownfield D, Garbe JC, Kuhn I, Stampfer MR, et al. (2011) Self-
organization is a dynamic and lineage-intrinsic property of mammary epithelialcells. Proc Natl Acad Sci U S A 108: 3264–3269.
45. Zhang Y, Thomas GL, Swat M, Shirinifard A, Glazier JA (2011) Computer
simulations of cell sorting due to differential adhesion. PLoS One 6: e24999.
46. Petersen OW, Ronnov-Jessen L, Howlett AR, Bissell MJ (1992) Interaction withbasement membrane serves to rapidly distinguish growth and differentiation
pattern of normal and malignant human breast epithelial cells. Proc Natl Acad
Sci U S A 89: 9064–9068.
47. Rejniak KA, Anderson AR (2008) A computational study of the development ofepithelial acini: II. Necessary conditions for structure and lumen stability. Bull
Math Biol 70: 1450–1479.
48. Rejniak KA, Anderson AR (2008) A computational study of the development ofepithelial acini: I. Sufficient conditions for the formation of a hollow structure.
Bull Math Biol 70: 677–712.
49. Tang J, Enderling H, Becker-Weimann S, Pham C, Polyzos A, et al. (2011)
Phenotypic transition maps of 3D breast acini obtained by imaging-guidedagent-based modeling. Integr Biol 3: 408–421.
50. Edgerton ME, Chuang YL, Macklin P, Yang W, Bearer EL, et al. (2011) A
novel, patient-specific mathematical pathology approach for assessment ofsurgical volume: application to ductal carcinoma in situ of the breast. Anal Cell
Pathol (Amst) 34: 247–263.
51. Macklin P, Edgerton ME, Thompson AM, Cristini V (2012) Patient-calibrated
agent-based modelling of ductal carcinoma in situ (DCIS): from microscopicmeasurements to macroscopic predictions of clinical progression. J Theor Biol
301: 122–140.
52. Eisenhoffer GT, Loftus PD, Yoshigi M, Otsuna H, Chien CB, et al. (2012)Crowding induces live cell extrusion to maintain homeostatic cell numbers in
epithelia. Nature 484: 546–549.
53. Rosenblatt J, Raff MC, Cramer LP (2001) An epithelial cell destined for
apoptosis signals its neighbors to extrude it by an actin- and myosin-dependentmechanism. Curr Biol 11: 1847–1857.
54. Engels K, Fox SB, Whitehouse RM, Gatter KC, Harris AL (1997) Distinct
angiogenic patterns are associated with high-grade in situ ductal carcinomas ofthe breast. J Pathol 181: 207–212.
55. Guidi AJ, Fischer L, Harris JR, Schnitt SJ (1994) Microvessel density and
distribution in ductal carcinoma in situ of the breast. J Natl Cancer Inst 86: 614–
619.
56. Werling RW, Hwang H, Yaziji H, Gown AM (2003) Immunohistochemicaldistinction of invasive from noninvasive breast lesions: a comparative study of
p63 versus calponin and smooth muscle myosin heavy chain. Am J Surg Pathol27: 82–90.
57. Hill CB, Yeh IT (2005) Myoepithelial cell staining patterns of papillary breast
lesions: from intraductal papillomas to invasive papillary carcinomas. Am J Clin
Pathol 123: 36–44.
58. Iwase H, Ando Y, Ichihara S, Toyoshima S, Nakamura T, et al. (2001)Immunohistochemical analysis on biological markers in ductal carcinoma in situ
of the breast. Breast Cancer 8: 98–104.
59. Bijker N, Peterse JL, Duchateau L, Julien JP, Fentiman IS, et al. (2001) Riskfactors for recurrence and metastasis after breast-conserving therapy for ductal
carcinoma-in-situ: analysis of European Organization for Research and
Treatment of Cancer Trial 10853. J Clin Oncol 19: 2263–2271.
Modeling Ductal Carcinoma In Situ
PLOS Computational Biology | www.ploscompbiol.org 13 December 2014 | Volume 10 | Issue 12 | e1003997
60. Pinder SE (2010) Ductal carcinoma in situ (DCIS): pathological features,
differential diagnosis, prognostic factors and specimen evaluation. Mod Pathol
23 Suppl 2: S8–13.
61. Aragona M, Panciera T, Manfrin A, Giulitti S, Michielin F, et al. (2013) A
Mechanical Checkpoint Controls Multicellular Growth through YAP/TAZ
Regulation by Actin-Processing Factors. Cell 154: 1047–1059.
62. Li JF, Lowengrub J (2013) The effects of cell compressibility, motility and
contact inhibition on the growth of tumor cell clusters using the Cellular Potts
Model. J Theor Biol.
63. Bankhead A, 3rd, Magnuson NS, Heckendorn RB (2007) Cellular automaton
simulation examining progenitor hierarchy structure effects on mammary ductal
carcinoma in situ. J Theor Biol 246: 491–498.
64. Franks SJ, Byrne HM, Underwood JC, Lewis CE (2005) Biological inferences
from a mathematical model of comedo ductal carcinoma in situ of the breast.
J Theor Biol 232: 523–543.
65. Albonico G, Querzoli P, Ferretti S, Rinaldi R, Nenci I (1998) Biological profile
of in situ breast cancer investigated by immunohistochemical technique. Cancer
Detect Prev 22: 313–318.
66. Lari SA, Kuerer HM (2011) Biological Markers in DCIS and Risk of Breast
Recurrence: A Systematic Review. J Cancer 2: 232–261.
67. Skinner KA, Silverstein MJ (2001) The management of ductal carcinoma in situ
of the breast. Endocr Relat Cancer 8: 33–45.
68. Cerruti B, Puliafito A, Shewan AM, Yu W, Combes AN, et al. (2013) Polarity,
cell division, and out-of-equilibrium dynamics control the growth of epithelialstructures. J Cell Biol 203: 359–372.
69. Kim Y, Othmer HG (2013) A hybrid model of tumor-stromal interactions in
breast cancer. Bull Math Biol 75: 1304–1350.70. Dvorak HF, Weaver VM, Tlsty TD, Bergers G (2011) Tumor microenviron-
ment and progression. J Surg Oncol 103: 468–474.71. Bissell MJ, Hines WC (2011) Why don’t we get more cancer? A proposed role of
the microenvironment in restraining cancer progression. Nat Med 17: 320–329.
72. Edinger AL, Thompson CB (2004) Death by design: apoptosis, necrosis andautophagy. Curr Opin Cell Biol 16: 663–669.
73. Poller DN, Silverstein MJ, Galea M, Locker AP, Elston CW, et al. (1994) Ideasin pathology. Ductal carcinoma in situ of the breast: a proposal for a new
simplified histological classification association between cellular proliferation andc-erbB-2 protein expression. Mod Pathol 7: 257–262.
74. Silverstein MJ, Poller DN, Waisman JR, Colburn WJ, Barth A, et al. (1995)
Prognostic classification of breast ductal carcinoma-in-situ. Lancet 345: 1154–1157.
75. Mammoto T, Mammoto A, Ingber DE (2013) Mechanobiology and develop-mental control. Annu Rev Cell Dev Biol 29: 27–61.
76. Infanger DW, Lynch ME, Fischbach C (2013) Engineered culture models for
studies of tumor-microenvironment interactions. Annu Rev Biomed Eng 15: 29–53.
Modeling Ductal Carcinoma In Situ
PLOS Computational Biology | www.ploscompbiol.org 14 December 2014 | Volume 10 | Issue 12 | e1003997