Embed Size (px)
Citation preview

Last Study Topics
• FCF and PV• NPV and its competitors• The payback Period• The book rate of return• Internal rate of return

Today Study Topics
• Internal Rate of Return• Numerical
Internal Rate of Return
• The internal rate of return rule is to accept an investment project if the opportunity cost of capital is less than the internal rate of return;– If the opportunity cost of capital is less than the 28
percent IRR, then the project has a positive NPV.– If it is equal to the IRR, the project has a zero NPV. – And if it is greater than the IRR, the project has a
negative NPV
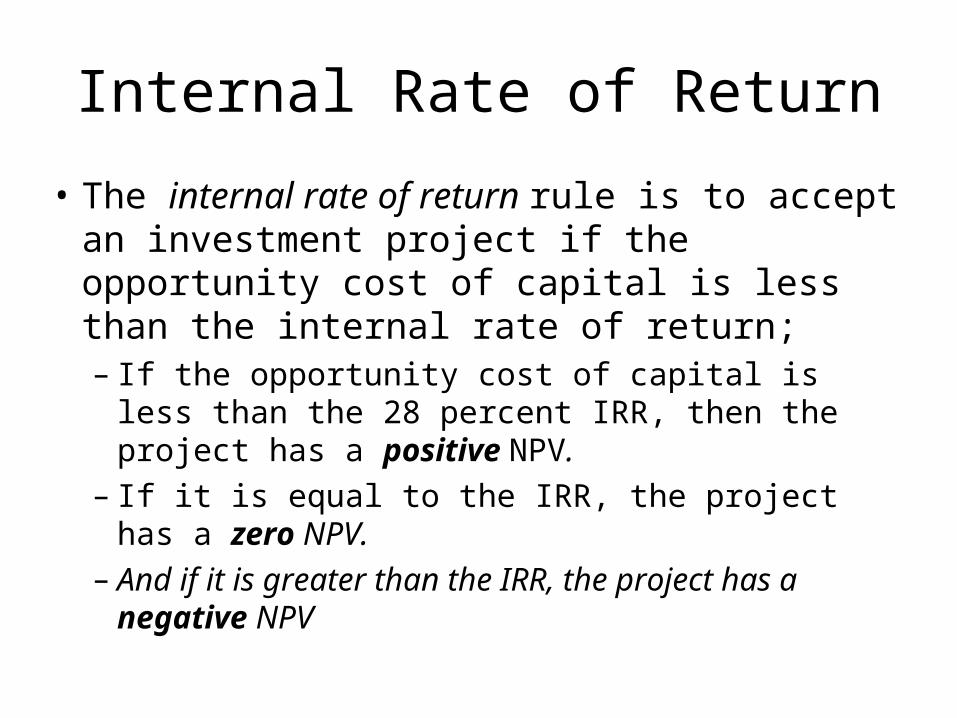
Internal Rate of ReturnPitfall 1 - Lending or Borrowing?• Not all cash-flow streams have NPVs that decline as
the discount rate increases.• @ 50% IRR = NPV = 0.• Does this mean that they are equally attractive?
364%5015001000
,364%5015001000
%10@Project 0
B
A
NPVIRRCC t
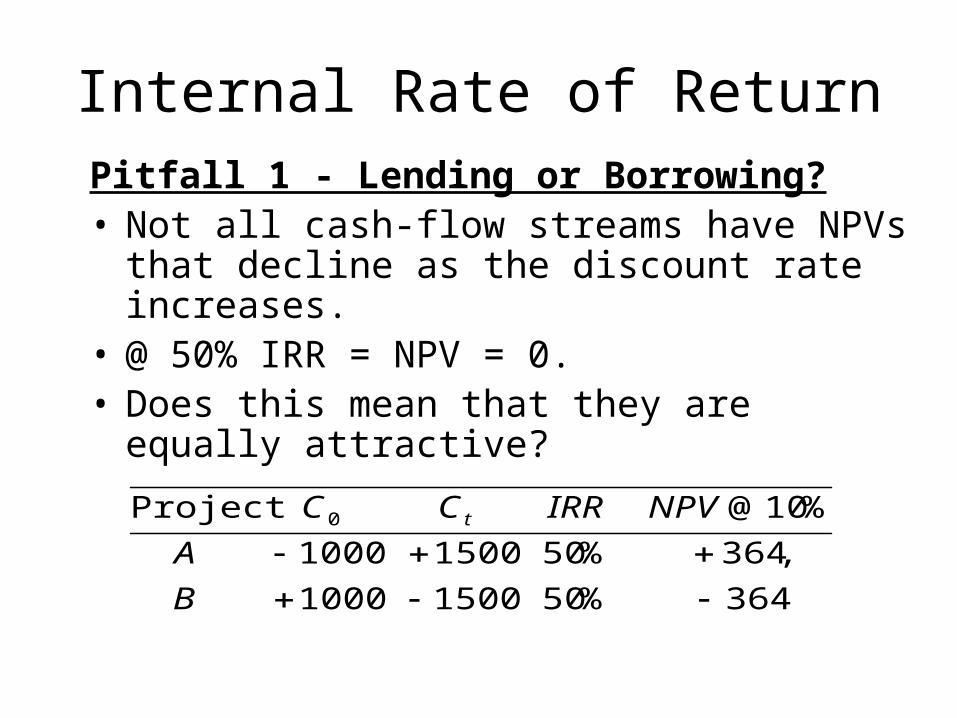
Internal Rate of ReturnPitfall 1 - Lending or Borrowing?• Not all cash-flow streams have NPVs that decline as
the discount rate increases.• @ 50% IRR = NPV = 0.• Does this mean that they are equally attractive?• Project A = Lending • Project B = Borrowing
364%5015001000
,364%5015001000
%10@Project 0
B
A
NPVIRRCC t
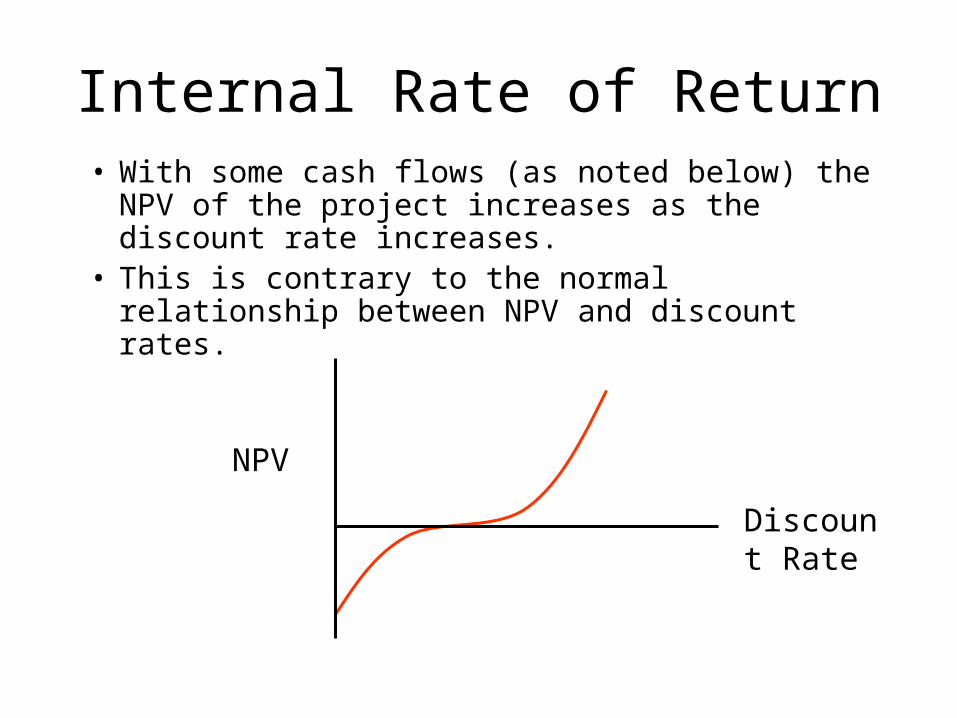
Internal Rate of Return• With some cash flows (as noted below) the NPV
of the project increases as the discount rate increases.
• This is contrary to the normal relationship between NPV and discount rates.
Discount Rate
NPV
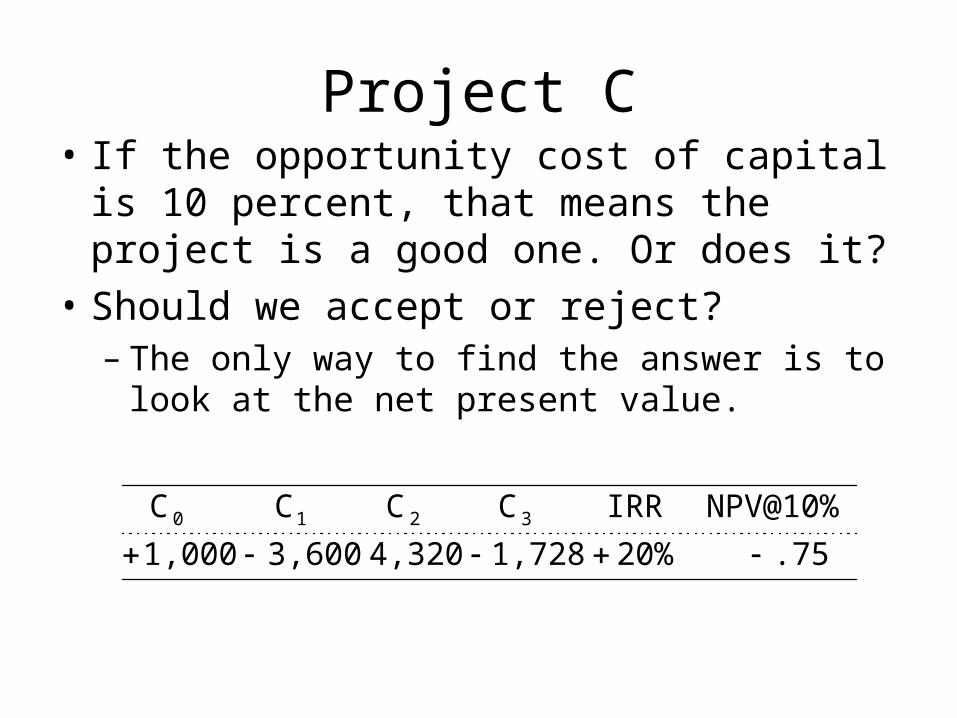
Project C• If the opportunity cost of capital is 10 percent,
that means the project is a good one. Or does it?
• Should we accept or reject? – The only way to find the answer is to look at the
net present value.
.7520%1,7284,3203,6001,000
NPV@10%IRRCCCC 3210
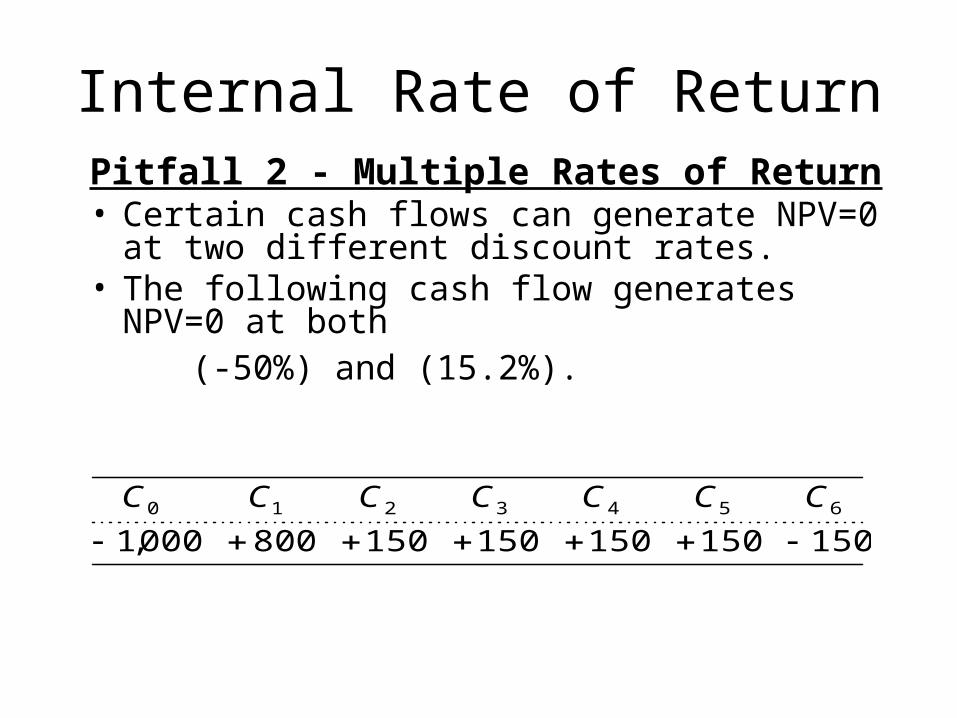
Internal Rate of ReturnPitfall 2 - Multiple Rates of Return• Certain cash flows can generate NPV=0 at two
different discount rates.• The following cash flow generates NPV=0 at both (-50%) and (15.2%).
150150150150150800000,16543210
CCCCCCC
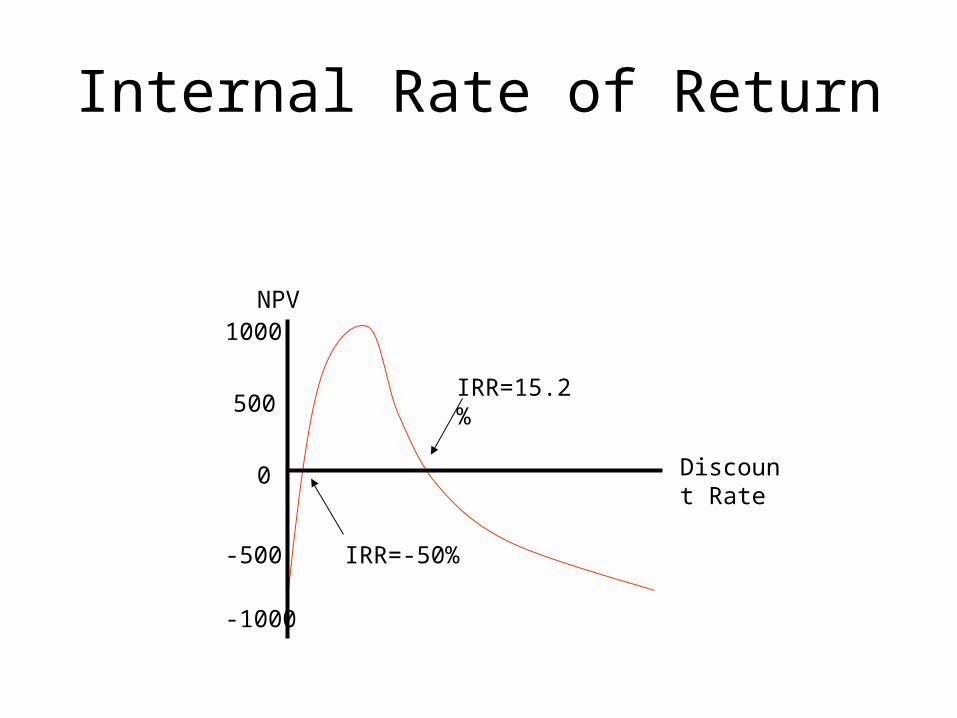
Internal Rate of Return
1000NPV
500
0
-500
-1000
Discount Rate
IRR=15.2%
IRR=-50%
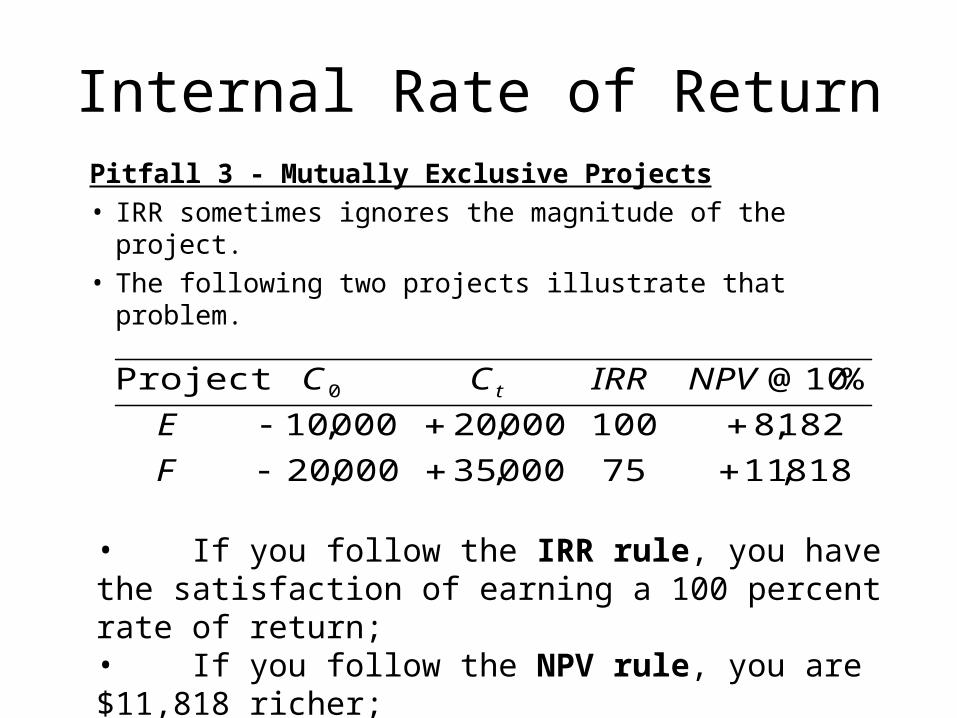
Internal Rate of ReturnPitfall 3 - Mutually Exclusive Projects• IRR sometimes ignores the magnitude of the project.• The following two projects illustrate that problem.
818,1175000,35000,20
182,8100000,20000,10
%10@Project 0
F
E
NPVIRRCC t
• If you follow the IRR rule, you have the satisfaction of earning a 100 percent rate of return;• If you follow the NPV rule, you are $11,818 richer;
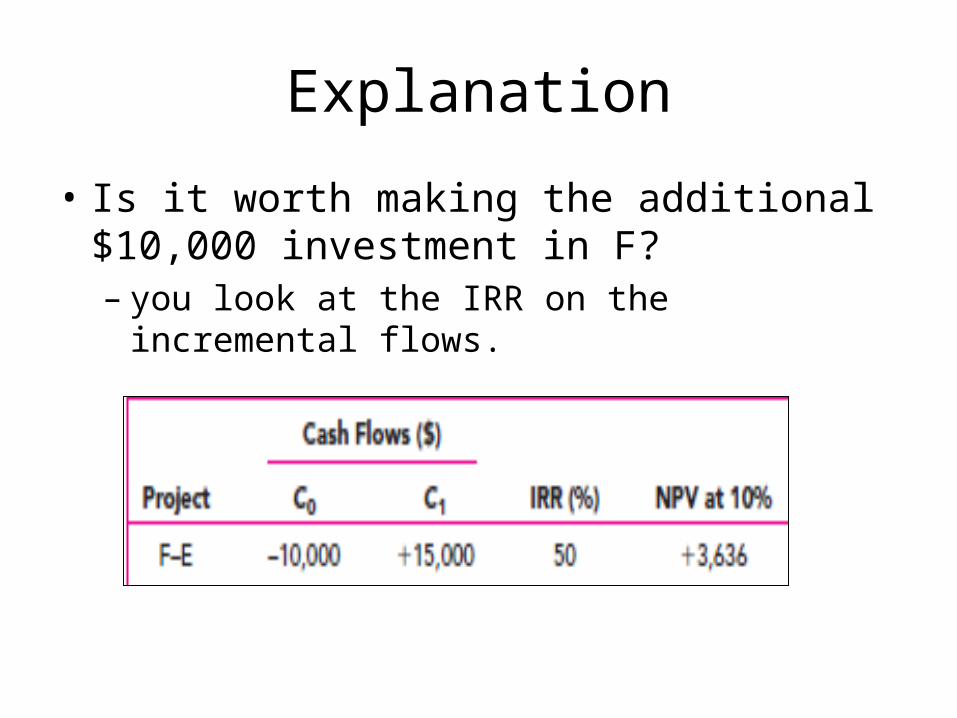
Explanation
• Is it worth making the additional $10,000 investment in F?– you look at the IRR on the incremental flows.
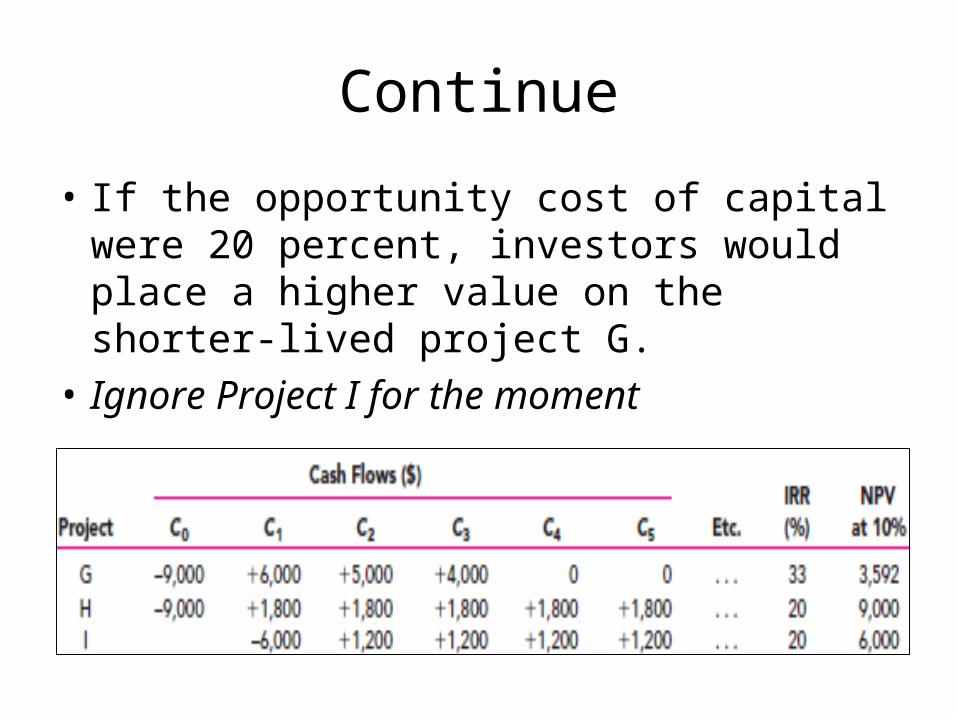
Continue
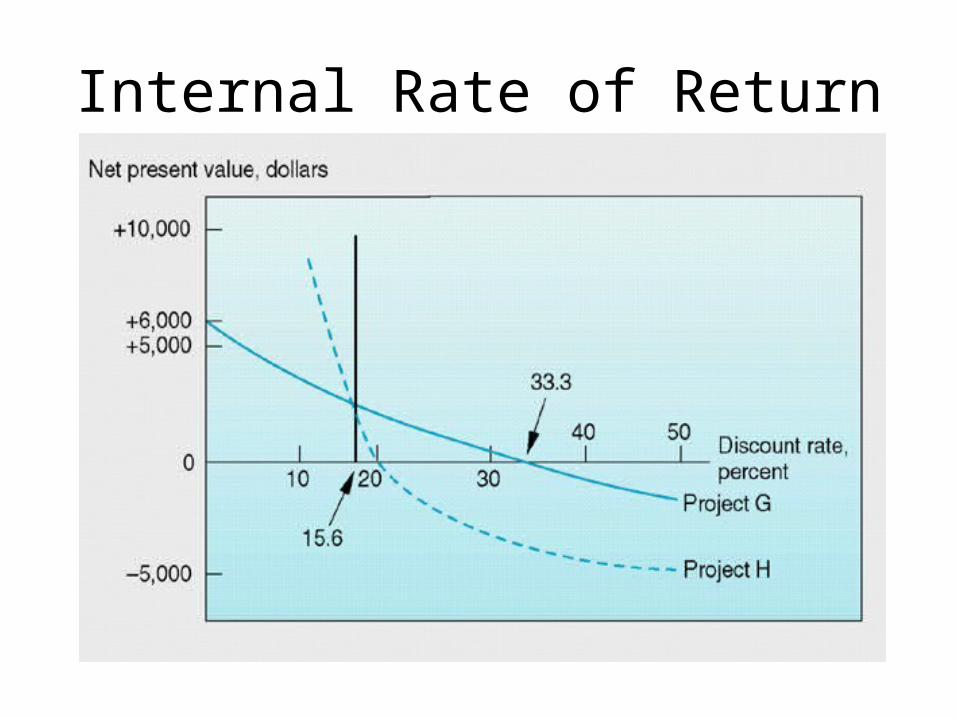
• If the opportunity cost of capital were 20 percent, investors would place a higher value on the shorter-lived project G.
• Ignore Project I for the moment
Opportunity Cost matters
• But in our example the opportunity cost of capital is not 20 % but 10 %.
• Investors are prepared to pay relatively high prices for longer-lived securities, and so they will pay a relatively high price for the longer-lived project.
Internal Rate of Return
Continue
• At a 10 percent cost of capital, an investment in H has an NPV of $9,000 and an investment in G has an NPV of only $3,592;
• Assume, it is a shortage of capital which forces the choice between G and H;– But, When this implicit assumption is brought out,
H is better if there is no capital shortage.
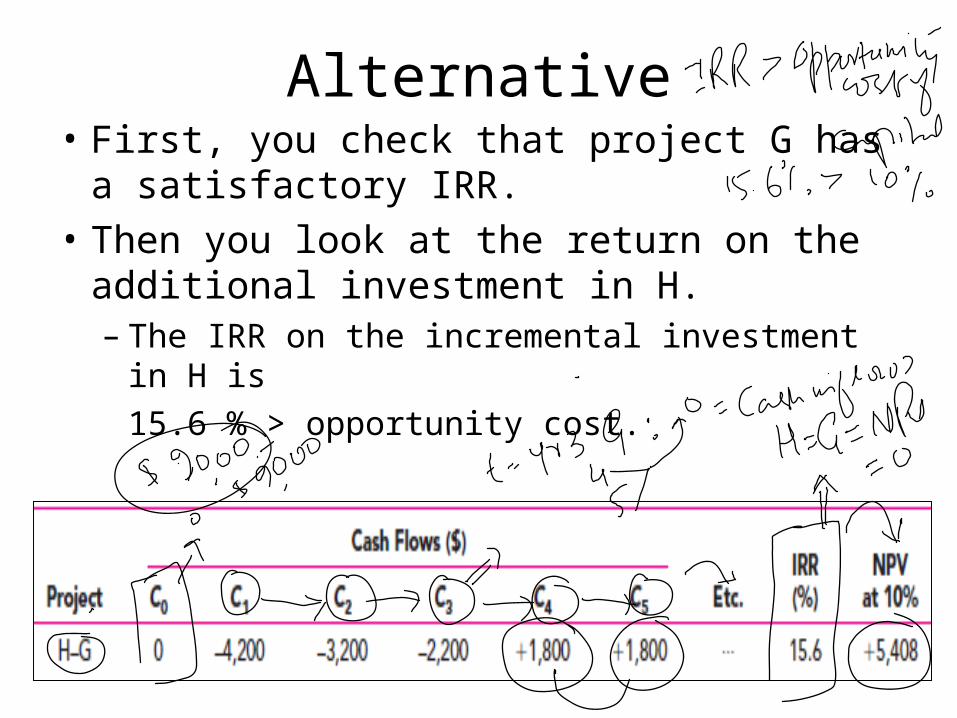
Alternative• First, you check that project G has a
satisfactory IRR. • Then you look at the return on the additional
investment in H.– The IRR on the incremental investment in H is
15.6 % > opportunity cost.
Internal Rate of Return
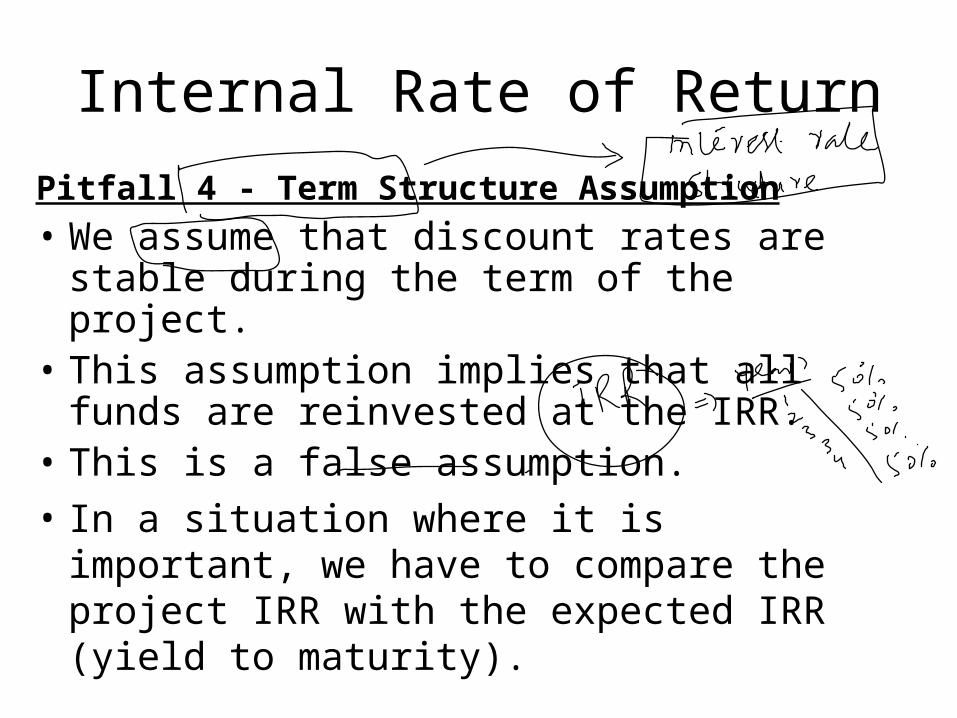
Pitfall 4 - Term Structure Assumption• We assume that discount rates are stable during
the term of the project. • This assumption implies that all funds are
reinvested at the IRR. • This is a false assumption.• In a situation where it is important, we have to
compare the project IRR with the expected IRR (yield to maturity).
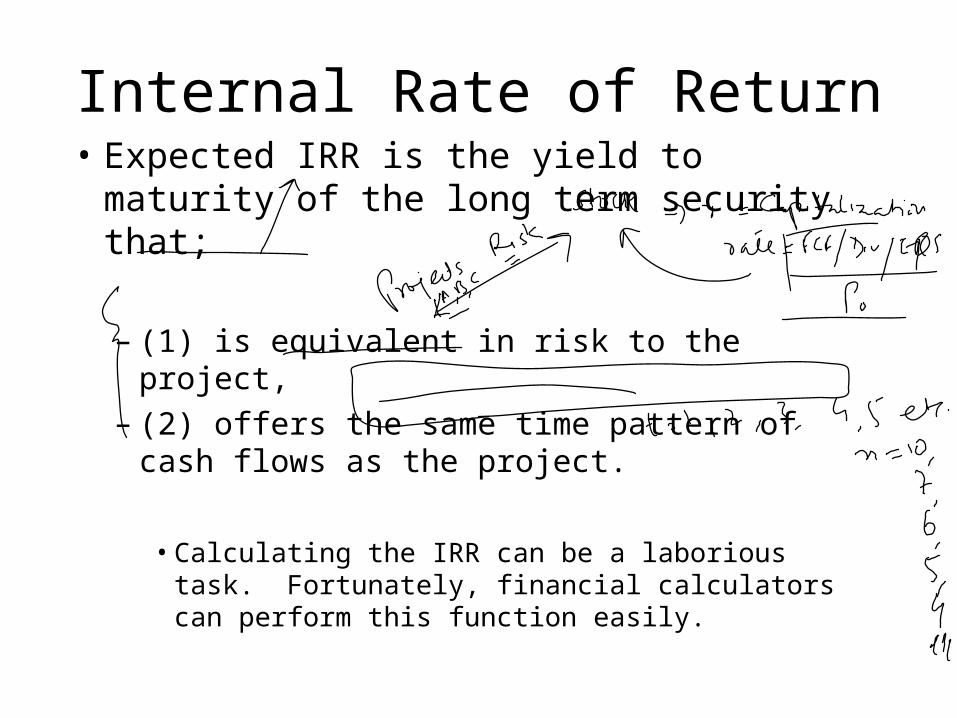
Internal Rate of Return• Expected IRR is the yield to maturity of the
long term security that;
– (1) is equivalent in risk to the project,– (2) offers the same time pattern of cash flows
as the project.
• Calculating the IRR can be a laborious task. Fortunately, financial calculators can perform this function easily.
Summary
• Internal Rate of Return• Pitfalls of IRR
Profitability Index (PI)
• When resources are limited, the profitability index (PI) provides a tool for selecting among various project combinations and alternatives
• A set of limited resources and projects can yield various combinations.
• The highest weighted average PI can indicate which projects to select.
Continue
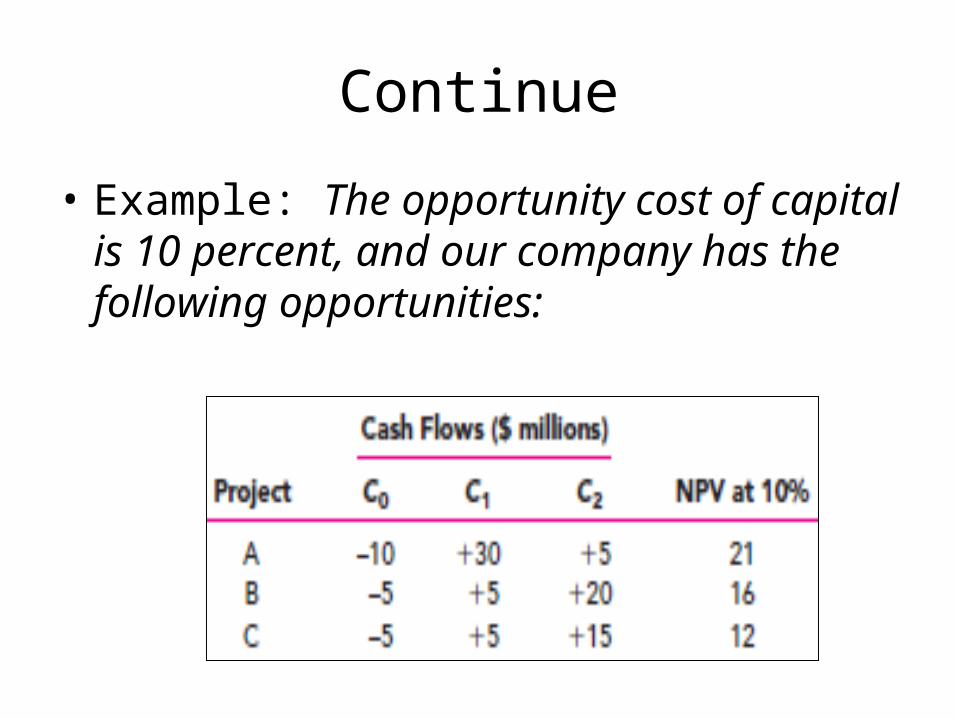
• Example: The opportunity cost of capital is 10 percent, and our company has the following opportunities:
Continue
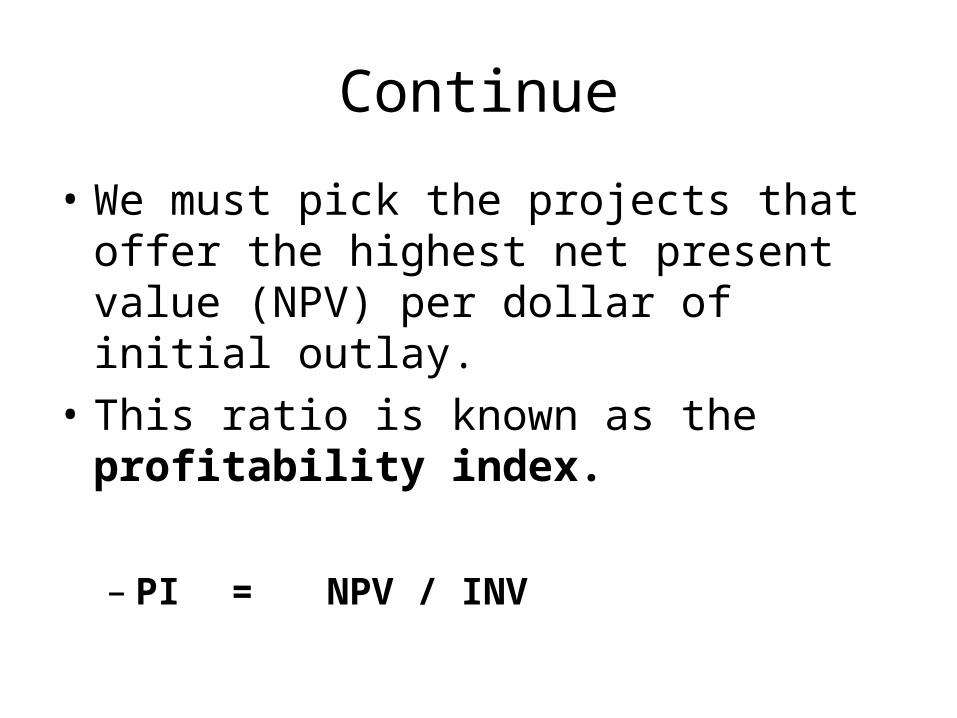
• We must pick the projects that offer the highest net present value (NPV) per dollar of initial outlay.
• This ratio is known as the profitability index.
– PI = NPV / INV
Continue
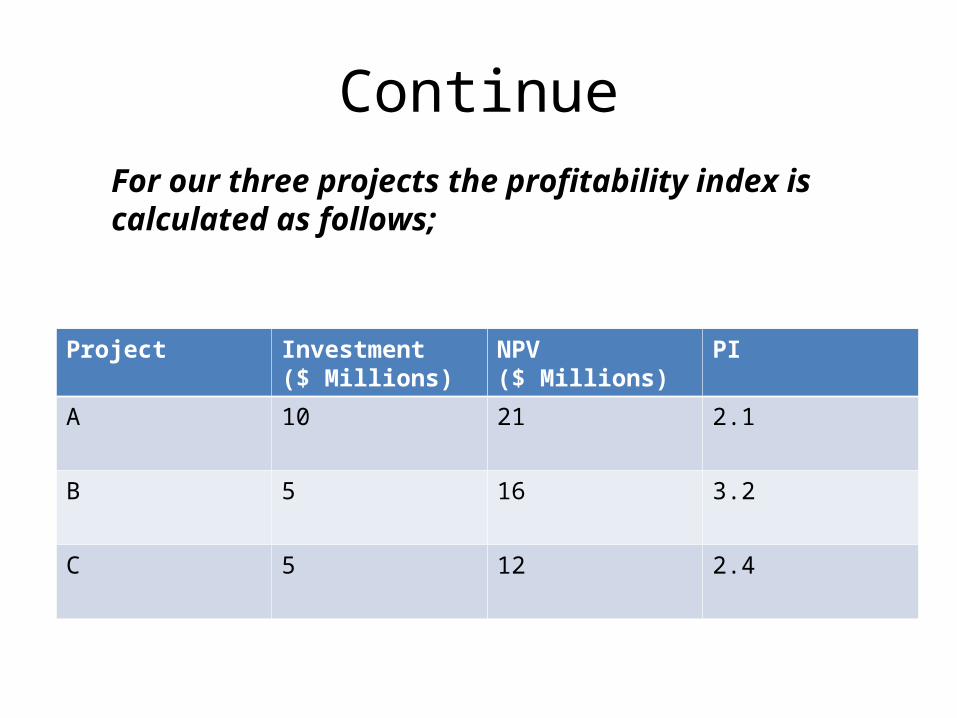
Project Investment($ Millions)
NPV($ Millions)
PI
A 10 21 2.1
B 5 16 3.2
C 5 12 2.4
For our three projects the profitability index is calculated as follows;
Profitability Index
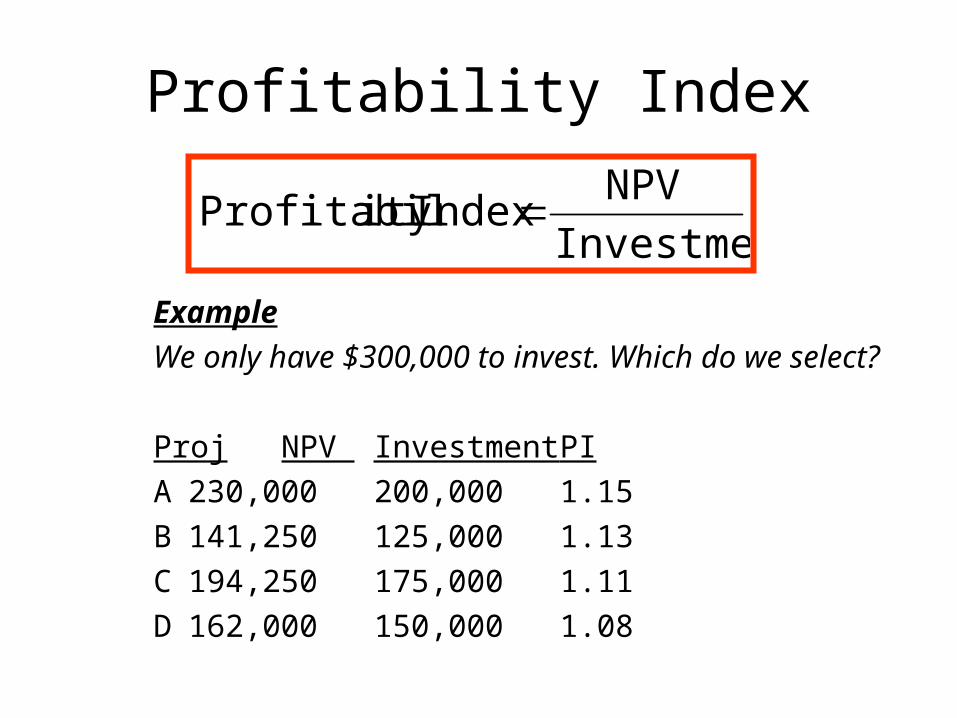
ExampleWe only have $300,000 to invest. Which do we select?
Proj NPV Investment PIA 230,000 200,000 1.15B 141,250 125,000 1.13C 194,250 175,000 1.11D 162,000 150,000 1.08
Investment
NPVIndexity Profitabil
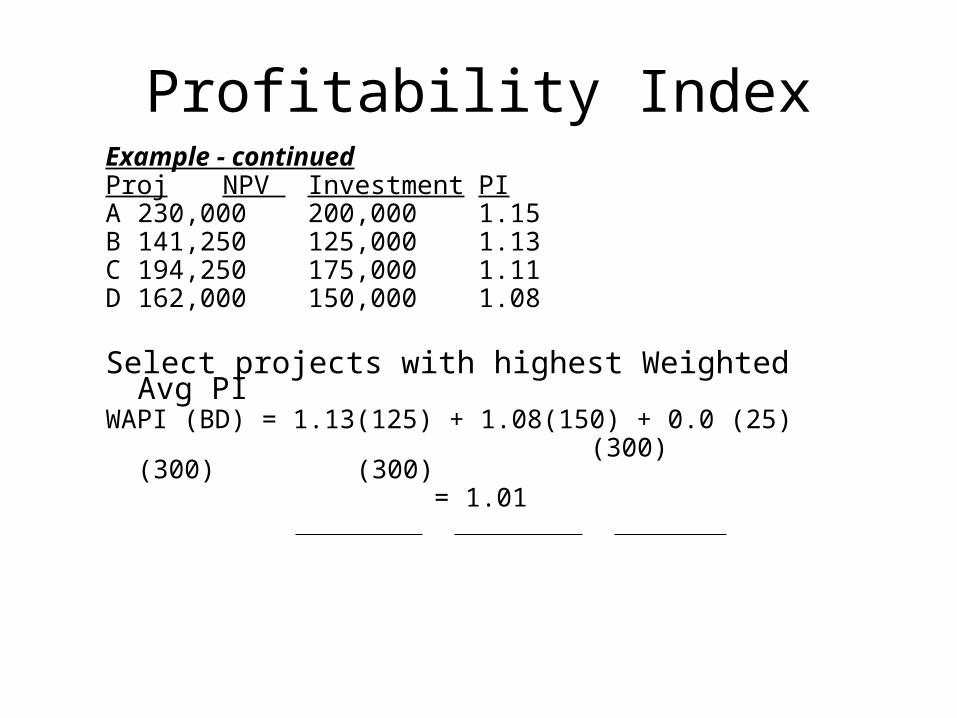
Profitability IndexExample - continuedProj NPV Investment PIA 230,000 200,000 1.15B 141,250 125,000 1.13C 194,250 175,000 1.11D 162,000 150,000 1.08
Select projects with highest Weighted Avg PIWAPI (BD) = 1.13(125) + 1.08(150) + 0.0 (25) (300) (300) (300) = 1.01
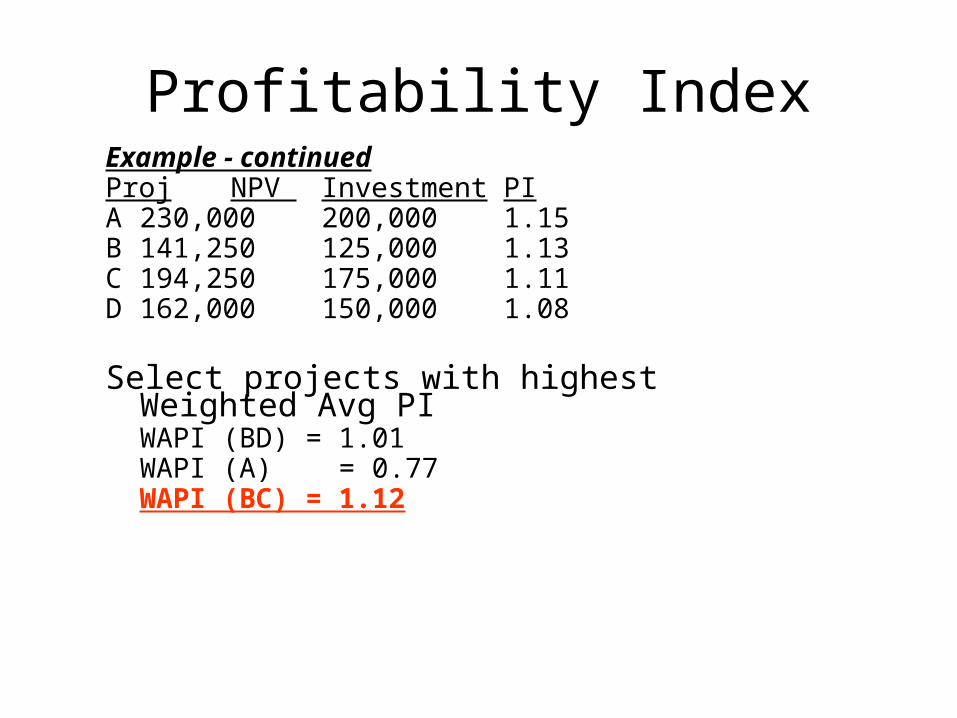
Profitability IndexExample - continuedProj NPV Investment PIA 230,000 200,000 1.15B 141,250 125,000 1.13C 194,250 175,000 1.11D 162,000 150,000 1.08
Select projects with highest Weighted Avg PIWAPI (BD) = 1.01WAPI (A) = 0.77WAPI (BC) = 1.12
Linear Programming
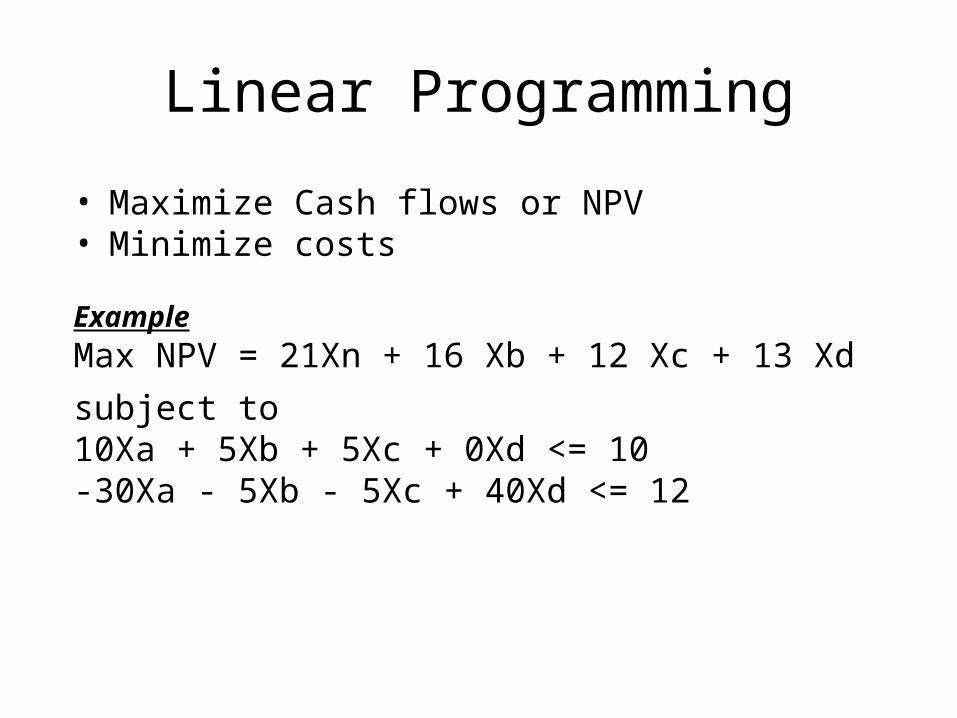
• Maximize Cash flows or NPV• Minimize costs
ExampleMax NPV = 21Xn + 16 Xb + 12 Xc + 13 Xd
subject to10Xa + 5Xb + 5Xc + 0Xd <= 10-30Xa - 5Xb - 5Xc + 40Xd <= 12

Numericals