Embed Size (px)
Citation preview
5 Chapter 3
Chapter 5
Lasing characteristics of
PbO-Sb2O3-B2O3:Er2O3 glasses
155
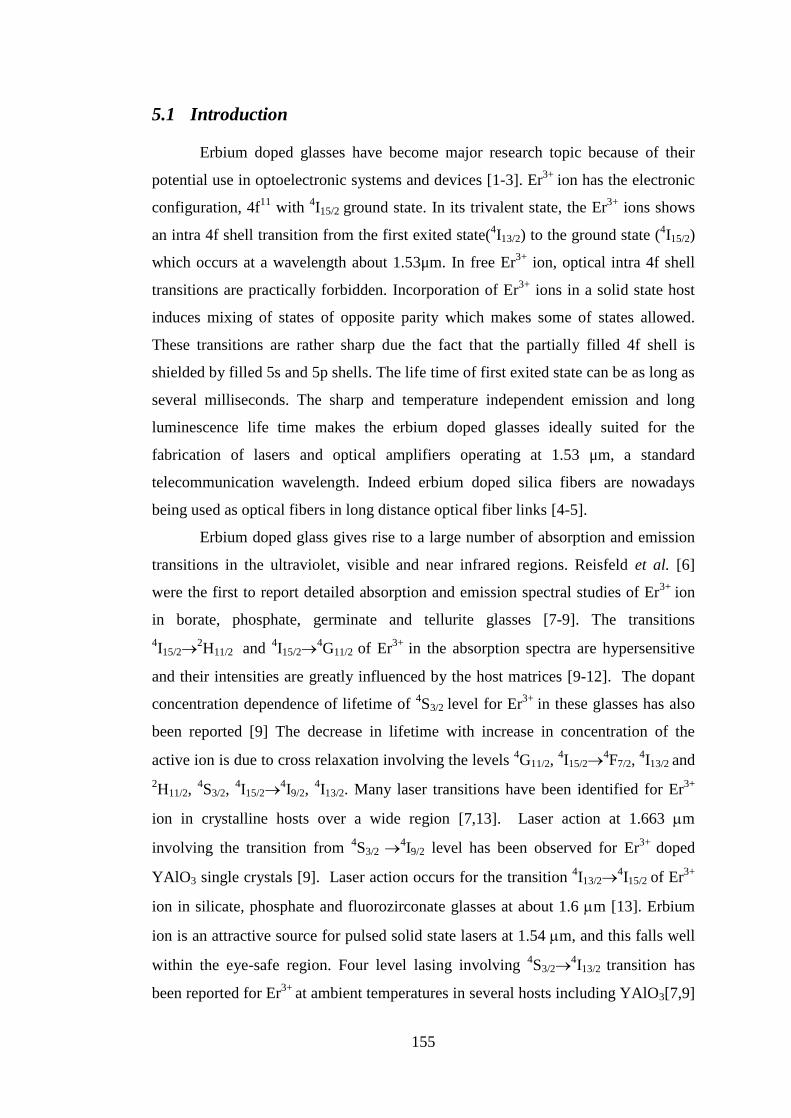
5.1 Introduction
Erbium doped glasses have become major research topic because of their
potential use in optoelectronic systems and devices [1-3]. Er3+ ion has the electronic
configuration, 4f11 with 4I15/2 ground state. In its trivalent state, the Er3+ ions shows
an intra 4f shell transition from the first exited state(4I13/2) to the ground state (4I15/2)
which occurs at a wavelength about 1.53μm. In free Er3+ ion, optical intra 4f shell
transitions are practically forbidden. Incorporation of Er3+ ions in a solid state host
induces mixing of states of opposite parity which makes some of states allowed.
These transitions are rather sharp due the fact that the partially filled 4f shell is
shielded by filled 5s and 5p shells. The life time of first exited state can be as long as
several milliseconds. The sharp and temperature independent emission and long
luminescence life time makes the erbium doped glasses ideally suited for the
fabrication of lasers and optical amplifiers operating at 1.53 μm, a standard
telecommunication wavelength. Indeed erbium doped silica fibers are nowadays
being used as optical fibers in long distance optical fiber links [4-5].
Erbium doped glass gives rise to a large number of absorption and emission
transitions in the ultraviolet, visible and near infrared regions. Reisfeld et al. [6]
were the first to report detailed absorption and emission spectral studies of Er3+ ion
in borate, phosphate, germinate and tellurite glasses [7-9]. The transitions4I15/22H11/2 and 4I15/24G11/2 of Er3+ in the absorption spectra are hypersensitive
and their intensities are greatly influenced by the host matrices [9-12]. The dopant
concentration dependence of lifetime of 4S3/2 level for Er3+ in these glasses has also
been reported [9] The decrease in lifetime with increase in concentration of the
active ion is due to cross relaxation involving the levels 4G11/2,4I15/24F7/2,
4I13/2 and2H11/2,
4S3/2,4I15/24I9/2,
4I13/2. Many laser transitions have been identified for Er3+
ion in crystalline hosts over a wide region [7,13]. Laser action at 1.663 m
involving the transition from 4S3/2 4I9/2 level has been observed for Er3+ doped
YAlO3 single crystals [9]. Laser action occurs for the transition 4I13/24I15/2 of Er3+
ion in silicate, phosphate and fluorozirconate glasses at about 1.6 m [13]. Erbium
ion is an attractive source for pulsed solid state lasers at 1.54 m, and this falls well
within the eye-safe region. Four level lasing involving 4S3/24I13/2 transition has
been reported for Er3+ at ambient temperatures in several hosts including YAlO3[7,9]
156
This transition is of interest because of the existence of sensitive photo detection at
around 850 nm where the second harmonic of the above transition occurs.
Continuous wave operation of Er3+ doped fluorozirconate glass fiber laser emitting
at 2.7 m corresponding to the transition, 4I11/24I13/2 is based on the depletion of
the lower level by excited state absorption of the appropriate pump wavelength.
Er3+ doped phosphate glasses have proved to be optical glasses with good
homogeneity and the laser transition 4I13/24I15/2 around 1.5 m is being used for
laser action with the bulk glasses as the host matrix [68].
5.2 Brief review of the previous work on Er3+ doped glasses
Rama Moorthy et al. [14] have studied the absorption and emission
characteristics of Er3+ ions in alkali chloroborophosphate glasses. Laercio Gomes et
al. [15] have reported the energy level decay and excited state absorption processes
in erbium-doped tellurite glass. Subbalakshmi and Veeraiah [16] have studied the
optical absorption and fluorescence properties of Er3+ ion in MO–WO3–P2O5
glasses. Babu et al. [17] have studied the thermal and optical properties of Er3+
doped oxyfluoro tellurite glasses. Gerlas et al. [18] have studied absorption and
emission cross sections of Er3+ in Al2O3 waveguides. Atsunobu Masuno et al. [19]
have reported the broadband infrared fluorescence in Er3+ doped BaO–SiO2 glasses.
Ondracek et al. [20] have done the characterization of erbium doped glass optical
waveguides by a fine tunable semiconductor laser. Marjanovic et al. [21] have done
characterization of new erbium-doped tellurite glasses and fibers. ZHOU Ya-xun et
al. [22] have studied the concentration-dependent luminescence properties in Er3+
doped TeO2- ZnO-La2O3 glasses. Shiqing Xu et al. [23] have studied the effect of
Bi2O3 on spectroscopic properties of Er3+ doped lead oxyfluoro silicate glasses for
broadband optical amplifiers. Pisarski et al. [24] have studied the effect of heat
treatment on Er3+ containing multicomponent oxyfluoride lead borate glass system.
Kaushal Kumar et al. [25] have studied the enhancement of luminescence properties
in Er3+ doped TeO2–Na2O–PbX (X =O and F) ternary glasses. Wilfried Blanc et.al
[26] have studied erbium emission properties in nanostructured fibers. Xiyan Li et
al. [27] have studied the near-infrared luminescent properties and natural lifetime
calculation of a novel Er3+ complex. Dong et al. [28] have done the observation of
micro laser with Er3+ doped phosphate glass coated microsphere pumped by 780 nm.
157
Laxmi Kanth et al. [29] have studied optical absorption, fluorescence and thermo-
luminescence properties of ZnF2–MO–TeO2 (MO =ZnO; CdO and PbO) glasses
doped with Er3+ ions. Hiroki Yamauchi and Yasutake Ohishi [30] have studied the
Spectroscopic properties of Er3+ doped PbO–Ga2O3–GeO2 glass for optical
amplifiers.
5.3 Sample preparation
The molar composition of the glasses under study is 30 PbO-25 Sb2O3-(45-x)
B2O3-x Er2O3 where x = 0, 0.2, 0.4, 0.6 and 1mol%. The samples were labeled as E0,
E2, E4, E6, E8 and E10 respectively. Appropriate amounts of AR grade reagents of
PbO, Sb2O3, B2O3 and Er2O3 powders are thoroughly mixed in agate mortar and
melted in a silica crucible in the temperature range of 900 °C to 950 °C in a
programmable electrical furnace for thirty minutes until bubble free liquid is formed.
The resultant melt is poured in a brass mould and subsequently annealed at 250 °C
for 2 h. The samples prepared were then ground and optical polished to the
dimensions of 1 cm×1 cm×0.2 cm. The detailed composition of the samples is
E0: 30 PbO-25 Sb2O3-45 B2O3-0.0 Er2O3
E2: 30 PbO-25 Sb2O3-44.8 B2O3-0.2 Er2O3
E4: 30 PbO-25 Sb2O3-44.6 B2O3-0.4 Er2O3
E6: 30 PbO-25 Sb2O3-44.4 B2O3-0.6 Er2O3
E8: 30 PbO-25 Sb2O3-44.2 B2O3-0.8 Er2O3
E10: 30 PbO-25 Sb2O3- 44 B2O3-1.0 Er2O3
5.4 Physical properties
Various physical properties like density, molar volume, oxygen mol%,
oxygen packing density, Er3+ ion concentration, inter ionic distance, refractive
index, polaron radius, molar refraction and polarizability of Er3+ doped glasses were
calculated and presented in Table 5.1.
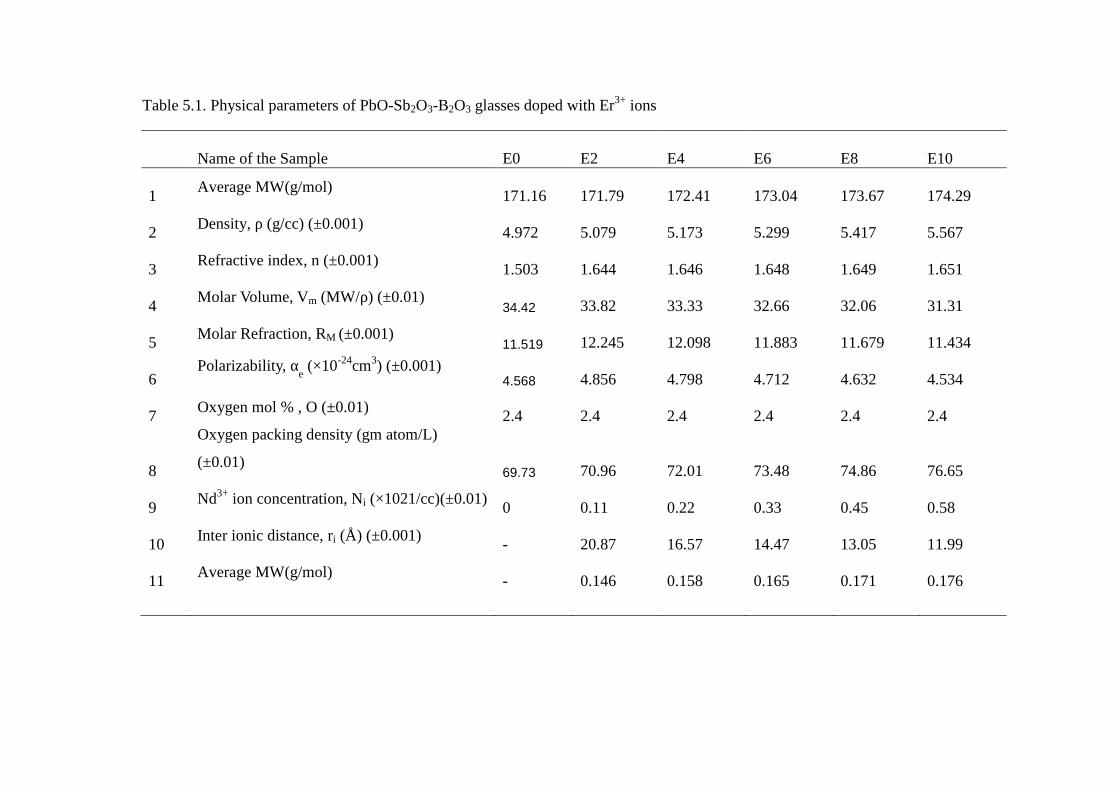
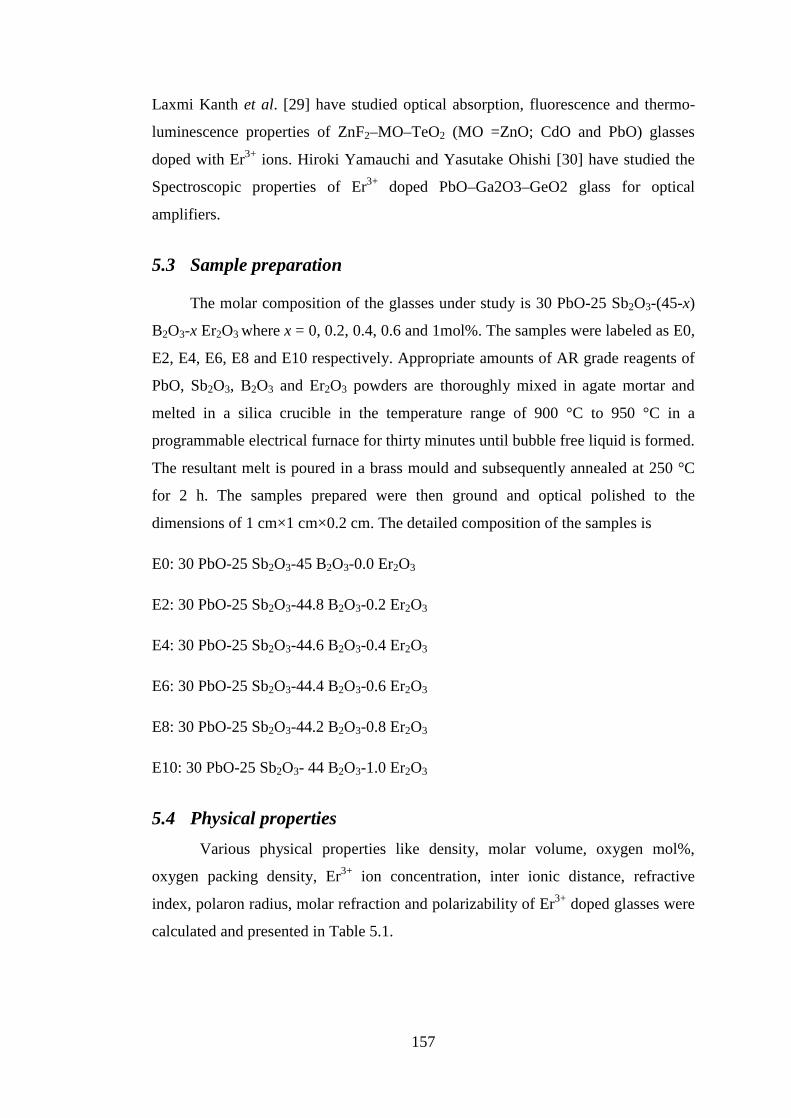
Table 5.1. Physical parameters of PbO-Sb2O3-B2O3 glasses doped with Er3+ ions
Name of the Sample E0 E2 E4 E6 E8 E10
1Average MW(g/mol)
171.16 171.79 172.41 173.04 173.67 174.29
2Density, ρ (g/cc) (±0.001)
4.972 5.079 5.173 5.299 5.417 5.567
3Refractive index, n (±0.001)
1.503 1.644 1.646 1.648 1.649 1.651
4Molar Volume, Vm (MW/ρ) (±0.01)
34.42 33.82 33.33 32.66 32.06 31.31
5Molar Refraction, RM (±0.001)
11.519 12.245 12.098 11.883 11.679 11.434
6Polarizability, α
e(×10-24cm3) (±0.001)
4.568 4.856 4.798 4.712 4.632 4.534
7Oxygen mol % , O (±0.01)
2.4 2.4 2.4 2.4 2.4 2.4
8
Oxygen packing density (gm atom/L)
(±0.01)69.73 70.96 72.01 73.48 74.86 76.65
9Nd3+ ion concentration, Ni (×1021/cc)(±0.01)
0 0.11 0.22 0.33 0.45 0.58
10Inter ionic distance, ri (Å) (±0.001)
- 20.87 16.57 14.47 13.05 11.99
11Average MW(g/mol)
- 0.146 0.158 0.165 0.171 0.176
159
As the concentration of Er3+ ions increased, a considerable increase in the
density and a considerable decrease in the molar volume of samples were observed.
Modification of the geometrical configurations of the glass network, change in
coordination and the variation of dimensions of the interstitial holes can be
considered as responsible for such a variation of density. Oxygen packing density
was also found to be increased with the increase in the concentration of Er3+ ions.
Such an increase indicates an increase in the structural compactness of the samples.
5.5 Characterization
5.5.1 XRD
The X-ray diffraction of all the samples was recorded on Rigaku
diffractometer mini flex with CuKɑ radiation. It was ensured that the samples
prepared were freed from visible inhomogeneous such as inclusions, cracks or
bubbles. Based on the visual examination, the absence of peaks in the X-ray
diffraction pattern we could come to the conclusion that samples prepared are
reasonably free from crystalline nature. The Fig. 5.1 shows the X-ray diffractograms
of erbium doped lead antimony borate glasses. The absence of symmetrical peaks
confirms the amorphous nature of the samples.
Fig. 5.1 X- ray difractograms of PbO-Sb2O3-B2O3 glasses doped with Er3+ ions.
160
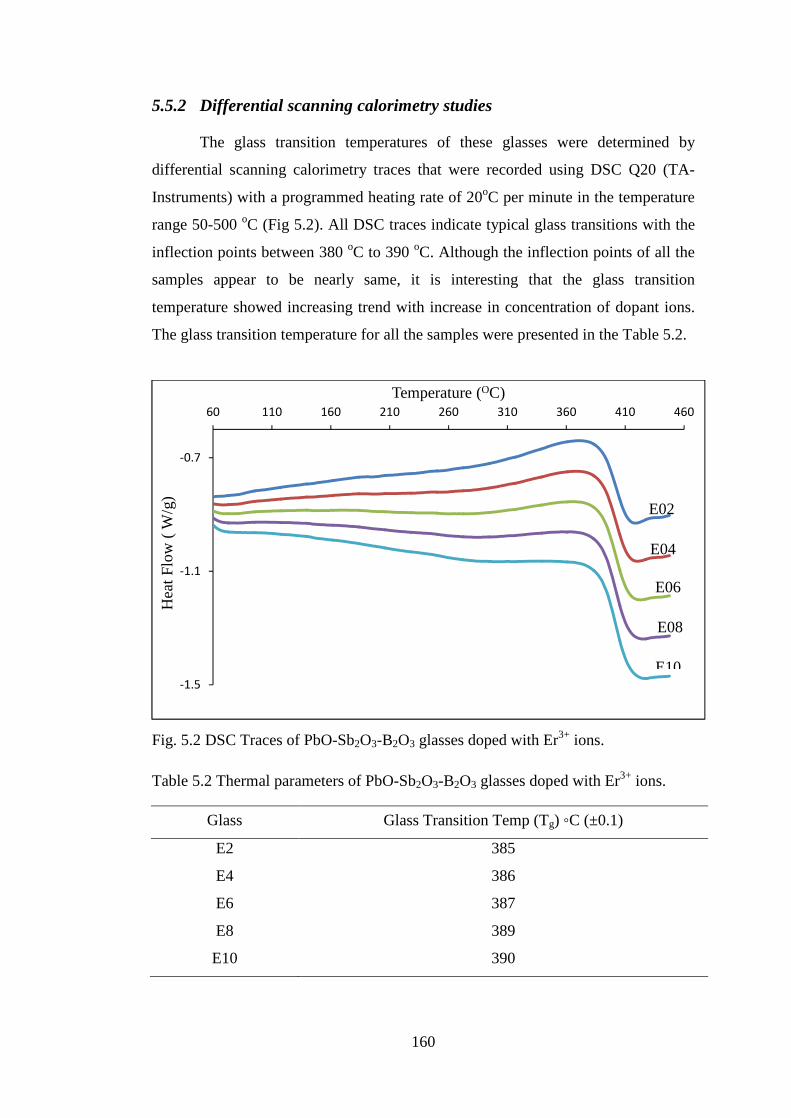
5.5.2 Differential scanning calorimetry studies
The glass transition temperatures of these glasses were determined by
differential scanning calorimetry traces that were recorded using DSC Q20 (TA-
Instruments) with a programmed heating rate of 20oC per minute in the temperature
range 50-500 oC (Fig 5.2). All DSC traces indicate typical glass transitions with the
inflection points between 380 oC to 390 oC. Although the inflection points of all the
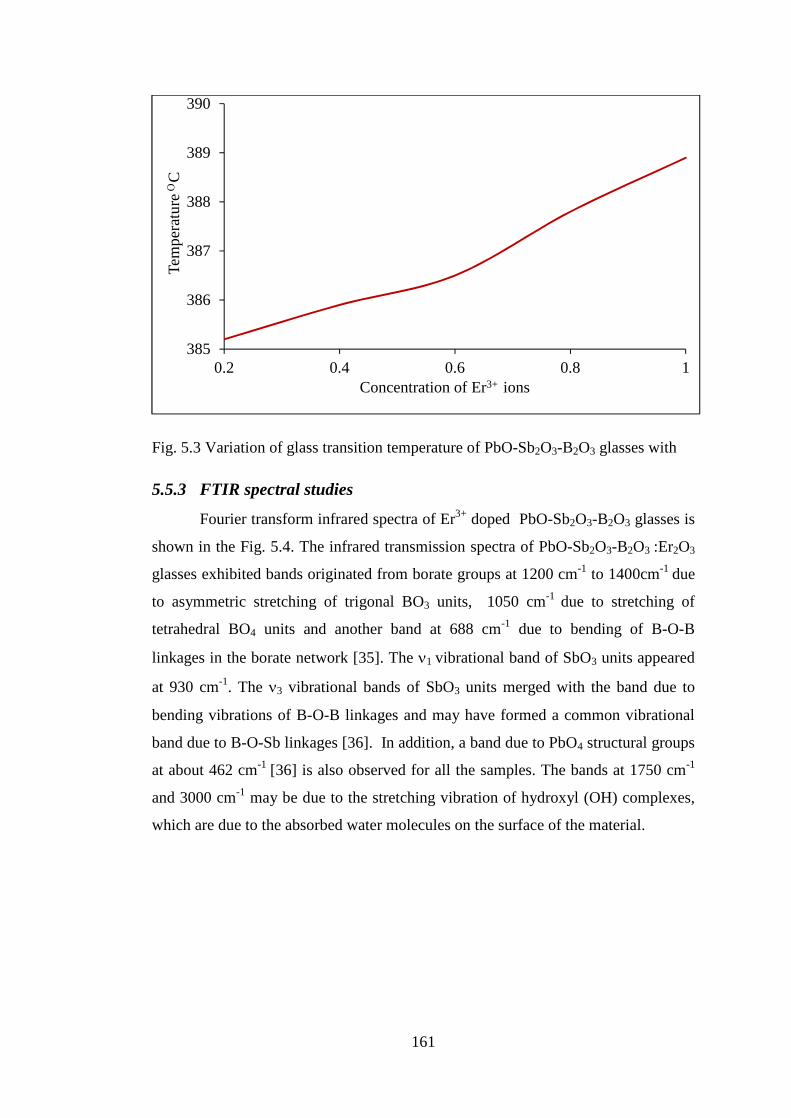
samples appear to be nearly same, it is interesting that the glass transition
temperature showed increasing trend with increase in concentration of dopant ions.
The glass transition temperature for all the samples were presented in the Table 5.2.
Fig. 5.2 DSC Traces of PbO-Sb2O3-B2O3 glasses doped with Er3+ ions.
Table 5.2 Thermal parameters of PbO-Sb2O3-B2O3 glasses doped with Er3+ ions.
Glass Glass Transition Temp (Tg) C (±0.1)
E2 385
E4 386
E6 387
E8 389
E10 390
-1.5
-1.1
-0.7
60 110 160 210 260 310 360 410 460
Hea
t Flo
w (
W/g
)
Temperature (OC)
E10
E08
E06
E04
E02
161
Fig. 5.3 Variation of glass transition temperature of PbO-Sb2O3-B2O3 glasses with
5.5.3 FTIR spectral studies
Fourier transform infrared spectra of Er3+ doped PbO-Sb2O3-B2O3 glasses is
shown in the Fig. 5.4. The infrared transmission spectra of PbO-Sb2O3-B2O3 :Er2O3
glasses exhibited bands originated from borate groups at 1200 cm-1 to 1400cm-1 due
to asymmetric stretching of trigonal BO3 units, 1050 cm-1 due to stretching of
tetrahedral BO4 units and another band at 688 cm-1 due to bending of B-O-B
linkages in the borate network [35]. The 1 vibrational band of SbO3 units appeared
at 930 cm-1. The 3 vibrational bands of SbO3 units merged with the band due to
bending vibrations of B-O-B linkages and may have formed a common vibrational
band due to B-O-Sb linkages [36]. In addition, a band due to PbO4 structural groups
at about 462 cm-1 [36] is also observed for all the samples. The bands at 1750 cm-1
and 3000 cm-1 may be due to the stretching vibration of hydroxyl (OH) complexes,
which are due to the absorbed water molecules on the surface of the material.
385
386
387
388
389
390
0.2 0.4 0.6 0.8 1
Tem
pera
ture
OC
Concentration of Er3+ ions
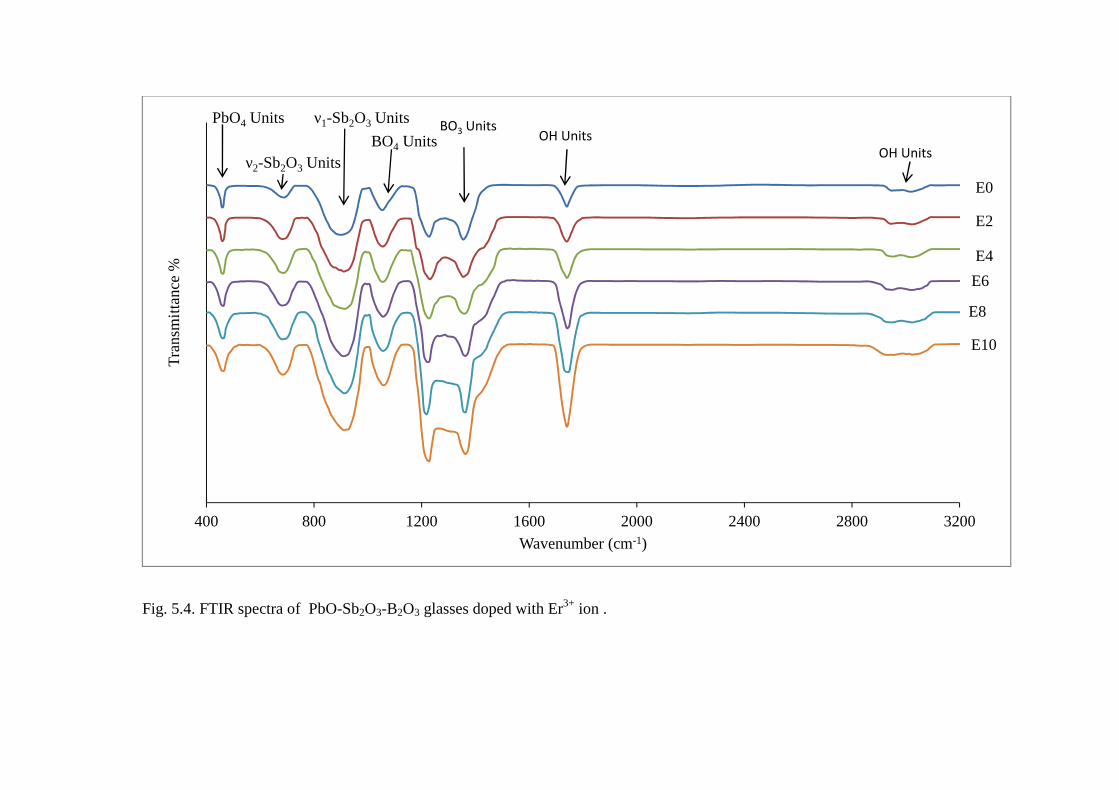
Fig. 5.4. FTIR spectra of PbO-Sb2O3-B2O3 glasses doped with Er3+ ion .
400 800 1200 1600 2000 2400 2800 3200
Tra
nsm
itta
nce
%
Wavenumber (cm-1)
E10
E8
E6
E4
E2
E0
PbO4 Units
ν2-Sb2O3 Units
ν1-Sb2O3 Units
BO4 UnitsBO3 Units
OH UnitsOH Units
163
5.6 Optical absorption
The optical absorption spectra of Er3+ doped lead borate glasses recorded at
room temperature in the wavelength region 300-2000 nm has exhibited twelve
absorption bands all from the ground state 4I15/2 and was shown in the Fig. 5.5. These
levels are assigned to the following appropriate electronic transitions by comparison
with energy levels of Er3+ aqua-ion [31].
4I13/2 (1527 nm)
4I11/2 (973 nm)
4I9/2 (797 nm)
4F9/2 (652 nm)
4S3/2 (543 nm)
2H11/2 (522 nm)
4F7/2 (488 nm)
4F5/2 (452 nm)
4F3/2 (443nm)
2G9/2 (408 nm)
4G11/2 (378 nm)
4G9/2 (364 nm)
The spectra obtained for all the glasses showed identical characterization
with the exception of their relative band intensities. The spectral intensities of these
bands are found to increase with the content of Er2O3.
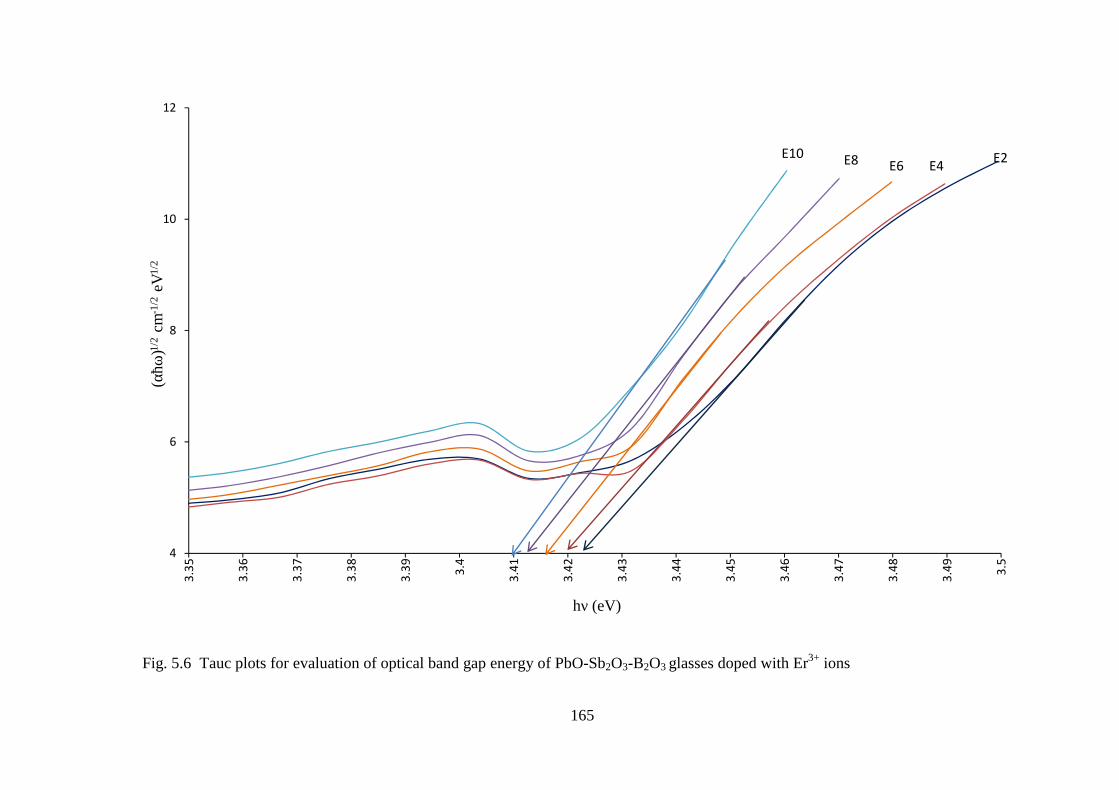
5.6.1 Optical parameters
The optical band gap energy is calculated from the extrapolation of linear
region of graph (α ħω)1/2 against ħω and presented in the Fig. 5.. Optical band gap
energies of the samples were decreasing with increasing the concentration of Nd3+
ions.
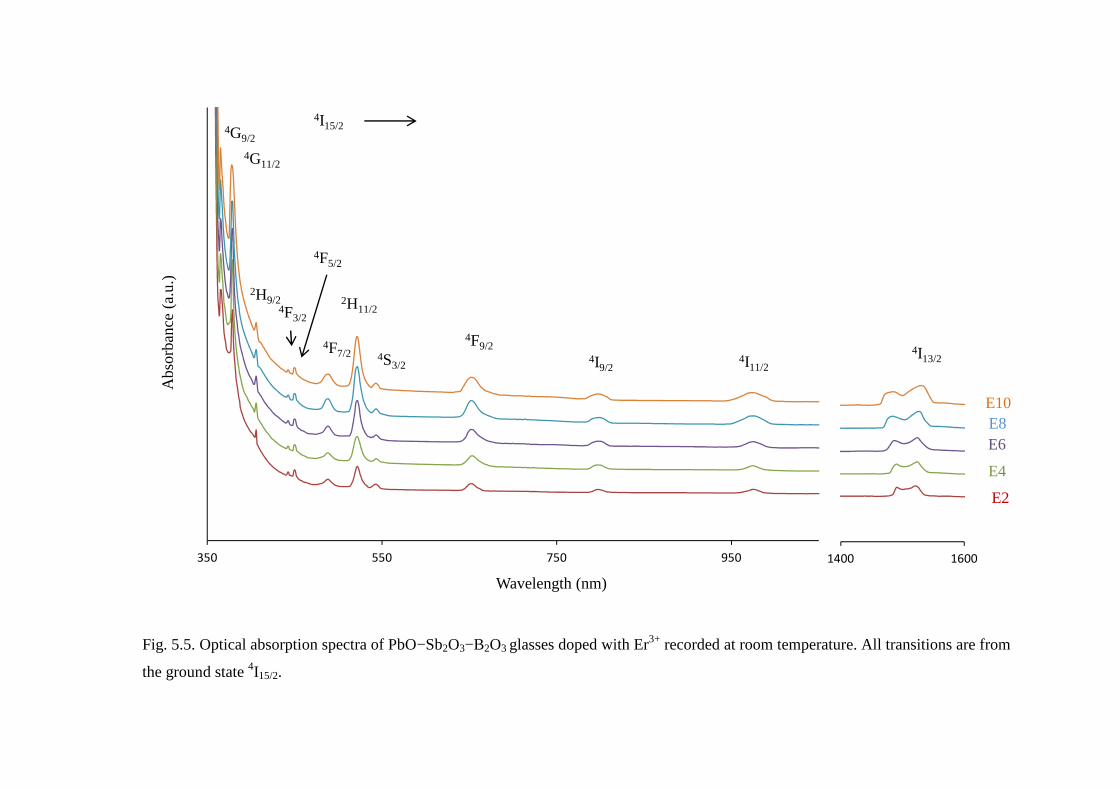
Fig. 5.5. Optical absorption spectra of PbO−Sb2O3−B2O3 glasses doped with Er3+ recorded at room temperature. All transitions are from
the ground state 4I15/2.
350 550 750 950
Abs
orba
nce
(a.u
.)
Wavelength (nm)
E10E8E6
E4
E2
4I11/24I9/2
4F9/24S3/2
2H11/2
4F7/2
4F5/2
2H9/2
4G11/2
4I15/24G9/2
4F3/2
1400 1600
4I13/2
165
Fig. 5.6 Tauc plots for evaluation of optical band gap energy of PbO-Sb2O3-B2O3 glasses doped with Er3+ ions
4
6
8
10
12
3.35
3.36
3.37
3.38
3.39 3.
4
3.41
3.42
3.43
3.44
3.45
3.46
3.47
3.48
3.49 3.
5
(αħω
)1/2
cm-1
/2eV
1/2
hν (eV)
E2E4E6E8E10
166
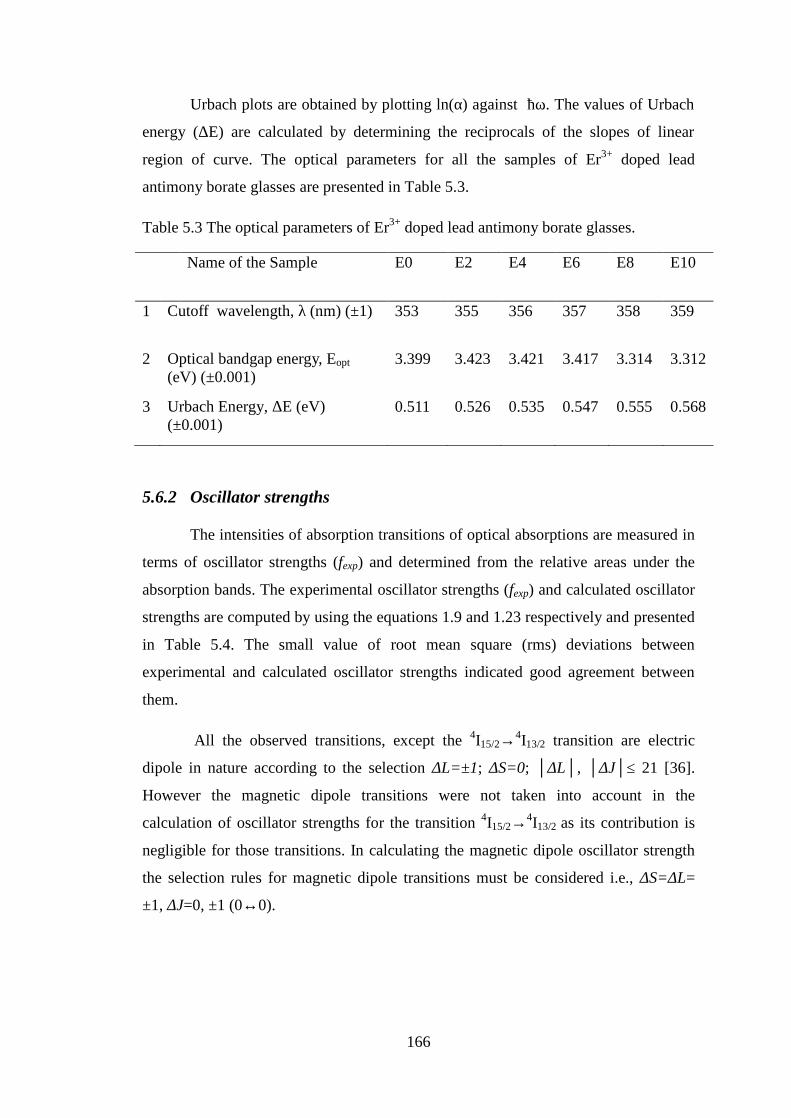
Urbach plots are obtained by plotting ln(α) against ħω. The values of Urbach
energy (ΔE) are calculated by determining the reciprocals of the slopes of linear
region of curve. The optical parameters for all the samples of Er3+ doped lead
antimony borate glasses are presented in Table 5.3.
Table 5.3 The optical parameters of Er3+ doped lead antimony borate glasses.
Name of the Sample E0 E2 E4 E6 E8 E10
1 Cutoff wavelength, λ (nm) (±1) 353 355 356 357 358 359
2 Optical bandgap energy, Eopt
(eV) (±0.001)3.399 3.423 3.421 3.417 3.314 3.312
3 Urbach Energy, ΔE (eV)(±0.001)
0.511 0.526 0.535 0.547 0.555 0.568
5.6.2 Oscillator strengths
The intensities of absorption transitions of optical absorptions are measured in
terms of oscillator strengths (fexp) and determined from the relative areas under the
absorption bands. The experimental oscillator strengths (fexp) and calculated oscillator
strengths are computed by using the equations 1.9 and 1.23 respectively and presented
in Table 5.4. The small value of root mean square (rms) deviations between
experimental and calculated oscillator strengths indicated good agreement between
them.
All the observed transitions, except the 4I15/2→4I13/2 transition are electric
dipole in nature according to the selection ΔL=±1; ΔS=0; ΔL, ΔJ≤ 21 [36].
However the magnetic dipole transitions were not taken into account in the
calculation of oscillator strengths for the transition 4I15/2→4I13/2 as its contribution is
negligible for those transitions. In calculating the magnetic dipole oscillator strength
the selection rules for magnetic dipole transitions must be considered i.e., ΔS=ΔL=
±1, ΔJ=0, ±1 (0↔0).
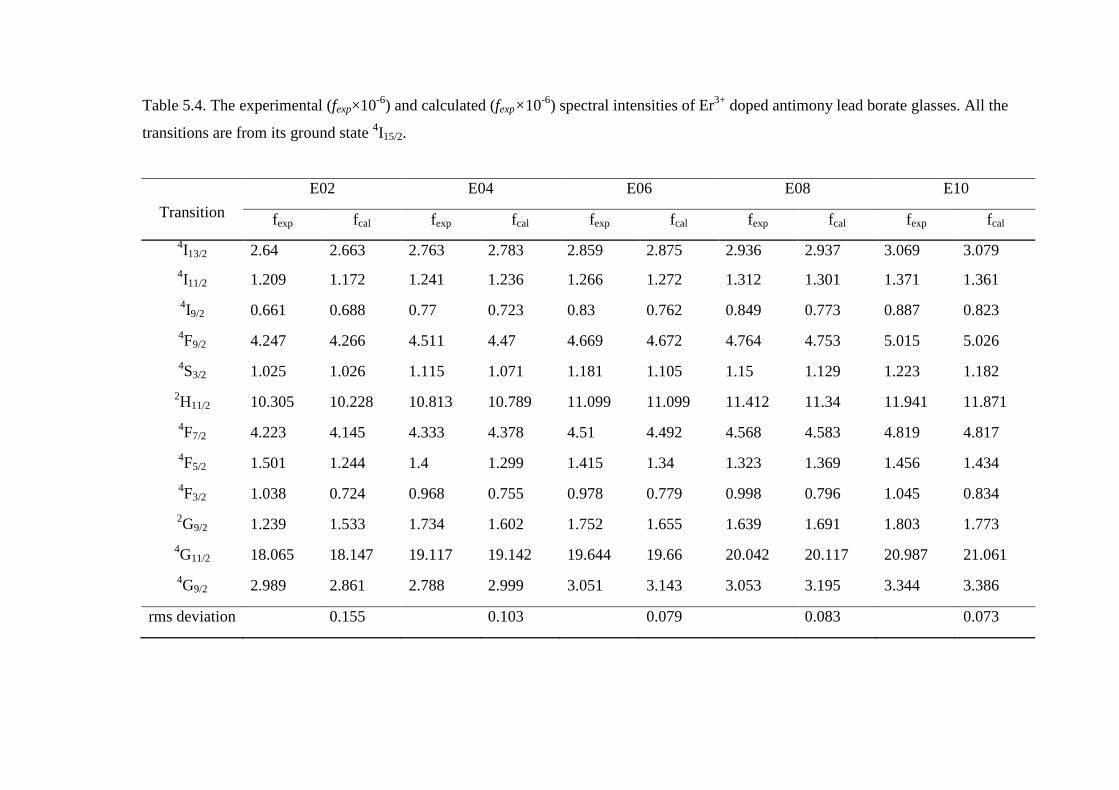
Table 5.4. The experimental (fexp×10-6) and calculated (fexp×10-6) spectral intensities of Er3+ doped antimony lead borate glasses. All the
transitions are from its ground state 4I15/2.
Transition
E02 E04 E06 E08 E10
fexp fcal fexp fcal fexp fcal fexp fcal fexp fcal
4I13/2 2.64 2.663 2.763 2.783 2.859 2.875 2.936 2.937 3.069 3.0794I11/2 1.209 1.172 1.241 1.236 1.266 1.272 1.312 1.301 1.371 1.361
4I9/2 0.661 0.688 0.77 0.723 0.83 0.762 0.849 0.773 0.887 0.823
4F9/2 4.247 4.266 4.511 4.47 4.669 4.672 4.764 4.753 5.015 5.026
4S3/2 1.025 1.026 1.115 1.071 1.181 1.105 1.15 1.129 1.223 1.182
2H11/2 10.305 10.228 10.813 10.789 11.099 11.099 11.412 11.34 11.941 11.871
4F7/2 4.223 4.145 4.333 4.378 4.51 4.492 4.568 4.583 4.819 4.817
4F5/2 1.501 1.244 1.4 1.299 1.415 1.34 1.323 1.369 1.456 1.434
4F3/2 1.038 0.724 0.968 0.755 0.978 0.779 0.998 0.796 1.045 0.834
2G9/2 1.239 1.533 1.734 1.602 1.752 1.655 1.639 1.691 1.803 1.773
4G11/2 18.065 18.147 19.117 19.142 19.644 19.66 20.042 20.117 20.987 21.061
4G9/2 2.989 2.861 2.788 2.999 3.051 3.143 3.053 3.195 3.344 3.386
rms deviation 0.155 0.103 0.079 0.083 0.073
168
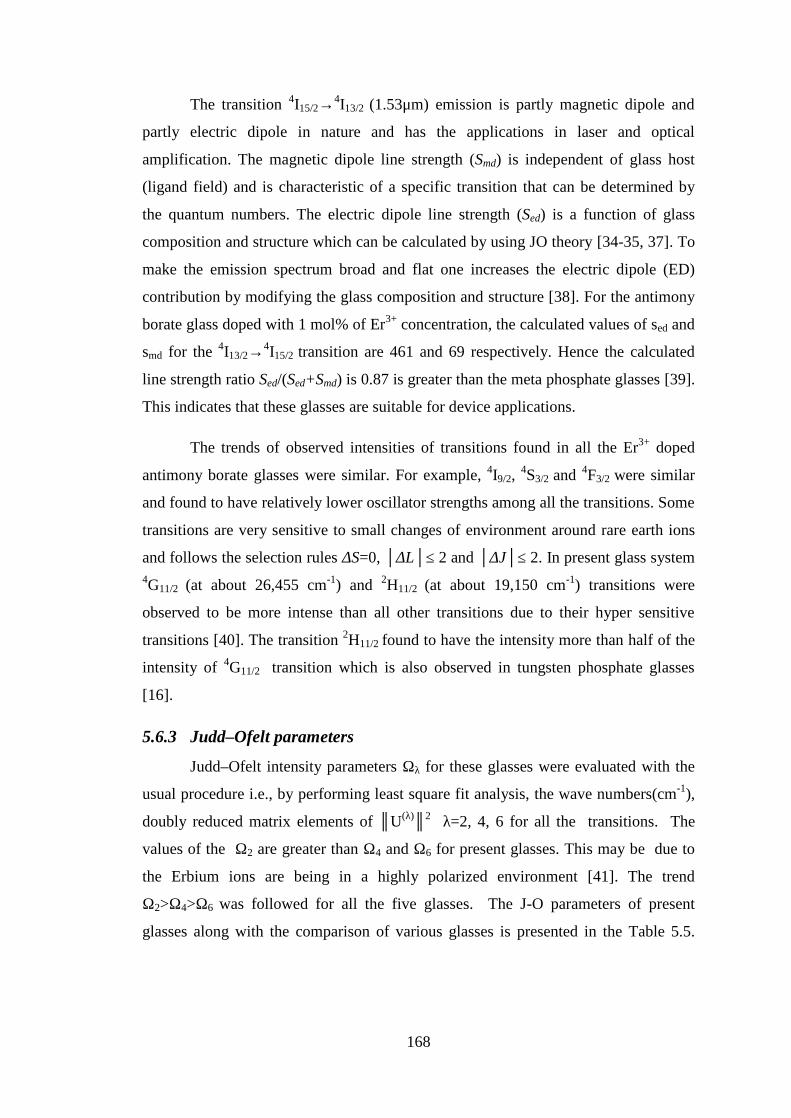
The transition 4I15/2→4I13/2 (1.53μm) emission is partly magnetic dipole and
partly electric dipole in nature and has the applications in laser and optical
amplification. The magnetic dipole line strength (Smd) is independent of glass host
(ligand field) and is characteristic of a specific transition that can be determined by
the quantum numbers. The electric dipole line strength (Sed) is a function of glass
composition and structure which can be calculated by using JO theory [34-35, 37]. To
make the emission spectrum broad and flat one increases the electric dipole (ED)
contribution by modifying the glass composition and structure [38]. For the antimony
borate glass doped with 1 mol% of Er3+ concentration, the calculated values of sed and
smd for the 4I13/2→4I15/2 transition are 461 and 69 respectively. Hence the calculated
line strength ratio Sed/(Sed+Smd) is 0.87 is greater than the meta phosphate glasses [39].
This indicates that these glasses are suitable for device applications.
The trends of observed intensities of transitions found in all the Er3+ doped
antimony borate glasses were similar. For example, 4I9/2,4S3/2 and 4F3/2 were similar
and found to have relatively lower oscillator strengths among all the transitions. Some
transitions are very sensitive to small changes of environment around rare earth ions
and follows the selection rules ΔS=0, ΔL≤ 2 and ΔJ≤ 2. In present glass system4G11/2 (at about 26,455 cm-1) and 2H11/2 (at about 19,150 cm-1) transitions were
observed to be more intense than all other transitions due to their hyper sensitive
transitions [40]. The transition 2H11/2 found to have the intensity more than half of the
intensity of 4G11/2 transition which is also observed in tungsten phosphate glasses
[16].
5.6.3 Judd–Ofelt parameters
Judd–Ofelt intensity parameters Ωλ for these glasses were evaluated with the
usual procedure i.e., by performing least square fit analysis, the wave numbers(cm-1),
doubly reduced matrix elements of U(λ)2 λ=2, 4, 6 for all the transitions. The
values of the Ω2 are greater than Ω4 and Ω6 for present glasses. This may be due to
the Erbium ions are being in a highly polarized environment [41]. The trend
Ω2>Ω4>Ω6 was followed for all the five glasses. The J-O parameters of present
glasses along with the comparison of various glasses is presented in the Table 5.5.
169
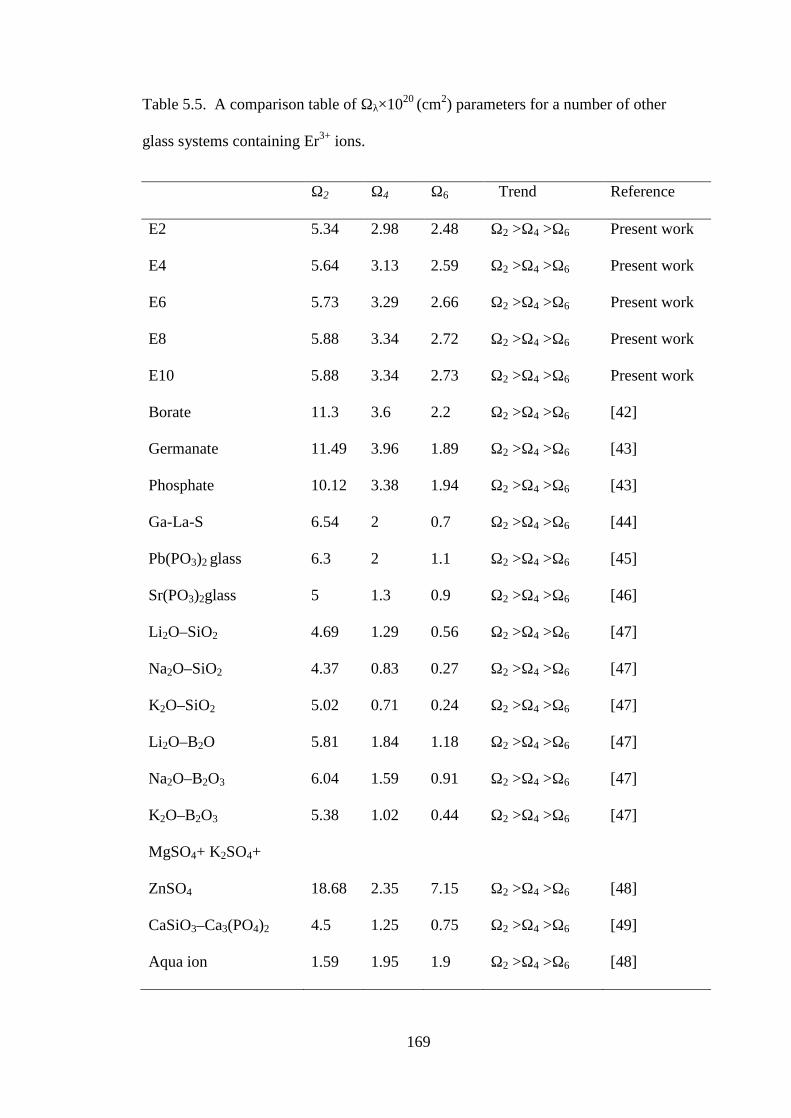
Table 5.5. A comparison table of Ωλ×1020 (cm2) parameters for a number of other
glass systems containing Er3+ ions.
Ω2 Ω4 Ω6 Trend Reference
E2 5.34 2.98 2.48 Ω2 >Ω4 >Ω6 Present work
E4 5.64 3.13 2.59 Ω2 >Ω4 >Ω6 Present work
E6 5.73 3.29 2.66 Ω2 >Ω4 >Ω6 Present work
E8 5.88 3.34 2.72 Ω2 >Ω4 >Ω6 Present work
E10 5.88 3.34 2.73 Ω2 >Ω4 >Ω6 Present work
Borate 11.3 3.6 2.2 Ω2 >Ω4 >Ω6 [42]
Germanate 11.49 3.96 1.89 Ω2 >Ω4 >Ω6 [43]
Phosphate 10.12 3.38 1.94 Ω2 >Ω4 >Ω6 [43]
Ga-La-S 6.54 2 0.7 Ω2 >Ω4 >Ω6 [44]
Pb(PO3)2 glass 6.3 2 1.1 Ω2 >Ω4 >Ω6 [45]
Sr(PO3)2glass 5 1.3 0.9 Ω2 >Ω4 >Ω6 [46]
Li2O–SiO2 4.69 1.29 0.56 Ω2 >Ω4 >Ω6 [47]
Na2O–SiO2 4.37 0.83 0.27 Ω2 >Ω4 >Ω6 [47]
K2O–SiO2 5.02 0.71 0.24 Ω2 >Ω4 >Ω6 [47]
Li2O–B2O 5.81 1.84 1.18 Ω2 >Ω4 >Ω6 [47]
Na2O–B2O3 6.04 1.59 0.91 Ω2 >Ω4 >Ω6 [47]
K2O–B2O3 5.38 1.02 0.44 Ω2 >Ω4 >Ω6 [47]
MgSO4+ K2SO4+
ZnSO4 18.68 2.35 7.15 Ω2 >Ω4 >Ω6 [48]
CaSiO3–Ca3(PO4)2 4.5 1.25 0.75 Ω2 >Ω4 >Ω6 [49]
Aqua ion 1.59 1.95 1.9 Ω2 >Ω4 >Ω6 [48]

170
From the values of Ω2 and Ω6 obtained from the absorption spectra, one can
attempt to extract information on the local interactions of Er3+ ions with the
surrounding glass network as a function of glass composition. The Ω2 parameter is
measure of the degree of covalency of the chemical bonds between Er3+ and its
nearest neighbouring atoms [50]. The Ω6 parameter increases with decreasing rigidity
of the medium and Ω6 values are usually higher for glasses than for crystals. The
Judd–Ofelt analysis therefore seems to indicate a higher covalency and lower force
constant of the Er3+ ligand bonds in our glass systems. The relatively high values of
Ω2 indicate the high degree of inhomogeneity in these glasses [13].
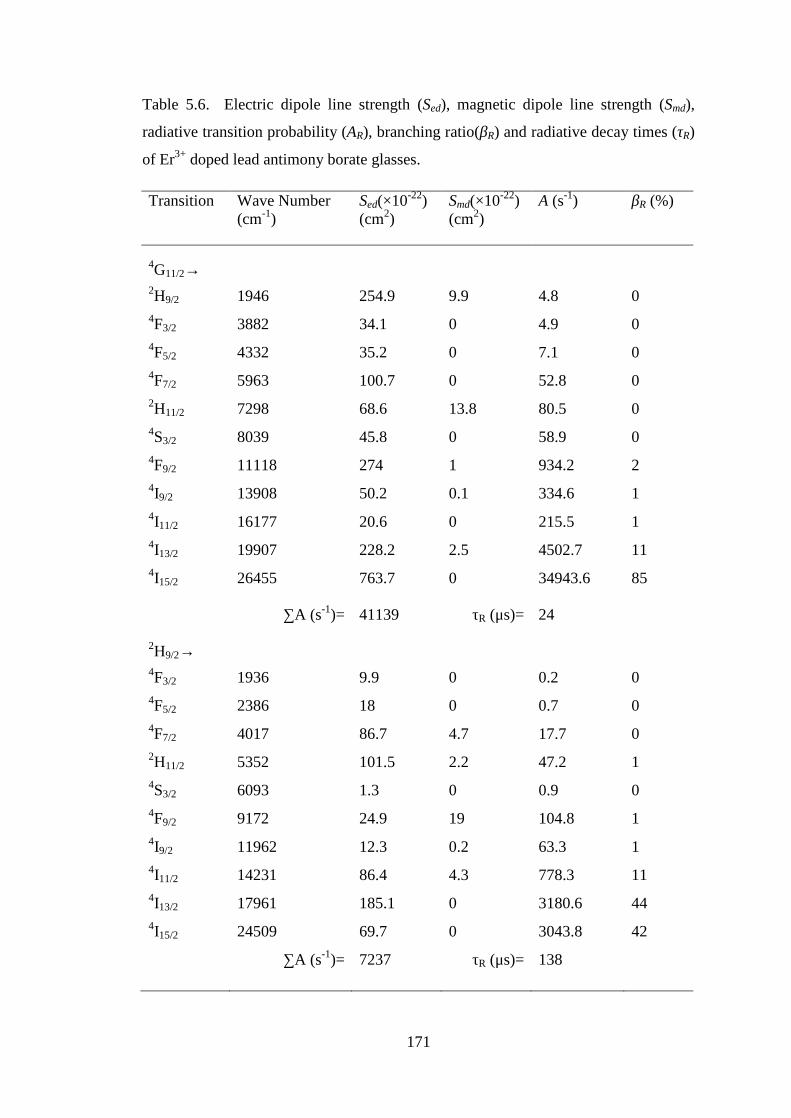
5.6.4 Radiative properties
Various radiative parameters such as electric dipole line strength (Sed), magnetic
dipole line strength (Smd), radiative transition probability (AR), total radiative transition
probabilities(AT), the radiative decay times (τR), and branching ratio(βR) of Nd3+
doped lead antimony borate glasses were calculated using the equations
1.14,1.15,1.25,1.26,1.27 and 1.29 respectively. The radiative parameters of lead
antimony borate glasses for 1% of Nd3+ are presented the Table 5.6.
The radiative properties of Re3+ ions depends upon the number of factors such
as network former and modifier of the glass. The branching ratio (βR) characteristics
the lasing power of the a transition. The intense green transition 4S3/2→4I15/2 was
found to have the branching ratio 67% indicates the potential laser transition in Er3+
doped lead antimony borate glasses.
171
Table 5.6. Electric dipole line strength (Sed), magnetic dipole line strength (Smd),
radiative transition probability (AR), branching ratio(βR) and radiative decay times (τR)
of Er3+ doped lead antimony borate glasses.
Transition Wave Number(cm-1)
Sed(×10-22)(cm2)
Smd(×10-22)(cm2)
A (s-1) βR (%)
4G11/2→2H9/2 1946 254.9 9.9 4.8 04F3/2 3882 34.1 0 4.9 04F5/2 4332 35.2 0 7.1 04F7/2 5963 100.7 0 52.8 02H11/2 7298 68.6 13.8 80.5 04S3/2 8039 45.8 0 58.9 04F9/2 11118 274 1 934.2 24I9/2 13908 50.2 0.1 334.6 14I11/2 16177 20.6 0 215.5 14I13/2 19907 228.2 2.5 4502.7 114I15/2 26455 763.7 0 34943.6 85
∑A (s-1)= 41139 τR (μs)= 24
2H9/2→4F3/2 1936 9.9 0 0.2 04F5/2 2386 18 0 0.7 04F7/2 4017 86.7 4.7 17.7 02H11/2 5352 101.5 2.2 47.2 14S3/2 6093 1.3 0 0.9 04F9/2 9172 24.9 19 104.8 14I9/2 11962 12.3 0.2 63.3 14I11/2 14231 86.4 4.3 778.3 114I13/2 17961 185.1 0 3180.6 444I15/2 24509 69.7 0 3043.8 42
∑A (s-1)= 7237 τR (μs)= 138
172
Transition Wave Number(cm-1)
Sed(×10-22)(cm2)
Smd(×10-22)(cm2)
A (s-1) βR (%)
4F5/2→4F7/2 1631 93 37.7 2.9 02H11/2 2966 74.3 0 9.6 04S3/2 3707 5.8 2.2 2.1 04F9/2 6786 185 0 285.7 44I9/2 9576 59.1 0 256.3 44I11/2 11845 35.7 0 292.9 44I13/2 15575 160.9 0 3005.1 414I15/2 22123 63.7 0 3408.6 47
∑A (s-1)= 7263 τR (μs)= 1374F7/2→2H11/2 1335 198.2 0 1.8 04S3/2 2076 2 0 0.1 04F9/2 5155 23.8 24.1 25.5 04I9/2 7945 166.2 6.6 322.4 34I11/2 10214 140 0 553.2 64I13/2 13944 120.6 0 1212.6 134I15/2 20492 230.7 0 7359.4 78
∑A (s-1)= 9475 τR (μs)= 1054S3/2→4F9/2 3079 7.1 0 1.5 04I9/2 5869 99 0 148.4 34I11/2 8138 24.3 0 97.2 24I13/2 11868 97.6 0 1210.1 274I15/2 18416 64.1 0 2970.4 67
∑A (s-1)= 4428 τR (μs)= 2254F9/2→4I9/2 2790 84.4 42.6 8.5 04I11/2 5059 409.3 17.7 164.6 44I13/2 8789 84.1 0 169.3 44I15/2 15337 327.2 0 3500.8 91
∑A (s-1)= 3843 τR (μs)= 260
173
Transition Wave Number(cm-1)
Sed(×10-22)(cm2)
Smd(×10-22)(cm2)
A (s-1) βR
(%)
4I9/2→4I11/2 2269 65.7 40.1 3.8 14I13/2 5999 207.6 0 132.9 274I15/2 12547 61 0 357.4 72
∑A (s-1)= 494 τR (μs)= 20234I11/2→ 0 0 04I13/2 3730 390.9 77.4 61 154I15/2 10278 130.6 0 350.3 85
∑A (s-1)= 411 τR (μs)= 24314I13/2→4I15/2 6548 460.8 68.8 319 100
∑A (s-1)= 318 τR (μs)= 3135
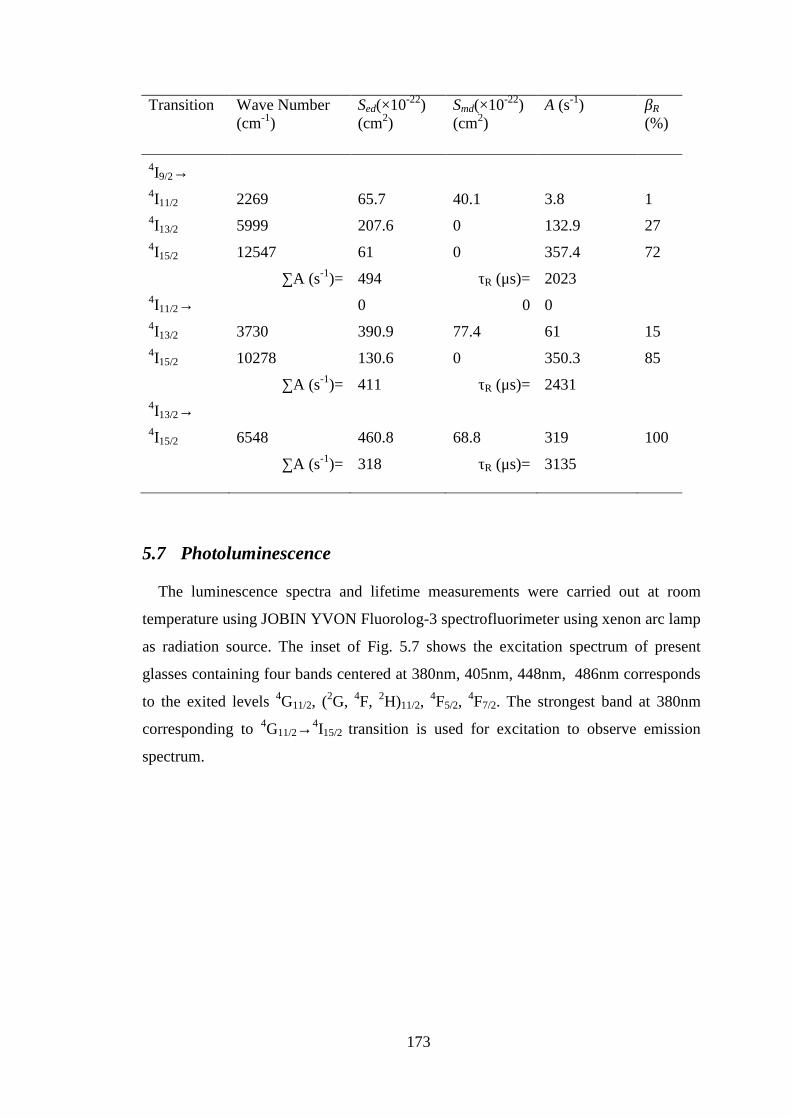
5.7 Photoluminescence
The luminescence spectra and lifetime measurements were carried out at room
temperature using JOBIN YVON Fluorolog-3 spectrofluorimeter using xenon arc lamp
as radiation source. The inset of Fig. 5.7 shows the excitation spectrum of present
glasses containing four bands centered at 380nm, 405nm, 448nm, 486nm corresponds
to the exited levels 4G11/2, (2G, 4F, 2H)11/2,4F5/2,
4F7/2. The strongest band at 380nm
corresponding to 4G11/2→4I15/2 transition is used for excitation to observe emission
spectrum.
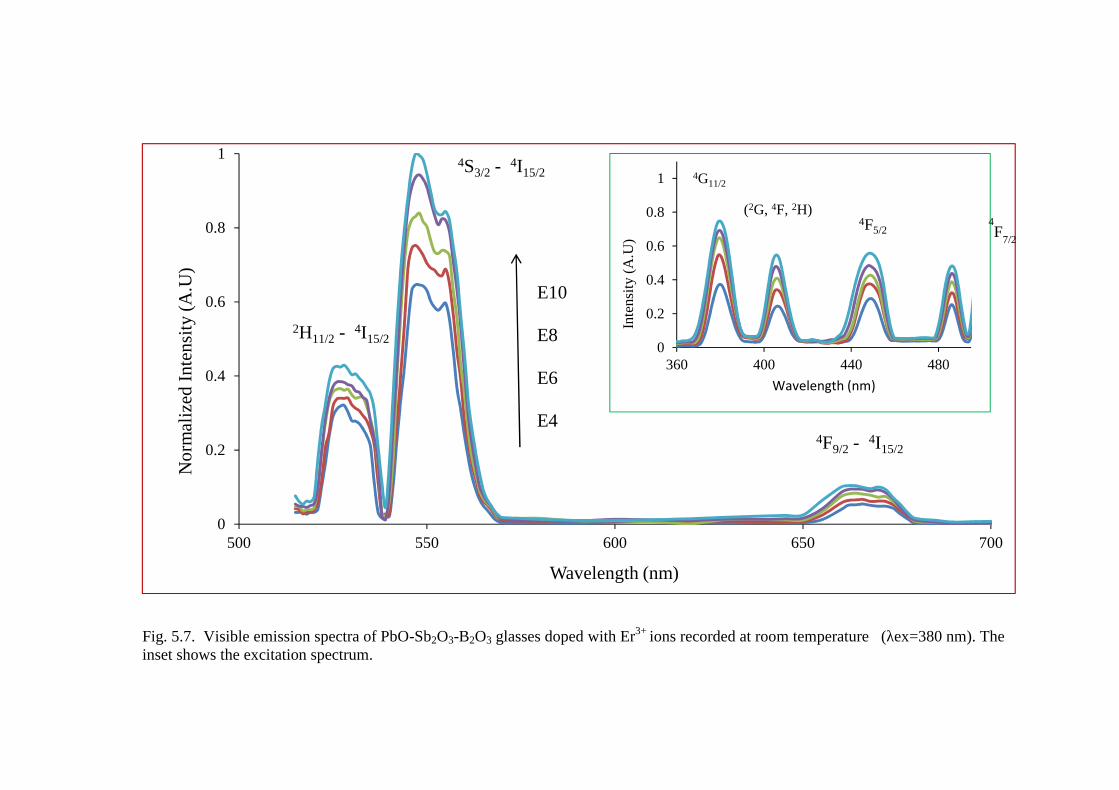
Fig. 5.7. Visible emission spectra of PbO-Sb2O3-B2O3 glasses doped with Er3+ ions recorded at room temperature (λex=380 nm). Theinset shows the excitation spectrum.
0
0.2
0.4
0.6
0.8
1
500 550 600 650 700
Nor
mal
ized
Int
ensi
ty (
A.U
)
Wavelength (nm)
2H11/2 - 4I15/2
4S3/2 - 4I15/2
4F9/2 - 4I15/2
E10
E8
E6
E4
0
0.2
0.4
0.6
0.8
1
360 400 440 480
Inte
nsit
y (A
.U)
Wavelength (nm)
4G11/2
(2G, 4F, 2H)4F5/2
4F
7/2
175
5.7.1 Visible emission
The visible emission spectra shows bands corresponding to the transitions
2H11/2→4I15/2 (526nm),4S3/2 →4I15/2 (547 nm) and4F9/2→4I15/2 ( 665 nm).
The two transitions 2H11/2→4I15/2,4S3/2→4I15/2 corresponds to bright green
emission whereas the transition due to 4F9/2→4I15/2 to a week red band. It should be
noted that the emission at 547nm (4S3/2→4I15/2) considerably broadens towards the
high energy side. It is observed that the photoluminescence intensity increases with
increase in mol% of Erbium ions. The variation of intensity of 4S3/2→4I15/2 transition
is shown in the Fig. 5.8
Fig. 5.8 Variation of intensity of 4S3/2→4I15/2 transition with mol% of Erbium ions
in PbO-Sb2O3-B2O3 : Er2O3 glasses
0.6
0.7
0.8
0.9
1
0.2 0.4 0.6 0.8 1
Inte
nsit
y (A
.U)
Mol % of Er3+
176
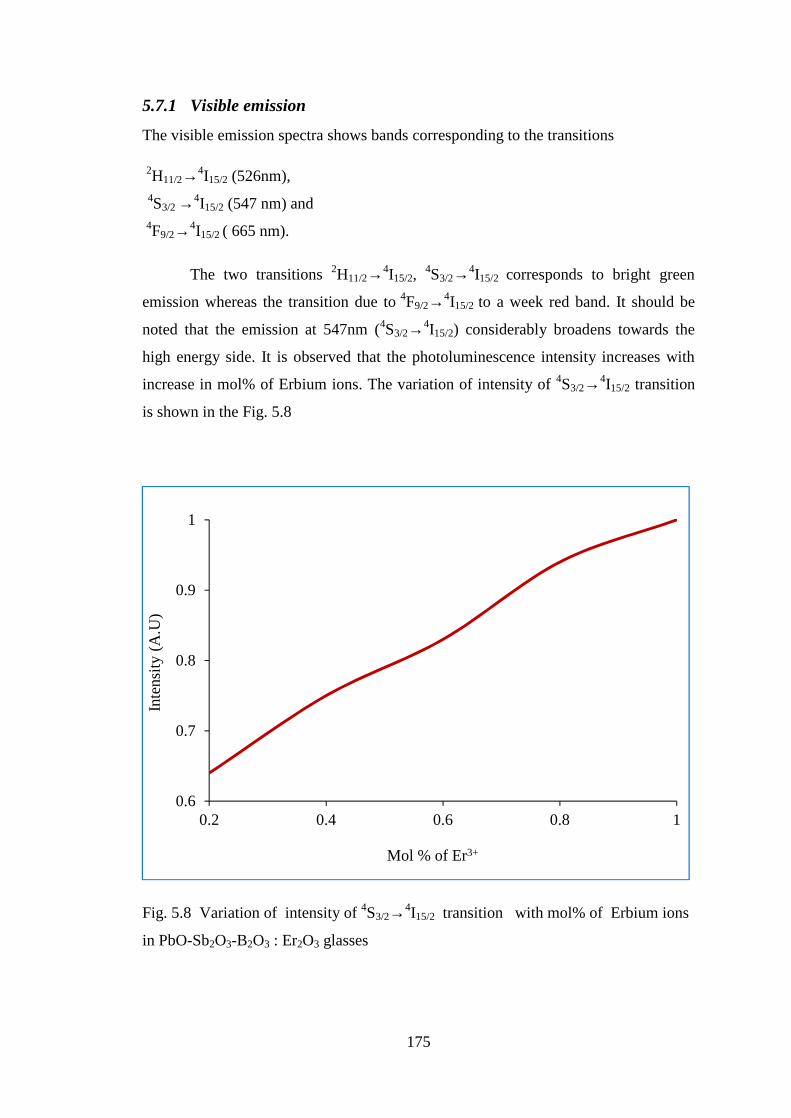
5.7.2 Energy gap calculation
Analysis based on a simple three-level system comprised of 4I15/2 (level 0),4S3/2 (level 1) and 2H11/2 (level 2) predicts that the thermalization of the 2H11/2 level can
be expressed by the following relation [33]
kT
E
gA
gA
I
Iexp
111
222
1
2
5.1
where A1 and A2 are the total spontaneous emission rates, hν1 and hν2 are the photon
energies and g1 and g2 are degeneracies (2J+1) of the 4S3/2 and 2H11/2 levels,
respectively. The I terms represent the integrated emission intensities of a given
transition at a given temperature. The ΔE is the energy gap between the 2H11/2 and4S3/2 level and k is the Boltzmann’s constant. The ratio of the degeneracies for 2H11/2
and 4S3/2 is 3 and the ratio of the photon energies is 1.04 for present glass system. The
ratios of the fluorescence intensities (I2/I1) as determined from the emission spectral
profiles (Fig. 5.). The predicted energy gaps (ΔE) between 2H11/2 and 4S3/2 levels are
calculated by using Equation 5.1 and presented in the Table 5.7. These ΔE values are
in good agreement with the average observed energy levels separation of 693 cm−1
between the 2H11/2 and 4S3/2 emission levels (Table 5.1).
Table 5.7. The predicted energy gaps (ΔE) between 2H11/2 and 4S3/2 levels of Er3+
doped lead antimony borate glasses.
Sample Energy gap(ΔE) cm-1
E2 682
E4 683
E6 682
E8 689
E10 672
5.7.3 Stimulated emission cross-section
The stimulated emission cross-section (σp) provides interesting information
about the potential laser performance of a material and it can be easily evaluated from
177
the luminescence spectrum. The stimulated emission cross-section (σp) is an important
parameter and its value signifies the rate of energy excitation from the lasing material.
From the observed emission bands, the stimulated emission cross-sections of all the
bands in emission spectra were calculated using 1.30. The emission cross-section of
different transitions of Er3+ doped lead antimony borate glasses was shown in Table
5.8.
Generally the branching ratios (βR) and the peak emission cross-sections(σem)
are high for a good potential laser transition [51]. The transition 4S3/2 →4I15/2 was
found to have the branching ratio 67% as well as good emission cross section 7.19
×10-21 cm2 indicates potential laser transition. The transition 2H11/2→4I15/2 have
comparatively larger values of emission cross-section, likely to suffer from the non
radiative process because of the small energy gap 672 cm-1 .
The emission cross-sectio σe for E10 glass at 550nm (green wavelength) is
7.19×10⁻²¹ cm2 which is more than soda lime silicate glass (σe=2.55×10⁻²¹ cm2) [52].
Similarly the σe for E10 glasses at 1531nm is found to be 6.94×10⁻²¹ cm2 which is
larger than more 4.2×10⁻²¹ cm2 for PbO-PbF2-B2O3 glasses [54] but comparable with
6.30 ×10⁻²¹ cm2 for soda lime silicate glasses [52]. In general transitions with large
stimulated emission cross-section exhibit low threshold and high gain laser operation
[39]. Hence, Er3+: lead antimony borate glasses with reasonably good stimulated
emission cross-section values are better hosts for laser applications in the green and
NIR regions and broadband amplifiers.
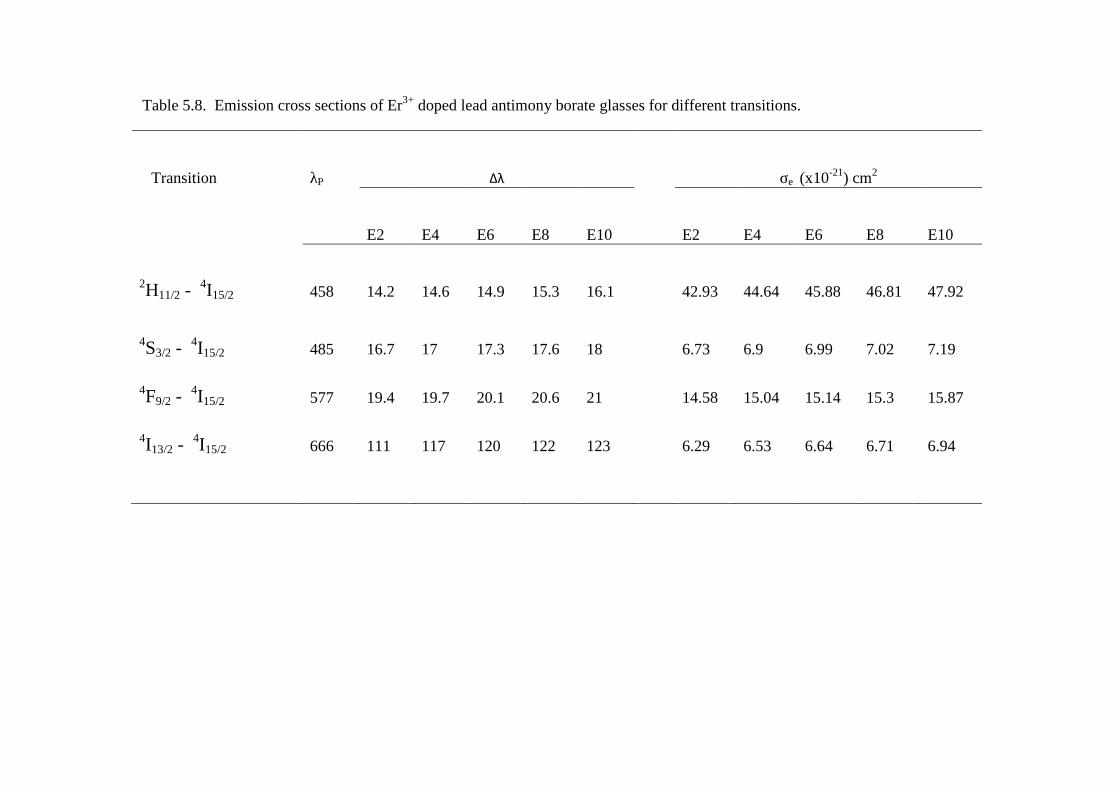
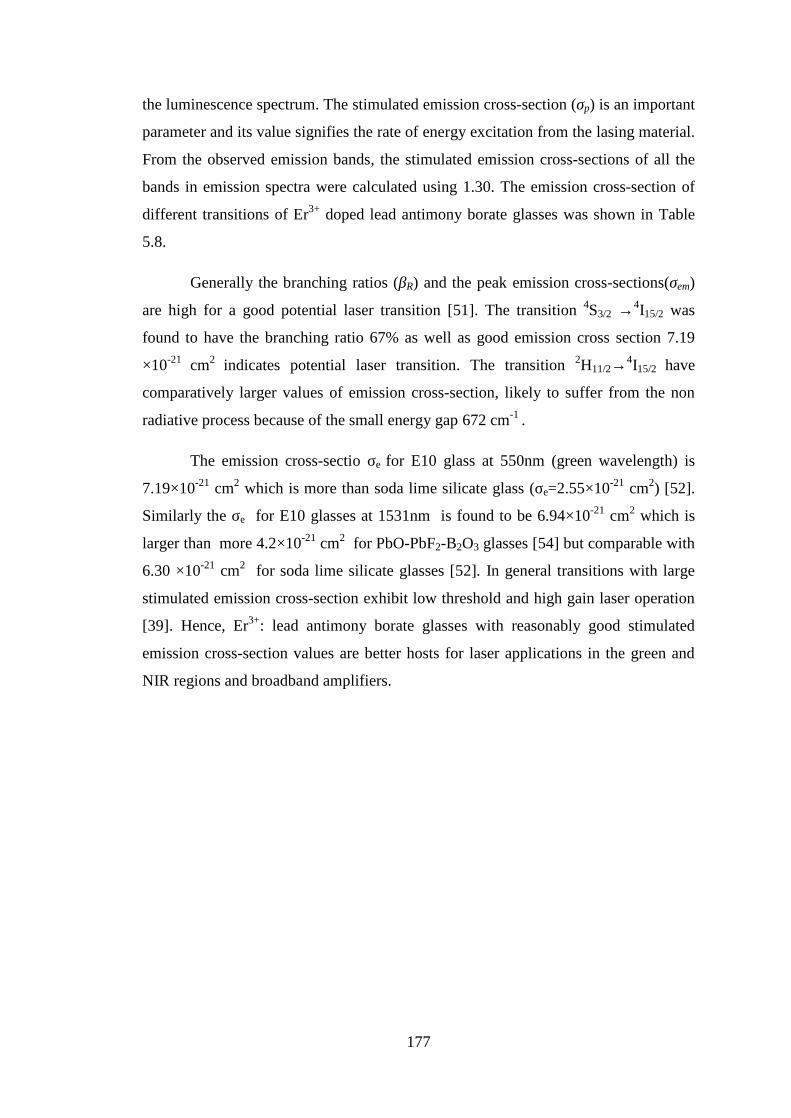
Table 5.8. Emission cross sections of Er3+ doped lead antimony borate glasses for different transitions.
Transition λP Δλ σe (x10-21) cm2
E2 E4 E6 E8 E10 E2 E4 E6 E8 E10
2H11/2 - 4I15/2 458 14.2 14.6 14.9 15.3 16.1 42.93 44.64 45.88 46.81 47.92
4S3/2 - 4I15/2 485 16.7 17 17.3 17.6 18 6.73 6.9 6.99 7.02 7.19
4F9/2 - 4I15/2 577 19.4 19.7 20.1 20.6 21 14.58 15.04 15.14 15.3 15.87
4I13/2 - 4I15/2 666 111 117 120 122 123 6.29 6.53 6.64 6.71 6.94
179
5.7.4 Near infrared emission
Fig. 5.9 shows near infrared luminescence spectra of Er3+ doped lead
antimony borate glasses. The spectral intensities were normalized with respect to the
peak intensities of E10 glass. The increase in fluorescence intensity at the higher Er3+
doped level is the evidence of absence of concentration quenching. In addition to
main peak at 1.53μm, a side peak is observed at 1.55μm. It was also observed that the
relative intensity of peak at 1.55μm increased with the concentration of Er3+ ions. The
fluorescence width at half-maximum (FWHM) increased from 111nm to 123 nm with
increasing the Er3+ ion concentration from 0.2% to 1%.
Because of the overlap of the absorption and emission spectra of Er3+ ions at
1.53 μm, the broadening trend with increasing Er3+ doped concentration should
mainly be attributed to the radiation trapping [55-59]. The radiation trapping
inevitably induces that the emission intensity at the bands located at lower energies
with respect to the peak wavelength of 1531nm increases accordingly, and then it
leads to a broadening of the emission spectrum. The radiation trapping always occurs
in a typical three-level system when the absorption and emission spectra overlap [56-
59].The radiation trapping effect is in proportion to the Er 3+ doped concentration.
180
Fig. 5.9 Normalized fluorescence near infrared spectra of lead antimony glasses withdifferent Er2O3 doping contents. λexc=980 nm.
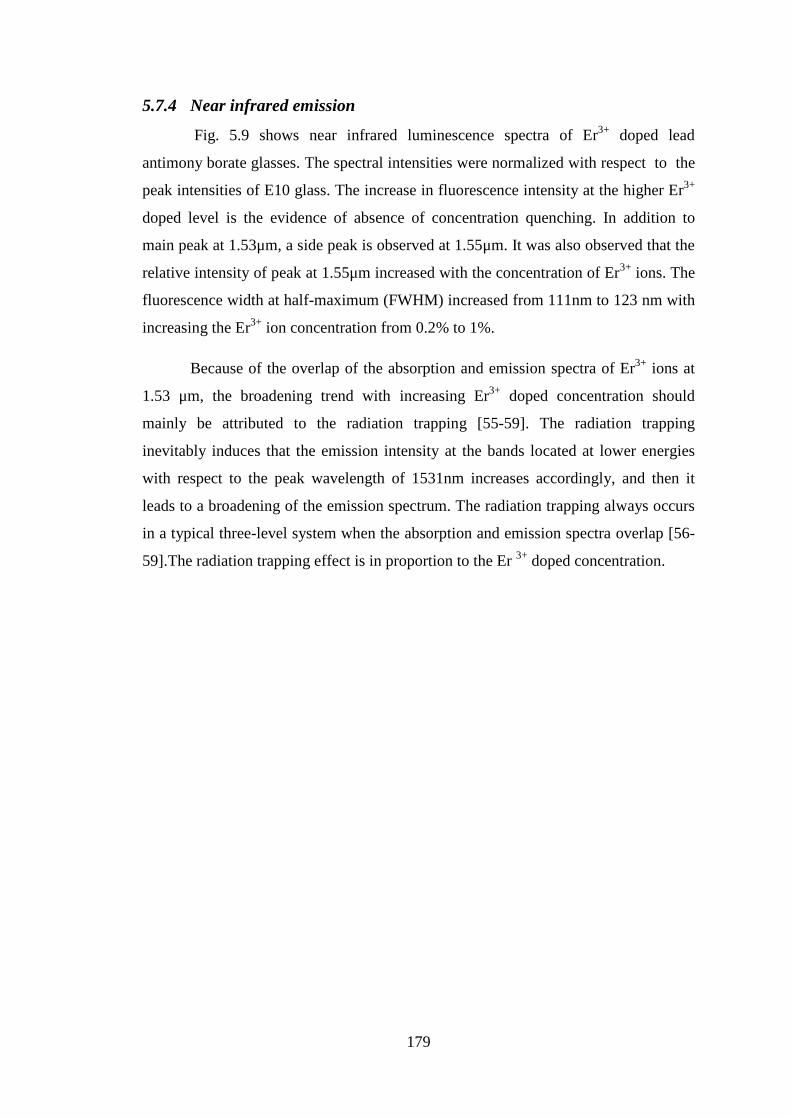
Fig. 5.10 Cross-section (absorption and emission) of 4I13/2 → 4I15/2 transition of PbO-
Sb2O3-B2O3-Er2O3 glasses for 1 mol% of Er3+ ions
0
0.2
0.4
0.6
0.8
1
1.2
1400 1450 1500 1550 1600 1650 1700
Nor
mal
ized
Int
ensi
ty (
AU
)
Wavelegth (nm)
4I13/2 - 4I15/2
E10E8E6E4E2
0
1
2
3
4
5
1400 1450 1500 1550 1600 1650 1700
Cro
ss-s
ecti
on (
×10
-21
cm2)
Wavelength (nm)
absorption
Emission
181
To obtain the intrinsic 1.53μm emission spectrum free from re-absorption, the
emission spectra of Er3+ ions were calculated according to the reciprocity method of
McCumber- Miniscalco [60-61], which relates the absorption and emission cross-
sections by
Nl
IIa
)/log(303.2 0 5.2
where N is concentration of 1mol% Er3+ ions (0.56x10²¹ ions/cm3) and l is thickness
of sample in cm and log(I0/I) is optical density or at absorbance at wavelength λ. The
absorption and emission cross sections of the 4I15/2→ 4I13/2 for 1 mol% of Er3+ ions
were shown in the Fig. 5.10. From Fig. 5.10 it is clear that the peaks of absorption and
stimulated emission cross-section of Er3+ are at 1531 nm (λp). At wavelengths longer
than λp, Me is higher than σa and for lower wavelengths M
e is smaller than σa.
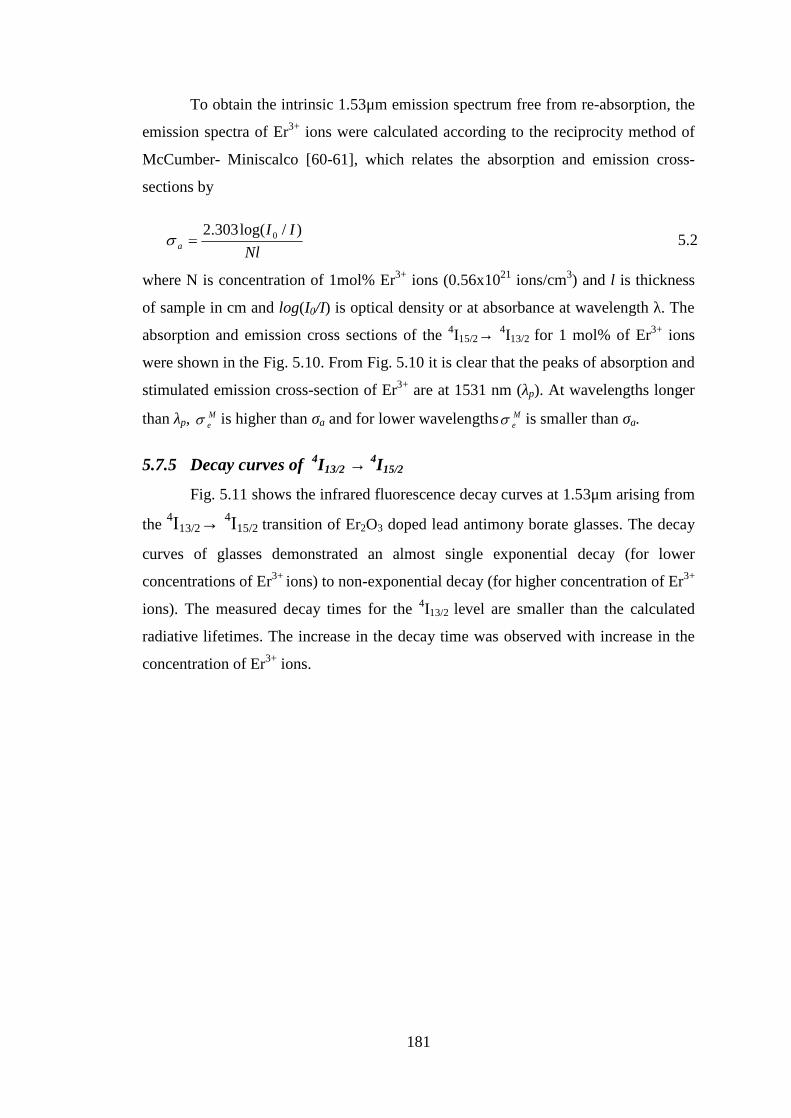
5.7.5 Decay curves of 4I13/2 → 4I15/2
Fig. 5.11 shows the infrared fluorescence decay curves at 1.53μm arising from
the 4I13/2→ 4I15/2 transition of Er2O3 doped lead antimony borate glasses. The decay
curves of glasses demonstrated an almost single exponential decay (for lower
concentrations of Er3+ ions) to non-exponential decay (for higher concentration of Er3+
ions). The measured decay times for the 4I13/2 level are smaller than the calculated
radiative lifetimes. The increase in the decay time was observed with increase in the
concentration of Er3+ ions.
182
Fig. 5.11. Luminescent decay curves of 4I13/2→ 4I15/2 transition in Er3+ doped leadantimony borate glasses. λexc = 980 nm.
0
0.02
0.04
0.06
0.08
0.1
0.12
0.14
0.16
0.18
0.2
0 1000 2000 3000 4000 5000
Inte
nsit
y (a
rb.u
nit)
Time (μs)
E2
E4
E6
E8
E10
183
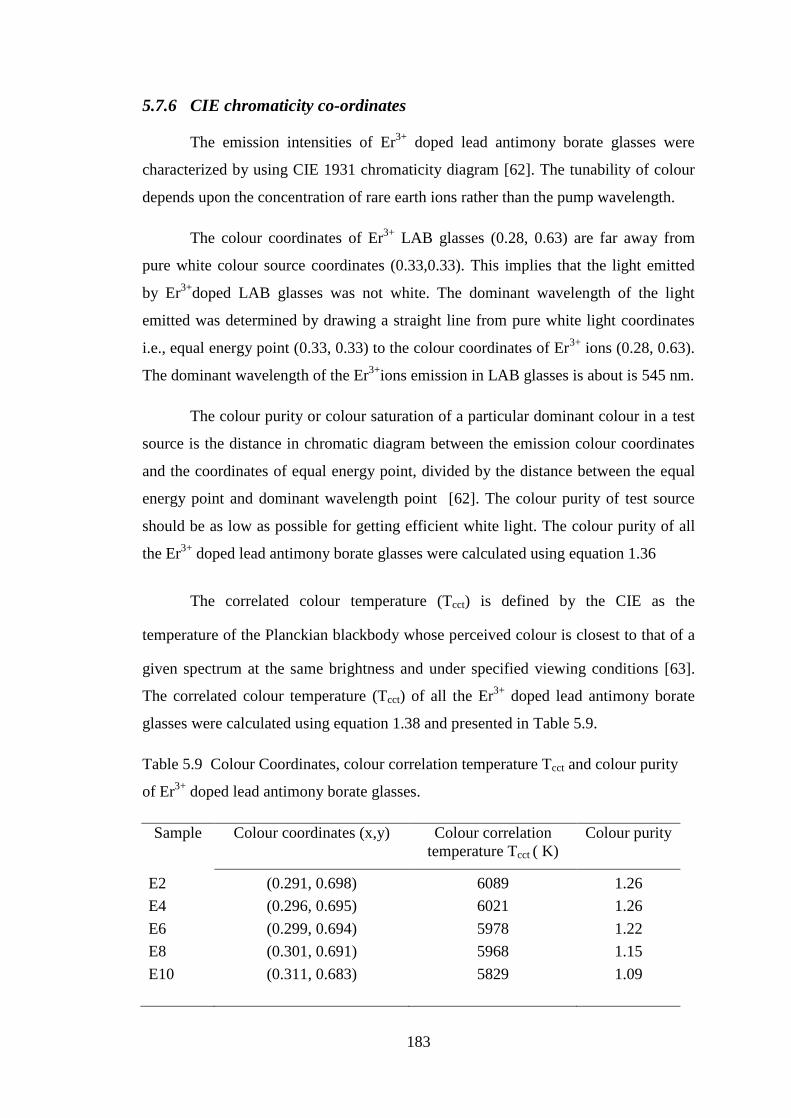
5.7.6 CIE chromaticity co-ordinates
The emission intensities of Er3+ doped lead antimony borate glasses were
characterized by using CIE 1931 chromaticity diagram [62]. The tunability of colour
depends upon the concentration of rare earth ions rather than the pump wavelength.
The colour coordinates of Er3+ LAB glasses (0.28, 0.63) are far away from
pure white colour source coordinates (0.33,0.33). This implies that the light emitted
by Er3+doped LAB glasses was not white. The dominant wavelength of the light
emitted was determined by drawing a straight line from pure white light coordinates
i.e., equal energy point (0.33, 0.33) to the colour coordinates of Er3+ ions (0.28, 0.63).
The dominant wavelength of the Er3+ions emission in LAB glasses is about is 545 nm.
The colour purity or colour saturation of a particular dominant colour in a test
source is the distance in chromatic diagram between the emission colour coordinates
and the coordinates of equal energy point, divided by the distance between the equal
energy point and dominant wavelength point [62]. The colour purity of test source
should be as low as possible for getting efficient white light. The colour purity of all
the Er3+ doped lead antimony borate glasses were calculated using equation 1.36
The correlated colour temperature (Tcct) is defined by the CIE as the
temperature of the Planckian blackbody whose perceived colour is closest to that of a
given spectrum at the same brightness and under specified viewing conditions [63].
The correlated colour temperature (Tcct) of all the Er3+ doped lead antimony borate
glasses were calculated using equation 1.38 and presented in Table 5.9.
Table 5.9 Colour Coordinates, colour correlation temperature Tcct and colour purity
of Er3+ doped lead antimony borate glasses.
Sample Colour coordinates (x,y) Colour correlationtemperature Tcct ( K)
Colour purity
E2 (0.291, 0.698) 6089 1.26
E4 (0.296, 0.695) 6021 1.26
E6 (0.299, 0.694) 5978 1.22
E8 (0.301, 0.691) 5968 1.15
E10 (0.311, 0.683) 5829 1.09
184
Fig. 5.12 Colour chromatic diagram of lead antimony borate glasses doped with
1 mol% concentration of rare earth ions.
6 Conclusions
Lead antimony borate glasses with different concentrations of erbium were
prepared by the conventional melt quenching method. The amorphous (glass) nature
was confirmed by the characterization techniques such as X-ray diffractograms and
DSC traces.
The various physical parameters of the samples were calculated and analysed.
The density of the glasses increased with increase in the mol% of rare earth ions
almost linearly because; the high dense rare earth ions are replacing low dense B2O3.
In general the density and molar volume show opposite behaviour and the same thing
is reflected here. The molar volume of the glass samples is decreasing with increase in
the erbium concentration. The oxygen packing density of the samples was increased
with increase in the mol% of rare earth ions. Refractive index of the samples
increased with increase in concentration whereas molar refraction and polarizability
are decreased.
185
Fourier transform infrared spectra PbO-Sb2O3-B2O3: Er2O3 glasses exhibited
five conventional bands at 1330 cm-1 (BO3 units), 1050 cm-1 (BO4 units), 688 cm-1
(bending vibrations of B-O-B linkages) , 930 cm-1 (1 vibrational band of SbO3) and
462 cm-1 (PbO4 structural groups).
The optical absorption spectra of Er3+ doped lead antimony borate glasses
have exhibited twelve absorption bands. All the bands were identified according to
Carnall. Cut off wavelength is shifted to higher wavelength with increase in Er3+ ion
concentration. The optical band gap is found to decrease gradually with increase in
the concentration of rare earth ions whereas Urbach energy is increasing. Except the4I15/2→4I13/2, all the transition are electric dipole in nature according to the selection
ΔL=±1; ΔS=0; ΔL, ΔJ≤ 21. The transition 4I15/2→4I13/2 (1.53μm) emission is
partly magnetic dipole and partly electric dipole in nature.
Oscillator strengths (OS) for various transitions have been calculated using
J-O theory. Good agreement between experimental and calculated OS has been
achieved, demonstrating the applicability of JO theory. The Judd-Ofelt parameters
shows the trend Ω2>Ω4>Ω6 for all the samples. The relatively high values of Ω2
indicate the high degree of inhomogeneity in these glasses.
Electric dipole line strength (Sed), magnetic dipole line strength (Smd),
radiative transition probability (AR), branching ratio (βR) and radiative decay times
(τR) were calculated for all the samples. The intense green transition 4S3/2 →4I15/2 is
found to have the branching ratio 67%. The visible luminescence spectra shows three
transitions, 2H11/2 →4I15/2,4S3/2→ 4I15/2 (bright green emission) and 4F9/2 → 4I15/2(week
red emission).
The transition 4S3/2→4I15/2 is found to have the branching ratio 67% as well as
good emission cross section 7.19 ×10⁻²¹ cm2 indicates potential laser transition. The
transition 2H11/2→4I15/2 have comparatively larger values emission cross-section, likely
to suffer from the non radiative process because of the small energy gap 672 cm-1.
The near infrared luminescence spectra of Er3+ doped lead antimony borate
glasses showed a band 4I13/2 → 4I15/2 (1.53 μm). Stimulated emission cross section (σE)
and absorption cross section (σa) were evaluated. Peaks of absorption cross section
and stimulated emission cross-section coincides at 1531nm (λp). At wavelengths
186
longer than λp, Me is higher than σa and for lower wavelengths M
e is smaller than σa.
Fluorescence decay curves were recorded for 4I13/2→4I15/2 transition for all the
samples. The measured decay times for the 4I13/2 level are smaller than the calculated
radiative lifetimes.
CIE Chromatic coordinates were calculated for the emission spectra of all the
samples of Er3+ doped lead antimony borate glasses. The colour coordinates of Er3+
LAB glasses (0.28, 0.63) are far away from pure white colour source coordinates
(0.33, 0.33). This implies that the light emitted by Er3+doped LAB glasses are not
white. The dominant wavelength of the Er3+ions emission in LAB glasses is about
545nm (green).
187
References
[1] E. Desurvire, Sci. Am. 266 (1992) 96.
[2] A.M Glass, Phys.Today 46 (1993) 34.
[3] E. Desurvire, Phys.Today 47 (1994) 20.
[4] E Desurvire, J.R. Simson and P.C. Becker, Opt Lett.12, (1987) 888.
[5] R.J.Mears, L.Reekie, I.M. Jauncev and D.N. Paynee, Electron. Lett 23 (1987)1026.
[6] R. Reisfeld and Y. Eckstein, Solid State Commun. 13 (1973) 265.
[7] G. Ajithkumar, P. K. Gupta, G. Jose, N. V. Unnikrishnan, J. Non-Cryst. Solids,275 (2000) 93.
[8] P. Nuemec, B. Frumarovua, M. Frumar, J. Non-Cryst. Solids 270 (2000) 137.
[9] K. B. Yatsimirskii, N. K. Davidenko, Coord. Chem. Rev. 27 (1979) 223.
[10] G. Boulon, M. Bouderbala, J. Seriot, J.Less-common Mets, 112 (1985) 41.
[11] Q. Su, Z. Pei, L. Chi, H. Zhang, Z. Zhang, F. Zou, J. Alloys Compds, 92 (1993)25.
[12] E. W. J. L. Oomen, P. M. T. Le Gall, and A. M.A. Van Dongen, J. Non-Cryst.Solids,111 (1989) 205.
[13] K. Hirao, S. Todoroki, N. Soga, J. Non-Cryst. Solids,175 (1994) 263.
[14] L. Rama Moorthy, T. Srinivasa Rao, K. Janardhnam, A. Radhapathy,Spectrochimica Acta Part A 56 (2000) 1759.
[15] Laercio Gomes, Michael Oermann, Heike Ebendorff-Heidepriem, DavidOttaway, Tanya Monro, Andre Felipe Henriques Librantz and Stuart Jackson,Journals Of Applied Physics 110 (2011) 083111.
[16] P.Subbalaxmi, N.Veeraiah, Journals of physics and chemistry of solids 64 (2003)1027.
[17] P.Babu , HyoJinSeo , C.R.Kesavulu , Kyoung Hyuk Jang , C.K.Jayasankar,Journal ofLuminescence129 (2009) 444.
188
[18] Gerlas N. van den Hoven, Jan A. van der Elsken, Albert Polman, Cor van Dam,Koos W. M. van Uffelen, and Meint K. Smit, APPLIED OPTICS 36, (1997) 232.
[19] Atsunobu Masuno, Hiroyuki Inoue, Yoshihiro Saito, Optical Materials 33 (2011)1898.
[20] F. Ondracek, L. Salavcova, M. Míka, J. Spirkova, J. Ctyroky, MeasurmentScience Review 5 (2005) 451.
[21] S. Marjanovic, J. Toulouse , H. Jain , C. Sandmann, V. Dierolf , A.R. Kortan , N.Kopylov and R.G. Ahrens, Journal of Non-Crystalline Solids 322 (2003) 311–318.
[22] ZHOU Ya-xun , XU Xing-chen , CHEN Fen , LIN Jian-hui , and YANG Gaobo,Optoelectronics Letters, 8 (2012) 273.
[23] Shiqing Xu , Zhongmin Yang , Shixun Dai , Guonian Wang, Lili Hu a,Zhonghong Jiang, Journal of Non-Crystalline Solids 347 (2004) 197.
[24] W.A. Pisarski , T. Goryczka, J. Pisarska , G. Dominiak-Dzik, W. Ryba-Romanowski, Journal of Non-Crystalline Solids 354 (2008) 492.
[25] Kaushal Kumar, S.B. Rai, D.K. Rai, Spectrochimica Acta Part A 66 (2007) 1052.
[26] Wilfried Blanc, Bernard Dussardier, Gerard Monnom, Romain Peretti, Anne-Marie Jurdyc, Bernard Jacquier, Marie Foret and Ann Roberts, Applied Optics48, 31 (2009) 119.
[27] Xiyan Li, Zhenjun Si, Chengling Pan, Liang Zhou, Zhefeng Li, Xiaona Li, JinkuiTang, Hongjie Zha, Inorganic Chemistry Communications 12 (2009) 675.
[28] C.H. Dong , Y. Yang , Y.L. Shen , C.L. Zou , F.W. Sun, H. Ming , G.C. Guo ,Z.F. Han, Optics Communications 283 (2010) 5117.
[29] C. Laxmi Kanth, B.V. Raghavaiah, B. Appa Rao, N. Veeraiah, Journal ofLuminescence 109 (2004) 193.
[30] Hiroki Yamauchi , Yasutake Ohishi, Optical Materials 27 (2005) 679.
[31] W.T. Carnall, P.R. Fields, K. Rajak, J. Chem. Phys. 49 (1968) 4424.
[32] G.H. Dieke, spectra and energy levals of rare earth ions in crystals.Intersciences, New York, 1968.
[33] T. Satyanarayana, I.V. Kityk, M. Piasecki, P. Bragiel, M.G. Brik, N.Veeriah, J.
189
Phys. Cond. Matter 21 (2009) 245104.
[34] B.R. Judd, Phys. Rev. 127 (1962) 750.
[35] G.S. Ofelt, J. Chem. Phys. 37 (1962) 511.
[36] D. C. Yeh, W. A. Sibley, M. Suscavage, and M. G. Drexhage, J. Appl.Phys. 62(1987) 266.
[37] C. Gorller-Walrand, K. Binnemans, in: K.A. Gschneidner, L. Eyring (Eds.),Handbook on the Physics and Chemistry of Rare Earths, vol. 25 (1998) 101.
[38] H. Chen, Y.H. Liu, Y.F. Zhou, Z.H. Jiang, J. Alloys Compds. 397 (2005) 286.
[39] P. Babu, H.J. Seo, K.H. Jang, R. Balakrishnaiah, C.K. Jayasankar, K.S. Lim,V.Lavin, J. Opt. Soc. Am. B 24 (2007) 2218.
[40] J. Porque, S. Jiang, B.C. Hwang, V. Fufligin, E. Salley, J. Zao, N.Peyghambarian, Proc. SPIE 3942 (2000) 60.
[41] R.D. Peacock, Struct. Bonding, 22 (1975) 83.
[42] R. Reisfeld, Electrochem. Soc. 131 (1984) 1360.
[43] F. Auzel , Ann. Telecommun. Soc. 24 (1969) 199.
[44] C.C.Ye, M.Hempstead, D.W.Hewak, D.N.Payne, J Non-Cryst. Solids 208 (1996)56.
[45] M. Ingeletto, M. Bettinelli, L. Di Sipi, Inorg.Chim. Acta 188 (1991) 201.
[46] S. Zaccaria, M. Casarin, A. Speghini, D. Ajo and M. Bettinelli.,Spectrochim.Acta A 55 (1999) 171.
[47] H. Takebe, Y. Nageno, K. Morinaga, J. Am. Ceram. Soc. 77 (1994) 2132.
[48] Y. Subramanyam, L.R. Moorthy, S.V.J. Lakshman, Mater. Lett. 91 (1988) 46.
[49] J.A. Pardo, J.J. Pena, R.I. Merino, R. Cases, A. Larrea, V.M. Orera, J. Non-Cryst.Solids 298 (2002) 23.
[50] M. D. Shinn, W. A. Sibley, M. G. Drexhage, and R. N. Brown, Phys.Rev. B 27(1983) 6635.
[51] C.K. Jorgensen R. Reisfeld, Lasers and Excited States of Rare Earths, Springer-Verlag, New York, 1977.
190
[52] Y.K. Sharma, S.S.L. Surana, R.K. Singh, R.P. Dubedi, Opt. Mater. 29 (2007)598.
[53] P. Babu, H.J. Seo, K.H. Jang, R. Balakrishnaiah, C.K. Jayasankar, K.S. Lim,V.Lavin, J. Opt. Soc. Am. B 24 (2007) 2218.
[54] L.R.P. Kassab, L.C. Courrol, R. Seragioli, N.U. Wetter, S.H. Tatumi, L. Gomes,J. Non-Cryst. Solids 348 (2004) 94.
[55] N. Jaba, H. Ben Mansour, A. Kanoun, A. Brenier and B.Champagnon, J. Lumin.129 (2009) 270.
[56] S. X. Dai, C. L. Yu, G. Zhou, J. J. Zhang, G. N. Wang and L.L. Hu, J. Lumin.117 (2006) 39.
[57] H. Desirena, E. De la Rosa, L. A. Diaz-Torres and G. A. Kumar, Opt. Mater. 28(2006) 560.
[58] S. X. Dai, L. J. Lu, T. F. Xu, X. Shen and X. S. Wang, J. Non Cryst. Solids 353(2007 )2744.
[59] P. R. Ehrmann and J. H. Campbell, J. Am. Ceram. Soc. 85 (2002) 1061.
[60] D. E. McCumber, Phys. Rev. 136 (1964) 954.
[61] W. J. Miniscalco and R.S. Quimby, Opt. Lett. 16 (1991) 258.
[62] E.Fred Schubert, Light emiting diodes, 2nd (Eds.), Cambridge Univesity Press,New York (2006) 292.
![(PME-PBO (PME-PBO$BSEMFTTvmobile.topica.ne.jp/ebook/pdf/goldloan.pdf(PME-PBO (PME-PBO$BSEMFTT ~ª E Å çÅé ï yyyyyÍ ~ª E Å çÅé ï Åèµ] b ;¨ Å] b ;w ²t Ù c± ï j Øw]](https://img.pdfslide.us/doc/110x75/5cdb825888c99386458cc987/pme-pbo-pme-pbo-pme-pbo-pme-pbobsemftt-a-e-a-cae-i-yyyyyi-a-e-a.jpg)