Embed Size (px)
Citation preview

Laser spectroscopic study of ozone in the 100←000 band for the SWIFT instrument
M. Guinet, C. Janssen, D. Mondelain, C. Camy-PeyretLPMAA, CNRS- UPMC (France)
18/06/2010

Importance of ozone in terrestrial atmosphere
• In the stratosphere: UV filter for solar radiation• Key role in tropospheric chemistry (OH radical precursor)• Green house gas
Studied by a large palette of instruments (UV spectrophotometer, Dobson spectrometer, FTIR…)
1% uncertainty for intensity is required for atmospheric applications (reactive gas!)
Comparison of published data sets → several % inconsistencies for intensities (10 µm bands)
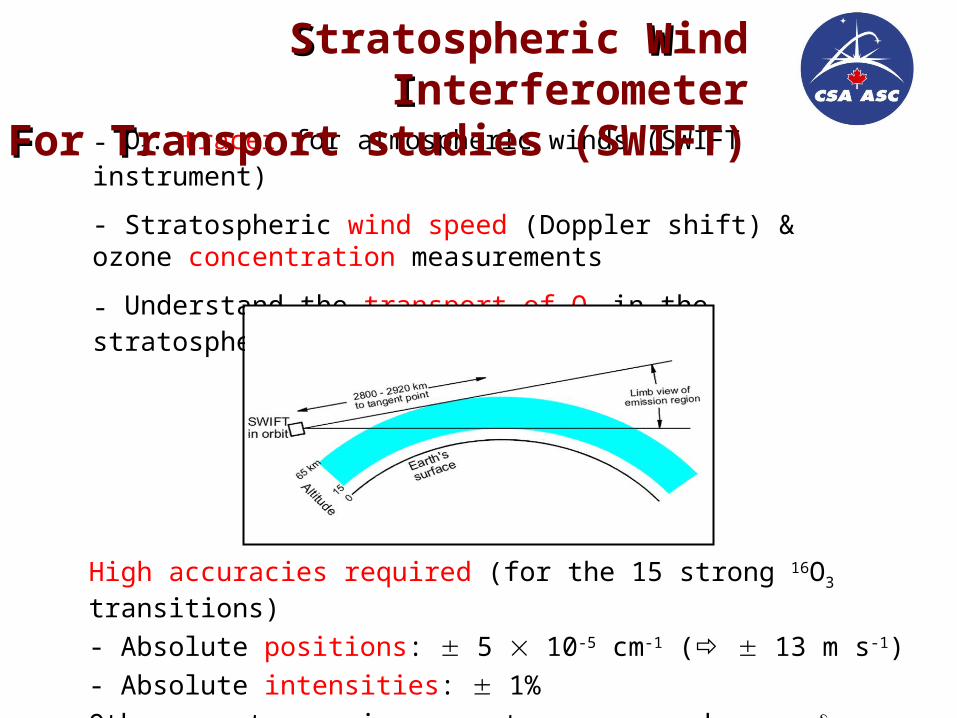
- O3: tracer for atmospheric winds (SWIFT instrument)
- Stratospheric wind speed (Doppler shift) & ozone concentration measurements
- Understand the transport of O3 in the stratosphere
High accuracies required (for the 15 strong 16O3 transitions)
- Absolute positions: 5 10-5 cm-1 ( 13 m s-1)
- Absolute intensities: 1%
Other spectroscopic parameters measured: air, air, self
SStratospheric WWind IInterferometerFFor TTransport studies (SWIFT)

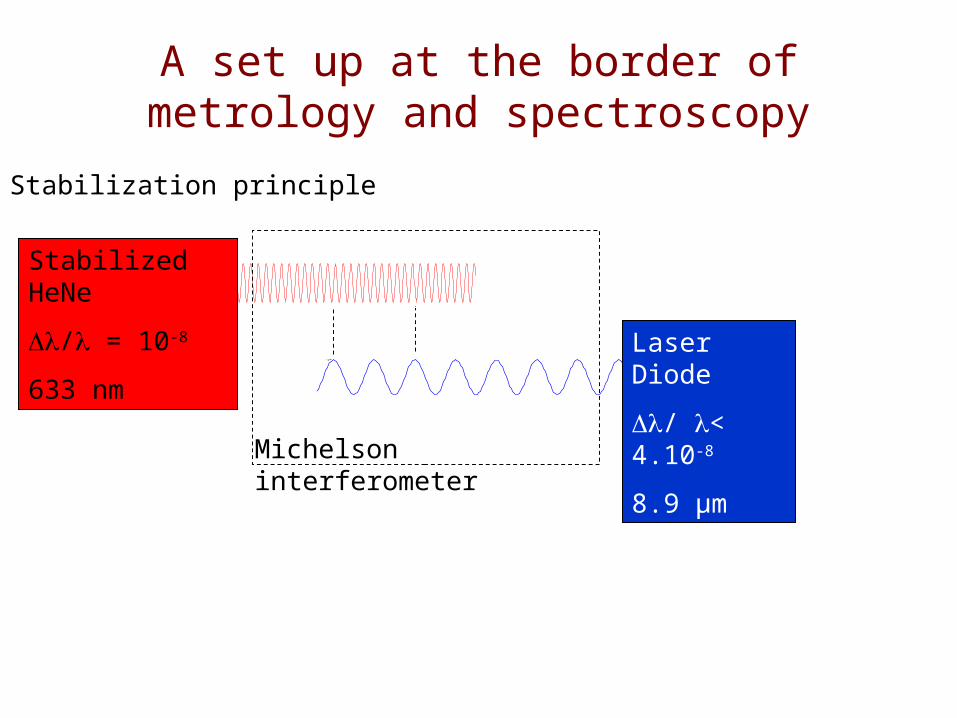
A set up at the border of metrology and spectroscopy
0 50 100 150 200 250 300
-1,0
-0,5
0,0
0,5
1,0 ?
0 100 200 300 400 500
-1,0
-0,5
0,0
0,5
1,0
Laser Diode
/ < 4.10-8
8.9 µm
Stabilization principle
Stabilized HeNe
/ = 10-8
633 nm
Michelson interferometer
KIR
HeNe

A set up at the border of metrology and spectroscopy
0 50 100 150 200 250 300
-1,0
-0,5
0,0
0,5
1,0 ?
Laser Diode
/ < 4.10-8
0 100 200 300 400 500
-1,0
-0,5
0,0
0,5
1,0Stabilized HeNe
/ = 10-8
Michelson interferometer
Stabilization principle
Stabilized HeNe
/ = 10-8
633 nmLaser Diode
/ < 4.10-8
8.9 µm

A set up at the border of metrology and spectroscopy
0 50 100 150 200 250 300
-1,0
-0,5
0,0
0,5
1,0 ?
Laser Diode
/ < 4.10-8
Amplitude modulation scheme good S/N (several thousand)
Both highly tunable and stabilized system
Ultra flexible setup (atmospheric windows accessible)
0 100 200 300 400 500
-1,0
-0,5
0,0
0,5
1,0Stabilized HeNe
/ = 10-8
Michelson interferometer
Stabilization principle
Stabilized HeNe
/ = 10-8
633 nmLaser Diode
/ < 4.10-8
8.9 µm

Stabilized spectrometer
LaserDiode
O3 Generation
UVO3
N2O
(FP)D
D
C D
PT 100
D
LaserDiode
UV O3 Generation system
Step by step modeStep < 10-4 cm-1
S/N : 3000I0
FPN2O Accuracy (2):
Position < 8.10-5 cm-1
Intensity < 2%
M. Guinet, D. Mondelain, C. Janssen, C. Camy-Peyret, JQSRT, 111, 961-972 (2010)
Interferometer locked onto stabilized HeNe laser

Spectra
Linearization
Absolute calibration
SWIFT Line
10 000 points

Metrological approachReduction and taking into account of systematic biases : Sample purity, spectrometer, experimental conditions…
Traceability :
Following the BIPM recommendation (photometer UV).Calibrated tools (PT 100, micrometer, pressure gauge, stabilized HeNe).
Expertise :O3 sample purity test (> 99.5 % purity sample) :
IR spectrometer (CO2, H2O, N2O)
mass spectrometer (N2, NOx)
pressure (O2, N2, non condensable gases),
Stable conditions (temperature, very low ozone decomposition 2- 4 ‰ / hour)
Checking :
Check BIPM UV recommended cross section (Hearn) with a calibrated pressure gauge.
C. Janssen and M. Guinet, RSI., submitted
Hearn A. G., Proc. Phys. Soc., 78 (1961) 932-940
Mass spectrometer

High accuracy absorption measurement of O3 cross
section at 253.65 nm
International standard (BIPM) :
our measures :
M. Guinet, C. Camy-Peyret, D. Mondelain and C. Janssen, Refinement of the ozone standard – absolute ozone absorption cross section at the mercury emission line position 253.65 nm, Metrol., en préparation
= 1.14710-17cm² (± 2.1%)
= 1.13110-17cm² (± 0.7%)

• Estimated uncertainties between 0.8 and 1.3% considering:– statistical error over the 11 spectra with pure O3
– systematic errors (T, offset, UV, LUV, LIR…)
Results on intensities
Comparison with HITRAN08:-2.2 1.1(2) %
(Our UV cross section)
-2.6 1.3(2)
(Mauersberger cross section)

• Cross cell : UV and IR measured simultaneously
3.6% inconsistencies between UV (Hearn) and IR (HITRAN 08) recommended values in agreement with Picquet-Varrault
Results on intensities
Picquet-Varrault et al, J. Phys. Chem A, 109 (2005) 1008-1014.
UV
IR

Absolute positions of strong O3 lines
• The N2O line positions were accurately measured by an heterodyne experiment (Maki and Wells)
• Linearization and calibration procedure applied to O3 and N2O spectra
N2O positions → overall accuracy of 8 10-5 cm-1 (2)
Wind speed uncertainty: ~ 20 m s-1
O3 positions →
Mean difference
with HITRAN08:
(5 8 (2))10-5 cm-1
Maki A.G., Wells J.S. NIST Special publication (1991) 821

Determination of the self pressure broadening
• Ultra high resolution spectra
(200 – 1000 points / line)• Voigt and Rautian-Sobel'man
(hard) line profile• Multi-fit procedure
Pressure broadening at 2 % accuracy level (2)
Agrees with HITRAN by 0.6% with Smith by 1.7%(Voigt profile)
HITRAN [cm-1]
HITRAN [cm-1atm-1]
This work [cm-1atm-1] (Voigt)
This work - HITRAN
[%]
This work [cm-1atm-1] (Hard)
1132.59927 0.1031 0.10372(15) 0.60 0.10540(17) 1132.60340 0.1035 0.10421132.65698 0.0964 0.09594(8) -0.48 0.09660(7) 1132.78600 0.0963 0.09691132.81144 0.1023 0.10160(11) -0.68 0.10222(12)
1133.43351 0.1033 0.10706(6) 3.64 0.10753(6) 1133.58691 0.1033 0.10415(15) 0.82 0.10488(15)1133.63170 0.0948 0.09630(9) 1.58 0.09678(8)1133.67120 0.0958 0.09331(11) -2.60 0.09362(11)1133.72456 0.1017 0.10289(12) 1.17 0.10370(12)1133.97863 0.0917 0.09231134.02880 0.0954 0.09736(8) 2.06 0.09777(9)1134.25147 0.1032 0.10675(12) 3.441134.45383 0.0952 0.09272(9) -2.611134.50970 0.1010 0.10169(8) 0.68
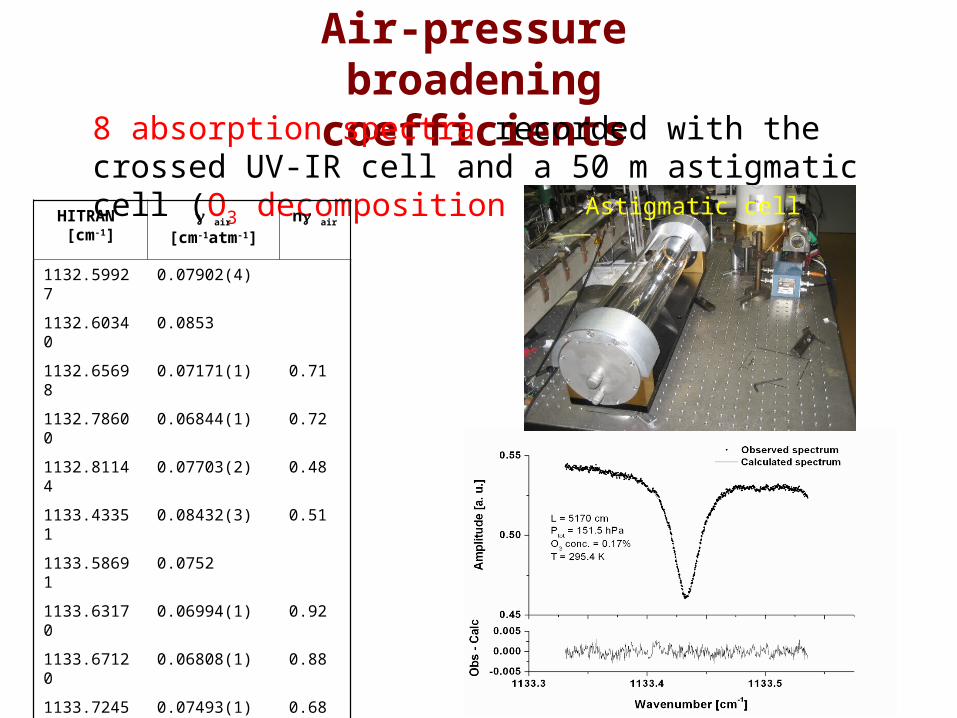
Air-pressure broadening coefficients
8 absorption spectra recorded with the crossed UV-IR cell and a 50 m astigmatic cell (O3 decomposition <1% / hour)
Astigmatic cellHITRAN [cm-1]
air
[cm-1atm-1]n air
1132.59927 0.07902(4)
1132.60340 0.0853
1132.65698 0.07171(1) 0.71
1132.78600 0.06844(1) 0.72
1132.81144 0.07703(2) 0.48
1133.43351 0.08432(3) 0.51
1133.58691 0.0752
1133.63170 0.06994(1) 0.92
1133.67120 0.06808(1) 0.88
1133.72456 0.07493(1) 0.68
1133.97863 0.07136(2) 0.77
1134.02880 0.07034(1) 0.76
1134.25147 0.08347(5)
1134.45383 0.06720(1)
1134.50970 0.07422(1)

Voigt profile
Air Pressure ShiftTemperature dependence:
Determination of air and air at 240 K
→ nair and nair
Temperature regulated cell
HITRAN [cm-1]
air
[cm-1atm-1](This work)
air
[cm-1atm-1](Smith)
’ 105
[cm-1atm-1 K-
1](This work)
’ 105
[cm-1atm-1 K-1](Smith)
1132.59927
1132.60340
1132.65698 -0.0017(1) 1.8
1132.78600 -0.0010(1)
1132.81144 -0.0004(1)
1133.43351 -0.0014(1) 1.2
1133.58691 -0.0004(7) -2.8(10)
1133.63170 -0.0002(1) 0.0007(2) 0.5(3)
1133.67120 -0.0011(1) -0.0012(1) 1.4 0.4(2)
1133.72456 -0.0005(1) -0.0012(2) -0.6(3)
1133.97863 -0.0004(1) -0.0002(3) 0.1(6)
1134.02880 -0.0016(1) -0.0009(1) 0.6(2)
1134.25147 -0.0018(2) -0.0009(3) -0.4(4)
1134.45383 -0.0004(1) -0.0008(1) 1.7(2)
1134.50970 0.0005(2) 3.3(4)
Smith M. A. H., Malati Devi V., Benner D. C., Rinsland C. P., J. Mol. Spectrosc.
182 (1997) 239-259.

Conclusion
253 nm UV cross section determination
Our IR measurement are 2.2 % higher than HITRAN 08
3.6% inconsistencies between UV (Hearn) and IR (HITRAN 08) recommended values
Position in agreement with HITRAN 08
Measurement of temperature dependence of air broadening and air shifting.

Laser spectroscopic study of ozone in the 100←000 band for the SWIFT instrument
M. Guinet, C. Janssen, D. Mondelain, C. Camy-PeyretLPMAA, CNRS- UPMC (France)
18/06/2010

Jitter of the Laser diode
3.7
1
0-5 c
m-1
0 200 400 600
0,5
0,6
0,7
0,8
0,9
1,0
B
-1,5
x10-4
-1,0
x10
-4-5
,0x1
0-5
0,0
5,0
x10-5
1,0x
10-4
1,5x
10-4
0
100
200
The line is used like a frequency/amplitude noise converter
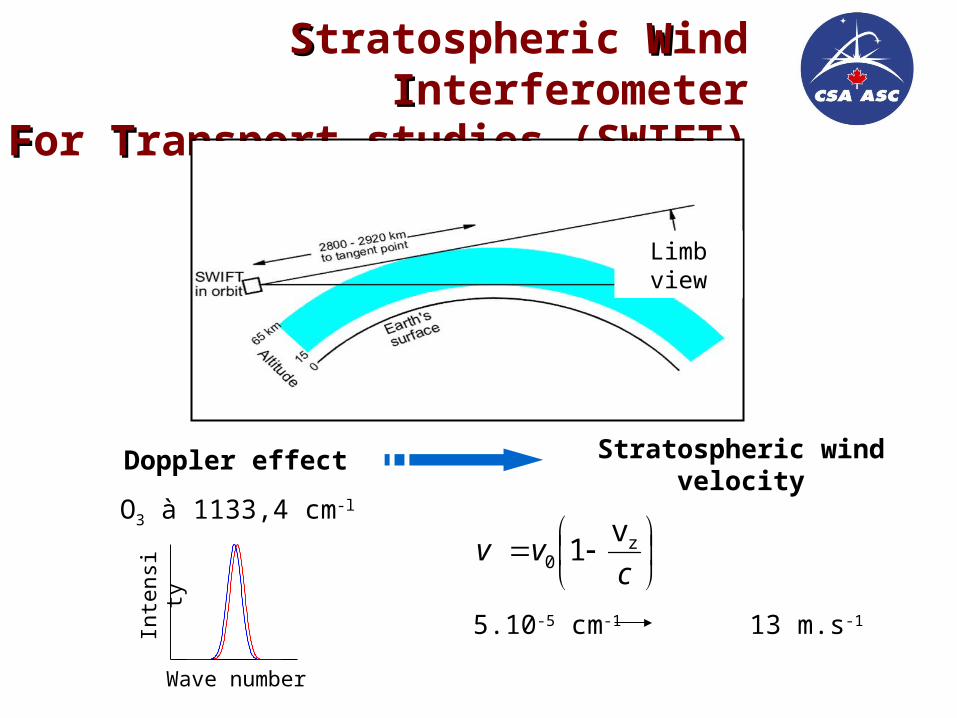
SStratospheric WWind IInterferometerFFor TTransport studies (SWIFT)
Stratospheric wind velocity
Doppler effect
Wave number
Inte
nsity
5.10-5 cm-1 13 m.s-1
cvv z
0
v1
Limb view
O3 à 1133,4 cm-l

J. Reid, D. T. Cassidy, and R. T. MenziesLinewidth measurements of tunable diode lasers using heterodyne and etalon techniques November 1982 / Vol. 21, No. 21 / APPLIED OPTICS
Exemple of TDL Line Shape :
Repeatability of the determination of the laser line shape
Set of 32 (on two day) measure in a sealed N2O cell
The intensity, lorentz (210-4 cm-1) , gaussian (410-4 cm-1)
are fit on the spectrum
± 4%lorentz
Inte
nsi
ty
± 9
‰
Parameter SD
intensity 9‰
lorentz
gaussian
4%5%
Source of bias Effect on the intensity mean value ( ± 1.6 ‰)
lorentz fix to it’s mean value
0.7‰
gaussian fix to it’s mean value
0.3 ‰
4% on lorentz
5% on gaussian
3‰
1.5‰
We fit the instrument’s apparatus function like a Voigt profile
‰2,1 2,2 2,3 2,4 2,5 2,6 2,7
5,55
5,60
5,65
5,70
5,75
5,80

Stabilized spectrometer
LaserDiode
UV O3 Generation system
I0
FPN2O
Accuracy (1): Position < 4.10-5 cm-1
Intensity < 1%
![Hemera 1.1 C Camy-Peyret final.ppt [Kompatibilitätsmodus]€¦ · 2uglqdwhxu gh erug 2swltxh gh vruwlh j ghx[ gpwhfwhxuv 0lurlu il[h 0lurlu preloh,qwhuipurpqwuh +polrvwdw 0lurlu](https://img.pdfslide.us/doc/110x75/602d7268289fd54ef9681765/hemera-11-c-camy-peyret-finalppt-kompatibilitftsmodus-2uglqdwhxu-gh-erug.jpg)


![SOLODUCHA TELEKOMINNOVLAB final.ppt - ETSI · 2012. 11. 27. · Title: Microsoft PowerPoint - SOLODUCHA_TELEKOMINNOVLAB_final.ppt [Compatibility Mode] Author: guinet Created Date:](https://img.pdfslide.us/doc/110x75/5fd03cbaedde0d3c872c8d37/soloducha-telekominnovlab-finalppt-etsi-2012-11-27-title-microsoft-powerpoint.jpg)

![TOMBAZ FINAL.ppt - ETSI · 2012. 6. 21. · Title: Microsoft PowerPoint - TOMBAZ_FINAL.ppt [Compatibility Mode] Author: guinet Created Date: 6/21/2012 10:01:58 AM](https://img.pdfslide.us/doc/110x75/5fd03f03c106f415c67a5474/tombaz-finalppt-etsi-2012-6-21-title-microsoft-powerpoint-tombazfinalppt.jpg)


![Second-Order Convergence of a Projection Scheme for the …users.cms.caltech.edu/~hou/papers/Hou-Wetton-1993.pdf · 2016-07-13 · [7] and the book by Peyret and Taylor [13]. One](https://img.pdfslide.us/doc/110x75/5ec540faecda8e73e420e954/second-order-convergence-of-a-projection-scheme-for-the-userscms-houpapershou-wetton-1993pdf.jpg)

![808 Bibliographie - Springer978-2-287-99050-2/1.pdf · [45] Françoise DUQuENNE, Serge BOTTON, François PEYRET, David BÉTAILLE, ... Astronomia Nova et Harmonices Mundi). Chez le](https://img.pdfslide.us/doc/110x75/5c0e3ea809d3f23c2a8ca715/808-bibliographie-springer-978-2-287-99050-21pdf-45-francoise-duquenne.jpg)