Embed Size (px)
Citation preview
LARSA 2000 User's Guide
for
LARSA 2000Finite Element Analysis and Design Software
Larsa, Inc.Melville, New York, USA
Revised August 2004
Table of Contents
Overview 6About LARSA 2000 and LARSA 2000/4D 8
Using LARSA Overview 10
Files & Reports 19Project Properties 20
Import Project (Merge) 22
Import from DXF (AutoCAD) 24
Export to Zip Package 26
Export to DXF (AutoCAD) 28
Export AVI (Animation) 30
Print a Report 32
File Types 35
Graphics & Selection 37An Overview of Graphics & Selection 38
Select Special 42
Select by Plane 44
Select by Polygon 45
Graphics Display Options 46
Graphics Window Grid 50
Hide Unselected 52
Explorers 54Model Data Explorer 56
Load Cases Explorer 58
Structure Groups Explorer 60
Construction Stages Explorer 64
LARSA 2000 User's Guide
2
Analysis Results Explorer 66
Modeling Tools 69Drawing Geometry and Loads 70
Undo/Redo 75
Erase and Delete 76
Break, Merge, and Join 77
Transformations 79
Generation Tools 81
Project Options 85Model Units 86
Universal Restraints 88
Connecting Databases 89
Using the Model Spreadsheets 91
Special Data Tools 97Working with User Coordinate Systems 98
Integrity Check 100
Loading Standard Materials 103
Loading Standard Sections 105
Creating Custom Sections 107
Construction Stage Editor 109
The Database Editor 110
Spreadsheet Formulas 113
Running an Analysis 116
Getting Results 119Viewing Results Graphically 120
Results Spreadsheets 127
Linear Result Combinations 131
Extreme Effect Groups 134
Graphing Results 136
Results Units 141
Graphical Results Options 143
Capture Deformed Structure 146
LARSA 2000 User's Guide
3
Automatic Code-Based Load Combinations 148
Tendon Results Tools 154
Steel Design 157
Installing Plugins 163
LARSA 2000 User's Guide
4

LARSA 2000 User's Guide
5
Overview
This is the LARSA 2000 User's Guide, which covers how to use the LARSA 2000/4thDimension user interface. This is also the starting point for any new LARSA 2000 user.
About the Manual
Topics covered in this manual include:
• Files and Reports, including importing/exporting
• Graphics, Selection, Spreadsheets, and Explorers
• Modeling Tools, including drawing, transformations, generation, and grids
• Running an Analysis
• Getting Results, both visually and numerically, and
• Steel Design
Other manuals for LARSA 2000/4D cover more specialized or in-depth topics:
Samples and TutorialsThis manual includes the Quickstart Guide, which all new LARSA users should gothrough to get a basic understanding of how LARSA 2000 works. The manual alsoincludes a number of samples and tutorials.
Reference ManualThe reference manual covers LARSA's element library and other input data,explains how analyses are performed, and defines how analysis output is reported.
Bridge Analysis GuideAn in-depth guide to using LARSA 2000/4D for bridge structures, including usingtendons, influence-based results, and related tools. The manual also includes atutorial for conforming to the AASHTO LRFD 1998 code.
Staged Construction Analysis Guide
LARSA 2000 User's Guide
6
An in-depth guide to using LARSA 2000/4D in staged or segmental construction,including a reference for LARSA's time-dependent staged construction analysis.
Developer's GuideA reference for extending LARSA 2000 through user-written plugins and VBAmacros.
Section Composer ReferenceA guide to the LARSA Section Composer.
These manuals are available in several formats on our website at http://www.larsausa.com inthe Support section.
Getting Help
For technical support,
• Please call us using one of the following telephone numbers:
• U.S. & Canada, Toll Free: 1-800-LARSA-01
• International: 212-736-4326 (our New York office)
• Email us at [email protected], or
• Visit our website www.larsausa.com and see the Support section.
We are open 9am to 5pm U.S. Eastern Time Monday through Friday.
You may also reach us by postal mail at:
About LARSA 2000 and LARSA 2000/4D 8
Using LARSA Overview 10
LARSA 2000 User's Guide
7
About LARSA 2000 andLARSA 2000/4D
LARSA 2000 and LARSA 2000/4th Dimension are the most advanced multipurposestructural analysis package available today. The sixth version in the LARSA product line,LARSA 2000 features an all-new, powerful user interface and an engine with unmatchedanalytical features.
LARSA 2000/4D's new fourth-dimension features make the software uniquely able to handlethe demands of modeling bridges: influence-line based moving load analysis, stagedconstruction analysis, time dependent construction analysis, hysteretic and seismic elements,and progressive collapse.
And LARSA 2000's new user interface is just as astounding as its analytical engine. Theinterface features clear and powerful graphics windows, easy-to-use numerical spreadsheetsfor both input data and results, new Explorers for navigating project data, and a long list ofmodeling tools.
LARSA 2000 and LARSA 2000/4D are available as a program for Microsoft Windows98/ME/2000/XP on Intel 386-compatible processors.
The LARSA structural analysis engine has been in commercial use for over 25 years. It wasoriginally developed to perform nonlinear static analysis of structures that have largedisplacements, such as suspension and cable stayed bridges and guyed towers. The enginebecame popular for analyses of these types of structures because of its unprecedentedaccuracy at a reasonable price. The engine has been powerful since day one, using bothtangent stiffness and the full Newton-Raphson method with iterations. LARSA has come along way since it was first available on the VAX super-mini computers decades ago.
In 1986, LARSA expanded its engine to meet the needs of any structural analysis that apracticing engineer might find at that time, including seismic analysis and design. At thesame time, a graphical user interface was released for DOS. LARSA was the first to offer anindividual PC-based DOS structural analysis package with geometric nonlinear analysiscapabilities.
LARSA again led the industry in 1994 by taking the next step to Microsoft Windows. That
LARSA 2000 User's Guide
8
year LARSA introduced its 16-bit Windows 3.x version of the software with a point and clickgraphical user interface. In 1996, LARSA was the first to offer elastic/perfectly plasticpushover analysis.
In 2001, LARSA 2000 and LARSA 2000/4th Dimension were released. LARSA continues tolead the industry in structural analysis.
LARSA 2000 User's Guide
9
Using LARSA Overview
This section provides an overview of the features needed to get started using LARSA 2000.
The LARSA 2000 Look and Feel
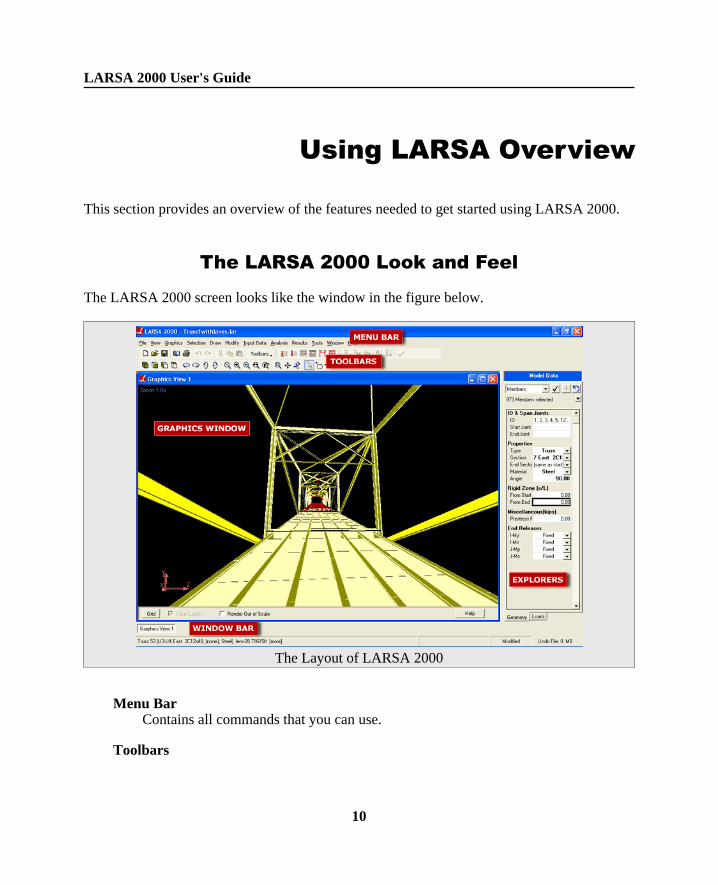
The LARSA 2000 screen looks like the window in the figure below.
The Layout of LARSA 2000
Menu BarContains all commands that you can use.
Toolbars
LARSA 2000 User's Guide
10
Contains buttons for frequently used commands.
Graphics WindowShows a graphical representation of the open project. See An Overview of Graphics& Selection [p38].
ExplorersProvides quick access to all aspects of the open project. See Explorers [p54].
Window BarLists all open LARSA windows (e.g. graphics windows, spreadsheets). Click thename of a window to switch to it.
Defining Properties
The term "properties" in LARSA 2000 refers to the project input that defines the behavior ofthe geometry of the model, including material properties, sectional properties, nonlinearspring properties, and time-dependent material properties.
Materials and Sections can be added to the project using any of the following methods.
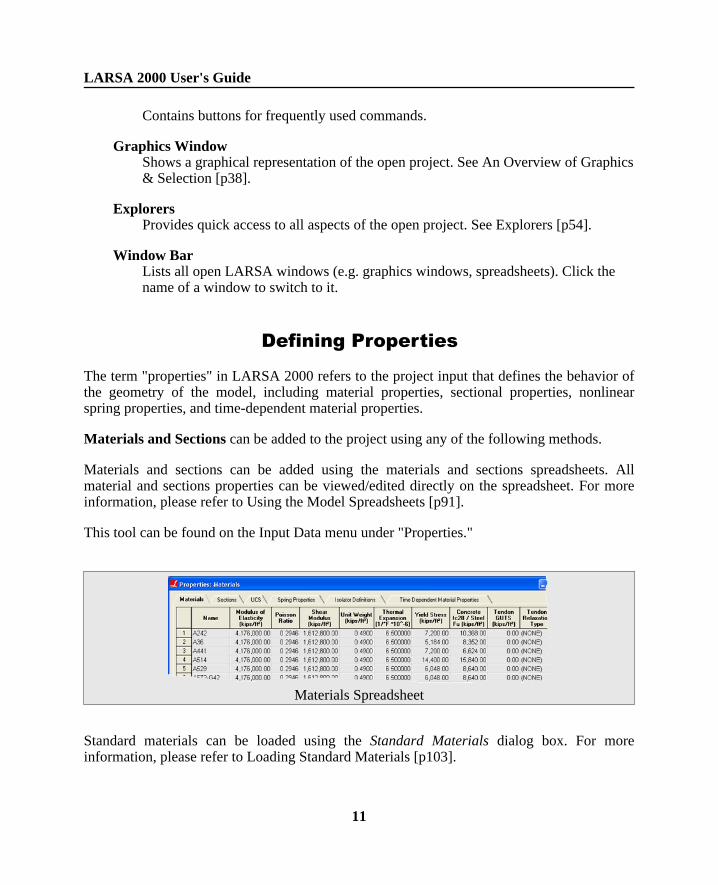
Materials and sections can be added using the materials and sections spreadsheets. Allmaterial and sections properties can be viewed/edited directly on the spreadsheet. For moreinformation, please refer to Using the Model Spreadsheets [p91].
This tool can be found on the Input Data menu under "Properties."
Materials Spreadsheet
Standard materials can be loaded using the Standard Materials dialog box. For moreinformation, please refer to Loading Standard Materials [p103].
LARSA 2000 User's Guide
11
This tool can be found on the Input Data menu under "Standard Materials."
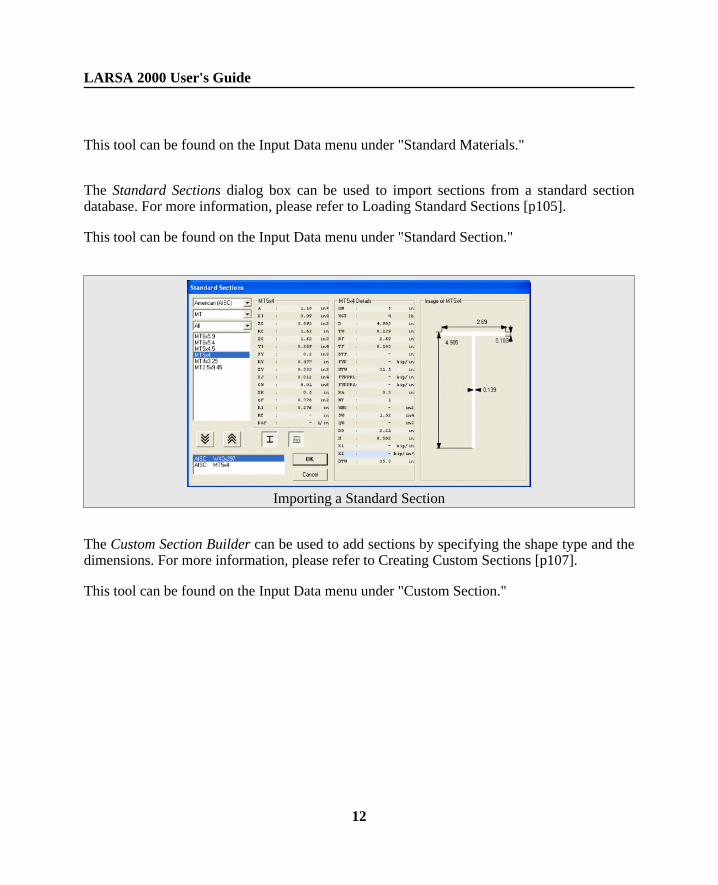
The Standard Sections dialog box can be used to import sections from a standard sectiondatabase. For more information, please refer to Loading Standard Sections [p105].
This tool can be found on the Input Data menu under "Standard Section."
Importing a Standard Section
The Custom Section Builder can be used to add sections by specifying the shape type and thedimensions. For more information, please refer to Creating Custom Sections [p107].
This tool can be found on the Input Data menu under "Custom Section."
LARSA 2000 User's Guide
12
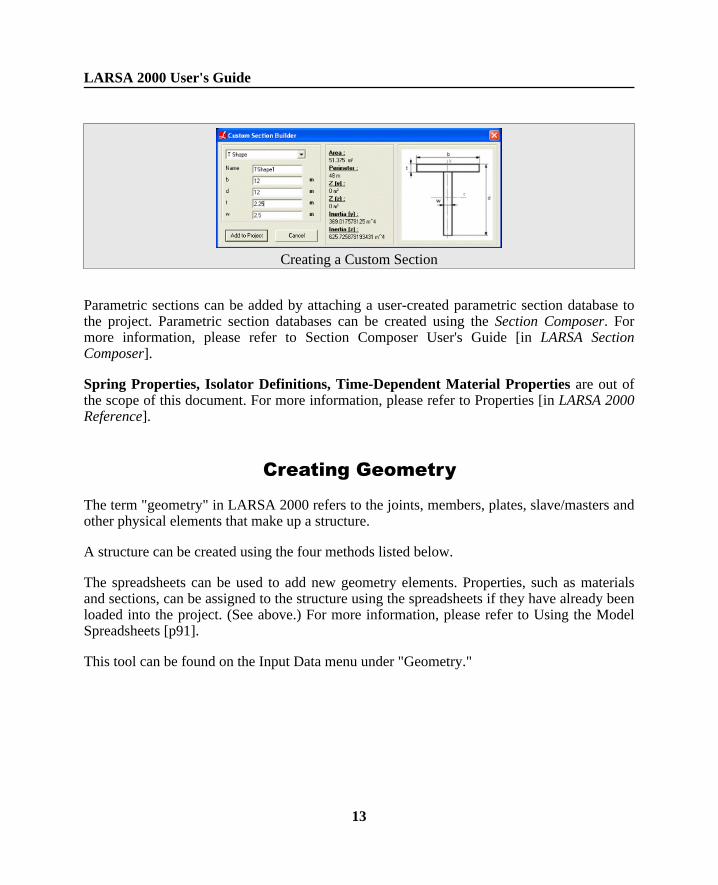
Creating a Custom Section
Parametric sections can be added by attaching a user-created parametric section database tothe project. Parametric section databases can be created using the Section Composer. Formore information, please refer to Section Composer User's Guide [in LARSA SectionComposer].
Spring Properties, Isolator Definitions, Time-Dependent Material Properties are out ofthe scope of this document. For more information, please refer to Properties [in LARSA 2000Reference].
Creating Geometry
The term "geometry" in LARSA 2000 refers to the joints, members, plates, slave/masters andother physical elements that make up a structure.
A structure can be created using the four methods listed below.
The spreadsheets can be used to add new geometry elements. Properties, such as materialsand sections, can be assigned to the structure using the spreadsheets if they have already beenloaded into the project. (See above.) For more information, please refer to Using the ModelSpreadsheets [p91].
This tool can be found on the Input Data menu under "Geometry."
LARSA 2000 User's Guide
13
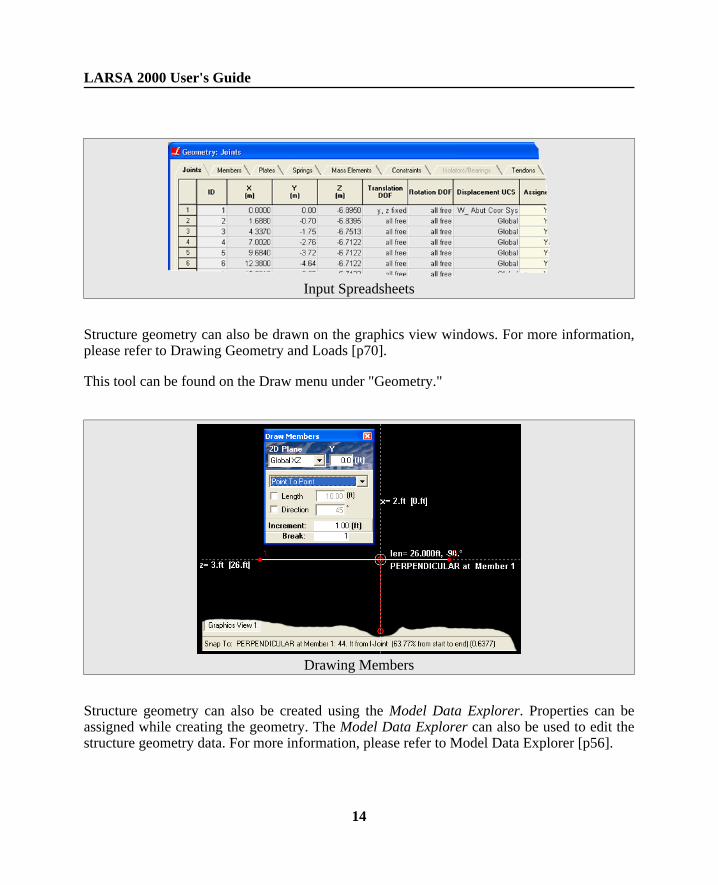
Input Spreadsheets
Structure geometry can also be drawn on the graphics view windows. For more information,please refer to Drawing Geometry and Loads [p70].
This tool can be found on the Draw menu under "Geometry."
Drawing Members
Structure geometry can also be created using the Model Data Explorer. Properties can beassigned while creating the geometry. The Model Data Explorer can also be used to edit thestructure geometry data. For more information, please refer to Model Data Explorer [p56].
LARSA 2000 User's Guide
14
This tool can be found on the View menu under "Model Data."
Various generation tools can be used to create the geometry. For more information, pleaserefer to Generation Tools [p81].
This tool can be found on the Draw menu under "Generation."
Applying Loads
Load Cases: All loads must be contained in a "load case." Therefore, before applying loadsto the structure geometry, one needs to create the load cases. For help creating and editingload cases, see Load Cases Explorer [p58].
Loads: Once there are load cases, loads can be created using one of the methods listed below.For more information on loads, please refer to Loads [in LARSA 2000 Reference].
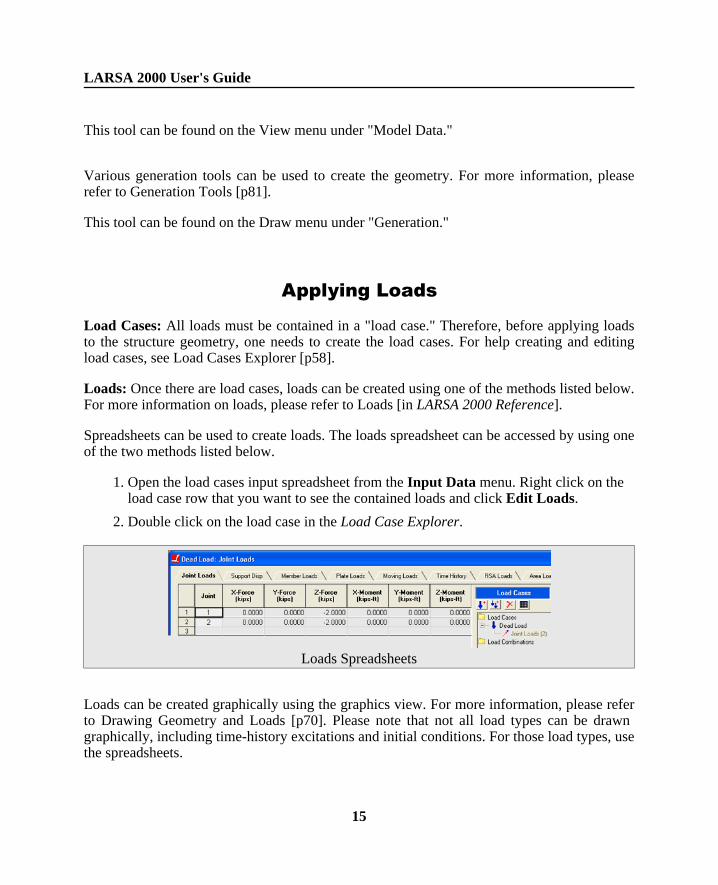
Spreadsheets can be used to create loads. The loads spreadsheet can be accessed by using oneof the two methods listed below.
1. Open the load cases input spreadsheet from the Input Data menu. Right click on theload case row that you want to see the contained loads and click Edit Loads.
2. Double click on the load case in the Load Case Explorer.
Loads Spreadsheets
Loads can be created graphically using the graphics view. For more information, please referto Drawing Geometry and Loads [p70]. Please note that not all load types can be drawngraphically, including time-history excitations and initial conditions. For those load types, usethe spreadsheets.
LARSA 2000 User's Guide
15
This tool can be found on the Draw menu under "Loads."
Analyzing the Model
Before analyzing your model, please use Integrity Check to ensure the validity of the project.For more information, please refer to Integrity Check [p100].
This tool can be found on the Input Data menu under "Integrity Check."
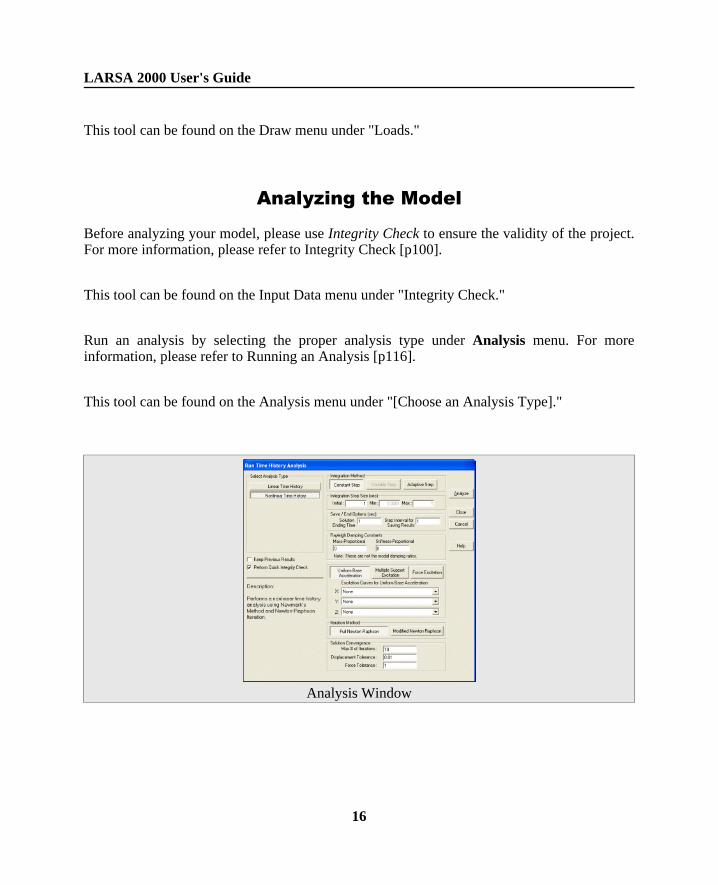
Run an analysis by selecting the proper analysis type under Analysis menu. For moreinformation, please refer to Running an Analysis [p116].
This tool can be found on the Analysis menu under "[Choose an Analysis Type]."
Analysis Window
LARSA 2000 User's Guide
16
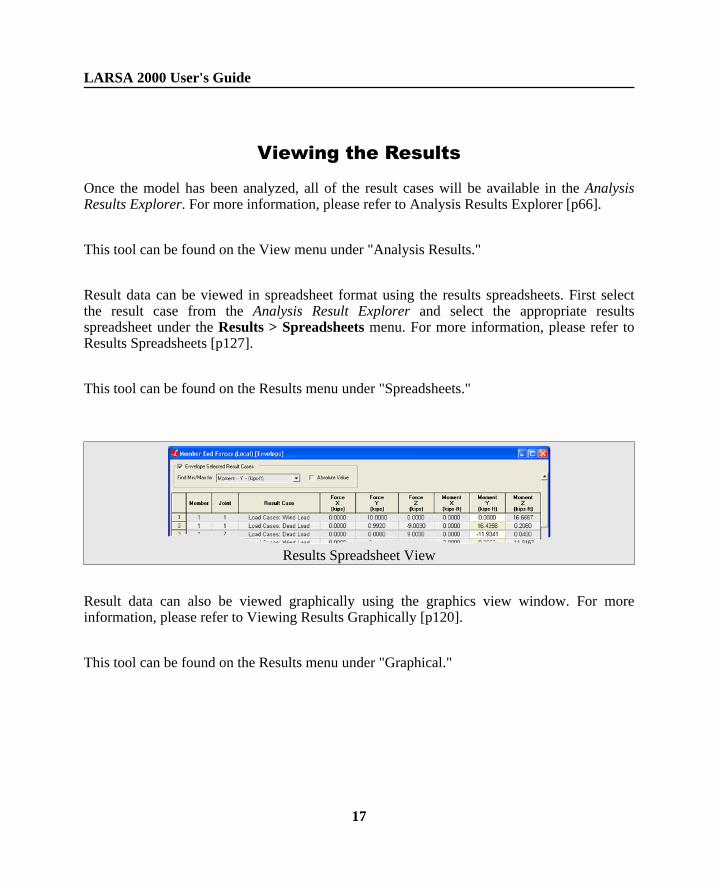
Viewing the Results
Once the model has been analyzed, all of the result cases will be available in the AnalysisResults Explorer. For more information, please refer to Analysis Results Explorer [p66].
This tool can be found on the View menu under "Analysis Results."
Result data can be viewed in spreadsheet format using the results spreadsheets. First selectthe result case from the Analysis Result Explorer and select the appropriate resultsspreadsheet under the Results > Spreadsheets menu. For more information, please refer toResults Spreadsheets [p127].
This tool can be found on the Results menu under "Spreadsheets."
Results Spreadsheet View
Result data can also be viewed graphically using the graphics view window. For moreinformation, please refer to Viewing Results Graphically [p120].
This tool can be found on the Results menu under "Graphical."
LARSA 2000 User's Guide
17
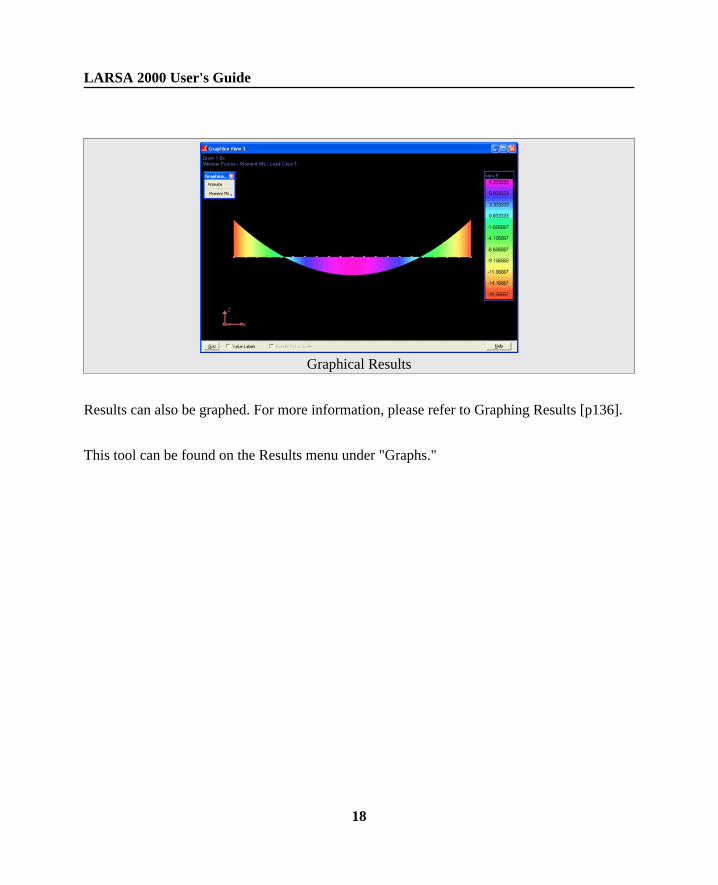
Graphical Results
Results can also be graphed. For more information, please refer to Graphing Results [p136].
This tool can be found on the Results menu under "Graphs."
LARSA 2000 User's Guide
18
Files & Reports
The following sections describe using files and reports in LARSA, through the loading,saving, import/export and report/printing features.
Project Properties 20
Import Project (Merge) 22
Import from DXF (AutoCAD) 24
Export to Zip Package 26
Export to DXF (AutoCAD) 28
Export AVI (Animation) 30
Print a Report 32
File Types 35
LARSA 2000 User's Guide
19
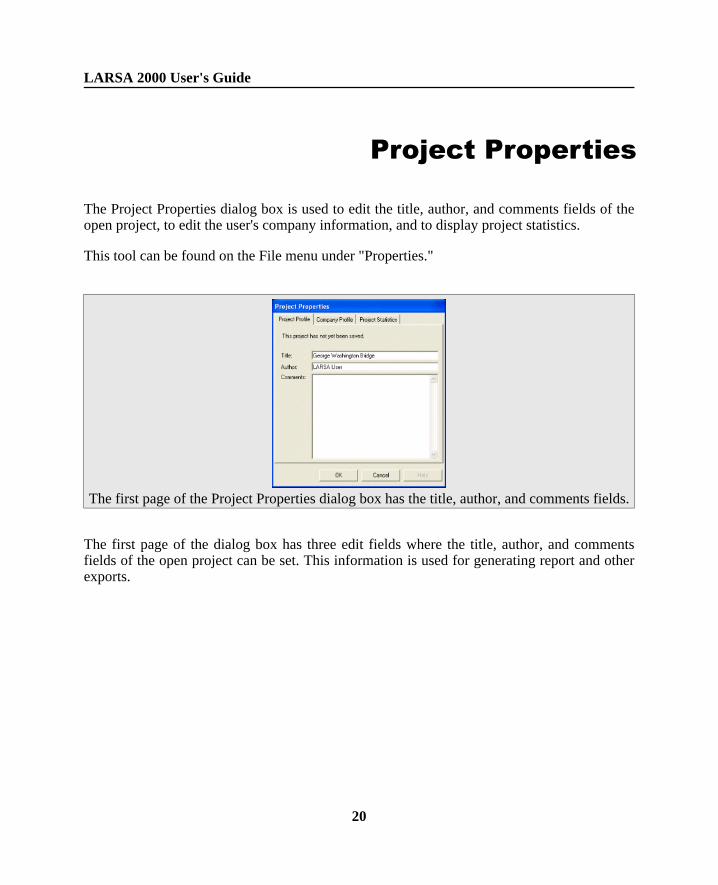
Project Properties
The Project Properties dialog box is used to edit the title, author, and comments fields of theopen project, to edit the user's company information, and to display project statistics.
This tool can be found on the File menu under "Properties."
The first page of the Project Properties dialog box has the title, author, and comments fields.
The first page of the dialog box has three edit fields where the title, author, and commentsfields of the open project can be set. This information is used for generating report and otherexports.
LARSA 2000 User's Guide
20
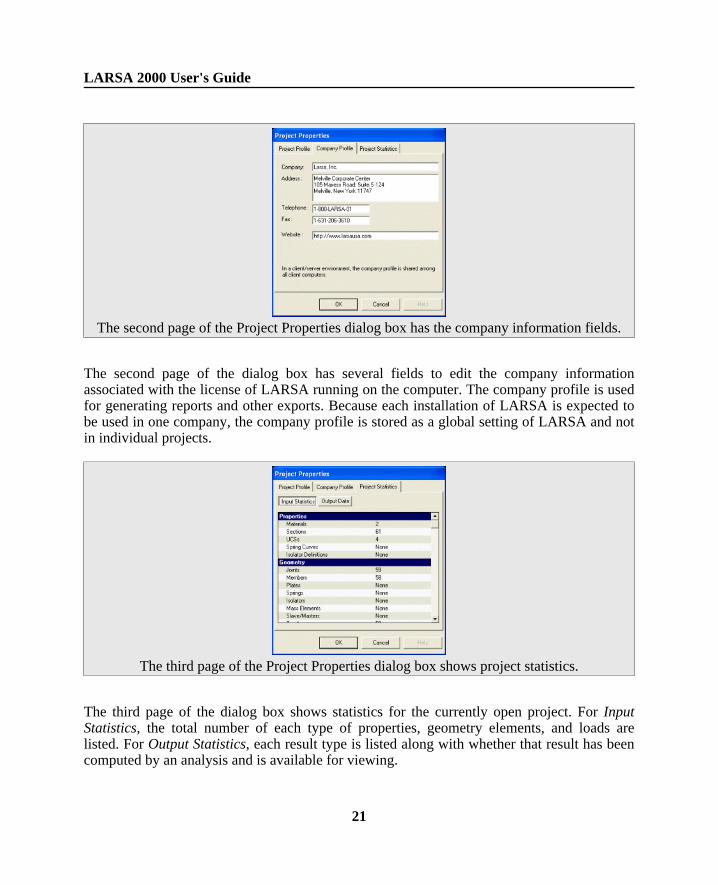
The second page of the Project Properties dialog box has the company information fields.
The second page of the dialog box has several fields to edit the company informationassociated with the license of LARSA running on the computer. The company profile is usedfor generating reports and other exports. Because each installation of LARSA is expected tobe used in one company, the company profile is stored as a global setting of LARSA and notin individual projects.
The third page of the Project Properties dialog box shows project statistics.
The third page of the dialog box shows statistics for the currently open project. For InputStatistics, the total number of each type of properties, geometry elements, and loads arelisted. For Output Statistics, each result type is listed along with whether that result has beencomputed by an analysis and is available for viewing.
LARSA 2000 User's Guide
21
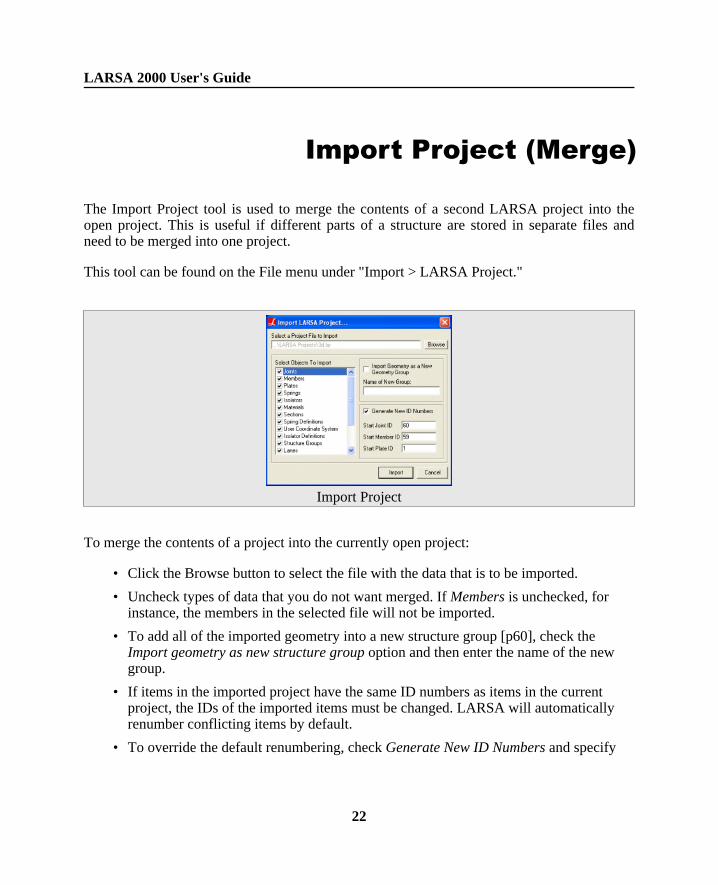
Import Project (Merge)
The Import Project tool is used to merge the contents of a second LARSA project into theopen project. This is useful if different parts of a structure are stored in separate files andneed to be merged into one project.
This tool can be found on the File menu under "Import > LARSA Project."
Import Project
To merge the contents of a project into the currently open project:
• Click the Browse button to select the file with the data that is to be imported.
• Uncheck types of data that you do not want merged. If Members is unchecked, forinstance, the members in the selected file will not be imported.
• To add all of the imported geometry into a new structure group [p60], check theImport geometry as new structure group option and then enter the name of the newgroup.
• If items in the imported project have the same ID numbers as items in the currentproject, the IDs of the imported items must be changed. LARSA will automaticallyrenumber conflicting items by default.
• To override the default renumbering, check Generate New ID Numbers and specify
LARSA 2000 User's Guide
22
the starting ID number for the joints, members, and plates imported.
• Click Import to begin importing the contents of the selected file.
LARSA 2000 User's Guide
23
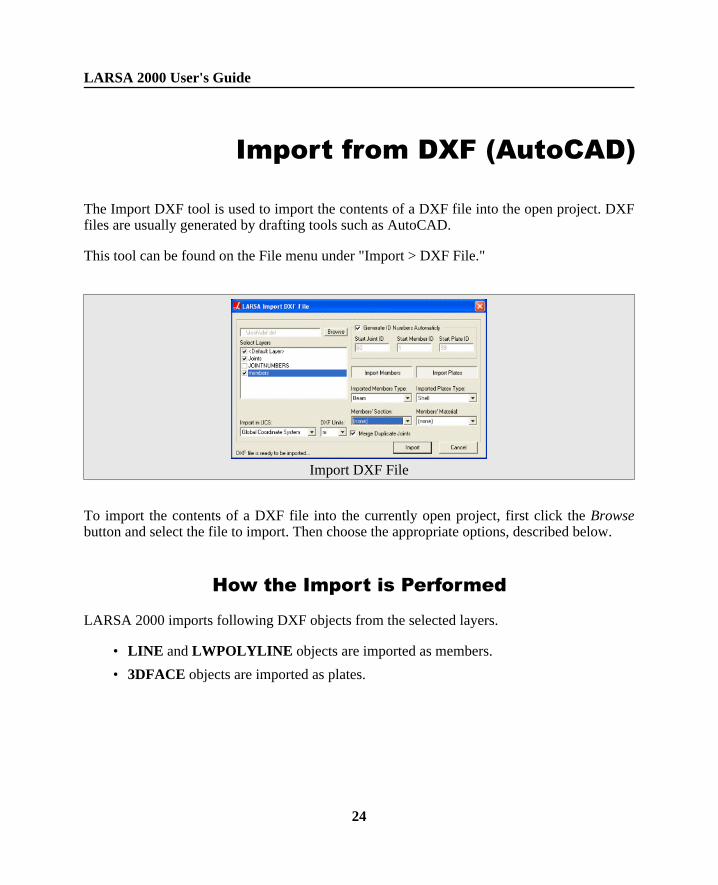
Import from DXF (AutoCAD)
The Import DXF tool is used to import the contents of a DXF file into the open project. DXFfiles are usually generated by drafting tools such as AutoCAD.
This tool can be found on the File menu under "Import > DXF File."
Import DXF File
To import the contents of a DXF file into the currently open project, first click the Browsebutton and select the file to import. Then choose the appropriate options, described below.
How the Import is Performed
LARSA 2000 imports following DXF objects from the selected layers.
• LINE and LWPOLYLINE objects are imported as members.
• 3DFACE objects are imported as plates.
LARSA 2000 User's Guide
24
Import Options
Select LayersOften the contents of DXF files are organized into layers, each layer containing adifferent set of drawing elements. LARSA will only import the contents of layersmarked with a check in the selection list.
Import in UCSThe contents of the DXF file can be imported relative to a user coordinate system [see"User Coordinate Systems" in LARSA 2000 Reference]. If a coordinate system other thanthe global coordinate system is chosen, then the coordinates of the DXF entities aretransformed as if they were specified in coordinates relative to the selected system.
DXF UnitsCoordinates in DXF files are specified without units. By default, the coordinates in theDXF file are assumed to be in whatever coordinate units are being used in the openproject. To override what units the coordinates in the DXF file are in, modify thisoption.
Generate ID Numbers AutomaticallyItems imported from a DXF file must be given IDs not already used by objects in theopen project. LARSA will automatically number items by default. To override thestarting ID numbers of the imported joints, members, and plates, uncheck this option andspecify the starting IDs.
Import Members, Import PlatesUnpush these buttons if you do not want the members or plates imported from the DXFfile.
Imported Types, Sections, MaterialsChoose what member/plate types, sections, and materials to assign to the importedentities, if any.
Merge Duplicate JointsIf checked, an extra scan of the imported coordinates will be performed to ensure noimported joints result in having two different joints at the same location in the project. Ifthe DXF file takes a long time to import and if you are sure no coordinates in the DXFfile overlap with coordinates of joints in the open project, this option may be unchecked.
LARSA 2000 User's Guide
25
Export to Zip Package
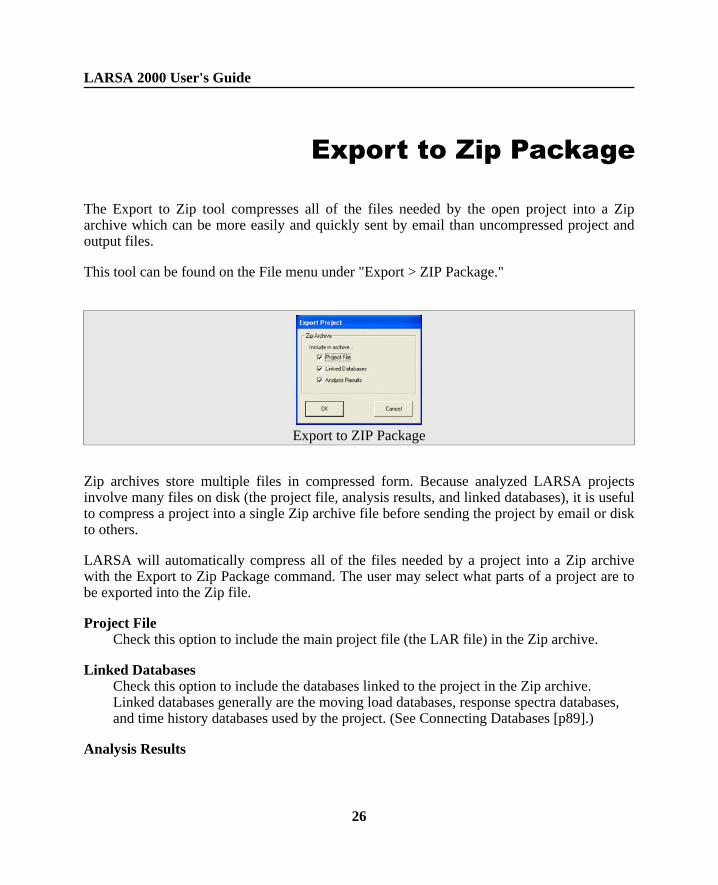
The Export to Zip tool compresses all of the files needed by the open project into a Ziparchive which can be more easily and quickly sent by email than uncompressed project andoutput files.
This tool can be found on the File menu under "Export > ZIP Package."
Export to ZIP Package
Zip archives store multiple files in compressed form. Because analyzed LARSA projectsinvolve many files on disk (the project file, analysis results, and linked databases), it is usefulto compress a project into a single Zip archive file before sending the project by email or diskto others.
LARSA will automatically compress all of the files needed by a project into a Zip archivewith the Export to Zip Package command. The user may select what parts of a project are tobe exported into the Zip file.
Project FileCheck this option to include the main project file (the LAR file) in the Zip archive.
Linked DatabasesCheck this option to include the databases linked to the project in the Zip archive.Linked databases generally are the moving load databases, response spectra databases,and time history databases used by the project. (See Connecting Databases [p89].)
Analysis Results
LARSA 2000 User's Guide
26
Check this option to include the analysis results in the Zip archive. Because analysisresults for large projects often are very large on disk, leaving this option checked mayresult in the exported Zip file being too large to send by email or disk.
The contents of a Zip archive can be accessed in several ways.
• LARSA will automatically open a LARSA project in a Zip archive from the regularFile > Open menu command.
• Users of Windows XP can extract the contents of a Zip archive from WindowsExplorer.
• Other third-party tools, such as WinZip (from http://www.winzip.com), are availablefor creating and extracting Zip files.
LARSA 2000 User's Guide
27
Export to DXF (AutoCAD)
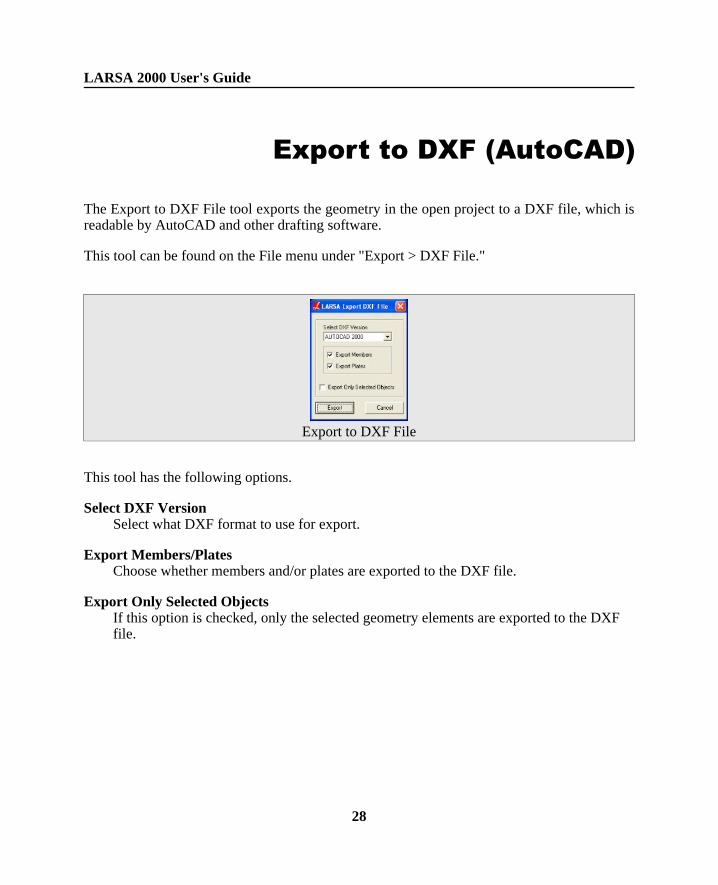
The Export to DXF File tool exports the geometry in the open project to a DXF file, which isreadable by AutoCAD and other drafting software.
This tool can be found on the File menu under "Export > DXF File."
Export to DXF File
This tool has the following options.
Select DXF VersionSelect what DXF format to use for export.
Export Members/PlatesChoose whether members and/or plates are exported to the DXF file.
Export Only Selected ObjectsIf this option is checked, only the selected geometry elements are exported to the DXFfile.
LARSA 2000 User's Guide
28
How the Export is Performed
LARSA 2000 exports joints, joint numbers, members and plates to DXF format.
• Joints are exported as POINT objects. All joints are placed in a layer called "Joints."Joint numbers are exported as MTEXT and placed in a 'JointNumbers' layer.
• Members are exported as LINE objects. All members are placed in a "Members"layer.
• Plates are exported as 3DFACE objects. All plates are placed in a "Plates" layer.
LARSA 2000 User's Guide
29
Export AVI (Animation)
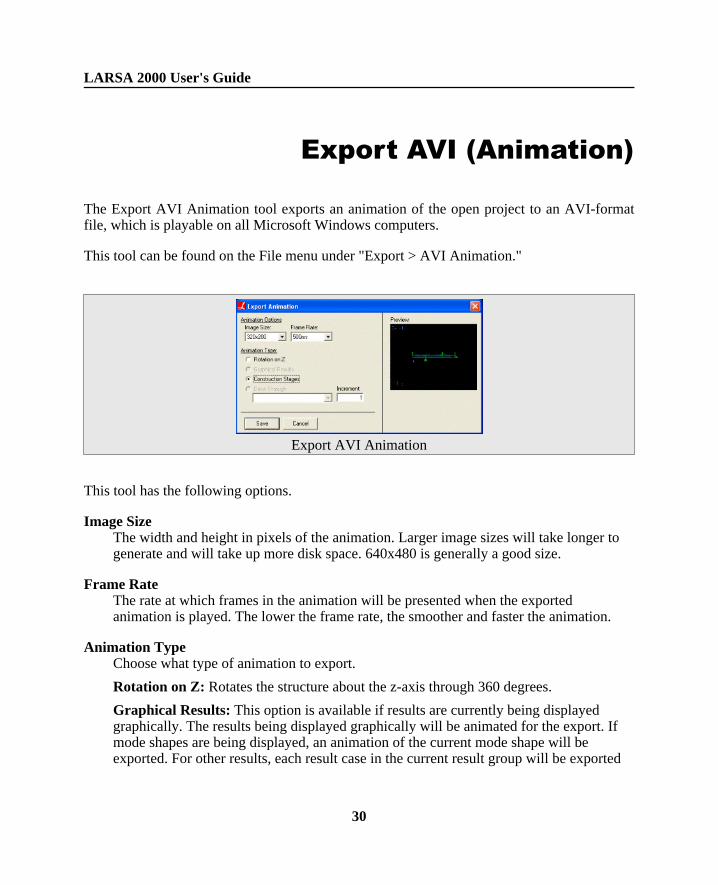
The Export AVI Animation tool exports an animation of the open project to an AVI-formatfile, which is playable on all Microsoft Windows computers.
This tool can be found on the File menu under "Export > AVI Animation."
Export AVI Animation
This tool has the following options.
Image SizeThe width and height in pixels of the animation. Larger image sizes will take longer togenerate and will take up more disk space. 640x480 is generally a good size.
Frame RateThe rate at which frames in the animation will be presented when the exportedanimation is played. The lower the frame rate, the smoother and faster the animation.
Animation TypeChoose what type of animation to export.
Rotation on Z: Rotates the structure about the z-axis through 360 degrees.
Graphical Results: This option is available if results are currently being displayedgraphically. The results being displayed graphically will be animated for the export. Ifmode shapes are being displayed, an animation of the current mode shape will beexported. For other results, each result case in the current result group will be exported
LARSA 2000 User's Guide
30
as a frame in the animation. This is useful for staged construction, moving load and timehistory analysis results. See Viewing Results Graphically [p120].
Construction Stages: Each step in the construction of the structure will be exported as aframe in the animation. See Staged Construction Guide [in LARSA 2000/4th Dimension:Staged Construction Analysis].
Drive Through: An animation of a drive-through of the structure will be exported. Thedrive-through will follow a lane [see "Lanes" in LARSA 2000 Reference] already definedin the project, and the position of the vantage point will move at the specified increment(in coordinate units) per frame.
LARSA 2000 User's Guide
31
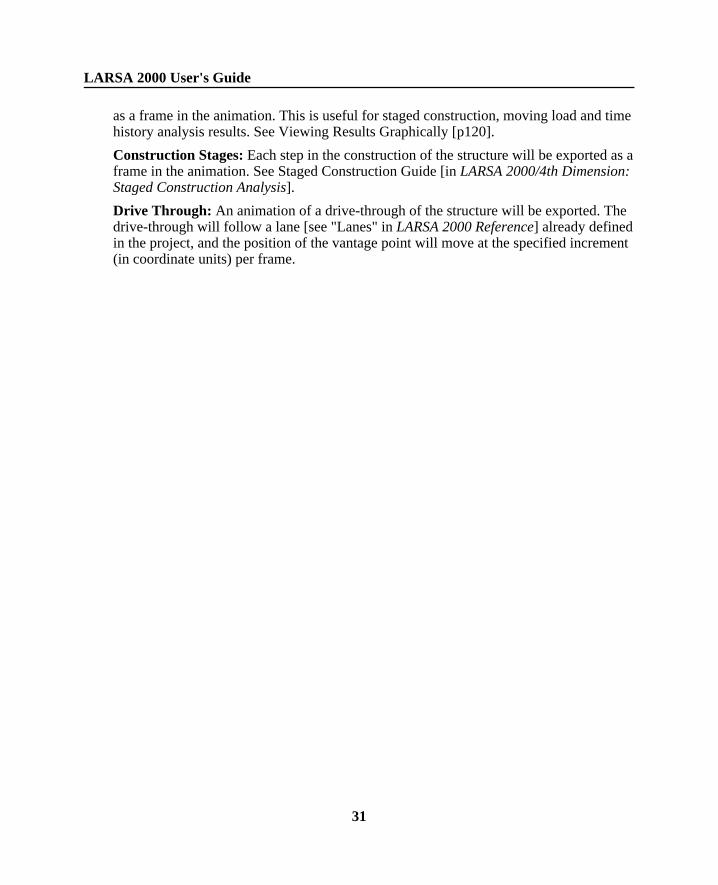
Print a Report
The Report tool prints out a hard copy of the model data or results in the open project, orsaves a report to a file in various formats.
This tool can be found on the File menu under "Report."
Create a Printed Report
The Report Wizard takes you through the steps to print out a report of the model and/orresults. Step forward and back through the wizard using the Back and Next buttons at thebottom of the dialog.
Report Options
Load Report ProfileAt the very end of the Report Wizard, you have the option of saving the choices youmade so that you do not need to go through the wizard again to generate the same report.To load in previously saved settings, choose the profile to load at this step.
Report TitleGive a title for the report. The title will be printed on the cover page.
What Pages to Include
LARSA 2000 User's Guide
32
You may optionally include each of the following pages:
• Cover Page - A cover page will be printed.
• Table of Contents - A table of contents of the report will be printed.
• File Summary - A summary of the project's contents will be printed.
• Graphics Windows - All open graphics windows will be printed.
Company LogoTo print your company's logo on your report, click the Browse button and select animage file on your computer with your company's logo. Standard image format files aresupported, including BMP and GIF.
Model Data
The Model Data tab is divided into three sections: Properties & Geometry, Groups & Stages,and Load Cases & Combinations.
Each section contains a list of the different parts of your project that you can print. Sectionsare printed as spreadsheets, with the same rows and columns you normally see on screen.
Check each spreadsheet to include in the report.
Analysis Results
In this section, you can choose which analysis results to print in the report. Analysis resultsare only available if they have previously been solved in an analysis.
To print a result spreadsheet, follow these steps.
1. In the Result field, choose the type of result to print.
2. Select which result cases to print the results for. Select the result case on the left andthen click Add Result Case to add it to the list of cases on the right.
3. If you want the results enveloped, select the aspect of the result to envelope on. Forinstance, if you are printing member end forces, you might want to report themaximum starting x-force for each member. In that case, choose Start Force in X toenvelope on. The envelope will be taken over the result cases chosen in the previous
LARSA 2000 User's Guide
33
step.
4. When all of these choices are finalized, choose Add Report Item. Your choices will belisted in the box at the bottom.
5. Repeat this process for each result type to print.
Graphics Views
If you have saved Named Graphics Views, you may print a graphics page for each of theviews. Select which named views to print from the list.
Generate Report
This is the final step before printing the report.
At this point, you may save the choices you made as a report profile so that you can recall thechoices the next time you want to print the same report again. To save your choices, enter aname that describes your choices and then click Save.
Output FormatChoose which type of output format you would like.
• Printer - The report will be printed.
• PDF Format - The report will be saved to a PDF file, which is readable by the freeAdobe Acrobat Reader provided by Adobe.
• HTML Document - The report will be saved in an HTML-format file, which isreadable by any web browser.
• Microsoft Excel - The report will be saved as a Microsoft Excel spreadsheet. BecauseExcel spreadsheets are limited to 65,535 rows, large projects may not exportsuccessfully.
• Text-Only - The report will be saved as a plain text file, readable on any computerwith any text editor.
Click Finish to print the report. You will first be presented with a preview of the report.
LARSA 2000 User's Guide
34
File Types
The various files used by LARSA 2000 are explained in this section.
Project Files (*.lar)
All of the information that makes up a model is stored in a *.lar file. This file includes allunits, properties, geometry, loads etc.
Please note that moving load patterns, time history curves, and response spectra curves arestored in external databases. See below.
Database Files (*.drs,*.dth, *.dml, *.lpsx)
These files are database files that can be used by attaching them to a project.
• *.drs: Stores response spectra curve data. Use Database Editor to edit, create or viewthe database.
• *.dth: Stores time history curve data. Use Database Editor to edit, create or view thedatabase.
• *.dml: Stores moving load pattern data. Use Database Editor to edit, create or viewthe database.
• *.lpsx: Stores parametric section data. Use Section Composer to edit, create or viewthe database.
For information on how to connect databases to a project, see Connecting Databases [p89].For information on how to create and edit databases, see The Database Editor [p110].For information on how to create and edit section databases, see Section Composer User'sGuide [in LARSA Section Composer].
LARSA 2000 User's Guide
35
Analysis Results Files
The LARSA 2000 analysis engine writes results into result files with the same file name asthe project file but with different extension. Each result file holds the information for aspecific result type.
It is not uncommon for an analysis to generate dozens of results files.
Analysis Results Archive (*.lan)
If the option Pack results into LAN archive is checked in Tools > Options, then LARSA willautomatically pack together all of the result files when LARSA closes a project or exists intoa file with the same name as the project file but with the extension LAN. LARSA will unpackLAN files and then delete the LAN file when projects with LAN files are opened.
LARSA 2000 User's Guide
36
Graphics & Selection
The sections below describe the various ways of using LARSA's graphics windows and howto select and unselect objects.
An Overview of Graphics & Selection 38
Select Special 42
Select by Plane 44
Select by Polygon 45
Graphics Display Options 46
Graphics Window Grid 50
Hide Unselected 52
LARSA 2000 User's Guide
37
An Overview of Graphics &Selection
The graphics views are the primary means of viewing and modeling structures in LARSA2000. In order to use the graphics views effectively, one must understand the six graphicstools and the concept of selection.
Selection
Every structural object in LARSA is either selected or unselected. LARSA provides varioustools to modify the selection state of objects, including the Selection/Unselection graphicstools (below), Select Special [p42], Select by Plane [p44], and Select/Unselect All. Selectedobjects are generally displayed solid, while unselected objects are generally displayed dashed.
The selection state of objects is important because most modeling operations, such asmodifying the properties of objects, applying transformations, and meshing, operate only onthe selected objects. Therefore, the objects to which you want to apply an operation must beselected before applying the operation.
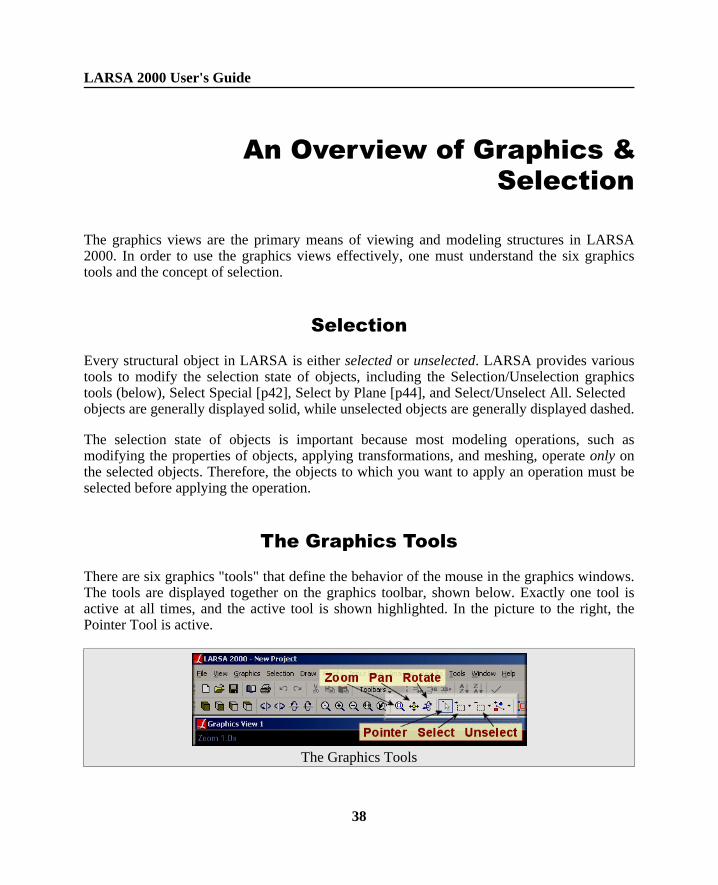
The Graphics Tools
There are six graphics "tools" that define the behavior of the mouse in the graphics windows.The tools are displayed together on the graphics toolbar, shown below. Exactly one tool isactive at all times, and the active tool is shown highlighted. In the picture to the right, thePointer Tool is active.
The Graphics Tools
LARSA 2000 User's Guide
38
The Pointer tool is the primary tool of the graphics windows. It is used to examine objectsquickly (click) and to quickly manipulate objects (right-click). The Select and Unselect toolsselect and unselect objects. Click or click-and-drag windows around objects to select/unselectthem.
Use the Zoom tool to zoom in by click-and-dragging a window around objects you wish tozoom in on. Right-click to zoom out. The Rotate and Pan tools are used to rotate thestructure and pan the structure left/right/up/down on the screen.
For the pointer and selection tools, right-clicking empty space in the graphics window willopen up the graphics shortcut menu, which provides quick access to graphics windowcommands.
The Zoom Tool.
Zoom WindowClick-and-drag a window around a portion of the structure to zoom in onto thatportion of the structure.
One-ClickClick an empty area of the graphics window to zoom in by 2.5x. (Or right-click tozoom out.) Or, click a structural object to zoom in by 2.5x and center the display onthat object. (Or right-click to zoom out.)
The Pan Tool.
Click-and-DragMove the structure on the screen to pan left, right, up, and down.
The Rotate Tool.
Click-and-DragMove the mouse in the graphics window to rotate the structure. Drag horizontallyto rotate the structure about the y-axis. Drag vertically to rotate the structure aboutthe x-axis.
Hold SHIFTAnd drag horizontally to rotate the structure about the z-axis.
The Pointer Tool.
LARSA 2000 User's Guide
39
Quick InfoClick structural objects to get more information about the objects. Right-click astructural object to access the shortcut menu for the object.
Quick SelectHold SHIFT while clicking on an object to select only that object. All other objectswill be deselected.
The Selection and Unselection Tools.
Select WindowClick-and-drag a window around structural objects to select/unselect the objects.(Other objects will remain as they were.) Dragging from right to left will include allobjects that are at least partially within the window. Dragging from left to right willinclude only the objects that are entirely within the window.
One-ClickClick objects to select just one object at a time. If more than one object is under themouse cursor, you will be prompted to choose which one to select.
ReverseHold SHIFT to do the opposite. If the selection tool is active, object will beunselected, and if the unselection tool is active, objects will be selected.
Quick GroupHold CTRL and drag objects into the Structure Groups Explorer [p60] orConstruction Stages Explorer [p64] to create a new group from the currentlyselected objects.
Switching Between Tools
In addition to clicking on their icons, there are two ways to quickly switch between the tools:shortcut keys and using the middle mouse button.
The shortcut keys are as follows:
ZoomF5
LARSA 2000 User's Guide
40
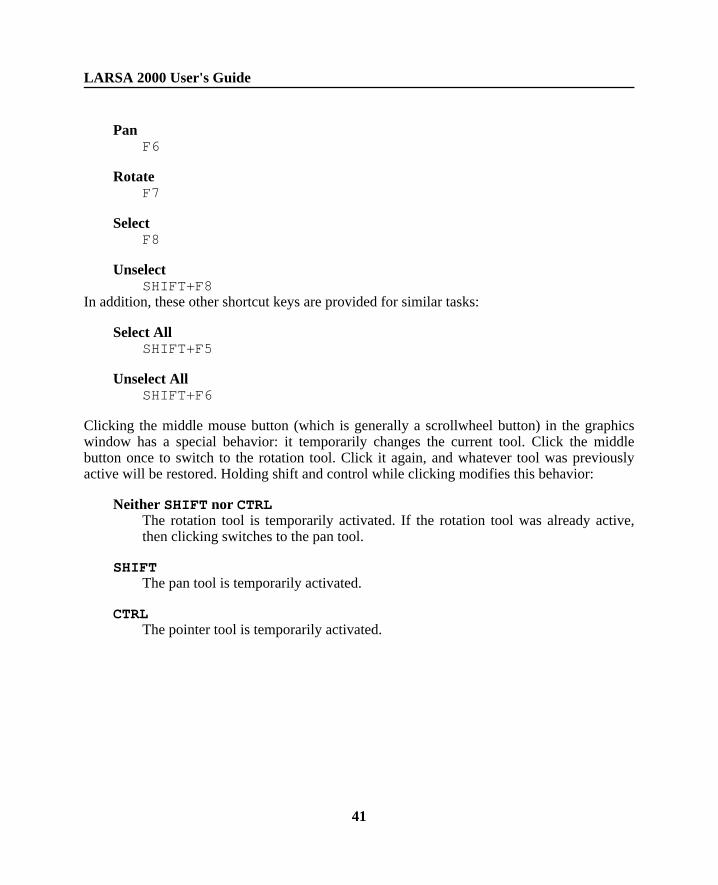
PanF6
RotateF7
SelectF8
UnselectSHIFT+F8
In addition, these other shortcut keys are provided for similar tasks:
Select AllSHIFT+F5
Unselect AllSHIFT+F6
Clicking the middle mouse button (which is generally a scrollwheel button) in the graphicswindow has a special behavior: it temporarily changes the current tool. Click the middlebutton once to switch to the rotation tool. Click it again, and whatever tool was previouslyactive will be restored. Holding shift and control while clicking modifies this behavior:
Neither SHIFT nor CTRLThe rotation tool is temporarily activated. If the rotation tool was already active,then clicking switches to the pan tool.
SHIFTThe pan tool is temporarily activated.
CTRLThe pointer tool is temporarily activated.
LARSA 2000 User's Guide
41
Select Special
The Select Special tool selects or deselects objects that have certain properties. For instance,unlike Select All Joints, Select Special can select "all joints whose x-coordinate is less than10."
This tool can be found on the Selection menu under "Select Special."
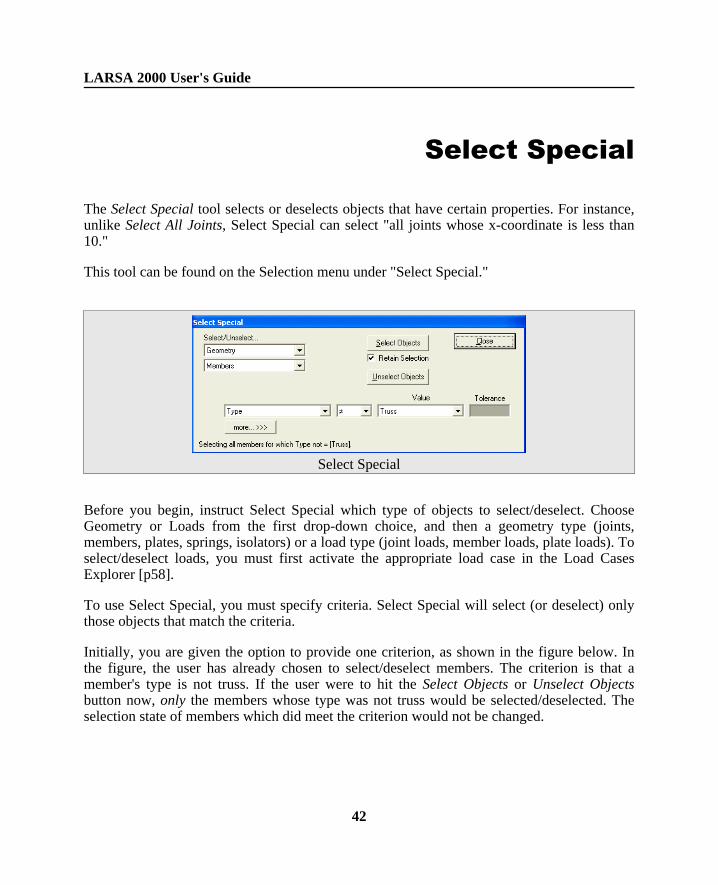
Select Special
Before you begin, instruct Select Special which type of objects to select/deselect. ChooseGeometry or Loads from the first drop-down choice, and then a geometry type (joints,members, plates, springs, isolators) or a load type (joint loads, member loads, plate loads). Toselect/deselect loads, you must first activate the appropriate load case in the Load CasesExplorer [p58].
To use Select Special, you must specify criteria. Select Special will select (or deselect) onlythose objects that match the criteria.
Initially, you are given the option to provide one criterion, as shown in the figure below. Inthe figure, the user has already chosen to select/deselect members. The criterion is that amember's type is not truss. If the user were to hit the Select Objects or Unselect Objectsbutton now, only the members whose type was not truss would be selected/deselected. Theselection state of members which did meet the criterion would not be changed.
LARSA 2000 User's Guide
42
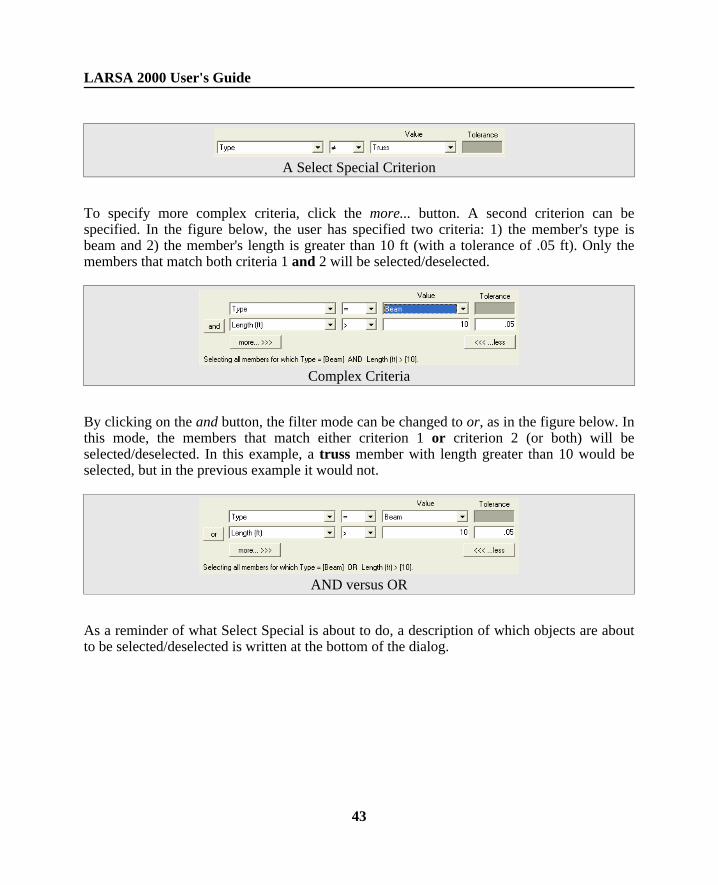
A Select Special Criterion
To specify more complex criteria, click the more... button. A second criterion can bespecified. In the figure below, the user has specified two criteria: 1) the member's type isbeam and 2) the member's length is greater than 10 ft (with a tolerance of .05 ft). Only themembers that match both criteria 1 and 2 will be selected/deselected.
Complex Criteria
By clicking on the and button, the filter mode can be changed to or, as in the figure below. Inthis mode, the members that match either criterion 1 or criterion 2 (or both) will beselected/deselected. In this example, a truss member with length greater than 10 would beselected, but in the previous example it would not.
AND versus OR
As a reminder of what Select Special is about to do, a description of which objects are aboutto be selected/deselected is written at the bottom of the dialog.
LARSA 2000 User's Guide
43
Select by Plane
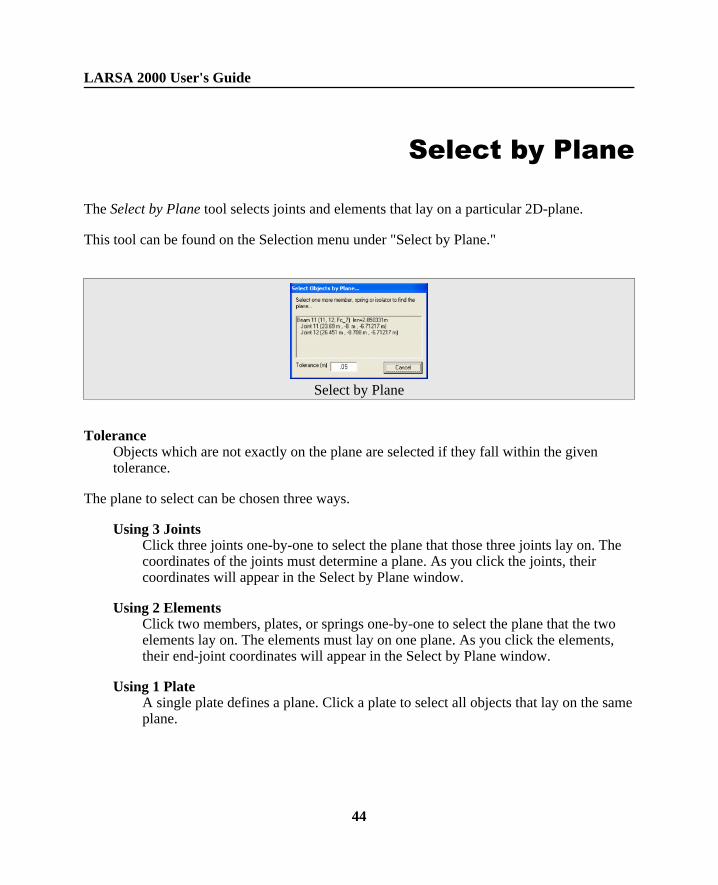
The Select by Plane tool selects joints and elements that lay on a particular 2D-plane.
This tool can be found on the Selection menu under "Select by Plane."
Select by Plane
ToleranceObjects which are not exactly on the plane are selected if they fall within the giventolerance.
The plane to select can be chosen three ways.
Using 3 JointsClick three joints one-by-one to select the plane that those three joints lay on. Thecoordinates of the joints must determine a plane. As you click the joints, theircoordinates will appear in the Select by Plane window.
Using 2 ElementsClick two members, plates, or springs one-by-one to select the plane that the twoelements lay on. The elements must lay on one plane. As you click the elements,their end-joint coordinates will appear in the Select by Plane window.
Using 1 PlateA single plate defines a plane. Click a plate to select all objects that lay on the sameplane.
LARSA 2000 User's Guide
44
Select by Polygon
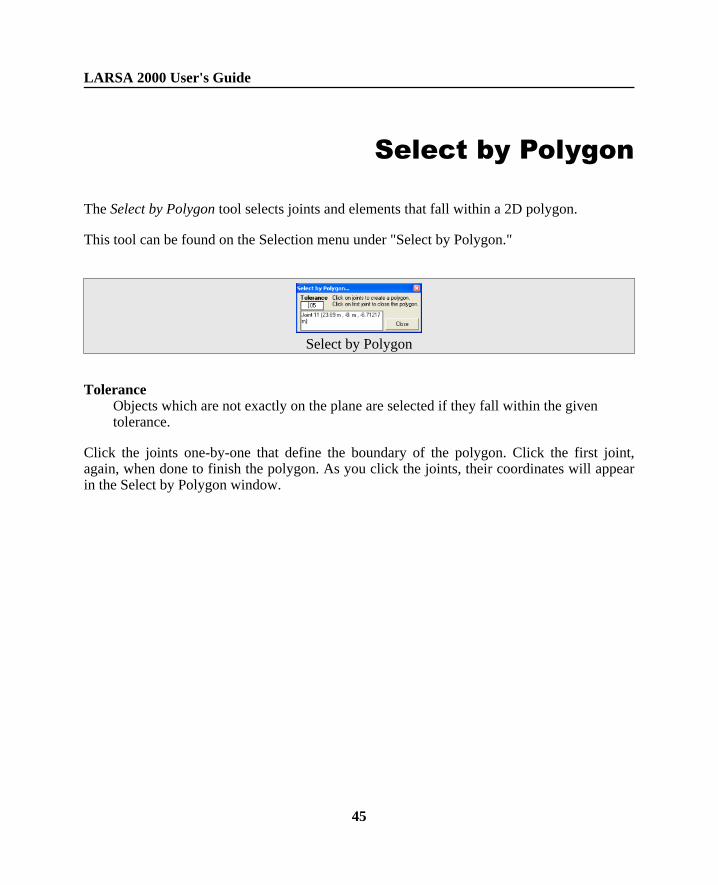
The Select by Polygon tool selects joints and elements that fall within a 2D polygon.
This tool can be found on the Selection menu under "Select by Polygon."
Select by Polygon
ToleranceObjects which are not exactly on the plane are selected if they fall within the giventolerance.
Click the joints one-by-one that define the boundary of the polygon. Click the first joint,again, when done to finish the polygon. As you click the joints, their coordinates will appearin the Select by Polygon window.
LARSA 2000 User's Guide
45
Graphics Display Options
The graphics display options control how structures are displayed in the graphics window.These options are located in various parts of LARSA 2000.
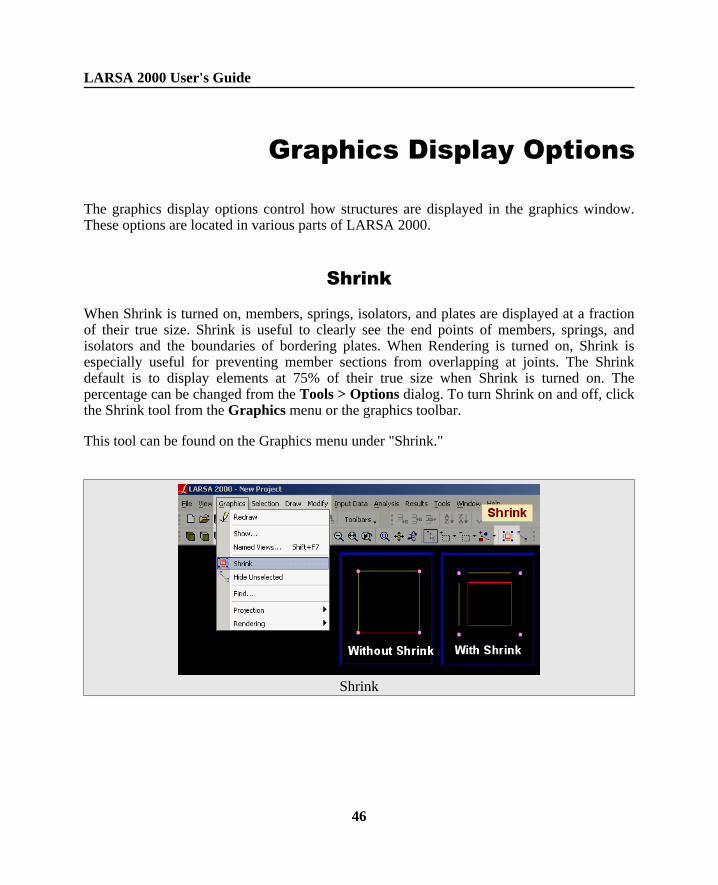
Shrink
When Shrink is turned on, members, springs, isolators, and plates are displayed at a fractionof their true size. Shrink is useful to clearly see the end points of members, springs, andisolators and the boundaries of bordering plates. When Rendering is turned on, Shrink isespecially useful for preventing member sections from overlapping at joints. The Shrinkdefault is to display elements at 75% of their true size when Shrink is turned on. Thepercentage can be changed from the Tools > Options dialog. To turn Shrink on and off, clickthe Shrink tool from the Graphics menu or the graphics toolbar.
This tool can be found on the Graphics menu under "Shrink."
Shrink
LARSA 2000 User's Guide
46
Orthographic/Perspective Projection
The graphic window may present the structure in one of two projections: orthographic orperspective.
Under orthographic mode, structural elements do not become smaller as they become fartheraway (there is no perspective). Orthographic mode is most useful while modeling thestructure, as it does not have any distortions.
On the other hand, perspective mode is closer to a realistic display of the structure andgenerally makes the structure easier to view. Because of the distortions inherent in aperspective view, it is sometimes confusing when modeling. Perspective view can also behighly distored when looking at certain structures from certain directions.
This tool can be found on the Graphics menu under "Projection."
Icon Size
Certain elements are displayed as icons, such as supports and loads. The size of these iconsmay need to be adjusted when working on very large structures, as the icons may overcrowdthe display. The Icon Size may be adjusted from the Show dialog, which is on the Graphicsmenu or on the graphics right-click menu when using the Pointer Tool. The Icon Size may beSmall or Large. Large is the default and is suitable under most circumstances.
This tool can be found on the Graphics menu under "Show."
Element Labels and Icons
Element labels (such as joint numbers, plate thicknesses, spring types) can be displayedbeside each element. Each element type (joint, member, plate, spring, isolator) may only haveat most one label type turned on at a time. Orientation and Rigid Zone Icons may also bedisplayed on members. These options are available in the Show dialog, which is on theGraphics menu or on the graphics right-click menu when using the Pointer Tool.
LARSA 2000 User's Guide
47
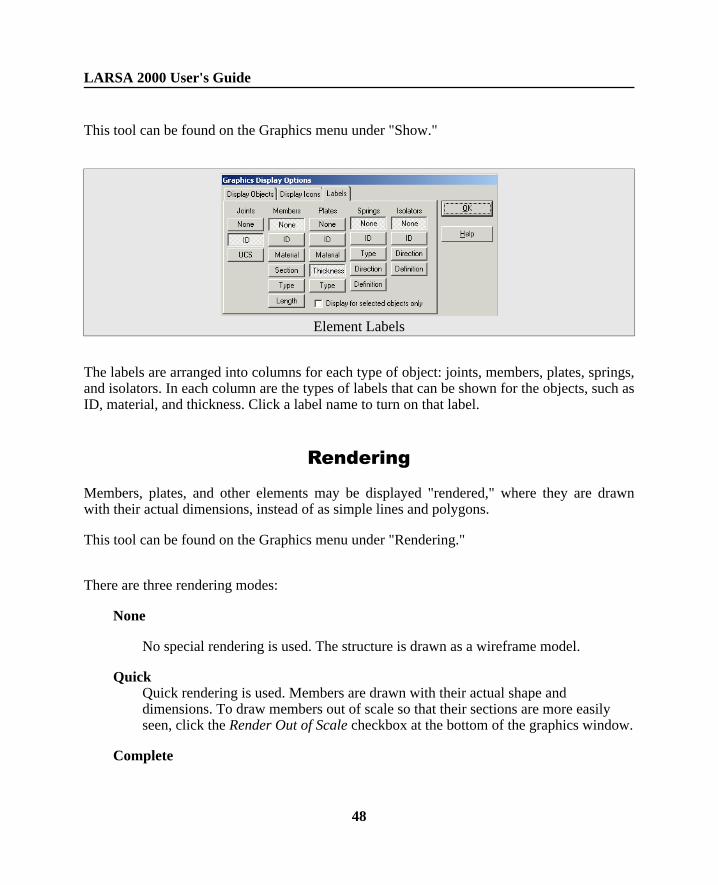
This tool can be found on the Graphics menu under "Show."
Element Labels
The labels are arranged into columns for each type of object: joints, members, plates, springs,and isolators. In each column are the types of labels that can be shown for the objects, such asID, material, and thickness. Click a label name to turn on that label.
Rendering
Members, plates, and other elements may be displayed "rendered," where they are drawnwith their actual dimensions, instead of as simple lines and polygons.
This tool can be found on the Graphics menu under "Rendering."
There are three rendering modes:
None
No special rendering is used. The structure is drawn as a wireframe model.
QuickQuick rendering is used. Members are drawn with their actual shape anddimensions. To draw members out of scale so that their sections are more easilyseen, click the Render Out of Scale checkbox at the bottom of the graphics window.
Complete
LARSA 2000 User's Guide
48
Full rendering is used. Both members and plates are drawn with their actual shapeand dimensions, and lighting effects are also used. To draw members out of scaleso that their sections are more easily seen, click the Render Out of Scale checkboxat the bottom of the graphics window.
LARSA 2000 User's Guide
49
Graphics Window Grid
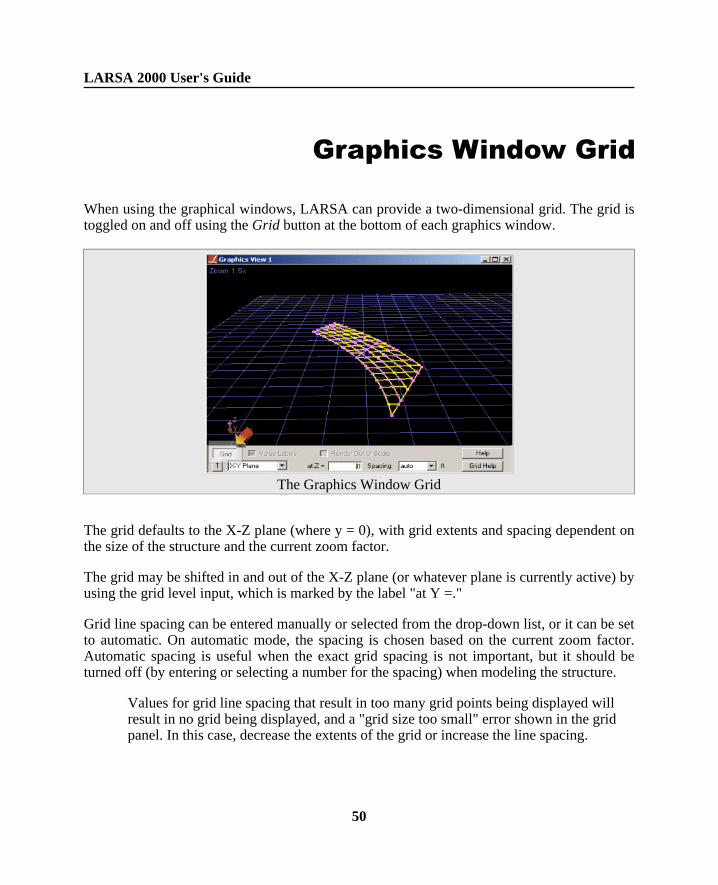
When using the graphical windows, LARSA can provide a two-dimensional grid. The grid istoggled on and off using the Grid button at the bottom of each graphics window.
The Graphics Window Grid
The grid defaults to the X-Z plane (where y = 0), with grid extents and spacing dependent onthe size of the structure and the current zoom factor.
The grid may be shifted in and out of the X-Z plane (or whatever plane is currently active) byusing the grid level input, which is marked by the label "at Y =."
Grid line spacing can be entered manually or selected from the drop-down list, or it can be setto automatic. On automatic mode, the spacing is chosen based on the current zoom factor.Automatic spacing is useful when the exact grid spacing is not important, but it should beturned off (by entering or selecting a number for the spacing) when modeling the structure.
Values for grid line spacing that result in too many grid points being displayed willresult in no grid being displayed, and a "grid size too small" error shown in the gridpanel. In this case, decrease the extents of the grid or increase the line spacing.
LARSA 2000 User's Guide
50
Grid extents are also chosen automatically by default. Before modeling the structure, enteringvalues for the extents manually will prevent the extents from changing automatically. To setthe extents manually, click the up arrow, which is directly below the Grid button. In the GridExtents box which will appear at the lower-left of the graphics display, the grid extents maybe entered. Additionally, separate grid spacing values can be entered for each of the threeaxes. Automatic extents may be turned on and off by clicking the "Auto" checkbox in theGrid Extents box. To close the Grid Extents box, click the up arrow again.
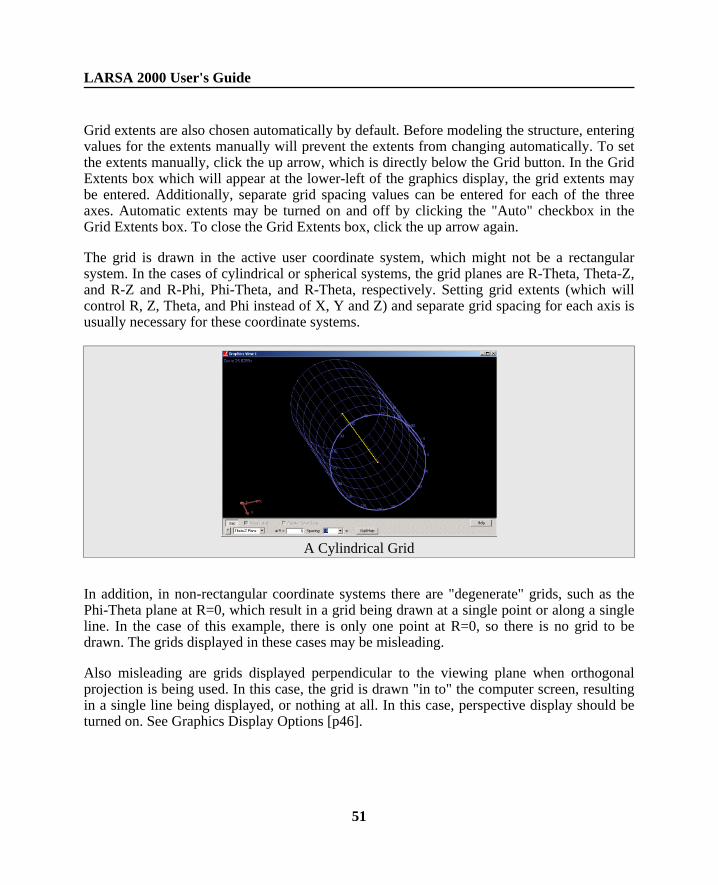
The grid is drawn in the active user coordinate system, which might not be a rectangularsystem. In the cases of cylindrical or spherical systems, the grid planes are R-Theta, Theta-Z,and R-Z and R-Phi, Phi-Theta, and R-Theta, respectively. Setting grid extents (which willcontrol R, Z, Theta, and Phi instead of X, Y and Z) and separate grid spacing for each axis isusually necessary for these coordinate systems.
A Cylindrical Grid
In addition, in non-rectangular coordinate systems there are "degenerate" grids, such as thePhi-Theta plane at R=0, which result in a grid being drawn at a single point or along a singleline. In the case of this example, there is only one point at R=0, so there is no grid to bedrawn. The grids displayed in these cases may be misleading.
Also misleading are grids displayed perpendicular to the viewing plane when orthogonalprojection is being used. In this case, the grid is drawn "in to" the computer screen, resultingin a single line being displayed, or nothing at all. In this case, perspective display should beturned on. See Graphics Display Options [p46].
LARSA 2000 User's Guide
51
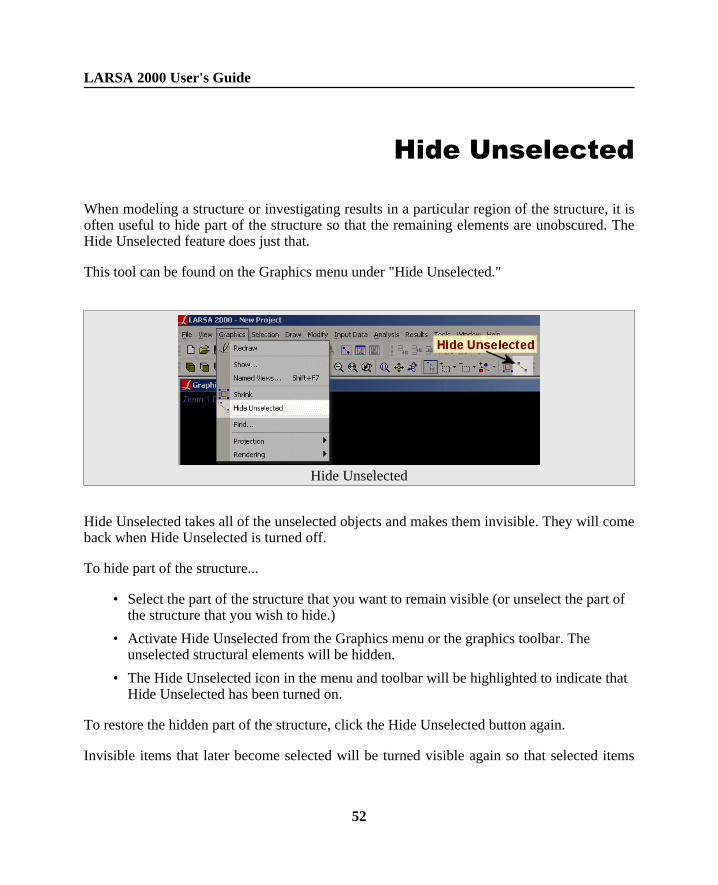
Hide Unselected
When modeling a structure or investigating results in a particular region of the structure, it isoften useful to hide part of the structure so that the remaining elements are unobscured. TheHide Unselected feature does just that.
This tool can be found on the Graphics menu under "Hide Unselected."
Hide Unselected
Hide Unselected takes all of the unselected objects and makes them invisible. They will comeback when Hide Unselected is turned off.
To hide part of the structure...
• Select the part of the structure that you want to remain visible (or unselect the part ofthe structure that you wish to hide.)
• Activate Hide Unselected from the Graphics menu or the graphics toolbar. Theunselected structural elements will be hidden.
• The Hide Unselected icon in the menu and toolbar will be highlighted to indicate thatHide Unselected has been turned on.
To restore the hidden part of the structure, click the Hide Unselected button again.
Invisible items that later become selected will be turned visible again so that selected items
LARSA 2000 User's Guide
52

are always shown.
LARSA 2000 User's Guide
53
Explorers
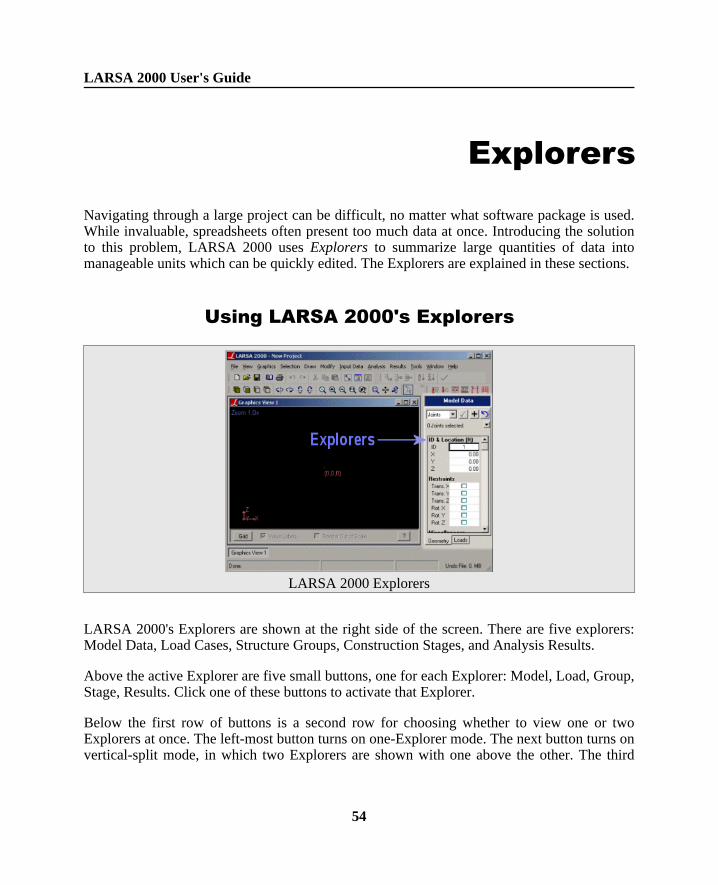
Navigating through a large project can be difficult, no matter what software package is used.While invaluable, spreadsheets often present too much data at once. Introducing the solutionto this problem, LARSA 2000 uses Explorers to summarize large quantities of data intomanageable units which can be quickly edited. The Explorers are explained in these sections.
Using LARSA 2000's Explorers
LARSA 2000 Explorers
LARSA 2000's Explorers are shown at the right side of the screen. There are five explorers:Model Data, Load Cases, Structure Groups, Construction Stages, and Analysis Results.
Above the active Explorer are five small buttons, one for each Explorer: Model, Load, Group,Stage, Results. Click one of these buttons to activate that Explorer.
Below the first row of buttons is a second row for choosing whether to view one or twoExplorers at once. The left-most button turns on one-Explorer mode. The next button turns onvertical-split mode, in which two Explorers are shown with one above the other. The third
LARSA 2000 User's Guide
54
button turns on horizontal-split mode, in which two Explorers are shown side-by-side. Whentwo Explorers are show, the last button is enabled and when clicked will reverse the positionsof the two Explorers.
To resize explorers, bring the mouse over the left border of the explorer. When the mousebecomes a horizontal arrow, drag the border sideways.
If screen space is limited, the explorers can be hidden. To hide the explorers, choose the Viewmenu and uncheck the command Show Explorers. To show the explorers again, choose thesame command again.
Model Data Explorer 56
Load Cases Explorer 58
Structure Groups Explorer 60
Construction Stages Explorer 64
Analysis Results Explorer 66
LARSA 2000 User's Guide
55
Model Data Explorer
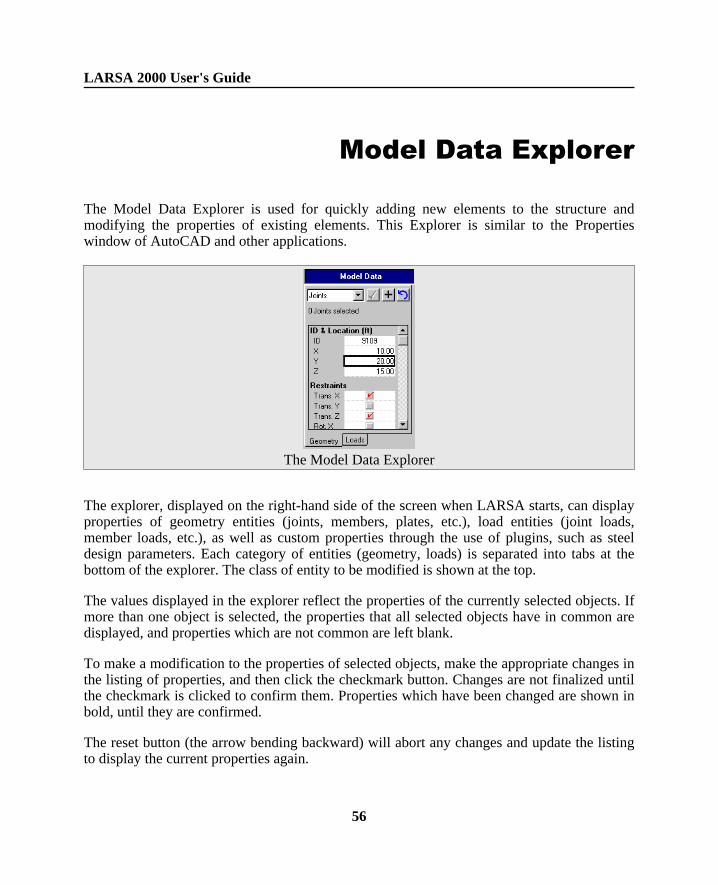
The Model Data Explorer is used for quickly adding new elements to the structure andmodifying the properties of existing elements. This Explorer is similar to the Propertieswindow of AutoCAD and other applications.
The Model Data Explorer
The explorer, displayed on the right-hand side of the screen when LARSA starts, can displayproperties of geometry entities (joints, members, plates, etc.), load entities (joint loads,member loads, etc.), as well as custom properties through the use of plugins, such as steeldesign parameters. Each category of entities (geometry, loads) is separated into tabs at thebottom of the explorer. The class of entity to be modified is shown at the top.
The values displayed in the explorer reflect the properties of the currently selected objects. Ifmore than one object is selected, the properties that all selected objects have in common aredisplayed, and properties which are not common are left blank.
To make a modification to the properties of selected objects, make the appropriate changes inthe listing of properties, and then click the checkmark button. Changes are not finalized untilthe checkmark is clicked to confirm them. Properties which have been changed are shown inbold, until they are confirmed.
The reset button (the arrow bending backward) will abort any changes and update the listingto display the current properties again.
LARSA 2000 User's Guide
56
To add a new object, enter the properties of the object, and then click the add button (the plussign). Be sure to set the properties first, as the Explorer will continue to display the propertiesof all selected objects afterwards, not just the new object. For geometry items, the add buttonwill not be available unless a unique ID for the object has been supplied.
If no objects of the type being modified are currently selected, then the explorer will displaydefault values, and the checkmark will not be available.
The Model Data Explorer can be used to quickly select objects by their ID. If the Explorer isshowing properties of selected joints, enter the ID of a joint in the ID field and hit enter, andthat joint will be selected. All other objects will be deselected. You may also enter ranges andlists of IDs (e.g. 1-10,25,26).
LARSA 2000 User's Guide
57
Load Cases Explorer
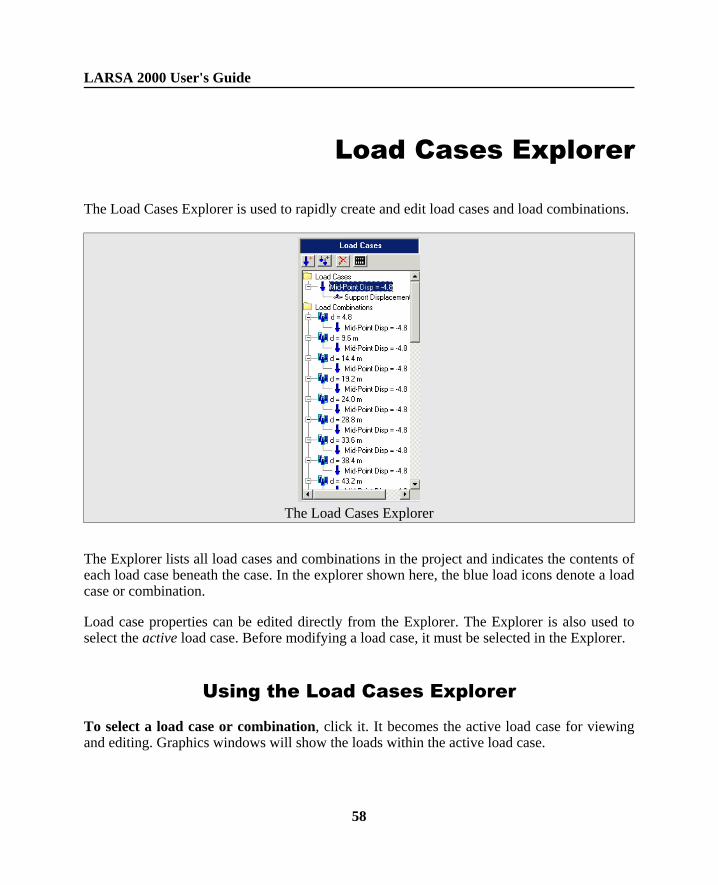
The Load Cases Explorer is used to rapidly create and edit load cases and load combinations.
The Load Cases Explorer
The Explorer lists all load cases and combinations in the project and indicates the contents ofeach load case beneath the case. In the explorer shown here, the blue load icons denote a loadcase or combination.
Load case properties can be edited directly from the Explorer. The Explorer is also used toselect the active load case. Before modifying a load case, it must be selected in the Explorer.
Using the Load Cases Explorer
To select a load case or combination, click it. It becomes the active load case for viewingand editing. Graphics windows will show the loads within the active load case.
LARSA 2000 User's Guide
58
To Create a New Load Case, click the New Load Case button, which has a plus sign next toa single load icon.
To Create a New Load Combination, click the New Load Combination button, which has aplus sign next to a load group icon (two arrows).
Right-click a load case or combination to modify its name, properties (including self-weightapplication), or to duplicate the case.
Double-click a load case, or click the spreadsheet button in the Explorer, to edit the contentsof the load case numerically in a spreadsheet.
Load cases can be added to load combinations by clicking-and-dragging the load case ontothe appropriate load combination. To remove a load case from a load combination, simplydrag the case out of the combination. To edit a load case's factor as applied in a loadcombination, right-click the load case.
To delete a case, select the case and then click the delete (X) button.
For More Information
• Static Load Cases [in LARSA 2000 Reference].• Load Combinations [in LARSA 2000 Reference].• Self Weight [in LARSA 2000 Reference].
LARSA 2000 User's Guide
59
Structure Groups Explorer
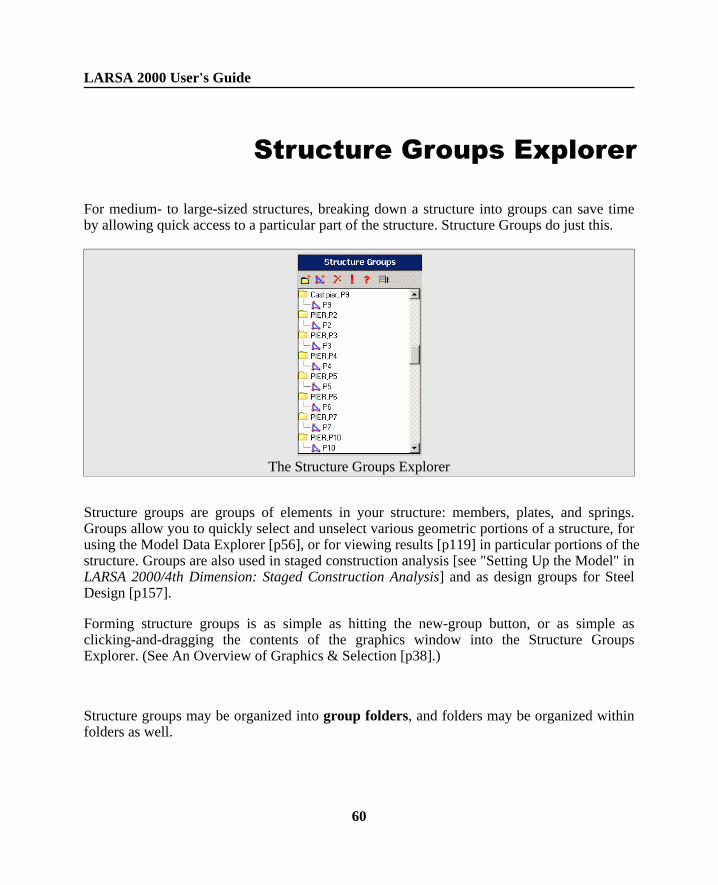
For medium- to large-sized structures, breaking down a structure into groups can save timeby allowing quick access to a particular part of the structure. Structure Groups do just this.
The Structure Groups Explorer
Structure groups are groups of elements in your structure: members, plates, and springs.Groups allow you to quickly select and unselect various geometric portions of a structure, forusing the Model Data Explorer [p56], or for viewing results [p119] in particular portions of thestructure. Groups are also used in staged construction analysis [see "Setting Up the Model" inLARSA 2000/4th Dimension: Staged Construction Analysis] and as design groups for SteelDesign [p157].
Forming structure groups is as simple as hitting the new-group button, or as simple asclicking-and-dragging the contents of the graphics window into the Structure GroupsExplorer. (See An Overview of Graphics & Selection [p38].)
Structure groups may be organized into group folders, and folders may be organized withinfolders as well.
LARSA 2000 User's Guide
60
Clicking on a structure group in the explorer will unselect all objects and then select onlythe objects within that group. Clicking a group folder will select all of the objects containedin all groups within that folder.
Hold CTRL while clicking structure groups to select more than one group.
Geometry elements may be members of multiple groups.
Groups can also be used to color different parts of a structure.
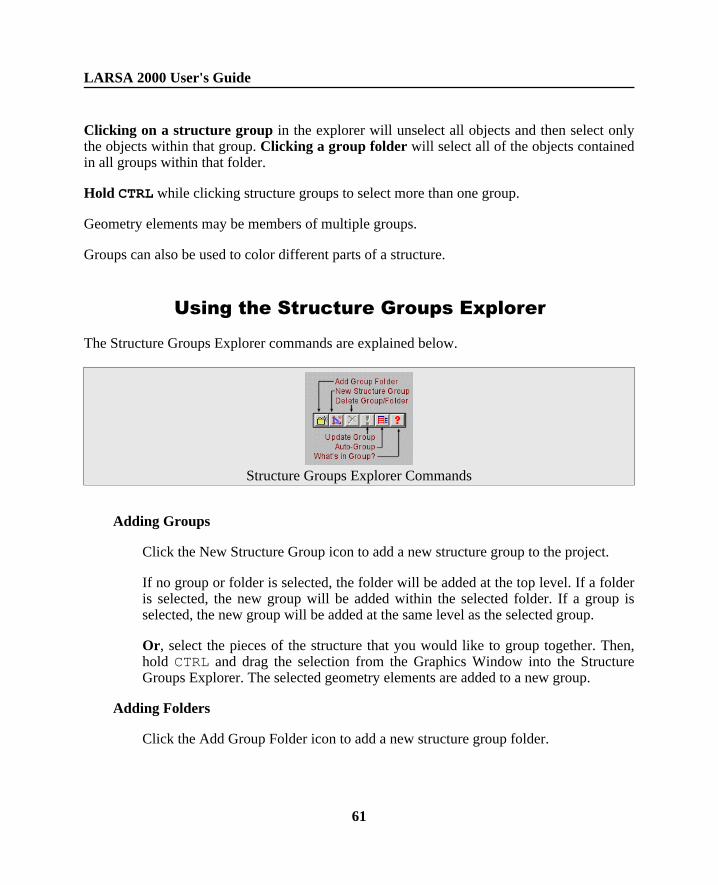
Using the Structure Groups Explorer
The Structure Groups Explorer commands are explained below.
Structure Groups Explorer Commands
Adding Groups
Click the New Structure Group icon to add a new structure group to the project.
If no group or folder is selected, the folder will be added at the top level. If a folderis selected, the new group will be added within the selected folder. If a group isselected, the new group will be added at the same level as the selected group.
Or, select the pieces of the structure that you would like to group together. Then,hold CTRL and drag the selection from the Graphics Window into the StructureGroups Explorer. The selected geometry elements are added to a new group.
Adding Folders
Click the Add Group Folder icon to add a new structure group folder.
LARSA 2000 User's Guide
61
If no group or folder is selected, the folder will be added at the top level. If a folderis selected, the new folder will be added within the selected folder. If a group isselected, the new folder will be added at the same level as the selected group.
Updating a Group
To change the contents of a structure group, first select the group in the explorer.Then, select only the object and all of the objects that you would like to be the newcontents of the group. Finally, click the Update button to update the group with theselected objects.
For example, to remove objects from a group, simply select the group in theexplorer, unselect the objects to delete, and click Update.
Setting a Group's Color
To change the color of all objects in a group, right-click the group and chooseColor.... To reset the color of a group, click Color... and choose Reset.
If an object is in multiple groups with colors, the color for the object is chosenarbitrarily.
Viewing and Editing Groups
To view and edit the contents of a structure group, select it in the explorer and clickthe What's in Group? button. You can add and remove objects from groups here aswell.
Managing Groups and Folders
Groups and folders may be moved into folders by clicking-and-dragging them ontop of folders. Bring a group or folder to the top level by dragging it into the emptywhitespace of the explorer.
While dragging a group, hold CTRL to make a copy of the group in the folderwhere you drop the group. No new members/plates will be created. Only a newstructure group will be formed with the same contents as the old group.
To delete a group or folder, select the folder and then click the Delete button.
Auto-Grouping
LARSA 2000 User's Guide
62
LARSA can automatically divide a structure into groups of floors and walls if thefloors and walls are in standard planes (planes parallel to the global x-y, x-z, or y-zplanes).
Click the auto-group button and choose which axis represents elevation. (If thefloors are on planes parallel to the x-y plane, choose the z-axis.)
Set a tolerance level so that objects at nearly-identical elevations are groupedtogether.
LARSA 2000 User's Guide
63
Construction StagesExplorer
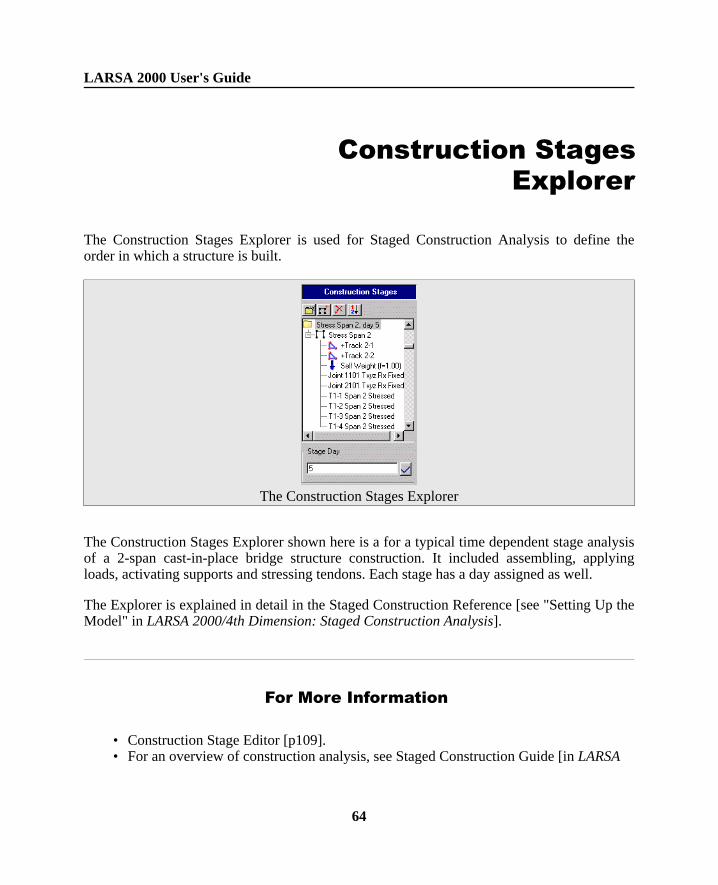
The Construction Stages Explorer is used for Staged Construction Analysis to define theorder in which a structure is built.
The Construction Stages Explorer
The Construction Stages Explorer shown here is a for a typical time dependent stage analysisof a 2-span cast-in-place bridge structure construction. It included assembling, applyingloads, activating supports and stressing tendons. Each stage has a day assigned as well.
The Explorer is explained in detail in the Staged Construction Reference [see "Setting Up theModel" in LARSA 2000/4th Dimension: Staged Construction Analysis].
For More Information
• Construction Stage Editor [p109].• For an overview of construction analysis, see Staged Construction Guide [in LARSA
LARSA 2000 User's Guide
64

2000/4th Dimension: Staged Construction Analysis].
LARSA 2000 User's Guide
65
Analysis Results Explorer
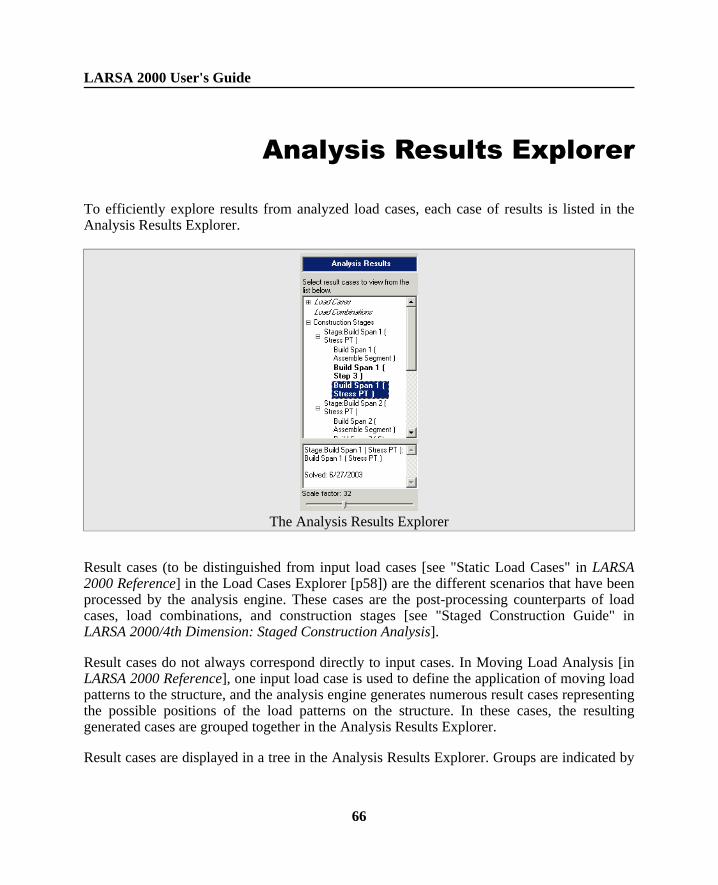
To efficiently explore results from analyzed load cases, each case of results is listed in theAnalysis Results Explorer.
The Analysis Results Explorer
Result cases (to be distinguished from input load cases [see "Static Load Cases" in LARSA2000 Reference] in the Load Cases Explorer [p58]) are the different scenarios that have beenprocessed by the analysis engine. These cases are the post-processing counterparts of loadcases, load combinations, and construction stages [see "Staged Construction Guide" inLARSA 2000/4th Dimension: Staged Construction Analysis].
Result cases do not always correspond directly to input cases. In Moving Load Analysis [inLARSA 2000 Reference], one input load case is used to define the application of moving loadpatterns to the structure, and the analysis engine generates numerous result cases representingthe possible positions of the load patterns on the structure. In these cases, the resultinggenerated cases are grouped together in the Analysis Results Explorer.
Result cases are displayed in a tree in the Analysis Results Explorer. Groups are indicated by
LARSA 2000 User's Guide
66
a plus or minus sign next to them. Click a plus sign to expand the group and see what resultcases and groups it contains. Click a minus sign next to a group to collapse the group andhide its children.
Using the Analysis Results Explorer
Results for a case can be viewed by clicking the result case, and then selecting either agraphical result to display or a result spreadsheet from the Results menu. You can alsoright-click a case to access its spreadsheet results quickly. For more on accessing results, seeGetting Results [p119].
Select cases by clicking them. Hold CTRL while clicking to select multiple cases. HoldSHIFT to select a range of cases. CTRL+click a group to select or unselect all of the cases inthe group. Selected cases are shown in bold. The last case clicked is highlighted.
When viewing results in Results Spreadsheets [p127], results are displayed for each caseselected in the Analysis Results Explorer. When envelope is turned on in a resultsspreadsheet, then the spreadsheet displays an envelope of the result cases selected in theAnalysis Results Explorer.
When viewing results graphically [p120], the results are shown foreither the last result caseselected or for an envelope of all of the result cases selected in the Analyis Results Explorer.See Viewing Results Graphically [p120].
The date and time that a result case was solved is displayed at the bottom of the Explorer, andthe display scale factor for displaying deformed structure, mode shape and force diagramscan be easily adjusted from the explorer by dragging the slider at the bottom.
Use with Special Result Cases
Result cases created after an analysis is run (e.g. Linear Result Combinations [p131], ExtremeEffect Groups [p134] and Influence-Based Analysis [inLARSA 2000 Reference]) are alsoshown in the Analysis Results Explorer.
Their properties can be edited by right-clicking on the case and choosing Properties.
They can also be deleted by right-clicking on the case and choosing Delete.
LARSA 2000 User's Guide
67

For More Information
• For more on accessing results, see Getting Results [p119].
LARSA 2000 User's Guide
68
Modeling Tools
LARSA provides a handful of modeling tools to help in the creation of your structure. Themodeling tools are in the Draw and Modify menus.
The Draw menu's tools allow you to create new objects in your structure.
The Modify menu's tools are for modifying existing objects.
Drawing Geometry and Loads 70
Undo/Redo 75
Erase and Delete 76
Break, Merge, and Join 77
Transformations 79
Generation Tools 81
LARSA 2000 User's Guide
69
Drawing Geometry andLoads
There are number of methods to create a model in LARSA 2000, one of which is drawing.
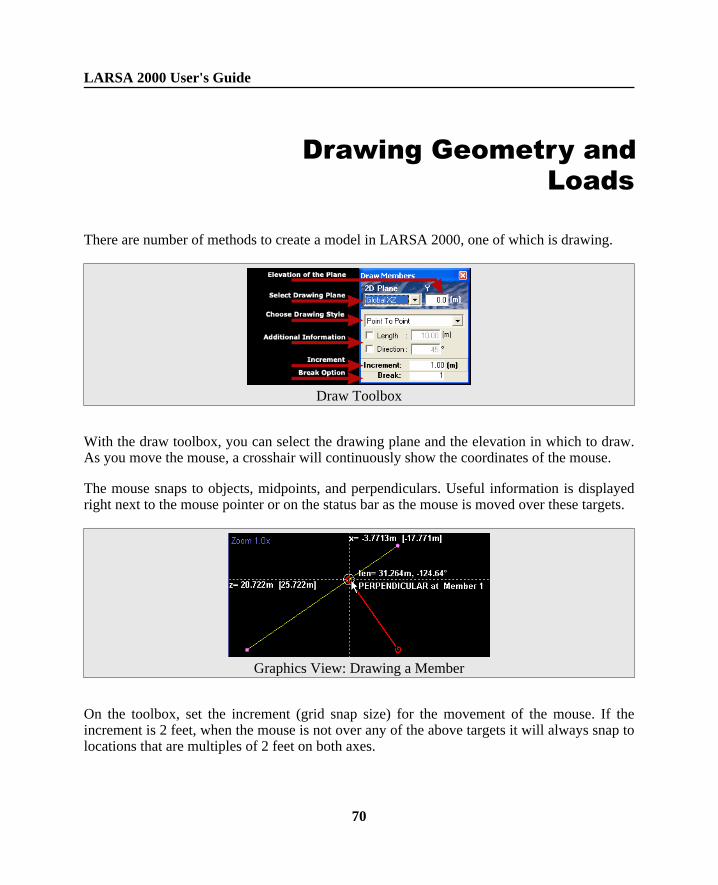
Draw Toolbox
With the draw toolbox, you can select the drawing plane and the elevation in which to draw.As you move the mouse, a crosshair will continuously show the coordinates of the mouse.
The mouse snaps to objects, midpoints, and perpendiculars. Useful information is displayedright next to the mouse pointer or on the status bar as the mouse is moved over these targets.
Graphics View: Drawing a Member
On the toolbox, set the increment (grid snap size) for the movement of the mouse. If theincrement is 2 feet, when the mouse is not over any of the above targets it will always snap tolocations that are multiples of 2 feet on both axes.
LARSA 2000 User's Guide
70
During the draw process, the Model Data Explorer [p56] automatically becomes active to letyou specify the properties of the geometry you are drawing. Set properties in the model dataexplorer before drawing so that the new objects you create take on those properties.
Right-clicking during the draw process will generally reset the current drawing command.When drawing plates, however, right clicking after specifying the third joint of the plate willcreate a three-node plate. For springs, right clicking after specifying the first node will createa grounded spring. Right clicking also has a special behavior when changing the supportconditions of a joint (see below).
Drawing Joints
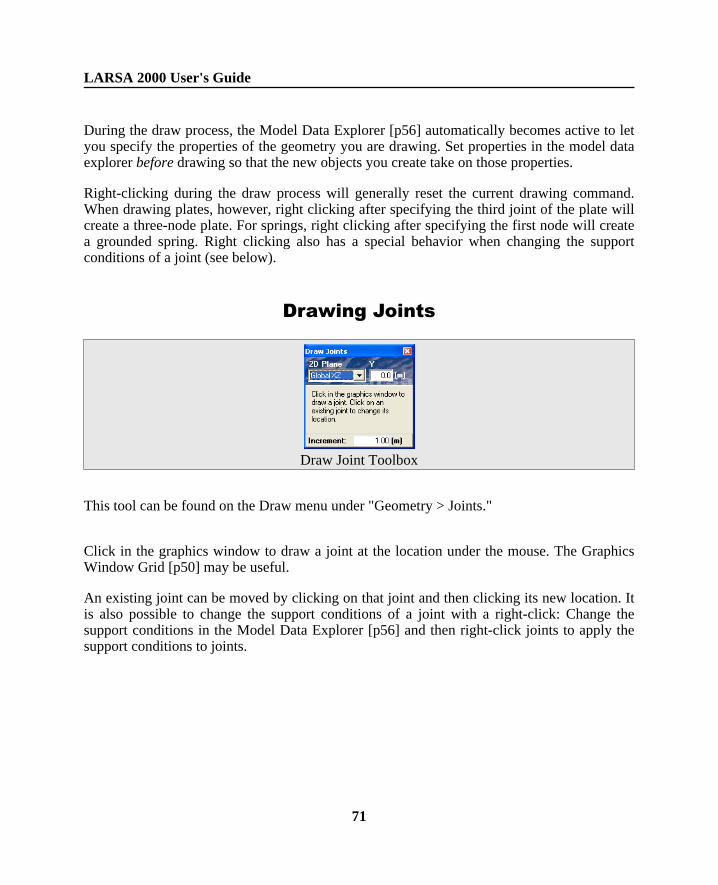
Draw Joint Toolbox
This tool can be found on the Draw menu under "Geometry > Joints."
Click in the graphics window to draw a joint at the location under the mouse. The GraphicsWindow Grid [p50] may be useful.
An existing joint can be moved by clicking on that joint and then clicking its new location. Itis also possible to change the support conditions of a joint with a right-click: Change thesupport conditions in the Model Data Explorer [p56] and then right-click joints to apply thesupport conditions to joints.
LARSA 2000 User's Guide
71
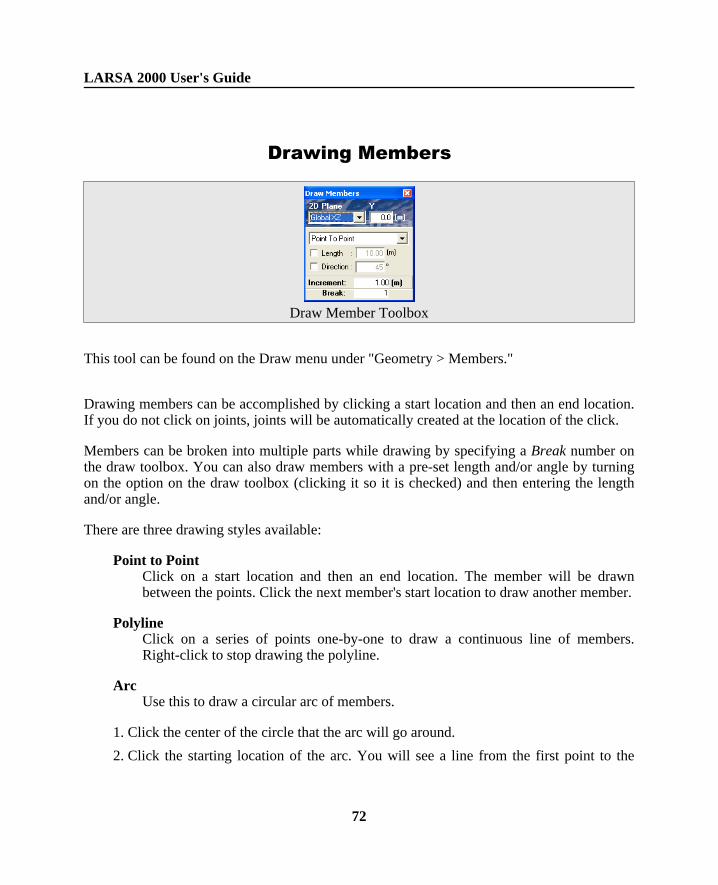
Drawing Members
Draw Member Toolbox
This tool can be found on the Draw menu under "Geometry > Members."
Drawing members can be accomplished by clicking a start location and then an end location.If you do not click on joints, joints will be automatically created at the location of the click.
Members can be broken into multiple parts while drawing by specifying a Break number onthe draw toolbox. You can also draw members with a pre-set length and/or angle by turningon the option on the draw toolbox (clicking it so it is checked) and then entering the lengthand/or angle.
There are three drawing styles available:
Point to PointClick on a start location and then an end location. The member will be drawnbetween the points. Click the next member's start location to draw another member.
PolylineClick on a series of points one-by-one to draw a continuous line of members.Right-click to stop drawing the polyline.
ArcUse this to draw a circular arc of members.
1. Click the center of the circle that the arc will go around.
2. Click the starting location of the arc. You will see a line from the first point to the
LARSA 2000 User's Guide
72
mouse indicating the radius of the arc.
3. Click the ending location of the arc. It must be on the circumference of the samecircle.
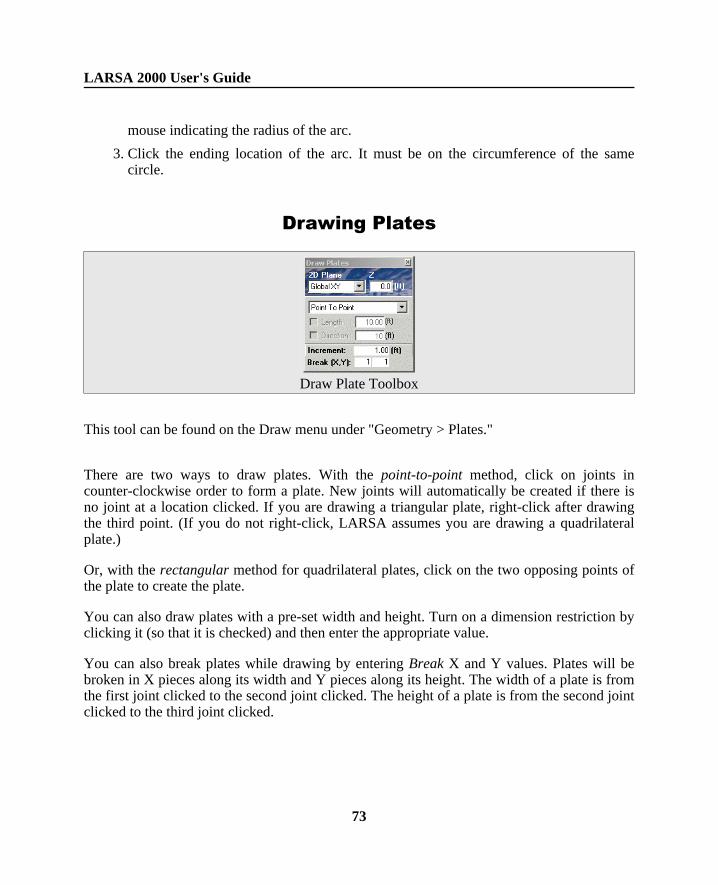
Drawing Plates
Draw Plate Toolbox
This tool can be found on the Draw menu under "Geometry > Plates."
There are two ways to draw plates. With the point-to-point method, click on joints incounter-clockwise order to form a plate. New joints will automatically be created if there isno joint at a location clicked. If you are drawing a triangular plate, right-click after drawingthe third point. (If you do not right-click, LARSA assumes you are drawing a quadrilateralplate.)
Or, with the rectangular method for quadrilateral plates, click on the two opposing points ofthe plate to create the plate.
You can also draw plates with a pre-set width and height. Turn on a dimension restriction byclicking it (so that it is checked) and then enter the appropriate value.
You can also break plates while drawing by entering Break X and Y values. Plates will bebroken in X pieces along its width and Y pieces along its height. The width of a plate is fromthe first joint clicked to the second joint clicked. The height of a plate is from the second jointclicked to the third joint clicked.
LARSA 2000 User's Guide
73
Drawing Springs
This tool can be found on the Draw menu under "Geometry > Springs."
You can draw springs by clicking on locations in the graphics window as you would fordrawing members (see above).
To draw grounded springs, click on a joint and then right-click to let LARSA know that youare done drawing.
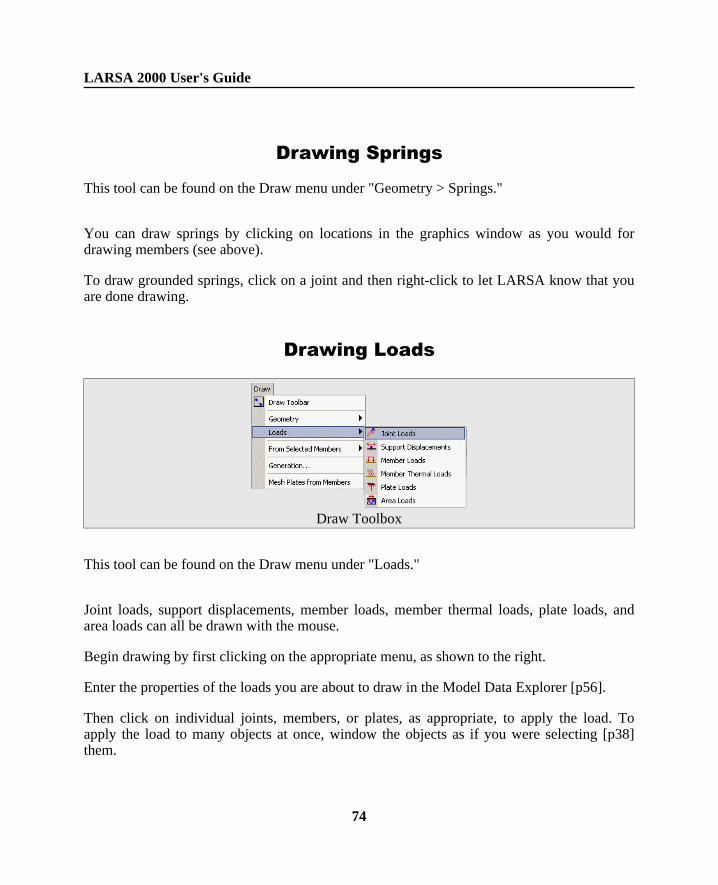
Drawing Loads
Draw Toolbox
This tool can be found on the Draw menu under "Loads."
Joint loads, support displacements, member loads, member thermal loads, plate loads, andarea loads can all be drawn with the mouse.
Begin drawing by first clicking on the appropriate menu, as shown to the right.
Enter the properties of the loads you are about to draw in the Model Data Explorer [p56].
Then click on individual joints, members, or plates, as appropriate, to apply the load. Toapply the load to many objects at once, window the objects as if you were selecting [p38]them.
LARSA 2000 User's Guide
74
Undo/Redo
The Undo/Redo capability of LARSA 2000 is one of the defining features of the program.Undo/Redo allows the user to reverse a change to the project — perhaps undoing anaccidental change — and then put it back again.
In LARSA 2000, all operations can be undone, save a small handful. Undo/Redo worksseamlessly with the spreadsheets, graphical editing tools, and Explorers. There is no limit tothe "Undo History," allowing you to undo all operations in the open project since the currentLARSA session began. Undo/Redo data is not saved with the project, so it lasts only as longas LARSA 2000 is running.
The Undo and Redo commands are on the Modify and Edit menus. (Only one of the twomenus is visible at a time. The Modify menu is available for the Graphics windows, and theEdit menu is available for the spreadsheet windows.)
When the Undo and Redo commands are available, a small description of the action that canbe undone appears in the menu item. The Undo command, for instance, might read "UndoAdd Joint," indicating the last operation that can be undone is adding a new joint. ChoosingUndo will delete that joint, as if it had never been created.
Redo puts back the last operation that was undone. As in the last example, Redo wouldrecreate that joint with the properties that it had before Undo removed it.
Undo/Redo data is stored in a temporary file. The size of that file is displayed in the statusbar. Only on very large models does the Undo/Redo file grow beyond a megabyte.
A small number of operations cannot be undone, including applying a unit conversion to theentire project. After such operations, all undo/redo data is cleared. Earlier operations can nolonger be undone. The user is prompted to confirm these operations and is warned of theconsequences.
LARSA 2000 User's Guide
75
Erase and Delete
The Erase and Delete commands, found on the Modify menu, remove geometric and loadentities from the model.
Erase
The Erase command deletes all selected geometric elements: joints, members, plates, springs,and isolators. All loads applied to the erased geometry are deleted.
If a joint is an end-point of a member and that member is not selected, then the joint cannotbe erased.
Delete Loads
The Delete Loads command removes all selected loads. Loads, like geometric elements, havea selected state. Only the selected loads are removed. Geometric elements that are notselected cannot have selected loads, so loads on unselected geometric elements areguaranteed to be ignored. No geometric elements are modified by Delete Loads.
LARSA 2000 User's Guide
76
Break, Merge, and Join
Break, merge, and join are three tools for manipulating joints, members, and plates. Thesetools are on the Modify menu.
Break Members, Break Plates
These tools are used to break the selected members and plates into pieces. All of the loadsplaced on the initial members and plates will be appropriately reassigned or redistributed ontothe pieces.
For breaking members, the number of segments n to break each member into is specified.By default, the members will be split evenly n ways. However, the position of the n-1 breakpoints can also be specified. Break points are given in relative terms, where 0 is the beginningof the member (the start joint) and 1 is the end of the member (the end joint). 0.5 specifies themiddle. To specify break points, enter the relative positions and separate each position with acomma.
For breaking plates, the number of horizontal and vertical segments to break each plate intois specified. If 3 horizontal segments and 2 vertical segments are specified, each plate will bebroken into 3*2 = 6 pieces. The direction meant by horizontal (X) is the direction of eachplate's local x-axis. A plate's local x-axis is from its first joint to its second joint. (See Plates[in LARSA 2000 Reference].)
Repeatedly breaking square plates can serve as a simple form of plate meshing.
Merge Joints
The Merge Joints command scans the selected joints looking for joints that have the samelocation (coincident). A tolerance can be specified to allow for rounding error.
After selecting Merge Joints from the menu, click Check to begin scanning. This process maytake some time if thousands of joints are selected.
LARSA 2000 User's Guide
77
Once the check is done, a list of each group of coincident joints is presented. Each row listsall of the joints that were found at a particular location. Uncheck a row if you do not wish tomerge those joints into one joint. Because a tolerance may be used, the coordinates ofcoincident joints may not be identical. In that case, for each row, you can choose whichjoint's coordinates to merge the joints into.
Finally, click Merge to perform the merge on any checked rows.
Join Members
Join Members looks through all of the selected members for any chain of members that formsa straight line. Join Members then joins all of those contiguous members into one, deletingany intermediate joints. If any intermediate joints cannot be deleted, then the chain will not bejoined.
All of the loads placed on the initial members will be appropriately reassigned orredistributed onto the new member.
LARSA 2000 User's Guide
78
Transformations
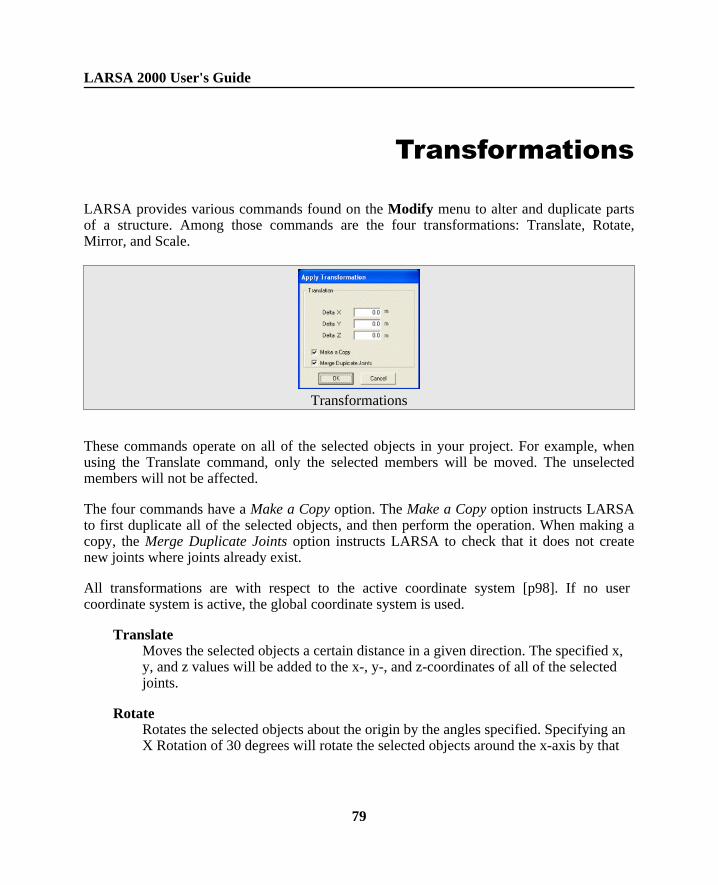
LARSA provides various commands found on the Modify menu to alter and duplicate partsof a structure. Among those commands are the four transformations: Translate, Rotate,Mirror, and Scale.
Transformations
These commands operate on all of the selected objects in your project. For example, whenusing the Translate command, only the selected members will be moved. The unselectedmembers will not be affected.
The four commands have a Make a Copy option. The Make a Copy option instructs LARSAto first duplicate all of the selected objects, and then perform the operation. When making acopy, the Merge Duplicate Joints option instructs LARSA to check that it does not createnew joints where joints already exist.
All transformations are with respect to the active coordinate system [p98]. If no usercoordinate system is active, the global coordinate system is used.
TranslateMoves the selected objects a certain distance in a given direction. The specified x,y, and z values will be added to the x-, y-, and z-coordinates of all of the selectedjoints.
RotateRotates the selected objects about the origin by the angles specified. Specifying anX Rotation of 30 degrees will rotate the selected objects around the x-axis by that
LARSA 2000 User's Guide
79
angle.
MirrorReflects the selected objects over the specified plane.
ScaleMultiplies the x-, y-, and z-coordinates of the selected objects by the specified scalefactors.
LARSA 2000 User's Guide
80
Generation Tools
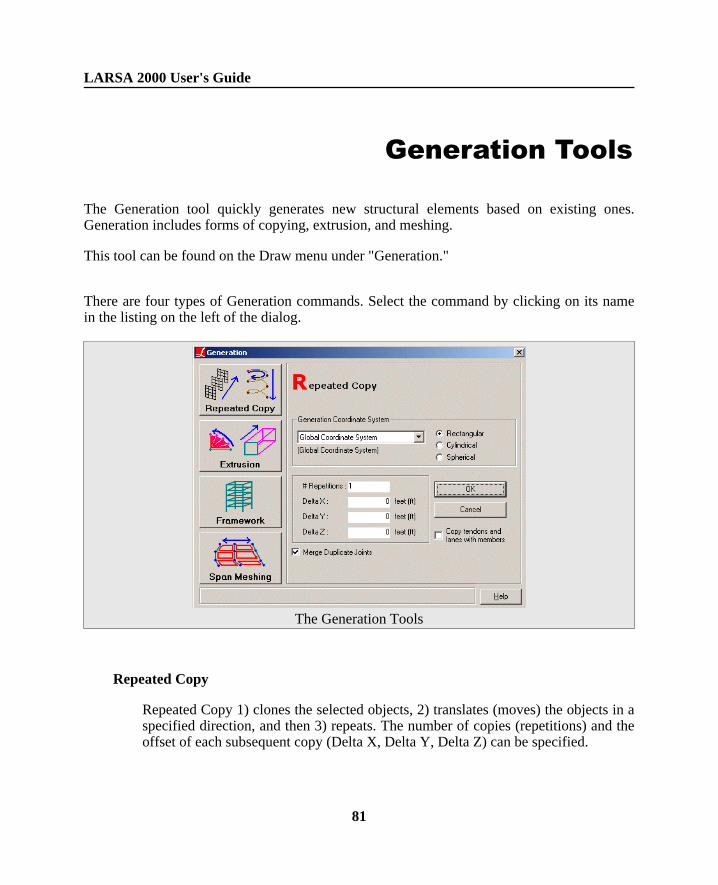
The Generation tool quickly generates new structural elements based on existing ones.Generation includes forms of copying, extrusion, and meshing.
This tool can be found on the Draw menu under "Generation."
There are four types of Generation commands. Select the command by clicking on its namein the listing on the left of the dialog.
The Generation Tools
Repeated Copy
Repeated Copy 1) clones the selected objects, 2) translates (moves) the objects in aspecified direction, and then 3) repeats. The number of copies (repetitions) and theoffset of each subsequent copy (Delta X, Delta Y, Delta Z) can be specified.
LARSA 2000 User's Guide
81
Repeated Copy can be applied in either the Global Coordinate System or in anyuser coordinate system [p98] of any type. In a rectangular UCS, the Delta X/Y/Zvalues are applied in the directions of the UCS's axes. In a cylindrical or sphericalcoordinate system, Delta R/Theta/Z or Delta R/Phi/Theta is specified, respectively.In those cases, the translations of each object will not all be parallel, but insteadthey will curve about the axes of the UCS. Arcs, spirals, and helixes can be createdusing Repeated Copy in a non-rectangular coordinate system.
The Merge Duplicate Joints option instructs LARSA to not create new, separatejoints at locations where joints already exist. For instance, if a joint at (10, 0, 0) isselected and you specify a repeated copy with Delta Y = 5 and a joint already existsat (10, 5, 0), then the existing joint at (10, 5, 0) will be used as the copy, rather thancreating a second joint at that location. If this option is not checked, coincidentjoints may be created.
Extrusion
Extrusion will extrude selected joints into members or selected members into platesalong the given direction. The extrusion will repeat a specified number of times.
The direction of extrusion follows the coordinate system specified in theGeneration Coordinate System box. See Repeated Copy (above) for moreinformation on using a UCS or non-rectangular coordinate system.
Select whether to extrude members, plates, or both in the Element Type drop-downchoice.
If only joints are being extruded into members, then all of the selected memberswill be copied in tandem with the extrusion in the same manner as Repeated Copy.
When extruding members, the new members will be given the type specified in theMember Type drop-down choice.
See the description of Merge Duplicate Joints, above.
Framework
Framework generates a framework of members based on a set of floor height andbay width/depth parameters. Framework can be used to quickly set up a buildingmodel.
LARSA 2000 User's Guide
82
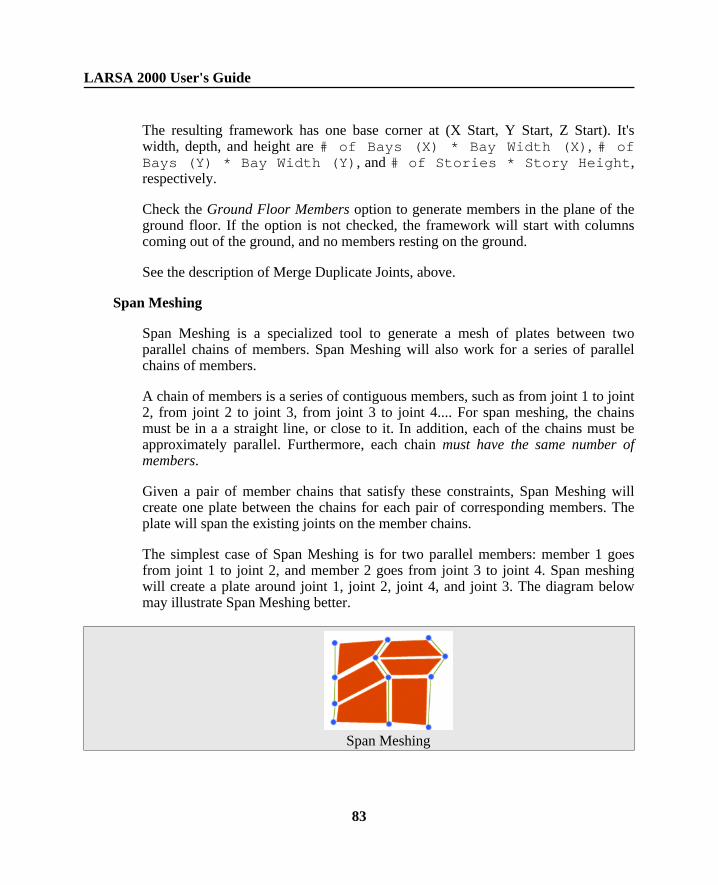
The resulting framework has one base corner at (X Start, Y Start, Z Start). It'swidth, depth, and height are # of Bays (X) * Bay Width (X), # ofBays (Y) * Bay Width (Y), and # of Stories * Story Height,respectively.
Check the Ground Floor Members option to generate members in the plane of theground floor. If the option is not checked, the framework will start with columnscoming out of the ground, and no members resting on the ground.
See the description of Merge Duplicate Joints, above.
Span Meshing
Span Meshing is a specialized tool to generate a mesh of plates between twoparallel chains of members. Span Meshing will also work for a series of parallelchains of members.
A chain of members is a series of contiguous members, such as from joint 1 to joint2, from joint 2 to joint 3, from joint 3 to joint 4.... For span meshing, the chainsmust be in a a straight line, or close to it. In addition, each of the chains must beapproximately parallel. Furthermore, each chain must have the same number ofmembers.
Given a pair of member chains that satisfy these constraints, Span Meshing willcreate one plate between the chains for each pair of corresponding members. Theplate will span the existing joints on the member chains.
The simplest case of Span Meshing is for two parallel members: member 1 goesfrom joint 1 to joint 2, and member 2 goes from joint 3 to joint 4. Span meshingwill create a plate around joint 1, joint 2, joint 4, and joint 3. The diagram belowmay illustrate Span Meshing better.
Span Meshing
LARSA 2000 User's Guide
83
Here there are three member chains (in grey), each composed of three members.Each of the three chains are close to straight lines, and the three chains are close toparallel. Span Meshing generated the six plates (in red) by connecting the adjacentchains at their corresponding joints.
See the description of Merge Duplicate Joints, above.
LARSA 2000 User's Guide
84

Project Options
The follow sections describe global project options.
Model Units 86
Universal Restraints 88
Connecting Databases 89
LARSA 2000 User's Guide
85
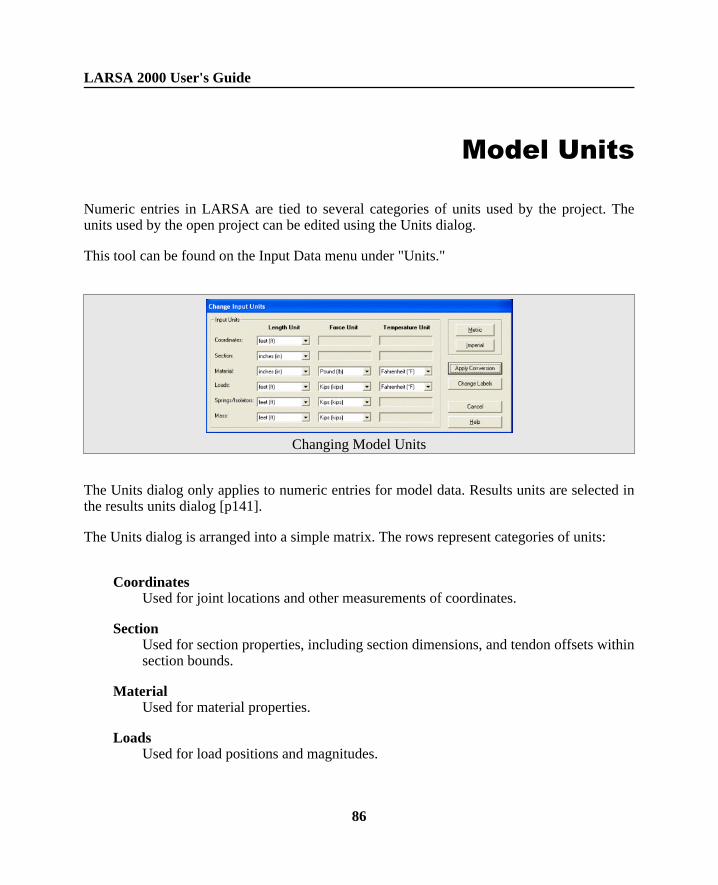
Model Units
Numeric entries in LARSA are tied to several categories of units used by the project. Theunits used by the open project can be edited using the Units dialog.
This tool can be found on the Input Data menu under "Units."
Changing Model Units
The Units dialog only applies to numeric entries for model data. Results units are selected inthe results units dialog [p141].
The Units dialog is arranged into a simple matrix. The rows represent categories of units:
CoordinatesUsed for joint locations and other measurements of coordinates.
SectionUsed for section properties, including section dimensions, and tendon offsets withinsection bounds.
MaterialUsed for material properties.
LoadsUsed for load positions and magnitudes.
LARSA 2000 User's Guide
86
Springs/IsolatorsUsed for spring and isolator properties.
MassUsed for mass elements and other properties.
The units for each category can be independently changed so that, for instance, jointlocations need not be in the same units as section dimensions.
The columns of the matrix represent unit types: Length, Force, and Temperature. The unit inthe cell in the Force column and Loads row will be used for Force (or derived) units for loadentities.
A unit can be selected for most cells in the matrix. Some cells are gray, such asCoordinates/Force, for which unit selection is not applicable.
Click the Metric or Imperial buttons to immediately change all units to the standard metric orimperial units.
Click Apply Conversion to convert all numeric values in the projects to the new units youhave specified.
Click Change Labels to set the project's units without applying a unit conversion. This isuseful if you have entered all numeric values in the wrong units. For instance, if you haveentered coordinates in meters but coordinate length units were set to feet, you can change thecoordinate length units to meters and then click Change Labels. The coordinates will be leftunchanged but they will then be labeled with the correct unit.
Click Cancel to discard any changes you have made to the units.
The Units dialog only applies to numeric entries for model data. Results units are selected inthe results units dialog [p141].
LARSA 2000 User's Guide
87
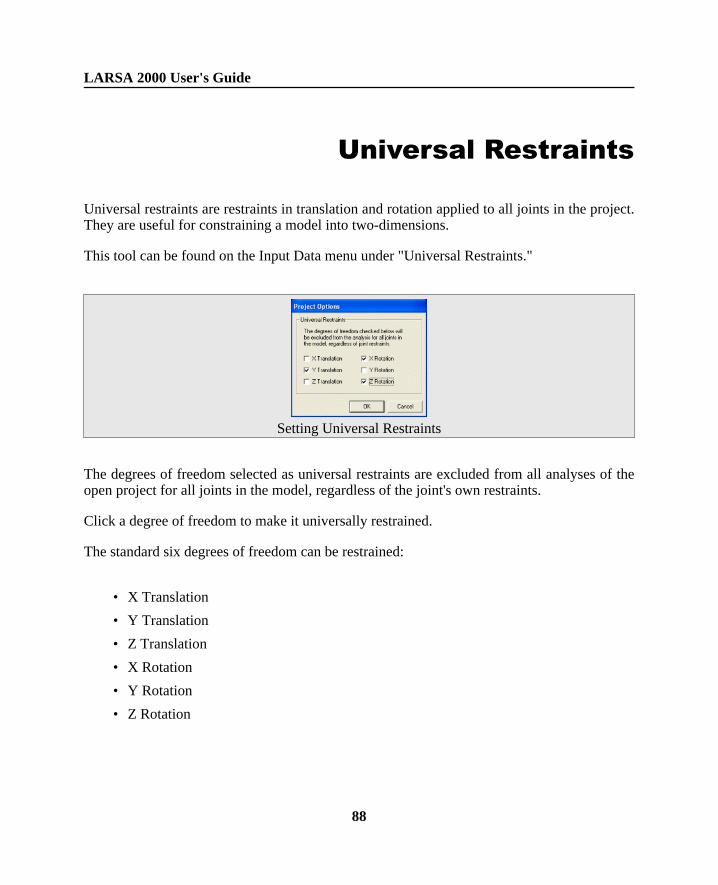
Universal Restraints
Universal restraints are restraints in translation and rotation applied to all joints in the project.They are useful for constraining a model into two-dimensions.
This tool can be found on the Input Data menu under "Universal Restraints."
Setting Universal Restraints
The degrees of freedom selected as universal restraints are excluded from all analyses of theopen project for all joints in the model, regardless of the joint's own restraints.
Click a degree of freedom to make it universally restrained.
The standard six degrees of freedom can be restrained:
• X Translation
• Y Translation
• Z Translation
• X Rotation
• Y Rotation
• Z Rotation
LARSA 2000 User's Guide
88
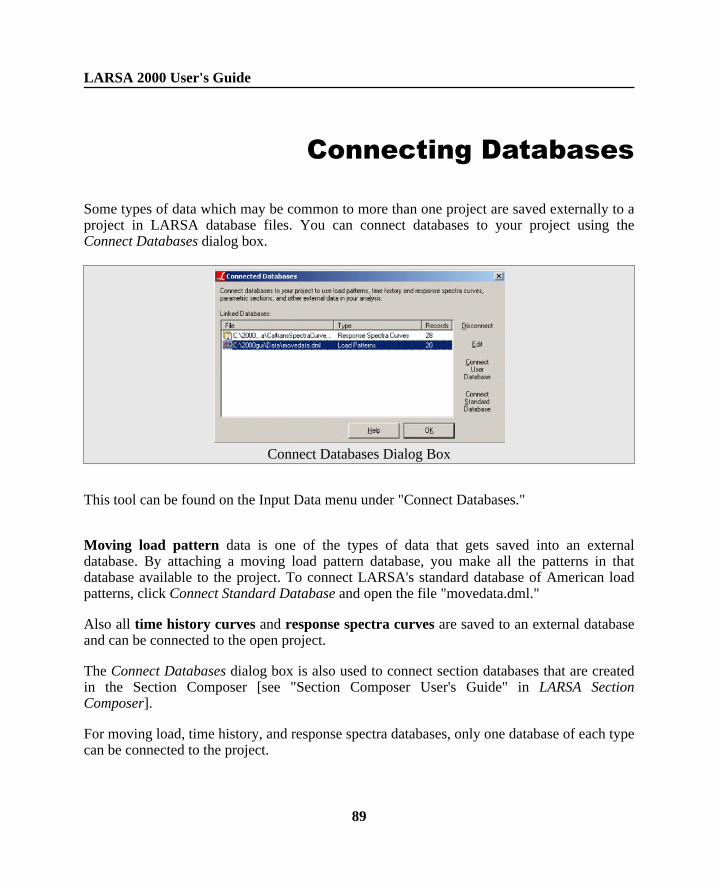
Connecting Databases
Some types of data which may be common to more than one project are saved externally to aproject in LARSA database files. You can connect databases to your project using theConnect Databases dialog box.
Connect Databases Dialog Box
This tool can be found on the Input Data menu under "Connect Databases."
Moving load pattern data is one of the types of data that gets saved into an externaldatabase. By attaching a moving load pattern database, you make all the patterns in thatdatabase available to the project. To connect LARSA's standard database of American loadpatterns, click Connect Standard Database and open the file "movedata.dml."
Also all time history curves and response spectra curves are saved to an external databaseand can be connected to the open project.
The Connect Databases dialog box is also used to connect section databases that are createdin the Section Composer [see "Section Composer User's Guide" in LARSA SectionComposer].
For moving load, time history, and response spectra databases, only one database of each typecan be connected to the project.
LARSA 2000 User's Guide
89
To connect a database: Click Connect User Database and select the database file using thebrowse dialog box. Once the database is connected, it will appear in the Linked Databaseslist.
To disconnect a database: Select the database from the list and click Disconnect.
To edit a database: Select the database from the list and click Edit. This will activate the TheDatabase Editor [p110]. Section databases can only be edited in the Section Composer [see"Section Composer User's Guide" in LARSA Section Composer].
For More Information
• For information on how to create and edit databases, see The Database Editor [p110].
LARSA 2000 User's Guide
90
Using the ModelSpreadsheets
Model data spreadsheets provide direct, numerical access to all of the data used to model astructure.
This tool can be found on the Input Data menu.
The spreadsheets are divided into several categories, listed on the Input Data menu. Chooseone of the categories to view that category's spreadsheets. (Which categories are available toyou depends on your license for LARSA.)
The categories are . . .
• Properties [in LARSA 2000 Reference]: Materials, sections, coordinate systems, andother element properties
• Geometry [in LARSA 2000 Reference]: Joints, members, plates, and other geometryelements
• Loads [in LARSA 2000 Reference]: Load cases, combinations, and stages
• Load spreadsheets can also be accessed from the Load Cases Explorer [p58]
• Construction stages can also be accessed from the Construction Stages Explorer [p64]
LARSA 2000 User's Guide
91
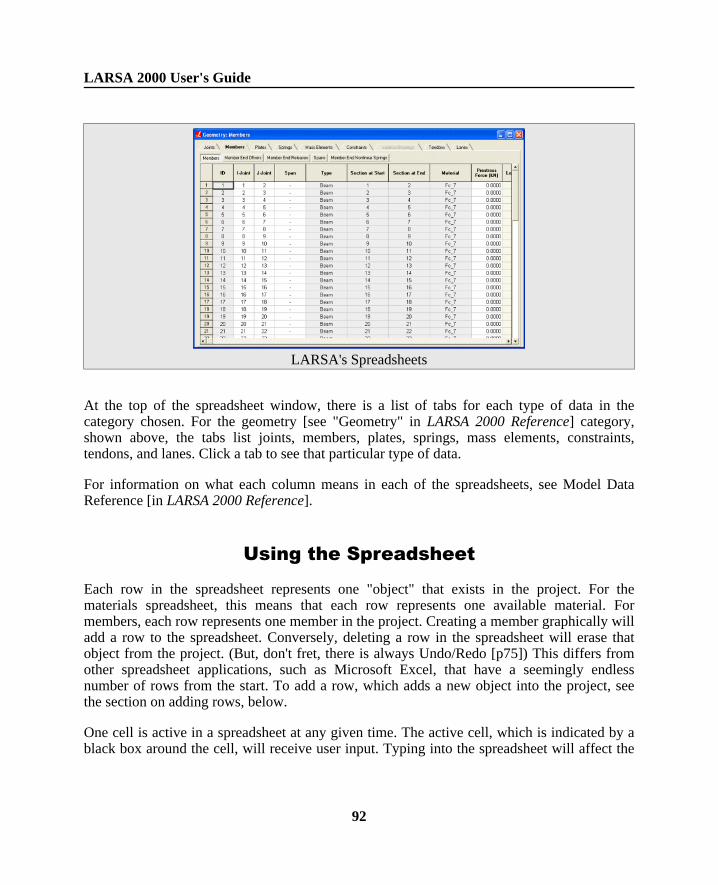
LARSA's Spreadsheets
At the top of the spreadsheet window, there is a list of tabs for each type of data in thecategory chosen. For the geometry [see "Geometry" in LARSA 2000 Reference] category,shown above, the tabs list joints, members, plates, springs, mass elements, constraints,tendons, and lanes. Click a tab to see that particular type of data.
For information on what each column means in each of the spreadsheets, see Model DataReference [in LARSA 2000 Reference].
Using the Spreadsheet
Each row in the spreadsheet represents one "object" that exists in the project. For thematerials spreadsheet, this means that each row represents one available material. Formembers, each row represents one member in the project. Creating a member graphically willadd a row to the spreadsheet. Conversely, deleting a row in the spreadsheet will erase thatobject from the project. (But, don't fret, there is always Undo/Redo [p75]) This differs fromother spreadsheet applications, such as Microsoft Excel, that have a seemingly endlessnumber of rows from the start. To add a row, which adds a new object into the project, seethe section on adding rows, below.
One cell is active in a spreadsheet at any given time. The active cell, which is indicated by ablack box around the cell, will receive user input. Typing into the spreadsheet will affect the
LARSA 2000 User's Guide
92
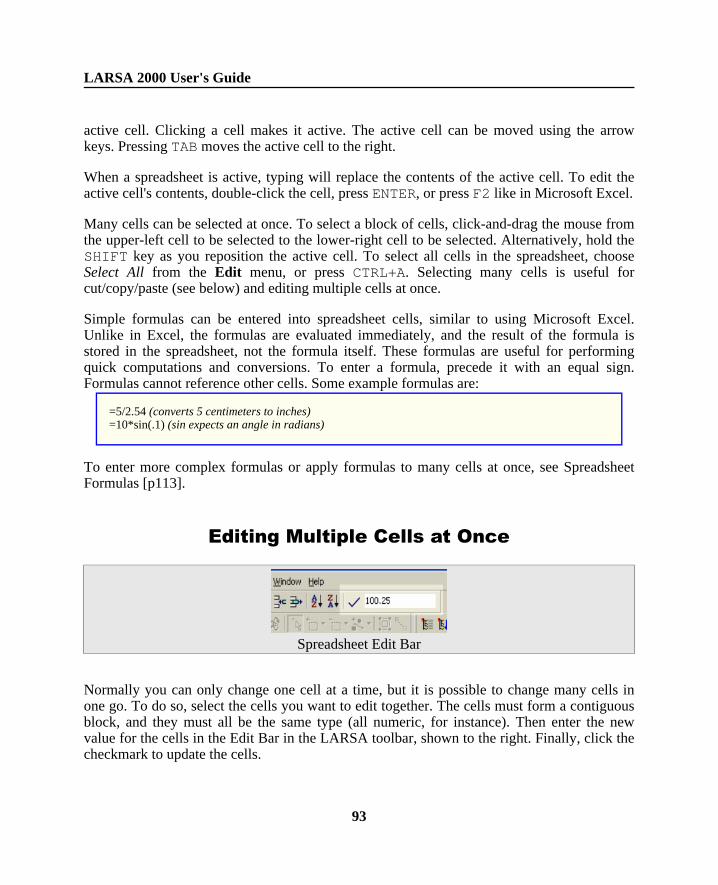
active cell. Clicking a cell makes it active. The active cell can be moved using the arrowkeys. Pressing TAB moves the active cell to the right.
When a spreadsheet is active, typing will replace the contents of the active cell. To edit theactive cell's contents, double-click the cell, press ENTER, or press F2 like in Microsoft Excel.
Many cells can be selected at once. To select a block of cells, click-and-drag the mouse fromthe upper-left cell to be selected to the lower-right cell to be selected. Alternatively, hold theSHIFT key as you reposition the active cell. To select all cells in the spreadsheet, chooseSelect All from the Edit menu, or press CTRL+A. Selecting many cells is useful forcut/copy/paste (see below) and editing multiple cells at once.
Simple formulas can be entered into spreadsheet cells, similar to using Microsoft Excel.Unlike in Excel, the formulas are evaluated immediately, and the result of the formula isstored in the spreadsheet, not the formula itself. These formulas are useful for performingquick computations and conversions. To enter a formula, precede it with an equal sign.Formulas cannot reference other cells. Some example formulas are:
=5/2.54 (converts 5 centimeters to inches)=10*sin(.1) (sin expects an angle in radians)
To enter more complex formulas or apply formulas to many cells at once, see SpreadsheetFormulas [p113].
Editing Multiple Cells at Once
Spreadsheet Edit Bar
Normally you can only change one cell at a time, but it is possible to change many cells inone go. To do so, select the cells you want to edit together. The cells must form a contiguousblock, and they must all be the same type (all numeric, for instance). Then enter the newvalue for the cells in the Edit Bar in the LARSA toolbar, shown to the right. Finally, click thecheckmark to update the cells.
LARSA 2000 User's Guide
93
Adding Rows
To add a new row of data to the end of a spreadsheet, choose Add Row, which can be foundin several locations:
• In the Edit menu, choose Add Row.
• Click the Add Row tool on the toolbar.
• Press the key combination SHIFT+INS.
A new row may be added to a spreadsheet by typing directly into the blank row at the end ofevery spreadsheet or by double-clicking a cell in that row. The blank row will then becomepromoted to a real row of data.
Inserting Rows
Rows of data can be inserted into the middle of a spreadsheet. Position the active cell belowwhere you want the new row to be inserted. Then do one of the following:
• In the Edit menu, choose Insert Row.
• Click the Insert Row tool on the toolbar.
• Press the key combination CTRL+INS.
• Right-click the spreadsheet and choose Insert Rows.
To insert multiple rows into a spreadsheet, select a block of cells so that the number of rowsselected is equal to the number of new rows you want to insert. Choosing Insert Rows willinsert that number of rows above the selection block.
LARSA 2000 User's Guide
94
Deleting Rows
To delete rows, select the rows you want to delete, or position the active cell in the row youwant to delete. Then do one of the following:
• In the Edit menu, choose Delete Rows.
• Click the Delete Rows tool on the toolbar.
• Press the key combination SHIFT+DEL.
• Right-click the spreadsheet and choose Delete Rows.
Cut and Copy
To copy cells to the Windows clipboard (from which you can paste the data elsewhere inLARSA or in other Windows applications), select the block of cells to be copied, or positionthe active cell in the one cell to be copied. Then do one of the following:
• In the Edit menu, choose Copy.
• Click the Copy tool on the toolbar.
• Press the key combination CTRL+C.
• Right-click the spreadsheet and choose Copy.
Although individual cells can be copied, only entire rows may be "cut" from the spreadsheetand placed into the clipboard. To cut a row or block of rows from the spreadsheet, positionthe active cell in the one row to be cut, or select the block of rows to be cut. Then do one ofthe following:
• In the Edit menu, choose Cut.
• Click the Cut tool on the toolbar.
• Press the key combination CTRL+X.
• Right-click the spreadsheet and choose Cut.
Selecting an entire row is not necessary to cut cells. If a block of cells is selected, all rowsthat the block intersects will be cut.
LARSA 2000 User's Guide
95
Paste
There are two modes in which LARSA will paste data from the Windows clipboard into aspreadsheet: Overwrite mode and Insert mode.
In Overwrite mode, the contents of the clipboard will replace the contents of the cells whichare selected. If only one cell of data is in the clipboard, LARSA will always overwrite thecontents of the active cell with the contents of the clipboard. Otherwise, to paste in overwritemode, select the block of cells to receive the data from the clipboard.
In Insert mode, the contents of the clipboard will be inserted into new rows in thespreadsheet. Multiple cells of data must be in the clipboard. To paste in insert mode, do notselect a block of cells. The contents of the clipboard will be inserted above the active cell.
After positioning the active cell and selecting a block of cells, if necessary, do one of thefollowing:
• In the Edit menu, choose Paste.
• Click the Paste tool on the toolbar.
• Press the key combination CTRL+V.
• Right-click the spreadsheet and choose Paste.
For More Information
• Spreadsheet Formulas [p113].• Model Data Reference [in LARSA 2000 Reference].
LARSA 2000 User's Guide
96
Special Data Tools
LARSA 2000 provides several specialized tools for working with materials, sections, andcoordinate systems and a special tool for checking for modeling errors.
Working with User Coordinate Systems 98
Integrity Check 100
Loading Standard Materials 103
Loading Standard Sections 105
Creating Custom Sections 107
Construction Stage Editor 109
The Database Editor 110
Spreadsheet Formulas 113
LARSA 2000 User's Guide
97
Working with UserCoordinate Systems
User coordinate systems are used to enter and view coordinates in systems other than globalcoordinates.
UCSs are used in the following ways:
Active Coordinate System
There is always an active coordinate system. When LARSA 2000 starts, the activecoordinate system is the global coordinate system. Joint coordinates in thespreadsheets [p91] and the Model Data Explorer [p56] are always reported withrespect to the active coordinate system. Transformations [p79] are also applied inthe active coordinate system, and the graphics window grid [p50] is displayed inthe active system.
A user coordinate system can be set as the active coordinate system. This isexplained below.
Changing the active coordinate system does not affect the positions of joints in theproject. It only affects how joint coordinates are displayed and how modeling toolsoperate.
Generation
Coordinate systems are used in Generation Tools [p81].
Joint Displacement Coordinate Systems
When joints are restrained, the restraints are applied in the directions of a usercoordinate system rather than in global directions. See Joints [in LARSA 2000Reference] for more information.
Coordinate systems are accessed through the Using the Model Spreadsheets [p91] or throughthe Coordinate Systems dialog box.
LARSA 2000 User's Guide
98
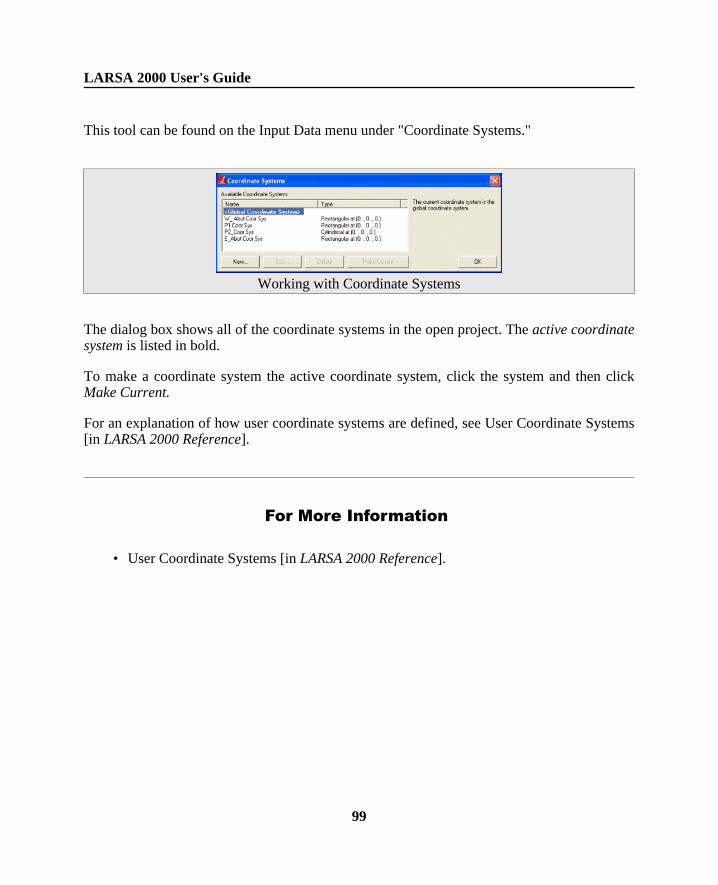
This tool can be found on the Input Data menu under "Coordinate Systems."
Working with Coordinate Systems
The dialog box shows all of the coordinate systems in the open project. The active coordinatesystem is listed in bold.
To make a coordinate system the active coordinate system, click the system and then clickMake Current.
For an explanation of how user coordinate systems are defined, see User Coordinate Systems[in LARSA 2000 Reference].
For More Information
• User Coordinate Systems [in LARSA 2000 Reference].
LARSA 2000 User's Guide
99
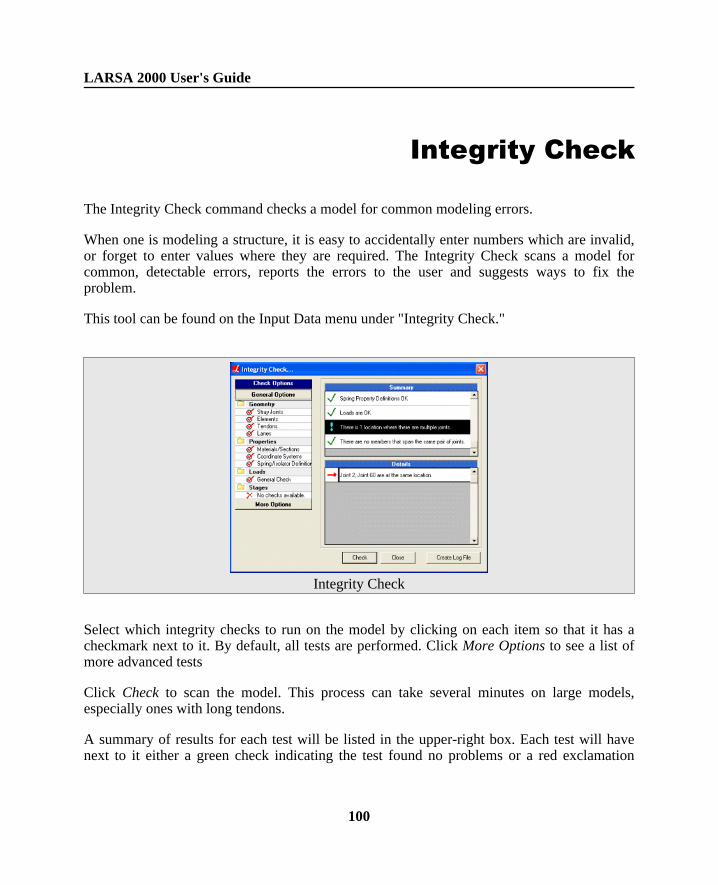
Integrity Check
The Integrity Check command checks a model for common modeling errors.
When one is modeling a structure, it is easy to accidentally enter numbers which are invalid,or forget to enter values where they are required. The Integrity Check scans a model forcommon, detectable errors, reports the errors to the user and suggests ways to fix theproblem.
This tool can be found on the Input Data menu under "Integrity Check."
Integrity Check
Select which integrity checks to run on the model by clicking on each item so that it has acheckmark next to it. By default, all tests are performed. Click More Options to see a list ofmore advanced tests
Click Check to scan the model. This process can take several minutes on large models,especially ones with long tendons.
A summary of results for each test will be listed in the upper-right box. Each test will havenext to it either a green check indicating the test found no problems or a red exclamation
LARSA 2000 User's Guide
100
point indicating errors or warnings were found.
Click an item in the summary list to see details in the lower-right list. Details will report theexact errors that were found.
Integrity Tests
The following checks are performed for each test.
See the Model Data Reference [in LARSA 2000 Reference] for more information aboutcorrectly entering data.
Stray JointsChecks for joints that are not connected to any elements.
ElementsChecks that...
• Members, springs, and isolators are assigned a distinct start and end joint.
• Members have non-zero length.
• Members have been given a section and material.
• Member rigid zones are defined from 0 to 1 and do not overlap.
• Plates are either triangular or quadrilateral.
• Plates have been given a material and have non-zero thickness.
• Isolators have been assigned an isolator definition.
• Master joints are not also slaved.
• Slave/Masters and Mass Elements are properly defined.
TendonsChecks that tendons have a material, a positive strand area, jacking force, andnumber of strands, and a well-defined path.
LanesChecks that lanes have a well-defined path.
LARSA 2000 User's Guide
101
Materials/SectionsChecks that materials have a non-zero shear modulus and a Poisson ratio between 0and 0.5. Also checks that members have unique names and sections have uniquenames.
User Coordinate SystemsChecks that user coordinate systems are well-defined.
Spring Definitions
Checks that spring curves have at least two points, no point through the origin if itis hysteretic, and have x-values that are only increasing.
Checks hysteretic spring definitions for Beta1, Beta2 between 0 and 1, and Alpha atleast 2. Checks that bilinear backbone spring definitions have 4 points on the curveand trilinear 7.
LoadsChecks that loads are properly defined.
Coincident JointsChecks whether multiple joints are coincident (at the same location).
Overlapping MembersChecks for multiple members that span the same two joints.
Overlapping PlatesChecks for multiple plates that span the same set of joints.
SpansChecks that spans are properly defined and are collinear.
LARSA 2000 User's Guide
102
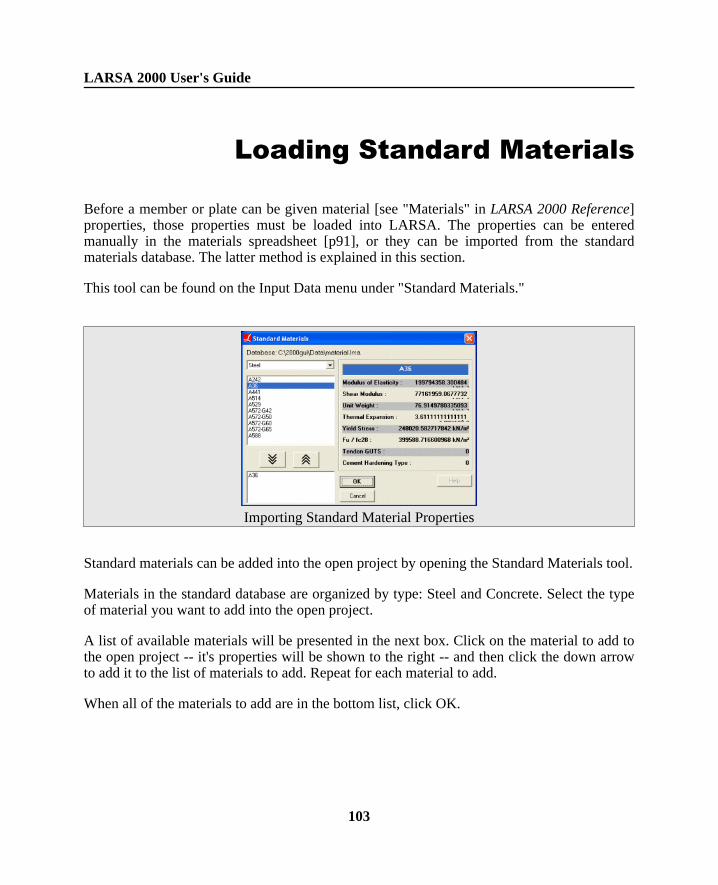
Loading Standard Materials
Before a member or plate can be given material [see "Materials" in LARSA 2000 Reference]properties, those properties must be loaded into LARSA. The properties can be enteredmanually in the materials spreadsheet [p91], or they can be imported from the standardmaterials database. The latter method is explained in this section.
This tool can be found on the Input Data menu under "Standard Materials."
Importing Standard Material Properties
Standard materials can be added into the open project by opening the Standard Materials tool.
Materials in the standard database are organized by type: Steel and Concrete. Select the typeof material you want to add into the open project.
A list of available materials will be presented in the next box. Click on the material to add tothe open project -- it's properties will be shown to the right -- and then click the down arrowto add it to the list of materials to add. Repeat for each material to add.
When all of the materials to add are in the bottom list, click OK.
LARSA 2000 User's Guide
103
For More Information
• Materials [in LARSA 2000 Reference].• Members [in LARSA 2000 Reference].• Plates [in LARSA 2000 Reference].
LARSA 2000 User's Guide
104
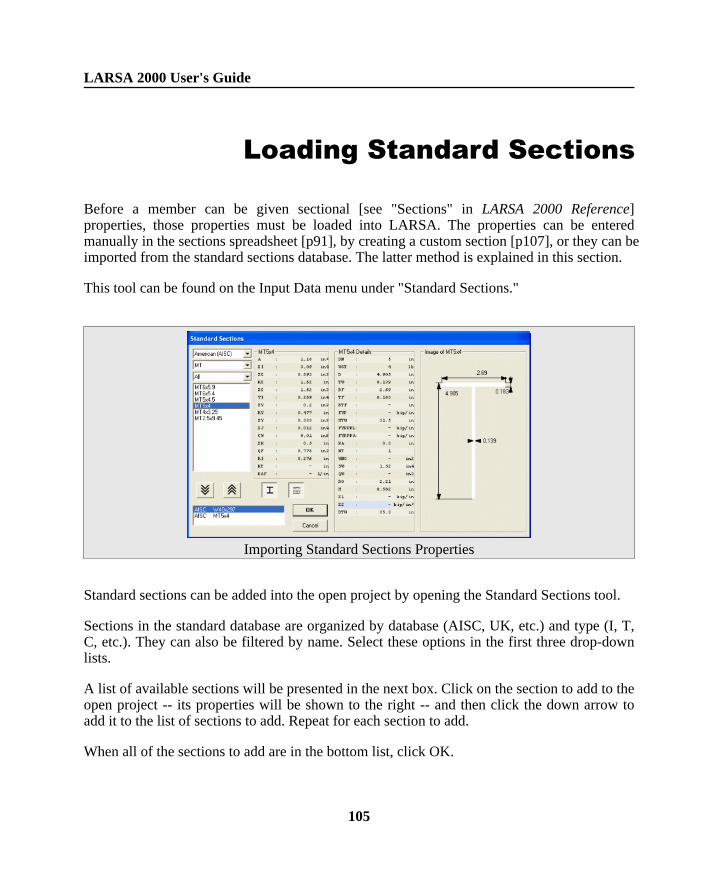
Loading Standard Sections
Before a member can be given sectional [see "Sections" in LARSA 2000 Reference]properties, those properties must be loaded into LARSA. The properties can be enteredmanually in the sections spreadsheet [p91], by creating a custom section [p107], or they can beimported from the standard sections database. The latter method is explained in this section.
This tool can be found on the Input Data menu under "Standard Sections."
Importing Standard Sections Properties
Standard sections can be added into the open project by opening the Standard Sections tool.
Sections in the standard database are organized by database (AISC, UK, etc.) and type (I, T,C, etc.). They can also be filtered by name. Select these options in the first three drop-downlists.
A list of available sections will be presented in the next box. Click on the section to add to theopen project -- its properties will be shown to the right -- and then click the down arrow toadd it to the list of sections to add. Repeat for each section to add.
When all of the sections to add are in the bottom list, click OK.
LARSA 2000 User's Guide
105
For More Information
• Sections [in LARSA 2000 Reference].• Members [in LARSA 2000 Reference].
LARSA 2000 User's Guide
106
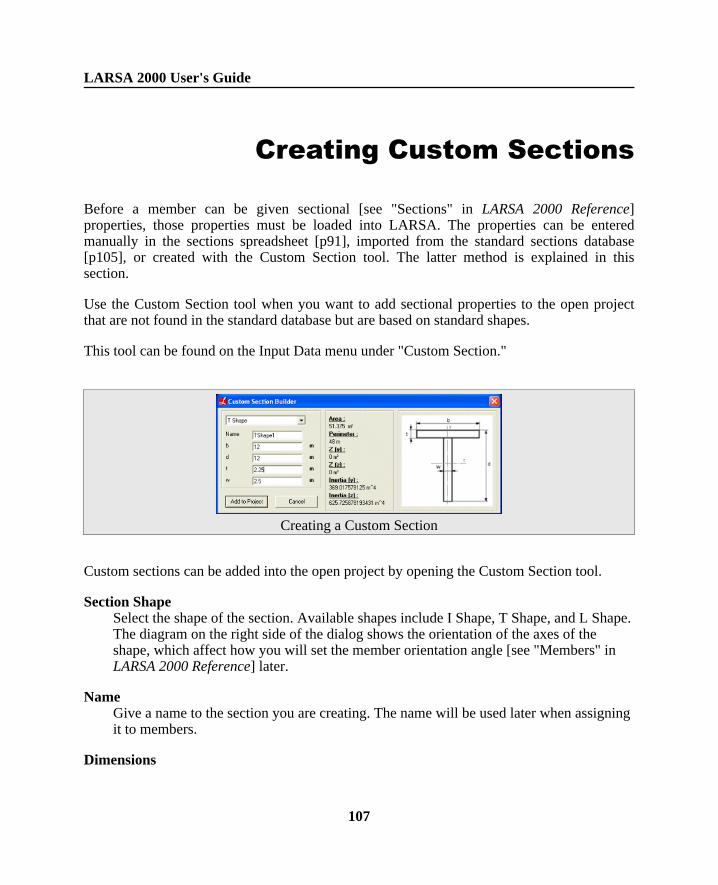
Creating Custom Sections
Before a member can be given sectional [see "Sections" in LARSA 2000 Reference]properties, those properties must be loaded into LARSA. The properties can be enteredmanually in the sections spreadsheet [p91], imported from the standard sections database[p105], or created with the Custom Section tool. The latter method is explained in thissection.
Use the Custom Section tool when you want to add sectional properties to the open projectthat are not found in the standard database but are based on standard shapes.
This tool can be found on the Input Data menu under "Custom Section."
Creating a Custom Section
Custom sections can be added into the open project by opening the Custom Section tool.
Section ShapeSelect the shape of the section. Available shapes include I Shape, T Shape, and L Shape.The diagram on the right side of the dialog shows the orientation of the axes of theshape, which affect how you will set the member orientation angle [see "Members" inLARSA 2000 Reference] later.
NameGive a name to the section you are creating. The name will be used later when assigningit to members.
Dimensions
LARSA 2000 User's Guide
107
A list of dimensions will be presented, appropriate for the section shape that youselected previously. Enter a value for each dimension. The diagram on the right side ofthe dialog shows the meaning of each dimension.
As you enter the dimensions, the calculated sectional properties will be updated on the right.
When all of the dimensions have been entered, click OK.
For More Information
• Sections [in LARSA 2000 Reference].• Members [in LARSA 2000 Reference].
LARSA 2000 User's Guide
108
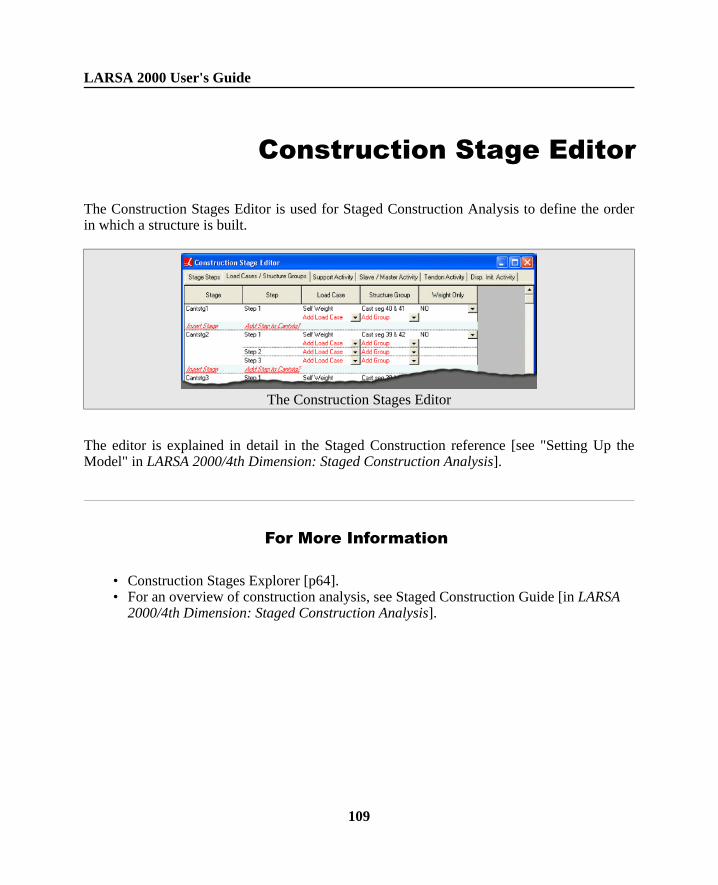
Construction Stage Editor
The Construction Stages Editor is used for Staged Construction Analysis to define the orderin which a structure is built.
The Construction Stages Editor
The editor is explained in detail in the Staged Construction reference [see "Setting Up theModel" in LARSA 2000/4th Dimension: Staged Construction Analysis].
For More Information
• Construction Stages Explorer [p64].• For an overview of construction analysis, see Staged Construction Guide [in LARSA
2000/4th Dimension: Staged Construction Analysis].
LARSA 2000 User's Guide
109
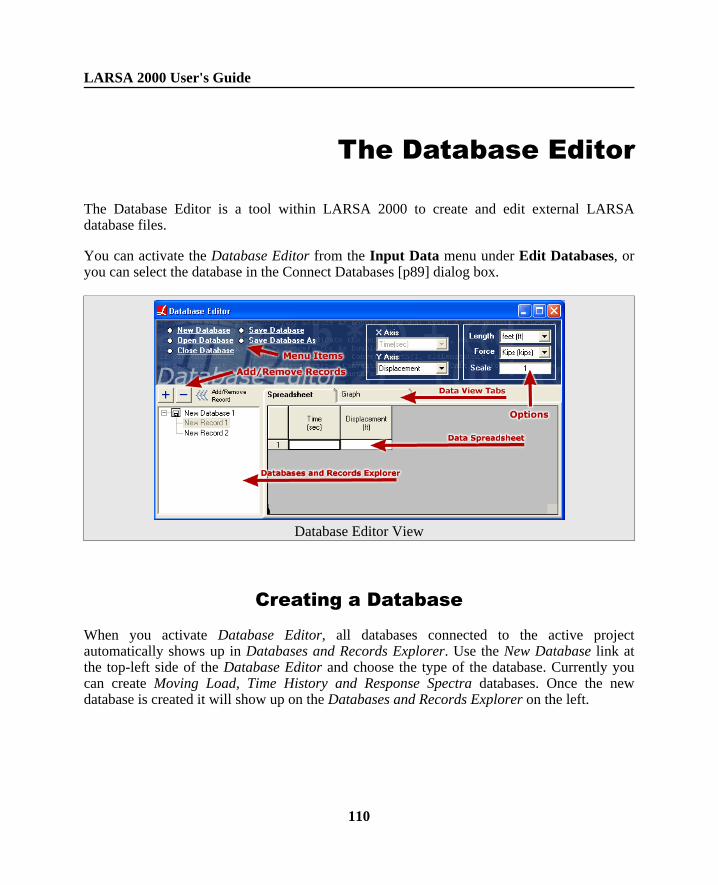
The Database Editor
The Database Editor is a tool within LARSA 2000 to create and edit external LARSAdatabase files.
You can activate the Database Editor from the Input Data menu under Edit Databases, oryou can select the database in the Connect Databases [p89] dialog box.
Database Editor View
Creating a Database
When you activate Database Editor, all databases connected to the active projectautomatically shows up in Databases and Records Explorer. Use the New Database link atthe top-left side of the Database Editor and choose the type of the database. Currently youcan create Moving Load, Time History and Response Spectra databases. Once the newdatabase is created it will show up on the Databases and Records Explorer on the left.
LARSA 2000 User's Guide
110
Adding/Removing Records
To add a new record, click on the database name on the Databases and Records Explorer andclick the button with the plus sign.
To remove an existing record, click on the record on the Databases and Records Explorerand click the button with the minus sign.
Adding/Editing/Removing Data
The data spreadsheet should be used to modify the records in the database. Click on therecord you would like to edit from the list on the left. The spreadsheet tab will activate. Usethis spreadsheet to insert/remove/edit data. Since this spreadsheet is like any otherspreadsheet in LARSA 2000, you can use almost all menu items to format the spreadsheet.See Using the Model Spreadsheets [p91].
Other Data Views
Other than the spreadsheet view, each database may have different types of view options. Forexample Moving Load Database records can be edited on the spreadsheet and then can beviewed visually on the next tab called Graphics. This allows users to easily verify their data.For Time History Curve and Response Spectra Curve databases, Database Editor will giveyou the option to view a graph of the data.
Additional Options
Depending on the database type, every record may have some additional options other thenthe actual data. For example for a Response Spectra Curve database you can choose to inputtime vs displacement or frequency vs displacement.
It is not recommended to edit the records that are currently in use by the project.
LARSA 2000 User's Guide
111

For More Information
• For information on how to connect databases to a project, see Connecting Databases[p89].
LARSA 2000 User's Guide
112
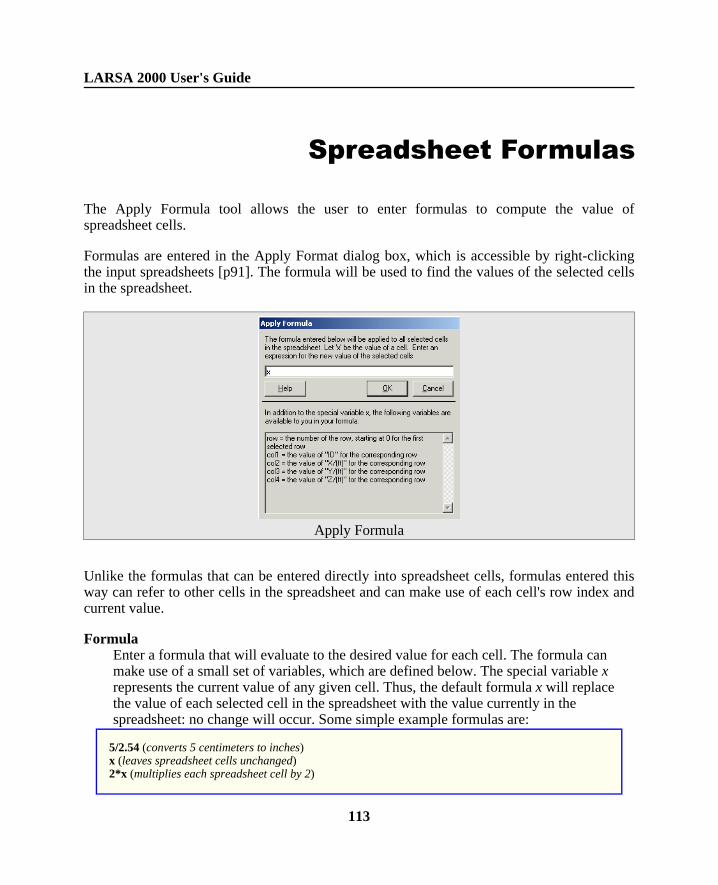
Spreadsheet Formulas
The Apply Formula tool allows the user to enter formulas to compute the value ofspreadsheet cells.
Formulas are entered in the Apply Format dialog box, which is accessible by right-clickingthe input spreadsheets [p91]. The formula will be used to find the values of the selected cellsin the spreadsheet.
Apply Formula
Unlike the formulas that can be entered directly into spreadsheet cells, formulas entered thisway can refer to other cells in the spreadsheet and can make use of each cell's row index andcurrent value.
FormulaEnter a formula that will evaluate to the desired value for each cell. The formula canmake use of a small set of variables, which are defined below. The special variable xrepresents the current value of any given cell. Thus, the default formula x will replacethe value of each selected cell in the spreadsheet with the value currently in thespreadsheet: no change will occur. Some simple example formulas are:
5/2.54 (converts 5 centimeters to inches)x (leaves spreadsheet cells unchanged)2*x (multiplies each spreadsheet cell by 2)
LARSA 2000 User's Guide
113
-x (changes the sign of the selected cells)
VariablesThe variables available to formulas include:
xThe current value of a cell.
rowThe row number of a cell, starting at 0 for the first row in the selected block ofcells.
col#The value in the other columns of the spreadsheet, in the same row as the cell beingupdated. A list of col# variables appears in the Apply Formula dialog box.
FunctionsThe following functions are available to formulas:
• abs, sgn, fix (round toward zero)
• sqr, exp, log
• sin, cos, tan, atn (uses radians)
Some further examples follow.
row (would set a single column of cells to the consecutive numbers starting at 0)2*col2 (in the Joints spreadsheet, would set the selected cells to have twice the value of thex-coordinate value in the corresponding row)col2+col3 (in the Joints spreadsheet, would set the selected cells to have the sum of the x- andy-coordinate values in the corresponding row)10+(25-10)*(col4-5)/(15-5) (in the Joints spreadsheet, if the z-coordinates in the selected rows rangefrom 5 to 15, then this function sets the values of the selected cells to a linear interpolation between 10and 25 at the position of the corresponding z-coordinate.)
For More Information
LARSA 2000 User's Guide
114

• Using the Model Spreadsheets [p91].
LARSA 2000 User's Guide
115
Running an Analysis
Running an analysis, the core feature of LARSA 2000, takes the structural model you havecreated and subjects it to various types of analyses. For more detailed information on howanalyses are performed, see the Analysis Reference [in LARSA 2000 Reference].
Selecting an Analysis
Analyses are grouped by type in the Analysis menu as follows:
• Linear Static [see "Linear Static Analysis" in LARSA 2000 Reference] and P-Delta[see "P-Delta Analysis" in LARSA 2000 Reference] Analyses
• Nonlinear Static Analysis [see "Nonlinear Static Analysis" in LARSA 2000 Reference]
• Nonlinear Plastic Pushover and Collapse
• Eigenvalue [see "Eigenvalue and Stressed Eigenvalue Analysis" in LARSA 2000Reference] and Response Spectra [see "Response Spectra Analysis" in LARSA 2000Reference] Analyses
• Time-History (linear/nonlinear) Analysis [see "Linear Time History Analysis" inLARSA 2000 Reference]
• Moving Load Analysis [see "Moving Load Analysis" in LARSA 2000 Reference]
• Staged Construction Analysis
A red arrow next to an analysis group indicates which type of analysis was last run for theopen project. If no analysis has been run, the arrow points to the first group.
Selecting one of the analysis groups brings up the analysis dialog box.
LARSA 2000 User's Guide
116
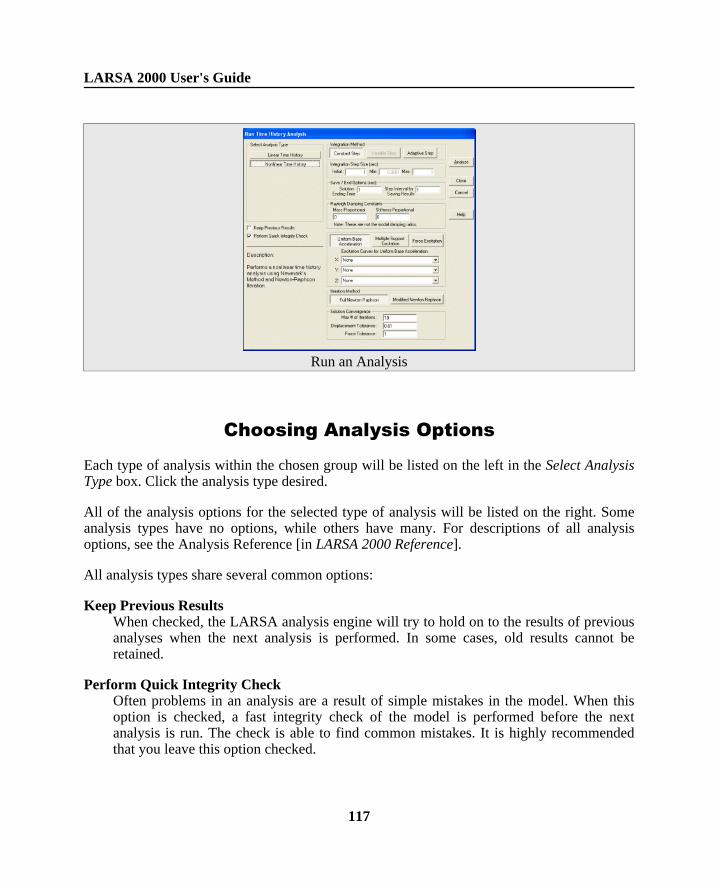
Run an Analysis
Choosing Analysis Options
Each type of analysis within the chosen group will be listed on the left in the Select AnalysisType box. Click the analysis type desired.
All of the analysis options for the selected type of analysis will be listed on the right. Someanalysis types have no options, while others have many. For descriptions of all analysisoptions, see the Analysis Reference [in LARSA 2000 Reference].
All analysis types share several common options:
Keep Previous ResultsWhen checked, the LARSA analysis engine will try to hold on to the results of previousanalyses when the next analysis is performed. In some cases, old results cannot beretained.
Perform Quick Integrity CheckOften problems in an analysis are a result of simple mistakes in the model. When thisoption is checked, a fast integrity check of the model is performed before the nextanalysis is run. The check is able to find common mistakes. It is highly recommendedthat you leave this option checked.
LARSA 2000 User's Guide
117
Running the Analysis
To run the analysis based on the options you have chosen, click Analyze. The analysiswindow will appear, showing the progress of the analysis as it happens. Analysis errors willalso be shown in the window.
Click Close to save your analysis options but not perform an analysis.
Click Cancel to discard changes to the analysis options and abort running an analysis.
For More Information
• Analysis Reference [in LARSA 2000 Reference].
LARSA 2000 User's Guide
118
Getting Results
The sections below describe how to access results graphically and numerically.
See Analysis Results Reference [in LARSA 2000 Reference] for a detailed description of eachresult type available in LARSA.
For More Information
• Analysis Results Reference [in LARSA 2000 Reference].
Viewing Results Graphically 120
Results Spreadsheets 127
Linear Result Combinations 131
Extreme Effect Groups 134
Graphing Results 136
Results Units 141
Graphical Results Options 143
Capture Deformed Structure 146
Automatic Code-Based Load Combinations 148
Tendon Results Tools 154
LARSA 2000 User's Guide
119
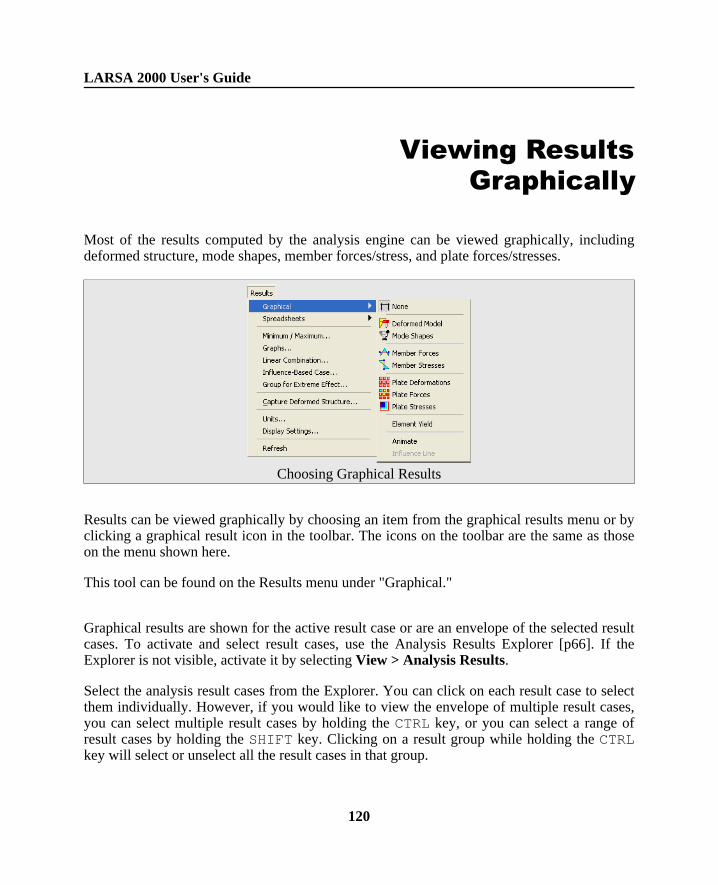
Viewing ResultsGraphically
Most of the results computed by the analysis engine can be viewed graphically, includingdeformed structure, mode shapes, member forces/stress, and plate forces/stresses.
Choosing Graphical Results
Results can be viewed graphically by choosing an item from the graphical results menu or byclicking a graphical result icon in the toolbar. The icons on the toolbar are the same as thoseon the menu shown here.
This tool can be found on the Results menu under "Graphical."
Graphical results are shown for the active result case or are an envelope of the selected resultcases. To activate and select result cases, use the Analysis Results Explorer [p66]. If theExplorer is not visible, activate it by selecting View > Analysis Results.
Select the analysis result cases from the Explorer. You can click on each result case to selectthem individually. However, if you would like to view the envelope of multiple result cases,you can select multiple result cases by holding the CTRL key, or you can select a range ofresult cases by holding the SHIFT key. Clicking on a result group while holding the CTRLkey will select or unselect all the result cases in that group.
LARSA 2000 User's Guide
120
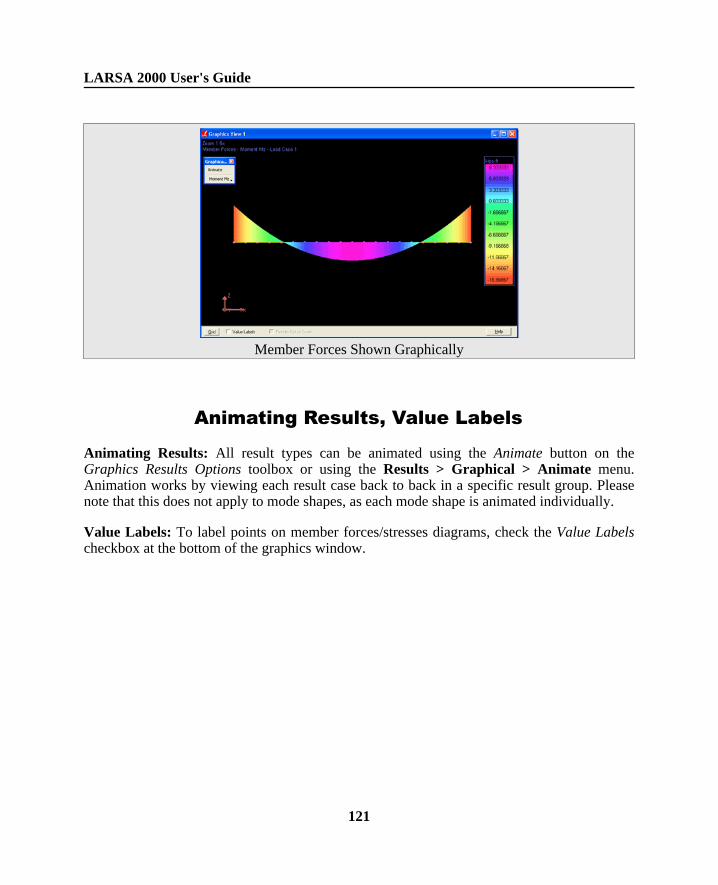
Member Forces Shown Graphically
Animating Results, Value Labels
Animating Results: All result types can be animated using the Animate button on theGraphics Results Options toolbox or using the Results > Graphical > Animate menu.Animation works by viewing each result case back to back in a specific result group. Pleasenote that this does not apply to mode shapes, as each mode shape is animated individually.
Value Labels: To label points on member forces/stresses diagrams, check the Value Labelscheckbox at the bottom of the graphics window.
LARSA 2000 User's Guide
121
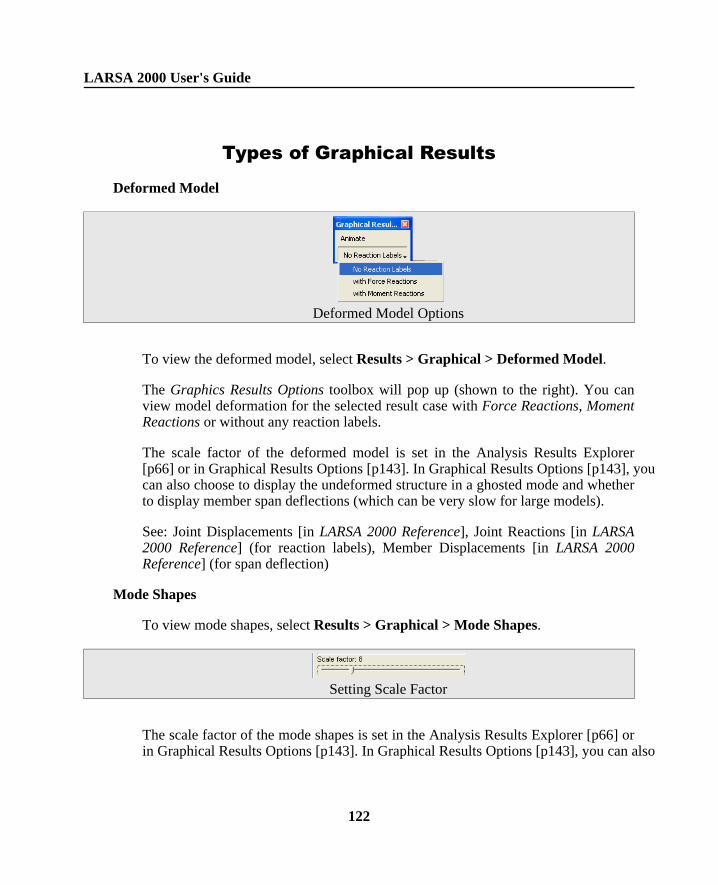
Types of Graphical Results
Deformed Model
Deformed Model Options
To view the deformed model, select Results > Graphical > Deformed Model.
The Graphics Results Options toolbox will pop up (shown to the right). You canview model deformation for the selected result case with Force Reactions, MomentReactions or without any reaction labels.
The scale factor of the deformed model is set in the Analysis Results Explorer[p66] or in Graphical Results Options [p143]. In Graphical Results Options [p143], youcan also choose to display the undeformed structure in a ghosted mode and whetherto display member span deflections (which can be very slow for large models).
See: Joint Displacements [in LARSA 2000 Reference], Joint Reactions [in LARSA2000 Reference] (for reaction labels), Member Displacements [in LARSA 2000Reference] (for span deflection)
Mode Shapes
To view mode shapes, select Results > Graphical > Mode Shapes.
Setting Scale Factor
The scale factor of the mode shapes is set in the Analysis Results Explorer [p66] orin Graphical Results Options [p143]. In Graphical Results Options [p143], you can also
LARSA 2000 User's Guide
122
choose to display the undeformed structure in a ghosted mode.
See: Mode Shapes [in LARSA 2000 Reference]
Member Forces
To view member forces, select Results > Graphical > Member Forces.
The Graphics Results Options toolbox will allow you to select which direction offorces to view: Axial Fx, Shear Fy, Shear Fz, Torsion Mx, Moment My, MomentMz.
The diagram size is set in the Analysis Results Explorer [p66] or in GraphicalResults Options [p143]. Also in Graphical Results Options [p143], you can choosewhether to display the diagram as a line diagram or with solid shading, whether toinvert the diagrams, and the number of stations along the members to report forcesat.
See: Member Sectional Forces [in LARSA 2000 Reference]
Member Stresses
To view member stresses, select Results > Graphical > Member Stresses.
The Graphics Results Options toolbox will allow you to select the location of thestress to view: at the centroid (P/A), at Stress Point A, at Stress Point B, at StressPoint C, at Stress Point D, the Shear Stress in Y, the Shear Stress in Z, theMaximum Absolute Stress, the Maximum Tensile Stress, and the MaximumCompressive Stress.
The diagram size is set in the Analysis Results Explorer [p66] or in GraphicalResults Options [p143]. Also in Graphical Results Options [p143], you can choosewhether to display the diagram as a line diagram or with solid shading, whether toinvert the diagrams, and the number of stations along the members to report forcesat.
See: Member Stresses [in LARSA 2000 Reference]
Plate Deformation
LARSA 2000 User's Guide
123
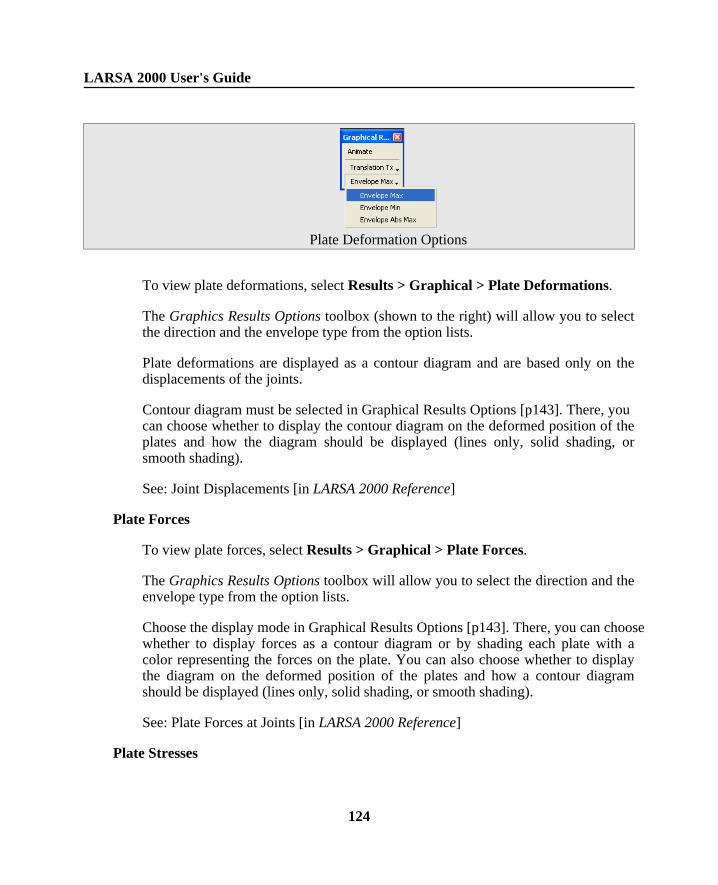
Plate Deformation Options
To view plate deformations, select Results > Graphical > Plate Deformations.
The Graphics Results Options toolbox (shown to the right) will allow you to selectthe direction and the envelope type from the option lists.
Plate deformations are displayed as a contour diagram and are based only on thedisplacements of the joints.
Contour diagram must be selected in Graphical Results Options [p143]. There, youcan choose whether to display the contour diagram on the deformed position of theplates and how the diagram should be displayed (lines only, solid shading, orsmooth shading).
See: Joint Displacements [in LARSA 2000 Reference]
Plate Forces
To view plate forces, select Results > Graphical > Plate Forces.
The Graphics Results Options toolbox will allow you to select the direction and theenvelope type from the option lists.
Choose the display mode in Graphical Results Options [p143]. There, you can choosewhether to display forces as a contour diagram or by shading each plate with acolor representing the forces on the plate. You can also choose whether to displaythe diagram on the deformed position of the plates and how a contour diagramshould be displayed (lines only, solid shading, or smooth shading).
See: Plate Forces at Joints [in LARSA 2000 Reference]
Plate Stresses
LARSA 2000 User's Guide
124
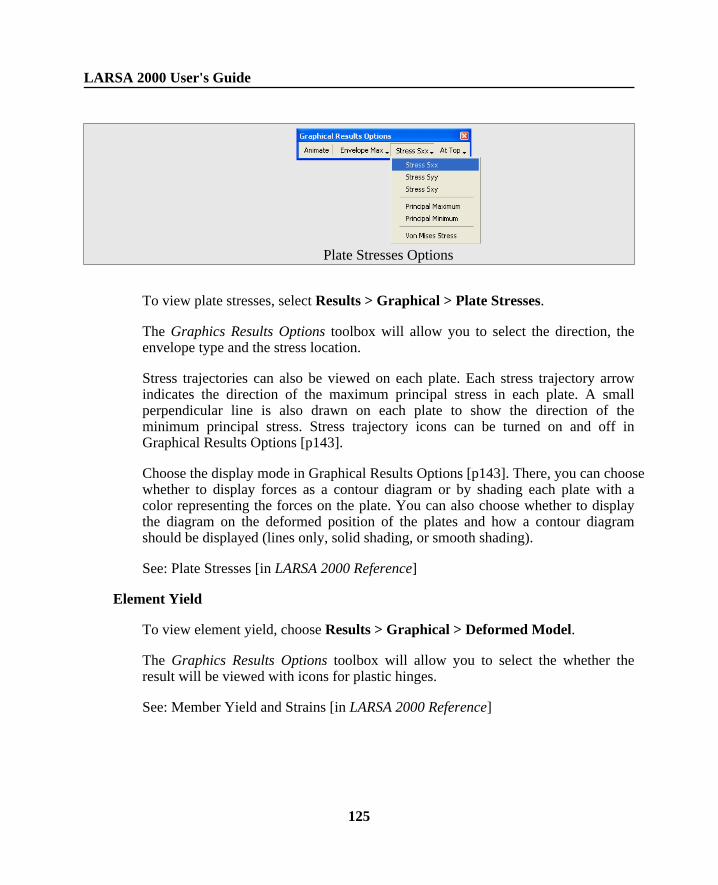
Plate Stresses Options
To view plate stresses, select Results > Graphical > Plate Stresses.
The Graphics Results Options toolbox will allow you to select the direction, theenvelope type and the stress location.
Stress trajectories can also be viewed on each plate. Each stress trajectory arrowindicates the direction of the maximum principal stress in each plate. A smallperpendicular line is also drawn on each plate to show the direction of theminimum principal stress. Stress trajectory icons can be turned on and off inGraphical Results Options [p143].
Choose the display mode in Graphical Results Options [p143]. There, you can choosewhether to display forces as a contour diagram or by shading each plate with acolor representing the forces on the plate. You can also choose whether to displaythe diagram on the deformed position of the plates and how a contour diagramshould be displayed (lines only, solid shading, or smooth shading).
See: Plate Stresses [in LARSA 2000 Reference]
Element Yield
To view element yield, choose Results > Graphical > Deformed Model.
The Graphics Results Options toolbox will allow you to select the whether theresult will be viewed with icons for plastic hinges.
See: Member Yield and Strains [in LARSA 2000 Reference]
LARSA 2000 User's Guide
125
For More Information
• Graphical Results Options [p143].• Results Spreadsheets [p127].• Analysis Results Reference [in LARSA 2000 Reference].
LARSA 2000 User's Guide
126
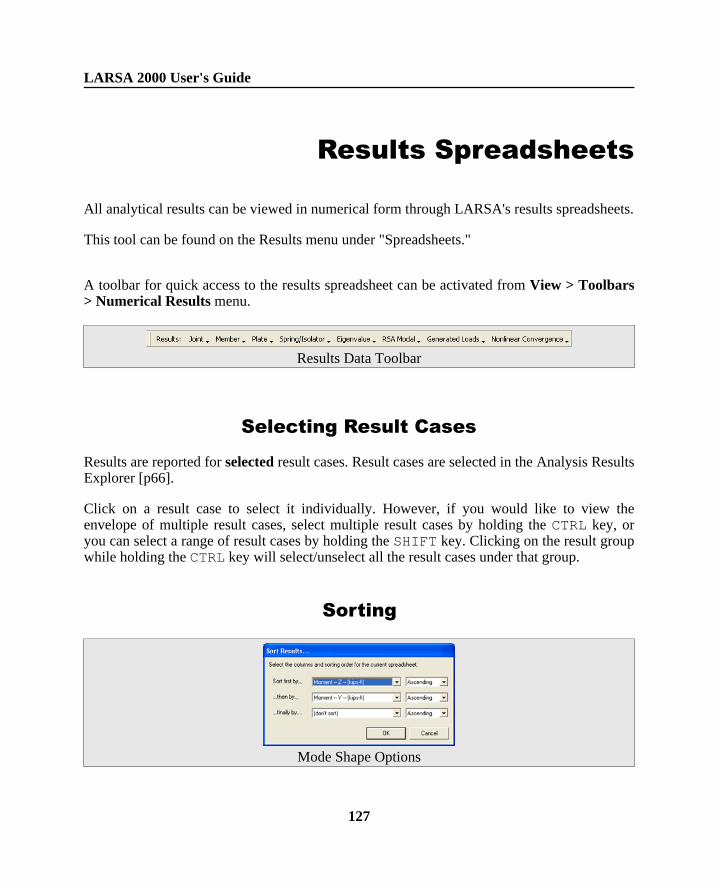
Results Spreadsheets
All analytical results can be viewed in numerical form through LARSA's results spreadsheets.
This tool can be found on the Results menu under "Spreadsheets."
A toolbar for quick access to the results spreadsheet can be activated from View > Toolbars> Numerical Results menu.
Results Data Toolbar
Selecting Result Cases
Results are reported for selected result cases. Result cases are selected in the Analysis ResultsExplorer [p66].
Click on a result case to select it individually. However, if you would like to view theenvelope of multiple result cases, select multiple result cases by holding the CTRL key, oryou can select a range of result cases by holding the SHIFT key. Clicking on the result groupwhile holding the CTRL key will select/unselect all the result cases under that group.
Sorting
Mode Shape Options
LARSA 2000 User's Guide
127
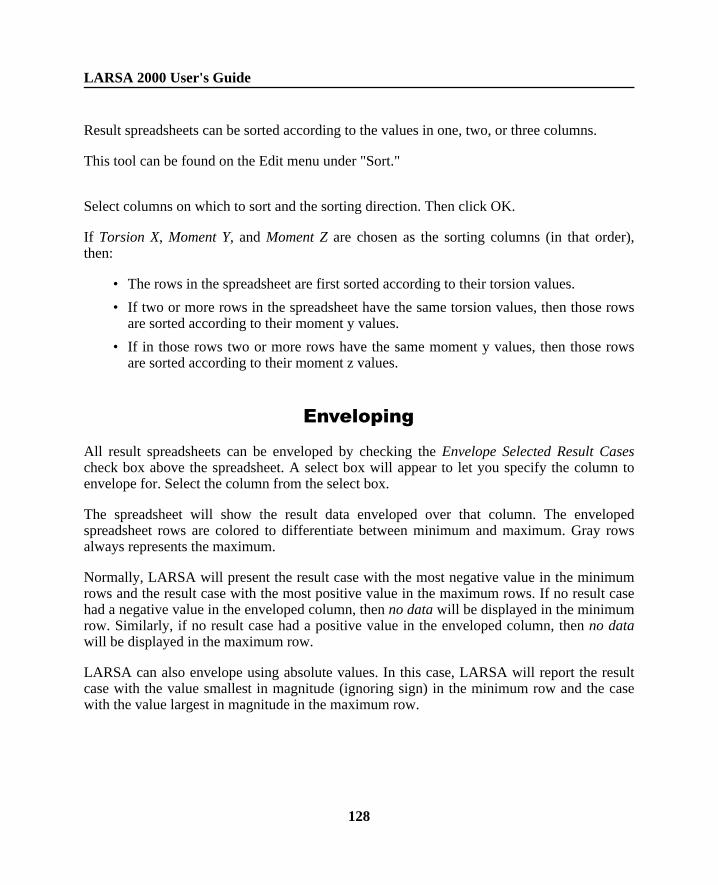
Result spreadsheets can be sorted according to the values in one, two, or three columns.
This tool can be found on the Edit menu under "Sort."
Select columns on which to sort and the sorting direction. Then click OK.
If Torsion X, Moment Y, and Moment Z are chosen as the sorting columns (in that order),then:
• The rows in the spreadsheet are first sorted according to their torsion values.
• If two or more rows in the spreadsheet have the same torsion values, then those rowsare sorted according to their moment y values.
• If in those rows two or more rows have the same moment y values, then those rowsare sorted according to their moment z values.
Enveloping
All result spreadsheets can be enveloped by checking the Envelope Selected Result Casescheck box above the spreadsheet. A select box will appear to let you specify the column toenvelope for. Select the column from the select box.
The spreadsheet will show the result data enveloped over that column. The envelopedspreadsheet rows are colored to differentiate between minimum and maximum. Gray rowsalways represents the maximum.
Normally, LARSA will present the result case with the most negative value in the minimumrows and the result case with the most positive value in the maximum rows. If no result casehad a negative value in the enveloped column, then no data will be displayed in the minimumrow. Similarly, if no result case had a positive value in the enveloped column, then no datawill be displayed in the maximum row.
LARSA can also envelope using absolute values. In this case, LARSA will report the resultcase with the value smallest in magnitude (ignoring sign) in the minimum row and the casewith the value largest in magnitude in the maximum row.
LARSA 2000 User's Guide
128
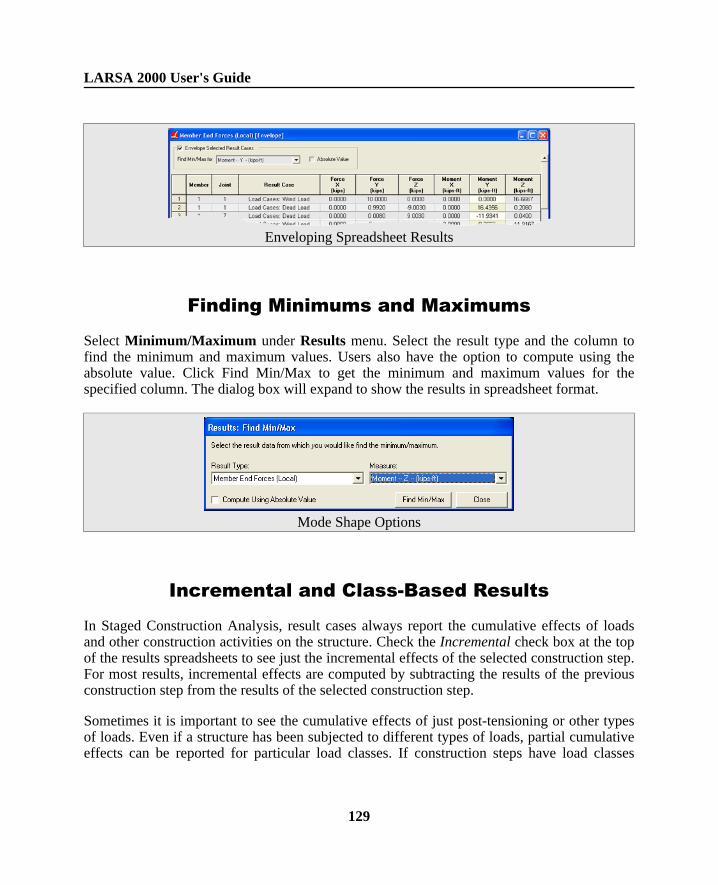
Enveloping Spreadsheet Results
Finding Minimums and Maximums
Select Minimum/Maximum under Results menu. Select the result type and the column tofind the minimum and maximum values. Users also have the option to compute using theabsolute value. Click Find Min/Max to get the minimum and maximum values for thespecified column. The dialog box will expand to show the results in spreadsheet format.
Mode Shape Options
Incremental and Class-Based Results
In Staged Construction Analysis, result cases always report the cumulative effects of loadsand other construction activities on the structure. Check the Incremental check box at the topof the results spreadsheets to see just the incremental effects of the selected construction step.For most results, incremental effects are computed by subtracting the results of the previousconstruction step from the results of the selected construction step.
Sometimes it is important to see the cumulative effects of just post-tensioning or other typesof loads. Even if a structure has been subjected to different types of loads, partial cumulativeeffects can be reported for particular load classes. If construction steps have load classes
LARSA 2000 User's Guide
129
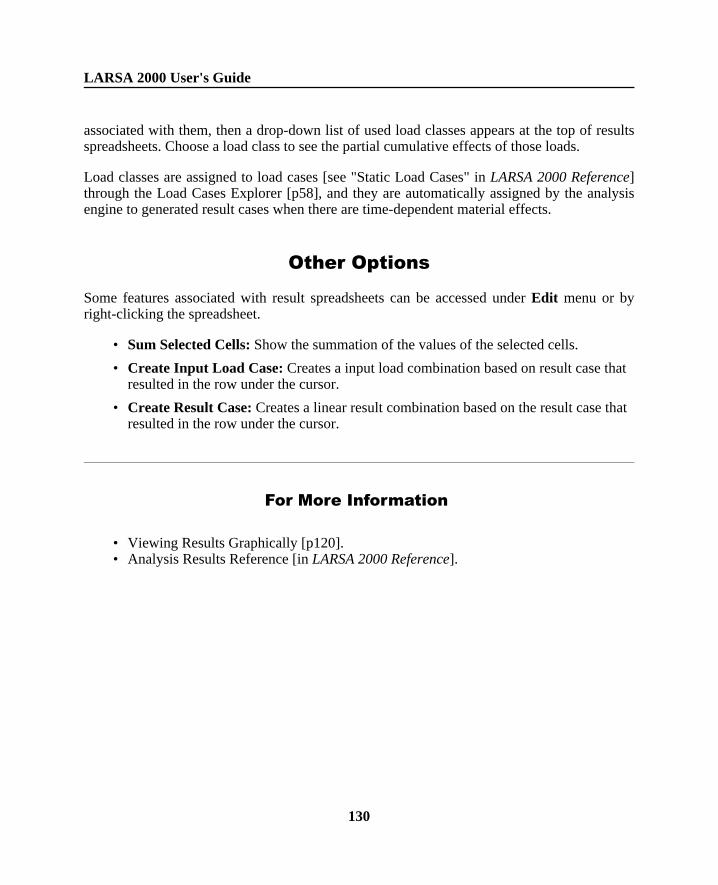
associated with them, then a drop-down list of used load classes appears at the top of resultsspreadsheets. Choose a load class to see the partial cumulative effects of those loads.
Load classes are assigned to load cases [see "Static Load Cases" in LARSA 2000 Reference]through the Load Cases Explorer [p58], and they are automatically assigned by the analysisengine to generated result cases when there are time-dependent material effects.
Other Options
Some features associated with result spreadsheets can be accessed under Edit menu or byright-clicking the spreadsheet.
• Sum Selected Cells: Show the summation of the values of the selected cells.
• Create Input Load Case: Creates a input load combination based on result case thatresulted in the row under the cursor.
• Create Result Case: Creates a linear result combination based on the result case thatresulted in the row under the cursor.
For More Information
• Viewing Results Graphically [p120].• Analysis Results Reference [in LARSA 2000 Reference].
LARSA 2000 User's Guide
130
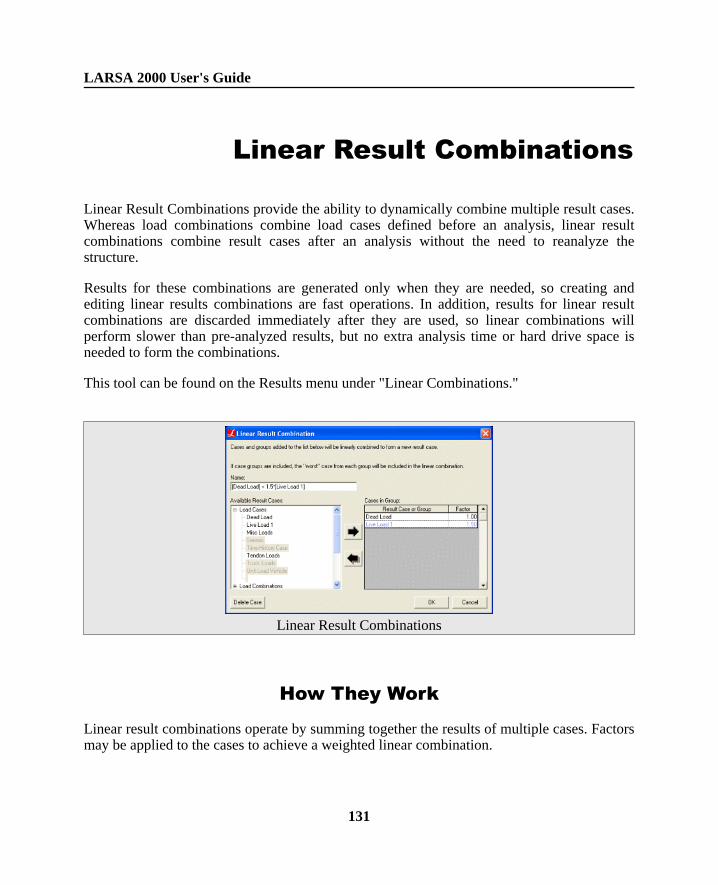
Linear Result Combinations
Linear Result Combinations provide the ability to dynamically combine multiple result cases.Whereas load combinations combine load cases defined before an analysis, linear resultcombinations combine result cases after an analysis without the need to reanalyze thestructure.
Results for these combinations are generated only when they are needed, so creating andediting linear results combinations are fast operations. In addition, results for linear resultcombinations are discarded immediately after they are used, so linear combinations willperform slower than pre-analyzed results, but no extra analysis time or hard drive space isneeded to form the combinations.
This tool can be found on the Results menu under "Linear Combinations."
Linear Result Combinations
How They Work
Linear result combinations operate by summing together the results of multiple cases. Factorsmay be applied to the cases to achieve a weighted linear combination.
LARSA 2000 User's Guide
131
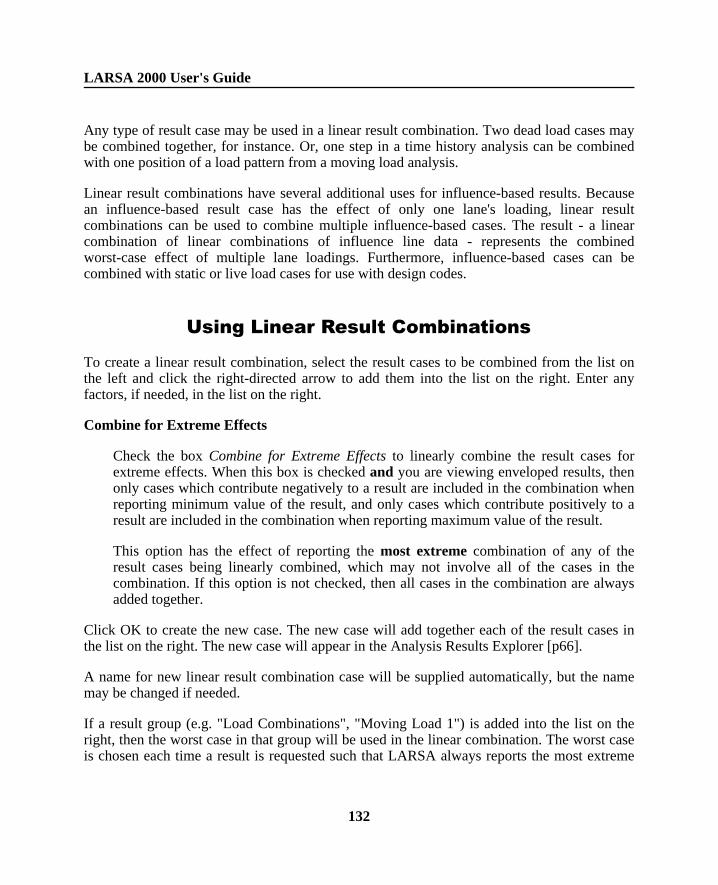
Any type of result case may be used in a linear result combination. Two dead load cases maybe combined together, for instance. Or, one step in a time history analysis can be combinedwith one position of a load pattern from a moving load analysis.
Linear result combinations have several additional uses for influence-based results. Becausean influence-based result case has the effect of only one lane's loading, linear resultcombinations can be used to combine multiple influence-based cases. The result - a linearcombination of linear combinations of influence line data - represents the combinedworst-case effect of multiple lane loadings. Furthermore, influence-based cases can becombined with static or live load cases for use with design codes.
Using Linear Result Combinations
To create a linear result combination, select the result cases to be combined from the list onthe left and click the right-directed arrow to add them into the list on the right. Enter anyfactors, if needed, in the list on the right.
Combine for Extreme Effects
Check the box Combine for Extreme Effects to linearly combine the result cases forextreme effects. When this box is checked and you are viewing enveloped results, thenonly cases which contribute negatively to a result are included in the combination whenreporting minimum value of the result, and only cases which contribute positively to aresult are included in the combination when reporting maximum value of the result.
This option has the effect of reporting the most extreme combination of any of theresult cases being linearly combined, which may not involve all of the cases in thecombination. If this option is not checked, then all cases in the combination are alwaysadded together.
Click OK to create the new case. The new case will add together each of the result cases inthe list on the right. The new case will appear in the Analysis Results Explorer [p66].
A name for new linear result combination case will be supplied automatically, but the namemay be changed if needed.
If a result group (e.g. "Load Combinations", "Moving Load 1") is added into the list on theright, then the worst case in that group will be used in the linear combination. The worst caseis chosen each time a result is requested such that LARSA always reports the most extreme
LARSA 2000 User's Guide
132
value.
To edit a linear result combination after it has been created, find the combination in theAnalysis Results Explorer, right-click it, and then click Properties.
To delete a linear result combination, find the combination in the Analysis Results Explorer,right-click it, and then click Delete.
For More Information
• Extreme Effect Groups [p134].
LARSA 2000 User's Guide
133
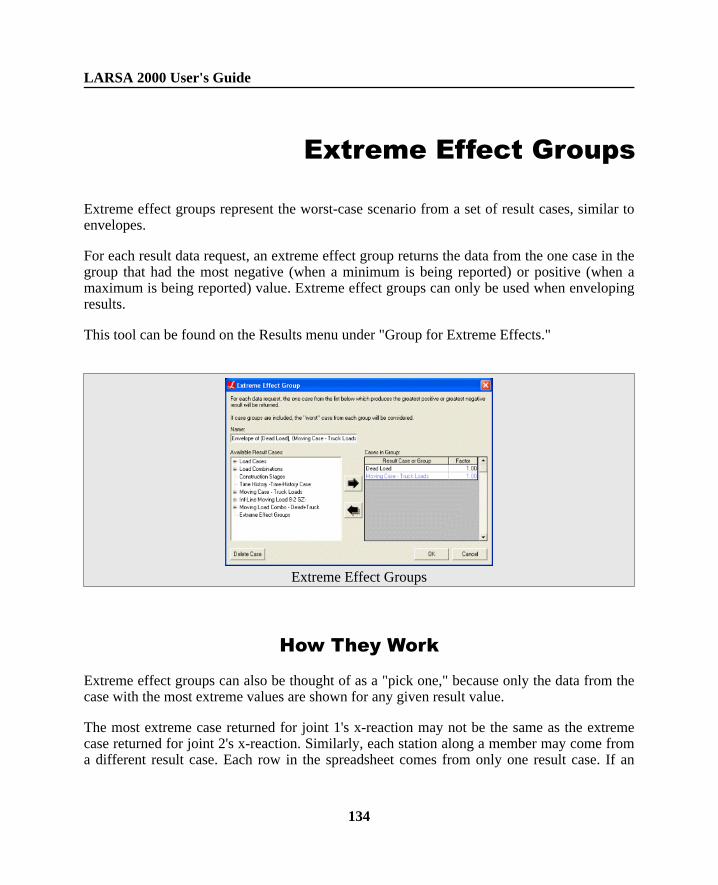
Extreme Effect Groups
Extreme effect groups represent the worst-case scenario from a set of result cases, similar toenvelopes.
For each result data request, an extreme effect group returns the data from the one case in thegroup that had the most negative (when a minimum is being reported) or positive (when amaximum is being reported) value. Extreme effect groups can only be used when envelopingresults.
This tool can be found on the Results menu under "Group for Extreme Effects."
Extreme Effect Groups
How They Work
Extreme effect groups can also be thought of as a "pick one," because only the data from thecase with the most extreme values are shown for any given result value.
The most extreme case returned for joint 1's x-reaction may not be the same as the extremecase returned for joint 2's x-reaction. Similarly, each station along a member may come froma different result case. Each row in the spreadsheet comes from only one result case. If an
LARSA 2000 User's Guide
134
envelope is requested for y-moment, then the results will come from the result case with theminimum and maximum extreme values in y-moment. The other columns in the spreadsheet,such as axial force, will not be extremes -- instead they will correspond to the result cases thathad the min/max y-moment for that row.
Extreme effect groups will never return a maximum that is negative or a minimum that ispositive. This follows the definition of extreme effects used in influence-based results anddifferentiates extreme effect groups from simple envelopes.
Extreme effect groups can only be used when enveloping result data. As with theinfluence-based results, not all graphical results are enveloped and so they cannot be used todisplay extreme effect group results.
Although envelopes of result data can be quickly found by selecting multiple cases in theAnalysis Results Explorer [p66], the list of cases which make up these on-the-fly envelopescannot be saved for later use. Furthermore, the data from those envelopes cannot be used inlinear result combinations. Extreme effect groups achieve a similar result but do not havethese limitations.
Using Extreme Effect Groups
Creating Extreme Effect Groups is done similarly to creating Linear Result Combinations[p131].
To edit an Extreme Effect Group after it has been created, find the combination in theAnalysis Results Explorer, right-click it, and then click Properties.
To delete an Extreme Effect Group, find the combination in the Analysis Results Explorer,right-click it, and then click Delete.
For More Information
• Linear Result Combinations [p131].
LARSA 2000 User's Guide
135
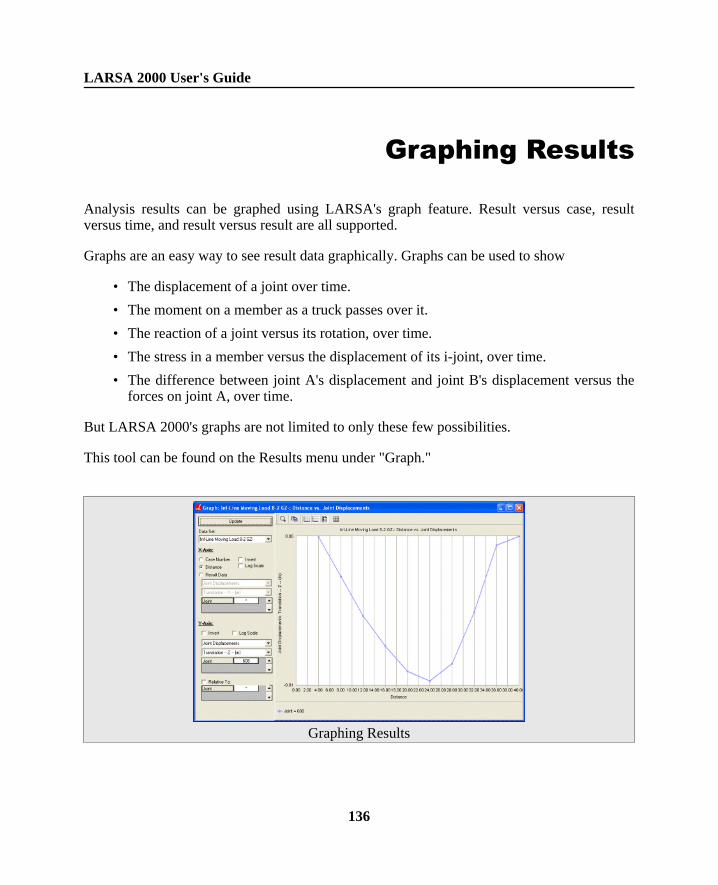
Graphing Results
Analysis results can be graphed using LARSA's graph feature. Result versus case, resultversus time, and result versus result are all supported.
Graphs are an easy way to see result data graphically. Graphs can be used to show
• The displacement of a joint over time.
• The moment on a member as a truck passes over it.
• The reaction of a joint versus its rotation, over time.
• The stress in a member versus the displacement of its i-joint, over time.
• The difference between joint A's displacement and joint B's displacement versus theforces on joint A, over time.
But LARSA 2000's graphs are not limited to only these few possibilities.
This tool can be found on the Results menu under "Graph."
Graphing Results
LARSA 2000 User's Guide
136
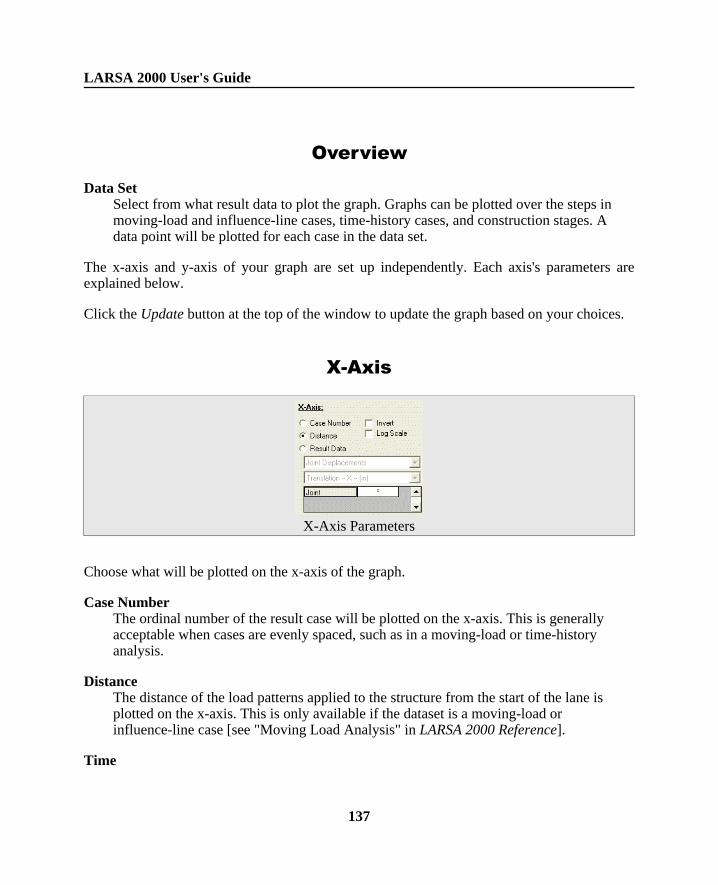
Overview
Data SetSelect from what result data to plot the graph. Graphs can be plotted over the steps inmoving-load and influence-line cases, time-history cases, and construction stages. Adata point will be plotted for each case in the data set.
The x-axis and y-axis of your graph are set up independently. Each axis's parameters areexplained below.
Click the Update button at the top of the window to update the graph based on your choices.
X-Axis
X-Axis Parameters
Choose what will be plotted on the x-axis of the graph.
Case NumberThe ordinal number of the result case will be plotted on the x-axis. This is generallyacceptable when cases are evenly spaced, such as in a moving-load or time-historyanalysis.
DistanceThe distance of the load patterns applied to the structure from the start of the lane isplotted on the x-axis. This is only available if the dataset is a moving-load orinfluence-line case [see "Moving Load Analysis" in LARSA 2000 Reference].
Time
LARSA 2000 User's Guide
137
The time of the case is plotted on the x-axis. This is only available if the dataset is atime-history case [see "Linear Time History Analysis" in LARSA 2000 Reference].
DayThe day number of the case is plotted on the x-axis. This is only available if the datasetis a staged-construction case.
Result DataA particular result data from the case will be plotted on the x-axis.
Result TypeSelect the type of result from the first selection box, such as Member End Forces, andthen select the particular result in the second selection box, such as Force -- Z -- At StartJoint.
Data Selection
Then, fill in all of the fields in the next box. If you chose Joint Displacements /Translation -- X, then the next box will display Joint, indicating you need to enter a jointnumber. The x-translation displacements of that joint will be plotted on the x-axis foreach case in the data set.
All fields must be filled in.
InvertDisplays the graph mirrored horizontally.
Log ScaleDisplays the x-axis on a logarithmic scale.
LARSA 2000 User's Guide
138
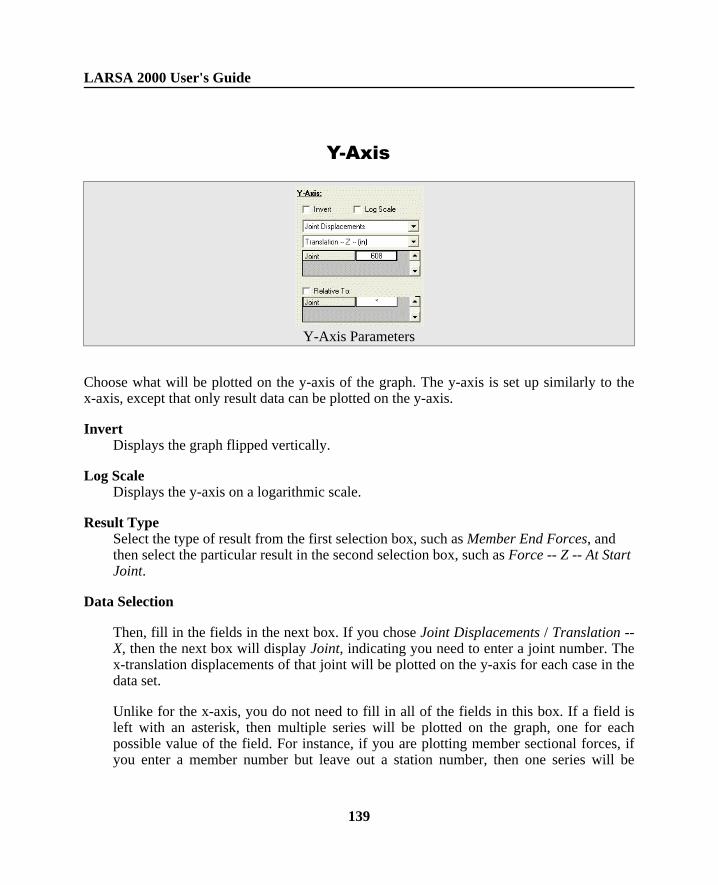
Y-Axis
Y-Axis Parameters
Choose what will be plotted on the y-axis of the graph. The y-axis is set up similarly to thex-axis, except that only result data can be plotted on the y-axis.
InvertDisplays the graph flipped vertically.
Log ScaleDisplays the y-axis on a logarithmic scale.
Result TypeSelect the type of result from the first selection box, such as Member End Forces, andthen select the particular result in the second selection box, such as Force -- Z -- At StartJoint.
Data Selection
Then, fill in the fields in the next box. If you chose Joint Displacements / Translation --X, then the next box will display Joint, indicating you need to enter a joint number. Thex-translation displacements of that joint will be plotted on the y-axis for each case in thedata set.
Unlike for the x-axis, you do not need to fill in all of the fields in this box. If a field isleft with an asterisk, then multiple series will be plotted on the graph, one for eachpossible value of the field. For instance, if you are plotting member sectional forces, ifyou enter a member number but leave out a station number, then one series will be
LARSA 2000 User's Guide
139
plotted for each station on the member. (The number of computed stations is set up inGraphical Results Options [p143].)
Relative ToCheck this box to plot values on the y-axis relative to another value. For instance, youmay want to plot the x-translation displacement of joint 1 relative to the same type ofdisplacement of joint 2. (That is, the first value minus the second value.) Fill in all of thefields in this box to choose what to plot the values relative to. The same result type asselected above applies to these values.
LARSA 2000 User's Guide
140
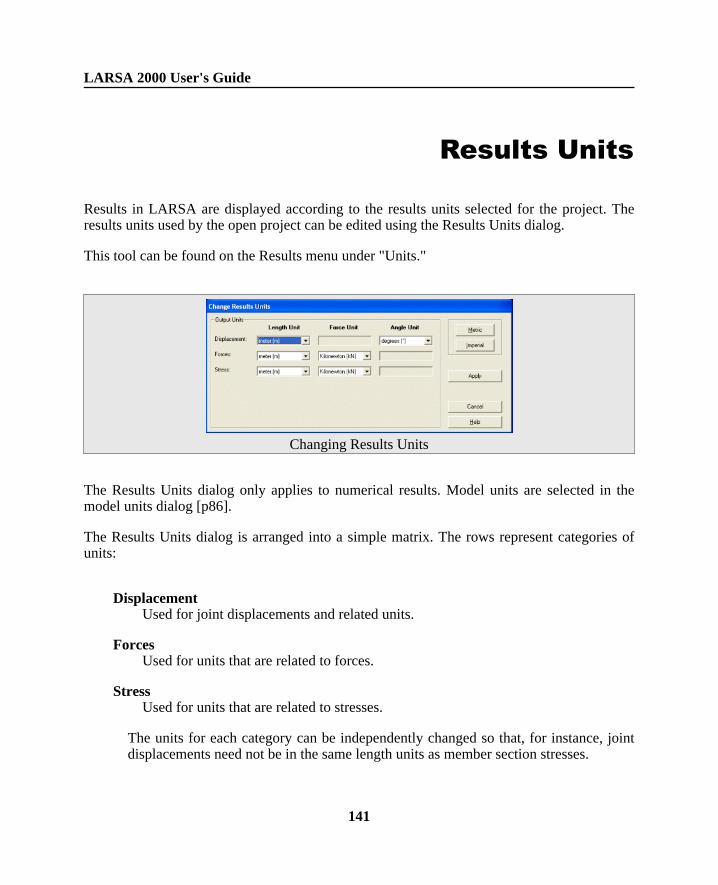
Results Units
Results in LARSA are displayed according to the results units selected for the project. Theresults units used by the open project can be edited using the Results Units dialog.
This tool can be found on the Results menu under "Units."
Changing Results Units
The Results Units dialog only applies to numerical results. Model units are selected in themodel units dialog [p86].
The Results Units dialog is arranged into a simple matrix. The rows represent categories ofunits:
DisplacementUsed for joint displacements and related units.
ForcesUsed for units that are related to forces.
StressUsed for units that are related to stresses.
The units for each category can be independently changed so that, for instance, jointdisplacements need not be in the same length units as member section stresses.
LARSA 2000 User's Guide
141
The columns of the matrix represent unit types: Length, Force, and Angle. The unit in the cellin the Force column and Stress row will be used in units that indicate stress.
A unit can be selected for most cells in the matrix. Some cells are gray, such asDisplacement/Force, for which unit selection is not applicable.
Click the Metric or Imperial buttons to immediately change all units to the standard metric orimperial units.
Click Apply to update the units used to display results. No immediate unit conversion isperformed.
LARSA 2000 User's Guide
142
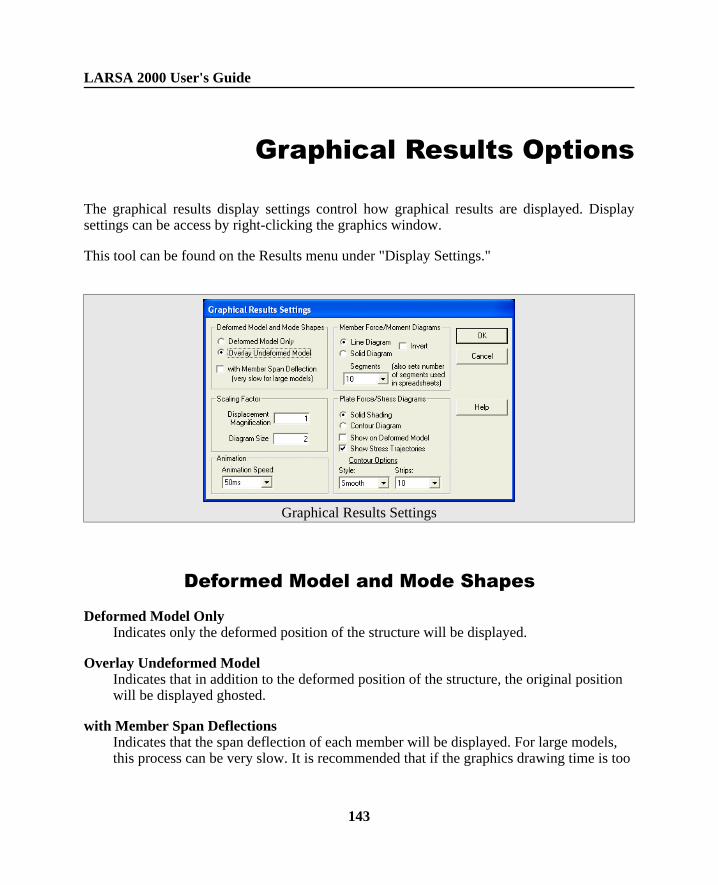
Graphical Results Options
The graphical results display settings control how graphical results are displayed. Displaysettings can be access by right-clicking the graphics window.
This tool can be found on the Results menu under "Display Settings."
Graphical Results Settings
Deformed Model and Mode Shapes
Deformed Model OnlyIndicates only the deformed position of the structure will be displayed.
Overlay Undeformed ModelIndicates that in addition to the deformed position of the structure, the original positionwill be displayed ghosted.
with Member Span DeflectionsIndicates that the span deflection of each member will be displayed. For large models,this process can be very slow. It is recommended that if the graphics drawing time is too
LARSA 2000 User's Guide
143
much, you should uncheck this option. With this option unchecked, members are drawnas straight lines between the deformed positions of the joints.
Scaling Factor
Displacement MagnificationSpecifies the magnification factor of the joint displacements used to display deformedmodel graphically.
Diagram SizeA number between 1 and 20, specifies the size of moment and stress diagrams on thescreen. A value of 1 indicates diagrams should be drawn very small, and 20 indicatesdiagrams should be drawn very large.
Animations
Animation SpeedDetermines the rate at which animations proceed. A value of 500ms indicates animationswill update every 500 milliseconds, or twice every second.
Member Force/Moment Diagrams
Line Diagramindicates force/moment diagrams are displayed as line diagrams, which sometimes makeit easier to read the value labels.
Solid DiagramIndicates force/moment diagrams are to be filled in according to the color legend on theright-hand side of the graphics window.
SegmentsIndicates how many segments to divide each member into to display theforces/moments. A value of 10 is usually sufficient, for which 11 data points are drawn.To see a smoother diagram, increase the number of stations. A greater number ofstations means the results will take longer to draw. This option also controls the numberof segments displayed in the spreadsheets.
LARSA 2000 User's Guide
144
Plate Force/Stress Diagrams
Solid ShadingIndicates each plate will be filled with the color that corresponds to the average force orstress acting on it.
Contour DiagramIndicates a contour diagram will be drawn over the surface of the plates, showing thecontours of the forces or stresses on the plates.
Show on Deformed ModelIndicates the diagram will be displayed on plates in their deformed position. Otherwise,the plates are drawn in their original position.
Show Stress TrajectoriesIndicates stress trajectories will be drawn over each plate. Each stress trajectory arrowindicates the direction of the maximum principal stress in each plate. A smallperpendicular line is also drawn on each plate to show the direction of the minimumprincipal stress.
Contour OptionsSpecifies how a contour diagram of plate forces or stresses is to be displayed. For Style:Lines indicate only contour lines will be drawn, Solid indicates each contour "bar" willbe solid-shaded, and Smooth indicates full-color shading will be used to show the forcesor stresses. Strips specifies the number of contour lines/strips to draw. More lines meansthe diagram will be drawn slower, but more precisely.
LARSA 2000 User's Guide
145
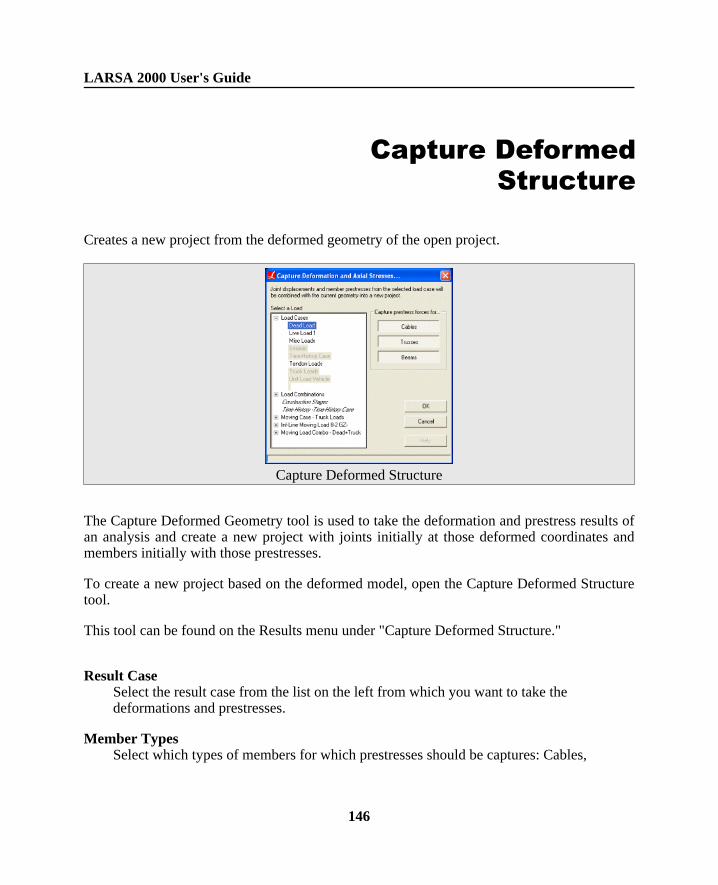
Capture DeformedStructure
Creates a new project from the deformed geometry of the open project.
Capture Deformed Structure
The Capture Deformed Geometry tool is used to take the deformation and prestress results ofan analysis and create a new project with joints initially at those deformed coordinates andmembers initially with those prestresses.
To create a new project based on the deformed model, open the Capture Deformed Structuretool.
This tool can be found on the Results menu under "Capture Deformed Structure."
Result CaseSelect the result case from the list on the left from which you want to take thedeformations and prestresses.
Member TypesSelect which types of members for which prestresses should be captures: Cables,
LARSA 2000 User's Guide
146
Trusses, and Beams. All three member types are on by default. Click a member type tonot capture those prestresses.
Click OK to create the new project. The open project will be closed. You will be prompted tosave your changes if the project has been modified since it was last saved.
LARSA 2000 User's Guide
147
Automatic Code-BasedLoad Combinations
The Auto Load Combinations tool is used to create input load combinations [p58] and linearresult combinations [p131] according to standard design codes and user defined codes.
This tool can be found on the Input Data/Results menu under "Auto Load Combinations."
Five standard design codes are included with the Auto Load Combinations tool:
• AASHTO-LFD Load Factor Design: TABLE 3.22.1A from Standard SpecificationsFor Highway Bridges, Sixteenth Edition.
• AASHTO-LFD Service Load: TABLE 3.22.1A from Standard Specifications ForHighway Bridges, Sixteenth Edition.
• AASHTO-LRFD: TABLE 3.4.1-1 - Load Combinations and Load Factors fromAASHTO LRFD Bridge Design Specificatios, Second Edition 1998.
• LRFD 2001: ASCE 7 from Load and Resistance Factor Design, Third Edition.
• Canadian Code: Clause 7, Load and Safety Criterion, Handbook of SteelConstruction.
Users can also enter and save their own codes.
A code consists of a set of combinations. Each combination is of a form similar to:
1.2 * (1*Dead + 1.5*Live + 2*Seismic + . . .)
The Auto Load Combinations tool selects existing load cases or result cases in the openproject and combines them based on their Load Class, according to the chosen code.
Some codes have factors that are chosen by the engineer. The Auto Load Combinations toolcalls these factors Code Variables, and they can be set by the user.
LARSA 2000 User's Guide
148
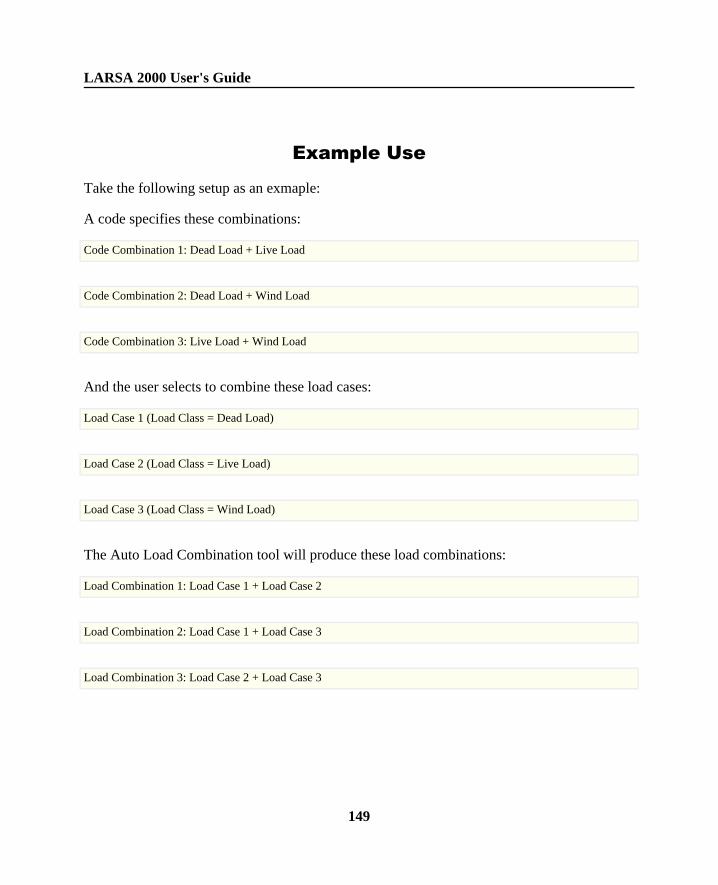
Example Use
Take the following setup as an exmaple:
A code specifies these combinations:
Code Combination 1: Dead Load + Live Load
Code Combination 2: Dead Load + Wind Load
Code Combination 3: Live Load + Wind Load
And the user selects to combine these load cases:
Load Case 1 (Load Class = Dead Load)
Load Case 2 (Load Class = Live Load)
Load Case 3 (Load Class = Wind Load)
The Auto Load Combination tool will produce these load combinations:
Load Combination 1: Load Case 1 + Load Case 2
Load Combination 2: Load Case 1 + Load Case 3
Load Combination 3: Load Case 2 + Load Case 3
LARSA 2000 User's Guide
149
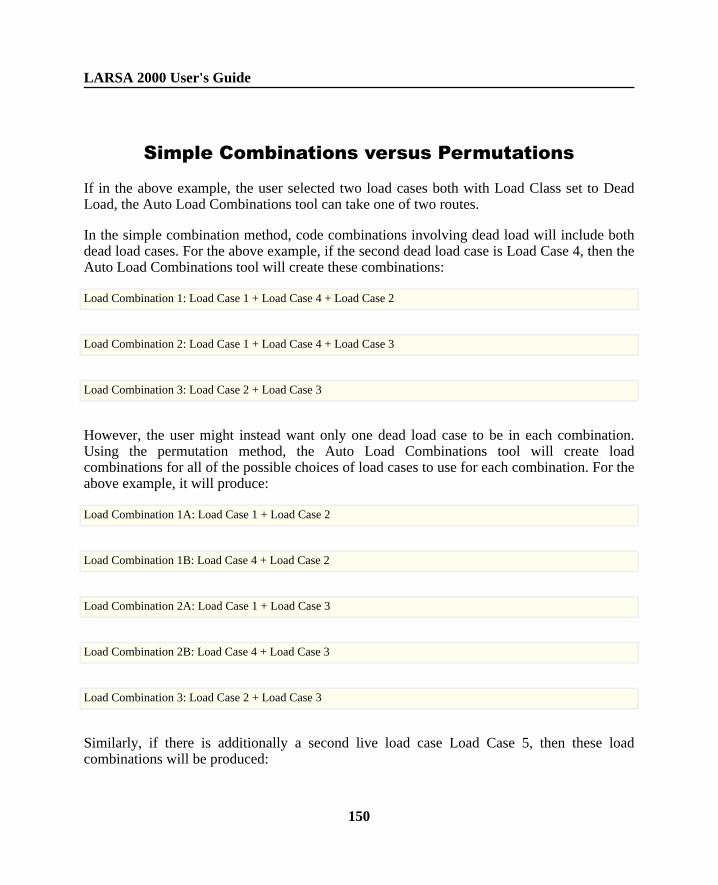
Simple Combinations versus Permutations
If in the above example, the user selected two load cases both with Load Class set to DeadLoad, the Auto Load Combinations tool can take one of two routes.
In the simple combination method, code combinations involving dead load will include bothdead load cases. For the above example, if the second dead load case is Load Case 4, then theAuto Load Combinations tool will create these combinations:
Load Combination 1: Load Case 1 + Load Case 4 + Load Case 2
Load Combination 2: Load Case 1 + Load Case 4 + Load Case 3
Load Combination 3: Load Case 2 + Load Case 3
However, the user might instead want only one dead load case to be in each combination.Using the permutation method, the Auto Load Combinations tool will create loadcombinations for all of the possible choices of load cases to use for each combination. For theabove example, it will produce:
Load Combination 1A: Load Case 1 + Load Case 2
Load Combination 1B: Load Case 4 + Load Case 2
Load Combination 2A: Load Case 1 + Load Case 3
Load Combination 2B: Load Case 4 + Load Case 3
Load Combination 3: Load Case 2 + Load Case 3
Similarly, if there is additionally a second live load case Load Case 5, then these loadcombinations will be produced:
LARSA 2000 User's Guide
150
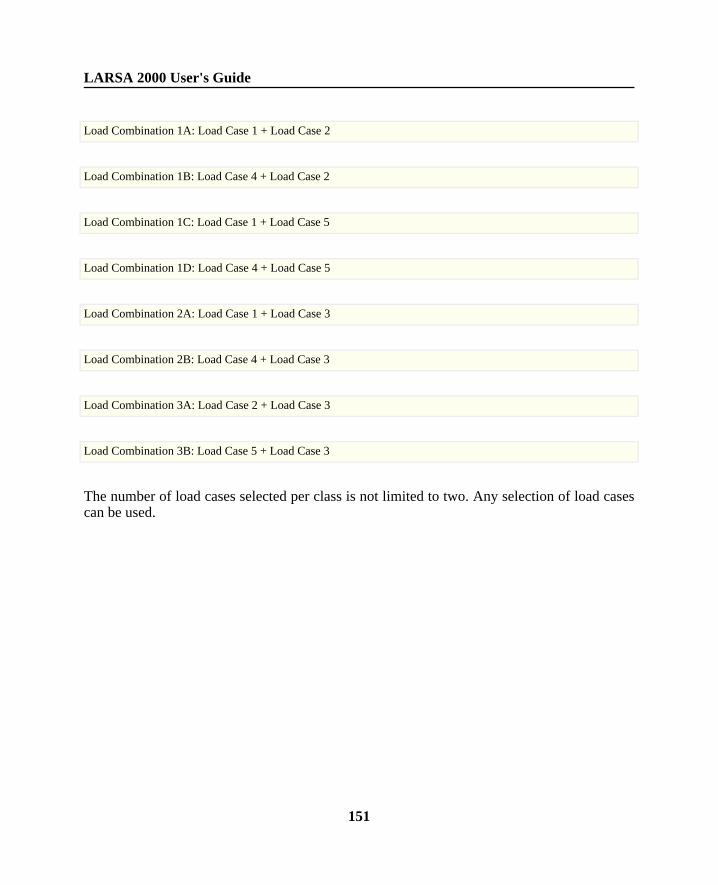
Load Combination 1A: Load Case 1 + Load Case 2
Load Combination 1B: Load Case 4 + Load Case 2
Load Combination 1C: Load Case 1 + Load Case 5
Load Combination 1D: Load Case 4 + Load Case 5
Load Combination 2A: Load Case 1 + Load Case 3
Load Combination 2B: Load Case 4 + Load Case 3
Load Combination 3A: Load Case 2 + Load Case 3
Load Combination 3B: Load Case 5 + Load Case 3
The number of load cases selected per class is not limited to two. Any selection of load casescan be used.
LARSA 2000 User's Guide
151
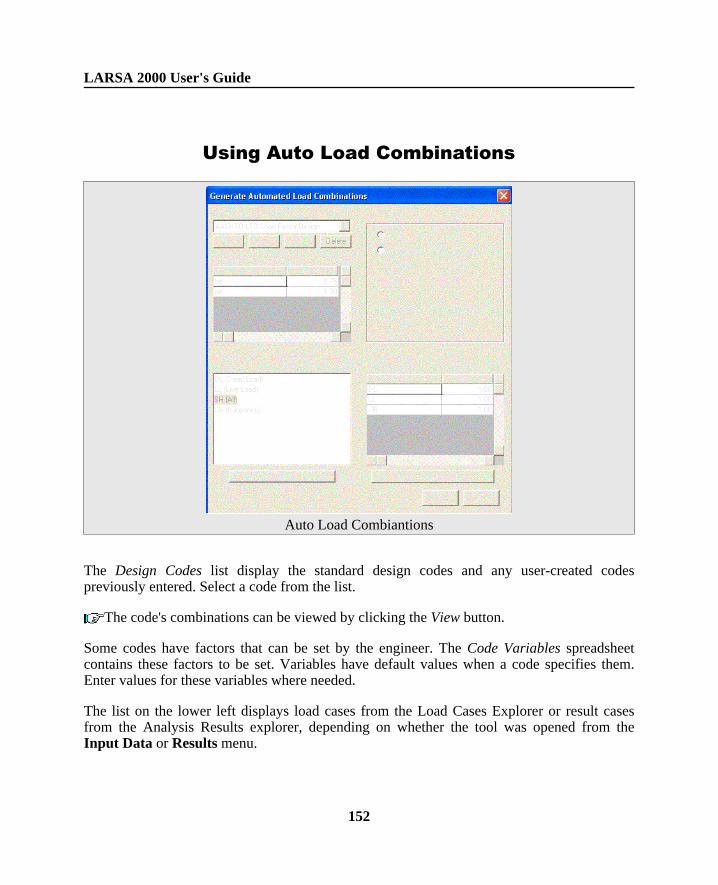
Using Auto Load Combinations
Auto Load Combiantions
The Design Codes list display the standard design codes and any user-created codespreviously entered. Select a code from the list.
The code's combinations can be viewed by clicking the View button.
Some codes have factors that can be set by the engineer. The Code Variables spreadsheetcontains these factors to be set. Variables have default values when a code specifies them.Enter values for these variables where needed.
The list on the lower left displays load cases from the Load Cases Explorer or result casesfrom the Analysis Results explorer, depending on whether the tool was opened from theInput Data or Results menu.
LARSA 2000 User's Guide
152
Choose which load cases/result cases to combine by selecting them from the list on theleft and clicking the Add button.
On top of the factors specified by the design code, factors may be applied to individualload cases as they are used by the code. A factor of 1.00 indicates not additional user factor isto be applied on top of the code.
If multiple load cases with the same load class have been selected, choose whether simplecombinations or permutations should be used. The difference is explained above.
Click Generate to create the new load combinations or linear result combinations. If thistool is run more than once, clicking Generate will not delete load cases or resultcombinations previously created by the tool.
Creating New Codes
User-defined codes can be created and used in the Auto Load Combinations tool.
New is used to create a new user defined design code.
Or, use Copy to create a new user code based on an existing code.
Click Edit to edit a user-defined code.
A window with a spreadsheet will appear. The rows of the spreadsheet are code-basedcombinations, and the columns are load classes. For each combination, enter the factor to beused for each load class in the appropriate column. For load classes not included in thecombination, leave the factor as zero.
A factor can be applied to all load classes, on top of any factors specified per class, byentering a factor in the first factor column.
Factors that must be set by the engineer at the time of generating combinations (codevariables) can be entered using a variable name instead of a numeric factor. Variable namesmust start with a letter.
User codes are stored in My Documents\LARSA Projects\User Codes with thefile extension code.
LARSA 2000 User's Guide
153
Tendon Results Tools
The tendon results tool visualizes tendon results, including geometry, losses andprimary/secondary moments.
This tool can be found on the Results menu under "Tendon Results."
Tendons at Cross-Section
This tool shows all the tendons passing through at the given location of a member on itscross-section. Each tendon shown inside the cross-section is color coded and matched withthe spreadsheet showing tendon forces at this location.
LARSA 2000 User's Guide
154
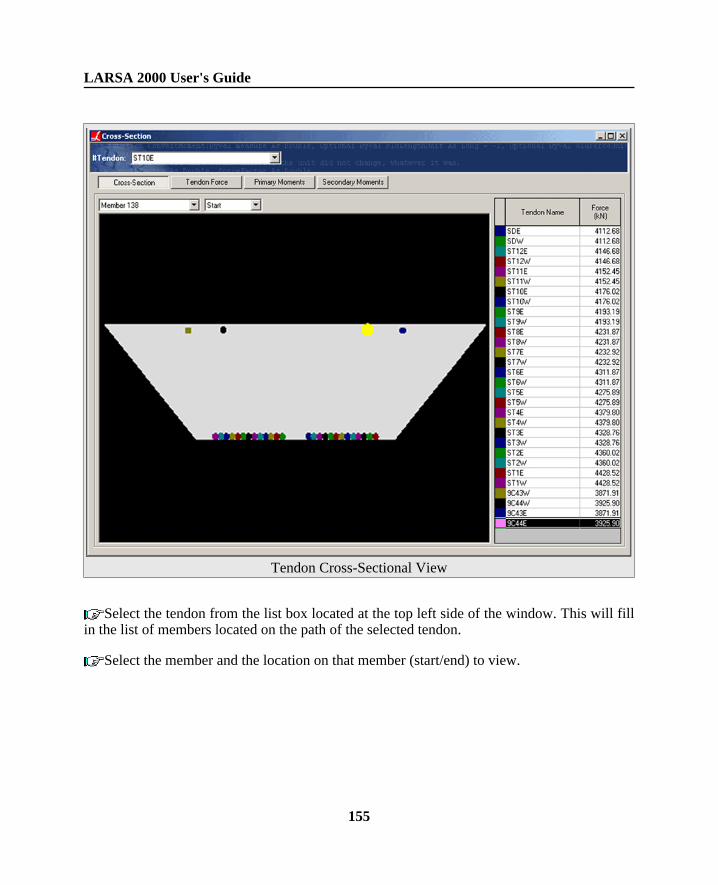
Tendon Cross-Sectional View
Select the tendon from the list box located at the top left side of the window. This will fillin the list of members located on the path of the selected tendon.
Select the member and the location on that member (start/end) to view.
LARSA 2000 User's Guide
155
Tendon Forces
This tool graphs short-term and long-term losses along the PT path. The vertical axis showsthe force in the tendon. The horizontal axis shows the distance from the start of the tendonpath. Short-term losses are represented in dark red, and long-term losses are shown in blue.
Primary Moments
This tool shows the primary moments at the end of each selected member graphed accordingto the members' x-coordinates. The horizontal axis is the member end x-coordinate, and thevertical axis is the primary moment at that location.
Secondary Moments
This tool shows the secondary moments at the end of each selected members, graphedaccording to the members' x-coordinates, as with the primary moments graph.
For More Information
• The Tendon Pseudoelement [in LARSA 2000 Reference].• Tendon Results [in LARSA 2000 Reference].
LARSA 2000 User's Guide
156
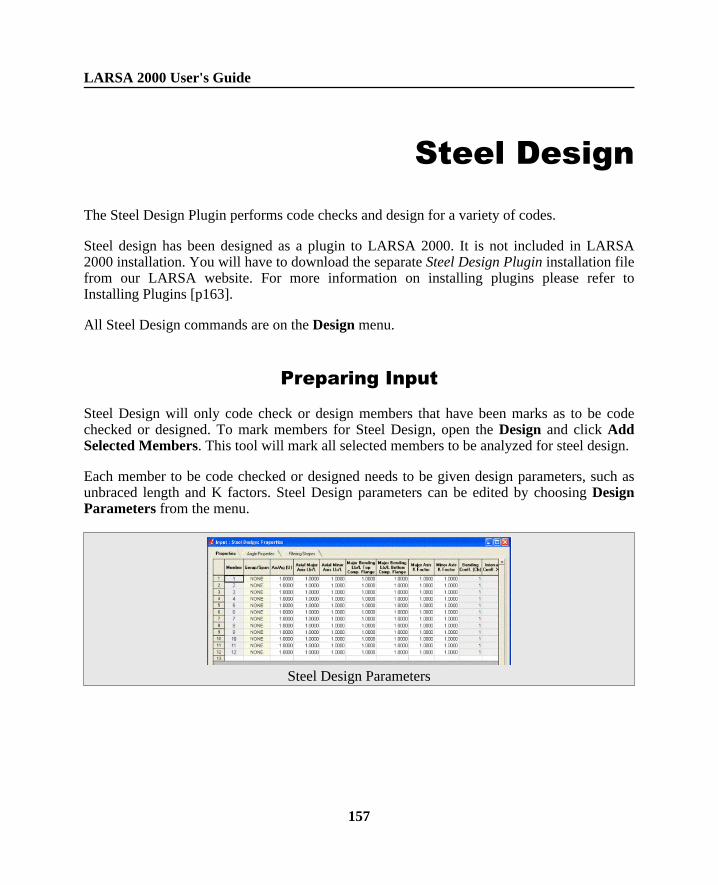
Steel Design
The Steel Design Plugin performs code checks and design for a variety of codes.
Steel design has been designed as a plugin to LARSA 2000. It is not included in LARSA2000 installation. You will have to download the separate Steel Design Plugin installation filefrom our LARSA website. For more information on installing plugins please refer toInstalling Plugins [p163].
All Steel Design commands are on the Design menu.
Preparing Input
Steel Design will only code check or design members that have been marks as to be codechecked or designed. To mark members for Steel Design, open the Design and click AddSelected Members. This tool will mark all selected members to be analyzed for steel design.
Each member to be code checked or designed needs to be given design parameters, such asunbraced length and K factors. Steel Design parameters can be edited by choosing DesignParameters from the menu.
Steel Design Parameters
LARSA 2000 User's Guide
157
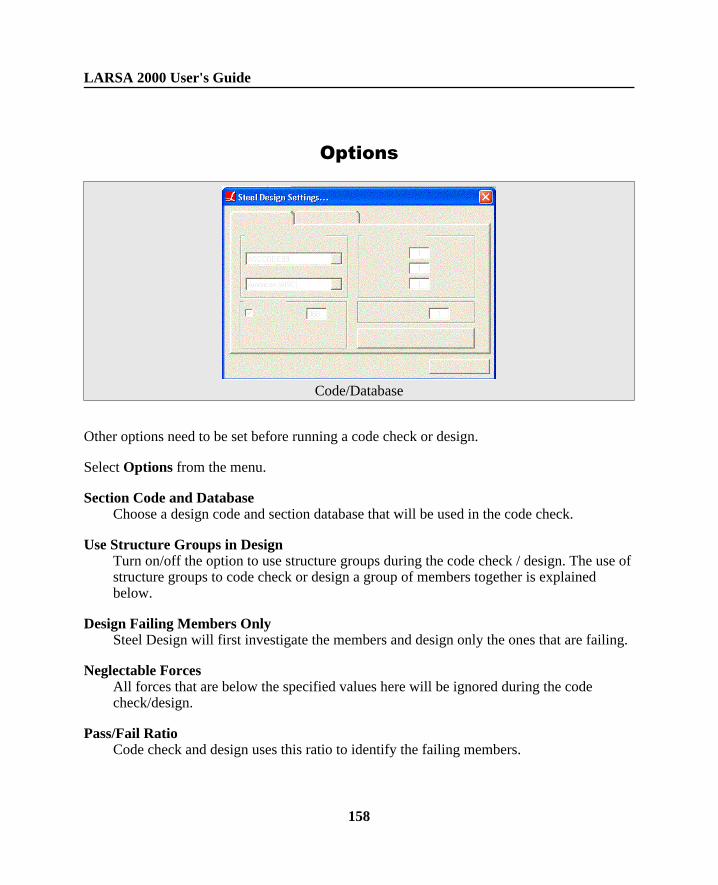
Options
Code/Database
Other options need to be set before running a code check or design.
Select Options from the menu.
Section Code and DatabaseChoose a design code and section database that will be used in the code check.
Use Structure Groups in DesignTurn on/off the option to use structure groups during the code check / design. The use ofstructure groups to code check or design a group of members together is explainedbelow.
Design Failing Members OnlySteel Design will first investigate the members and design only the ones that are failing.
Neglectable ForcesAll forces that are below the specified values here will be ignored during the codecheck/design.
Pass/Fail RatioCode check and design uses this ratio to identify the failing members.
LARSA 2000 User's Guide
158
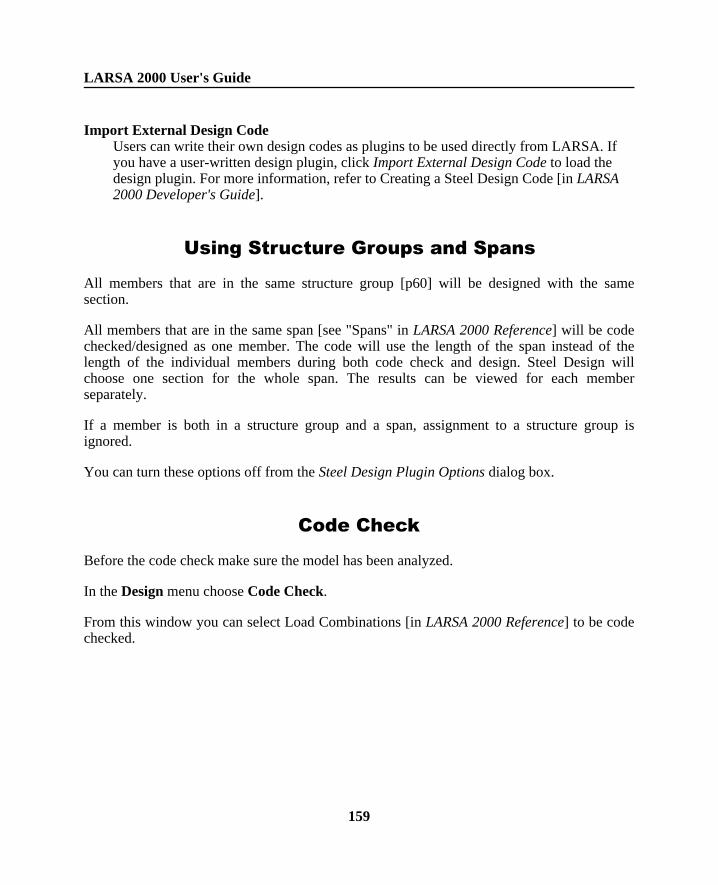
Import External Design CodeUsers can write their own design codes as plugins to be used directly from LARSA. Ifyou have a user-written design plugin, click Import External Design Code to load thedesign plugin. For more information, refer to Creating a Steel Design Code [in LARSA2000 Developer's Guide].
Using Structure Groups and Spans
All members that are in the same structure group [p60] will be designed with the samesection.
All members that are in the same span [see "Spans" in LARSA 2000 Reference] will be codechecked/designed as one member. The code will use the length of the span instead of thelength of the individual members during both code check and design. Steel Design willchoose one section for the whole span. The results can be viewed for each memberseparately.
If a member is both in a structure group and a span, assignment to a structure group isignored.
You can turn these options off from the Steel Design Plugin Options dialog box.
Code Check
Before the code check make sure the model has been analyzed.
In the Design menu choose Code Check.
From this window you can select Load Combinations [in LARSA 2000 Reference] to be codechecked.
LARSA 2000 User's Guide
159
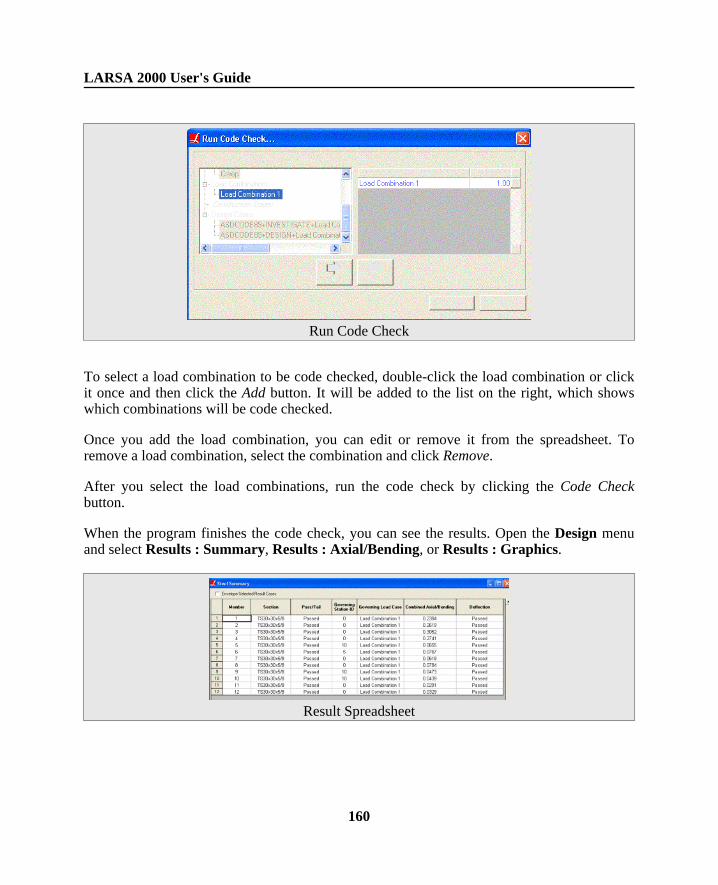
Run Code Check
To select a load combination to be code checked, double-click the load combination or clickit once and then click the Add button. It will be added to the list on the right, which showswhich combinations will be code checked.
Once you add the load combination, you can edit or remove it from the spreadsheet. Toremove a load combination, select the combination and click Remove.
After you select the load combinations, run the code check by clicking the Code Checkbutton.
When the program finishes the code check, you can see the results. Open the Design menuand select Results : Summary, Results : Axial/Bending, or Results : Graphics.
Result Spreadsheet
LARSA 2000 User's Guide
160
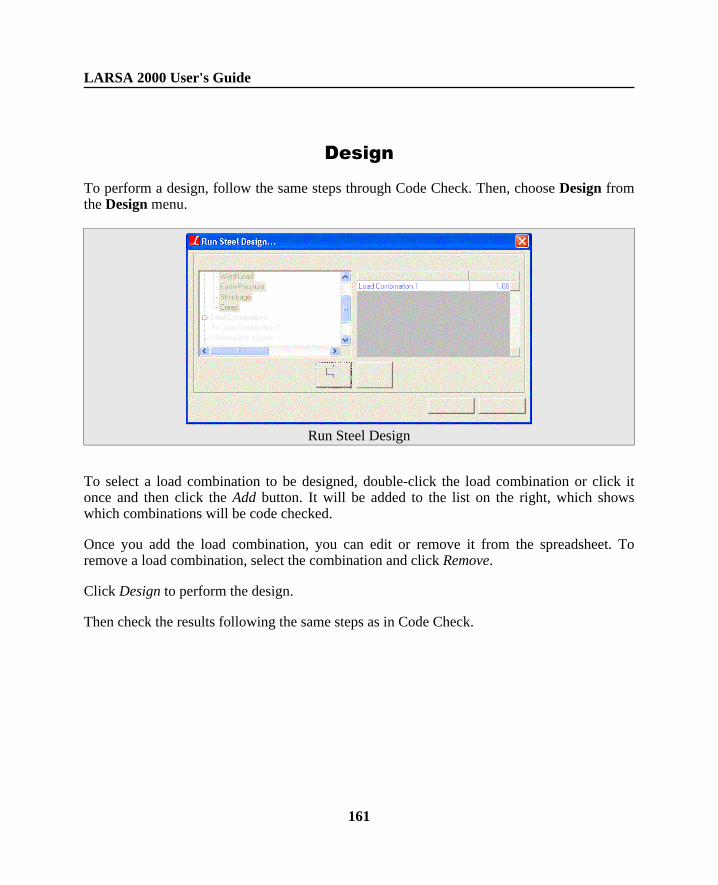
Design
To perform a design, follow the same steps through Code Check. Then, choose Design fromthe Design menu.
Run Steel Design
To select a load combination to be designed, double-click the load combination or click itonce and then click the Add button. It will be added to the list on the right, which showswhich combinations will be code checked.
Once you add the load combination, you can edit or remove it from the spreadsheet. Toremove a load combination, select the combination and click Remove.
Click Design to perform the design.
Then check the results following the same steps as in Code Check.
LARSA 2000 User's Guide
161
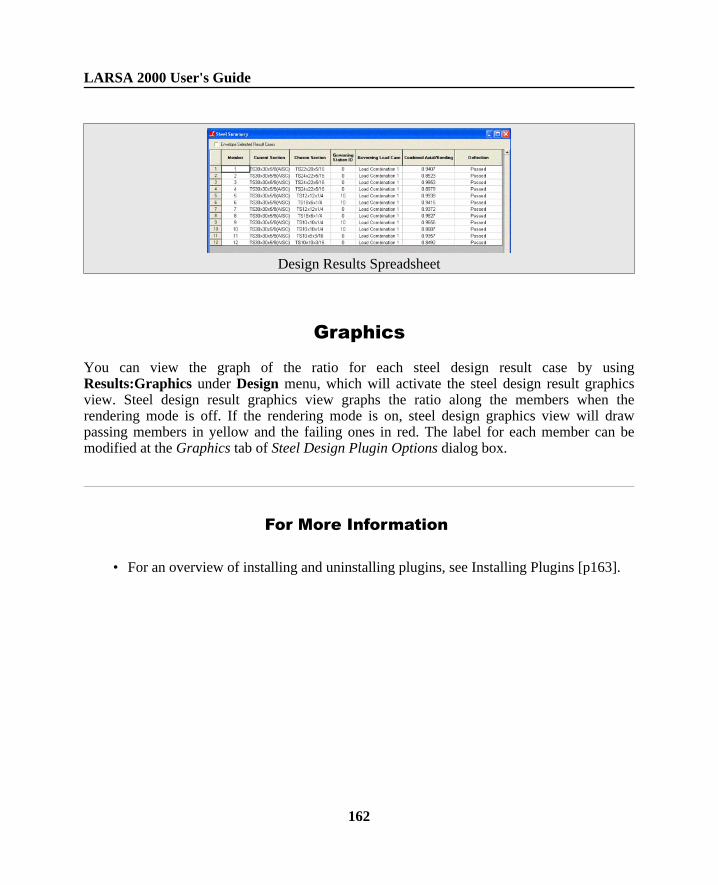
Design Results Spreadsheet
Graphics
You can view the graph of the ratio for each steel design result case by usingResults:Graphics under Design menu, which will activate the steel design result graphicsview. Steel design result graphics view graphs the ratio along the members when therendering mode is off. If the rendering mode is on, steel design graphics view will drawpassing members in yellow and the failing ones in red. The label for each member can bemodified at the Graphics tab of Steel Design Plugin Options dialog box.
For More Information
• For an overview of installing and uninstalling plugins, see Installing Plugins [p163].
LARSA 2000 User's Guide
162
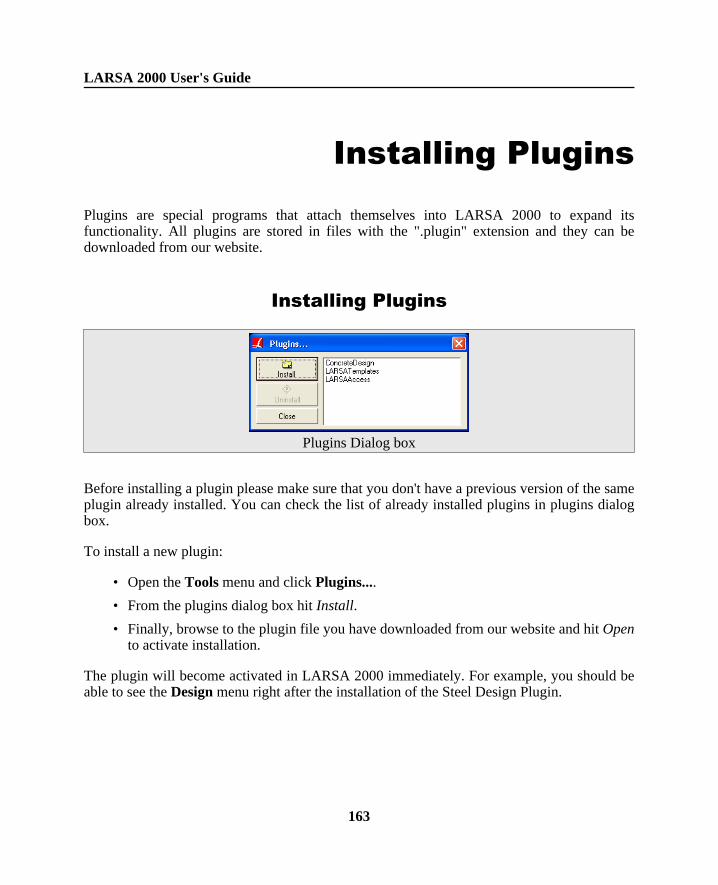
Installing Plugins
Plugins are special programs that attach themselves into LARSA 2000 to expand itsfunctionality. All plugins are stored in files with the ".plugin" extension and they can bedownloaded from our website.
Installing Plugins
Plugins Dialog box
Before installing a plugin please make sure that you don't have a previous version of the sameplugin already installed. You can check the list of already installed plugins in plugins dialogbox.
To install a new plugin:
• Open the Tools menu and click Plugins....
• From the plugins dialog box hit Install.
• Finally, browse to the plugin file you have downloaded from our website and hit Opento activate installation.
The plugin will become activated in LARSA 2000 immediately. For example, you should beable to see the Design menu right after the installation of the Steel Design Plugin.
LARSA 2000 User's Guide
163
Uninstalling Plugins
With every new version, plugins may loose the compatibility with LARSA 2000, or theremay just be a new version of the plugin that you would like to use. For both cases you have todownload the compatible version of the plugin from LARSA website. Before installing thenew version, you will have to uninstall the existing one.
• Open the Tools menu and click Plugins....
• Select the name of the plugin from the list and hit Uninstall.
LARSA 2000 will have to close down for the changes to take effect. It will not proceed withuninstallation of the plugin if you have an unsaved active project.
For More Information
• For an overview of plugins, see LARSA 2000 Plugin Technology [in LARSA 2000Developer's Guide].
LARSA 2000 User's Guide
164
Index
.dml, 35
.drs, 35
.dth, 35
.lan, 35
.lar, 35
.lpsx, 35active coordinate system, 98activity, 64add, 91address, 20AISC, 105analysis, 116analysis results explorer, 66angle, 141animation
Export AVI (Animation), 30Viewing Results Graphically, 120
animation speed, 143apply formulas, 113archive, 26assemble, 64author, 20auto load combinations, 148AutoCAD
Export to DXF (AutoCAD), 28Import from DXF (AutoCAD), 24
AVI, 30axis, 136break, 77calculate, 107capture deformed structure, 146chart, 136check for errors, 100colors, 60combination load cases, 58combinations, 131comments, 20company, 20concrete, 103connect, 77constraints, 88construction stages
Construction Stage Editor, 109Construction Stages Explorer, 64
contour diagram, 143coordinate systems, 98
coordinates, 86copy
Generation Tools, 81Transformations, 79Using the Model Spreadsheets, 91
count, 20cross-sectional tendon view, 154custom section, 107cut, 91data entry, 91databases
Connecting Databases, 89File Types, 35Loading Standard Materials, 103Loading Standard Sections, 105The Database Editor, 110
dead load, 58deflections, 143deformation, 146deformed model
Graphical Results Options, 143Viewing Results Graphically, 120
deleteErase and Delete, 76Using the Model Spreadsheets, 91
deleting result cases, 66diagram style, 143disassemble, 64disconnect, 77displacements
Capture Deformed Structure, 146Results Units, 141
display, 52draw, 70DXF
Export to DXF (AutoCAD), 28Import from DXF (AutoCAD), 24
editing, 56editing result cases, 66element yield, 120enlarge, 79envelope
Analysis Results Explorer, 66Viewing Results Graphically, 120
envelopes, 134erase
Erase and Delete, 76Using the Model Spreadsheets, 91
errors, 100European, 105explorer
Analysis Results Explorer, 66Load Cases Explorer, 58Model Data Explorer, 56
explorers, 54export
LARSA 2000 User's Guide
165
Export AVI (Animation), 30Export to DXF (AutoCAD), 28Export to Zip Package, 26
extensions, 35extents, 50extreme effect groups, 134extrude, 81factors, 131fax, 20file types, 35flip, 79force
Model Units, 86Results Units, 141Results Units, 141
formulasSpreadsheet Formulas, 113Using the Model Spreadsheets, 91
framework, 81generation, 81geometry
Capture Deformed Structure, 146Drawing Geometry and Loads, 70Model Data Explorer, 56
ghosted, 143global coordinate system, 98global restraints, 88graph, 136graphical results, 120graphics
An Overview of Graphics & Selection, 38Drawing Geometry and Loads, 70Graphical Results Options, 143Graphics Display Options, 46Graphics Window Grid, 50
grid, 50group, 60grouping results, 134grow, 79hide unselected, 52HS-20
Connecting Databases, 89The Database Editor, 110
icons, 46import
Import from DXF (AutoCAD), 24Import Project (Merge), 22Loading Standard Materials, 103Loading Standard Sections, 105
insert, 91installing plugins, 163integrity check, 100join, 77joint, 70labels, 46LARSA 2000, 8
lengthModel Units, 86Results Units, 141
line diagram, 143linear result combinations, 131live load, 58load
Import from DXF (AutoCAD), 24Loading Standard Materials, 103Loading Standard Sections, 105
load case, 66load cases explorer, 58load combinations
Linear Result Combinations, 131Load Cases Explorer, 58
load patternsConnecting Databases, 89The Database Editor, 110
loadsDrawing Geometry and Loads, 70Model Data Explorer, 56Model Units, 86
local coordinate systems, 98long-term losses, 154mass, 86material, 86material database, 103materials, 103member, 70member deflections, 143member forces, 120member stresses, 120merge
Break, Merge, and Join, 77Import from DXF (AutoCAD), 24Import Project (Merge), 22
mesh, 81mirror, 79mistake, 75mode shapes, 120model data explorer, 56model integrity, 100move, 79movedata.dml, 89movie, 30moving load analysis
Connecting Databases, 89The Database Editor, 110
number, 20numeric, 91oops!, 75options, 143orhographic, 46overview
An Overview of Graphics & Selection, 38Overview, 6
LARSA 2000 User's Guide
166
Using LARSA Overview, 10package, 26pan, 38paste, 91perspective, 46plane, 44plate, 70plate deformation, 120plate forces, 120plate stresses, 120plot, 136plugins, 163polygon, 45post-tensioning, 154primary moments, 154print, 32project
Import Project (Merge), 22Project Properties, 20
properties, 20properties of result cases, 66redo, 75reduce, 79remove
Erase and Delete, 76Using the Model Spreadsheets, 91
rendering, 46repeat, 81report, 32response spectra analysis
Connecting Databases, 89The Database Editor, 110
restraints, 88result cases, 66result combinations, 131results
Graphical Results Options, 143Results Spreadsheets, 127Results Units, 141Viewing Results Graphically, 120
rotateAn Overview of Graphics & Selection, 38Transformations, 79
running an analysis, 116save
Export AVI (Animation), 30Export to DXF (AutoCAD), 28Export to Zip Package, 26
scale, 79scale factor, 143secondary moments, 154section
Creating Custom Sections, 107Model Units, 86
section database, 105sections, 105
segments, 143select
An Overview of Graphics & Selection, 38Select by Plane, 44Select by Polygon, 45Select Special, 42Structure Groups Explorer, 60
self-weight, 58separate, 77shapes, 107shift, 79short-term losses, 154shrink
Graphics Display Options, 46Transformations, 79
sizeGraphical Results Options, 143Graphics Display Options, 46
slice, 77solid diagram, 143span deflections, 143split, 77spreadsheets
Results Spreadsheets, 127Using the Model Spreadsheets, 91
spring, 70springs, 86staged construction, 64stages
Construction Stage Editor, 109Construction Stages Explorer, 64
standard materials, 103standard sections, 105static loads, 58stations, 143steel, 103steel design, 157steps, 64stress, 141stress trajectories, 143structure groups explorer, 60style of diagram, 143summary, 32telephone, 20temperature, 86tendon results, 154tendons, 154testing the model, 116time history analysis
Connecting Databases, 89The Database Editor, 110
title, 20total, 20transformation, 79translate
Generation Tools, 81
LARSA 2000 User's Guide
167
Transformations, 79trucks
Connecting Databases, 89The Database Editor, 110
turn, 79twist, 81UK, 105undo
Erase and Delete, 76Undo/Redo, 75
unitsModel Units, 86Results Units, 141
universal restraints, 88user coordinate systems, 98vehicles
Connecting Databases, 89The Database Editor, 110
website, 20worst-case scenario, 134ZIP, 26zoom, 38
LARSA 2000 User's Guide
168