Embed Size (px)
Citation preview

Larry Cook Consulting (ABN 27 159 132 055)
PO Box 8146 TUMBI UMBI NSW 2261
Office: 02 4340 0193 Mobile: 0428 884645 Email: [email protected]
Larry Cook Consulting Pty Ltd
GROUNDWATER MONITORING,
SAMPLING AND TESTING
JULY 2015
‘Ardmore Park’ Quarry
Lot 24 in DP1001312
5152 Oallen Ford Road, Bungonia
PREPARED FOR: MULTIQUIP QUARRIES
PROJECT NO: 15076 DATE: 16TH
AUGUST 2015

Larry Cook Consulting Pty Ltd Groundwater Monitoring, Sampling & Testing – Lot 24 in DP1001312 5152 Oallen Ford Road Bungonia
REP. NO. 15076-B PAGE i
COPYRIGHT
© Larry Cook Consulting Pty Ltd, 2015
All intellectual property and copyright reserved.
Apart from any fair dealing for the purpose of private study, research, criticism or review, as permitted under the Copyright Act, 1968, no part of this report may be reproduced, transmitted, stored in a retrieval system or adapted in any form or by any means (electronic, mechanical, photocopying, recording or otherwise) without written permission. Enquiries should be addressed to Larry Cook Consulting Pty Ltd.
Author and Document Control
Record of Distribution
Copies Report No. & File Name Status Date Prepared for:
1 x PDF 15076-B Rev.1 Ed.1 16th August, 2015 Multiquip Quarries
Written/Submitted by: Reviewed / Approved by:
Larry Cook Senior Hydrogeologist & Environmental Scientist Larry Cook Consulting Pty Ltd

Larry Cook Consulting Pty Ltd Groundwater Monitoring, Sampling & Testing – Lot 24 in DP1001312 5152 Oallen Ford Road Bungonia
REP. NO. 15076-B PAGE ii
TABLE OF CONTENTS
1. INTRODUCTION ................................................................................................ 1
1.1 PURPOSE AND OBJECTIVES ......................................................................... 1
1.2 RELEVANT GUIDELINES AND STANDARDS ................................................................ 1
2. SITE DETAILS.................................................................................................... 1
3. GROUNDWATER MONITORING SITES ........................................................... 2
4. GROUNDWATER SAMPLING ........................................................................... 4
5. QUALITY ASSURANCE & QUALITY CONTROL .............................................. 4
5.1 DATA QUALITY OBJECTIVES ................................................................................. 4
5.2 FIELD QA/QC ..................................................................................................... 5
5.3 LABORATORY QUALITY ASSURANCE AND QUALITY CONTROL .................................. 6
6.0 RESULTS ........................................................................................................... 6
6.1 INTRODUCTION .................................................................................................... 6
6.2 MEASUREMENTS OF PH ....................................................................................... 6
6.3 MEASUREMENTS OF ELECTRICAL CONDUCTIVITY (EC) ........................................... 6
6.4 SELECTED ANIONS AND CATIONS ......................................................................... 7
6.5 NUTRIENTS ......................................................................................................... 7
7. DISCUSSION, CONCLUSIONS AND RECOMMENDATIONS .......................... 7

Larry Cook Consulting Pty Ltd Groundwater Monitoring, Sampling & Testing – Lot 24 in DP1001312 5152 Oallen Ford Road Bungonia
REP. NO. 15076-B PAGE iii
LIST OF TABLES, FIGURES & APPENDICES
TABLES
Table 1: Site Identification Details
Table 2 Register of Groundwater Monitoring Sites
Table 3 List of Analytes and Tests
Table 4 Data Quality Objectives
Table 5 Field QA/QC
Table 6 Summary Analytical Results
FIGURES
Figure 1 Location of Site
Figure 2 Locations of Hardrock Monitoring Bores
Figure 3 Locations of Sand Monitoring Bores
Figure 4 Locations of Springs
ANNEXURES
Annexure 1 Laboratory Certificate and COC

Larry Cook Consulting Pty Ltd Groundwater Monitoring, Sampling & Testing – Lot 24 in DP1001312 5152 Oallen Ford Road Bungonia
REP. NO. 15076-B PAGE 1
1. INTRODUCTION
1.1 PURPOSE AND OBJECTIVES
Larry Cook Consulting Pty Ltd was commissioned by Multiquip Quarries to carry out
water level measurements and water quality sampling and testing, and prepare a
report documenting water quality test results and comparing the results against the
Protection of Freshwater Aquatic Ecosystems (ANZECC 2000) and Drinking Water
Guidelines: National Water Quality Management Strategy 2004 (the Guidelines).
This report documents the results of scheduled water level monitoring and water
quality testing carried out on 28th July 2015.
1.2 RELEVANT GUIDELINES AND STANDARDS
A summary of the relevant guidelines and industry standards relating to monitoring,
sampling and testing of groundwater are detailed below:
Approved Methods for Sampling and Analysis of Water Pollutants in NSW (EPA 1998);
Handbook: Groundwater. Volume II: Methodology (USEPA 1991);
Minimum Construction Requirements for Water Bores in Australia (2003) (Land and Water Biodiversity Committee);
Protection of Freshwater Aquatic Ecosystems (ANZECC 2000); and
Drinking Water Guidelines: National Water Quality Management Strategy 2004.
2. SITE DETAILS
The Property is located adjacent to and on the eastern side of, sealed Oallen Ford Road approximately four kilometres due south of the village of Bungonia and about 25 kilometres southeast of the major regional commercial centre of Goulburn. The Property is nestled within largely cleared rolling hills on the western side of the rugged pristine Bungonia State Recreation Area and Morton National Park. Access to the Property is due south from Bungonia along Oallen Ford Road for approximately four kilometres with the entrance to the Property at the intersection of Oallen Ford Road and Lumley Road. The location of the Property is shown in Figure 1. The topographic map sheet covering the Property is Kooringaroo, 1:25,000 scale 8828-II-S (1983). The approximate AMG coordinates of the centre of the Property are Easting 769400m Northing 6134250m. The Property straddles part of a broad east-southeast trending ridge system, which broadly coincides with a basalt flow and forms a distinct watershed for drainages flowing north-northeast into the Limekiln and Inverary creek systems. Drainages to the south of the ridge system flow into the Jacqua Creek system. The top of the ridge system is at an average elevation of approximately 640m Average Height Datum (AHD) with the highest point on the Property being Chapman Trig Station at 676m AHD elevation, located in the central western part of the Property.

Larry Cook Consulting Pty Ltd Groundwater Monitoring, Sampling & Testing – Lot 24 in DP1001312 5152 Oallen Ford Road Bungonia
REP. NO. 15076-B PAGE 2
The key features required to identify the Site are summarised in Table 1.
Table 1: Site Identification Details
Site Description
Site Name Ardmore Park Quarry
Site Owner Multiquip Quarries
Address 5152 Oallen Ford Road, Bungonia NSW 2580
Title Plan Lot 24 in DP1001312
LGA Greater Argyle
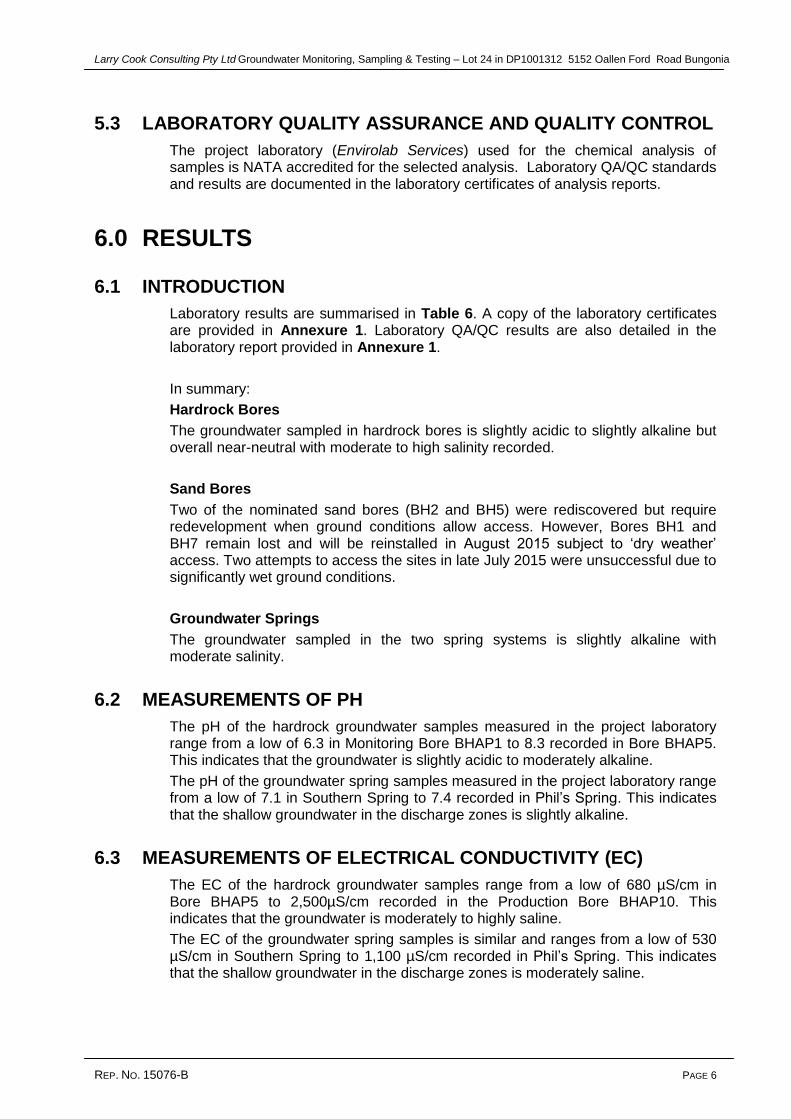
3. GROUNDWATER MONITORING SITES
A network of monitoring sites was established on the Site and off-site in 2004. These included a network of ‘hardrock’ production and monitoring bores, a strategically positioned network of sand monitoring bores and two springs.
The locations of the hardrock monitoring bores are shown in Figure 2, sand monitoring bores in Figure 3 and the two groundwater springs in Figure 4. The locations were strategically selected to intercept any potential contaminants that may be migrating in the groundwater system down gradient of the quarry.
A register of the monitoring sites with specifications is provided in Table 2.
Larry Cook Consulting Pty Ltd Groundwater Monitoring, Sampling & Testing – Lot 24 in DP1001312 5152 Oallen Ford Road Bungonia
REP. NO. 15076-B PAGE 3
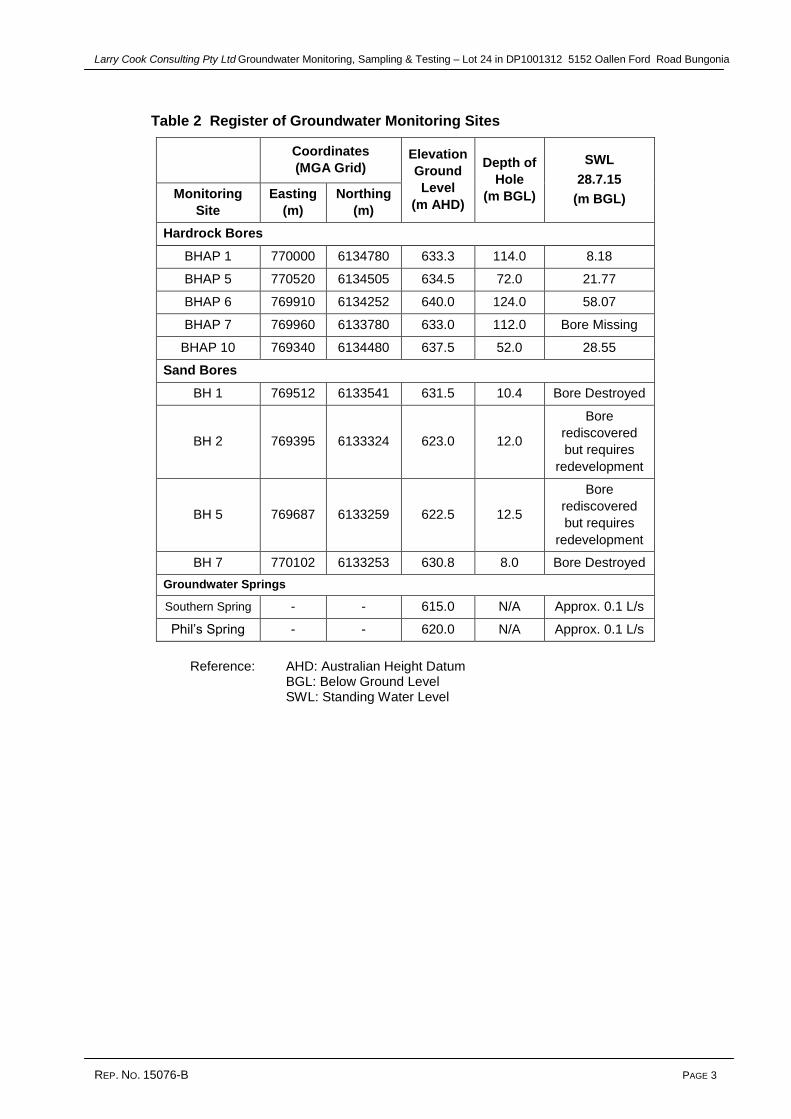
Table 2 Register of Groundwater Monitoring Sites
Coordinates
(MGA Grid) Elevation
Ground
Level
(m AHD)
Depth of
Hole
(m BGL)
SWL
28.7.15
(m BGL) Monitoring
Site
Easting
(m)
Northing
(m)
Hardrock Bores
BHAP 1 770000 6134780 633.3 114.0 8.18
BHAP 5 770520 6134505 634.5 72.0 21.77
BHAP 6 769910 6134252 640.0 124.0 58.07
BHAP 7 769960 6133780 633.0 112.0 Bore Missing
BHAP 10 769340 6134480 637.5 52.0 28.55
Sand Bores
BH 1 769512 6133541 631.5 10.4 Bore Destroyed
BH 2 769395 6133324 623.0 12.0
Bore
rediscovered
but requires
redevelopment
BH 5 769687 6133259 622.5 12.5
Bore
rediscovered
but requires
redevelopment
BH 7 770102 6133253 630.8 8.0 Bore Destroyed
Groundwater Springs
Southern Spring - - 615.0 N/A Approx. 0.1 L/s
Phil’s Spring - - 620.0 N/A Approx. 0.1 L/s
Reference: AHD: Australian Height Datum
BGL: Below Ground Level SWL: Standing Water Level
Larry Cook Consulting Pty Ltd Groundwater Monitoring, Sampling & Testing – Lot 24 in DP1001312 5152 Oallen Ford Road Bungonia
REP. NO. 15076-B PAGE 4
4. GROUNDWATER SAMPLING
Groundwater sampling in the nominated hardrock bores was conducted using either a stainless steel bailer which was decontaminated between bores using a Decon 90 solution or using the equipped pump (BHAP6). Suitable purging of the water column was undertaken prior to sampling. Field measurements of pH, Electrical Conductivity (EC), temperature, Redox Potential (Eh) and Dissolved Oxygen (DO) was undertaken during the purging process to determine at what time representative samples could be taken. Sampling of the nominated groundwater springs was achieved using a container.
Latex disposable gloves were used and samples stored in laboratory-supplied labelled bottles and chilled in an esky. The samples were submitted to NATA accredited laboratory Sydney Analytical Laboratories, Sydney (SAL) for a suite of tests and determinations proposed in the Groundwater Impact Assessment in order to characterise the chemistry of the groundwater and reveal any potential contamination. The samples were transported under our Chain of Custody (COC) protocol.
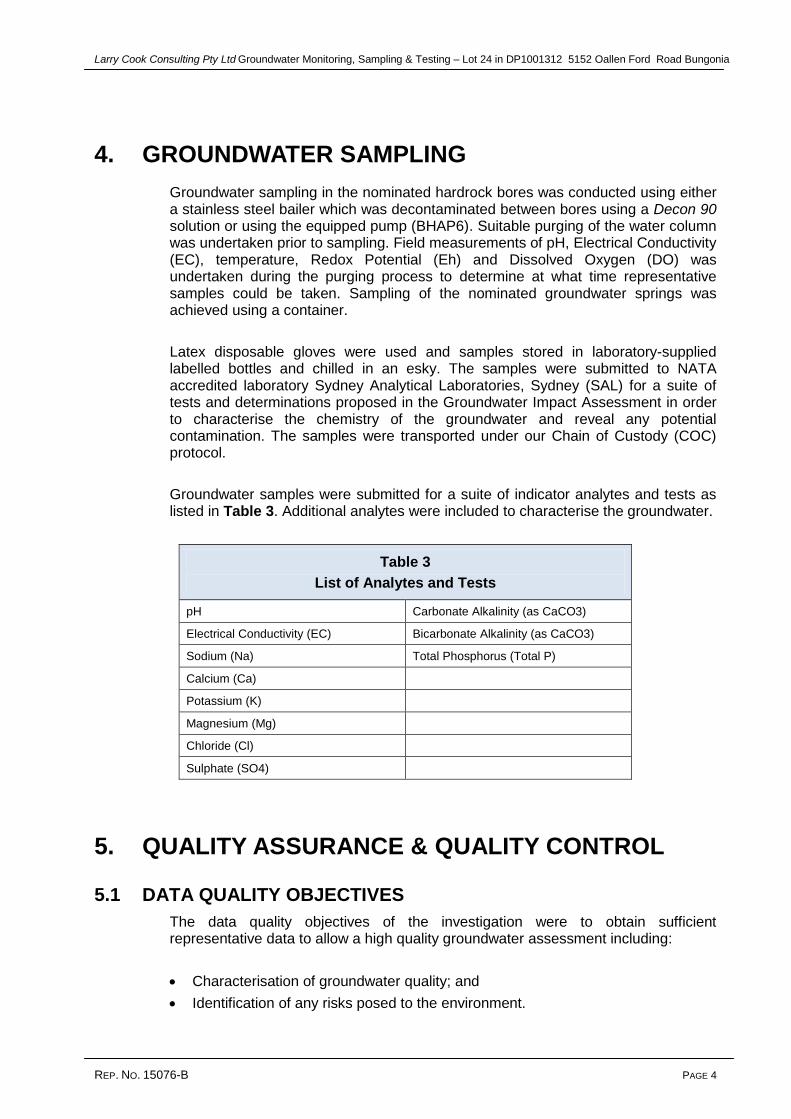
Groundwater samples were submitted for a suite of indicator analytes and tests as listed in Table 3. Additional analytes were included to characterise the groundwater.
Table 3
List of Analytes and Tests
pH Carbonate Alkalinity (as CaCO3)
Electrical Conductivity (EC) Bicarbonate Alkalinity (as CaCO3)
Sodium (Na) Total Phosphorus (Total P)
Calcium (Ca)
Potassium (K)
Magnesium (Mg)
Chloride (Cl)
Sulphate (SO4)
5. QUALITY ASSURANCE & QUALITY CONTROL
5.1 DATA QUALITY OBJECTIVES
The data quality objectives of the investigation were to obtain sufficient representative data to allow a high quality groundwater assessment including:
Characterisation of groundwater quality; and
Identification of any risks posed to the environment.

Larry Cook Consulting Pty Ltd Groundwater Monitoring, Sampling & Testing – Lot 24 in DP1001312 5152 Oallen Ford Road Bungonia
REP. NO. 15076-B PAGE 5
The assessment was conducted to a standard consistent with generally accepted and current professional consulting practice for such an investigation. The evaluation criteria (Decision Rules) adopted for the investigation are summarised in Table 4.
Table 4 Data Quality Objectives
DQO Evaluation Criteria
Documentation
completeness
Completion of calibration records, chain of custody
documentation, laboratory test certificates from NATA-
accredited laboratory
Data comparability
Use of appropriate techniques for the sampling, storage
and transportation of samples. Use of NATA accredited
laboratory.
Data
representativeness
Adequate sampling coverage of all areas of environmental
concern at the site, and selection of representative
samples
Precision and
accuracy for
sampling and
analysis
Use properly trained and qualified field personnel.
Achieve laboratory QC criteria.
5.2 FIELD QA/QC
The Quality Assurance and Quality Control QA/QC protocols used during the fieldwork are listed in Table 5.
Table 5 Field QA/QC
Protocol Description
Sampling
Team
The fieldwork was managed by Larry Cook, Senior Hydrogeologist.
Project personnel comprised professionals and technicians trained
in conducting groundwater investigations.
QA/QC System
All fieldwork was conducted in accordance with the Larry Cook
Consulting Standard Sampling Procedure by professionals and
trained technicians.
Chain of
Custody Forms
All samples were logged and transferred under appropriately
completed Chain of Custody (COC) Forms.
Preservation
All samples were delivered to the project laboratory in appropriately
preserved containers, with preservation consisting of packing
samples in eskies with ice.
Blind Field
Duplicates Duplicate testing was not carried out for this assessment.
Larry Cook Consulting Pty Ltd Groundwater Monitoring, Sampling & Testing – Lot 24 in DP1001312 5152 Oallen Ford Road Bungonia
REP. NO. 15076-B PAGE 6
5.3 LABORATORY QUALITY ASSURANCE AND QUALITY CONTROL
The project laboratory (Envirolab Services) used for the chemical analysis of samples is NATA accredited for the selected analysis. Laboratory QA/QC standards and results are documented in the laboratory certificates of analysis reports.
6.0 RESULTS
6.1 INTRODUCTION
Laboratory results are summarised in Table 6. A copy of the laboratory certificates are provided in Annexure 1. Laboratory QA/QC results are also detailed in the laboratory report provided in Annexure 1.
In summary:
Hardrock Bores
The groundwater sampled in hardrock bores is slightly acidic to slightly alkaline but overall near-neutral with moderate to high salinity recorded.
Sand Bores
Two of the nominated sand bores (BH2 and BH5) were rediscovered but require redevelopment when ground conditions allow access. However, Bores BH1 and BH7 remain lost and will be reinstalled in August 2015 subject to ‘dry weather’ access. Two attempts to access the sites in late July 2015 were unsuccessful due to significantly wet ground conditions.
Groundwater Springs
The groundwater sampled in the two spring systems is slightly alkaline with moderate salinity.
6.2 MEASUREMENTS OF PH
The pH of the hardrock groundwater samples measured in the project laboratory range from a low of 6.3 in Monitoring Bore BHAP1 to 8.3 recorded in Bore BHAP5. This indicates that the groundwater is slightly acidic to moderately alkaline.
The pH of the groundwater spring samples measured in the project laboratory range from a low of 7.1 in Southern Spring to 7.4 recorded in Phil’s Spring. This indicates that the shallow groundwater in the discharge zones is slightly alkaline.
6.3 MEASUREMENTS OF ELECTRICAL CONDUCTIVITY (EC)
The EC of the hardrock groundwater samples range from a low of 680 µS/cm in Bore BHAP5 to 2,500µS/cm recorded in the Production Bore BHAP10. This indicates that the groundwater is moderately to highly saline.
The EC of the groundwater spring samples is similar and ranges from a low of 530 µS/cm in Southern Spring to 1,100 µS/cm recorded in Phil’s Spring. This indicates that the shallow groundwater in the discharge zones is moderately saline.

BH
AP
/1B
HA
P/5
BH
AP
/6B
HA
P/1
0S
outh
S
prin
gP
hil's
S
prin
g
Mon
itorin
g B
ore
Mon
itorin
g B
ore
Mon
itorin
g B
ore
Mon
itorin
g B
ore
Mon
itorin
g B
ore
Mon
itorin
g B
ore
AN
AL
YT
EU
NIT
pH (l
ab)
pH U
nits
ISD
6.3
8.3
7.1
6.8
7.1
7.4
Elec
trica
l Con
duct
ivity
(lab
)µS
/cm
1.0
760
680
2,1
00
2,5
00
530
1,1
00
Cati
on
s
Sodiu
m N
a+
mg/
L180
0.5
130
20
230
400
50
87
Calc
ium
Ca+
+m
g/L
0.5
18
19
140
69
21
50
Pota
ssiu
m K
+m
g/L
0.5
1.3
0.9
3.3
8.0
1.1
0.7
Magnesiu
m M
g+
+m
g/L
0.5
13
72
70
96
30
81
An
ion
s
Chlo
ride C
l-m
g/L
250
1230
52
500
670
86
150
Sulp
hate
SO
4--
mg/
L500
16
19
25
59
<1
16
Bic
arb
onate
HC
O3-
mg/
L5
18
230
350
330
170
420
Carb
onate
CO
3--
mg/
L5
<5
<5
<5
<5
<5
<5
Tota
l P
hosphoru
sm
g/L
0.0
50.1
0.2
0.1
0.3
01.4
0.2
1 Dri
nkin
g W
ater
Gui
delin
es: N
atio
nal W
ater
Qua
lity
Man
agem
ent S
trate
gy 2
004
n
ote:
ISD
den
otes
insu
ffici
ent d
ata
to se
t a g
uide
line
valu
e ba
sed
on h
ealth
con
side
ratio
ns2 P
rote
ctio
n of
Fre
shw
ater
Aqu
atic
Eco
syst
ems (
AN
ZEC
C 2
000)
Jul-15
Jul-15
Jul-15
Tab
le 6
S
um
mary
of
Wa
ter
Qu
ali
ty A
naly
tica
l R
es
ult
s
SAM
PLE
Gui
delin
es
Meth
od
Dete
ction
Lim
it
DE
SCR
IPT
ION
Dri
nkin
g W
ate
r -
He
alth
Gu
ide
line
s
1
Tri
gg
er
Va
lue
fo
r
the
Pro
tectio
n o
f
Fre
sh
wa
ter
Aq
ua
tic
Eco
syste
ms 2
DA
TE
Jul-15
Jul-15
Jul-15

Larry Cook Consulting Pty Ltd Groundwater Monitoring, Sampling & Testing – Lot 24 in DP1001312 5152 Oallen Ford Road Bungonia
REP. NO. 15076-B PAGE 7
6.4 SELECTED ANIONS AND CATIONS
Sodium levels in the hardrock groundwater samples range from a low of 20 mg/L
recorded in Bore BHAP5 to 400 mg/L in BHAP10.
Sodium levels in the shallow spring water samples range from 50 mg/L in
Southern Spring to 87 mg/L recorded in Phil’s Spring.
Chloride concentrations are generally in proportion with the sodium levels in the
same monitoring sites and, in the hardrock bores, range from a low of 52 mg/L in
Bore BHAP5 to 670 mg/L in Production Bore BHAP10.
Chloride levels in the shallow spring water samples range from a low of 86 mg/L
recorded in Southern Spring to 150 mg/L in Phil’s Spring.
Elevated sodium and chloride levels are believed to be largely associated with
the composition of the host geology and are the dominant species causing
elevated and anomalous measurements of electrical conductivity (EC).
The higher levels of magnesium in hardrock aquifers were recorded in Bores
BHAP6 (70 mg/L), Bore BHAP5 (72 mg/L) and Bore BHAP10 (96 mg/L). The
concentrations recorded in Southern Spring and Phil’s Spring were 30 mg/L and
81 mg/L respectively.
Concentrations of sulphate varied between 6 mg/L and 59 mg/L in the hardrock
aquifers and from less than the LOR and 16 mg/L in the spring systems.
An elevated level of bicarbonate was recorded in hardrock Production Bore
BHAP6 (350 mg/L) with a relatively low level in BHAP1 (18 mg/L). Similar
relatively high levels of bicarbonate were recorded in the two spring systems
(170 and 420 mg/L). Levels of carbonate in hardrock bores and springs were all
recorded less than the Limit of Reporting (LOR).
6.5 NUTRIENTS
Total Phosphorus levels in hardrock groundwater samples range from 0.10 mg/L in Production Bores BHAP1 and BHAP6 to 0.3 mg/L in BHAP10.
The concentrations of Total Phosphorus recorded in Southern Spring and Phil’s Spring were an anomalous level of 1.4 mg/L and 0.2 mg/L respectively.
7. DISCUSSION, CONCLUSIONS AND RECOMMENDATIONS
Based on the results of the groundwater testing, the following discussion, conclusions and recommendations are provided.
Natural pH values are near neutral and EC levels are considered to reflect the composition of the host geological formation. The moderate salinity of the springs reflects the relative close proximity to the remnant basalt layers in the area.

Larry Cook Consulting Pty Ltd Groundwater Monitoring, Sampling & Testing – Lot 24 in DP1001312 5152 Oallen Ford Road Bungonia
REP. NO. 15076-B PAGE 8
Concentrations of cations and anions were similar to those recorded in the last monitoring round (January 2015). An exception is the anomalously high concentration of Total Phosphorus recorded in the Southern Spring (30 mg/L) during the last monitoring round in January 2015. This result was not replicated in the current July 2015 testing.
Scheduled regular follow-up monitoring will provide useful data that will be analysed to detect any trends and assessed for any potential adverse impacts from the quarry operations on the groundwater system. Charting of water level data, water quality results and analysis of any trends will be undertaken following accumulation of sufficient data. Charting will recommence following receipt of results obtained from the next monitoring and testing round.
Recommendations
Attempt to again reinstall the destroyed sand monitoring bores BH1 and BH7 when ground conditions allow
Redevelop recently rediscovered sand monitoring bores BH2 and BH5, and other sand bores in the network
Continue the search for Hardrock Bore BHAP7
Reinstall automated water level data loggers in designated hardrock bores. New generation pressure transducers and telemetry are proposed
Attempt to again install automated flow monitoring in the two spring systems when ground conditions allow safe access
Carry out the next routine (quarterly) groundwater monitoring in the network of monitoring sites in late August 2015 in accordance with the minimum requirement for quarterly sampling and testing;
Submit groundwater samples from the next sampling and testing round in late August 2015 to the project laboratory for analysis, assess any trends and exceedances and, if required, implement a response and action plan in accordance with the guidelines; and
Prepare a report giving the results of the August 2015 monitoring round and an assessment of any trends and potential impacts. This will include an ongoing assessment of pH (acidity), EC and nutrient levels.

REP. NO. 15076-B PAGE 1
ANNEXURES

REP. NO. 15076-B PAGE 2
Annexure 1
Laboratory Certificate and
COC Documentation

CERTIFICATE OF ANALYSIS 132754
Client:
Larry Cook Consulting
PO Box 8146
Tumbi Umbi
NSW 2261
Attention: Larry Cook
Sample log in details:
Your Reference: Ardmore Park
No. of samples: 6 Waters
Date samples received / completed instructions received 14/08/2015 / 14/08/2015
Analysis Details:
Please refer to the following pages for results, methodology summary and quality control data.
Samples were analysed as received from the client. Results relate specifically to the samples as received.
Results are reported on a dry weight basis for solids and on an as received basis for other matrices.
Please refer to the last page of this report for any comments relating to the results.
Report Details:
Date results requested by: / Issue Date: 21/08/15 / 19/08/15
Date of Preliminary Report: Not Issued
NATA accreditation number 2901. This document shall not be reproduced except in full.
Accredited for compliance with ISO/IEC 17025. Tests not covered by NATA are denoted with *.
Results Approved By:
Page 1 of 8Envirolab Reference: 132754
Revision No: R 00

Client Reference: Ardmore Park
Ion Balance
Our Reference: UNITS 132754-1 132754-2 132754-3 132754-4 132754-5
Your Reference ------------- BHAP 1 BHAP 5 BHAP 6 BHAP 10 Phils Spring
Date Sampled ------------ 28/07/2015 28/07/2016 28/07/2017 28/07/2018 28/07/2019
Type of sample Water Water Water Water Water
Date prepared - 14/08/2015 14/08/2015 14/08/2015 14/08/2015 14/08/2015
Date analysed - 14/08/2015 14/08/2015 14/08/2015 14/08/2015 14/08/2015
Calcium - Dissolved mg/L 18 19 140 69 50
Potassium - Dissolved mg/L 1.3 0.9 3.3 8.0 0.7
Sodium - Dissolved mg/L 130 20 230 400 87
Magnesium - Dissolved mg/L 13 72 70 96 81
Hydroxide Alkalinity (OH-) as
CaCO3
mg/L <5 <5 <5 <5 <5
Bicarbonate Alkalinity as CaCO3 mg/L 18 230 350 330 420
Carbonate Alkalinity as CaCO3 mg/L <5 <5 <5 <5 <5
Total Alkalinity as CaCO3 mg/L 18 230 350 330 420
Sulphate, SO4 mg/L 6 19 25 59 16
Chloride, Cl mg/L 230 52 500 670 150
Ionic Balance % 6.0 9.7 2.6 4.3 -0.13
Ion Balance
Our Reference: UNITS 132754-6
Your Reference ------------- Southern
Spring
Date Sampled ------------ 28/07/2020
Type of sample Water
Date prepared - 14/08/2015
Date analysed - 14/08/2015
Calcium - Dissolved mg/L 21
Potassium - Dissolved mg/L 1.1
Sodium - Dissolved mg/L 50
Magnesium - Dissolved mg/L 30
Hydroxide Alkalinity (OH-) as
CaCO3
mg/L <5
Bicarbonate Alkalinity as CaCO3 mg/L 170
Carbonate Alkalinity as CaCO3 mg/L <5
Total Alkalinity as CaCO3 mg/L 170
Sulphate, SO4 mg/L <1
Chloride, Cl mg/L 86
Ionic Balance % -0.86
Page 2 of 8Envirolab Reference: 132754
Revision No: R 00

Client Reference: Ardmore Park
Metals in Waters - Total
Our Reference: UNITS 132754-1 132754-2 132754-3 132754-4 132754-5
Your Reference ------------- BHAP 1 BHAP 5 BHAP 6 BHAP 10 Phils Spring
Date Sampled ------------ 28/07/2015 28/07/2016 28/07/2017 28/07/2018 28/07/2019
Type of sample Water Water Water Water Water
Date prepared - 17/08/2015 17/08/2015 17/08/2015 17/08/2015 17/08/2015
Date analysed - 17/08/2015 17/08/2015 17/08/2015 17/08/2015 17/08/2015
Phosphorus - Total mg/L 0.1 0.2 0.1 0.3 0.2
Metals in Waters - Total
Our Reference: UNITS 132754-6
Your Reference ------------- Southern
Spring
Date Sampled ------------ 28/07/2020
Type of sample Water
Date prepared - 17/08/2015
Date analysed - 17/08/2015
Phosphorus - Total mg/L 1.4
Page 3 of 8Envirolab Reference: 132754
Revision No: R 00

Client Reference: Ardmore Park
Miscellaneous Inorganics
Our Reference: UNITS 132754-1 132754-2 132754-3 132754-4 132754-5
Your Reference ------------- BHAP 1 BHAP 5 BHAP 6 BHAP 10 Phils Spring
Date Sampled ------------ 28/07/2015 28/07/2016 28/07/2017 28/07/2018 28/07/2019
Type of sample Water Water Water Water Water
Date prepared - 14/08/2015 14/08/2015 14/08/2015 14/08/2015 14/08/2015
Date analysed - 14/08/2015 14/08/2015 14/08/2015 14/08/2015 14/08/2015
pH pH Units 6.3 8.3 7.1 6.8 7.4
Electrical Conductivity µS/cm 760 680 2,100 2,500 1,100
Miscellaneous Inorganics
Our Reference: UNITS 132754-6
Your Reference ------------- Southern
Spring
Date Sampled ------------ 28/07/2020
Type of sample Water
Date prepared - 14/08/2015
Date analysed - 14/08/2015
pH pH Units 7.1
Electrical Conductivity µS/cm 530
Page 4 of 8Envirolab Reference: 132754
Revision No: R 00

Client Reference: Ardmore Park
Method ID Methodology Summary
Metals-020 ICP-
AES
Determination of various metals by ICP-AES.
Inorg-006 Alkalinity - determined titrimetrically in accordance with APHA latest edition, 2320-B.
Inorg-081 Anions - a range of Anions are determined by Ion Chromatography, in accordance with APHA latest edition,
4110-B.
Inorg-041 Gravimetric determination of the total solids content of water based on APHA latest edition 2540B.
Inorg-001 pH - Measured using pH meter and electrode in accordance with APHA latest edition, 4500-H+. Please note
that the results for water analyses are indicative only, as analysis outside of the APHA storage times.
Inorg-002 Conductivity and Salinity - measured using a conductivity cell at 25oC in accordance with APHA latest edition
2510 and Rayment & Lyons.
Page 5 of 8Envirolab Reference: 132754
Revision No: R 00

Client Reference: Ardmore Park
QUALITY CONTROL UNITS PQL METHOD Blank Duplicate
Sm#
Duplicate results Spike Sm# Spike %
Recovery
Ion Balance Base ll Duplicate ll %RPD
Date prepared - 14/08/2
015
132754-1 14/08/2015 || 14/08/2015 LCS-W1 14/08/2015
Date analysed - 14/08/2
015
132754-1 14/08/2015 || 14/08/2015 LCS-W1 14/08/2015
Calcium - Dissolved mg/L 0.5 Metals-020
ICP-AES
<0.5 132754-1 18 || [N/T] LCS-W1 104%
Potassium - Dissolved mg/L 0.5 Metals-020
ICP-AES
<0.5 132754-1 1.3 || [N/T] LCS-W1 106%
Sodium - Dissolved mg/L 0.5 Metals-020
ICP-AES
<0.5 132754-1 130 || [N/T] LCS-W1 105%
Magnesium - Dissolved mg/L 0.5 Metals-020
ICP-AES
<0.5 132754-1 13 || [N/T] LCS-W1 106%
Hydroxide Alkalinity
(OH-) as CaCO3
mg/L 5 Inorg-006 <5 132754-1 <5 || <5 [NR] [NR]
Bicarbonate Alkalinity as
CaCO3
mg/L 5 Inorg-006 <5 132754-1 18 || 18 || RPD: 0 [NR] [NR]
Carbonate Alkalinity as
CaCO3
mg/L 5 Inorg-006 <5 132754-1 <5 || <5 [NR] [NR]
Total Alkalinity as
CaCO3
mg/L 5 Inorg-006 <5 132754-1 18 || 18 || RPD: 0 LCS-W1 103%
Sulphate, SO4 mg/L 1 Inorg-081 <1 132754-1 6 || 6 || RPD: 0 LCS-W1 99%
Chloride, Cl mg/L 1 Inorg-081 <1 132754-1 230 || 230 || RPD: 0 LCS-W1 97%
Ionic Balance % Inorg-041 [NT] 132754-1 6.0 || [N/T] [NR] [NR]
QUALITY CONTROL UNITS PQL METHOD Blank Duplicate
Sm#
Duplicate results Spike Sm# Spike %
Recovery
Metals in Waters - Total Base ll Duplicate ll %RPD
Date prepared - 17/08/2
015
132754-1 17/08/2015 || 17/08/2015 LCS-W2 17/08/2015
Date analysed - 17/08/2
015
132754-1 17/08/2015 || 17/08/2015 LCS-W2 17/08/2015
Phosphorus - Total mg/L 0.05 Metals-020
ICP-AES
<0.05 132754-1 0.1 || 0.1 || RPD: 0 LCS-W2 106%
QUALITY CONTROL UNITS PQL METHOD Blank Duplicate
Sm#
Duplicate results Spike Sm# Spike %
Recovery
Miscellaneous Inorganics Base ll Duplicate ll %RPD
Date prepared - 14/08/2
015
132754-1 14/08/2015 || 14/08/2015 LCS-W1 14/08/2015
Date analysed - 14/08/2
015
132754-1 14/08/2015 || 14/08/2015 LCS-W1 14/08/2015
pH pH Units Inorg-001 [NT] 132754-1 6.3 || 6.3 || RPD: 0 LCS-W1 101%
Electrical Conductivity µS/cm 1 Inorg-002 <1 132754-1 760 || 760 || RPD: 0 LCS-W1 100%
QUALITY CONTROL UNITS Dup. Sm# Duplicate Spike Sm# Spike % Recovery
Metals in Waters - Total Base + Duplicate + %RPD
Date prepared - [NT] [NT] 132754-2 17/08/2015
Date analysed - [NT] [NT] 132754-2 17/08/2015
Phosphorus - Total mg/L [NT] [NT] 132754-2 108%
Page 6 of 8Envirolab Reference: 132754
Revision No: R 00

Client Reference: Ardmore Park
Report Comments:
Asbestos ID was analysed by Approved Identifier: Not applicable for this job
Asbestos ID was authorised by Approved Signatory: Not applicable for this job
INS: Insufficient sample for this test PQL: Practical Quantitation Limit NT: Not tested
NA: Test not required RPD: Relative Percent Difference NA: Test not required
<: Less than >: Greater than LCS: Laboratory Control Sample
Page 7 of 8Envirolab Reference: 132754
Revision No: R 00

Client Reference: Ardmore Park
Quality Control Definitions
Blank: This is the component of the analytical signal which is not derived from the sample but from reagents,
glassware etc, can be determined by processing solvents and reagents in exactly the same manner as for samples.
Duplicate : This is the complete duplicate analysis of a sample from the process batch. If possible, the sample
selected should be one where the analyte concentration is easily measurable.
Matrix Spike : A portion of the sample is spiked with a known concentration of target analyte. The purpose of the matrix
spike is to monitor the performance of the analytical method used and to determine whether matrix interferences exist.
LCS (Laboratory Control Sample) : This comprises either a standard reference material or a control matrix (such as a blank
sand or water) fortified with analytes representative of the analyte class. It is simply a check sample.
Surrogate Spike: Surrogates are known additions to each sample, blank, matrix spike and LCS in a batch, of compounds
which are similar to the analyte of interest, however are not expected to be found in real samples.
Laboratory Acceptance Criteria
Duplicate sample and matrix spike recoveries may not be reported on smaller jobs, however, were analysed at a frequency
to meet or exceed NEPM requirements. All samples are tested in batches of 20. The duplicate sample RPD and matrix
spike recoveries for the batch were within the laboratory acceptance criteria.
Filters, swabs, wipes, tubes and badges will not have duplicate data as the whole sample is generally extracted
during sample extraction.
Spikes for Physical and Aggregate Tests are not applicable.
For VOCs in water samples, three vials are required for duplicate or spike analysis.
Duplicates: <5xPQL - any RPD is acceptable; >5xPQL - 0-50% RPD is acceptable.
Matrix Spikes, LCS and Surrogate recoveries: Generally 70-130% for inorganics/metals; 60-140%
for organics (+/-50% surrogates) and 10-140% for labile SVOCs (including labile surrogates), ultra trace organics
and speciated phenols is acceptable.
In circumstances where no duplicate and/or sample spike has been reported at 1 in 10 and/or 1 in 20 samples
respectively, the sample volume submitted was insufficient in order to satisfy laboratory QA/QC protocols.
When samples are received where certain analytes are outside of recommended technical holding times (THTs),
the analysis has proceeded. Where analytes are on the verge of breaching THTs, every effort will be made to analyse
within the THT or as soon as practicable.
Page 8 of 8Envirolab Reference: 132754
Revision No: R 00

REP. NO. 15076-B PAGE 3
FIGURES

Scale: As shown
FIGURE 1
Larry Cook Consulting PO Box 8146 Tumbi Umbi NSW 2261 Ph 02 4340 0 193
N 0 km 1
Lot 24 DP1001312 - ‘Ardmore Park’ Location of Property
Property Boundary
‘Ardmore Park’
Groundwater Monitoring
Scale: As shown
FIGURE 2
N 0 km 1
Lot 24 DP1001312 - ‘Ardmore Park’ Location of Hardrock Bores
Property Boundary Property
BHAP10 BHAP6
BHAP5
BHAP7
BHAP1
Production Bore
Groundwater Monitoring Larry Cook Consulting PO Box 8146 Tumbi Umbi NSW 2261 Ph 02 4340 0 193

Lot
24
DP1
0013
12 -
‘Ard
mor
e Pa
rk’
Loca
tions
of S
and
Mon
itorin
g B
ores
N
Sc
ale:
As s
how
n
FIG
UR
E 3
Larr
y C
ook
Con
sulti
ng
PO B
ox 8
146
Tum
bi U
mbi
NSW
226
1 Ph
02
4340
019
3
Air C
ore
Dril
lhol
e
Con
trol A
ir C
ore
Dril
lhol
e APS
38
Exca
vatio
n Pi
t Ai
r Cor
e Sa
nd D
rillh
ole
Gro
undw
ater
Mon
itori
ng
Lim
it of
Exp
osed
to P
artly
Exp
osed
S
outh
ern
Sand
Res
ourc
e B
H1
BH
7 B
H6
BH
5 BH
4
BH
3
APS
38
BH
1
BH
2 ‘dry
’
‘dry
’ ‘d
ry’
‘dry
’ ‘d
ry’
‘dry
’
‘dry
’
‘dry
’
Mon
itorin
g B
ore
Gro
undw
ater
Flo
w
Not
suc
cess
fully
c
ompl
eted

Lot
24
DP1
0013
12 -
‘Ard
mor
e Pa
rk’
Loca
tions
of S
prin
gs
N
Scal
e: A
s sho
wn
FIG
UR
E 4
Gro
undw
ater
Mon
itori
ng
V
V
V
V
V
V
V
B
B
B
Sout
hern
S
and
Res
ourc
e
V
B
Sedi
men
tary
B
asem
ent
Out
crop
V
V
V
V
B
B
Stor
age
Phil’
s Spr
ing
~ 6
20m
AH
D
~ 62
4m A
HD
~ 61
9m A
HD
~ 6
24m
AH
D
~ 6
24m
AH
D
V
B
Sprin
g / D
irect
ion
of F
low
B
asal
t B
asem
ent R
ocks
In
terp
rete
d G
roun
dwat
er F
low
Su
rfac
e Fl
ow
0 50
0 m
App
roxi
mat
e B
ound
ary
of
Prop
erty
Sout
hern
Spr
ing
~ 6
15m
AH
D
Inte
rpre
ted
Edg
e o
f Bas
alt
Larr
y C
ook
Con
sulti
ng
PO B
ox 8
146
Tum
bi U
mbi
NSW
226
1 Ph
02
4340
0 1
93