Embed Size (px)
Citation preview
Submitted 5 July 2013Accepted 10 November 2015Published 7 December 2015
Corresponding authorMark S. Lambert,[email protected]
Academic editorNigel Yoccoz
Additional Information andDeclarations can be found onpage 16
DOI 10.7717/peerj.1458
Copyright2015 Haniza et al.
Distributed underOpen Government License
OPEN ACCESS
Large-scale structure of brown rat(Rattus norvegicus) populations inEngland: effects on rodenticide resistanceMohd Z.H. Haniza1, Sally Adams2, Eleanor P. Jones3, Alan MacNicoll4,Eamonn B. Mallon5, Robert H. Smith6 and Mark S. Lambert4
1 Faculty of Science and Mathematics, Universiti Pendidikan Sultan Idris, Tanjung Malim Perak,Malaysia
2 School of Life Sciences, University of Warwick, Coventry, United Kingdom3 Fera Science Ltd., York, United Kingdom4 Animal and Plant Health Agency, York, United Kingdom5 Department of Genetics, University of Leicester, Leicester, United Kingdom6 School of Applied Sciences, University of Huddersfield, Huddersfield, United Kingdom
ABSTRACTThe brown rat (Rattus norvegicus) is a relatively recent (<300 years) addition tothe British fauna, but by association with negative impacts on public health, animalhealth and agriculture, it is regarded as one of the most important vertebratepest species. Anticoagulant rodenticides were introduced for brown rat controlin the 1950s and are widely used for rat control in the UK, but long-standingresistance has been linked to control failures in some regions. One thus farignored aspect of resistance biology is the population structure of the brown rat.This paper investigates the role population structure has on the development ofanticoagulant resistance. Using mitochondrial and microsatellite DNA, we examined186 individuals (from 15 counties in England and one location in Wales near theWales–England border) to investigate the population structure of rural brown ratpopulations. We also examined individual rats for variations of the VKORC1 genepreviously associated with resistance to anticoagulant rodenticides. We show that thepopulations were structured to some degree, but that this was only apparent in themicrosatellite data and not the mtDNA data. We discuss various reasons why this isthe case. We show that the population as a whole appears not to be at equilibrium.The relative lack of diversity in the mtDNA sequences examined can be explainedby founder effects and a subsequent spatial expansion of a species introduced to theUK relatively recently. We found there was a geographical distribution of resistancemutations, and relatively low rate of gene flow between populations, which hasimplications for the development and management of anticoagulant resistance.
Subjects Biodiversity, Biogeography, Conservation Biology, Ecology, Environmental SciencesKeywords VKORC1, Bottleneck, Selection, Anticoagulants
INTRODUCTIONThe brown rat (Rattus norvegicus) first arrived in Britain in the early 18th century,
originally from the steppes of Central Asia (Yalden, 1990), and is regarded as one of the
most important vertebrate pest species in the UK (Buckle & Smith, 2015). Brown rats
How to cite this article Haniza et al. (2015), Large-scale structure of brown rat (Rattus norvegicus) populations in England: effects onrodenticide resistance. PeerJ 3:e1458; DOI 10.7717/peerj.1458
are associated with risks to public health, animal health, and impacts on agriculture,
infrastructure and native wildlife (Meehan, 1984; Webster, Ellis & MacDonald, 1995).
Anticoagulant rodenticides have been widely used for controlling rat populations in the
UK since the introduction of warfarin in the 1950s (Hayes, 1950). However, resistance
to warfarin was encountered by 1960 (Boyle, 1960), and it is thought that chance
genetic mutations arise that confer heritable resistance to anticoagulant compounds;
intensive use of anticoagulants applies a selection pressure that increases the frequency
of resistant rats within a population (Greaves, 1995; Greaves & Ayres, 1967; Smith &
Greaves, 1987). In response to the emergence of warfarin resistance, ‘second-generation’
anticoagulant rodenticides, including bromadiolone and difenacoum, were developed that
controlled warfarin-resistant rats (Hadler & Shadbolt, 1975; Hadler, Redfern & Rowe, 1975),
although some rat populations have now evolved resistance to some of these more toxic
anticoagulants (Lund, 1985; Redfern & Gill, 1978).
Warfarin acts by interfering with blood coagulation (blood clotting). Several factors
in the coagulation process are dependent on sufficient vitamin K levels for their proper
functioning (Suttie, 1980). Vitamin K hydroquinone is an essential cofactor for post-
translational gamma-carboxylation of these blood coagulation factors (Sadowski, Esmon
& Suttie, 1976). During each carboxylation step, one molecule of vitamin K hydroquinone
is oxidized to vitamin K 2,3 epoxide. The recycling of this micronutrient is carried out
by the vitamin K epoxide reductase (VKOR) complex. Suppression of the VKOR by
anticoagulants inhibits the carboxylation of clotting factors and thus compromises the
coagulation process (Bell & Caldwell, 1973). Early studies showed that warfarin resistance
was inherited in rats as a single autosomal dominant gene (Rw) (Greaves & Ayres, 1967).
More recently it has been demonstrated that mutations or variations (Single Nucleotide
Polymorphisms) in a gene of the VKOR complex, VKORC1, are involved in the resistance
to anticoagulants in rats (Pelz et al., 2005; Rost et al., 2004). These variations, which
result in amino acid substitutions in the protein VKORC1, may decrease the sensitivity
of the protein to warfarin, maintaining the efficiency of the coagulation process in
warfarin-exposed resistant rats (Pelz et al., 2005).
It has been suggested that rodenticide resistance spread in European rat populations
from initial focal points, with resistant rats expanding into new areas (Pelz et al., 2005).
Earlier work noted that resistance spread at about 5 km per year (Brodie, 1976; Drummond,
1970). However, warfarin resistance, though widespread, is not ubiquitous. One possible
explanation for this pattern is that gene flow between different rat populations is limited.
The rate at which resistance is acquired is a function of the resistance allele’s frequency,
its dominance, the relative fitness of being resistant and, often overlooked, the pest
organism’s population structure (Roush & McKenzie, 1987). Population structure, the
subdivision of populations into smaller interbreeding units, is important as it controls
gene flow from area to area. Gene flow has two effects on the spread of resistance. Firstly,
the greater the gene flow between areas, the more likely resistance genes are to spread.
Secondly, if resistance genes spread into areas where pesticides are not used, resistance
genes may be diluted by susceptible individuals (Wool & Noiman, 1983). In this study, we
Haniza et al. (2015), PeerJ, DOI 10.7717/peerj.1458 2/20

Figure 1 Geographical distribution of samples. Current (ceremonial) counties shown for England(shaded), Wales and Scotland; place markers denote county centroids rather than exact origin of samples.Contains Ordnance Survey data (©) Crown Copyright 2015.
used microsatellites, which are informative of population level structures and gene-flow
between populations (e.g., Balloux & Lugon-Moulin, 2002; Hutchison & Templeton, 1999),
and mitochondrial DNA sequences, which can provide information about older events in
the colonisation history of the rats in the UK, as has been done for example, for house mice
(Searle et al., 2009).
We examined 186 rural brown rat DNA samples (184 from England and two from a
location in Wales near to the Wales–England border) in order to investigate population
structure through mitochondrial DNA (mtDNA) and microsatellite analysis. We also
examined the distribution of VKORC1 variants within the sampled populations. The
samples were collected opportunistically and hence sampling was not geographically
stratified, nor was regional coverage comprehensive; however, the results reveal novel
insights into the structure of rural brown rat populations that have important implications
for the development and management of anticoagulant resistance.
MATERIALS AND METHODSSample detailsWe analysed 184 rats from 15 counties in England; we also included two rats collected
from Welshpool, Powys, 6 km from the Wales–England border (Fig. 1). The majority of
the samples came from an extensive trapping program carried out by the Animal and Plant
Health Agency’s (APHA) National Wildlife Management Centre (then part of the Central
Science Laboratory), York from 1990–2000. These samples were obtained as livers stored
at −20 ◦C. Rats were also trapped on several farms in Leicestershire and Yorkshire during
Haniza et al. (2015), PeerJ, DOI 10.7717/peerj.1458 3/20
2004 and 2005 and stored at −20 ◦C. In addition, samples from Cambridge were obtained
from rats trapped in 2004 as extracted DNA from the Babraham Institute, Cambridge.
All research that involved the use of live animals was approved in advance by written
confirmation from the APHA’s Animal Welfare and Ethical Review Body (AWERB) or
equivalent at the time of the study. Our AWERB membership has both internal and
external members including lay representatives and experts in a variety of apposite areas
such as veterinary surgery, statistics and animal welfare.
DNA extractionTotal genomic DNA was extracted from either 20 µg of liver or a 15 mm tail tip using
the Wizard SV Genomic DNA Purification System (Promega, Madison, WI, USA) as per
instructions. DNA samples were stored at −20 ◦C until use.
Mitochondrial DNA (mtDNA)For each individual, a 425 base pair region of the hypervariable region 1 (HVR1)
segment within the mtDNA control region was PCR amplified. PCR was carried out
as per Hingston et al. (2005) with slight modifications. Primers used were L283 (5′-
TACACTGGTCTTGTAAACC-3′) and H16498 (5′-CCTGAAGTAGGAACCAGATG-3′).
A 20 µl reaction was used in which 2 µl genomic DNA was added to the reaction mixtures
containing 10 µl PCR reaction mix (YorkBio, York, UK), 1 µl (10 uM) of each primer
and 6 µl of H2O. PCR was carried out on a T1 Thermocycler (Biometra, Goettingen,
Germany). The PCR conditions were: 30 cycles of denaturation at 94 ◦C for 45 s, annealing
at 50 ◦C for 45 s, elongation at 72 ◦C for one min, and a final extension at 72 ◦C for 30 min.
PCR products were then cleaned with the YorkBio PCR Cleanup kit to remove any
unincorporated nucleotides and primers that can interfere with the sequencing process.
The cleaned PCR products were sequenced by the John Innes Genome laboratory using an
ABI3700 capillary sequencer.
Microsatellite DNAWe used six microsatellite loci from the literature, that are highly variable for brown rats
(D3, D5, D8, D12, D16, D17) (Heiberg, 2002). The PCR volume was 10 ul, containing 5 ul
of PCR reaction mix (YorkBio), 0.5 ul of DNA, 0.5 ul of each primer and 3.5 ul of ddH2O.
One primer of each locus was labelled with one of the fluorescent dyes, PET, 6FAM or VIC.
PCR was run on a T1 Thermocycler (Biometra, Goettingen, Germany) using the following
conditions: one cycle of denaturation at 94 ◦C for five mins, 35 cycles of denaturation
(94 ◦C for 30 s), annealing (50 ◦C for 30 s) and elongation (72 ◦C for 30 s). Finally, there
was one cycle of extension at 72 ◦C for 30 s. PCR products were run as two batches on an
ABI 3730 capillary sequencer (Applied Biosystems, Foster City, CA, USA). The results were
scored using GeneMapper v0.5.0 (Applied Biosystems, Foster City, CA, USA).
VKOR analysisPelz et al. (2005) identified seven different VKORC1 variants in warfarin resistant Norway
rats; four of these (Tyr139Cys, Leu120Gln, Leu128Gln and Tyr139Ser) were reported from
Haniza et al. (2015), PeerJ, DOI 10.7717/peerj.1458 4/20
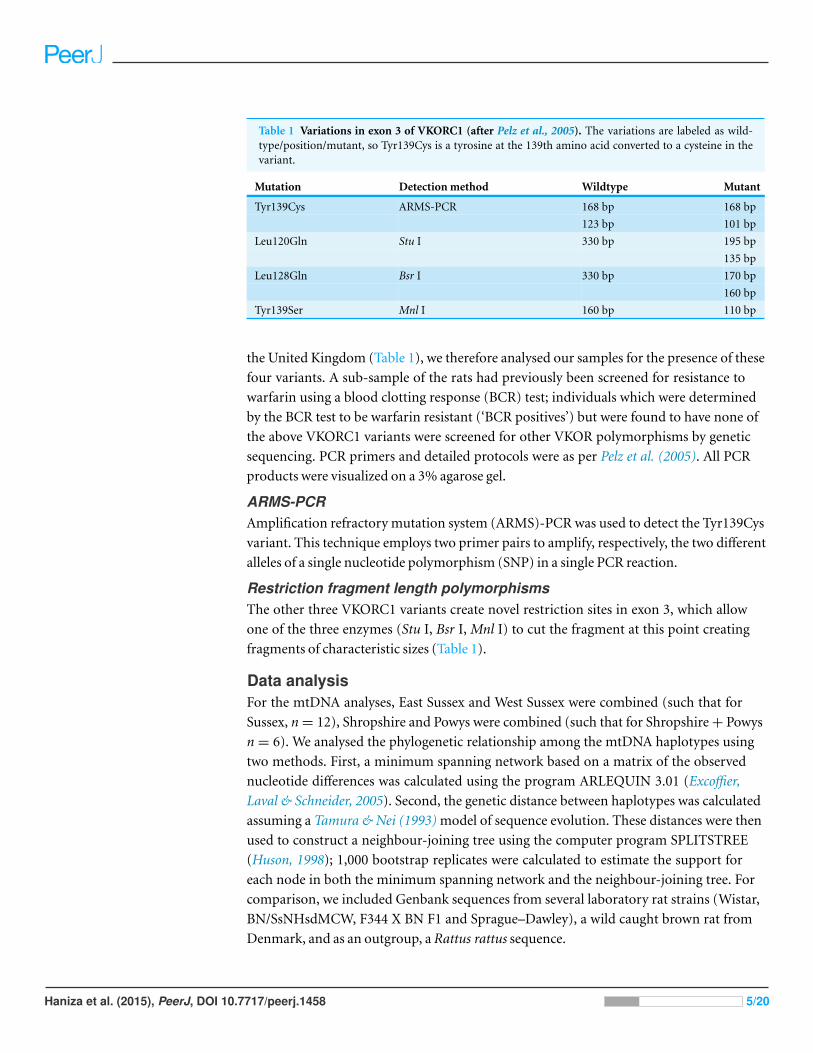
Table 1 Variations in exon 3 of VKORC1 (after Pelz et al., 2005). The variations are labeled as wild-type/position/mutant, so Tyr139Cys is a tyrosine at the 139th amino acid converted to a cysteine in thevariant.
Mutation Detection method Wildtype Mutant
Tyr139Cys ARMS-PCR 168 bp 168 bp
123 bp 101 bp
Leu120Gln Stu I 330 bp 195 bp
135 bp
Leu128Gln Bsr I 330 bp 170 bp
160 bp
Tyr139Ser Mnl I 160 bp 110 bp
the United Kingdom (Table 1), we therefore analysed our samples for the presence of these
four variants. A sub-sample of the rats had previously been screened for resistance to
warfarin using a blood clotting response (BCR) test; individuals which were determined
by the BCR test to be warfarin resistant (‘BCR positives’) but were found to have none of
the above VKORC1 variants were screened for other VKOR polymorphisms by genetic
sequencing. PCR primers and detailed protocols were as per Pelz et al. (2005). All PCR
products were visualized on a 3% agarose gel.
ARMS-PCRAmplification refractory mutation system (ARMS)-PCR was used to detect the Tyr139Cys
variant. This technique employs two primer pairs to amplify, respectively, the two different
alleles of a single nucleotide polymorphism (SNP) in a single PCR reaction.
Restriction fragment length polymorphismsThe other three VKORC1 variants create novel restriction sites in exon 3, which allow
one of the three enzymes (Stu I, Bsr I, Mnl I) to cut the fragment at this point creating
fragments of characteristic sizes (Table 1).
Data analysisFor the mtDNA analyses, East Sussex and West Sussex were combined (such that for
Sussex, n = 12), Shropshire and Powys were combined (such that for Shropshire + Powys
n = 6). We analysed the phylogenetic relationship among the mtDNA haplotypes using
two methods. First, a minimum spanning network based on a matrix of the observed
nucleotide differences was calculated using the program ARLEQUIN 3.01 (Excoffier,
Laval & Schneider, 2005). Second, the genetic distance between haplotypes was calculated
assuming a Tamura & Nei (1993) model of sequence evolution. These distances were then
used to construct a neighbour-joining tree using the computer program SPLITSTREE
(Huson, 1998); 1,000 bootstrap replicates were calculated to estimate the support for
each node in both the minimum spanning network and the neighbour-joining tree. For
comparison, we included Genbank sequences from several laboratory rat strains (Wistar,
BN/SsNHsdMCW, F344 X BN F1 and Sprague–Dawley), a wild caught brown rat from
Denmark, and as an outgroup, a Rattus rattus sequence.
Haniza et al. (2015), PeerJ, DOI 10.7717/peerj.1458 5/20
The geographic distribution of genetic variation was estimated using Analysis of
Molecular Variance (AMOVA) performed by ARLEQUIN 3.01. Gene diversity (h) and
nucleotide diversity (π) of the various populations and their respective standard deviations
were calculated using ARLEQUIN 3.01. ARLEQUIN 3.01 was also used to perform
mismatch analysis to compare the distribution of the observed number of differences
between pairs of haplotypes (mtDNA) and the expected distribution under various models
of population change (Rogers & Harpending, 1992).
Geographical distances were calculated as the distance from the central national grid
reference of one population area to the central national grid reference of the other. This
distance was compared with Φst, an analogue of Wright’s Fst statistic (Wright, 1951), using
a Mantel test carried out with the computer program GenAlEx 6 (Peakall & Smouse, 2006).
Observed and expected heterozygosities were calculated for the microsatellite data in
ARLEQUIN 3.01.
For the microsatellite analyses, East Sussex and West Sussex were combined (such
that for Sussex, n = 12), Powys and Shropshire were combined (n = 6); samples from
Greater London (n = 3) and Gloucestershire (n = 3) were not included (because of the
small sample sizes). Using microsatellite data, inferences on the number of populations
were made with the fully Bayesian clustering method implemented in STRUCTURE
2.1 (Pritchard, Stephens & Donnelly, 2000). With the aim of determining the most likely
number K of population units, the program was run ten times for K = 2 to K = 10. The
model with admixture has been used with correlated frequencies. After some preliminary
tests of the convergence time needed for the Monte–Carlo Markov chain, a burn-in period
of 100,000 steps followed by 1,000,000 steps was used. The most likely value of K was
considered using the maximum log likelihood values for the aggregated runs, and by
considering Delta K, the rate of change in the log-likelihood values between the values of
K (Evanno, Regnaut & Goudet, 2005), calculated in Structure Harvester (Earl & vonHoldt,
2012). Structure plots were created for K = 3–5 using the programs CLUMPP (Jakobsson
& Rosenberg, 2007) and DISTRUCT (Rosenberg, 2004), which aggregate and plot out the
multiple runs for each value of K into single outputs.
RESULTSMolecular diversityA total of six unique mtDNA haplotypes were represented in the individuals sampled. The
nucleotide differences between haplotypes are shown in Table 2. Sequences representing
each unique mtDNA haplotype have been deposited in Genbank under accession
numbers DQ897633–DQ897638. There are 10 variable nucleotide positions all of
which are transitions (Table 2), forming two haplogroups. These are RNH1, the most
common haplotype, and RNH6, which diverges from it by a single mutation, RNH2,
the second most common haplotype, and RNH5 and RNH3, which diverge from it by
single mutations with a further haplotype RNH3, two mutations from RNH5 (Figs. 2A
and 2B). Figure 2B also includes several other sequences obtained from Genbank for this
region of the R. norvegicus mitochondrial genome. These include sequences from several
Haniza et al. (2015), PeerJ, DOI 10.7717/peerj.1458 6/20
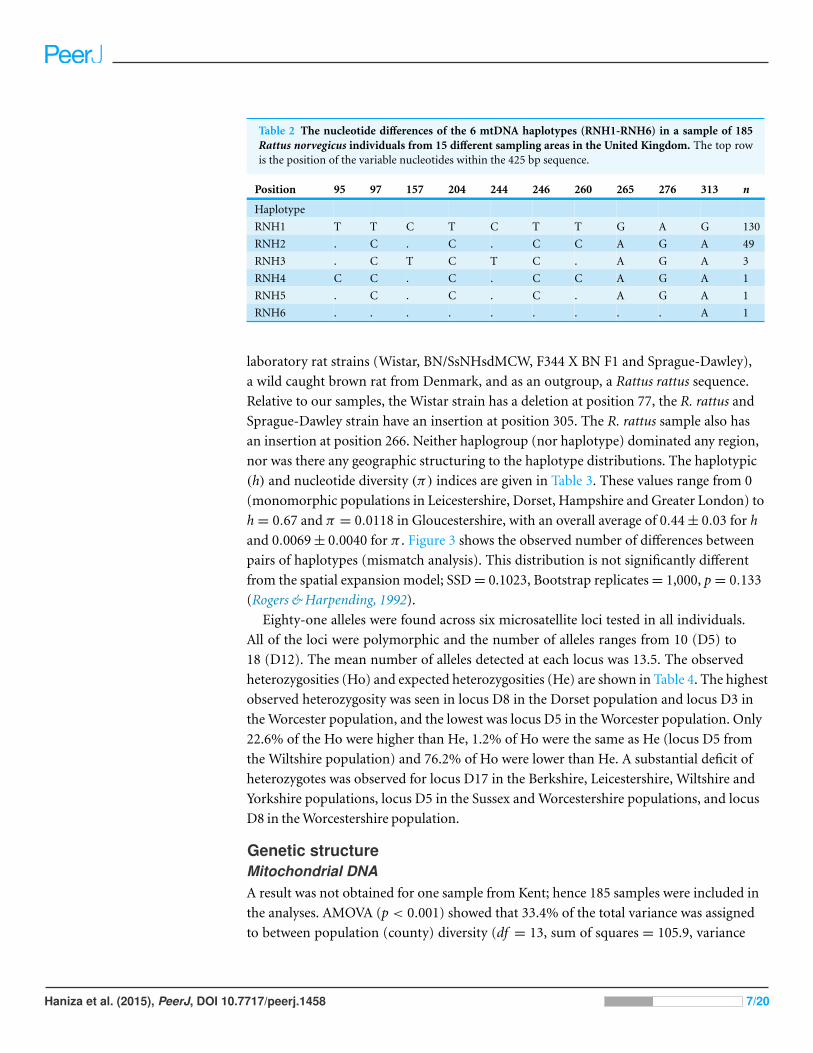
Table 2 The nucleotide differences of the 6 mtDNA haplotypes (RNH1-RNH6) in a sample of 185Rattus norvegicus individuals from 15 different sampling areas in the United Kingdom. The top rowis the position of the variable nucleotides within the 425 bp sequence.
Position 95 97 157 204 244 246 260 265 276 313 n
Haplotype
RNH1 T T C T C T T G A G 130
RNH2 . C . C . C C A G A 49
RNH3 . C T C T C . A G A 3
RNH4 C C . C . C C A G A 1
RNH5 . C . C . C . A G A 1
RNH6 . . . . . . . . . A 1
laboratory rat strains (Wistar, BN/SsNHsdMCW, F344 X BN F1 and Sprague-Dawley),
a wild caught brown rat from Denmark, and as an outgroup, a Rattus rattus sequence.
Relative to our samples, the Wistar strain has a deletion at position 77, the R. rattus and
Sprague-Dawley strain have an insertion at position 305. The R. rattus sample also has
an insertion at position 266. Neither haplogroup (nor haplotype) dominated any region,
nor was there any geographic structuring to the haplotype distributions. The haplotypic
(h) and nucleotide diversity (π) indices are given in Table 3. These values range from 0
(monomorphic populations in Leicestershire, Dorset, Hampshire and Greater London) to
h = 0.67 and π = 0.0118 in Gloucestershire, with an overall average of 0.44 ± 0.03 for h
and 0.0069 ± 0.0040 for π . Figure 3 shows the observed number of differences between
pairs of haplotypes (mismatch analysis). This distribution is not significantly different
from the spatial expansion model; SSD = 0.1023, Bootstrap replicates = 1,000, p = 0.133
(Rogers & Harpending, 1992).
Eighty-one alleles were found across six microsatellite loci tested in all individuals.
All of the loci were polymorphic and the number of alleles ranges from 10 (D5) to
18 (D12). The mean number of alleles detected at each locus was 13.5. The observed
heterozygosities (Ho) and expected heterozygosities (He) are shown in Table 4. The highest
observed heterozygosity was seen in locus D8 in the Dorset population and locus D3 in
the Worcester population, and the lowest was locus D5 in the Worcester population. Only
22.6% of the Ho were higher than He, 1.2% of Ho were the same as He (locus D5 from
the Wiltshire population) and 76.2% of Ho were lower than He. A substantial deficit of
heterozygotes was observed for locus D17 in the Berkshire, Leicestershire, Wiltshire and
Yorkshire populations, locus D5 in the Sussex and Worcestershire populations, and locus
D8 in the Worcestershire population.
Genetic structureMitochondrial DNAA result was not obtained for one sample from Kent; hence 185 samples were included in
the analyses. AMOVA (p < 0.001) showed that 33.4% of the total variance was assigned
to between population (county) diversity (df = 13, sum of squares = 105.9, variance
Haniza et al. (2015), PeerJ, DOI 10.7717/peerj.1458 7/20
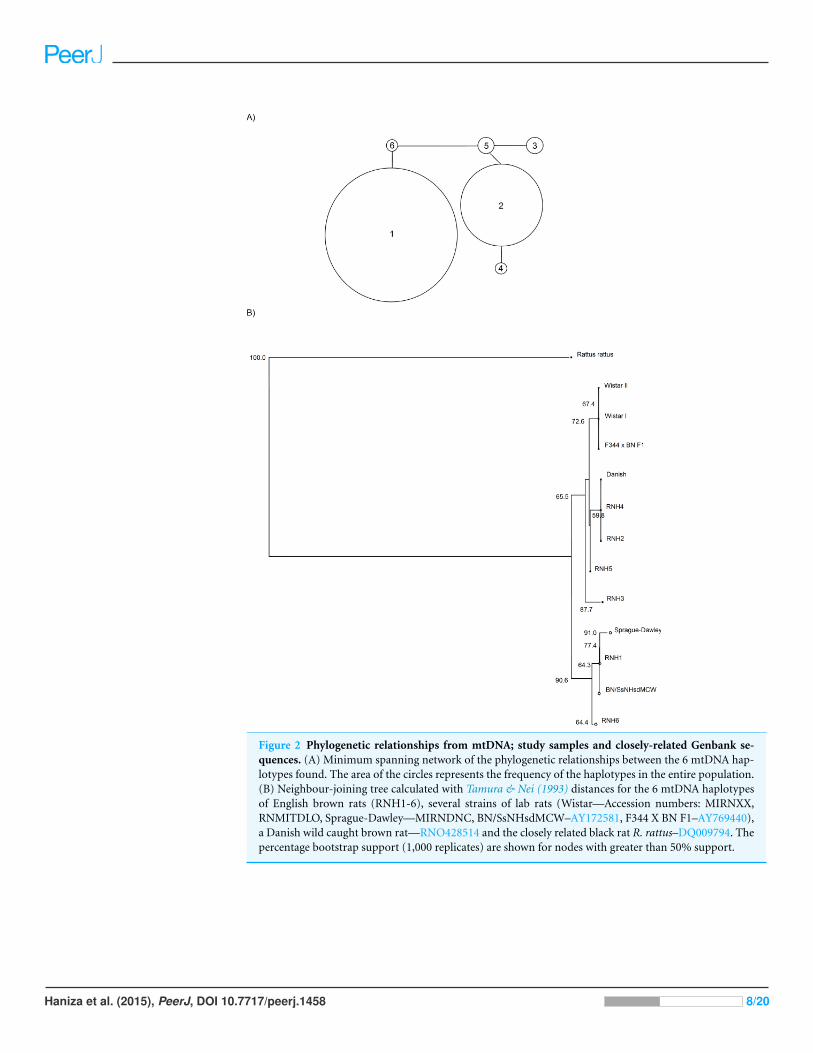
Figure 2 Phylogenetic relationships from mtDNA; study samples and closely-related Genbank se-quences. (A) Minimum spanning network of the phylogenetic relationships between the 6 mtDNA hap-lotypes found. The area of the circles represents the frequency of the haplotypes in the entire population.(B) Neighbour-joining tree calculated with Tamura & Nei (1993) distances for the 6 mtDNA haplotypesof English brown rats (RNH1-6), several strains of lab rats (Wistar—Accession numbers: MIRNXX,RNMITDLO, Sprague-Dawley—MIRNDNC, BN/SsNHsdMCW–AY172581, F344 X BN F1–AY769440),a Danish wild caught brown rat—RNO428514 and the closely related black rat R. rattus–DQ009794. Thepercentage bootstrap support (1,000 replicates) are shown for nodes with greater than 50% support.
Haniza et al. (2015), PeerJ, DOI 10.7717/peerj.1458 8/20
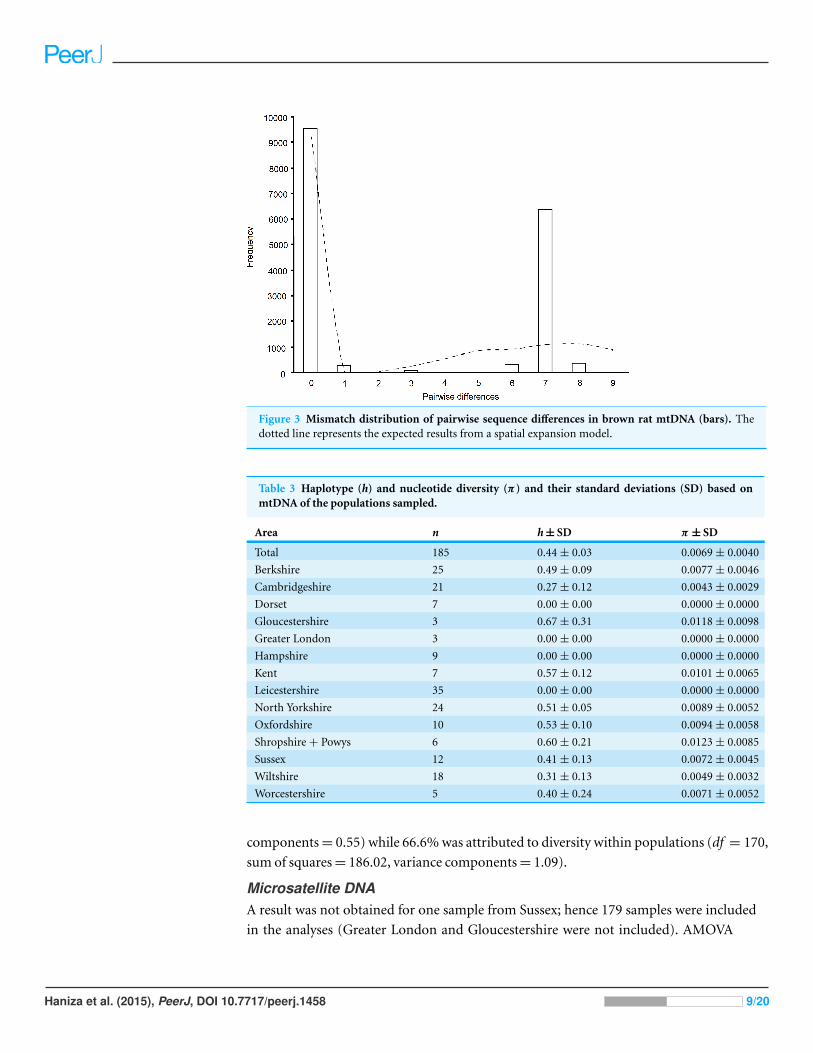
Figure 3 Mismatch distribution of pairwise sequence differences in brown rat mtDNA (bars). Thedotted line represents the expected results from a spatial expansion model.
Table 3 Haplotype (h) and nucleotide diversity (π) and their standard deviations (SD) based onmtDNA of the populations sampled.
Area n h ± SD π ± SD
Total 185 0.44 ± 0.03 0.0069 ± 0.0040
Berkshire 25 0.49 ± 0.09 0.0077 ± 0.0046
Cambridgeshire 21 0.27 ± 0.12 0.0043 ± 0.0029
Dorset 7 0.00 ± 0.00 0.0000 ± 0.0000
Gloucestershire 3 0.67 ± 0.31 0.0118 ± 0.0098
Greater London 3 0.00 ± 0.00 0.0000 ± 0.0000
Hampshire 9 0.00 ± 0.00 0.0000 ± 0.0000
Kent 7 0.57 ± 0.12 0.0101 ± 0.0065
Leicestershire 35 0.00 ± 0.00 0.0000 ± 0.0000
North Yorkshire 24 0.51 ± 0.05 0.0089 ± 0.0052
Oxfordshire 10 0.53 ± 0.10 0.0094 ± 0.0058
Shropshire + Powys 6 0.60 ± 0.21 0.0123 ± 0.0085
Sussex 12 0.41 ± 0.13 0.0072 ± 0.0045
Wiltshire 18 0.31 ± 0.13 0.0049 ± 0.0032
Worcestershire 5 0.40 ± 0.24 0.0071 ± 0.0052
components = 0.55) while 66.6% was attributed to diversity within populations (df = 170,
sum of squares = 186.02, variance components = 1.09).
Microsatellite DNAA result was not obtained for one sample from Sussex; hence 179 samples were included
in the analyses (Greater London and Gloucestershire were not included). AMOVA
Haniza et al. (2015), PeerJ, DOI 10.7717/peerj.1458 9/20
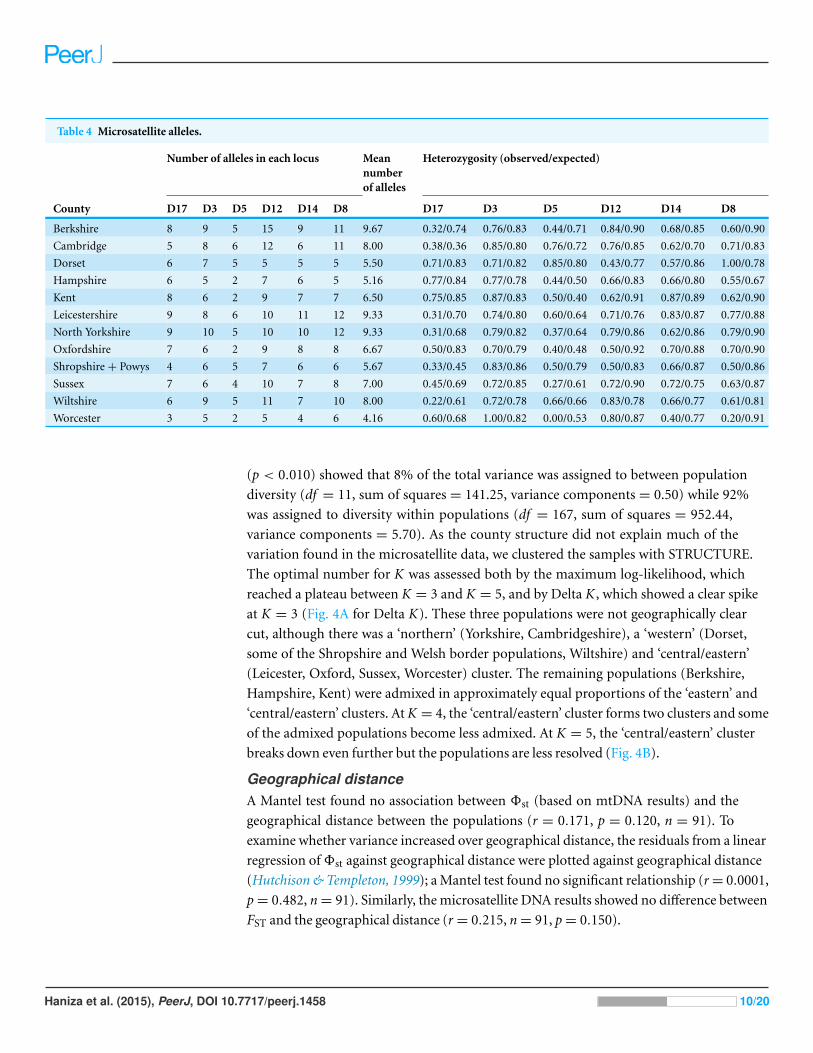
Table 4 Microsatellite alleles.
Number of alleles in each locus Meannumberof alleles
Heterozygosity (observed/expected)
County D17 D3 D5 D12 D14 D8 D17 D3 D5 D12 D14 D8
Berkshire 8 9 5 15 9 11 9.67 0.32/0.74 0.76/0.83 0.44/0.71 0.84/0.90 0.68/0.85 0.60/0.90
Cambridge 5 8 6 12 6 11 8.00 0.38/0.36 0.85/0.80 0.76/0.72 0.76/0.85 0.62/0.70 0.71/0.83
Dorset 6 7 5 5 5 5 5.50 0.71/0.83 0.71/0.82 0.85/0.80 0.43/0.77 0.57/0.86 1.00/0.78
Hampshire 6 5 2 7 6 5 5.16 0.77/0.84 0.77/0.78 0.44/0.50 0.66/0.83 0.66/0.80 0.55/0.67
Kent 8 6 2 9 7 7 6.50 0.75/0.85 0.87/0.83 0.50/0.40 0.62/0.91 0.87/0.89 0.62/0.90
Leicestershire 9 8 6 10 11 12 9.33 0.31/0.70 0.74/0.80 0.60/0.64 0.71/0.76 0.83/0.87 0.77/0.88
North Yorkshire 9 10 5 10 10 12 9.33 0.31/0.68 0.79/0.82 0.37/0.64 0.79/0.86 0.62/0.86 0.79/0.90
Oxfordshire 7 6 2 9 8 8 6.67 0.50/0.83 0.70/0.79 0.40/0.48 0.50/0.92 0.70/0.88 0.70/0.90
Shropshire + Powys 4 6 5 7 6 6 5.67 0.33/0.45 0.83/0.86 0.50/0.79 0.50/0.83 0.66/0.87 0.50/0.86
Sussex 7 6 4 10 7 8 7.00 0.45/0.69 0.72/0.85 0.27/0.61 0.72/0.90 0.72/0.75 0.63/0.87
Wiltshire 6 9 5 11 7 10 8.00 0.22/0.61 0.72/0.78 0.66/0.66 0.83/0.78 0.66/0.77 0.61/0.81
Worcester 3 5 2 5 4 6 4.16 0.60/0.68 1.00/0.82 0.00/0.53 0.80/0.87 0.40/0.77 0.20/0.91
(p < 0.010) showed that 8% of the total variance was assigned to between population
diversity (df = 11, sum of squares = 141.25, variance components = 0.50) while 92%
was assigned to diversity within populations (df = 167, sum of squares = 952.44,
variance components = 5.70). As the county structure did not explain much of the
variation found in the microsatellite data, we clustered the samples with STRUCTURE.
The optimal number for K was assessed both by the maximum log-likelihood, which
reached a plateau between K = 3 and K = 5, and by Delta K, which showed a clear spike
at K = 3 (Fig. 4A for Delta K). These three populations were not geographically clear
cut, although there was a ‘northern’ (Yorkshire, Cambridgeshire), a ‘western’ (Dorset,
some of the Shropshire and Welsh border populations, Wiltshire) and ‘central/eastern’
(Leicester, Oxford, Sussex, Worcester) cluster. The remaining populations (Berkshire,
Hampshire, Kent) were admixed in approximately equal proportions of the ‘eastern’ and
‘central/eastern’ clusters. At K = 4, the ‘central/eastern’ cluster forms two clusters and some
of the admixed populations become less admixed. At K = 5, the ‘central/eastern’ cluster
breaks down even further but the populations are less resolved (Fig. 4B).
Geographical distanceA Mantel test found no association between Φst (based on mtDNA results) and the
geographical distance between the populations (r = 0.171, p = 0.120, n = 91). To
examine whether variance increased over geographical distance, the residuals from a linear
regression of Φst against geographical distance were plotted against geographical distance
(Hutchison & Templeton, 1999); a Mantel test found no significant relationship (r = 0.0001,
p = 0.482, n = 91). Similarly, the microsatellite DNA results showed no difference between
FST and the geographical distance (r = 0.215, n = 91, p = 0.150).
Haniza et al. (2015), PeerJ, DOI 10.7717/peerj.1458 10/20
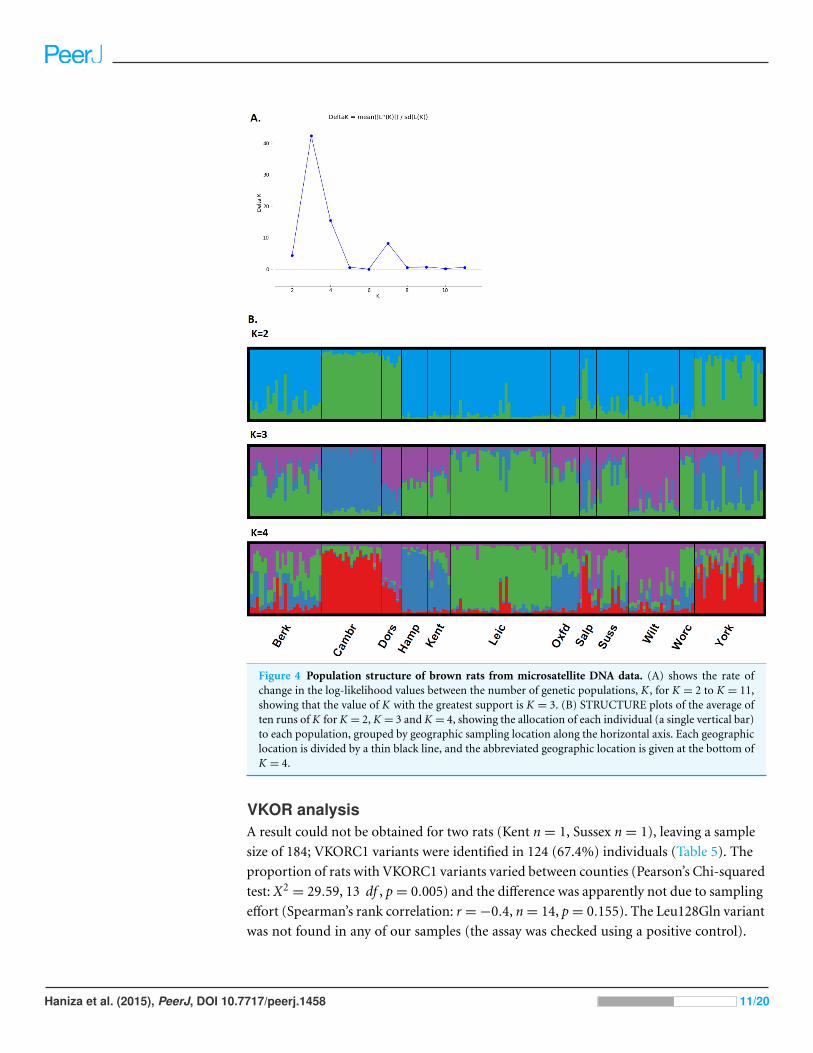
Figure 4 Population structure of brown rats from microsatellite DNA data. (A) shows the rate ofchange in the log-likelihood values between the number of genetic populations, K, for K = 2 to K = 11,showing that the value of K with the greatest support is K = 3. (B) STRUCTURE plots of the average often runs of K for K = 2, K = 3 and K = 4, showing the allocation of each individual (a single vertical bar)to each population, grouped by geographic sampling location along the horizontal axis. Each geographiclocation is divided by a thin black line, and the abbreviated geographic location is given at the bottom ofK = 4.
VKOR analysisA result could not be obtained for two rats (Kent n = 1, Sussex n = 1), leaving a sample
size of 184; VKORC1 variants were identified in 124 (67.4%) individuals (Table 5). The
proportion of rats with VKORC1 variants varied between counties (Pearson’s Chi-squared
test: X2= 29.59, 13 df , p = 0.005) and the difference was apparently not due to sampling
effort (Spearman’s rank correlation: r = −0.4, n = 14, p = 0.155). The Leu128Gln variant
was not found in any of our samples (the assay was checked using a positive control).
Haniza et al. (2015), PeerJ, DOI 10.7717/peerj.1458 11/20
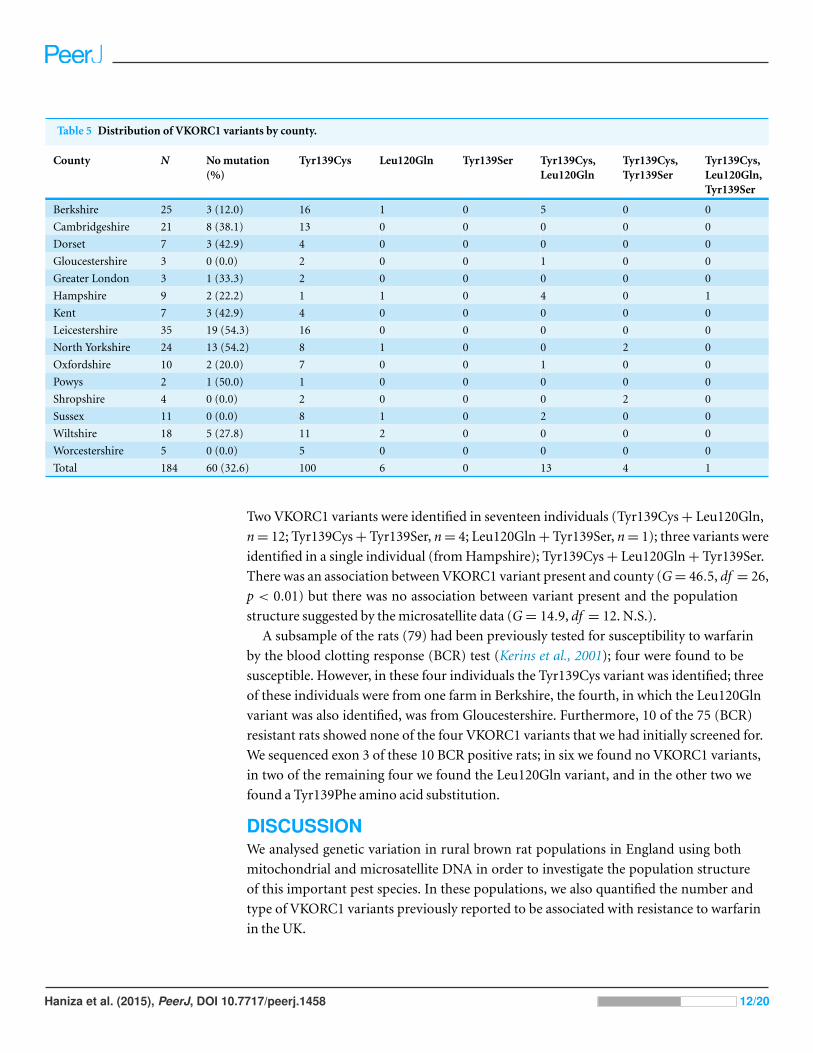
Table 5 Distribution of VKORC1 variants by county.
County N No mutation(%)
Tyr139Cys Leu120Gln Tyr139Ser Tyr139Cys,Leu120Gln
Tyr139Cys,Tyr139Ser
Tyr139Cys,Leu120Gln,Tyr139Ser
Berkshire 25 3 (12.0) 16 1 0 5 0 0
Cambridgeshire 21 8 (38.1) 13 0 0 0 0 0
Dorset 7 3 (42.9) 4 0 0 0 0 0
Gloucestershire 3 0 (0.0) 2 0 0 1 0 0
Greater London 3 1 (33.3) 2 0 0 0 0 0
Hampshire 9 2 (22.2) 1 1 0 4 0 1
Kent 7 3 (42.9) 4 0 0 0 0 0
Leicestershire 35 19 (54.3) 16 0 0 0 0 0
North Yorkshire 24 13 (54.2) 8 1 0 0 2 0
Oxfordshire 10 2 (20.0) 7 0 0 1 0 0
Powys 2 1 (50.0) 1 0 0 0 0 0
Shropshire 4 0 (0.0) 2 0 0 0 2 0
Sussex 11 0 (0.0) 8 1 0 2 0 0
Wiltshire 18 5 (27.8) 11 2 0 0 0 0
Worcestershire 5 0 (0.0) 5 0 0 0 0 0
Total 184 60 (32.6) 100 6 0 13 4 1
Two VKORC1 variants were identified in seventeen individuals (Tyr139Cys + Leu120Gln,
n = 12; Tyr139Cys + Tyr139Ser, n = 4; Leu120Gln + Tyr139Ser, n = 1); three variants were
identified in a single individual (from Hampshire); Tyr139Cys + Leu120Gln + Tyr139Ser.
There was an association between VKORC1 variant present and county (G = 46.5, df = 26,
p < 0.01) but there was no association between variant present and the population
structure suggested by the microsatellite data (G = 14.9, df = 12. N.S.).
A subsample of the rats (79) had been previously tested for susceptibility to warfarin
by the blood clotting response (BCR) test (Kerins et al., 2001); four were found to be
susceptible. However, in these four individuals the Tyr139Cys variant was identified; three
of these individuals were from one farm in Berkshire, the fourth, in which the Leu120Gln
variant was also identified, was from Gloucestershire. Furthermore, 10 of the 75 (BCR)
resistant rats showed none of the four VKORC1 variants that we had initially screened for.
We sequenced exon 3 of these 10 BCR positive rats; in six we found no VKORC1 variants,
in two of the remaining four we found the Leu120Gln variant, and in the other two we
found a Tyr139Phe amino acid substitution.
DISCUSSIONWe analysed genetic variation in rural brown rat populations in England using both
mitochondrial and microsatellite DNA in order to investigate the population structure
of this important pest species. In these populations, we also quantified the number and
type of VKORC1 variants previously reported to be associated with resistance to warfarin
in the UK.
Haniza et al. (2015), PeerJ, DOI 10.7717/peerj.1458 12/20
For the mtDNA data, we found two haplogroups, RNH1 and RNH6, and RNH2,
RNH4, RNH5 and RNH3. The divergence between these two haplogroups was quite high
(six mutational positions) relative to the within group divergence (one-two mutational
positions), suggesting that these two clusters represent distinct founding haplotypes rather
than in situ divergence. There is no geographic structuring to the distribution of these
haplogroups, suggesting either that they were introduced and spread concurrently, or that
they were introduced in two stages but subsequently spread panmictically. This lack of
mtDNA geographic structuring contrasts to that found in another rodent pest, the house
mouse, which has geographic structuring in the UK (Searle et al., 2009), although this was
detected at a wider scale than was found here.
In contrast, the STRUCTURE analysis of the microsatellite data suggested that there
was some degree of geographic population structuring within the UK, with a best fit of
three populations (K = 3). There is some geographic coherence to the distribution of
these populations, indicating they are biologically relevant. A confounding variable is
that there may also be a temporal element, as the Leicester, Cambridgeshire and Yorkshire
samples were all collected in 2005 rather than 1993–1994; Cambridgeshire and Yorkshire
form a distinct cluster. To compare the results again to house mice, studies in Ireland and
France found the microsatellite data strongly matched the geographic origin of the samples
(Jones et al., 2011).
Discrepancies of this kind between mitochondrial and microsatellite data have been
found in numerous studies (Waits et al., 2000). These discrepancies can be attributed to
differences in the levels of male and female gene flow (Avise, 1994), as the dispersal distance
of male rats is greater than females (Calhoun, 1962). However, this would imply a greater
degree of geographic structure shown by the (female dispersed) mtDNA data than that
shown by the (male and female dispersed) microsatellite data. A more likely explanation
for these results is that the relatively high mutation rate of microsatellites better reflects
population structuring than the slower mutating mtDNA sequence, which is informative
about earlier events. This is particularly likely to be the case as the fragment of mtDNA
extracted here is relatively short.
The haplotype and nucleotide diversity of mtDNA in our samples is relatively low,
although it is similar to the values found for the black rat on Madagascar (Hingston
et al., 2005). We found only six haplotypes differing at 10 positions. Low nucleotide
diversity found in a widespread species is often attributed to a slow range expansion
following a small population size (founder/ bottleneck effects) (Joseph, Wilke & Alpers,
2002). Further support for this is given by the distribution of pairwise haplotype
differences (Fig. 3), which matches that expected under a spatial expansion model
(Rogers & Harpending, 1992).
If, as seems likely from our data, the English brown rat population has undergone a
recent (on an evolutionary scale) expansion, it is unlikely to be yet at equilibrium. Regional
equilibrium can be tested by comparing Fst to geographical distance between regions
(Hutchison & Templeton, 1999). If the population has reached equilibrium, there will
be a linear relationship between Fst and geographical distance. We found no significant
Haniza et al. (2015), PeerJ, DOI 10.7717/peerj.1458 13/20
relationship between Φst (analogous to Fst) and geographical distance. Our results most
closely resemble Hutchison & Templeton’s case III, where the population is fragmented
into small, isolated populations and drift becomes more important than gene flow. This
allows allele frequencies in each population to drift independently relative to geographical
distance and random sampling of gametes creates a large degree of variance between
the plotted points (Hutchison & Templeton, 1999). We found no significant correlation
between the residual of Φst and geographical distance (a measure of the degree of variance)
and geographical distance, indicating that our data do indeed fit the case III model. This
model and our data suggest that the English rural rat population is not yet at equilibrium
and that gene flow is less important than drift in explaining the genetic structure found.
Accordingly, we found a geographical trend (by county) in the distribution of VKORC1
variants. The Leu120Gln amino acid substitution was found in the central and southern
counties. The Tyr139Cys substitution was the most common and found in the majority
in almost all counties; in Hampshire a combination of Tyr139Cys and Leu120Gln
substitutions was found more frequently than Tyr139Cys alone, although the sample size
for the county (nine) was relatively small. The Tyr139Cys substitution is reportedly better
at ameliorating the effects of (and therefore more likely to confer a selective advantage
against) warfarin use than Leu120Gln (Pelz et al., 2005), which potentially provides an
explanation for the more widespread distribution of Tyr139Cys. The Tyr139Cys amino
acid substitution is almost ubiquitous in Germany and Denmark (Pelz et al., 2005). We
found only five instances of the Tyr139Ser variant; all of these were in combination with
other VKORC1 amino acid substitutions. The Tyr139Ser variant has previously been
reported from rats near the Anglo-Welsh borders around the town of Welshpool, and not
from elsewhere in the UK (Buckle, 2013). Our two records of this VKORC1 variant from
Shropshire were from rats collected near the town of Shrewsbury, 30 km from Welshpool.
Our two records of this variant from Yorkshire, and the single record from Hampshire are
noteworthy given their considerable distance from previous records, although it is possible
that these represent false positives; Mln I digestion of the Tyr139Ser variant may produce
fragments close in size (110 bp plus < 50 bp) to wild type alleles (160 bp plus < 50 bp)
(Pelz et al., 2005).
We found a mis-match between BCR results and VKOR polymorphisms for some rats;
Tyr139Cys amino acid substitution was identified in four apparently susceptible rats. Pelz
et al. (2005) suggested that such cases were false negatives due to inaccuracies of the BCR
test, although an alternative explanation is that the Tyr139Cys amino acid substitution
alone is not sufficient to confer resistance, and an additional (undetected) substitution
(or other physiological mechanism) is required which these four rats did not possess.
We also found that six BCR positive rats had no VKORC1 amino acid substitutions,
that is, they were BCR false positives, unless there is an as yet undiscovered, alternative
resistance mechanism (Pelz et al., 2005), and a similar result has been reported elsewhere
(Heiberg, 2009). The Leu120Gln variant was identified in two BCR positive rats that were
initially thought to be false positives, whilst in a further two apparent BCR false positives,
a Tyr139Phe amino acid substitution not known from the UK at the time of our study was
Haniza et al. (2015), PeerJ, DOI 10.7717/peerj.1458 14/20
found, although this VKORC1 variant has since been reported in rats from Kent (Prescott
et al., 2010). Several other newly-discovered VKORC1 variants have recently been reported
from the UK (Buckle, 2013). We initially screened samples for the four VKORC1 variants
reported from the UK at the time of our study, and did not look for other variants, except
where BCR false positives were suspected. It is possible therefore that we underestimated
the prevalence of VKOR polymorphisms in our samples. However, the more recently
reported VKORC1 variants also appear to have limited (regional) distribution, which is
consistent with our suggestion that limited gene flow between regions limits geographical
distribution of VKOR polymorphisms.
It has been reported that because of pleiotropic costs (on vitamin K requirements,
reduced fecundity and growth rate) that anticoagulant resistant rats (from some regions)
are at a selective disadvantage in the absence of anticoagulant use compared to susceptible
individuals (Jacob et al., 2012; Smith, Townsend & Smith, 1991). Intuitively therefore, these
susceptible rats should out-compete their resistant counterparts in the absence of exposure
to anticoagulant rodenticides, and it follows that resistance-management strategies should,
where possible, include the use of non-anticoagulant rodenticides and non-rodenticide
approaches in order to remove selection pressure, and to remove resistant individuals
(Buckle, 2013; Greaves, 1995; Lambert et al., 2008; Quy et al., 1995; Smith & Greaves, 1987).
However, in a captive, insular rat population, anticoagulant tolerance was not significantly
influenced in the absence of bromadiolone selection (Heiberg, Leirs & Siegismund, 2006),
and not all warfarin resistant strains appear to be at a selective disadvantage in the absence
of poison use (Smith et al., 1993). In a field trial where removal of anticoagulant selection
pressure from a population of rats highly resistant to bromadiolone did not result in
a greatly increased proportion of susceptible individuals within the population, it was
found that a high proportion of rats on surrounding farmsteads were also resistant to
bromadiolone, and there was therefore little opportunity for susceptible rats to dilute
the resistant population through immigration (CSL, 2002). The lack of mixing between
populations at larger geographical scales, revealed by this study, is likely to intensify the
effect of local selection pressure imposed by sustained anticoagulant use, and reversing
these processes is therefore likely to be slow and difficult to achieve. However, the present
study also suggests that restricted gene flow between rat populations should limit the rate
of spread of resistant populations to some degree, and should therefore make their targeted
management a realistic possibility. Greaves (1995) suggested that prompt and sustained
control programmes using a suitable range of non-selective techniques within a 20 km
radius of anticoagulant foci would be very likely to extinguish the majority of resistant
populations. However, Buckle (2013) noted that such large-scale coordinated resistance
management efforts have previously proven prohibitively expensive or impractical in
the UK. Some of the most toxic second-generation anticoagulant rodenticides (SGARs)
including brodifacoum and flocoumafen are still effective against rats resistant to
warfarin, bromadiolone and difenacoum, and their use in areas where resistance to
the less-toxic anticoagulants is encountered has been recommended where alternative
(non-anticoagulant) methods cannot be used (Buckle, 2013). However, it is unknown
Haniza et al. (2015), PeerJ, DOI 10.7717/peerj.1458 15/20

what the impacts of this approach will be on resistant rat populations in the longer-term,
and it remains important that alternative rodent control approaches and rodenticides
are developed, so that a range of viable options is available to manage populations of
anticoagulant resistant rats.
ACKNOWLEDGEMENTSWe thank Carl Smith for his involvement with the work, and two anonymous referees who
provided useful feedback on an earlier draft. We are grateful to Geoff Butcher from the
Babraham Institute for providing the additional samples from Cambridge.
ADDITIONAL INFORMATION AND DECLARATIONS
FundingMZHH was funded by a Malaysian government scholarship. The funders had no role
in study design, data collection and analysis, decision to publish, or preparation of the
manuscript.
Grant DisclosuresThe following grant information was disclosed by the authors:
Malaysian government scholarship.
Competing InterestsThe authors declare there are no competing interests.
Author Contributions• Mohd Z.H. Haniza conceived and designed the experiments, performed the experi-
ments, wrote the paper, prepared figures and/or tables, reviewed drafts of the paper.
• Sally Adams performed the experiments, reviewed drafts of the paper.
• Eleanor P. Jones and Mark S. Lambert analyzed the data, wrote the paper, prepared
figures and/or tables, reviewed drafts of the paper.
• Alan MacNicoll contributed reagents/materials/analysis tools, reviewed drafts of the
paper.
• Eamonn B. Mallon conceived and designed the experiments, performed the experi-
ments, analyzed the data, wrote the paper, reviewed drafts of the paper.
• Robert H. Smith conceived and designed the experiments, reviewed drafts of the paper.
Animal EthicsThe following information was supplied relating to ethical approvals (i.e., approving body
and any reference numbers):
All research that involved the use of live animals was approved in advance by written
confirmation from Animal and Plant Health Agency, York, UK Animal Welfare and Ethical
Review Body (AWERB) or equivalent at the time of the study. Our AWERB membership
has both internal and external members including lay representatives and experts in a
variety of apposite areas such as veterinary surgery, statistics and animal welfare.
Haniza et al. (2015), PeerJ, DOI 10.7717/peerj.1458 16/20
DNA DepositionThe following information was supplied regarding the deposition of DNA sequences:
Genbank: DQ897633–DQ897638.
Supplemental InformationSupplemental information for this article can be found online at http://dx.doi.org/
10.7717/peerj.1458#supplemental-information.
REFERENCESAvise JC. 1994. Molecular markers, natural history and evolution. New York: Chapman & Hall.
Balloux F, Lugon-Moulin N. 2002. The estimation of population differentiation withmicrosatellite markers. Molecular Ecology 11:155–165 DOI 10.1046/j.0962-1083.2001.01436.x.
Bell RG, Caldwell PT. 1973. Mechanisms of warfarin resistance. Biochemistry 12:1759–1762DOI 10.1021/bi00733a015.
Boyle CM. 1960. Case of apparent resistance of Rattus norvegicus Berkenhout to anticoagulantpoisons. Nature 188:517 DOI 10.1038/188517a0.
Brodie J. 1976. Anticoagulant resistant rats (Rattus norvegicus) in Scotland. International PestControl 18:7–10.
Buckle A. 2013. Anticoagulant resistance in the United Kingdom and a new guideline for themanagement of resistant infestations of Norway rats (Rattus norvegicus Berk). Pest ManagementScience 69:334–341 DOI 10.1002/ps.3309.
Buckle A, Smith R. 2015. Rodent pests and their control. 2nd edition. Oxford: CABI.
Calhoun JB. 1962. The ecology and sociology of the Norway rat. Washington, D.C.: US Departmentof Health, Education and Welfare.
CSL. 2002. Development of guidelines on best practice for rodenticide use. Report to theDepartment of Environment. Food and Rural Affairs. Available at http://randd.defra.gov.uk/Document.aspx?Document=PV1016 917 FRP.doc.
Drummond DC. 1970. Variation in rodent populations in response to control measures. Symposiaof the Zoological Society of London 26:351–367.
Earl DA, VonHoldt BM. 2012. STRUCTURE HARVESTER: a website and program for visualizingSTRUCTURE output and implementing the Evanno method. Conservation Genetics Resources4:359–361 DOI 10.1007/s12686-011-9548-7.
Evanno G, Regnaut S, Goudet J. 2005. Detecting the number of clusters of individuals using thesoftware STRUCTURE: a simulation study. Molecular Ecology 14:2611–2620DOI 10.1111/j.1365-294X.2005.02553.x.
Excoffier L, Laval G, Schneider S. 2005. ARLEQUIN ver. 3.0: an integrated software package forpopulation genetics data analysis. Evolutionary Bioinformatics Online 1:47–50.
Greaves JH. 1995. Managing resistance to anticoagulant rodenticides: an appraisal. Pesticide Science43:79–82 DOI 10.1002/ps.2780430113.
Greaves JH, Ayres PB. 1967. Heritable resistance to warfarin in rats. Nature 215:877–878DOI 10.1038/215877a0.
Hadler MR, Redfern R, Rowe FP. 1975. Laboratory evaluation of difenacoum as a rodenticide.Journal of Hygiene 74:441–448 DOI 10.1017/S0022172400046957.
Haniza et al. (2015), PeerJ, DOI 10.7717/peerj.1458 17/20
Hadler M, Shadbolt R. 1975. Novel 4-hydroxycoumarin anticoagulants active against resistantrats. Nature 253:275–277 DOI 10.1038/253275a0.
Hayes WJ. 1950. Control of Norway rats with residual rodenticide warfarin. Public Health Reports65:1537–1555 DOI 10.2307/4587549.
Heiberg A-C. 2002. Population effects of anticoagulant rodenticide resistance in Norway Rats(Rattus norvegicus). PhD Thesis, University of Copenhagen.
Heiberg AC. 2009. Anticoagulant resistance: a relevant issue in sewer rat (Rattus norvegicus)control? Pest Management Science 65:444–449 DOI 10.1002/ps.1709.
Heiberg AC, Leirs H, Siegismund HR. 2006. Reproductive success of bromadiolone-resistantrats in absence of anticoagulant pressure. Pest Management Science 62:862–871DOI 10.1002/ps.1249.
Hingston M, Goodman SM, Ganzhorn JU, Sommer S. 2005. Reconstruction of the colonizationof southern Madagascar by introduced Rattus rattus. Journal of Biogeography 32:1549–1559DOI 10.1111/j.1365-2699.2005.01311.x.
Huson DH. 1998. SplitsTree: analyzing and visualizing evolutionary data. Bioinformatics 14:68–73DOI 10.1093/bioinformatics/14.1.68.
Hutchison DW, Templeton AR. 1999. Correlation of pairwise genetic and geographic distancemeasures: inferring the relative influences of gene flow and drift on the distribution of geneticvariability. Evolution 53:1898–1914 DOI 10.2307/2640449.
Jacob J, Endepols S, Pelz HJ, Kampling E, Cooper TG, Yeung CH, Redmann K, Schlatt S. 2012.Vitamin K requirement and reproduction in bromadiolone-resistant Norway rats. PestManagement Science 68:378–385 DOI 10.1002/ps.2273.
Jakobsson M, Rosenberg NA. 2007. CLUMPP: a cluster matching and permutation programfor dealing with label switching and multimodality in analysis of population structure.Bioinformatics 23:1801–1806 DOI 10.1093/bioinformatics/btm233.
Jones EP, Johannesdottir F, Gunduz I, Richards MB, Searle J. 2011. The expansion of the housemouse into north-western Europe. Journal of Zoology 283:257–268DOI 10.1111/j.1469-7998.2010.00767.x.
Joseph L, Wilke T, Alpers D. 2002. Reconciling genetic expectations from host specificity withhistorical population dynamics in an avian brood parasite, Horsfield’s Bronze-Cuckoo Chalcitesbasalis of Australia. Molecular Ecology 11:829–837 DOI 10.1046/j.1365-294X.2002.01481.x.
Kerins G, Dennis N, Atterby H, Gill J, MacNicoll A. 2001. Distribution of resistance toanticoagulant rodenticides in the Norway rat (Rattus norvegicus Berk.) in England 1995–98.Advances in Vertebrate Pest Management II 2:149–159.
Lambert MS, Quy RJ, Smith RH, Cowan DP. 2008. The effect of habitat management onhome-range size and survival of rural Norway rat populations. Journal of Applied Ecology45:1753–1761 DOI 10.1111/j.1365-2664.2008.01543.x.
Lund M. 1985. The “second generation” anticoagulants: a review. Acta Zoologica Fennica173:149–153.
Meehan AP. 1984. Rats and mice: their biology and control. East Grinstead: Rentokil Ltd.
Peakall R, Smouse PE. 2006. GENALEX 6: genetic analysis in Excel. Population genetic softwarefor teaching and research. Molecular Ecology Notes 6:288–295DOI 10.1111/j.1471-8286.2005.01155.x.
Pelz HJ, Rost S, Hunerberg M, Fregin A, Heiberg AC, Baert K, MacNicoll AD, Prescott CV,Walker AS, Oldenburg J, Muller CR. 2005. The genetic basis of resistance to anticoagulantsin rodents. Genetics 170:1839–1847 DOI 10.1534/genetics.104.040360.
Haniza et al. (2015), PeerJ, DOI 10.7717/peerj.1458 18/20
Prescott CV, Buckle AP, Gibbings JG, Allan EN, Stuart AM. 2010. Anticoagulant resistance inNorway rats (Rattus norvegicus Berk.) in Kent–a VKORC1 single nucleotide polymorphism,tyrosine139phenylalanine, new to the UK. International Journal of Pest Management 57:61–65DOI 10.1080/09670874.2010.523124.
Pritchard JK, Stephens M, Donnelly P. 2000. Inference of population structure using multilocusgenotype data. Genetics 155:945–959.
Quy RJ, Cowan DP, Prescott CV, Gill JE, Kerins GM, Dunsford G, Jones A, Macnicoll AD. 1995.Control of a population of Norway rats resistant to anticoagulant rodenticides. Pesticide Science45:247–256 DOI 10.1002/ps.2780450308.
Redfern R, Gill JE. 1978. The development and use of a test to identify resistance to theanticoagulant difenacoum in the Norway rat (Rattus norvegicus). Journal of Hygiene 81:427–431DOI 10.1017/S0022172400025316.
Rogers AR, Harpending H. 1992. Population growth makes waves in the distribution of pairwisegenetic differences. Molecular Biology and Evolution 9:552–569.
Rosenberg NA. 2004. DISTRUCT: a program for the graphical display of population structure.Molecular Ecology Notes 4:137–138 DOI 10.1046/j.1471-8286.2003.00566.x.
Rost S, Fregin A, Ivaskevicius V, Conzelmann E, Hortnagel K, Pelz H-J, Lappegard K, Seifried E,Scharrer I, Tuddenham EG. 2004. Mutations in VKORC1 cause warfarin resistance andmultiple coagulation factor deficiency type 2. Nature 427:537–541 DOI 10.1038/nature02214.
Roush RT, McKenzie JA. 1987. Ecological genetics of insecticide and acaricide resistance. AnnualReview of Entomology 32:361–380 DOI 10.1146/annurev.en.32.010187.002045.
Sadowski JA, Esmon CT, Suttie JW. 1976. Vitamin K-dependent carboxylase. Requirements of therat liver microsomal enzyme system. Journal of Biological Chemistry 251:2770–2776.
Searle JB, Jones CS, Gunduz I, Scascitelli M, Jones EP, Herman JS, Rambau RV, Noble LR,Berry R, Gimenez MD. 2009. Of mice and (Viking?) men: phylogeography of British and Irishhouse mice. Proceedings of the Royal Society B: Biological Sciences 276:201–207DOI 10.1098/rspb.2008.0958.
Smith P, Berdoy M, Smith RH, Macdonald DW. 1993. A new aspect of warfarin resistance in wildrats: benefits in the absence of poison. Functional Ecology 7:190–194 DOI 10.2307/2389886.
Smith RH, Greaves JH. 1987. Resistance to anticoagulant rodenticides: the problem and itsmanagement. In: Donahaye E, Navarro S, eds. Proceedings of the 4th international workingconference on stored-product protection. Bet Dagan: Agricultural Research Organisation,302–315.
Smith P, Townsend MG, Smith RH. 1991. A cost of resistance in the brown rat? Reduced growthrate in warfarin-resistant lines. Functional Ecology 5:441–447 DOI 10.2307/2389816.
Suttie JW. 1980. Mechanism of action of vitamin K: synthesis of gamma-carboxyglutamic acid.CRC Critical Reviews in Biochemistry 8:191–223 DOI 10.3109/10409238009105469.
Tamura K, Nei M. 1993. Estimation of the number of nucleotide substitutions in the controlregion of mitochondrial DNA in humans and chimpanzees. Molecular Biology and Evolution10:512–526.
Waits L, Taberlet P, Swenson JE, Sandegren F, Franzen R. 2000. Nuclear DNA microsatelliteanalysis of genetic diversity and gene flow in the Scandinavian brown bear (Ursus arctos).Molecular Ecology 9:421–431 DOI 10.1046/j.1365-294x.2000.00892.x.
Webster JP, Ellis WA, MacDonald DW. 1995. Prevalence of Leptospira spp. in wild brown rats(Rattus norvegicus) on UK farms. Epidemiology and Infection 114:195–201DOI 10.1017/S0950268800052043.
Haniza et al. (2015), PeerJ, DOI 10.7717/peerj.1458 19/20
Wool D, Noiman S. 1983. Integrated control of insecticide resistance by combined geneticand chemical treatments: a warehouse model with flour beetles (Tribolium; Tenebrionidae,Coleoptera). Zeitschrift fur Angewandte Entomologie 95:22–30DOI 10.1111/j.1439-0418.1983.tb02606.x.
Wright S. 1951. The genetical structure of populations. Annals of Eugenics 15:323–354DOI 10.1111/j.1469-1809.1949.tb02451.x.
Yalden D. 1990. The history of British mammals. Cambridge: Cambridge University Press.
Haniza et al. (2015), PeerJ, DOI 10.7717/peerj.1458 20/20


![Supplementary Table 1 - hnRNP K co-immunoprecipitated ... · Elmo3 Rattus norvegicus engulfment and cell motility 3 (Elmo3), mRNA [NM_001030028] 97.64 Grlf1 PREDICTED: Rattus norvegicus](https://img.pdfslide.us/doc/110x75/5f165050ace2765afb16af7c/supplementary-table-1-hnrnp-k-co-immunoprecipitated-elmo3-rattus-norvegicus.jpg)