Embed Size (px)
Citation preview
Stephanie Reynolds Westby, NOAA
Update
Large-Scale Oyster Restoration in Support of the Chesapeake Bay Agreement Oyster Goal
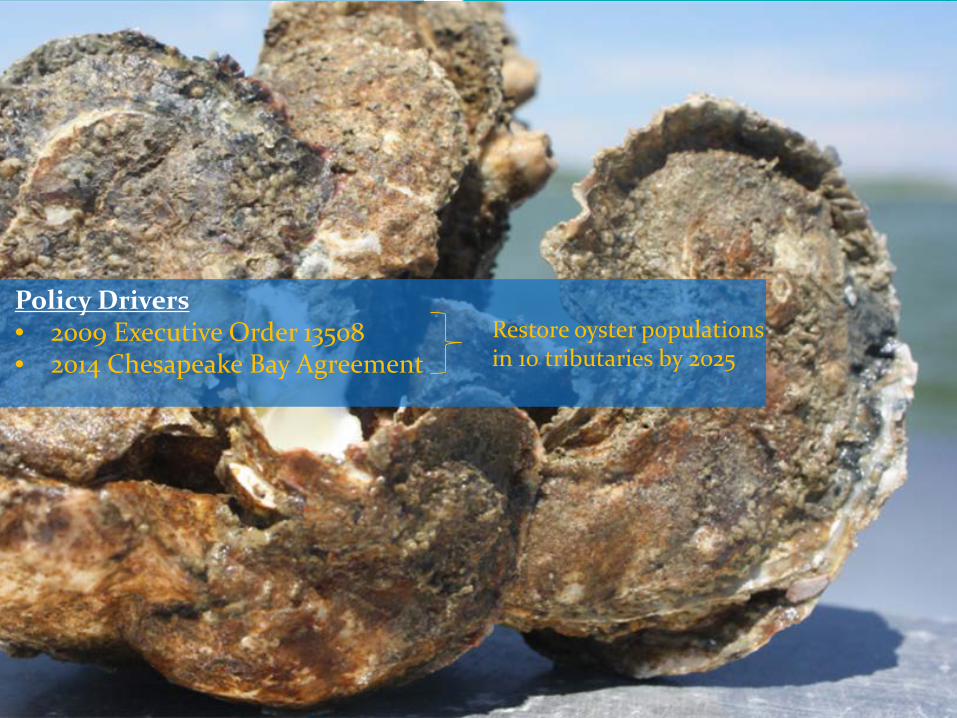
Policy Drivers• 2009 Executive Order 13508• 2014 Chesapeake Bay Agreement
Restore oyster populations in 10 tributaries by 2025
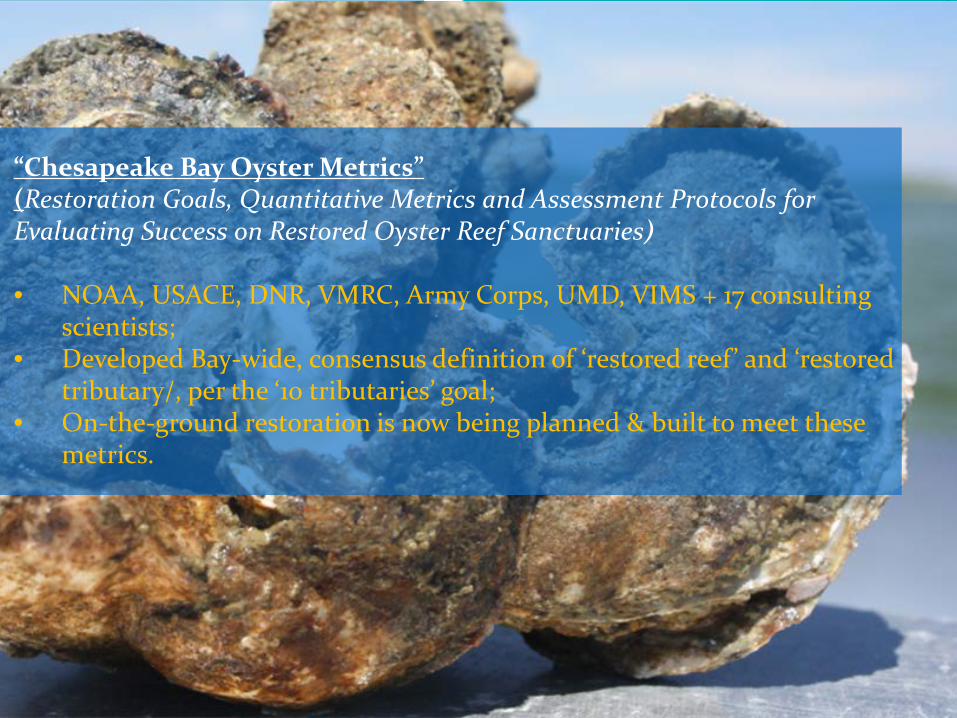
“Chesapeake Bay Oyster Metrics”(Restoration Goals, Quantitative Metrics and Assessment Protocols for Evaluating Success on Restored Oyster Reef Sanctuaries)
• NOAA, USACE, DNR, VMRC, Army Corps, UMD, VIMS + 17 consulting scientists;
• Developed Bay-wide, consensus definition of ‘restored reef ’ and ‘restored tributary/, per the ‘10 tributaries’ goal;
• On-the-ground restoration is now being planned & built to meet these metrics.
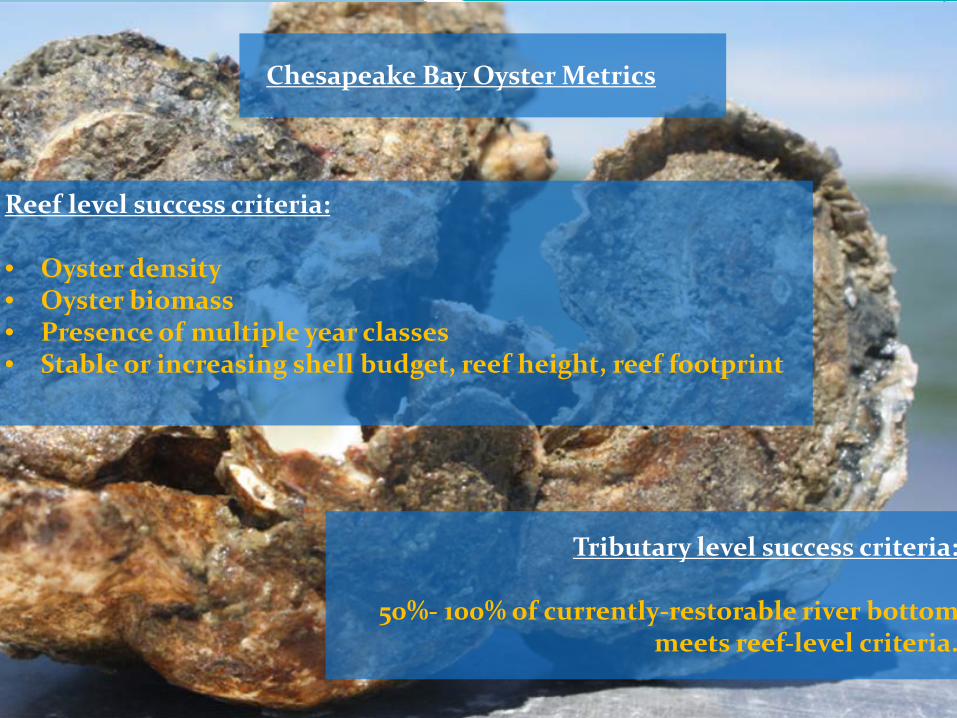
Reef level success criteria:
• Oyster density• Oyster biomass• Presence of multiple year classes• Stable or increasing shell budget, reef height, reef footprint
Tributary level success criteria:
50%- 100% of currently-restorable river bottom meets reef-level criteria.
Chesapeake Bay Oyster Metrics
Oyster Outcome:
Restore native oyster habitat and populations in 10 tributaries by 2025 and ensure their protection.
Progress tracked under:
Sustainable Fisheries Goal Implementation Team
Management Approach/ Process:
• Establish workgroups/ select tributaries• Collect baseline data (sonar surveys to determine hard bottom; oyster
population info)• Set acreage target, per Oyster Metrics• Develop restoration plan• Implement restoration• Monitor; adaptively manage
Harris Creek
Little Choptank
Tred Avon
Piankatank
Lafayette Lynnhaven
Maryland
Virginia
Lower York
Great Wicomico
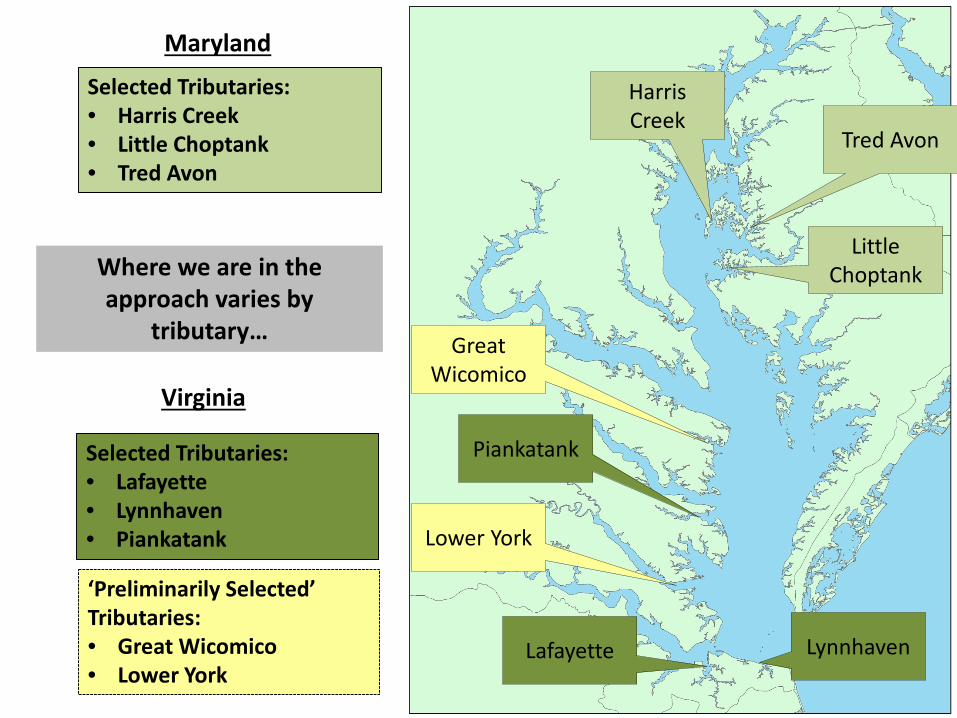
Selected Tributaries:• Harris Creek• Little Choptank• Tred Avon
Selected Tributaries:• Lafayette• Lynnhaven• Piankatank
‘Preliminarily Selected’ Tributaries:• Great Wicomico• Lower York
Where we are in the approach varies by
tributary…
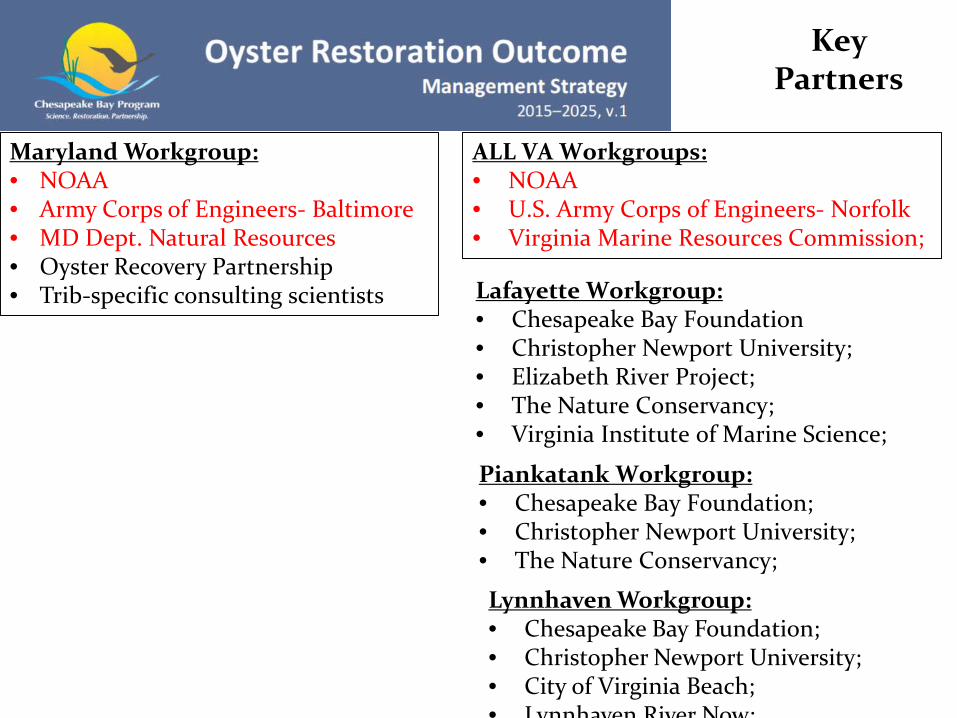
Lynnhaven Workgroup:• Chesapeake Bay Foundation; • Christopher Newport University; • City of Virginia Beach; • Lynnhaven River Now;
Maryland Workgroup:• NOAA• Army Corps of Engineers- Baltimore• MD Dept. Natural Resources• Oyster Recovery Partnership• Trib-specific consulting scientists
ALL VA Workgroups:• NOAA• U.S. Army Corps of Engineers- Norfolk• Virginia Marine Resources Commission;
Piankatank Workgroup:• Chesapeake Bay Foundation; • Christopher Newport University; • The Nature Conservancy;
Key Partners
Lafayette Workgroup:• Chesapeake Bay Foundation• Christopher Newport University; • Elizabeth River Project;• The Nature Conservancy; • Virginia Institute of Marine Science;
Factors Influencing Success:
• Low oyster populations• Water quality• Harvest enforcement• Spat set variability• Shell loss• Hard bottom availability• Public support• Climate change/ ocean acidification
• Oyster Resource Management/ user group conflicts:• Permitting• Bottom leasing• Designation of oyster sanctuaries• Navigation
• Resource Availability:• Finding• Shell/ substrate• Hatchery spat supply
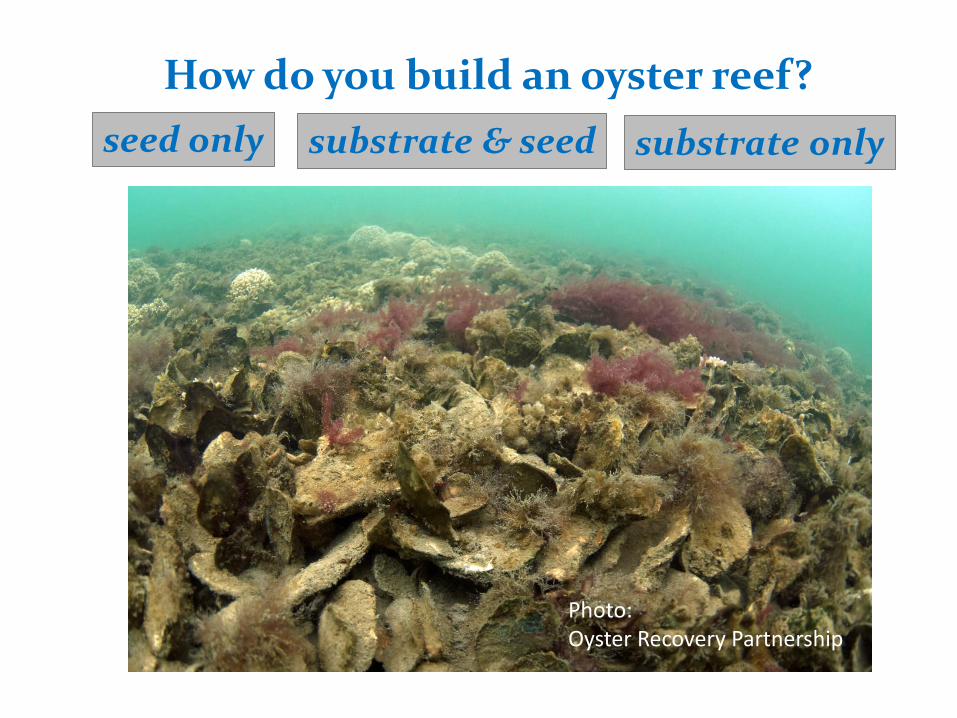
Photo: Oyster Recovery Partnership
How do you build an oyster reef?seed only substrate & seed substrate only
https://www.youtube.com/watch?v=BPN--zKxavg&feature=youtu.be
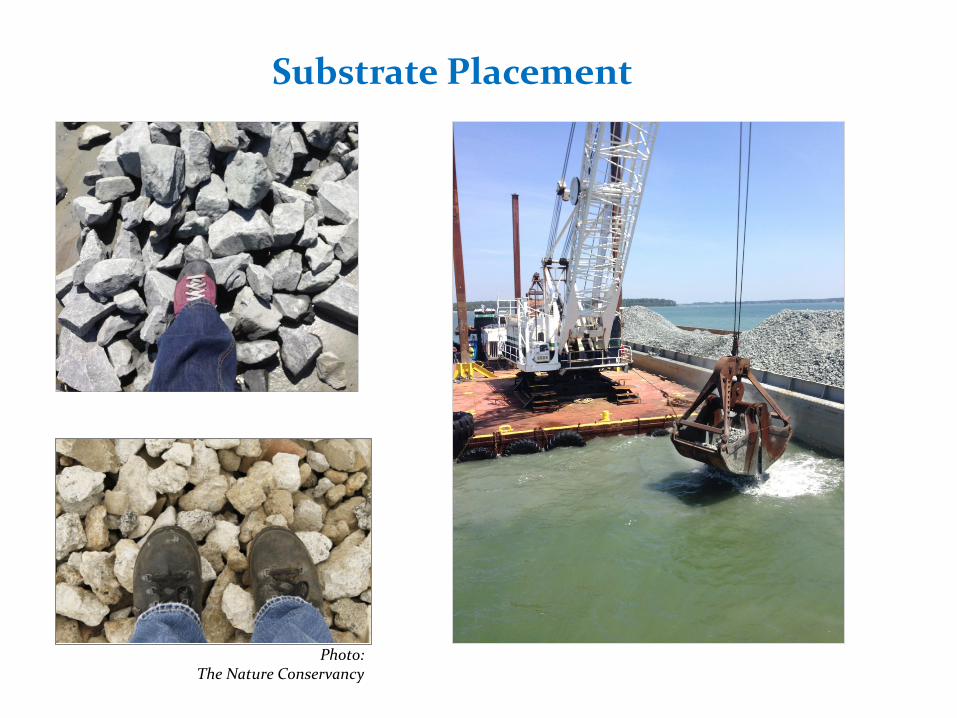
Substrate Placement
Photo: The Nature Conservancy
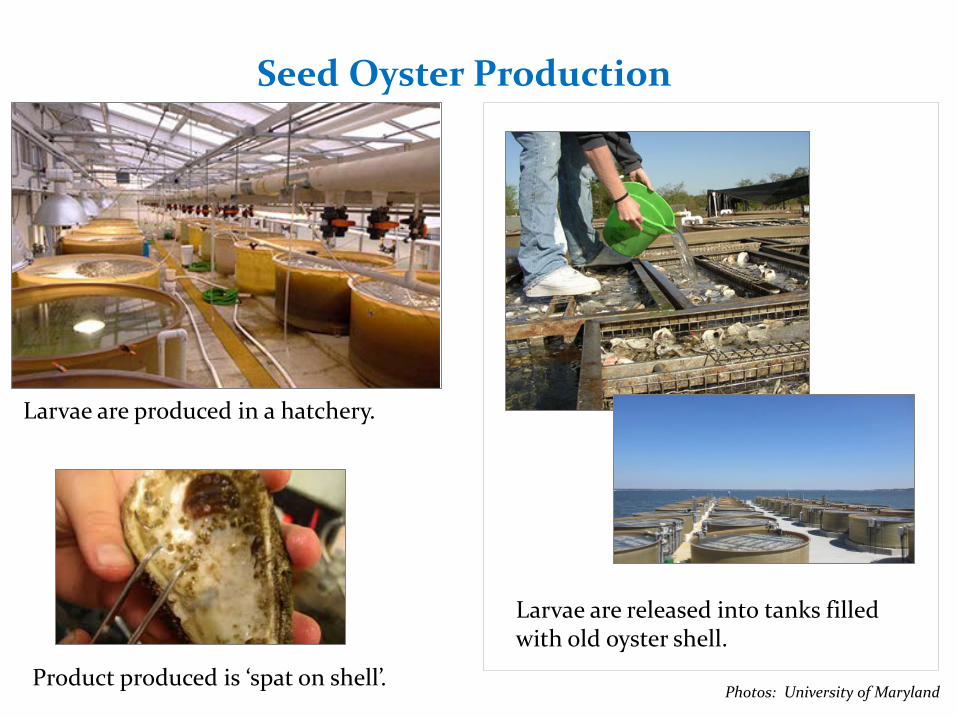
Photo: University of Maryland
Seed Oyster Production
Product produced is ‘spat on shell’.
Larvae are produced in a hatchery.
Larvae are released into tanks filled with old oyster shell.
Photos: University of Maryland
https://youtu.be/mG8hnbeI_4g
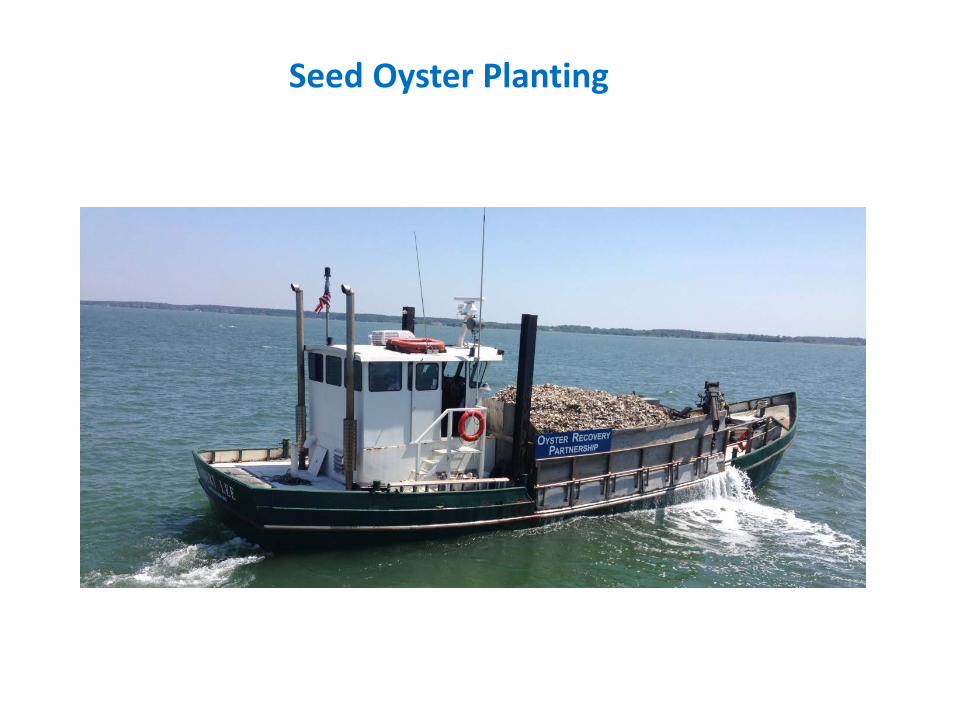
Juvenile oysters, attached to old shells, are transported to the reef and planted
Photos: Oyster Recovery Partnership and Chesapeake Bay Foundation
Seed Oyster Planting
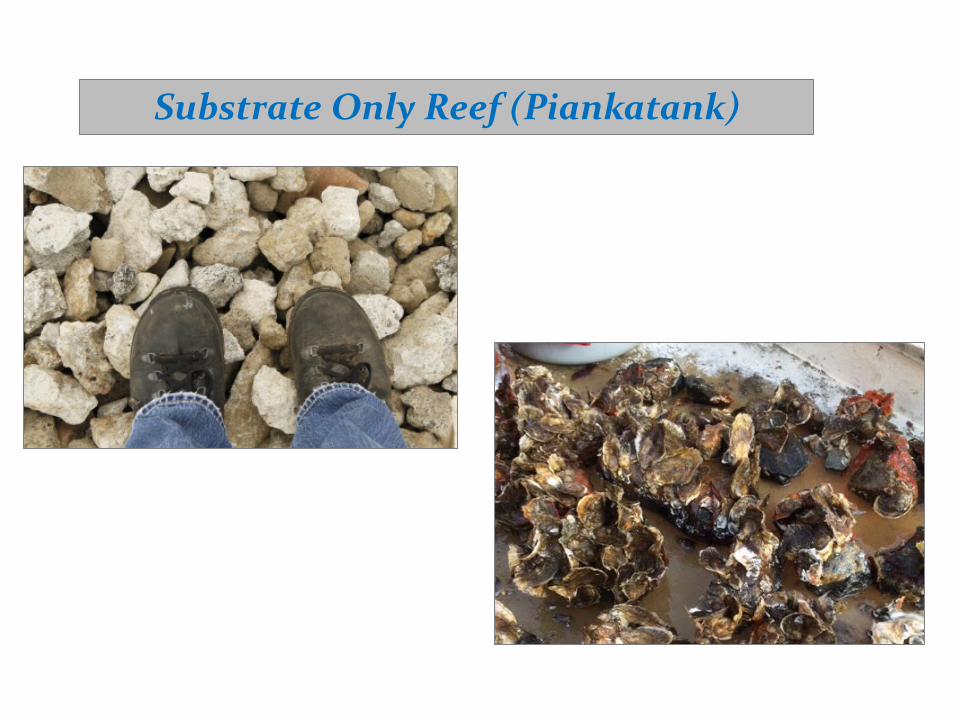
Substrate Only Reef (Piankatank)
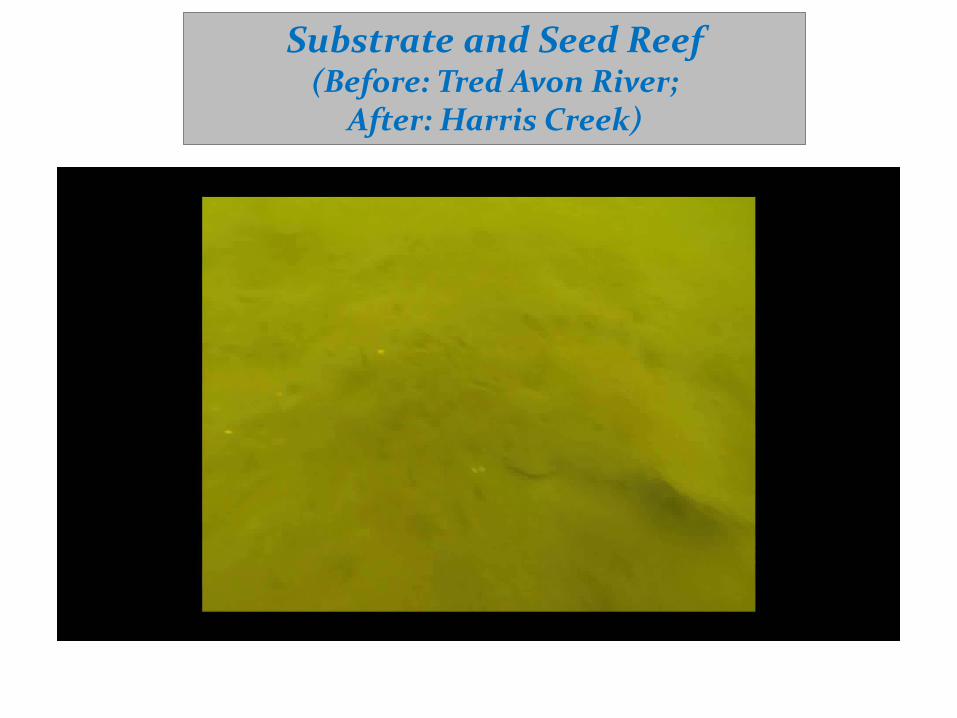
Substrate and Seed Reef (Before: Tred Avon River;
After: Harris Creek)
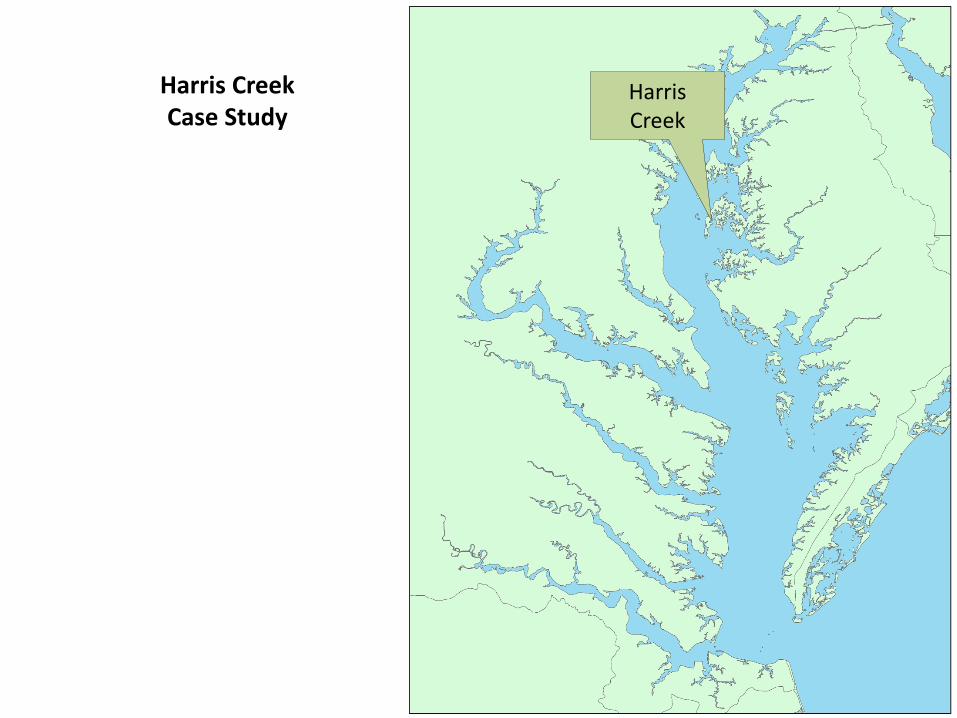
Harris Creek
Harris Creek Case Study
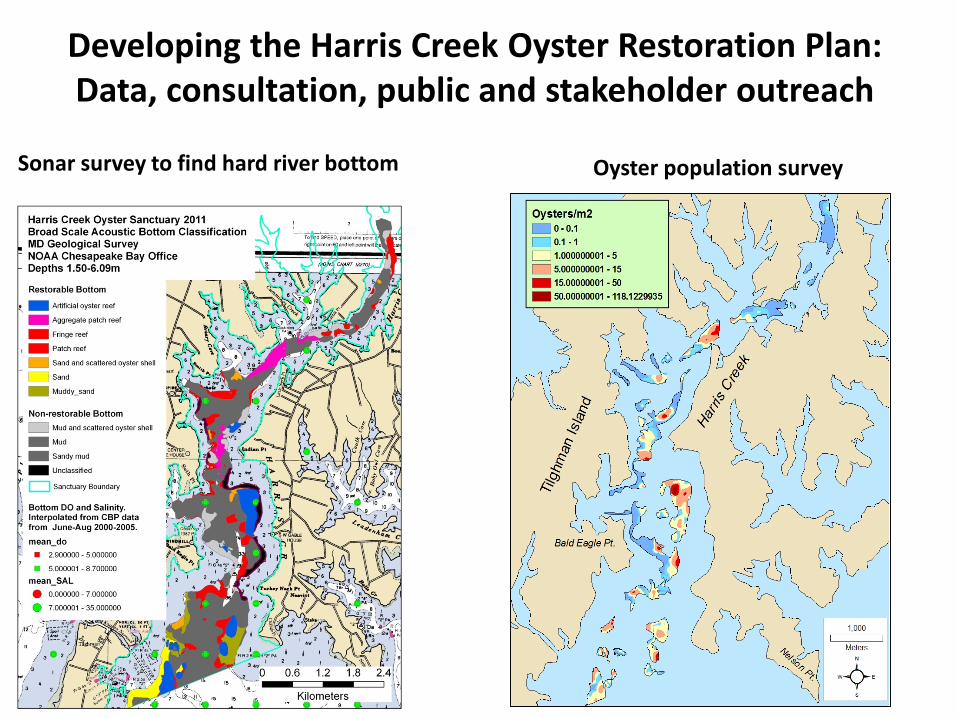
Developing the Harris Creek Oyster Restoration Plan:Data, consultation, public and stakeholder outreach
Sonar survey to find hard river bottom Oyster population survey
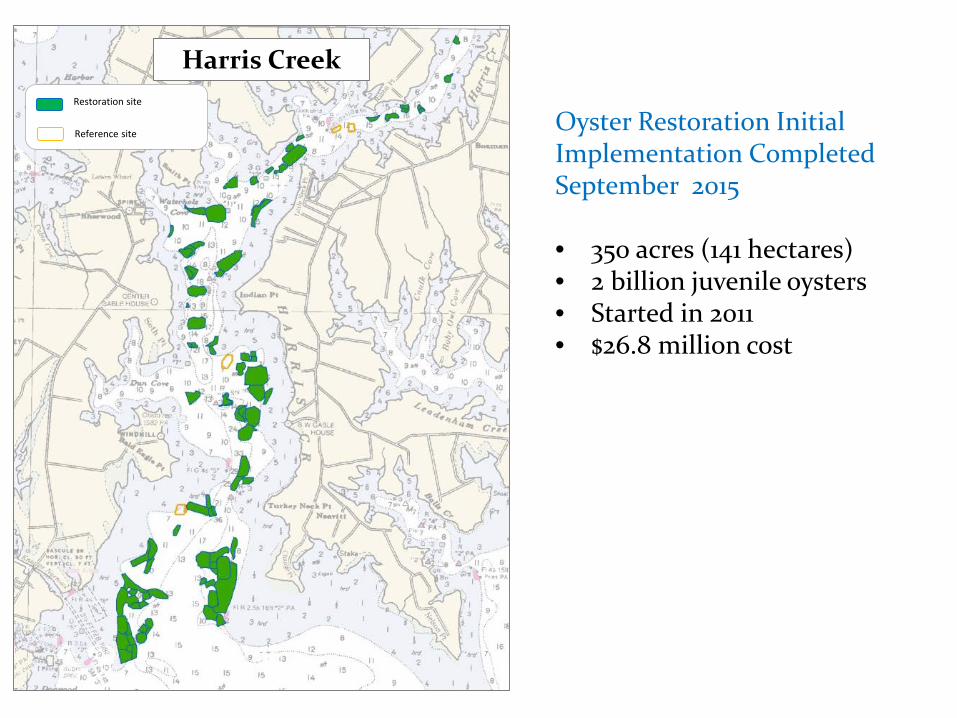
Oyster Restoration Initial Implementation Completed September 2015
• 350 acres (141 hectares)• 2 billion juvenile oysters• Started in 2011• $26.8 million cost
Restoration site
Reference site
Harris Creek
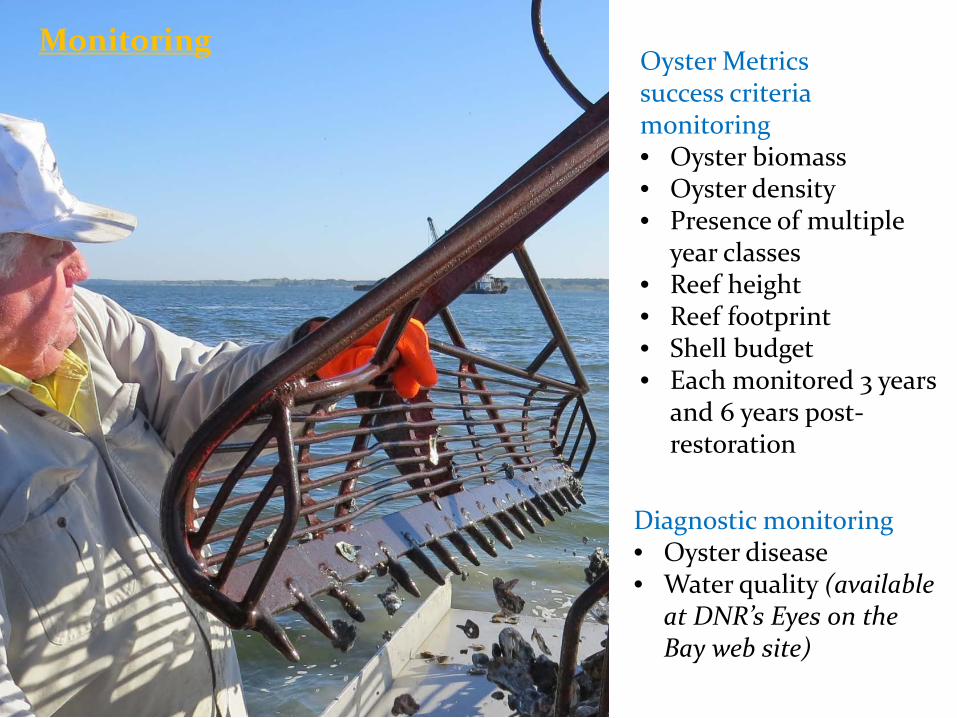
MonitoringOyster Metrics success criteria monitoring• Oyster biomass• Oyster density• Presence of multiple
year classes• Reef height• Reef footprint• Shell budget• Each monitored 3 years
and 6 years post-restoration
Diagnostic monitoring• Oyster disease• Water quality (available
at DNR’s Eyes on the Bay web site)
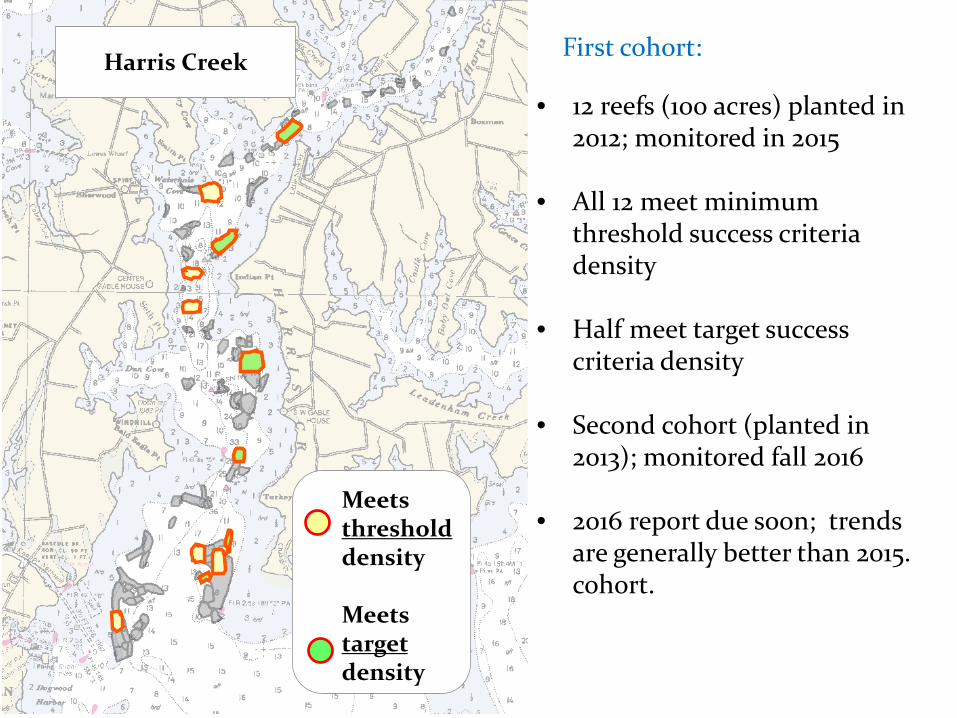
Harris Creek
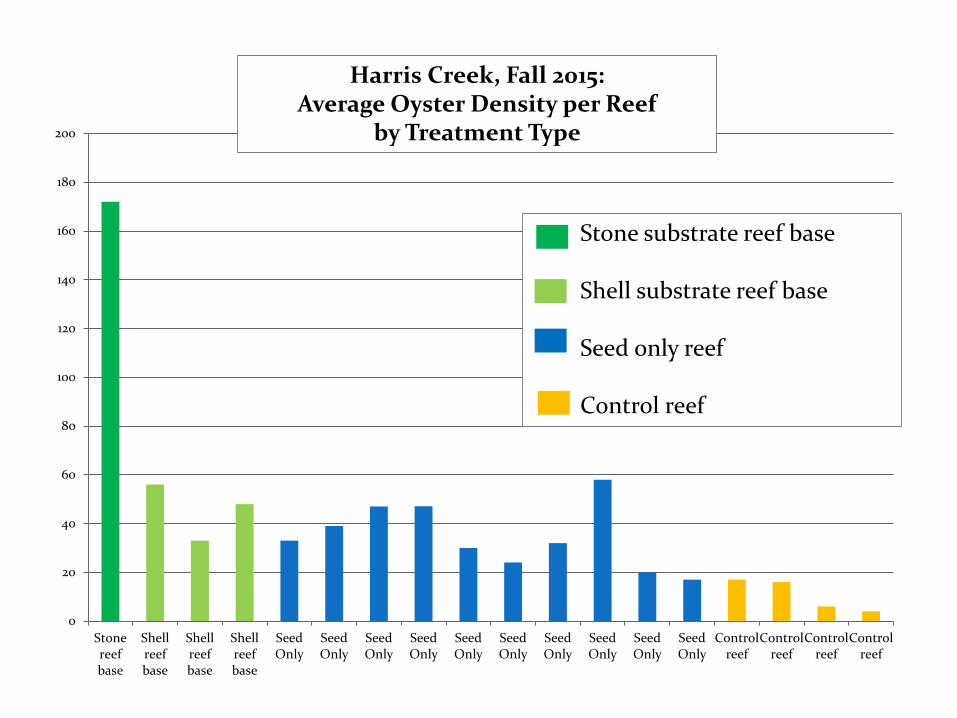
Meets threshold density
Meets target density
• 12 reefs (100 acres) planted in 2012; monitored in 2015
• All 12 meet minimum threshold success criteria density
• Half meet target success criteria density
• Second cohort (planted in 2013); monitored fall 2016
• 2016 report due soon; trends are generally better than 2015. cohort.
First cohort:
0
20
40
60
80
100
120
140
160
180
200
Stonereefbase
Shellreefbase
Shellreefbase
Shellreefbase
SeedOnly
SeedOnly
SeedOnly
SeedOnly
SeedOnly
SeedOnly
SeedOnly
SeedOnly
SeedOnly
SeedOnly
Controlreef
Controlreef
Controlreef
Controlreef
Harris Creek, Fall 2015:Average Oyster Density per Reef
by Treatment Type
Stone substrate reef base
Shell substrate reef base
Seed only reef
Control reef
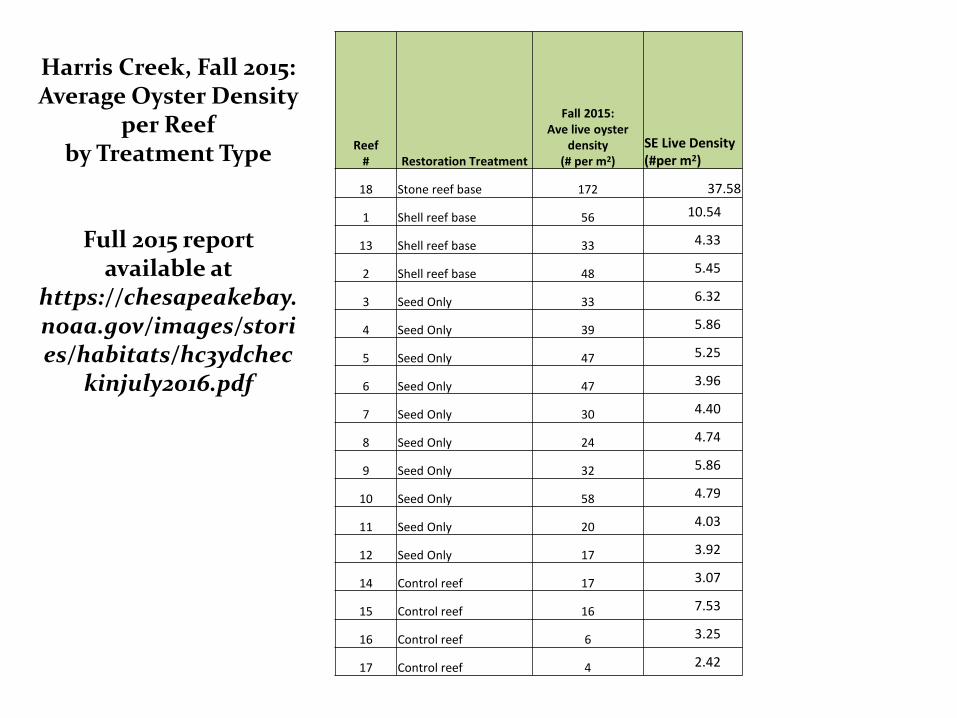
Reef # Restoration Treatment
Fall 2015:Ave live oyster
density (# per m2)
SE Live Density (#per m2)
18 Stone reef base 172 37.58
1 Shell reef base 56 10.54
13 Shell reef base 33 4.33
2 Shell reef base 48 5.45
3 Seed Only 33 6.32
4 Seed Only 39 5.86
5 Seed Only 47 5.25
6 Seed Only 47 3.96
7 Seed Only 30 4.40
8 Seed Only 24 4.74
9 Seed Only 32 5.86
10 Seed Only 58 4.79
11 Seed Only 20 4.03
12 Seed Only 17 3.92
14 Control reef 17 3.07
15 Control reef 16 7.53
16 Control reef 6 3.25
17 Control reef 4 2.42
Harris Creek, Fall 2015:Average Oyster Density
per Reef by Treatment Type
Full 2015 report available at
https://chesapeakebay.noaa.gov/images/stories/habitats/hc3ydchec
kinjuly2016.pdf
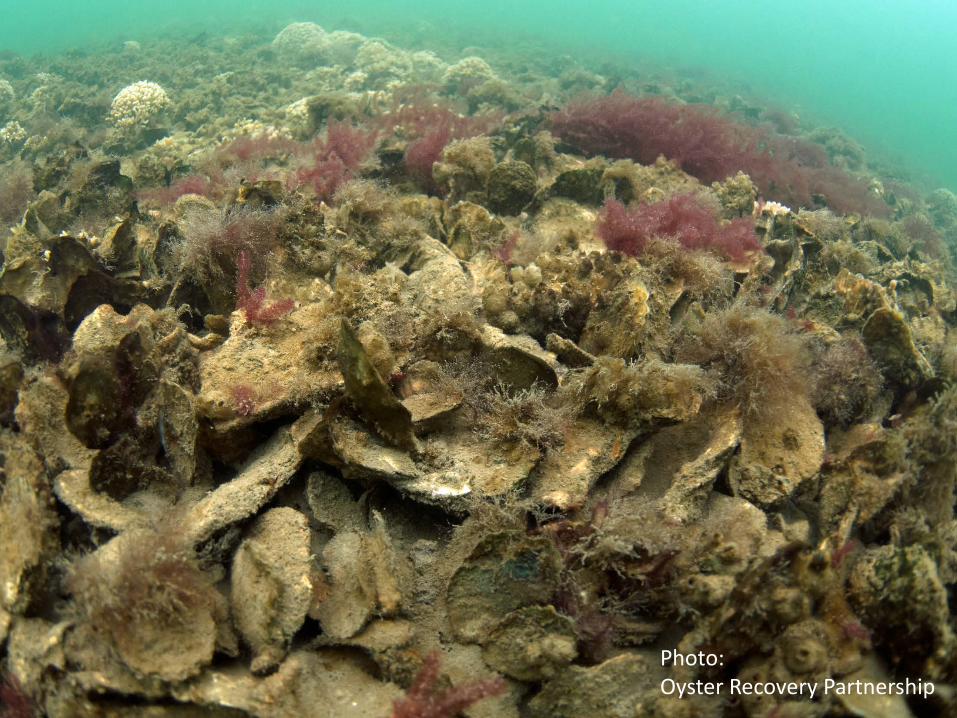
Photo: Oyster Recovery Partnership