Embed Size (px)
Citation preview

DCN
Department of the Interior US Geological Survey LANDSAT TERRAIN ERROR SENSITIVITY STUDY White Paper Version 1.1 May 2003

- ii - DCN
LANDSAT TERRAIN ERROR SENSITIVITY STUDY
White Paper
May 2003
Prepared By: Approved By: ______________________________ ___________________________ Jim Storey Date Mike Headley Date Chief Systems Engineer Principal Systems Engineer SAIC SAIC Reviewed By: ______________________________ Jason Williams Date Sr. Systems Engineer SAIC Reviewed By: _______________________________ Ron Hayes Date Sr. Scientist SAIC
USGS EROS Data Center Sioux Falls, South Dakota

- iii - DCN
Executive Summary
The Level 1 Product Generation System (LPGS) was implemented to produce basic (Level 1) Landsat 7 image data products. The core LPGS image processing software components are shared with the Image Assessment System and include capabilities not used in the LPGS implementation, including the capability to create terrain corrected image products. Such products (Level 1Gt) are normally produced using both digital elevation data and ground control points. The excellent absolute geolocation accuracy demonstrated by the Landsat 7 system creates the potential for realizing most of the benefits of terrain correction without the use of ancillary ground control. This study quantitatively analyzed the magnitude of the terrain-induced geometric errors in Level 1Gs data products, and the degree to which these errors could be corrected through the application of a systematic terrain correction to create Level 1Gst products. This study quantitatively evaluated the benefit to Landsat 7 product geodetic accuracy of applying terrain correction processing, in the absence of ground control, to systematically corrected image data products. This was accomplished by addressing three specific objectives:
1. Quantify the terrain error in Level 1Gs products. If terrain errors are not a significant component of the total scene geolocation error, then it will be of little benefit to expend resources to correct these errors.
2. Estimate the expected terrain error in Level 1Gst products. The ability to correct terrain errors should be degraded as absolute geolocation knowledge deteriorates and misregistration between the Landsat image and the elevation data increases. This must be demonstrated and quantified.
3. Compare candidate elevation data sources and identify the preferred source(s) of elevation data for Landsat 7 terrain correction processing.
Measuring terrain displacement errors by direct comparisons of precision corrected Level 1Gp products versus the corresponding precision and terrain corrected Level 1Gt products is practical for only a small number of scenes. In order to apply the terrain error analyses to a larger sample of scenes with varying topographic conditions, it was necessary to develop analytical methods that use nominal Landsat viewing geometry to operate on the terrain data only. The first phase of the study developed this analytical methodology, tested it against results obtained from actual 1Gp vs. 1Gt product comparisons, and then applied it to elevation data spanning the conterminous U.S. The predicted terrain displacement error statistics computed from a selected subset of the 3-arcsecond USGS DEM data were compared to actual image-to-image registration results obtained by generating corresponding 1Gp and 1Gt products on the IAS. The results of this comparison demonstrated the validity of the analytical prediction approach. The terrain error analysis tools were used to assess the impact of terrain height on Level 1G data product accuracy for each CONUS WRS2 scene for which complete DEM coverage was available. This analysis showed that, for much of the test area, the RMS horizontal error in Level 1Gs image products due to terrain displacement

- iv - DCN
is larger than the errors due to spacecraft position and pointing knowledge uncertainty. These terrain-induced errors vary rapidly within a scene, reaching values of many hundreds of meters in some cases. This makes it impossible for data users to apply a simple correction, using a few ground control points to remove a systematic offset. The effective terrain error caused by errors in Level 1Gst image geolocation was estimated by taking the difference, point by point, between the elevation predicted using the slightly erroneous image geolocation and the actual elevation at the true ground location and applying the nominal Landsat viewing geometry. In order to adequately characterize the sensitivity of the terrain-induced horizontal error to the magnitude of the misregistration, Level 1Gst product horizontal error statistics were computed for an array of offset values, increasing in 30-meter increments in both directions, up to a maximum offset of 150 meters. The resulting arrays of RMS and maximum errors were then fit to parametric models as functions of misregistration offset in order to represent the results in a more compact form, and to simplify subsequent analyses of the terrain-induced error. Specifically, combining the RMS and maximum terrain error models with the Landsat 7 horizontal error distribution allows us to compute the statistically expected RMS and maximum errors for each WRS path/row tested. The expected value results show residual terrain errors that are quite small, particularly the RMS error, which is less than 1.5 meters for all scenes in the CONUS test area. To place a more pessimistic bound on the predicted accuracy of 1Gst products, the analytical models were evaluated at a fixed horizontal offset value. Even with 100 meters of misregistration in each direction, the RMS terrain-induced error is less than 4 meters in all cases and the maximum error is less than the typical Landsat 7 geolocation error. These results, based upon the USGS 3-arcsecond DEM data, are confirmed by the corresponding analyses using the SRTM 3- and 1-arcsecond data. The comparisons of the multiple digital elevation data sources were conducted directly on the elevation datasets themselves. Elevation comparisons were made point-by-point with bilinear interpolation used when necessary to compare the 1-arcsecond data to the 3-arcsecond data. The observed elevation differences were summarized in mean, RMS, and maximum difference statistics. The mean offsets were all much less than the expected error in the elevation data, indicating the absence of significant vertical datum discrepancies in any of the datasets tested. All of the datasets appear to contain residual artifacts that, though not numerous, do have a significant effect on the maximum elevation difference statistics. Maximum differences of hundreds of meters were found in all dataset comparisons, including the comparison of 1-arcsecond to 3-arcsecond SRTM data. None of the datasets appear to be 100% trustworthy. This study demonstrated that the excellent absolute geolocation performance of Landsat 7 has raised the relative importance of terrain-induced errors as a limiting factor in overall Level 1Gs product accuracy. Systematic terrain correction processing can substantially reduce the effects of terrain errors in the 1Gs imagery but, although the statistically averaged performance can be expected to be very good, selected areas will still exhibit significant terrain-induced horizontal errors due to image/DEM

- v - DCN
misregistration and/or elevation data errors and artifacts. Higher resolution 1-arcsecond elevation data appear to confer no particular benefit to 1Gst processing. The selection of an elevation data source should be based on other criteria - the availability, accuracy and reliability of the source, rather than its resolution. Given the high accuracy and resolution of the NED, there is probably no reason to favor the SRTM 1-arcsecond data for use in the U.S. The finished 3-arcsecond SRTM data will undoubtedly be the preferred source of elevation data elsewhere, as it becomes available. Keywords: Landsat, terrain, DEM, SRTM, NED, GTOPO30.

- vi - DCN
Document Change Summary
List of Effective Pages
Page Number Issue All
Original
Document History
Document Number Status/Issue Publication Date Change Number ?
Original May 31, 2003
N/A

- vii - DCN
Contents
Executive Summary ..................................................................................................... iii Document Change Summary ...................................................................................... vi Contents....................................................................................................................... vii List of Figures .............................................................................................................. ix List of Tables ................................................................................................................ ix Section 1 Introduction.............................................................................................. 1
1.1 Background....................................................................................................... 1 1.2 Scope of Study.................................................................................................. 1 1.3 Document Organization .................................................................................... 2
Section 2 Study Objectives...................................................................................... 3 2.1 Quantify the Terrain Error in Level 1Gs Products ............................................. 3 2.2 Estimate the Expected Terrain Error in Level 1Gst Products ............................ 3 2.3 Compare Candidate Elevation Data Sources.................................................... 4
Section 3 Evaluating Level 1Gs Product Terrain Error ......................................... 5 3.1 Approach........................................................................................................... 5 3.2 Input Data ......................................................................................................... 6 3.3 Analysis Tools................................................................................................... 7 3.4 Data Processing................................................................................................ 9 3.5 Results ............................................................................................................ 10
Section 4 Estimating Level 1Gst Terrain Error..................................................... 14 4.1 Approach......................................................................................................... 14
4.1.1 Terrain Offset Sensitivity Model ............................................................... 15 4.1.2 Expected Values for Terrain Error Statistics ............................................ 16
4.2 Input Data ....................................................................................................... 17 4.3 Analysis Tools................................................................................................. 17 4.4 Data Processing.............................................................................................. 18 4.5 Results ............................................................................................................ 18
4.5.1 Terrain Error Expected Value .................................................................. 19 4.5.2 Terrain Error at a Fixed Horizontal Offset ................................................ 21 4.5.3 Terrain Error After Mean Elevation Correction......................................... 22
Section 5 Comparing Digital Elevation Data Sources ......................................... 25 5.1 Approach......................................................................................................... 25 5.2 Input Data - Elevation Data Sources Evaluated .............................................. 25
5.2.1 USGS 3-Arcsecond Digital Elevation Models .......................................... 25 5.2.2 Shuttle Radar Topography Mission 3-Arcsecond Data ............................ 26 5.2.3 Shuttle Radar Topography Mission 1-Arcsecond Data ............................ 26 5.2.4 National Elevation Dataset 1-Arcsecond Data ......................................... 26
5.3 Analysis Tools................................................................................................. 27 5.4 Data Processing.............................................................................................. 28 5.5 Results ............................................................................................................ 28
5.5.1 USGS DEMs vs. SRTM 3-Arcsecond ...................................................... 28 5.5.2 SRTM 3-Arcsecond vs. SRTM 1-Arcsecond............................................ 30

- viii - DCN
5.5.3 USGS DEMs vs. NED.............................................................................. 33 Section 6 Discussion.............................................................................................. 36
6.1 General Observations ..................................................................................... 36 6.2 Limitations of the Study................................................................................... 36
Section 7 Conclusions and Recommendations................................................... 38 7.1 Value of the Level 1Gst Product ..................................................................... 38 7.2 Recommended Sources of Terrain Data......................................................... 39
Appendix A Analysis Results ................................................................................ 41 Appendix B Acronyms............................................................................................ 49 References................................................................................................................... 50

- ix - DCN
List of Figures
Figure 3-1: RMS Terrain-Induced Horizontal Error for CONUS.................................... 12 Figure 3-2: Maximum Terrain-Induced Horizontal Error for CONUS ............................ 13 Figure 4-1: Plots of RMS and Maximum Terrain Error Models for Path 38 / Row 35 .... 16 Figure 4-2: Expected Values For RMS Terrain Error.................................................... 20 Figure 4-3: Expected Values For Maximum Terrain Error ............................................ 20 Figure 4-4: RMS Terrain Error at 100-meter Along- and Across-Track Offsets............ 21 Figure 4-5: Maximum Terrain Error at 100-meter Along- and Across-Track Offsets .... 22 Figure 4-6: RMS Residual Terrain Error After Correction for Mean Elevation .............. 23 Figure 4-7: Maximum Residual Terrain Error After Correction for Mean Elevation ...... 24 Figure 5-1: RMS Elevation Differences - SRTM vs. USGS DEM Data......................... 29 Figure 5-2: Maximum Elevation Differences - SRTM vs. USGS DEM Data ................. 29 Figure 5-3: RMS Elevation Differences - SRTM 1" vs. 3" Data .................................... 30 Figure 5-4: Maximum Elevation Differences - SRTM 1" vs. 3" Data............................. 31 Figure 5-5: RMS Terrain-Induced Image Difference Due to 1" vs. 3" DEM .................. 32 Figure 5-6: Maximum Terrain-Induced Image Difference Due to 1" vs. 3" DEM .......... 33 Figure A-7-1: RMS Terrain-Induced Horizontal Error for CONUS (SRTM 3" Data)....... 41 Figure A-7-2: Max Terrain-Induced Horizontal Error for CONUS (SRTM 3" Data) ....... 41 Figure A-7-3: Expected RMS Residual 1Gst Terrain Error (SRTM 3" Data).................. 42 Figure A-7-4: Expected Max Residual 1Gst Terrain Error (SRTM 3" Data)................... 42 Figure A-7-5: RMS 1Gst Error with 100-m Horizontal Offset (SRTM 3" Data).............. 43 Figure A-7-6: Max 1Gst Error with 100-m Horizontal Offset (SRTM 3" Data)................ 43 Figure A-7-7: RMS Mean-Elevation Residual Terrain Error (SRTM 3" Data) ................ 44 Figure A-7-8: Max Mean-Elevation Residual Terrain Error (SRTM 3" Data) ................. 44 Figure A-7-9: RMS Terrain-Induced Horizontal Error for CONUS (SRTM 1" Data)...... 45 Figure A-7-10: Max Terrain-Induced Horizontal Error for CONUS (SRTM 1" Data) ..... 45 Figure A-7-11: Expected RMS Residual 1Gst Terrain Error (SRTM 1" Data)............... 46 Figure A-7-12: Expected Max Residual 1Gst Terrain Error (SRTM 1" Data)................ 46 Figure A-7-13: RMS 1Gst Error with 100-m Horizontal Offset (SRTM 1" Data)............ 47 Figure A-7-14: Max 1Gst Error with 100-m Horizontal Offset (SRTM 1" Data)............. 47 Figure A-7-15: RMS Mean-Elevation Residual Terrain Error (SRTM 1" Data) ............. 48 Figure A-7-16: Max Mean-Elevation Residual Terrain Error (SRTM 1" Data) .............. 48 List of Tables
Table 3-1: Elevation Data Handling and Terrain Displacement Analysis Tools.............. 8 Table 3-2: Validation of Predicted RMS Terrain Displacement .................................... 10 Table 3-3: Validation of Predicted Maximum Terrain Displacement............................. 11 Table 4-1: RMS and Maximum Terrain Error Model Fit Statistics ................................ 19 Table 5-1: Elevation Data Comparison Tools............................................................... 27 Table 5-2: NED vs. USGS DEM Comparison Statistics ............................................... 34 Table 5-3: NED vs. SRTM 1" Comparison Statistics .................................................... 35

- 1 - DCN
Section 1 Introduction
1.1 Background The Level 1 Product Generation System (LPGS) was implemented to provide the Landsat 7 Mission with the capability to produce basic (Level 1) radiometrically and geometrically corrected image data products. It has generated Level 1R radiometrically corrected and Level 1Gs systematic geometrically corrected products since the launch of Landsat 7 in 1999. The core image processing software components of the LPGS are shared with the Landsat 7 Image Assessment System (IAS) [1] and include capabilities not exercised in the LPGS implementation. Examples of such capabilities include using ground control points to correct for spacecraft ephemeris and attitude biases, and compensating for terrain elevation effects in the geometric correction process. The Landsat Mission Management Office is considering taking advantage of the latent terrain correction capability of the LPGS to introduce an improved data product that would use digital elevation data to correct the cross-track terrain offsets induced by the Landsat viewing geometry. Terrain corrected products (Level 1Gt) are normally produced using both digital elevation data and ground control points. The ground control is used to precisely register the Landsat image to the ground reference system used by the supporting elevation data. This registers the image and elevation data so that the height of each point in the image can be readily determined. The applicability of the 1Gt production process is limited by the lack of accurate ground control for all but selected areas, and the operational difficulties associated with applying control point processing in the presence of cloud contamination and seasonal change. Fortunately, the excellent absolute geolocation accuracy demonstrated by the Landsat 7 system [2] (and required of the follow-on Landsat Data Continuity Mission) creates the potential for realizing most of the benefits of terrain correction without the use of ancillary ground control. The accuracy of this "systematic" terrain correction will be degraded by errors in the Landsat 7 position and pointing knowledge which will effectively misregister the Landsat 7 image data and the underlying elevation data used to compute the terrain correction. This study seeks to quantitatively analyze the magnitude of the terrain-induced geometric errors in Landsat 7 Level 1Gs data products, and the degree to which these errors could be corrected through the application of such a systematic terrain correction process.
1.2 Scope of Study The purpose of this study is to quantitatively demonstrate the value of terrain correction processing for Landsat 7 image data products, without the benefit of supporting ground control point data. Topics to be considered include the impact of terrain displacements on Landsat 7 product geometric accuracy, the degree to which these displacements can

- 2 - DCN
be corrected in the absence of precision ground control point processing, and the suitability of the several available sources for digital elevation data for purposes of terrain correction processing. The ultimate objective of the study is to assess the potential value of, and provide recommendations on the production process for a new systematic terrain corrected (Level 1Gst) Landsat 7 data product.
1.3 Document Organization Section 1 of this document provides background information on the purpose and scope of the study described herein. Section 2 describes the three specific objectives of the study. The analyses conducted and results obtained for each of the objectives are presented in sections 3, 4, and 5. Section 6 contains a discussion of the analysis results and section 7 presents the recommendations and conclusions drawn from the study. The three "topical" sections: 3, 4, and 5; contain the most significant and illustrative results from the many analyses conducted as part of this study. Appendix A captures the results of the other, supporting analyses, for completeness.

- 3 - DCN
Section 2 Study Objectives The overall objective of this study is to quantitatively evaluate the benefit, or lack thereof, to Landsat 7 product geodetic accuracy of applying terrain correction processing, in the absence of ground control, to systematically corrected (Level 1Gs) image data products. This analysis will then be used to make recommendations concerning the value of a systematically terrain corrected (Level 1Gst) product and the preferred data sources and processing methods to be used in generating such a product. This will be accomplished by addressing the three specific objectives described in the following subsections.
2.1 Quantify the Terrain Error in Level 1Gs Products In order to determine the value of terrain correction processing it is first necessary to quantify the impact of terrain displacement errors in systematically corrected Level 1Gs data products. If terrain errors are not a significant component of the total scene geolocation error, then it will be of little benefit to expend resources to correct these errors. The first objective of this study is to develop a methodology to evaluate the susceptibility of any given Landsat 7 worldwide reference system (WRS) scene to terrain error, to validate this methodology by analyzing actual 1Gs, 1Gp, and 1Gt data products, and to apply this methodology to a representative test area for which digital elevation data are available. The conterminous United States (CONUS) was selected as the test area for this and subsequent analyses due to the availability of digital elevation data sets from multiple sources at multiple resolutions.
2.2 Estimate the Expected Terrain Error in Level 1Gst Products Although it remains to be demonstrated, it is reasonable to assume that the ability to correct terrain errors is degraded as absolute geolocation knowledge deteriorates and misregistration between the Landsat image and the elevation data used to perform the correction increases. Thus, applying terrain correction to data with poor absolute geolocation knowledge yields reduced benefits both because of the impairment of the terrain correction process itself, due to image/elevation misregistration, and because the terrain-induced error component becomes a smaller fraction of the total geolocation error. The latter point is less significant since pointing/ephemeris errors are easily corrected with a small number of ground control points, especially if terrain correction processing has already been applied since this obviates the need to account for control point height. Evaluating the sensitivity of the terrain correction process to errors in the image/elevation registration is the second major objective of this study. This includes computing the terrain correction error introduced by varying levels of horizontal misregistration and developing a model of this terrain correction error as a function of

- 4 - DCN
horizontal offset. This model of terrain correction error can then be used in conjunction with the known Landsat 7 geolocation/geodetic accuracy performance to evaluate the statistically expected terrain correction residual error for Level 1Gst products. Comparing this result to the errors associated with uncompensated 1Gs products will provide a measure of the value of 1Gst processing.
2.3 Compare Candidate Elevation Data Sources Although obtaining any reasonable terrain elevation data is a challenge for most areas of the world, there are a variety of data sources available for the United States. The Landsat 7 characterization and calibration activities conducted on the Image Assessment System (IAS) use the USGS 3-arcsecond Digital Elevation Model (DEM) database as supporting information. These data were used as the fundamental data set and basis of comparison for this study. Since data from the Shuttle Radar Topography Mission (SRTM) are expected to provide the best unclassified global terrain data set available in the coming years, it is of interest to compare these new data to other elevation data sources where possible, and to assess the value of the U.S.-only higher resolution 1-arcsecond version of the SRTM data relative to the global-standard 3-arcsecond data. The potential value of higher resolution elevation data can also be assessed using the 1-arcsecond layer of the National Elevation Dataset (NED). The NED data provide a check on the quality of the SRTM 1-arcsecond data. The objective of this portion of the study will be to identify the preferred source(s) of elevation data for Landsat 7 terrain correction processing.

- 5 - DCN
Section 3 Evaluating Level 1Gs Product Terrain Error Before embarking upon a detailed analysis of the degree to which the geometric effects of terrain displacement can or cannot be removed from Landsat 7 data products, it is prudent to first quantitatively demonstrate whether this terrain error is a problem of sufficient magnitude to be worthy of attention. Measuring terrain displacement errors by direct comparisons of Landsat 7 precision corrected Level 1Gp products versus the corresponding precision and terrain corrected Level 1Gt products is practical for only a small number of scenes. In order to apply this and the subsequent analyses to a larger sample of scenes with varying topographic conditions, it is necessary to develop analytical methods that can operate on the terrain data only, without requiring the actual acquisition and processing of Landsat 7 image data. The first phase of the study developed this analytical methodology, tested it against results obtained from actual 1Gp vs. 1Gt product comparisons, and then applied it to elevation data spanning the conterminous United States (CONUS).
3.1 Approach As a nadir-viewing sensor, the Landsat 7 ETM+ exhibits very little sensitivity to terrain relief in the central portion of its swath. It is only as the ETM+ scans off nadir at the sides of the swath that significant relief displacement is induced. In order to fairly characterize the effects of terrain height variation on Landsat 7 image geometric accuracy it is therefore necessary to examine the full swath width of the ETM+ sensor. A convenient unit of data for assessing terrain effects is thus a full worldwide reference system (WRS) scene. The analysis of 1Gs product terrain-induced error and the subsequent horizontal offset sensitivity studies both used individual WRS path/row scenes as the fundamental unit of data for which terrain error statistics were computed. In order to apply the WRS scene-based terrain analysis, it was first necessary to assemble the elevation data for the scenes to be analyzed. The initial tests used the USGS 3-arc second DEM data as the source of elevation data. Custom software tools ingested and sorted by latitude/longitude the entire 3-arc second data set for CONUS. Another custom tool provided the capability to assemble a single DEM covering a specified WRS-2 path/row by automatically selecting and mosaicking the appropriate 1-degree cells from the 3-arc second data set. This tool also applied the geoid separation correction to create output DEMs referenced to the WGS84 ellipsoid surface. This mosaicking tool creates its output WRS path/row DEM in the Hierarchical Data Format (HDF) so that it will be suitable for terrain correction use by the IAS. This WRS scene DEM assembly capability was subsequently extended to process SRTM 3-arcsecond and 1-arcsecond data as well as NED 1-arcsecond data. The analytical derivation of expected Landsat 7 product terrain displacement error uses the scene-based DEMs as input, applying the nominal ETM+ cross-track viewing geometry and the nominal WRS-2 ground track to compute the horizontal image displacement caused by the terrain height. Initially, this was achieved by computing the

- 6 - DCN
predicted sensor viewing zenith angle at each DEM ground point, performing a test to determine whether the ground point was within the ETM+ field of view, and then using the zenith angle and DEM elevation value to compute the magnitude of the resulting image point displacement. Root mean square and maximum terrain error statistics were computed for all points identified as falling within the sensor field of view. This approach was subsequently modified to perform an initial resampling of the DEM data into the nominal Landsat 7 image along- and across-track coordinate system, trimming the resulting resampled DEM based upon the ETM+ field of view and the nominal length of a WRS scene, and then performing the zenith angle and horizontal displacement computations as before. This was done to facilitate the inclusion of logic to apply along- and across-track offsets to the DEM data so that the same software could support the horizontal offset sensitivity analyses. The results derived by applying the nominal Landsat viewing geometry to the WRS scene-based digital elevation data were validated by processing and testing sample Landsat 7 data products. Five scenes acquired over three different geometric calibration sites were processed to both Level 1Gp and Level 1Gt. The 1Gp/1Gt image pairs were then compared using the IAS image-to-image registration accuracy characterization tools. The resulting misregistration statistics were then compared to the terrain error predictions derived from the analytical method, to verify the analytical approach.
3.2 Input Data The fundamental input data for the terrain displacement analysis was the USGS 3-arcsecond DEM data set. DEM data covering the entire United States are available via FTP from the EDC archive. These data are provided in the ASCII DEM format [3] in files covering 1 degree of latitude by 1 degree of longitude each. Unfortunately, these files use a naming convention based upon the 1:250,000-scale map name for the covered area rather than a system based on geographic coordinates. For example, the 3-arcsecond DEM file covering the eastern half of the 1-degree by 2-degree Sioux Falls 1:250K map is called "sioux_falls-e". This makes identifying all of the data needed to cover a specific geographic area somewhat challenging. To simplify data handling, these ASCII DEM files were converted to a simple, compact binary form, based on the GTOPO30 data format, for internal use. These binary files were also renamed according to the latitude and longitude of the cell northwest corner. This internal format and naming convention was used for all of the elevation data sets analyzed in this study, to facilitate the development of a common suite of analysis tools. For purposes of this analysis, only the DEMs covering the CONUS area were processed. Alaskan data was excluded to avoid the complications associated with the variation in sample spacing with latitude used in those data sets. Hawaii and Puerto Rico were similarly ignored to simplify data handling by maintaining a spatially contiguous test area. The Canadian and Mexican border areas created special

- 7 - DCN
problems since the DEM data coverage does not include cells falling outside the U.S. This led to incomplete coverage for many of the WRS path/row scenes that span the borders. These incomplete coverage scenes were removed from the analysis to avoid biasing the results by using scenes where only part of the swath had elevation data. The USGS DEM data, like the SRTM-derived elevation data, provide elevations relative to a vertical reference datum representing the Earth geoid (nominal mean sea level). In order to use these elevations for satellite applications they must first be converted to heights above the WGS84 Earth ellipsoid. This is achieved by adding the geoid separation (i.e., the vertical offset between the ellipsoid and the geoid) to the DEM elevations. A WGS84 global geoid separation file generated by NIMA at 0.5-degree spacing was used for this purpose. Five Landsat 7 Level 0Rp data products were used to verify the analytical terrain error analysis approach. These data sets covered five of the IAS geometric calibration super sites, where accurate ground control points are available. The Level 0Rp data sets, the IAS ground control libraries, and the 3-arcsecond DEM data for these sites were input to the IAS Level 1Gp and Level 1Gt product generation software. After the analytical method was verified and applied to the CONUS DEM data, the analysis was repeated using the SRTM 1-arcsecond and 3-arcsecond data for the same area. This was intended to expose any dependency of the analysis results on the input data set selected. In fact, all data sets examined yielded essentially the same results for this portion of the study.
3.3 Analysis Tools Several new software tools were developed to facilitate the efficient, automated handling of the DEM data and to perform the terrain displacement sensitivity analysis. A list of these tools, with brief descriptions, is provided in table 3-1. Tool Name Input
Output Function Use
dem2gtopo Input: ASCII DEM file. Output: Binary GTOPO30 elevation data file.
Read USGS ASCII DEM, convert to binary GTOPO30 format, and rename based on NW corner lat/lon.
Ingest, convert, and rename the CONUS USGS 3-arcsecond DEM data set.
srtm2gtopo Input: gzip compressed SRTM elevation data file. Output: Binary GTOPO30 elevation data file.
Read SRTM binary elevation data, rename based on NW rather than SW corner, and construct GTOPO30 header file.
Ingest, rename, and build headers for the SRTM 1" CONUS and 3" North American data sets
gtopogeoid Input: NIMA geoid separation table flat file. Output: Binary GTOPO30 geoid separation data file.
Read the binary NIMA-provided geoid separation file and convert to GTOPO30 format for input/output compatibility with the DEM handling tools.
Prepare the NIMA geoid table for use by the WRS scene DEM assembly tool.

- 8 - DCN
usgsdem Input: WRS path/row numbers, GTOPO30 binary elevation data files, GTOPO30 geoid file. Output: HDF format DEM covering the WRS scene.
Get user-input WRS path/row, compute the whole-degree lat/lon bounds for the scene, extract the 1-degree DEM cells required to cover the scene, mosaic the cells, apply the geoid correction, write out the corrected mosaic in HDF format.
Assemble a WRS scene-based DEM file in the form required for use in the IAS.
terrainmapscene Input: WRS path/row number and corresponding HDF format WRS scene-based DEM. Output: GTOPO30 format array of nominal ETM+ horizontal terrain offsets.
Using the nominal viewing geometry for the specified WRS path/row, convert each elevation in the DEM to the corresponding cross-track horizontal offset, or to a fill value if it is outside the ETM+ field of view. Write the resulting horizontal offset array to a GTOPO30 format file.
Used to visualize the ETM+ horizontal offset effects of an input DEM.
wrsdemshift Input: WRS path/row number and corresponding HDF format WRS scene-based DEM, maximum horizontal misregistration (in meters) to allow, DEM analysis resolution/step size for misregistration. Output: Resampled DEM oriented to nominal along- and across-track viewing geometry, RMS and maximum terrain-induced offsets, parameters of misregistration sensitivity model (see below).
Resample the input HDF geographic arcsecond DEM to the nominal ETM+ field of view at the specified resolution, write the resampled DEM to a GTOPO30 format file, convert the heights in the resampled DEM to corresponding horizontal terrain displacements based upon ETM+ viewing geometry, compute and report RMS and maximum statistics on these displacements. To this was added (for subsequent 1Gst terrain offset sensitivity analysis) the capability to compute elevation errors resulting from systematic misregistration of the resampled DEM with itself, to convert these elevation errors to terrain displacement and compute RMS and maximum displacement statistics at each offset location, fit these RMS and maximum statistics to analytical models of terrain displacement vs. misregistration, report the model coefficients and model fit statistics.
Core analysis tool used to evaluate the predicted 1Gs product terrain-induced error based upon the elevation data covering each WRS scene. Capabilities were subsequently added to support the second phase analysis of terrain displacement sensitivity to misregistration between the image and terrain data.
Table 3-1: Elevation Data Handling and Terrain Displacement Analysis Tools The USGS DEM ("dem2gtopo") and SRTM elevation data ("srtm2gtopo") ingest utilities were used in a one-time pass to convert the incoming ASCII USGS DEM files and binary SRTM height data files to a common internal form based upon the simple GTOPO30 format. Similarly, the "gtopogeoid" utility was used once to convert the NIMA geoid table to the same internal format. This led to the creation of three repositories of

- 9 - DCN
elevation data: one derived from the 3" USGS DEMs, one from the 3" SRTM data, and one from the 1" SRTM data, with supporting geoid separation data. Any of these three repositories could then be selected as the input to the "usgsdem" utility to create geoid-corrected, WRS scene-based, HDF elevation data mosaics on demand. These HDF elevation mosaics were the input to the "terrainmapscene" and "wrsdemshift" analysis tools. The "wrsdemshift" application was the primary analysis tool used to predict and model the terrain-induced horizontal errors in 1Gs and 1Gst data products.
3.4 Data Processing The terrain data analysis tools described above, were initially applied to a selected subset of the 3-arcsecond USGS DEM data. This yielded predicted RMS and maximum terrain displacements for five WRS path/row locations where ground control and elevation data were available to support direct evaluation of 1Gp vs. 1Gt errors. The terrain displacement error statistics predicted by the analytical tool were compared to actual image-to-image registration results obtained by generating corresponding 1Gp and 1Gt products on the IAS. The results of this comparison, detailed in the next section, demonstrated the validity of the analytical prediction approach but highlighted the presence of small band dependencies in the analytical model. This is discussed in the next section. After validating the performance of the analytical approach, the analysis tools were unleashed on the entire 3-arcsecond USGS DEM dataset covering CONUS. After downloading and ingesting (using "dem2gtopo") the CONUS DEM data, the "usgsdem" DEM assembly tool was used to generate geoid-corrected HDF elevation files for each WRS-2 path/row falling entirely within the combined DEM data area. The Landsat terrain error analysis tool "wrsdemshift" was then used to assess the impact of terrain height on Landsat Level 1G data product accuracy for each WRS-2 scene for which complete DEM coverage was available. This analysis excluded some scenes along the Canadian and Mexican borders where required DEM cells falling outside the U.S. were unavailable. For each included WRS path/row, the terrain analysis tool computed the following:
1. The RMS horizontal error that would be introduced into a Level 1G data product if terrain effects were ignored (i.e., the RMS terrain error in a 1Gs product), based on nominal Landsat viewing geometry.
2. The maximum terrain-induced horizontal error in a nominal 1Gs product. 3. The RMS horizontal error introduced if terrain correction were to be applied using
a DEM that was misregistered to the image data. This simulates the effect of imprecise geodetic knowledge in 1Gs data processing (without ground control). This statistic was evaluated at horizontal misregistrations up to +/- 150 meters in both the along- and across-track directions, in increments of 30 meters.
4. The maximum horizontal error introduced if terrain correction were to be applied using a DEM that was misregistered to the image data.
5. The RMS horizontal error introduced if terrain correction were to be applied using the optimum mean elevation plane for the WRS path/row.

- 10 - DCN
6. The maximum horizontal error introduced if terrain correction were to be applied using the optimum mean elevation plane for the WRS path/row.
Items 3-6 above were used to support the subsequent analyses of horizontal misregistration sensitivity and of the potential for removing image scale errors by applying a mean elevation correction. The arrays of data points generated by items 3 and 4 above were reduced to a set of 10 parameters for each scene by fitting the data to a pair of models: one for RMS error as a function of along- and across-track misregistration and one for maximum error as a function of misregistration. Statistics indicating the quality of these model fits were also output for each scene. The results for the 392 WRS-2 scenes in the study area were assembled and loaded into an Excel spreadsheet for display and further analysis.
3.5 Results The results of the comparison between the measured 1Gp to 1Gt image-to-image registration accuracy versus the corresponding analytical predictions for five scenes over geometric calibration sites are shown in tables 3-2 and 3-3. Table 3-2 shows the measured and predicted RMS error statistics. Note that the path 39 / row 37 scene is listed twice. Initially all scenes were analyzed using the panchromatic band (band 8) to perform the image-to-image registration analyses. Although the actual and predicted results were very close, a small bias was evident, with the actual RMSE almost always approximately 1 meter higher than the predicted value. This led to the hypothesis that the location of the panchromatic band at the edge of the ETM+ focal plane gives it slightly asymmetrical ground viewing angles, with slightly higher zenith angles on the western edge of the swath than on the eastern edge. The analytical model is based on the ETM+ optical axis and uses symmetrical viewing angles. In this respect, it better reflects the geometry of band 4. Thinking that the bias may be due to slightly greater sensitivity to terrain at the western edge of the scene in band 8, the test was repeated using band 4. Note that the band 4 results are closer to the predicted value with the prediction lying between the measured results for bands 4 and 8.
Path Row
P2T Line RMSE (Pixels)
P2T Sample RMSE (Pixels)
P2T Net RMSE
(Meters) Predicted RMSE
(Meters) Band 39 37 0.612 3.830 58.185 56.923 8 39 37 0.594 3.714 56.419 56.923 4 39 36 0.627 3.961 60.161 59.262 8 30 33 0.877 4.367 66.813 65.674 8 18 37 0.162 0.884 13.478 12.577 8 18 38 0.064 0.354 5.403 6.028 8
Table 3-2: Validation of Predicted RMS Terrain Displacement

- 11 - DCN
Table 3-3 shows the corresponding comparison for the maximum terrain displacement measurements and predictions. Although the relative magnitudes of the measured maximum errors generally track the predicted values, the correspondence is not as good as for the RMS statistics. This is not surprising for the following reasons:
1. The maximum error is a single point value, based on one worst-case topographic feature, whereas the RMS value is a statistical average of many points and features. Thus, the image-to-image registration test must select the worst-case feature as a test point to achieve the same result as the analytical prediction, which analyzes all points in the DEM.
2. The worst-case point is, because of the ETM+ viewing geometry, found at either the eastern or western edge of the scene, since high terrain displacements are caused by the combination of high elevation and high viewing zenith angle. The predicted values are computed using a nominal ETM+ field of view from the nominal WRS orbit. Actual Landsat 7 acquisitions deviate from this pattern as the spacecraft orbit drifts back and forth across the nominal ground track. A high elevation feature that falls at the edge of the nominal swath can fall outside the field of view in actual images acquired while the orbit has drifted off WRS in the opposite direction. Conversely, a high elevation feature that falls just outside the nominal swath can be included in an actual acquisition.
3. Image windows extracted from the two images being compared are correlated to measure the image-to-image offsets. The correlation process returns the average horizontal offset for the entire image window rather than the displacement of any single point within the window. This tends to smooth out the measured offset values somewhat, depressing the extreme values slightly.
Given these considerations, the differences between the measured and predicted maximum errors are understandable. The correlator averaging phenomenon in particular suggests that the analytical method is a more accurate indicator of the true magnitude of the worst-case terrain displacement than can be achieved through direct image measurement.
Path Row
P2T Line Max Error (Pixels)
P2T Sample Max Error (Pixels)
P2T Net Max Error (Meters)
Predicted Max Error (Meters) Band
39 37 -2.375 -15.066 228.777 319 8 39 37 -2.625 -16.507 250.714 319 4 39 36 -2.340 -15.434 234.158 215 8 30 33 -2.099 -10.139 155.304 152 8 18 37 -0.649 -3.208 49.096 53 8 18 38 -0.251 -1.410 21.487 33 8
Table 3-3: Validation of Predicted Maximum Terrain Displacement Based upon the results of these comparisons, the performance of the analytical method was deemed to be a sufficiently accurate predictor of Landsat 7 image terrain effects to justify proceeding with the large-scale analysis of the CONUS DEM data. Figure 3-1 shows a plot of the predicted RMS terrain error for each WRS scene in the test area.

- 12 - DCN
The plot uses WRS path and row as its horizontal and vertical axes, with the RMS terrain error depicted using the color codes indicated in the scale at the bottom. Note that while much of the eastern portion of the U.S. exhibits RMS terrain effects less than 30 meters (one multispectral pixel), much of the western U.S. has more severe terrain problems, with some scenes exceeding 200 meters of RMS terrain displacement. Even the relatively flat Great Plains region has significant errors due to the cross-track scale errors induced by high mean terrain elevation.
Figure 3-1: RMS Terrain-Induced Horizontal Error for CONUS (Based on USGS 3" DEM Data)
Figure 3-2 shows the corresponding plot for the maximum predicted terrain error. Note that even in the eastern U.S. many scenes exceed 100 meters of terrain error, while in the west, some scenes have offsets larger than 500 meters. These results show that, for much of the CONUS test area, the RMS horizontal error in Level 1Gs image products due to terrain displacement is larger than the errors due to spacecraft position and pointing knowledge uncertainties. Furthermore, these terrain-induced errors vary rapidly within a scene, reaching values of many hundreds of meters in some cases. This makes it impossible for data users to apply a simple correction, using a few ground control points to remove a systematic offset. Terrain correction based upon digital elevation data is required to compensate for this error, which, for many locations, is the
47 45 43 41 39 37 35 33 31 29 27 25 23 21 19 17 15 13 11
27282930313233343536373839404142
WRS Path
WR
S R
ow
RMS Terrain Error (Meters)
0.0-30.0 30.0-60.0 60.0-90.0 90.0-120.0 120.0-150.0 150.0-180.0 180.0-210.0 210.0-240.0

- 13 - DCN
dominant source of horizontal error in Level 1Gs products. This raises the next question to be considered - how much of the benefit of this terrain compensation can be realized by a systematic terrain correction process that does not use ground control points.
Figure 3-2: Maximum Terrain-Induced Horizontal Error for CONUS (Based on USGS 3" DEM Data)
47 45 43 41 39 37 35 33 31 29 27 25 23 21 19 17 15 13 11
27282930313233343536373839404142
WRS Path
WR
S R
ow
Max Terrain Error (Meters)
0.0-90.0 90.0-180.0 180.0-270.0 270.0-360.0 360.0-450.0 450.0-540.0 540.0-630.0 630.0-720.0

- 14 - DCN
Section 4 Estimating Level 1Gst Terrain Error Having addressed the problem of computing the RMS and maximum horizontal errors to be expected in a selected WRS scene if terrain effects are ignored, we now consider the problem of estimating the errors associated with applying terrain correction under conditions in which the image geolocation is not precisely known (i.e., applying terrain correction without ground control). By comparing the error associated with ignoring terrain to the error expected in applying a slightly misregistered terrain correction we can quantify the benefit (or lack thereof) of performing a systematic terrain correction (Level 1Gst processing) for each WRS-2 scene for which we have terrain data.
4.1 Approach The computation of the effective terrain error caused by errors in Level 1Gst image geolocation is straightforward given digital elevation data, presumed to be accurate, for the area in question. The effective height errors are computed by taking the difference between the elevation predicted using the slightly erroneous image geolocation and the actual elevation at the true ground location, for each point in the image product. By assuming that the image geolocation error is primarily a simple horizontal shift, the predicted elevation error can be computed as the difference between each point in the digital elevation data (the true elevation) and the corresponding point a fixed distance away (the mislocated elevation), with the distance determined by the estimated geolocation error. The effect of the 1Gs geolocation error is thus modeled as a misregistration of the digital elevation data with itself. For each pair of along- and across-track misregistration values, the height errors are computed and converted to the corresponding Level 1G product horizontal error, using nominal Landsat viewing geometry as before. Summary RMS and maximum horizontal error statistics are computed and stored for that offset condition. Varying the specified misregistration in a regular pattern creates an array of offsets in both the along- and across-track directions, with summary horizontal error statistics computed at each offset location. In order to adequately characterize the sensitivity of the resulting terrain-induced horizontal error to the magnitude of the misregistration, the offset magnitudes were increased in 30 meter increments in both directions, up to a maximum offset of 150 meters. The 30 meter increment was selected because it represented the finest elevation data resolution available (from the SRTM 1" data) for the test. The maximum offset was selected as three times the expected Landsat 7 one-sigma geolocation error of 50 meters. The input elevation data sets were first resampled into a coordinate system oriented parallel to the Landsat ground track, at 30 meter resolution. This made the subsequent offset and difference computations much more efficient. The predicted Level 1Gst product horizontal error statistics were then computed for each misregistration offset location up to the maximum of 150 meters in each direction. This yielded arrays of RMS and maximum predicted horizontal error as functions of the misregistration offset. These arrays were then fit to parametric models of RMS and maximum error as functions of misregistration offset in order to represent the results in

- 15 - DCN
a more compact form, and to simplify subsequent analyses of the terrain-induced error in conjunction with the expected Landsat 7 geolocation error distribution. These topics are discussed in more detail in the following subsections.
4.1.1 Terrain Offset Sensitivity Model As noted above, the terrain correction errors induced by misregistering the Landsat image with its supported digital elevation data can be directly evaluated at any desired horizontal offset location. This is done by computing the difference in elevation reported from the DEM at its "true" location vs. the elevation reported at the DEM location offset by the specified distance. This elevation "error" is then reduced to the equivalent cross-track horizontal error using the tangent of the local satellite viewing zenith angle. This direct evaluation yields an array of induced terrain correction errors as a function of cross-track and along-track horizontal offset. The resulting tables of RMS and maximum errors can be characterized, to an acceptable level of accuracy, with a relatively simple model (e.g., error as a function of along- and across-track displacement) rather than having to record and manipulate the computed errors for each spatial offset. Through experimentation with a variety of DEM data sets and model parameterization approaches the following functional forms were found to provide the best performance: RMS(x,y) = a0xy + a1x2 + a2y2 + a3(x2 + y2)1/2 Max(x,y) = b0xy + b1x2 + b2y2 + b3(x2 + y2)1/2 + b4(|x| + |y|) + b5(|x| - |y|) where: x = along-track offset in kilometers y = across-track offset in kilometers a0, a1, a2, a3 = RMS error model parameters b0, b1, b2, b3, b4, b5 = Maximum error model parameters The horizontal sensitivity analysis was applied to each WRS path/row in the test area. For each scene analyzed, the following 23 values were captured and recorded:
1. WRS path [1], 2. WRS row [1], 3. RMS terrain displacement error with no horizontal offset (meters) [1], 4. Maximum terrain displacement error with no horizontal offset (meters) [1], 5. Offset search range (meters) [1], 6. Offset search resolution (meters) [1], 7. RMS fit parameters a0, a1, a2, a3 [4], 8. RMS fit quality (model vs. data RMS and maximum difference in meters) [2], 9. Maximum fit parameters b0, b1, b2, b3, b4, b5 [6], 10. Maximum fit quality (model vs. data RMS and maximum difference in meters) [2], 11. Computed optimum mean elevation to use for terrain correction (meters) [1], 12. RMS terrain displacement error (with no horizontal offset) using the optimum
mean elevation [1],

- 16 - DCN
13. Maximum terrain displacement error (with no horizontal offset) using the optimum mean elevation [1].
Items #3 and #4 replicate the computation of predicted Level 1Gs product terrain error described in section 3 of this report. Items #5 through #10 capture the results of the horizontal sensitivity analysis in the form of the model parameter values and model fit statistics for each path/row. Figure 4-1 shows an example of the RMS and maximum terrain error sensitivity models, evaluated using the parameters computed for path 38, row 35.
Figure 4-1: Plots of RMS and Maximum Terrain Error Models for Path 38 / Row 35 Items #11 through #13 provide the results of a simpler terrain correction analysis evaluating the effectiveness of applying the correction based upon a mean elevation for each scene rather than a full resolution, but misregistered elevation model. As a further analysis step, spreadsheet logic was implemented to integrate the RMS and maximum model fit parameters (items #7 and #9 above) against the nominal Landsat 7 1Gs circular error distribution (50 meters 1 σ). This yields the statistically expected values of the RMS and maximum errors over a set of acquisitions with the Landsat 7 error characteristics. The details of this analysis are the topic of the next section.
4.1.2 Expected Values for Terrain Error Statistics In addition to recording the sensitivity of terrain-induced horizontal errors to image geolocation errors in a compact form, the terrain offset sensitivity model functions can be used to analytically derive expected terrain-induced errors using the geolocation
-150
-120 -9
0
-60
-30 0 30 60 90 120
150
-150-130-110-90-70-50-30-101030507090110130150
X-Track Offset (Meters)
A-T
rack
Offs
et (M
eter
s)
RMS Error ModelPath 38 Row 35
2.5-3.02.0-2.51.5-2.01.0-1.50.5-1.00.0-0.5
-150
-120 -9
0
-60
-30 0 30 60 90 120
150
-150-130-110-90-70-50-30-101030507090110130150
X-Track Offset (Meters)
A-T
rack
Offs
et (M
eter
s)
Max Error ModelPath 38 Row 35
65.0-70.060.0-65.055.0-60.050.0-55.045.0-50.040.0-45.035.0-40.030.0-35.025.0-30.020.0-25.015.0-20.010.0-15.05.0-10.00.0-5.0

- 17 - DCN
error distribution. If we assume that the along- and across-track geolocation errors are identically distributed zero mean Gaussian random variables with variance σ2, then we can compute expected values for the terrain error offset sensitivity models. Thus, for a specified circular geolocation error distribution we can derive equations for the expected terrain RMS and maximum errors in terms of the circular error variance. It can be shown that these equations are: E[ RMS(x,y) ] = (a1 + a2) σ2 + a3 sqrt(π/2) σ E[ Max(x,y) ] = (b1 + b2) σ2 + b3 sqrt(π/2) σ + b4 sqrt(8/π) σ where: σ = circular error parameter in kilometers = CE90 / 2.146 a1, a2, a3 = RMS error model parameters as above b1, b2, b3, b4 = Maximum error model parameters as above These equations were applied to the model parameters computed for each WRS path/row in the study area. This yielded the statistically expected values of the RMS and maximum 1Gst terrain error for each WRS path/row in the CONUS test area, making it possible to summarize the terrain-induced error sensitivity for each scene as a pair of representative numbers.
4.2 Input Data The same geoid-corrected elevation data sets described in section 3.2 above were also used to perform the horizontal offset sensitivity analysis. The WRS-based DEM mosaics created by the "usgsdem" tool were the primary input to the analysis process. As was the case for the 1Gs product terrain error prediction, the analysis was repeated using the USGS 3" DEM data, the SRTM 3" elevation data, and the SRTM 1" elevation data.
4.3 Analysis Tools The primary software tools used for the terrain error sensitivity analysis were the "usgsdem" and "wrsdemshift" tools described in section 3.3 above. The "wrsdemshift" tool was augmented with the capability to compute the optimum "mean" correction elevation for each scene, and to compute the RMS and maximum horizontal errors that would result from correcting the entire scene to this optimum elevation. The optimum elevation was computed by weighting each elevation in the input array (after resampling to the 30-meter orbit-oriented coordinate system) by the magnitude of the tangent of the viewing zenith angle at that point. This yields in an optimum elevation that minimizes the RMS terrain-induced error rather than an actual mean elevation for the scene area. The RMS and maximum residual terrain errors resulting from correcting to this optimum elevation provide a measure of the degree to which the 1Gs terrain effects are due to the mean target area elevation rather than local terrain features.

- 18 - DCN
The output of the "wrsdemshift" program was captured in an Excel spreadsheet where the expected value equations, presented in section 4.1.2, were implemented. The spreadsheet was also set up to evaluate the RMS and maximum error models at a set of user specified offset values. Excel also provided a convenient way to plot the analysis results.
4.4 Data Processing Since all three input elevation data sets (USGS DEM, SRTM 3", and SRTM 1") were analyzed, a significant amount of disk storage space was required to manage the input elevation data. The input 1-degree elevation data cells were stored in a compressed (gzip) format but still required 0.8 GB to store the USGSDEM CONUS data, 1.9 GB to store the North American SRTM 3" data, and 7.9 GB to store the CONUS SRTM 1" data. To store the (uncompressed) WRS scene-based elevation mosaics would have required an additional ~25 GB for the 3" USGS and SRTM data (total) and an additional ~114 GB for the 1" SRTM data. To avoid this impact on the available disk resources the "usgsdem" elevation mosaic construction tool was placed inline with the "wrsdemshift" analysis tool so that the WRS scene mosaics were created when needed and then immediately deleted. The analysis task itself was quite computationally intensive, requiring 8 to 9 minutes per WRS path/row on a Silicon Graphics Origin 2000 server with 195 MHz R10000 processors, for the "wrsdemshift" process alone. Thus, the analysis of each of the three input elevation data sets required over 55 hours of processing time. By running two processing streams in parallel this was reduced to approximately 28 hours of processing time per data source. Most of this processing was run during nights and weekends to avoid interfering with other tasks. The processing time for the higher resolution SRTM 1" data was only slightly higher than for the USGS and SRTM 3" data sets since all sources were resampled to 30 meter resolution for the offset analysis computations.
4.5 Results Using analytical models to capture the terrain error horizontal offset sensitivity proved to be very successful, as measured by the accuracy of the model fit to the underlying data, particularly for the RMS statistics. For the 384 WRS path/row scenes analyzed, the poorest model fit to the array of RMS statistics had an RMS fit error of 0.034 meters and a maximum error of 0.081 meters, as shown in table 4-1. The overall average RMS model fit was 0.011 meters. Thus, the analytical model accurately represents the individual RMS computations to approximately 1 centimeter on average, and to better than 10 centimeters in all cases.

- 19 - DCN
Model Worst Scene RMS Fit Error
Worst Scene Maximum Fit Error
Overall RMS Fit Error
RMS Terrain Error 0.034 meters 0.081 meters 0.011 meters Max Terrain Error 4.779 meters 10.780 meters 1.125 meters
Table 4-1: RMS and Maximum Terrain Error Model Fit Statistics (Based on USGS 3" DEM Data)
The maximum model fit did not perform quite as well. The RMS values are statistics computed from the aggregate of the elevation differences at each offset location and would be expected to be a regular and slowly varying function of the offset distance. In contrast, the maximum values represent the single worst-case point at each offset location and would be expected to be more irregular and idiosyncratic. As such, the maximum values are less amenable to a smooth functional fit. Nevertheless, the overall RMS fit accuracy of 1.125 meters (see table 4-1) represents reasonably good performance for most of the scenes analyzed. These fit results, particularly the occasional failure of the maximum error model to completely capture the computed errors, should be kept in mind while interpreting the results of the terrain error analysis.
4.5.1 Terrain Error Expected Value As noted above, using the analytical models to express the sensitivity of the terrain induced errors to horizontal misregistration, provided a basis for the statistical analysis of the terrain errors in conjunction with the observed horizontal accuracy of Landsat 7 Level 1Gs products. Combining the RMS and maximum terrain error models with the Landsat 7 horizontal error distribution allows us to compute the statistically expected RMS and maximum errors for each WRS path/row in the test area. The resulting RMS and maximum error expected values are plotted versus WRS path/row in figures 4-2 and 4-3, respectively. The expected value results show residual terrain errors that are smaller than might have been expected. This is particularly true of the expected RMS error, which is less than 1.5 meters for all scenes in the CONUS test area. The scene average RMS values are suppressed by the combination of two factors: 1) much of the scene is imaged near nadir so even large terrain errors have no effect on horizontal accuracy; and 2) given a 50 meter RMS geolocation accuracy, most scenes are reasonably well registered to the underlying digital elevation data. Thus, many scenes will have very small terrain-induced errors, including the statistically "typical" scene. This does not provide an indication of how large the terrain-induced errors are likely to be in the significant number of scenes with larger than normal geolocation errors.

- 20 - DCN
Figure 4-2: Expected Values For RMS Terrain Error (Based on USGS 3" DEM Data)
Figure 4-3: Expected Values For Maximum Terrain Error (Based on USGS 3" DEM Data)
47 45 43 41 39 37 35 33 31 29 27 25 23 21 19 17 15 13 11
27282930313233343536373839404142
WRS Path
WR
S R
ow
USGS 3" DEMExpected RMS Terrain Error (Meters)
0.0-0.2 0.2-0.4 0.4-0.6 0.6-0.8 0.8-1.0 1.0-1.2 1.2-1.4 1.4-1.6
47 45 43 41 39 37 35 33 31 29 27 25 23 21 19 17 15 13 1127282930313233343536373839404142
WRS Path
WR
S R
ow
USGS 3" DEMExpected Max Terrain Error (Meters)
0.0-5.0 5.0-10.0 10.0-15.0 15.0-20.0 20.0-25.0 25.0-30.0 30.0-35.0

- 21 - DCN
4.5.2 Terrain Error at a Fixed Horizontal Offset To place a more pessimistic bound on the predicted accuracy of 1Gst products, the analytical models were evaluated at horizontal offset values of 100 meters in each direction. This 141.4-meter net horizontal displacement is larger than 98% of all scenes having a 50 meter 1-σ error distribution. Therefore, all but 2% of the 1Gst products generated for each WRS path/row scene should exhibit terrain-induced RMS and maximum errors smaller than these predictions. The results of these 100-meter offset RMS and maximum model evaluations as functions of WRS path and row are shown in figures 4-4 and 4-5.
Figure 4-4: RMS Terrain Error at 100-meter Along- and Across-Track Offsets (Based on USGS 3" DEM Data)
Even with 100 meters of misregistration in each direction, the RMS terrain-induced error is less than 4 meters in all cases. Furthermore, the maximum error is less than the assumed geolocation error. These results, based upon the USGS 3-arcsecond DEM data, are confirmed by the corresponding analyses using the SRTM 3-arcsecond and 1-arcsecond data, particularly in the case of the RMS statistics. The computed maximum terrain-induced errors are somewhat higher in the SRTM 3-arcsecond version and are higher still for the SRTM 1-arcsecond data. In both cases, the worst-case errors are still smaller than the original 100-meter geolocation offset. Plots showing the detailed SRTM results are shown in Appendix A.
47 45 43 41 39 37 35 33 31 29 27 25 23 21 19 17 15 13 11
27
29
31
33
35
37
39
41
WRS Path
WR
S R
ow
USGS 3" DEM RMS Terrain Error (Meters)100 m Offset Along- and Across-Track
0.0-0.5 0.5-1.0 1.0-1.5 1.5-2.0 2.0-2.5 2.5-3.0 3.0-3.5

- 22 - DCN
Figure 4-5: Maximum Terrain Error at 100-meter Along- and Across-Track Offsets
(Based on USGS 3" DEM Data)
4.5.3 Terrain Error After Mean Elevation Correction An alternate way of approaching the systematic terrain correction problem is to correct each 1Gst product to a single optimum mean elevation plane. The mean elevation correction accounts for the low-frequency cross-track scale errors induced by variations in the distance from the Landsat spacecraft to the Earth target, but ignores local terrain relief. This approach will work well in areas such as the Great Plains where the local variations in terrain relief are small compared to the mean elevation above sea level. Using a mean elevation approach has the advantage of being insensitive to horizontal geolocation errors. Since the elevation is constant for the entire image, the amount of terrain correction applied at each point is a function only of viewing geometry, not absolute pointing knowledge. Rather than being the true arithmetic average of the elevations falling within the scene area the “mean” elevation correction value was computed as a weighted average of the elevations with the weights being the tangent of the sensor zenith angle – the conversion factor from height to horizontal terrain displacement – at each point. The mean correction elevation was thus selected to minimize the RMS terrain displacement in the corrected image. The residual terrain errors were then the difference between the
47 45 43 41 39 37 35 33 31 29 27 25 23 21 19 17 15 13 11
27
29
31
33
35
37
39
41
WRS Path
WR
S R
ow
USGS 3" DEM Max Terrain Error (Meters)100 m Offset Along- and Across-Track
0.0-10.0 10.0-20.0 20.0-30.0 30.0-40.0 40.0-50.0 50.0-60.0 60.0-70.0

- 23 - DCN
actual elevation data for a scene and the mean value computed for that scene. The corresponding horizontal terrain displacement error was then computed from these residual terrain errors as before. Figure 4-6 shows a plot of the resulting per scene RMS terrain error as a function of WRS path and row. This plot uses the same color scale as figure 3-1 above, to simplify a direct comparison.
Figure 4-6: RMS Residual Terrain Error After Correction for Mean Elevation Though a significant improvement over applying no terrain correction at all, the mean elevation correction leaves residual RMS errors that are still more than an order of magnitude greater than the 1Gst approach. Similarly, the maximum residual terrain errors, shown in figure 4-7, though an improvement over ignoring terrain effects, still leave terrain-induced errors of hundreds of meters. Interestingly, the improvement in the maximum error statistic is less dramatic than for the RMS error. The worst-case mean elevation RMS error for the CONUS study area is 89 meters versus 235 meters for no terrain correction, whereas the worst-case maximum errors for these two cases are 525 meters and 643 meters, respectively. These compare to RMS errors less than 5 meters and maximum errors less than 100 meters for the 1Gst approach. One secondary advantage of the mean elevation correction approach is that it allows for subsequent precision and terrain correction, so long as the mean elevation value used in the correction is recorded. This after-the-fact terrain correction would be very similar to the 1Gs terrain correction procedure applied by some value added vendors today, requiring only that the mean correction elevation be subtracted from the full resolution
47 45 43 41 39 37 35 33 31 29 27 25 23 21 19 17 15 13 11
27
29
31
33
35
37
39
41
WRS Path
WR
S R
ow
Mean Height RMS Terrain Error (Meters)
0.0-30.0 30.0-60.0 60.0-90.0 90.0-120.0 120.0-150.0 150.0-180.0 180.0-210.0 210.0-240.0

- 24 - DCN
terrain model prior to applying the final terrain correction process. The mean elevation value could easily be added to the product metadata, making this a minor adjustment to these existing value added processes. Doing the same thing for the 1Gst case, though possible, would require providing the entire terrain model used in the 1Gst process along with the image product.
Figure 4-7: Maximum Residual Terrain Error After Correction for Mean Elevation
47 45 43 41 39 37 35 33 31 29 27 25 23 21 19 17 15 13 11
27
29
31
33
35
37
39
41
WRS Path
WR
S R
ow
Mean Height Max Terrain Error (Meters)
0.0-90.0 90.0-180.0 180.0-270.0 270.0-360.0 360.0-450.0 450.0-540.0 540.0-630.0 630.0-720.0

- 25 - DCN
Section 5 Comparing Digital Elevation Data Sources The final set of analyses undertaken in this study focused on the available sources of elevation data in an attempt to identify the advantages and disadvantages of using each for Landsat terrain correction processing. Three data sources: the USGS 3-arcsecond DEM, the SRTM 3-arcsecond, and the SRTM 1-arcsecond data sets, were compared over the entire CONUS test area. A fourth source, the 1-arcsecond National Elevation Dataset (NED) was compared to the USGS DEM and 1-arcsecond SRTM data over a smaller (15 one-degree cells) test area.
5.1 Approach Unlike the WRS scene-based analysis of terrain-induced image displacements, the comparisons of the multiple digital elevation data sources were conducted directly on the elevation datasets, packaged in one-degree in latitude by one-degree in longitude cells. These one-degree cells are the fundamental distribution unit for all three of the primary elevation data sources. Elevation comparisons were made point-by-point with bilinear interpolation used when necessary to compare the 1-arcsecond data to the 3-arcsecond data. The observed elevation differences were summarized in mean, RMS, and maximum difference statistics for each one-degree cell analyzed. In the cases where data at different resolutions were compared, in particular the 1-arcsecond SRTM vs. the 3-arcsecond SRTM and the NED vs. USGS DEM comparisons, the analysis was performed twice - once at the lower resolution, comparing all of the points in the 3-arcsecond data to the corresponding points selected from the 1-arcsecond data; and once at the higher resolution, comparing all of the points in the 1-arcsecond data to the corresponding values interpolated from the 3-arcsecond data. This double comparison helps to separate the effects of data sample spacing from the effects of differences in elevation data source accuracy.
5.2 Input Data - Elevation Data Sources Evaluated Although all of the elevation datasets included in this study have been mentioned previously, a brief description of each data source is provided here to establish the context for the subsequent presentation of the comparison results. These data sources represent the full range of available high-resolution elevation data with sufficient coverage and accuracy to be considered as candidates for operational use in Landsat image product terrain correction.
5.2.1 USGS 3-Arcsecond Digital Elevation Models The USGS 3-arcsecond one-degree digital elevation models (DEMs) were originally produced by the National Imagery and Mapping Agency (NIMA), as a byproduct of their Digital Terrain Elevation Data (DTED) dataset [4]. These data were drawn from a variety

- 26 - DCN
of photogrammetric and cartographic sources and have been in use since the 1980s. The 3-arcsecond DEMs were the source of elevation data for the geometric calibration sites used by the Landsat 7 Image Assessment System (IAS). The USGS DEM data are thought to be accurate to approximately 30-50 meters (RMS).
5.2.2 Shuttle Radar Topography Mission 1-Arcsecond Data The SRTM data were collected using radar interferometric techniques during the STS-99 mission of the Space Shuttle Endeavor during February 2000 [5]. This joint NASA/NIMA project was designed to collect digital elevation data covering the approximately 80% of the Earth's land surface falling between 60 degrees north and 56 degrees south latitude. The original SRTM data were collected in swaths parallel to the shuttle orbit with the majority of the data observed in more than one swath. The original data were processed and mosaicked into one-degree cells, with a 1-arcsecond grid spacing, at the NASA Jet Propulsion Laboratory. These initial "research grade" data, including many void areas and artifacts, were used in this study. These initial data will be refined by product finishing operations at NIMA including filtering, artifact removal, and water body flattening [5]. Only the U.S. portion of the 1-arcsecond data will be made available for public distribution. The remainder of the SRTM dataset will be generalized to 3-arcsecond resolution prior to general availability.
5.2.3 Shuttle Radar Topography Mission 3-Arcsecond Data The SRTM 3-arcsecond data are derived from the original 1-arcsecond data through a generalization process that averages the elevations in each 3-by-3 set of 1-arcsecond grid points corresponding to a single 3-arcsecond grid point [5]. Although this averaging process reduces the RMS noise in the SRTM data the initial 3-arcsecond dataset is based on the unfinished 1-arcsecond data and, so, includes many void areas and artifacts, especially in water areas. The SRTM data used in this study are therefore somewhat less consistent and complete than the final dataset will be once the product finishing operations have been completed. The finished SRTM data are expected to be accurate to approximately 12 meters (RMS).
5.2.4 National Elevation Dataset 1-Arcsecond Data The U.S. Geological Survey assembled the National Elevation Dataset (NED) to provide consistent and complete elevation data coverage for the conterminous United States, Alaska, Hawaii, and Puerto Rico [6]. Though drawn from many sources, including stereophotogrammetric image correlation, Digital Line Graph hypsography layer (i.e., elevation contour) conversion, and high-resolution DEMs delivered in conjunction with the Digital Orthophoto Quadrangle (DOQ) program, the NED data have been converted to use common units, reference systems, and datums and integrated into a seamless nationwide database. These data are available online in user-specified distribution units

- 27 - DCN
through the USGS Seamless Data Distribution System [7]. Although somewhat variable due to the variety of data sources, the NED data are thought to be accurate to approximately 7 meters (RMS) overall.
5.3 Analysis Tools Several new software tools were developed to analyze the outputs created by the "dem2gtopo" and "srtm2gtopo" elevation data ingest tools described in section 3.3. These new tools perform elevation comparison analysis, elevation model differencing, elevation model interpolation, and elevation model resolution reduction. These tools are listed, with brief descriptions, in table 5-1.
Tool Name
Input Output
Function Use
demcomp Input: Two binary GTOPO30 elevation data files to be compared. Output: Mean, RMS, and maximum elevation difference statistics.
Compare two one-degree elevation data cells point by point. Perform bilinear interpolation on the second cell as necessary to match the first cell's resolution. Report mean, RMS, and maximum elevation difference statistics.
Compare corresponding cells from different elevation data sets.
demdiff Input: Two binary GTOPO30 elevation data files to be differenced. Output: Binary GTOPO30 elevation data file containing the elevation differences between the two input files.
Compute the difference between two one-degree elevation data cells. Perform bilinear interpolation on the second cell as necessary to match the first cell's resolution. Create a new binary GTOPO30 elevation data file containing the elevation differences.
Generate an elevation difference cell from the corresponding cells from different elevation data sets.
demdens Input: Binary GTOPO30 elevation data file at 3-arcsecond grid spacing. Output: Binary GTOPO30 elevation data file at 1-arcsecond grid spacing.
Use bilinear interpolation to densify an input 3-arcsecond elevation data cell to create a corresponding 1-arcsecond elevation cell.
Densify a 3-arcsecond elevation cell to 1-arcsecond grid spacing.
optsub Input: Binary GTOPO30 elevation data file at 1-arcsecond grid spacing. Output: Binary GTOPO30 elevation data file at 3-arcsecond grid spacing.
Compute the 3-arcsecond elevation data cell that will yield, through bilinear interpolation, a 1-arcsecond cell that best fits the input 1-arcsecond elevation data. This is a more complex, though not necessarily better, algorithm than the 3x3 averaging used to create the 3-arcsecond SRTM data from the 1-arcsecond SRTM data.
Reduce a 1-arcsecond elevation cell to a corresponding 3-arcsecond cell.
Table 5-1: Elevation Data Comparison Tools

- 28 - DCN
5.4 Data Processing The "demcomp" tool, described above, was applied systematically to compare: 1) the USGS DEM dataset to the SRTM 3-arcsecond data, 2) the SRTM 3-arcsecond dataset to the SRTM 1-arcsecond data (at 3-arcsecond resolution), and 3) the SRTM 1-arcsecond dataset to the SRTM 3-arcsecond data (at 1-arcsecond resolution. Each of these comparisons yielded arrays of mean, RMS, and maximum elevation differences covering the entire CONUS test area. The "demcomp" tool was also applied to the limited (15 cell) sample of NED data to perform three comparisons: 1) the 3-arcsecond USGS DEM data to the 1-arcsecond NED data (at 3-arcsecond resolution), 2) the 1-arcsecond NED data to the 3-arcsecond USGS DEM data (at 1-arcsecond resolution), and 3) the 1-arcsecond NED data to the 1-arcsecond SRTM data. The "demdiff" utility was used to create an elevation difference dataset, representing the difference between the SRTM 1-arcsecond and 3-arcsecond data, covering the CONUS test area. This SRTM difference data (at 1-arcsecond resolution) was processed through the "wrsdemshift" tool to assess the impact on Landsat terrain correction of using the higher resolution version of the SRTM data. The "demdens" and "optsub" tools were used only in limited testing and were not applied systematically to the elevation datasets.
5.5 Results Several common characteristics emerged from the comparisons of the various elevation data sets. First, the mean offsets were all much less than the expected error in the elevation data, indicating that there do not appear to be significant vertical datum discrepancies in any of the datasets tested. Second, all of the datasets appear to contain residual artifacts that, though not numerous, do have a significant effect on the maximum elevation difference statistics. Maximum differences of hundreds of meters were found in all dataset comparisons, including the comparison of 1-arcsecond to 3-arcsecond SRTM data. The fact that these artifacts are few in number is demonstrated by the divergence between the well-behaved RMS difference statistics and the more idiosyncratic maximum differences. Still, none of the datasets appear to be a 100% trustworthy reference. The detailed results of the elevation data comparisons are presented in the following subsections.
5.5.1 SRTM 3-Arcsecond vs. USGS DEMs The RMS and maximum elevation differences measured in the comparison of the 3-arcsecond SRTM data to the USGS DEM data are plotted as functions of cell latitude and longitude in figures 5-1 and 5-2, respectively. These plots are shown in a perspective view to better demonstrate the spiky nature of the differences.

- 29 - DCN
Figure 5-1: RMS Elevation Differences - SRTM vs. USGS DEM Data
Figure 5-2: Maximum Elevation Differences - SRTM vs. USGS DEM Data
125
122
119
116
113
110
107
104
101 98 95 92 89 86 83 80 77 74 71 68
50
46
42
38
34
30
26-200
20406080
100120140
Longitude
Latit
ude
SRTM vs. USGS 3" DEMsRMS Difference (Meters)
0-20 20-40 40-60 60-80 80-100 100-120 120-140
125
122
119
116
113
110
107
104
101 98 95 92 89 86 83 80 77 74 71 68
50
46
42
38
34
30
26-2000
200400600800
10001200
Longitude
Latit
ude
SRTM vs. USGS 3" DEMsMax Difference (Meters)
0-200 200-400 400-600 600-800 800-1000 1000-1200

- 30 - DCN
Although most of the RMS differences are below the 30-50 meter expected accuracy of the USGS DEM data there are a few cells that exhibit much larger errors. Detailed examination of some of these (N45W116 and N49W116) revealed topographic features that appeared to be mislocated by 800-1200 meters. This apparent horizontal error was attributed to the USGS DEM data when examination of the corresponding SRTM and NED data showed the features to be in good agreement in those data sets. Although these were the only cases of apparent blunders that were examined in detail, the frequency of large maximum differences, some over 1000 meters, suggests that they may not be the only serious errors in the USGS 3-arcsecond DEM data. Even though the USGS DEM dataset as a whole appears to generally meet the expected 30-50 meter RMS accuracy, this discovery casts doubt on the desirability of using these data as a source for operational Landsat 7 terrain correction.
5.5.2 SRTM 3-Arcsecond vs. SRTM 1-Arcsecond As noted above, the SRTM 1- and 3-arcsecond datasets were compared at both resolutions. Comparing these data at 3-arcsecond resolution proved to be a largely pointless exercise. Given the fact that these datasets are essentially the same, there are no underlying source data differences to be isolated. All of the differences are solely a result of the resolution reduction operation. The 3-arcsecond comparison is, thus, simply a subset of the 1-arcsecond comparison. The remainder of the discussion will, therefore, focus on the comparison performed at 1-arcsecond resolution.
Figure 5-3: RMS Elevation Differences - SRTM 1" vs. 3" Data
125
122
119
116
113
110
107
104
101 98 95 92 89 86 83 80 77 74 71
49
45
41
37
33
29
25-1
0
1
2
3
4
5
Longitude
Latit
ude
SRTM 1" vs. SRTM 3" DEMsRMS Difference (Meters)
0-1 1-2 2-3 3-4 4-5
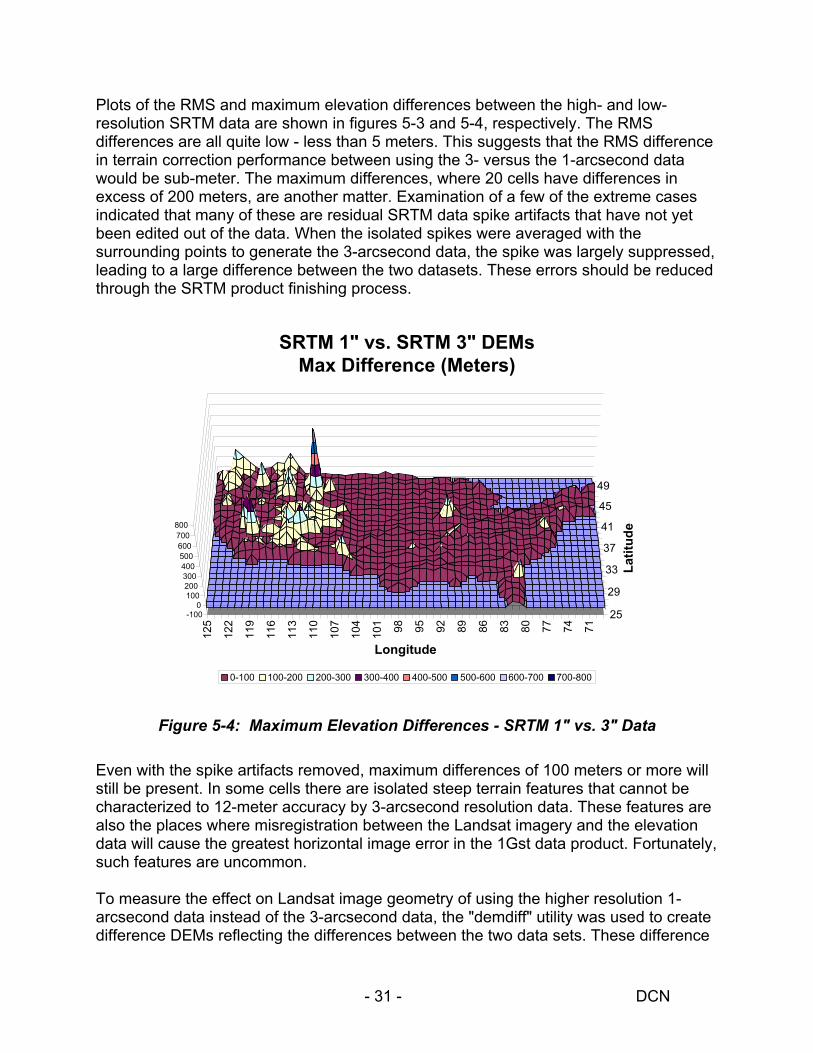
- 31 - DCN
Plots of the RMS and maximum elevation differences between the high- and low-resolution SRTM data are shown in figures 5-3 and 5-4, respectively. The RMS differences are all quite low - less than 5 meters. This suggests that the RMS difference in terrain correction performance between using the 3- versus the 1-arcsecond data would be sub-meter. The maximum differences, where 20 cells have differences in excess of 200 meters, are another matter. Examination of a few of the extreme cases indicated that many of these are residual SRTM data spike artifacts that have not yet been edited out of the data. When the isolated spikes were averaged with the surrounding points to generate the 3-arcsecond data, the spike was largely suppressed, leading to a large difference between the two datasets. These errors should be reduced through the SRTM product finishing process.
Figure 5-4: Maximum Elevation Differences - SRTM 1" vs. 3" Data
Even with the spike artifacts removed, maximum differences of 100 meters or more will still be present. In some cells there are isolated steep terrain features that cannot be characterized to 12-meter accuracy by 3-arcsecond resolution data. These features are also the places where misregistration between the Landsat imagery and the elevation data will cause the greatest horizontal image error in the 1Gst data product. Fortunately, such features are uncommon. To measure the effect on Landsat image geometry of using the higher resolution 1-arcsecond data instead of the 3-arcsecond data, the "demdiff" utility was used to create difference DEMs reflecting the differences between the two data sets. These difference
125
122
119
116
113
110
107
104
101 98 95 92 89 86 83 80 77 74 71
49
45
41
37
33
29
25-1000
100200300400500600700800
LongitudeLa
titud
e
SRTM 1" vs. SRTM 3" DEMsMax Difference (Meters)
0-100 100-200 200-300 300-400 400-500 500-600 600-700 700-800

- 32 - DCN
DEMs were mosaicked into WRS-based units and analyzed using the "wrsdemshift" software to compute the RMS and maximum horizontal image differences induced by the DEM differences. The resulting RMS and maximum horizontal errors are plotted vs. WRS path and row in figures 5-5 and 5-6, respectively.
Figure 5-5: RMS Terrain-Induced Image Difference Due to 1" vs. 3" DEM As predicted from the RMS elevation difference statistics, the corresponding horizontal image differences are sub-meter. This small average effect masks the presence of more significant local distortions, however. As the plot of maximum horizontal differences in figure 5-6 shows, these local offsets range up to 53 meters. Most of the largest differences observed in this test proved to be caused by residual artifacts in the SRTM data. Nevertheless, local image offsets up to 30 meters or so are not uncommon. This reinforces the observation that some terrain features require 1-arcsecond or higher resolution data to be adequately characterized. Interestingly, the resulting image differences, though visible when two terrain corrected images are superimposed, cannot be readily measured in the imagery due to the high spatial frequency of the variations. Any image correlation or other matching system requires an image neighborhood of several pixels to establish a "feature" when identifying and measuring corresponding points in two or more images. In this case, the terrain-induced image variations being examined occur at scales of only 1 or 2 pixels, rendering the standard image correlation-based mensuration methods insensitive to the variations. This suggests that the analytical approach employed in this study may
47 45 43 41 39 37 35 33 31 29 27 25 23 21 19 17 15 13 11
27282930313233343536373839404142
WRS Path
WR
S R
ow
SRTM 3" vs. 1"RMS Terrain Error (Meters)
0.0-0.1 0.1-0.2 0.2-0.3

- 33 - DCN
actually produce a better estimate of the impact of DEM resolution on image geometry than would direct measurements on terrain-corrected images.
Figure 5-6: Maximum Terrain-Induced Image Difference Due to 1" vs. 3" DEM
5.5.3 NED vs. USGS DEMs The comparison of the 1-arcsecond NED data to the USGS 3-arcsecond DEMs was conducted on a limited, 15 one-degree cell area covering the Landsat 7 Southern California geometric calibration site. The results of the point-by-point elevation comparisons for each cell are shown in Table 5-2. Mean, root-mean-square, and maximum elevation differences were computed for each one-degree cell. For the most part, the comparisons show little mean elevation difference suggesting that there is no significant systematic vertical datum offset between these datasets. The RMS difference values are also within the expected accuracy of the USGS DEM data. The more disconcerting aspect of the comparison is the presence of large maximum differences. These maximum differences are greater than 150 meters for every cell examined. While it would be easy to assume that these are due to inaccuracies or artifacts in the less reliable USGS DEM data, closer examination of some of the larger offsets revealed the presence of serious pit artifacts in the NED data. This showed that none of the elevation data sets evaluated in this study were perfect or free from artifacts. Even though the global mean and RMS statistics on the data set comparisons all show good agreement, the worst-case maximum offsets are much larger than would be expected from purely random errors. This is due to the relatively frequent occurrence of artifacts, such as
47 45 43 41 39 37 35 33 31 29 27 25 23 21 19 17 15 13 11
27282930313233343536373839404142
WRS Path
WR
S R
ow
SRTM 3" vs. 1"Max Terrain Error (Meters)
0.0-5.0 5.0-10.0 10.0-15.0 15.0-20.0 20.0-25.0 25.0-30.0 30.0-35.0 35.0-40.0 40.0-45.045.0-50.0 50.0-55.0

- 34 - DCN
spikes, pits, and mislocated features, making it difficult to fully characterize these data sets statistically.
NED vs. USGS DEM
Cell Lat/Lon Mean
Difference (Meters)
RMS Difference (Meters)
Max Difference (Meters)
N33 / W115 -0.225 10.766 208 N33 / W116 -0.789 4.849 175 N33 / W117 -1.525 15.102 175 N34 / W114 10.149 27.624 -323 N34 / W115 4.859 24.308 -360 N34 / W116 3.134 16.835 214 N34 / W117 0.994 27.326 -306 N35 / W114 3.200 25.039 -246 N35 / W115 1.353 17.550 -364 N35 / W116 7.295 19.899 337 N35 / W117 0.464 17.126 -314 N36 / W114 12.299 38.696 -511 N36 / W115 9.112 32.710 -233 N36 / W116 6.217 25.634 402 N36 / W117 5.080 10.003 -395
Table 5-2: NED vs. USGS DEM Comparison Statistics
5.5.4 NED vs. SRTM 1-Arcsecond The 15 one-degree NED cells were also compared to the 1-arcsecond SRTM data, with the results shown in Table 5-3. Once again, the mean differences are small and, in this case, more consistent than in the USGS DEM comparison. The RMS differences are also smaller than those observed in the USGS DEM comparison, as would be expected given the higher accuracy of the SRTM data. Interestingly, large maximum differences are still present, some larger than the corresponding USGS DEM differences. This suggests that the large maximum differences are not due to the difference in resolution between the NED and the USGS DEM data. This also indicates that artifacts are a problem for all of these data sets and that the magnitudes of these artifacts are not necessarily related to the overall accuracy of the valid elevation data. These results indicate that Landsat 7 terrain corrected products generated using either of these elevation data sets would not be significantly different in any global statistical sense but could exhibit significant local differences in specific locations. Given the presence of artifacts in all data sources, it may not be obvious which source is better in any particular case. The SRTM data may become more consistent once the NIMA product finishing operations are completed.

- 35 - DCN
NED vs. SRTM 1" Cell Lat/Lon Mean
Difference (Meters)
RMS Difference (Meters)
Max Difference (Meters)
N33 / W115 -5.144 9.044 160 N33 / W116 -3.181 10.705 -234 N33 / W117 -1.140 16.434 187 N34 / W114 -2.260 4.512 -165 N34 / W115 -1.893 5.355 -197 N34 / W116 -0.979 5.739 -110 N34 / W117 -0.376 8.605 -250 N35 / W114 -1.378 6.055 -323 N35 / W115 0.286 4.486 -173 N35 / W116 0.053 5.804 183 N35 / W117 -0.134 6.228 129 N36 / W114 1.686 11.806 548 N36 / W115 0.888 5.544 -165 N36 / W116 -0.136 5.745 472 N36 / W117 0.509 6.223 -389
Table 5-3: NED vs. SRTM 1" Comparison Statistics

- 36 - DCN
Section 6 Discussion Prior to presenting summary conclusions and recommendations resulting from this study, it may be helpful to discuss several general observations and caveats, to provide a context and to reinforce key points from the analysis results. These items are presented in bullet form in the following subsections.
6.1 General Observations The analytical modeling approach to analyzing the sensitivity of terrain correction accuracy to image/DEM misregistration seemed to work well, especially for the RMS statistics. The predictions of the terrain-induced horizontal error to be expected in Level 1Gs image products showed that this is a serious problem for many scenes. These results were very consistent across all of the elevation data sets analyzed. The RMS error statistics were quite well behaved as the misregistration between the Landsat 7 image and the underlying elevation data increased. No critical misregistration "break point" was evident within the range of offsets anticipated in Landsat 7 data. The maximum error statistics were more idiosyncratic both as they related to the sensitivity to misregistration and to the elevation data comparisons. Thus, while it may be expected that 1Gst products will contain occasional areas with larger than normal terrain-induced errors, where image/DEM misregistration has led to large apparent elevation errors in steep regions, the same thing can happen in 1Gt products. In this case, artifacts in the elevation data can cause significant local displacement of image features, even with perfect image geolocation. None of the elevation data sources is perfect. All will yield artifact-induced image discrepancies somewhere. Direct analysis of the terrain data may be a better way to study the effects of DEM resolution on image product accuracy than assessing the image products directly. The differences between image products created with 1-arcsecond and 3-arcsecond data, for example, are very high frequency and difficult to measure in the imagery.
6.2 Limitations of the Study The study area was limited to CONUS. Other parts of the world may exhibit significantly different terrain regimes leading to either greater or lesser sensitivity to terrain errors and/or to image/elevation data misregistration.

- 37 - DCN
This investigation did not directly address the subject of terrain data accuracy except in a relative sense. The bulk of this analysis assumed that available terrain data were perfect and assessed only the marginal effects of image/terrain data misregistration. In practice, errors in the terrain data cause additional residual horizontal error in the 1Gst (or 1Gt) product. This investigation did not study the effects of larger horizontal misregistrations (e.g., those appropriate for Landsat 5 data).

- 38 - DCN
Section 7 Conclusions and Recommendations The summary conclusions and recommendations arising from this study will be presented in the form of responses to key questions. These questions address the two main topics of this investigation: 1) what is the expected horizontal accuracy performance of a Landsat 7 1Gst product as compared to the current 1Gs product, and 2) what are the relative merits and/or problems with the various sources of elevation data currently available to support 1Gst product generation.
7.1 Value of the Level 1Gst Product How bad is the terrain problem in 1Gs?
• More than 40% of scenes in the CONUS test area have RMS terrain errors larger than the Landsat 7 RMS geolocation error => terrain is the dominant source of horizontal error 40% of the time.
• More than 75% of scenes in the CONUS test area have maximum terrain errors larger than the Landsat 7 RMS geolocation error => terrain is a significant source of horizontal error in 3 out of 4 scenes.
• Terrain error is always there unless compensated. Geolocation error is random and is quite small in many scenes. It is also easily corrected, even by relatively unsophisticated users, requiring a small number of ground control points to remove the residual ephemeris and attitude biases. Many GIS users have existing cartographic base data that can be used for this purpose. Terrain error is present even in scenes with perfect geolocation and requires a full terrain model to correct.
The excellent absolute geodetic accuracy/geolocation performance of Landsat 7 has raised the relative importance of terrain-induced errors as a limiting factor in overall Level 1Gs product accuracy. How much improvement can we expect from 1Gst?
• More than might have been expected. Residual terrain error is small, especially in the RMS sense (< 5 meters). Even the maximum errors are small most of the time (< 30 meters 80% of the time).
• Largest residual errors are often in remote places – areas subject to image/terrain misregistration error are steep and high and, often, remote and lacking in planimetric features => horizontal errors have less impact on many applications.
• 1Gst correction should eliminate or reduce the dominant source of horizontal geometric error in many Landsat 7 systematic products.
• These benefits are made possible because of the Landsat 7 geolocation accuracy.
Systematic terrain correction processing can substantially reduce the effects of terrain errors in the 1Gs imagery. Although the statistically averaged performance can be expected to be very good, selected areas will still exhibit significant terrain-induced

- 39 - DCN
horizontal errors due to image/DEM misregistration and/or elevation data errors and artifacts. What are the pros and cons of a 1Gst product?
• Pro: GIS-ready - Relatively easy to produce (quite easy once supporting elevation data are assembled) and much more “GIS-friendly” than traditional 1Gs products.
• Pro: Large area analysis - Makes cross-path analysis and creating mosaics of large areas much easier by correcting most of the terrain-induced distortions at WRS path boundaries.
• Pro: LDCM pathfinder - Prepares user community for LDCM products, which will (likely) require terrain correction to achieve band-to-band registration (like EO-1 ALI).
• Con: Substitution effect - A 1Gst with subsequent control point correction is not as accurate as a 1Gt product but should be easier (and cheaper?) to produce, undermining the market for the superior 1Gt product.
• Con: Requires user education - 1Gst products may give a false impression appearing to be highly accurate most places, after the application of two or three control points to remove the geolocation biases, but may still have terrain-induced errors of tens of meters in some places due to the original image/terrain data misregistration.
• Con: Value added industry impact – Makes subsequent precision/terrain correction more difficult. Could be perceived as intruding on value-added industry’s sphere if distributed to non-government users.
The problems associated with residual horizontal error due to DEM errors or artifacts, and the application of subsequent value-added precision/terrain refinement processing, could be at least partially addressed by including the DEM data used to perform the 1Gst correction with the product. Technically, the Level 1Gst product appears to be quite attractive. Most of the obvious disadvantages are more programmatic than technical.
7.2 Recommended Sources of Terrain Data What are the benefits of 1-arcsecond versus 3-arcsecond resolution DEM data for Landsat terrain correction?
• The answer to this question may be slightly different for 1Gst processing than for 1Gt processing. The increased resolution of the 1-arcsecond data does yield more accurate elevations and improved terrain correction accuracy but also seems to increase the sensitivity to image/DEM misregistration somewhat. This obviates the benefits of the higher resolution data for 1Gst products. There is no compelling evidence that, given the expected Landsat 7 geolocation errors, 1-arcsecond data will lead to more accurate 1Gst data products than will 3-arcsecond data.

- 40 - DCN
• The existing 3-arcsecond USGS DEM data have (horizontal) accuracy problems that make them undesirable as an operational source for 1Gst elevation data. The NED is the preferred data source for this reason, not because of its higher resolution.
Higher resolution 1-arcsecond elevation data appear to confer no particular benefit to 1Gst processing. The selection of an elevation data source should be based on other criteria - the availability, accuracy and reliability of the source, rather than its resolution. Should SRTM data be used as the standard Landsat elevation data source?
• While the SRTM data appear to be a promising future source of elevation data for areas outside the United States, the current, research grade data, have too many void areas and artifacts to be appealing as an operational data source where reasonable alternatives (e.g., NED) exist.
• The 3-arcsecond SRTM data represent a giant leap forward in comparison to the GTOPO30 data that currently provide the only generally available source of global elevation data. The public release of these data will be eagerly awaited.
Given the high accuracy and resolution of the NED, there is probably no reason to favor the SRTM 1-arcsecond data for use in the U.S. The finished 3-arcsecond SRTM data will undoubtedly be the preferred source of elevation data elsewhere, as it becomes available. Should the USGS 3" DEMs be replaced?
• Large topographic features that are horizontally mislocated by 1 kilometer should not be tolerated when better data are readily available. The existing 3-arcsecond USGS DEM data should be considered obsolete given the existence of the NED.
• There is value in a somewhat lower resolution elevation data set, particularly for satellite applications where large areas are routinely analyzed and manipulated.
• The SRTM 3-arcsecond data will fill this role for those parts of the world where it is available. Due to the collection strategy employed (minimizing collection where other good sources of elevation data were known to be available) the U.S. SRTM coverage has more and larger void areas than should be common elsewhere, making its use somewhat problematic.
• Superficially, it does not appear as though it should be a terribly difficult task to create a 3-arcsecond version of the NED from the existing database.
Perhaps the finished version of the 3-arcsecond SRTM data will ultimately fill this role or maybe a 3-arcsecond NED layer should be considered but, one way or another, the existing 3-arcsecond DEM data should be replaced.

- 41 - DCN
Appendix A Analysis Results
This appendix contains the analysis result plots for the SRTM 3-arcsecond and 1-arcsecond data sets, corresponding to the figures derived from the USGS 3-arcsecond DEM data presented in sections 3 and 4.
Figure A-7-1: RMS Terrain-Induced Horizontal Error for CONUS (SRTM 3" Data)
Figure A-7-2: Max Terrain-Induced Horizontal Error for CONUS (SRTM 3" Data)
47 45 43 41 39 37 35 33 31 29 27 25 23 21 19 17 15 13 11
27282930313233343536373839404142
WRS Path
WR
S R
ow
RMS Terrain Error (Meters)
0.0-30.0 30.0-60.0 60.0-90.0 90.0-120.0 120.0-150.0 150.0-180.0 180.0-210.0 210.0-240.0
47 45 43 41 39 37 35 33 31 29 27 25 23 21 19 17 15 13 11
27282930313233343536373839404142
WRS Path
WR
S R
ow
Max Terrain Error (Meters)
0.0-90.0 90.0-180.0 180.0-270.0 270.0-360.0 360.0-450.0 450.0-540.0 540.0-630.0 630.0-720.0

- 42 - DCN
Figure A-7-3: Expected RMS Residual 1Gst Terrain Error (SRTM 3" Data)
Figure A-7-4: Expected Max Residual 1Gst Terrain Error (SRTM 3" Data)
47 45 43 41 39 37 35 33 31 29 27 25 23 21 19 17 15 13 11
27282930313233343536373839404142
WRS Path
WR
S R
ow
SRTM 3" DEMExpected RMS Terrain Error (Meters)
0.0-0.2 0.2-0.4 0.4-0.6 0.6-0.8 0.8-1.0 1.0-1.2 1.2-1.4 1.4-1.6
47 45 43 41 39 37 35 33 31 29 27 25 23 21 19 17 15 13 11
27282930313233343536373839404142
WRS Path
WR
S R
ow
SRTM 3" DEMExpected Max Terrain Error (Meters)
0.0-5.0 5.0-10.0 10.0-15.0 15.0-20.0 20.0-25.0 25.0-30.0 30.0-35.0 35.0-40.0 40.0-45.0 45.0-50.0

- 43 - DCN
Figure A-7-5: RMS 1Gst Error with 100-m Horizontal Offset (SRTM 3" Data)
Figure A-7-6: Max 1Gst Error with 100-m Horizontal Offset (SRTM 3" Data)
47 45 43 41 39 37 35 33 31 29 27 25 23 21 19 17 15 13 11
27
29
31
33
35
37
39
41
WRS Path
WR
S R
ow
SRTM 3" DEM RMS Terrain Error (Meters)100 m Offset Along- and Across-Track
0.0-0.5 0.5-1.0 1.0-1.5 1.5-2.0 2.0-2.5 2.5-3.0 3.0-3.5
47 45 43 41 39 37 35 33 31 29 27 25 23 21 19 17 15 13 11
27
29
31
33
35
37
39
41
WRS Path
WR
S R
ow
SRTM 3" DEM Max Terrain Error (Meters)100 m Offset Along- and Across-Track
0.0-10.0 10.0-20.0 20.0-30.0 30.0-40.0 40.0-50.0 50.0-60.0 60.0-70.0 70.0-80.0
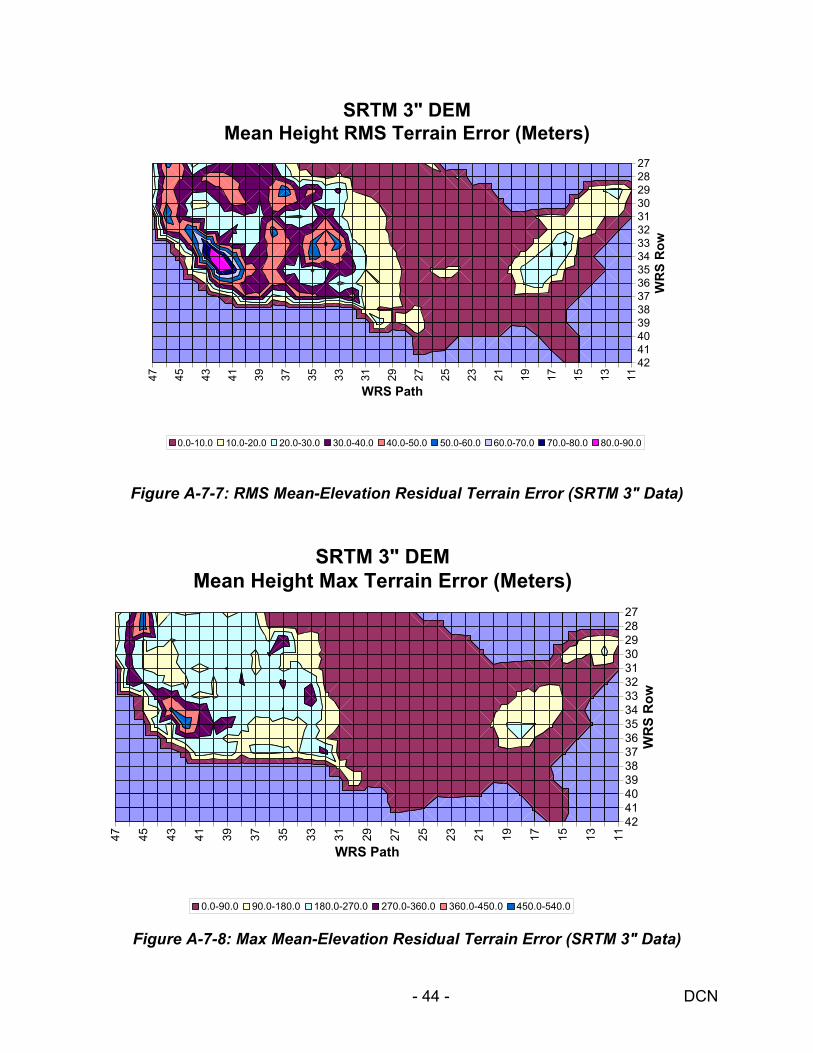
- 44 - DCN
Figure A-7-7: RMS Mean-Elevation Residual Terrain Error (SRTM 3" Data)
Figure A-7-8: Max Mean-Elevation Residual Terrain Error (SRTM 3" Data)
47 45 43 41 39 37 35 33 31 29 27 25 23 21 19 17 15 13 11
27282930313233343536373839404142
WRS Path
WR
S R
ow
SRTM 3" DEMMean Height RMS Terrain Error (Meters)
0.0-10.0 10.0-20.0 20.0-30.0 30.0-40.0 40.0-50.0 50.0-60.0 60.0-70.0 70.0-80.0 80.0-90.0
47 45 43 41 39 37 35 33 31 29 27 25 23 21 19 17 15 13 1127282930313233343536373839404142
WRS Path
WR
S R
ow
SRTM 3" DEMMean Height Max Terrain Error (Meters)
0.0-90.0 90.0-180.0 180.0-270.0 270.0-360.0 360.0-450.0 450.0-540.0

- 45 - DCN
Figure A-7-9: RMS Terrain-Induced Horizontal Error for CONUS (SRTM 1" Data)
Figure A-7-10: Max Terrain-Induced Horizontal Error for CONUS (SRTM 1" Data)
47 45 43 41 39 37 35 33 31 29 27 25 23 21 19 17 15 13 11
27282930313233343536373839404142
WRS Path
WR
S R
ow
SRTM 1" DEMRMS Terrain Error (Meters)
0.0-30.0 30.0-60.0 60.0-90.0 90.0-120.0 120.0-150.0 150.0-180.0 180.0-210.0 210.0-240.0
47 45 43 41 39 37 35 33 31 29 27 25 23 21 19 17 15 13 1127282930313233343536373839404142
WRS Path
WR
S R
ow
SRTM 1" DEMMax Terrain Error (Meters)
0.0-90.0 90.0-180.0 180.0-270.0 270.0-360.0 360.0-450.0 450.0-540.0 540.0-630.0 630.0-720.0

- 46 - DCN
Figure A-7-11: Expected RMS Residual 1Gst Terrain Error (SRTM 1" Data)
Figure A-7-12: Expected Max Residual 1Gst Terrain Error (SRTM 1" Data)
47 45 43 41 39 37 35 33 31 29 27 25 23 21 19 17 15 13 11
27282930313233343536373839404142
WRS Path
WR
S R
ow
SRTM 1" DEMExpected RMS Terrain Error (Meters)
0.0-0.2 0.2-0.4 0.4-0.6 0.6-0.8 0.8-1.0 1.0-1.2 1.2-1.4 1.4-1.6
47 45 43 41 39 37 35 33 31 29 27 25 23 21 19 17 15 13 11
27282930313233343536373839404142
WRS Path
WR
S R
ow
SRTM 1" DEMExpected Max Terrain Error (Meters)
0.0-5.0 5.0-10.0 10.0-15.0 15.0-20.0 20.0-25.0 25.0-30.0 30.0-35.0 35.0-40.0 40.0-45.045.0-50.0 50.0-55.0

- 47 - DCN
Figure A-7-13: RMS 1Gst Error with 100-m Horizontal Offset (SRTM 1" Data)
Figure A-7-14: Max 1Gst Error with 100-m Horizontal Offset (SRTM 1" Data)
47 45 43 41 39 37 35 33 31 29 27 25 23 21 19 17 15 13 11
27
29
31
33
35
37
39
41
WRS Path
WR
S R
ow
SRTM 1" DEM RMS Terrain Error (Meters)100 m Offset Along- and Across-Track
0.0-0.5 0.5-1.0 1.0-1.5 1.5-2.0 2.0-2.5 2.5-3.0 3.0-3.5
47 45 43 41 39 37 35 33 31 29 27 25 23 21 19 17 15 13 1127
29
31
33
35
37
39
41
WRS Path
WR
S R
ow
SRTM 1" DEM Max Terrain Error (Meters)100 m Offset Along- and Across-Track
0.0-10.0 10.0-20.0 20.0-30.0 30.0-40.0 40.0-50.0 50.0-60.0 60.0-70.0 70.0-80.0 80.0-90.0

- 48 - DCN
Figure A-7-15: RMS Mean-Elevation Residual Terrain Error (SRTM 1" Data)
Figure A-7-16: Max Mean-Elevation Residual Terrain Error (SRTM 1" Data)
47 45 43 41 39 37 35 33 31 29 27 25 23 21 19 17 15 13 11
27282930313233343536373839404142
WRS Path
WR
S R
ow
SRTM 1" DEMMean Height RMS Terrain Error (Meters)
0.0-10.0 10.0-20.0 20.0-30.0 30.0-40.0 40.0-50.0 50.0-60.0 60.0-70.0 70.0-80.0 80.0-90.0
47 45 43 41 39 37 35 33 31 29 27 25 23 21 19 17 15 13 11
27282930313233343536373839404142
WRS Path
WR
S R
ow
SRTM 1" DEMMean Height Max Terrain Error (Meters)
0.0-90.0 90.0-180.0 180.0-270.0 270.0-360.0 360.0-450.0 450.0-540.0

- 49 - DCN
Appendix B Acronyms
CONUS Conterminous United States
DEM Digital Elevation Model
DLG Digital Line Graph
DTED Digital Terrain Elevation Data
EDC EROS Data Center
EROS Earth Resources Observation Systems
ETM+ Enhanced Thematic Mapper Plus
GIS Geographic Information System
GSFC Goddard Space Flight Center
IAS Image Assessment System
JPL Jet Propulsion Laboratory
L1G Level 1 Geometrically Corrected
L1Gst L1G with Systematic Terrain Correction
L1Gt L1G with Precision and Terrain Correction
L1R Level 1 Radiometrically Corrected
LDCM Landsat Data Continuity Mission
NASA National Aeronautics and Space Administration
NED National Elevation Dataset
NIMA National Imagery and Mapping Agency
RMS Root Mean Square
SRTM Shuttle Radar Topography Mission
STS Space Transportation System
USGS US Geological Survey
WRS Worldwide Reference System

- 50 - DCN
References
1 - J.C. Storey, R.A. Morfitt, and P.R. Thorson, “Image Processing on the Landsat 7 Image Assessment System,” Proceedings of the 1999 American Society for Photogrammetry and Remote Sensing Annual Conference, Portland, Oregon, May 1999, pp. 743-758.
2 - James Storey and Michael Choate, "Landsat 7 on-orbit geometric calibration and performance", Algorithms for Multispectral, Hyperspectral, and Ultraspectral Imagery VI, Sylvia S. Chen, Michael R. Descour, Editors, Proceedings of SPIE Vol. 4049 (2000), pp. 143-154.
3 - U.S. Geological Survey, Digital Elevation Models Data Users Guide, National Mapping Program Technical Instructions, Data Users Guide 5, Department of the Interior, Reston, Virginia, 1990.
4 - U.S. Geological Survey, US GeoData Digital Elevation Models Fact Sheet, April 2000, USGS EROS Data Center, <http://mac.usgs.gov/mac/isb/pubs/factsheets/fs04000.html>.
5 - U.S. Geological Survey, SRTM Documentation, 11/21/2002, USGS EROS Data Center, <ftp://edcftp.cr.usgs.gov/pub/data/srtm/Documentation/..SRTM_Topo_doc>.
6 - U.S. Geological Survey, National Elevation Dataset, 11/6/2002, USGS EROS Data Center, <http://gisdata.usgs.net/NED/About.asp>.
7 - U.S. Geological Survey, Seamless Data Distribution System, 5/2/2003, USGS EROS Data Center, <http://seamless.usgs.gov/>.