Embed Size (px)
Citation preview
U.S. Department of the Interior
U.S. Geological Survey
Landsat – Monitoring our Earth’s
Condition for over 40 years
Thomas Cecere Land Remote Sensing Program
USGS
ISPRS:Earth Observing Data and Tools for Health Studies
Arlington, VA
August 28, 2013
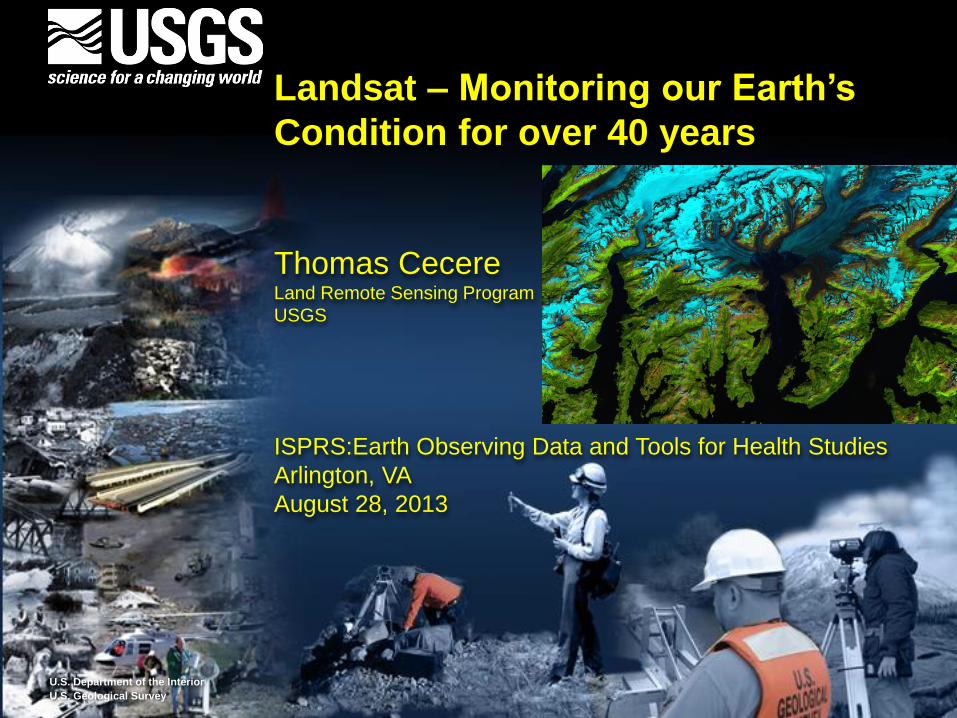
Vicinity Washington DC – August 27, 2013
2km
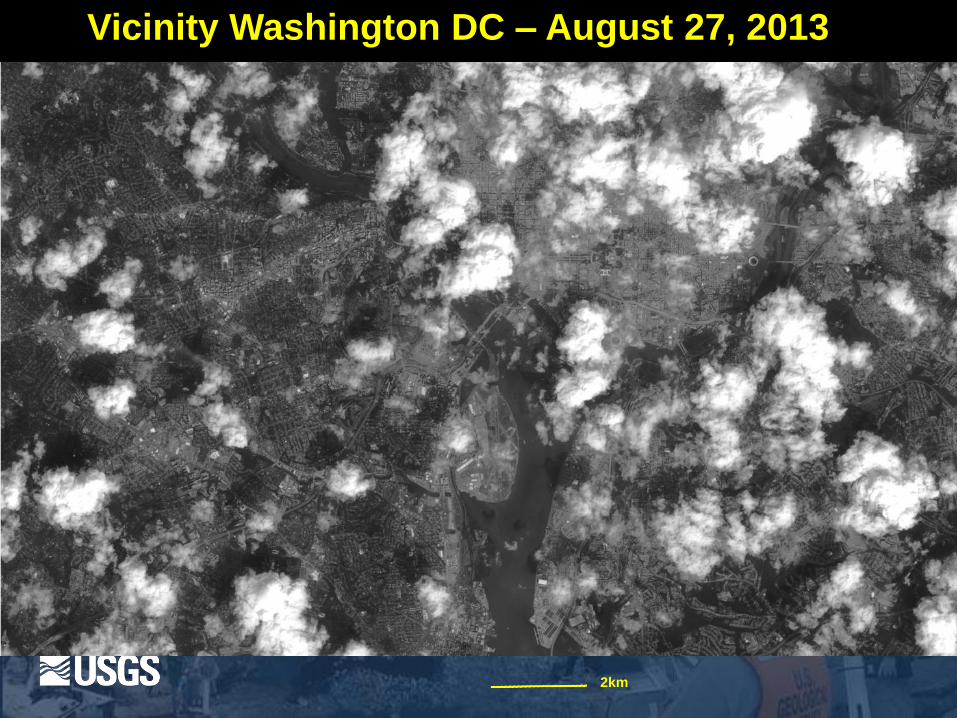
Vicinity Washington DC – August 27, 2013
2km
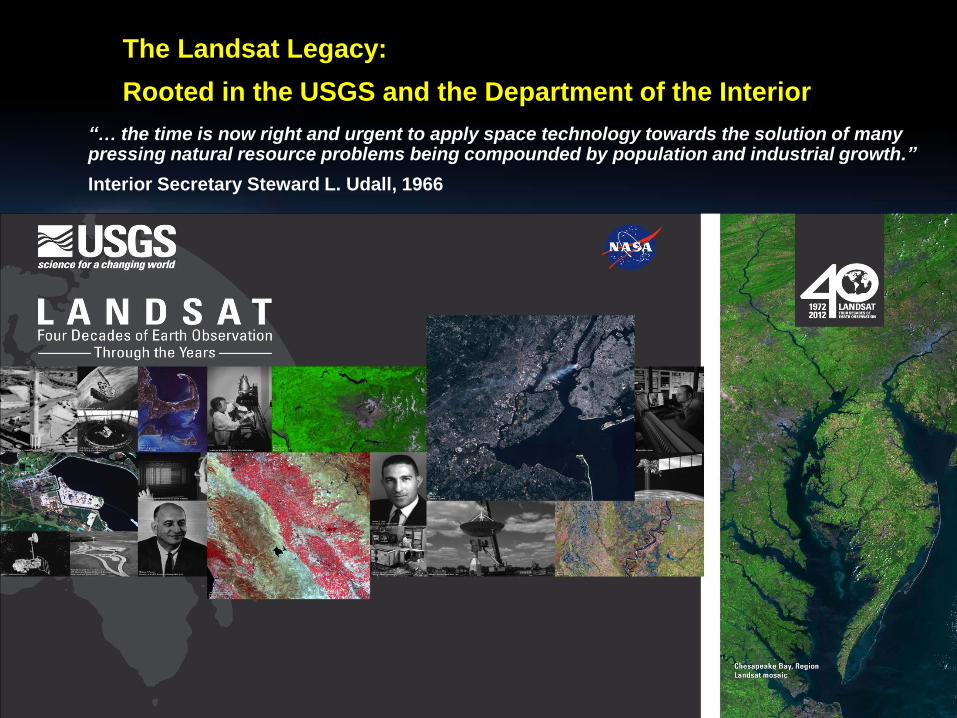
The Landsat Legacy:
Rooted in the USGS and the Department of the Interior
• “… the time is now right and urgent to apply space technology towards the solution of many pressing natural resource problems being compounded by population and industrial growth.”
Interior Secretary Steward L. Udall, 1966
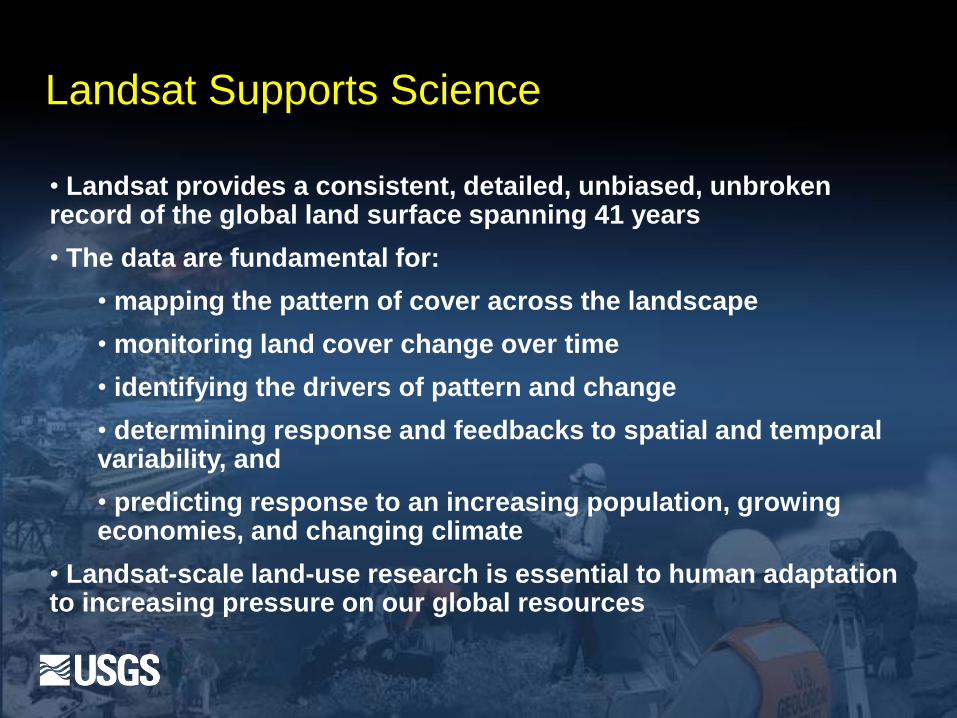
Landsat Supports Science
• Landsat provides a consistent, detailed, unbiased, unbroken record of the global land surface spanning 41 years
• The data are fundamental for:
• mapping the pattern of cover across the landscape
• monitoring land cover change over time
• identifying the drivers of pattern and change
• determining response and feedbacks to spatial and temporal variability, and
• predicting response to an increasing population, growing economies, and changing climate
• Landsat-scale land-use research is essential to human adaptation to increasing pressure on our global resources
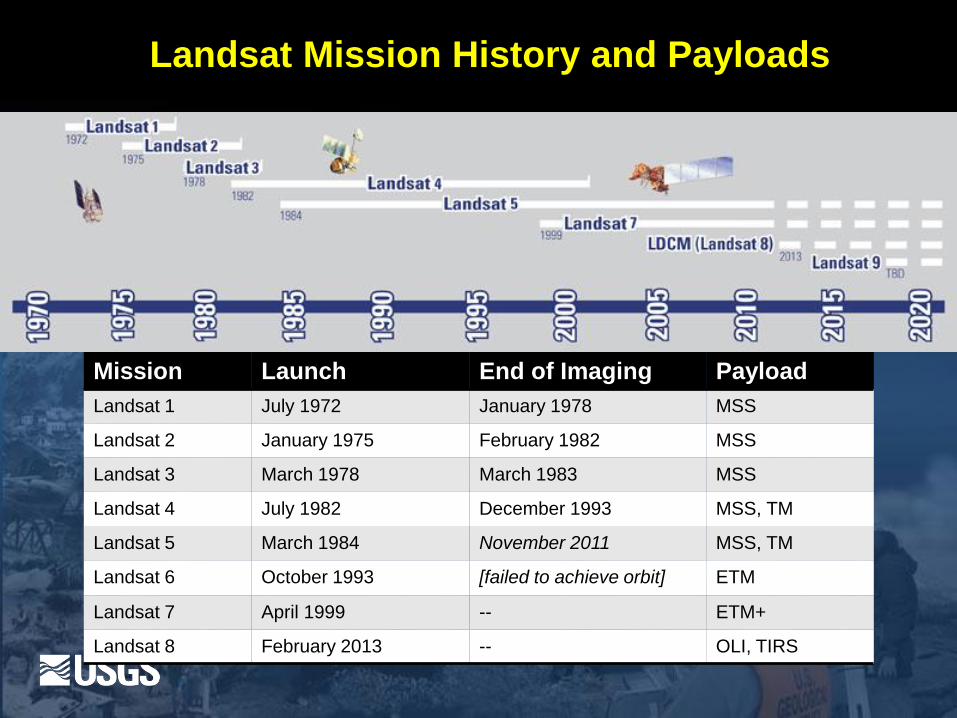
Landsat Mission History and Payloads
Mission Launch End of Imaging Payload
Landsat 1 July 1972 January 1978 MSS
Landsat 2 January 1975 February 1982 MSS
Landsat 3 March 1978 March 1983 MSS
Landsat 4 July 1982 December 1993 MSS, TM
Landsat 5 March 1984 November 2011 MSS, TM
Landsat 6 October 1993 [failed to achieve orbit] ETM
Landsat 7 April 1999 -- ETM+
Landsat 8 February 2013 -- OLI, TIRS
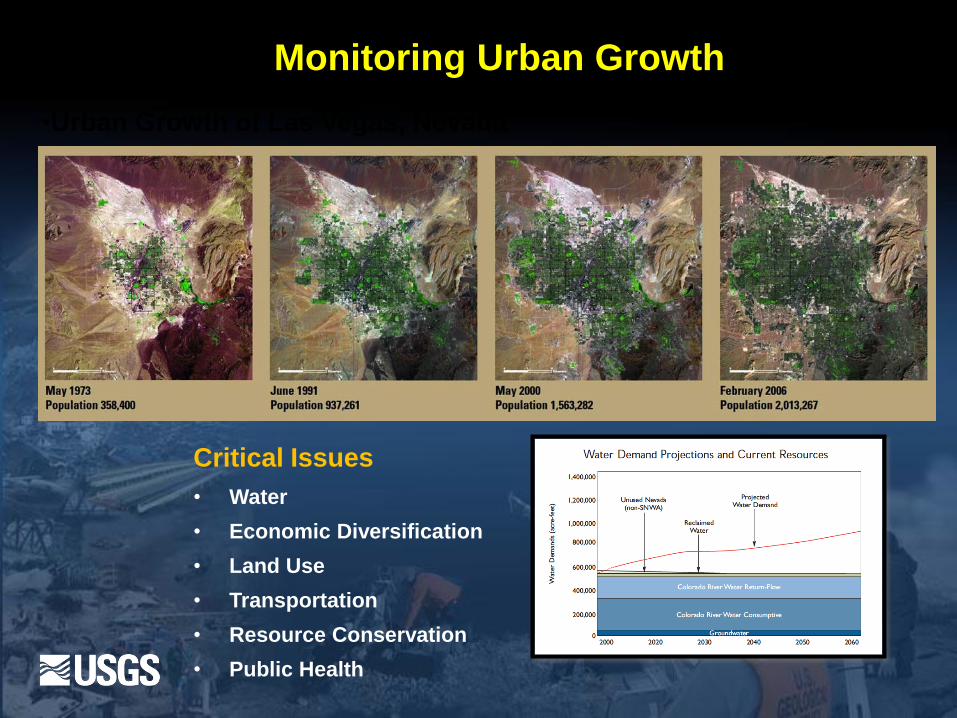
•Urban Growth of Las Vegas, Nevada
Critical Issues
• Water
• Economic Diversification
• Land Use
• Transportation
• Resource Conservation
• Public Health
Monitoring Urban Growth
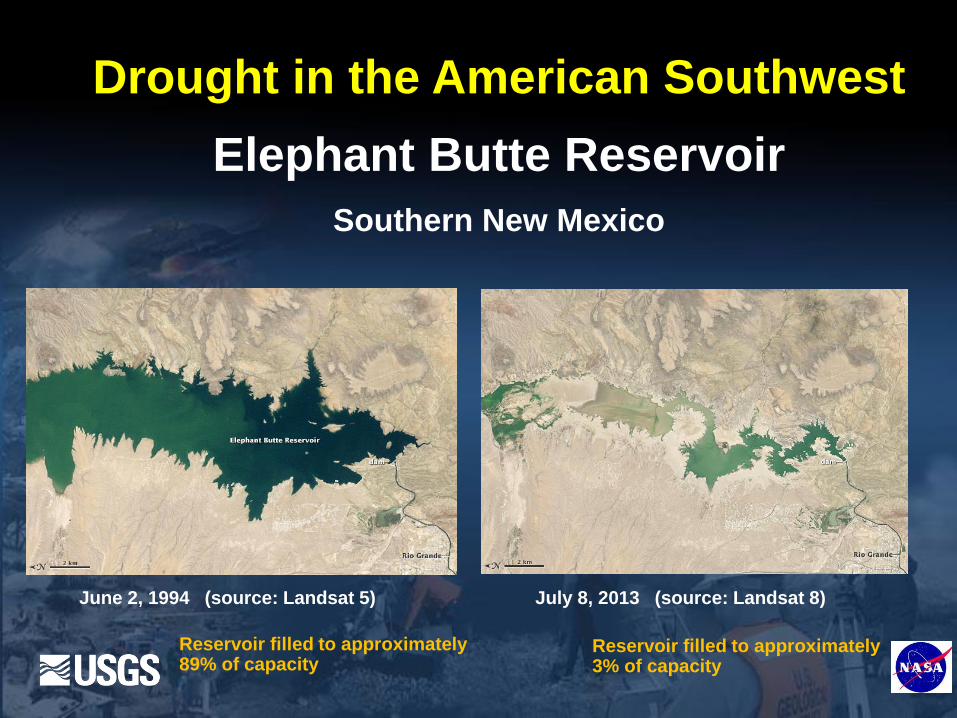
Drought in the American Southwest
Elephant Butte Reservoir
Southern New Mexico
June 2, 1994 (source: Landsat 5) July 8, 2013 (source: Landsat 8)
Reservoir filled to approximately 3% of capacity
Reservoir filled to approximately 89% of capacity
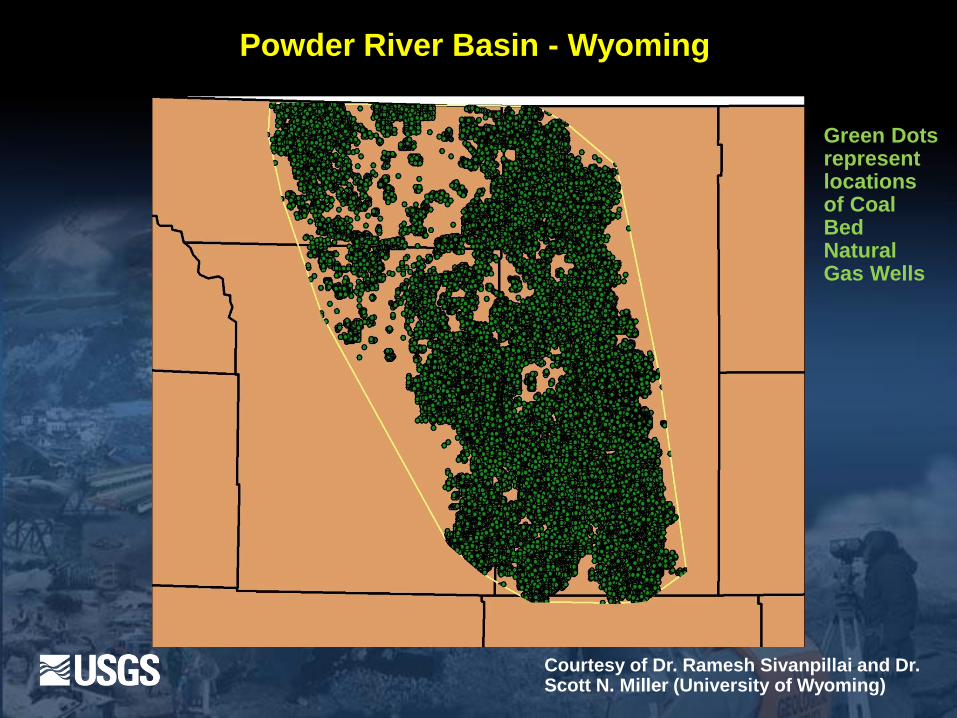
Powder River Basin - Wyoming
Courtesy of Dr. Ramesh Sivanpillai and Dr. Scott N. Miller (University of Wyoming)
Green Dots represent locations of Coal Bed Natural Gas Wells
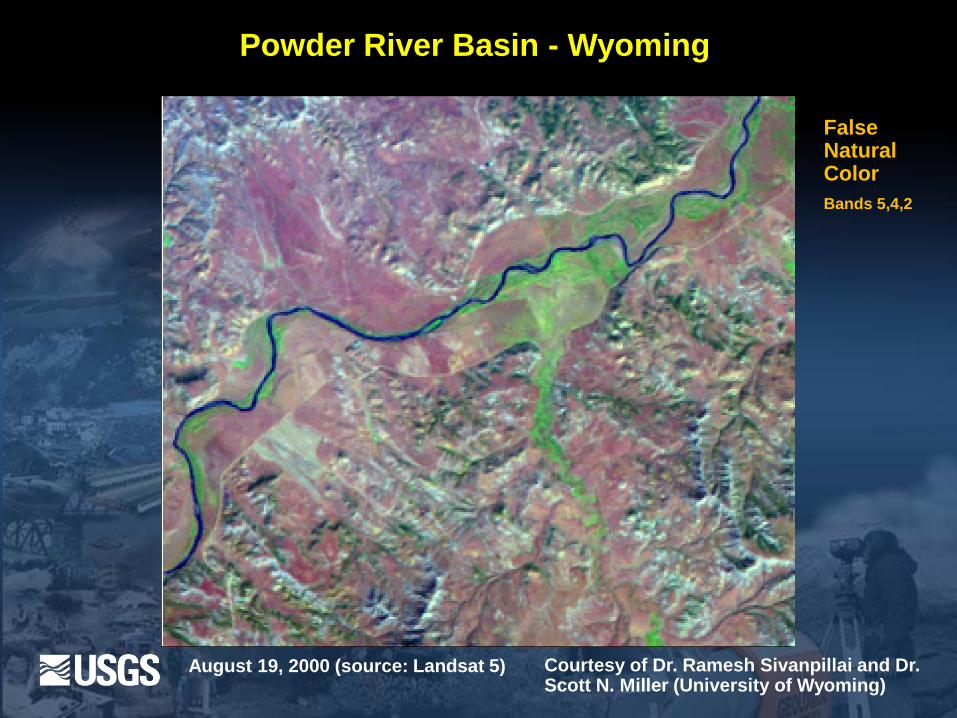
Powder River Basin - Wyoming
Courtesy of Dr. Ramesh Sivanpillai and Dr. Scott N. Miller (University of Wyoming)
False Natural Color
Bands 5,4,2
August 19, 2000 (source: Landsat 5)
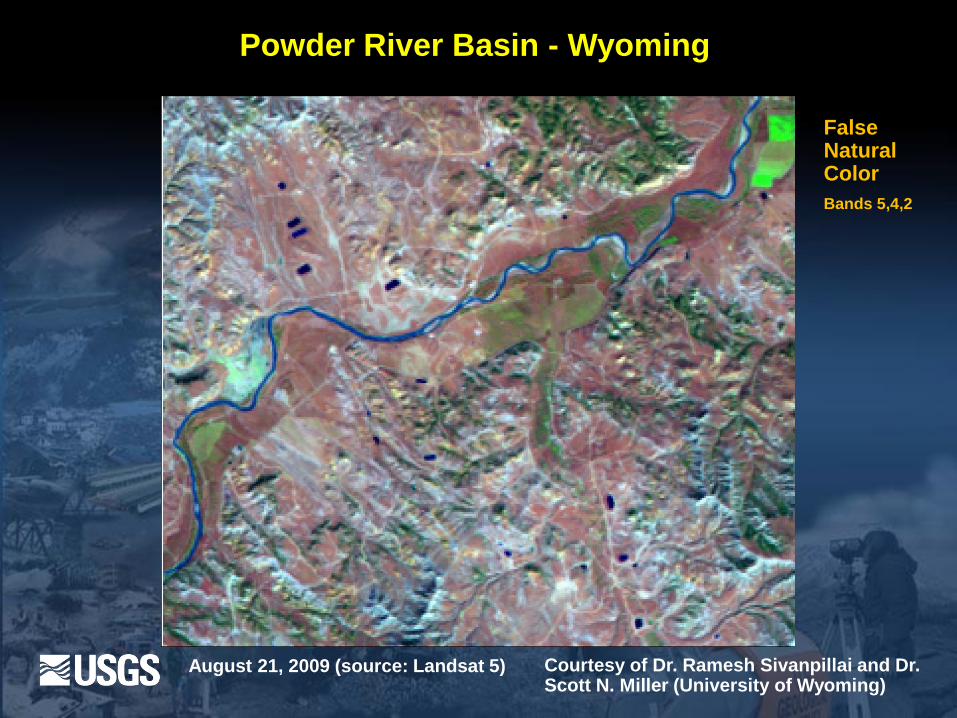
Powder River Basin - Wyoming
False Natural Color
Bands 5,4,2
August 21, 2009 (source: Landsat 5) Courtesy of Dr. Ramesh Sivanpillai and Dr. Scott N. Miller (University of Wyoming)
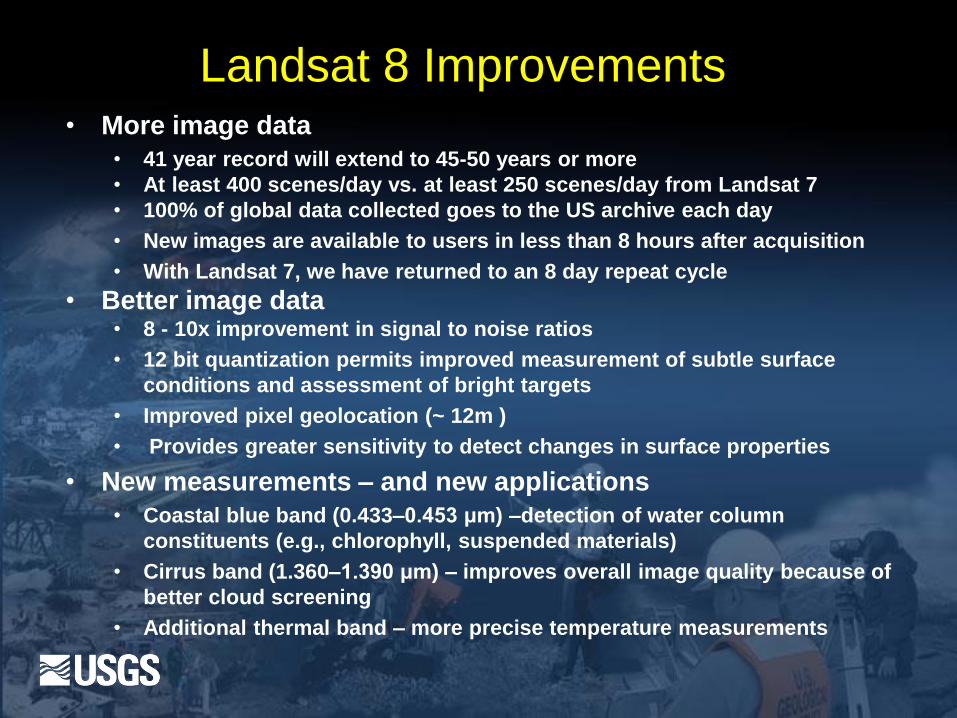
Landsat 8 Improvements • More image data
• 41 year record will extend to 45-50 years or more
• At least 400 scenes/day vs. at least 250 scenes/day from Landsat 7
• 100% of global data collected goes to the US archive each day
• New images are available to users in less than 8 hours after acquisition
• With Landsat 7, we have returned to an 8 day repeat cycle
• Better image data • 8 - 10x improvement in signal to noise ratios
• 12 bit quantization permits improved measurement of subtle surface
conditions and assessment of bright targets
• Improved pixel geolocation (~ 12m )
• Provides greater sensitivity to detect changes in surface properties
• New measurements – and new applications
• Coastal blue band (0.433–0.453 μm) –detection of water column
constituents (e.g., chlorophyll, suspended materials)
• Cirrus band (1.360–1.390 μm) – improves overall image quality because of
better cloud screening
• Additional thermal band – more precise temperature measurements
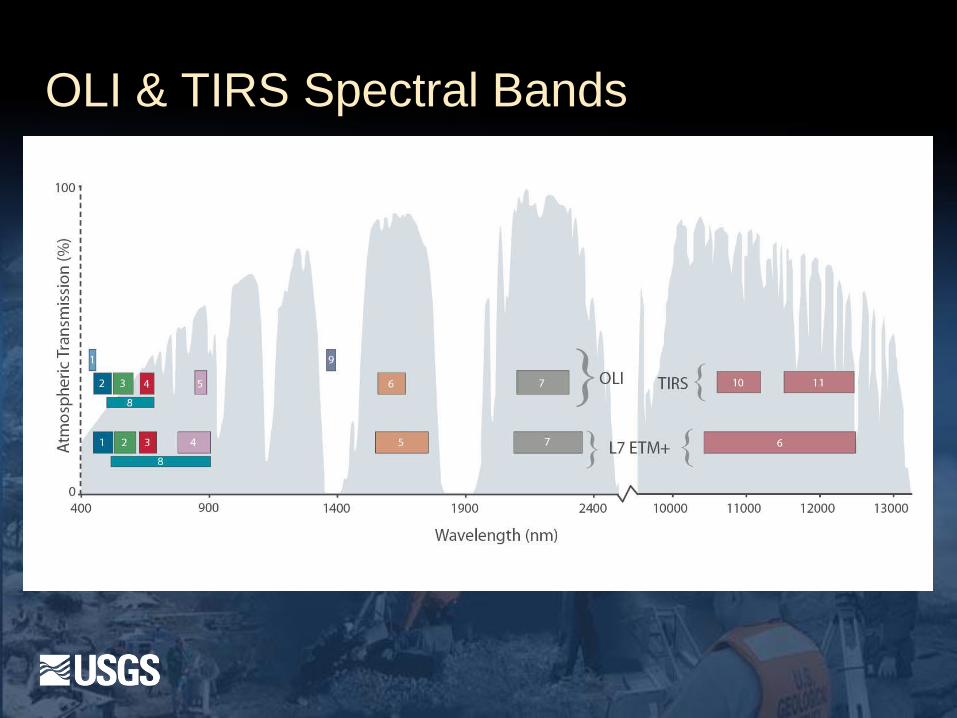
OLI & TIRS Spectral Bands
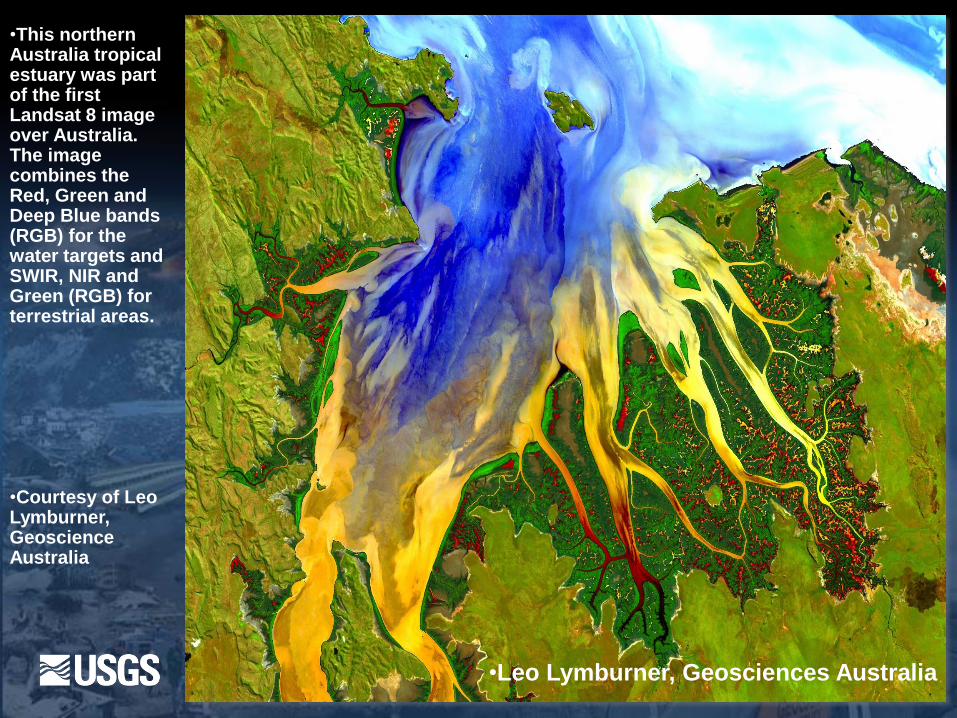
•This northern Australia tropical estuary was part of the first Landsat 8 image over Australia. The image combines the Red, Green and Deep Blue bands (RGB) for the water targets and SWIR, NIR and Green (RGB) for terrestrial areas.
•Courtesy of Leo Lymburner, Geoscience Australia
•Leo Lymburner, Geosciences Australia
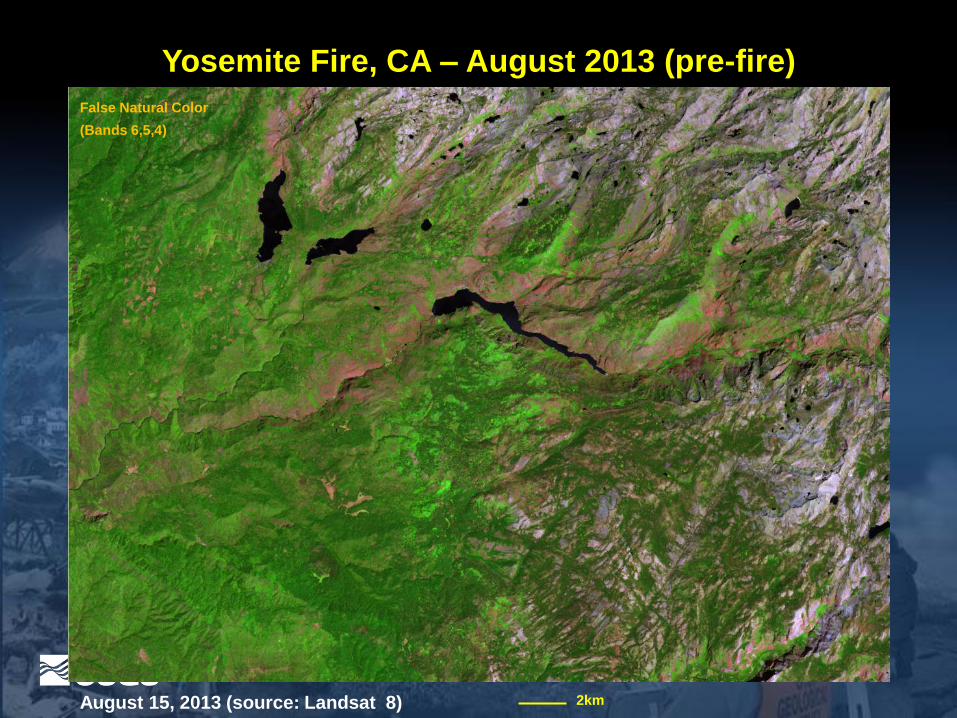
Yosemite Fire, CA – August 2013 (pre-fire)
August 15, 2013 (source: Landsat 8) 2km
False Natural Color
(Bands 6,5,4)
Yosemite Fire, CA – August 2013
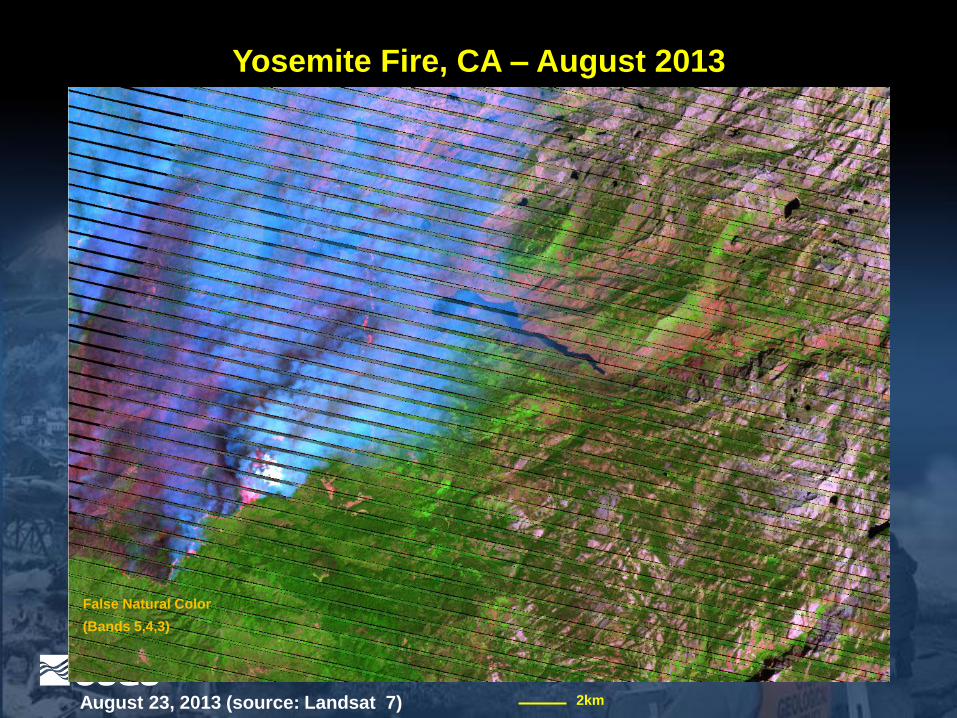
August 23, 2013 (source: Landsat 7) 2km
False Natural Color
(Bands 5,4,3)
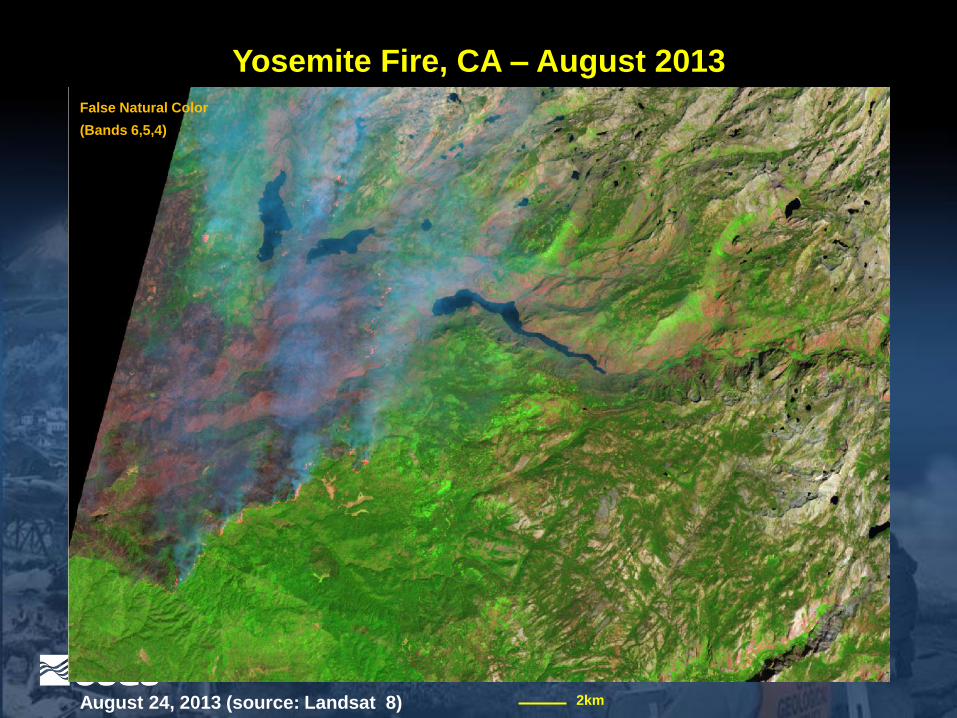
Yosemite Fire, CA – August 2013
August 24, 2013 (source: Landsat 8) 2km
False Natural Color
(Bands 6,5,4)
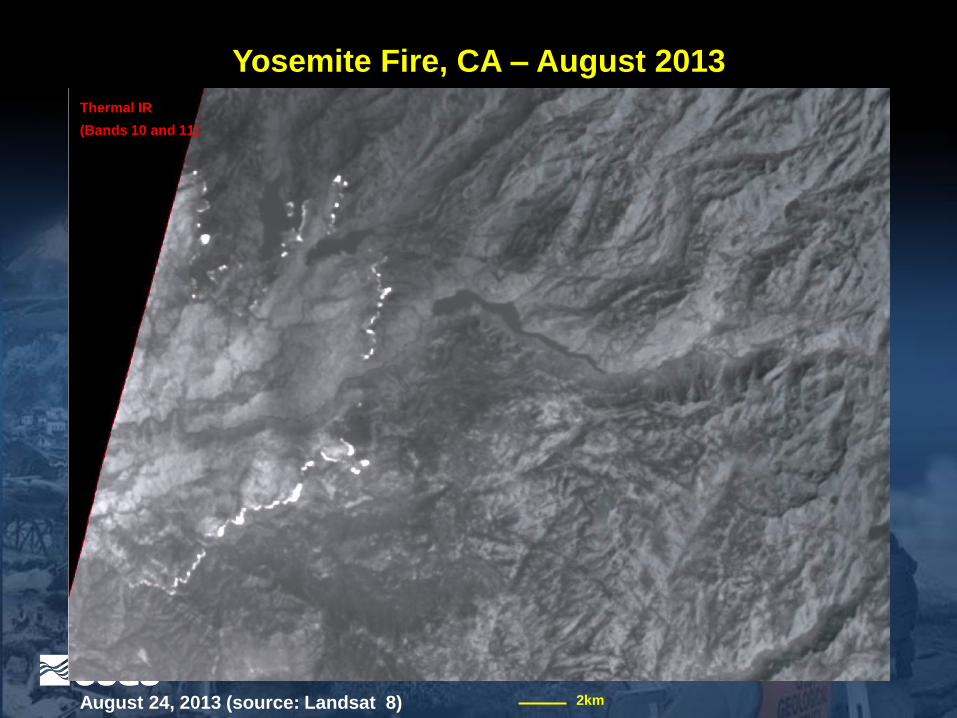
Yosemite Fire, CA – August 2013
August 24, 2013 (source: Landsat 8) 2km
Thermal IR
(Bands 10 and 11)
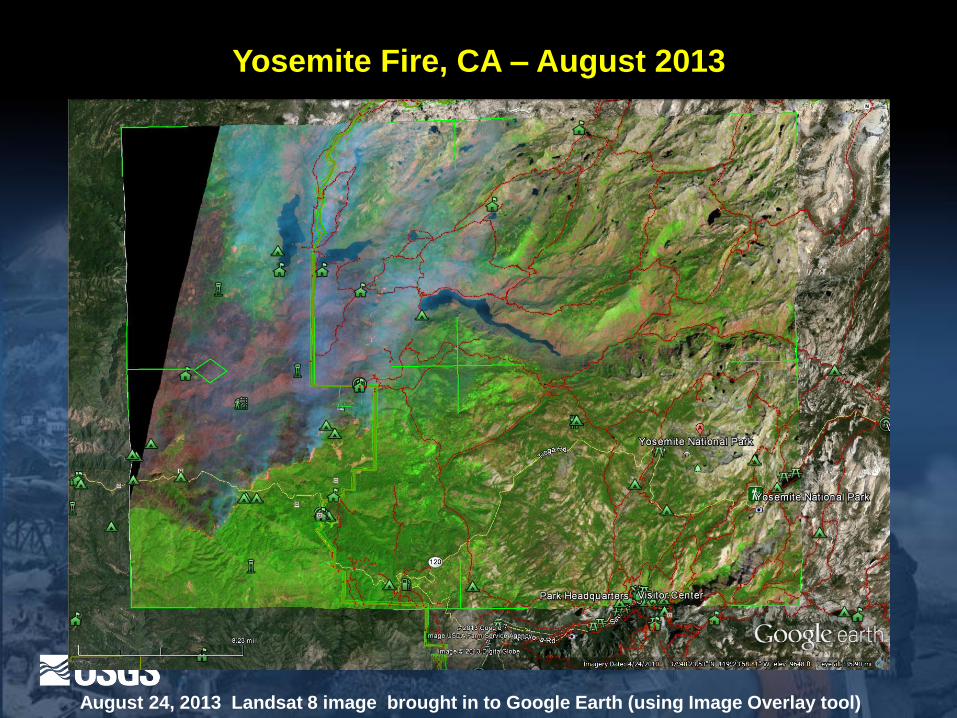
Yosemite Fire, CA – August 2013
August 24, 2013 Landsat 8 image brought in to Google Earth (using Image Overlay tool)
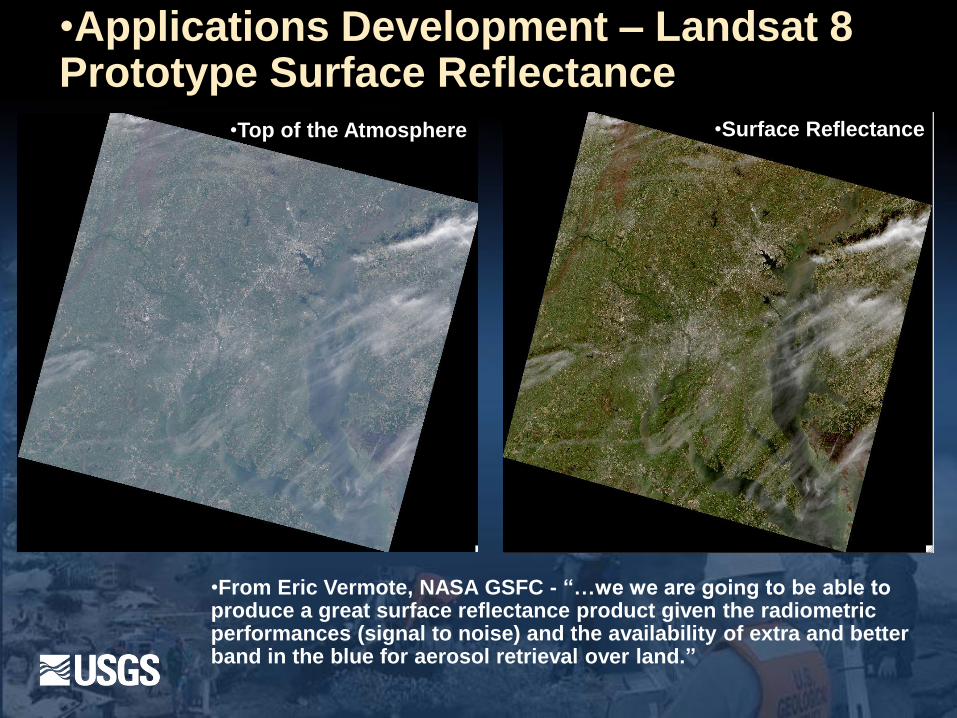
•Applications Development – Landsat 8 Prototype Surface Reflectance
•From Eric Vermote, NASA GSFC - “…we we are going to be able to produce a great surface reflectance product given the radiometric performances (signal to noise) and the availability of extra and better band in the blue for aerosol retrieval over land.”
•Top of the Atmosphere •Surface Reflectance
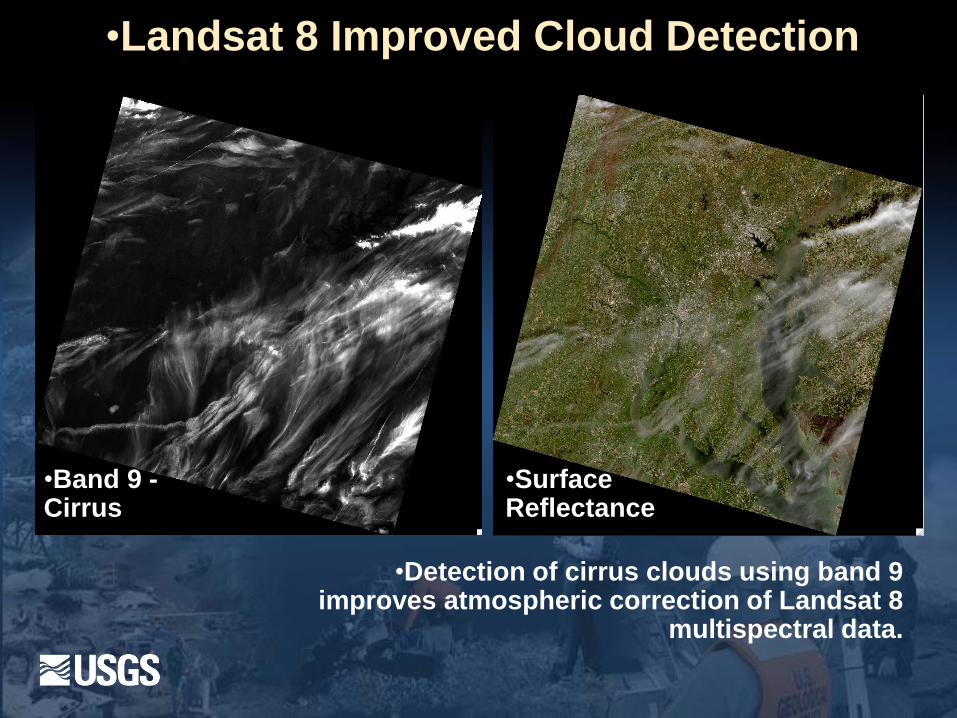
•Detection of cirrus clouds using band 9 improves atmospheric correction of Landsat 8
multispectral data.
•Landsat 8 Improved Cloud Detection
•Band 9 - Cirrus
•Surface Reflectance
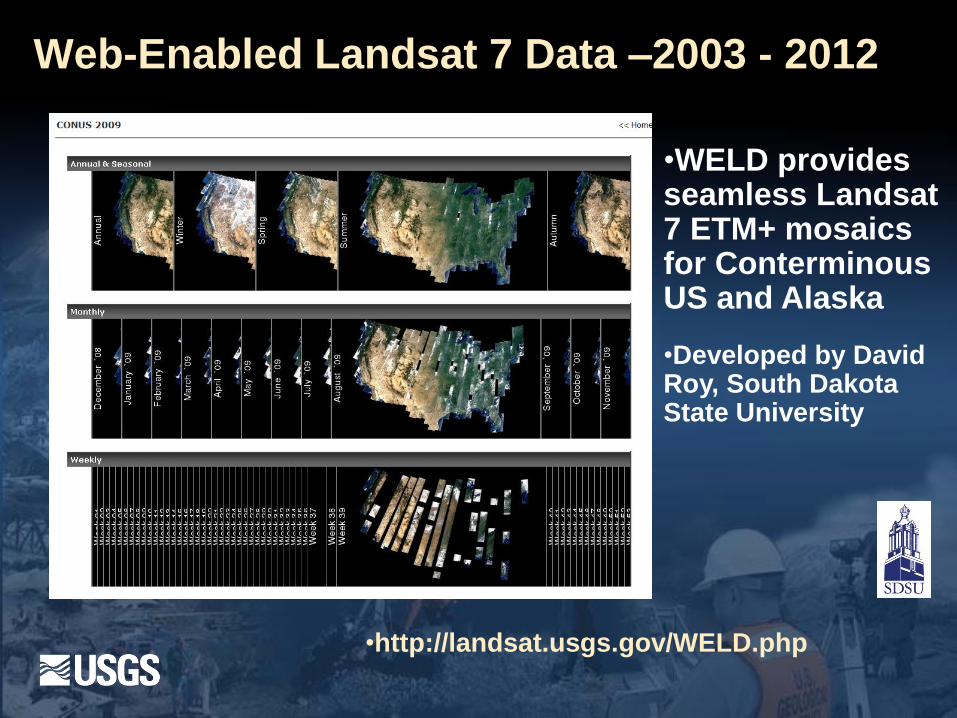
Web-Enabled Landsat 7 Data –2003 - 2012
•WELD provides seamless Landsat 7 ETM+ mosaics for Conterminous US and Alaska
•Developed by David Roy, South Dakota State University
•http://landsat.usgs.gov/WELD.php
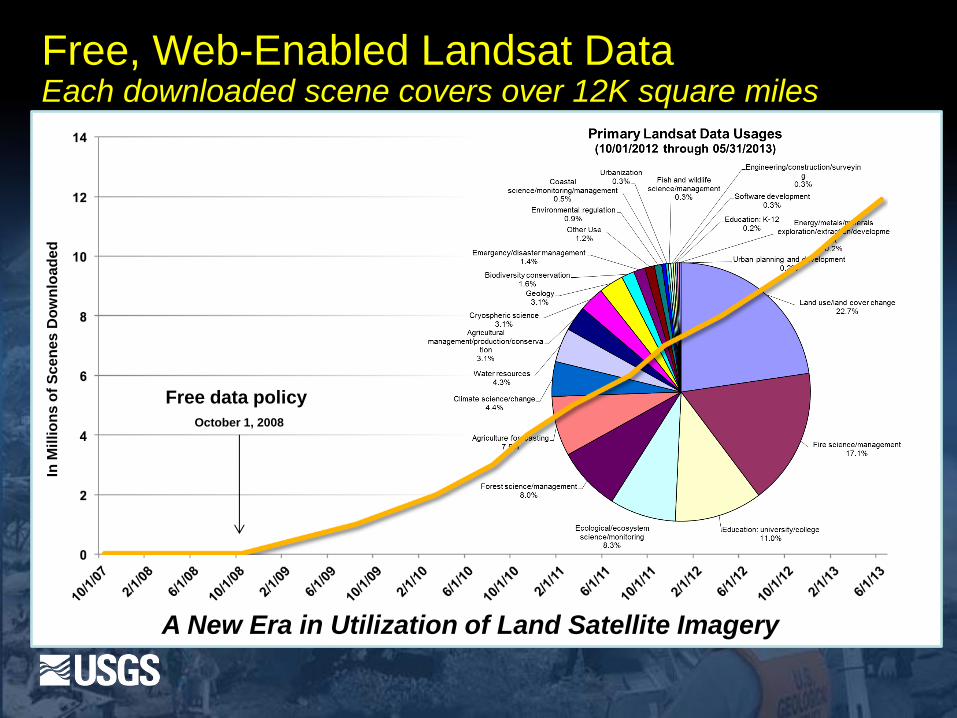
Free data policy
October 1, 2008
A New Era in Utilization of Land Satellite Imagery
Free, Web-Enabled Landsat Data Each downloaded scene covers over 12K square miles
In M
illio
ns
of
Sc
en
es
Do
wn
loa
de
d
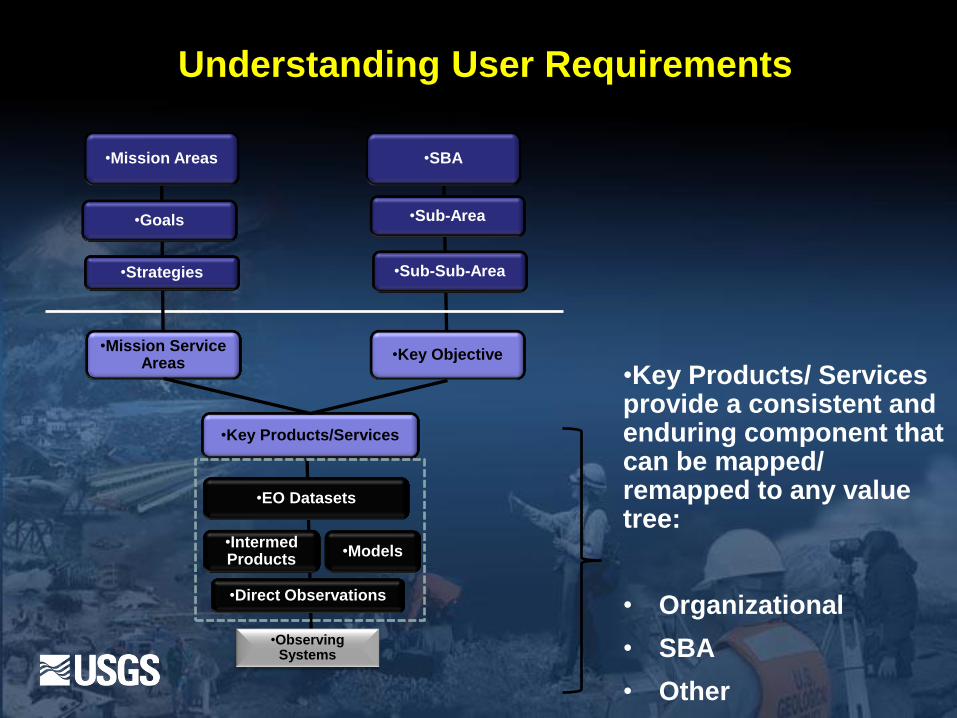
Understanding User Requirements
•SBA
•Sub-Area
•Key Objective
•Key Products/Services
•Observing Systems
•Mission Areas
•Goals
•Mission Service Areas
•Models •Intermed Products
•Direct Observations
•Strategies
•EO Datasets
•Sub-Sub-Area
•Key Products/ Services provide a consistent and enduring component that can be mapped/ remapped to any value tree:
• Organizational
• SBA
• Other
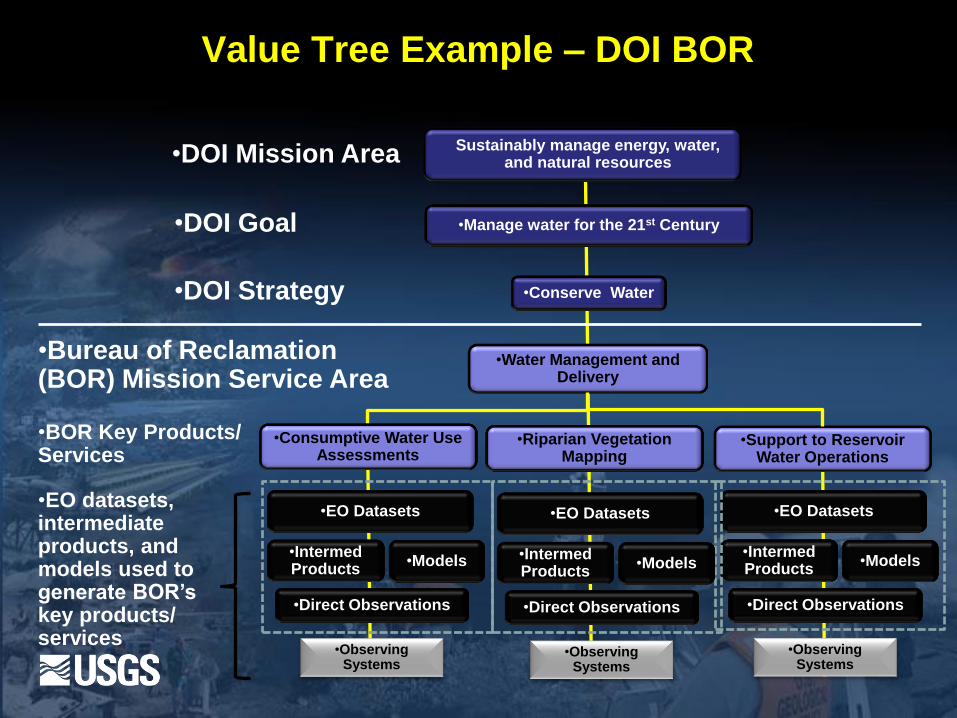
Value Tree Example – DOI BOR
•Consumptive Water Use Assessments
•Observing Systems
Sustainably manage energy, water, and natural resources
•Manage water for the 21st Century
•Water Management and Delivery
•Models •Intermed Products
•Direct Observations
•Conserve Water
•EO Datasets
•Riparian Vegetation Mapping
•Support to Reservoir Water Operations
•Observing Systems
•Models •Intermed Products
•Direct Observations
•EO Datasets
•Observing Systems
•Models •Intermed Products
•Direct Observations
•EO Datasets
•DOI Mission Area
•DOI Goal
•DOI Strategy
•Bureau of Reclamation (BOR) Mission Service Area
•BOR Key Products/ Services
•EO datasets, intermediate products, and models used to generate BOR’s key products/ services
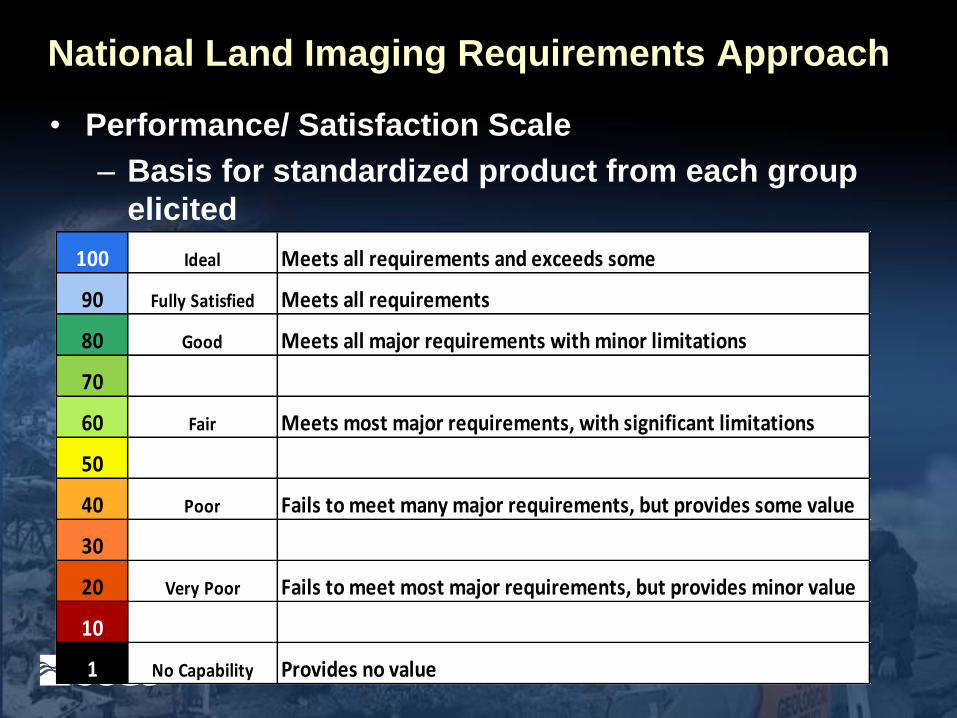
• Performance/ Satisfaction Scale
– Basis for standardized product from each group
elicited
100 Ideal Meets all requirements and exceeds some
90 Fully Satisfied Meets all requirements
80 Good Meets all major requirements with minor limitations
70
60 Fair Meets most major requirements, with significant limitations
50
40 Poor Fails to meet many major requirements, but provides some value
30
20 Very Poor Fails to meet most major requirements, but provides minor value
10
1 No Capability Provides no value
National Land Imaging Requirements Approach
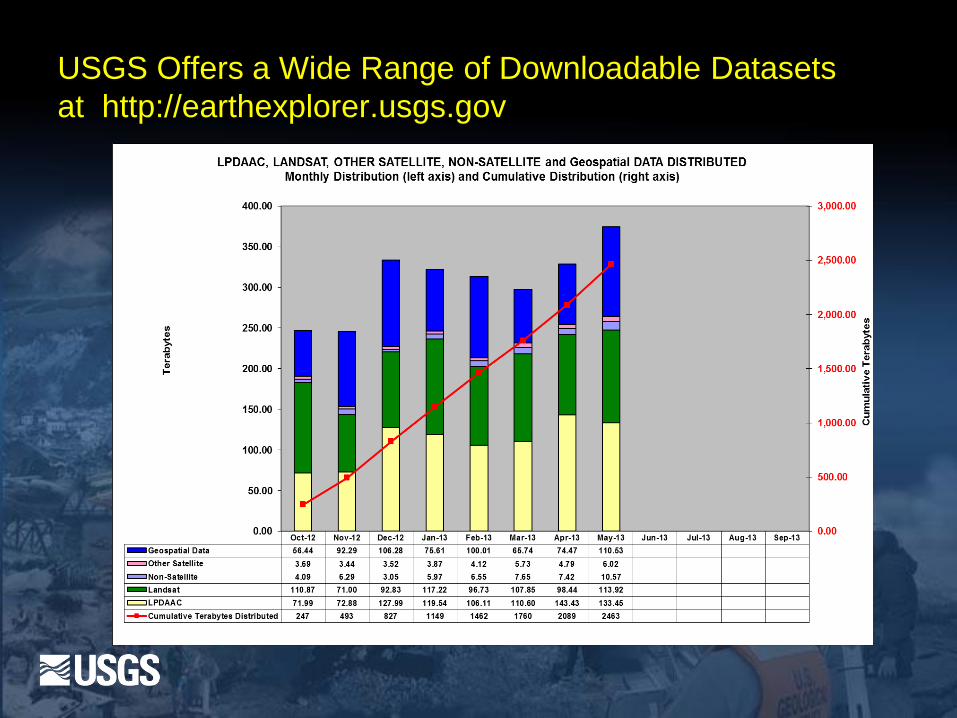
USGS Offers a Wide Range of Downloadable Datasets
at http://earthexplorer.usgs.gov
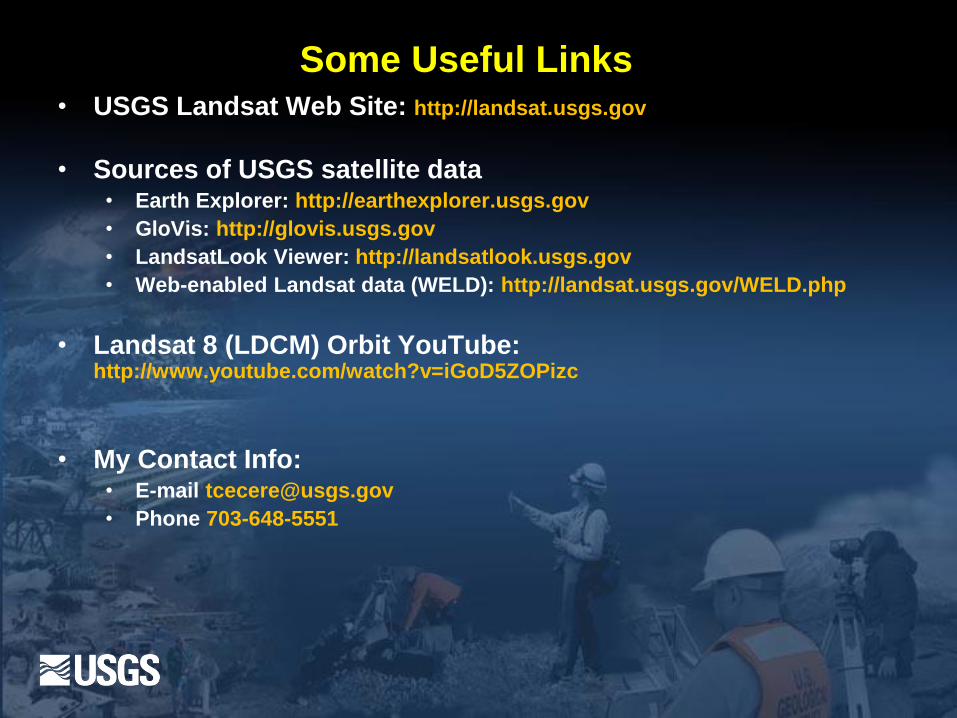
Some Useful Links • USGS Landsat Web Site: http://landsat.usgs.gov
• Sources of USGS satellite data • Earth Explorer: http://earthexplorer.usgs.gov
• GloVis: http://glovis.usgs.gov
• LandsatLook Viewer: http://landsatlook.usgs.gov
• Web-enabled Landsat data (WELD): http://landsat.usgs.gov/WELD.php
• Landsat 8 (LDCM) Orbit YouTube: http://www.youtube.com/watch?v=iGoD5ZOPizc
• My Contact Info: • E-mail [email protected]
• Phone 703-648-5551