Embed Size (px)
Citation preview
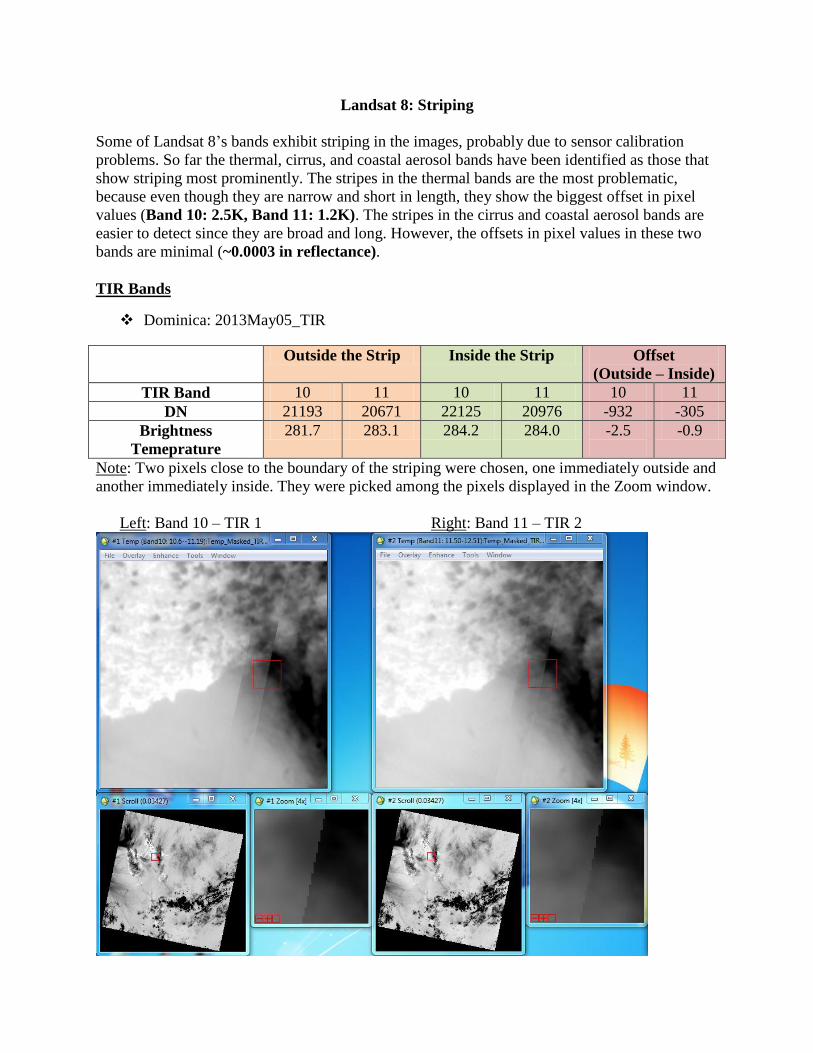
Landsat 8: Striping
Some of Landsat 8’s bands exhibit striping in the images, probably due to sensor calibration
problems. So far the thermal, cirrus, and coastal aerosol bands have been identified as those that
show striping most prominently. The stripes in the thermal bands are the most problematic,
because even though they are narrow and short in length, they show the biggest offset in pixel
values (Band 10: 2.5K, Band 11: 1.2K). The stripes in the cirrus and coastal aerosol bands are
easier to detect since they are broad and long. However, the offsets in pixel values in these two
bands are minimal (~0.0003 in reflectance).
TIR Bands
Dominica: 2013May05_TIR
Outside the Strip Inside the Strip Offset
(Outside – Inside)
TIR Band 10 11 10 11 10 11
DN 21193 20671 22125 20976 -932 -305
Brightness
Temeprature
281.7 283.1 284.2 284.0 -2.5
-0.9
Note: Two pixels close to the boundary of the striping were chosen, one immediately outside and
another immediately inside. They were picked among the pixels displayed in the Zoom window.
Left: Band 10 – TIR 1 Right: Band 11 – TIR 2
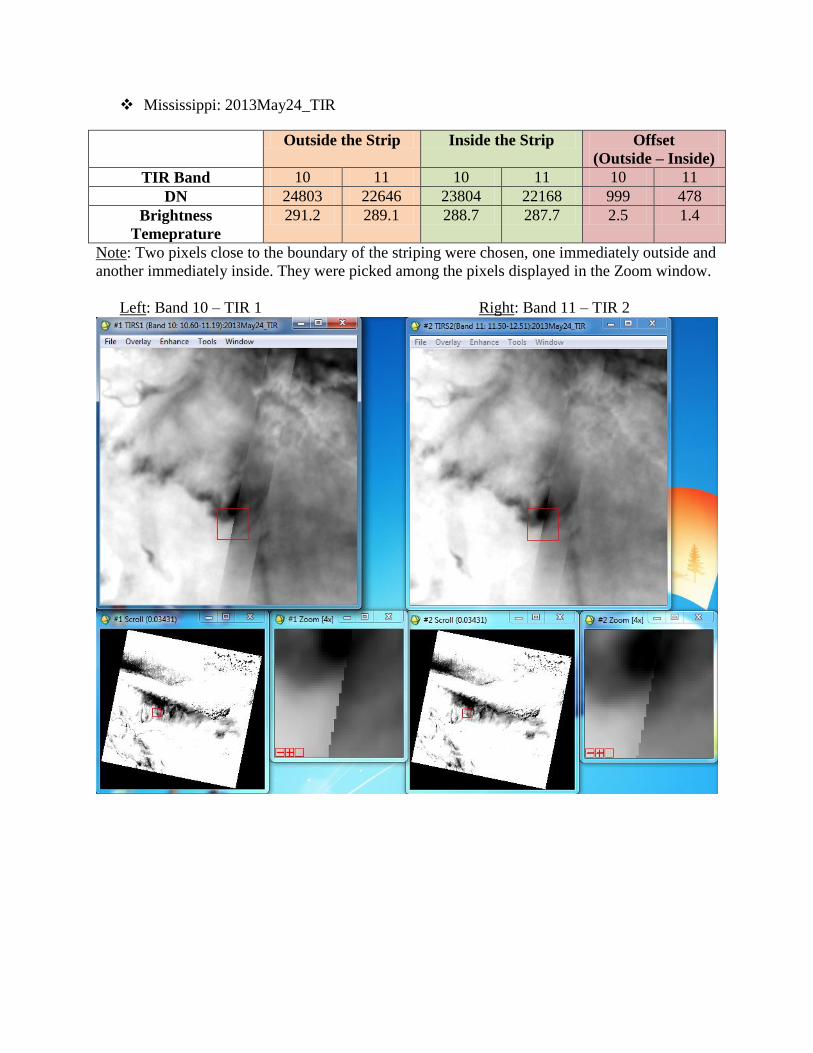
Mississippi: 2013May24_TIR
Outside the Strip Inside the Strip Offset
(Outside – Inside)
TIR Band 10 11 10 11 10 11
DN 24803 22646 23804 22168 999 478
Brightness
Temeprature
291.2 289.1 288.7 287.7 2.5 1.4
Note: Two pixels close to the boundary of the striping were chosen, one immediately outside and
another immediately inside. They were picked among the pixels displayed in the Zoom window.
Left: Band 10 – TIR 1 Right: Band 11 – TIR 2

Cirrus Band
Dominica: 2013May05_Cirrus
Outside the Strip Inside the Strip Offset
(Outside – Inside)
DN 5053 5061 -8
TOA Reflectance 0.0011 0.0013 -0.0002
Note: Two pixels close to the boundary of the striping were chosen, one immediately outside and
another immediately inside. They were picked among the pixels displayed in the Zoom window.

Mississippi: 2013May24_Cirrus
Outside the Strip Inside the Strip Offset
(Outside – Inside)
DN 5102 5087 15
TOA Reflectance 0.0022 0.0019 0.0003
Note: Two pixels close to the boundary of the striping were chosen, one immediately outside and
another immediately inside. They were picked among the pixels displayed in the Zoom window.


Coastal Aerosol
Florida: 2013May23_CoastalAerosol
Outside the Strip Inside the Strip Offset
(Outside – Inside)
Aerosol Index
(B1-B2/B1+B2)
0.064 0.058 0.006
DN 13693 13538 155
TOA Reflectance 0.186 0.182 0.004
Note: Two pixels close to the boundary of the striping were chosen, one immediately outside and
another immediately inside. They were picked among the pixels displayed in the Zoom window.
Left: Aerosol Index Right: Coastal Aerosol Band

Dominica: 2013May05_CoastalAerosol
Outside the Strip Inside the Strip Offset
(Outside – Inside)
Aerosol Index
(B1-B2/B1+B2)
0.104 0.109 -0.005
DN 11576 11616 -40
TOA Reflectance 0.142 0.143 -0.001
Note: Two pixels close to the boundary of the striping were chosen, one immediately outside and
another immediately inside. They were picked among the pixels displayed in the Zoom window.
Left: Aerosol Index Right: Coastal Aerosol Band

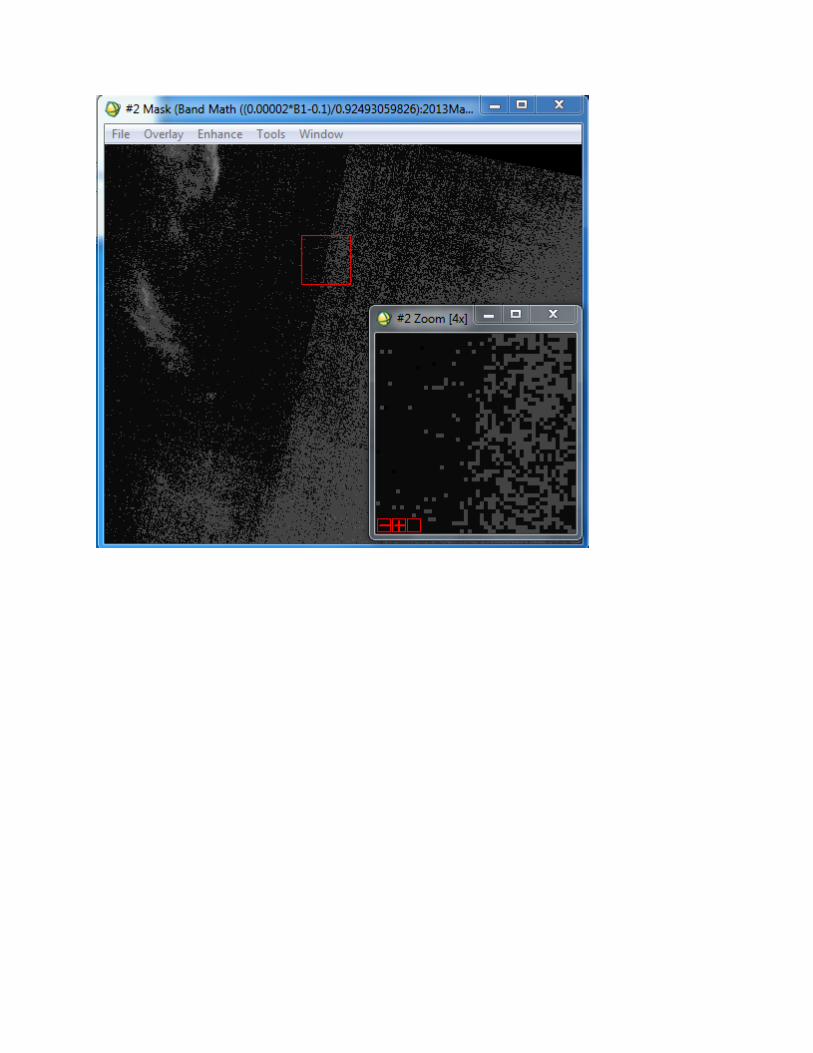
Blue Band
The striping in the Aerosol Index is primarily due to the coastal band. There is evidence of little
striping in the rest of the bands (See Mississippi example).
Florida: 2013May23_CoastalAerosol
Left: Aerosol Index Middle: Coastal Band Right: Blue Band
Left: Green Band Middle: Red Band Right: NIR Band

Left: MIR1 Band Right: MIR2 Band
Mississippi: 2013May23_CoastalAerosol
Left: Aerosol Index Middle: Coastal Band Right: Blue Band

Left: Green Band Middle: Red Band Right: NIR Band
Left: MIR1 Band Right: MIR2 Band