Embed Size (px)
Citation preview
Landsat-7 ETM+ as an observatory for land cover
Initial radiometric and geometric comparisons with
Landsat-5 Thematic Mapper
Jeffrey G. Masek*, Miroslav Honzak, Samuel N. Goward, Ping Liu, Edwin Pak
Department of Geography, University of Maryland, College Park, MD 20742, USA
Received 23 May 2000; received in revised form 14 February 2001; accepted 30 April 2001
Abstract
The Landsat-7 ETM+ sensor offers several enhancements over the Landsat-4,5 Thematic Mapper (TM) sensor, including increased
spectral information content, improved geodetic accuracy, reduced noise, reliable calibration, the addition of a panchromatic band, and
improved spatial resolution of the thermal band. In this paper, we present some initial comparisons between Landsat-5 TM and
Landsat-7 ETM+ imagery in order to quantify these improvements. We find that the ETM+ continues the record of TM observations,
and, in many respects, substantially improves upon the earlier sensor. Specific improvements include lower spatial noise levels,
improved information content, and geodetic accuracy of systematically corrected products to 50–100 m. These improvements are
likely to have significant benefits for land-cover mapping and change detection applications. D 2001 Published by Elsevier Science
Inc. All rights reserved.
1. Introduction
The Landsat-7 mission, successfully placed into orbit
on April 15, 1999, continues the 29-year record of land
remote sensing measurement that started in 1972 with
the Earth Resources Technology Satellite (ERTS, later
Landsat-1). From the beginning, Landsat sensors have
provided calibrated multispectral measurements of land
conditions, which have proven valuable in tracking the
Earth’s terrestrial forests, grasslands, agricultural activity,
urban growth, and surface hydrology (Goward & Wil-
liams, 1997). Landsat’s success is revealed not only in
the diverse applications of the acquired information but
also the many complimentary spaceborne land remote
sensing systems that are now actively monitoring the
Earth. The recent launch of Terra, with the MODIS,
ASTER, and MISR sensors, combined with Landsat-7
Enhanced Thematic Mapper Plus observations, comprise
a major US commitment to study potential changes in
the Earth system at the beginning of the 21st century.
The Landsat-7 mission represents a significant change in
operations in comparison to Landsat-4 and -5. Following
design studies in the mid-1970s, Landsat-4 introduced a new
sensor system, the Thematic Mapper (TM), to replace the
original four-spectral band Multispectral Scanner (MSS)
flown on Landsat-1, -2, and -3. The TM instrument signific-
antly refined the original MSS sensor, with more spectral
bands (seven vs. four), finer spatial resolution (30 m), and
improved radiometric precision (8 bits vs. 6 bits) (Markham
& Barker, 1985).
Coincident with the deployment of TM on Landsat-4, the
entire Landsat system was transferred to the private sector,
under the management of the National Oceanic and Atmo-
spheric Administration (Sheffner, 1994). A component of
this commercialization effort was the development of the
sensor system for Landsat-6. The EOSAT undertook a
redesign effort that introduced several changes in the
original TM sensor design in an effort to enhance
the competitiveness of the observations in comparison to
the French SPOT system. The new sensor design was called
the Enhanced Thematic Mapper (ETM).
The ETM instrument incorporated a new, 15-m pan-
chromatic band, as well as a 9-bit analog to digital
converter. The panchromatic band was added to provide
0034-4257/01/$ – see front matter D 2001 Elsevier Science Inc. All rights reserved.
PII: S0034 -4257 (01 )00254 -1
* Corresponding author.
E-mail address: [email protected] (J.G. Masek).
www.elsevier.com/locate/rse
Remote Sensing of Environment 78 (2001) 118–130
higher spatial resolution observations, as a compliment to
the 30-m multispectral measurements. However, in order
to provide sufficient signal, the spectral bandpass of the
panchromatic band covered both the visible and near-
infrared portions of the spectrum (0.5–0.9 mm). In order
to keep the telemetered data stream to a reasonable
volume the 9-bit A-to-D system was designed so that
either the upper or lower 8 bits of the radiometry could
be provided from the system. In effect, this introduced the
potential for two gain states (high and low), which,
particularly for dark landscapes, could increase the radio-
metric signal (while running the risk of increased satura-
tion of the signal for bright targets). Unfortunately, neither
the applications nor science community had a chance to
evaluate the ETM instrument. Landsat-6 was lost during
launch in 1993.
When the Landsat program was returned to US gov-
ernment operations in 1992, specifications were developed
for a new sensor system on Landsat-7. Of primary
concern was to ensure continuity of the Landsat obser-
vation record from previous missions (e.g., Landsat-4 and
-5). This pressure directed attention toward building a
duplicate of the Landsat-6 ETM instrument, which was
viewed as the quickest way to produce a backup to the
aging Landsat-4 and -5. Thus, the Landsat-7 ETM+
instrument is essentially the EOSAT Landsat-6 heritage
instrument. It replicates the Landsat-6 ETM design, with
the significant exception of the thermal infrared band,
where the ground resolution has been improved from 120
to 60 m, and the addition of a Partial Aperture Calibrator
(PAC) and Full Apature Calibrator (FAC) to allow solar
calibration of the instrument.
Beyond the technical changes represented in the ETM+
instrument, the technical and scientific teams associated
with the mission, directed from the NASA Goddard Space
Flight Center, brought better than 20 years experience to
the design and development of the Landsat platform.
Lessons learned over this time period offered considerable
promise that the quality of the Landsat-7 mission could
easily exceed the Landsat-4 and -5 missions, simply
because so much had been learned from these previous
missions with respect to radiometric calibration, geometric
accuracy, and image quality.
2. Objectives, approach, and data sources
With this history and technical potential well in mind,
we undertook an initial examination of selected Landsat-7
ETM+ observations, in comparison to both historical and
contemporary Landsat-5 observations. The specific goals
of this study were to evaluate the degree to which
Landsat-7 observations will permit continued large area
monitoring of land-cover dynamics. In addition, we set
out to understand how Landsat-7 observations may assist
in improved automation of regional and global scale
studies in support of the US Global Change Research
Program and NASA Earth Observation System goals
(Goward et al., 1999; Goward & Williams, 1997). This
study represents a first, ‘‘quick look’’ at the data charac-
teristics in comparison to Landsat-5 TM. We anticipate
that other studies will refine these results as more data
become available.
Several data attributes must be well understood to fully
exploit Landsat observations for global change science.
For this study, we selected three key attributes to compare
between Landsat-5 TM and Landsat-7 ETM+:
� Geodetic accuracy refers to the absolute accuracy of
projected pixel locations within the image, using the
corner coordinates provided by the ground process-
ing system.� Radiometric information content specifies the amount
of information (bits) used to represent the land surface
in any given image or image subset.� Periodic sensor noise refers to the coherent noise
(striping, banding, stippling) commonly found in
Landsat-5 TM images.
In essence, these attributes constitute a chain of informa-
tion. Degrading any aspect of this chain could limit the
ability to extract useful information from the imagery
(Vogelmann, Helder, Morfitt, Choate, & Merchant, 1998).
Radiometric calibration, while also a key part of this
information chain, is being examined by other members of
the Landsat Science Team and has not been addressed in this
study (Teillet et al., 2001; Vogelmann, Choate, Helder,
Merchant, & Bulley, 1999).
To intercompare Landsat-5 and Landsat-7 data, we
examined a suite of scenes for two regions, Washington,
DC and Manaus, Brazil, acquired during the last three
years (Table 1). The Washington, DC region includes
urban, suburban, deciduous forest, water, and wetlands
land-cover types. The Manaus scene includes primary
tropical forest, two types of river water, regenerating
forest, pasture, and the urban center of Manaus itself.
These two locations, in the mid- and tropical latitudes of
the Earth provide a representative sample of the condi-
tions that may be encountered any of the more humid
portions of the Earth’s land areas. ETM+ images were
processed to Level 1G, HDF format using LPGS soft-
ware. TM images were processed to Level 1G using the
EDC NLAPS system.
Of particular note are the two scenes of the Washing-
ton, DC area from June 2, 1999, acquired as Level 0
format. These scenes were acquired as part of the Land-
sat-5/Landsat-7 underfly experiment, in which the two
sensors simultaneously (within 4 min) imaged overlapping
ground swaths as Landsat-7 ascended to its final orbit.
This data set allowed direct comparison of radiometry
between the TM and ETM+ sensors. In addition, we used
multidate imagery for identical ground targets for some
J.G. Masek et al. / Remote Sensing of Environment 78 (2001) 118–130 119
analyses. Although multidate images incorporate variable
atmospheric effects and land-cover conditions, as well as
sensor changes, intercomparing many scenes from mul-
tiple dates can reveal consistent changes attributable to
sensor performance.
3. Sensor performance
3.1. Geodetic accuracy
Geodetic accuracy (the geographic navigation accuracy
of a particular pixel) is vital for not only locating image
features, but also for determining what has changed between
images from differing time periods. Geodetic accuracy is a
function of knowing the spacecraft position in time (eph-
emeris), spacecraft attitude, cameral model (focal plane),
and having an accurate software model to convert these data
into a geographically projected image. Applying the satellite
ephemeris data to the raw imagery, and resampling the
observations to a projected grid is part of the ‘‘systematic’’
correction done during L0R to L1G processing (Bernard,
1997). For Landsat-7, the geodetic error after systematic
correction was required to be less than 250 m (1s devi-
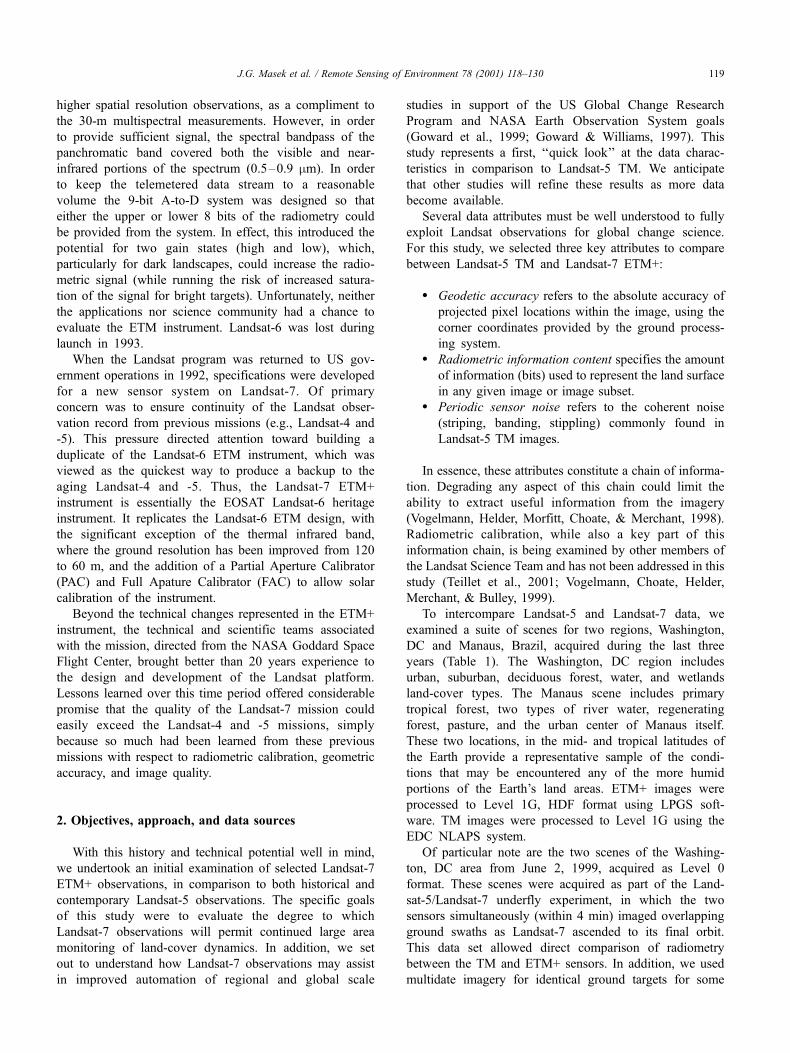
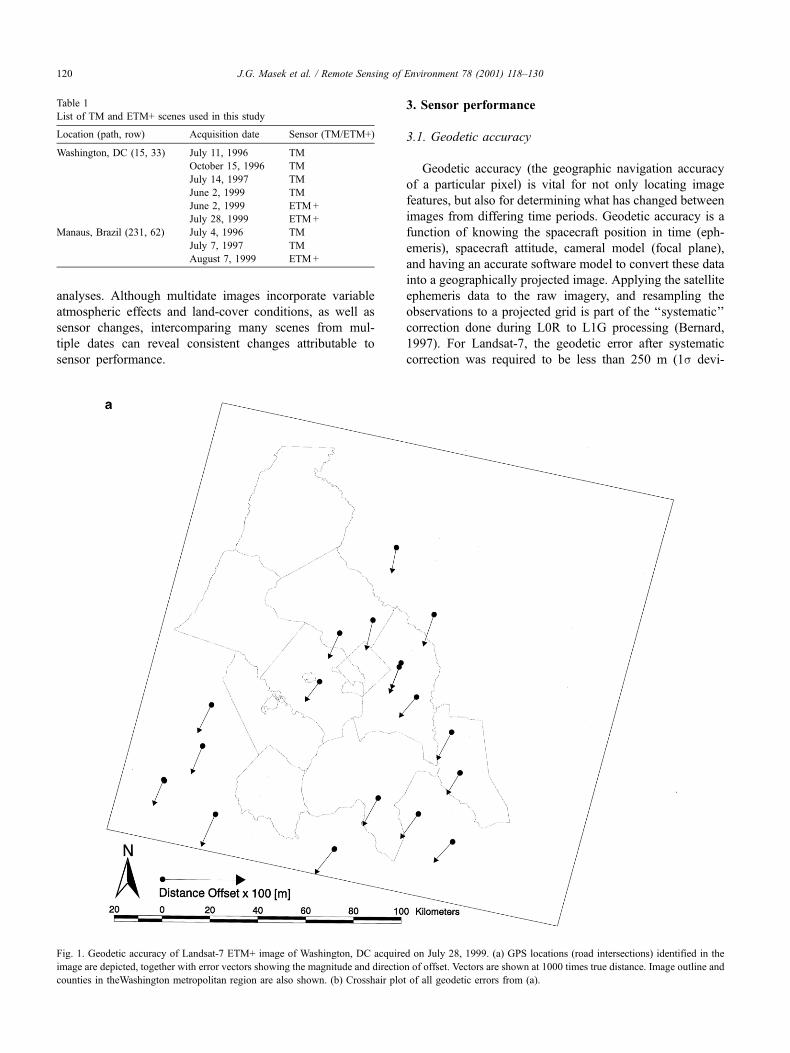
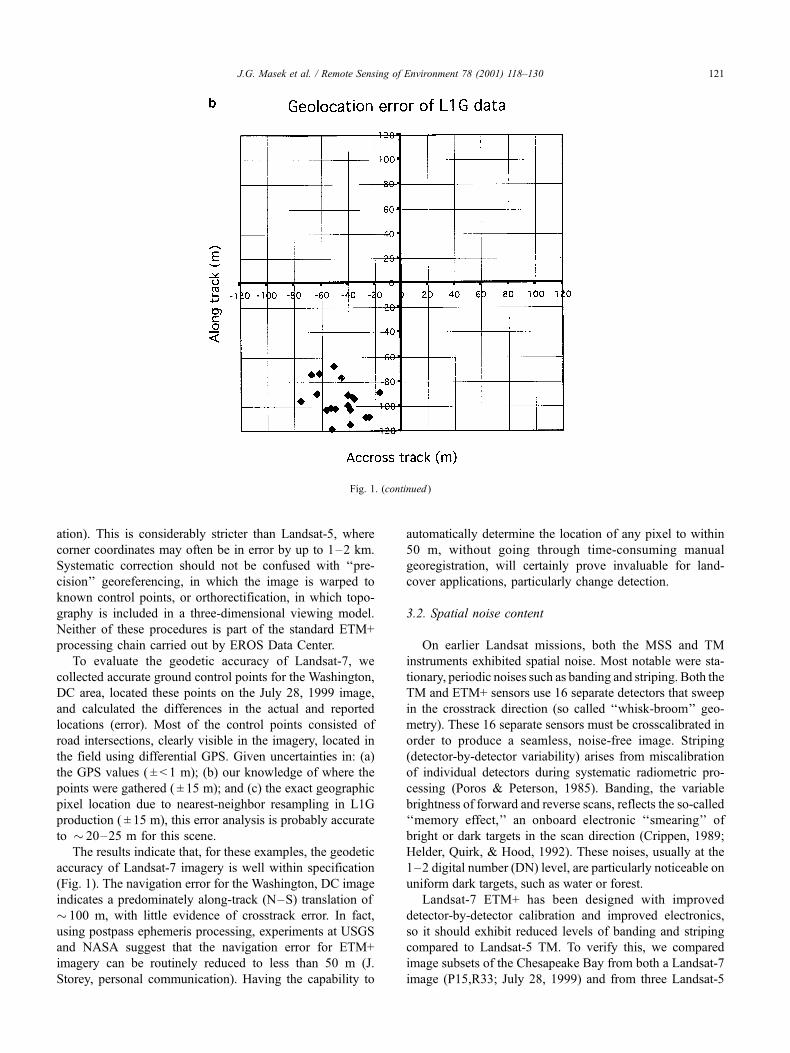
Fig. 1. Geodetic accuracy of Landsat-7 ETM+ image of Washington, DC acquired on July 28, 1999. (a) GPS locations (road intersections) identified in the
image are depicted, together with error vectors showing the magnitude and direction of offset. Vectors are shown at 1000 times true distance. Image outline and
counties in theWashington metropolitan region are also shown. (b) Crosshair plot of all geodetic errors from (a).
Table 1
List of TM and ETM+ scenes used in this study
Location (path, row) Acquisition date Sensor (TM/ETM+)
Washington, DC (15, 33) July 11, 1996 TM
October 15, 1996 TM
July 14, 1997 TM
June 2, 1999 TM
June 2, 1999 ETM+
July 28, 1999 ETM+
Manaus, Brazil (231, 62) July 4, 1996 TM
July 7, 1997 TM
August 7, 1999 ETM+
J.G. Masek et al. / Remote Sensing of Environment 78 (2001) 118–130120
ation). This is considerably stricter than Landsat-5, where
corner coordinates may often be in error by up to 1–2 km.
Systematic correction should not be confused with ‘‘pre-
cision’’ georeferencing, in which the image is warped to
known control points, or orthorectification, in which topo-
graphy is included in a three-dimensional viewing model.
Neither of these procedures is part of the standard ETM+
processing chain carried out by EROS Data Center.
To evaluate the geodetic accuracy of Landsat-7, we
collected accurate ground control points for the Washington,
DC area, located these points on the July 28, 1999 image,
and calculated the differences in the actual and reported
locations (error). Most of the control points consisted of
road intersections, clearly visible in the imagery, located in
the field using differential GPS. Given uncertainties in: (a)
the GPS values ( ± < 1 m); (b) our knowledge of where the
points were gathered ( ± 15 m); and (c) the exact geographic
pixel location due to nearest-neighbor resampling in L1G
production ( ± 15 m), this error analysis is probably accurate
to � 20–25 m for this scene.
The results indicate that, for these examples, the geodetic
accuracy of Landsat-7 imagery is well within specification
(Fig. 1). The navigation error for the Washington, DC image
indicates a predominately along-track (N–S) translation of
� 100 m, with little evidence of crosstrack error. In fact,
using postpass ephemeris processing, experiments at USGS
and NASA suggest that the navigation error for ETM+
imagery can be routinely reduced to less than 50 m (J.
Storey, personal communication). Having the capability to
automatically determine the location of any pixel to within
50 m, without going through time-consuming manual
georegistration, will certainly prove invaluable for land-
cover applications, particularly change detection.
3.2. Spatial noise content
On earlier Landsat missions, both the MSS and TM
instruments exhibited spatial noise. Most notable were sta-
tionary, periodic noises such as banding and striping. Both the
TM and ETM+ sensors use 16 separate detectors that sweep
in the crosstrack direction (so called ‘‘whisk-broom’’ geo-
metry). These 16 separate sensors must be crosscalibrated in
order to produce a seamless, noise-free image. Striping
(detector-by-detector variability) arises from miscalibration
of individual detectors during systematic radiometric pro-
cessing (Poros & Peterson, 1985). Banding, the variable
brightness of forward and reverse scans, reflects the so-called
‘‘memory effect,’’ an onboard electronic ‘‘smearing’’ of
bright or dark targets in the scan direction (Crippen, 1989;
Helder, Quirk, & Hood, 1992). These noises, usually at the
1–2 digital number (DN) level, are particularly noticeable on
uniform dark targets, such as water or forest.
Landsat-7 ETM+ has been designed with improved
detector-by-detector calibration and improved electronics,
so it should exhibit reduced levels of banding and striping
compared to Landsat-5 TM. To verify this, we compared
image subsets of the Chesapeake Bay from both a Landsat-7
image (P15,R33; July 28, 1999) and from three Landsat-5
Fig. 1. (continued )
J.G. Masek et al. / Remote Sensing of Environment 78 (2001) 118–130 121
images (July 14, 1997, October 15, 1996, and July 11,
1996). The target area was a 15� 15 km region of the Bay
south of Washington, DC. Each image was first converted to
units of at-sensor radiance (L) using the standard calibration
equation (Eq. (1)):
Lk ¼ gkDNþ bk ð1Þ
where gk and bk refer to the gain and bias for band k
(Landsat 7 Science Data Users Handbook: http://
ltpwww.gsfc.nasa.gov/IAS/handbook/). To ensure that all
images exhibited comparable total radiance levels, regard-
less of atmospheric conditions, the minimum value in each
subset was subtracted (e.g. simple dark-object subtraction)
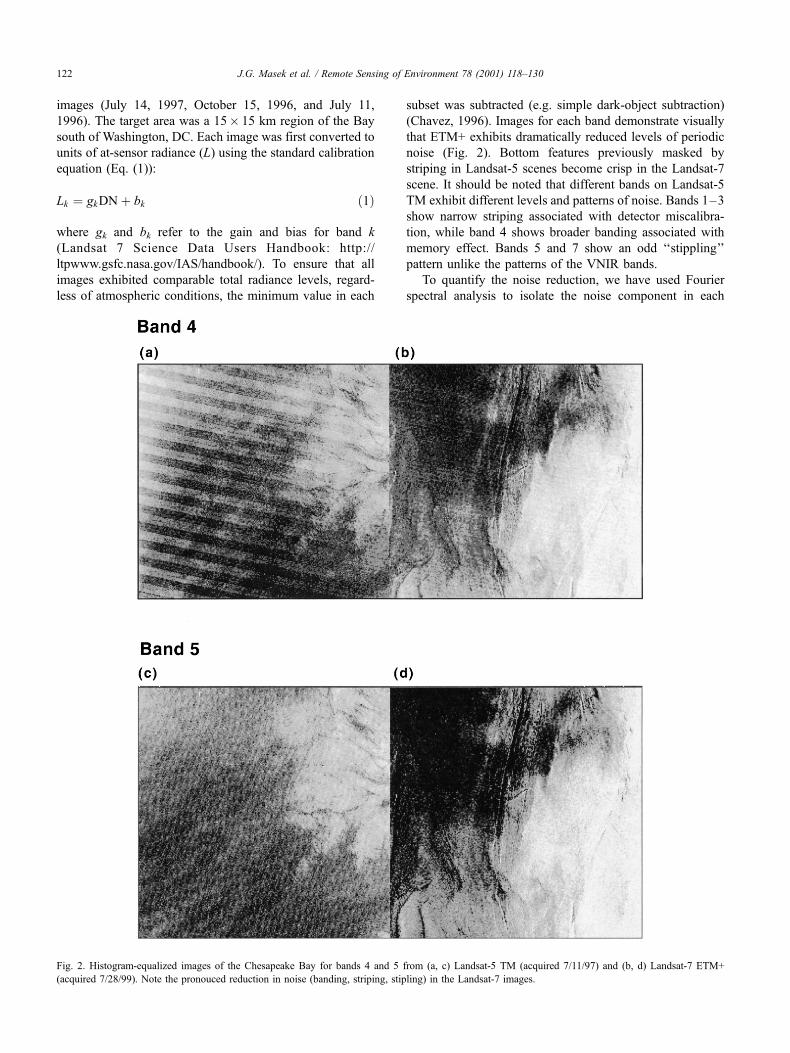
(Chavez, 1996). Images for each band demonstrate visually
that ETM+ exhibits dramatically reduced levels of periodic
noise (Fig. 2). Bottom features previously masked by
striping in Landsat-5 scenes become crisp in the Landsat-7
scene. It should be noted that different bands on Landsat-5
TM exhibit different levels and patterns of noise. Bands 1–3
show narrow striping associated with detector miscalibra-
tion, while band 4 shows broader banding associated with
memory effect. Bands 5 and 7 show an odd ‘‘stippling’’
pattern unlike the patterns of the VNIR bands.
To quantify the noise reduction, we have used Fourier
spectral analysis to isolate the noise component in each
Fig. 2. Histogram-equalized images of the Chesapeake Bay for bands 4 and 5 from (a, c) Landsat-5 TM (acquired 7/11/97) and (b, d) Landsat-7 ETM+
(acquired 7/28/99). Note the pronouced reduction in noise (banding, striping, stipling) in the Landsat-7 images.
J.G. Masek et al. / Remote Sensing of Environment 78 (2001) 118–130122

band. To ‘‘build’’ the Fourier noise signal, each 512� 512
pixel subset of the Chesapeake Bay was segmented into
nine overlapping 256� 256 pixel windows. The Fourier
amplitude spectrum was calculated for each window
separately, and then summed to increase the signal
coming from periodic noise. To reduce ‘‘ringing’’ asso-
ciated with edge discontinuities, each window was first
multiplied by the Hanning window (Eq. (2)):
wðrÞ ¼ 1
21� cos
2prN � 1
� �� �ð2Þ
where r is the distance from the edge of the image window
and N is the window size (Press, Flannery, Teukolsky, &
Vettering, 1988). The windowed data h(x,y) were then
transformed into the Fourier domain according to the
standard transform (Eq. (3)):
Hðkx; kyÞ ¼XN0
XN0
hðx; yÞeikxxeikyyDxDy ð3Þ
where kx and ky represent the x and y wavenumber
components, respectively, and H(kx,ky) is a complex array.
The complex array H(kx,ky) is converted to a real
amplitude array by taking the magnitude of each complex
value. The amplitude array from each of the 256� 256
windows is then added to ‘‘build’’ the periodic noise
signal and reduce components associated with particular
image content (e.g. varying atmospheric haze, sediment
patterns, etc.). To convert the two-dimensional summed
amplitude spectrum to a one-dimensional radial power
spectrum (RPS), the maximum value for each circum-
ferential band of discrete wavenumber kr (=(kx2 + ky
2)1/2)
was retained.
Radial amplitude spectra from all bands show a similar
pattern (Fig. 3). For low wavenumbers (k < 20), image
content dominates the spectra. For shorter wavelengths,
regular noise peaks occur at specific wavenumbers for each
band and each sensor. The position and (to a lesser extent)
amplitude of noise peaks in Landsat-5 TM subsets are
consistent regardless of acquisition date. In contrast, Land-
sat-7 ETM+ data typically show fewer discrete noise peaks,
and lower overall noise amplitude. It should be noted that
while the overall brightness of each image is about the same,
Landsat-7 tends to concentrate more of the image amplitude
in the longer-wavelength part of the spectrum associated
with actual image content, rather than shorter wavelengths
associated with noise.
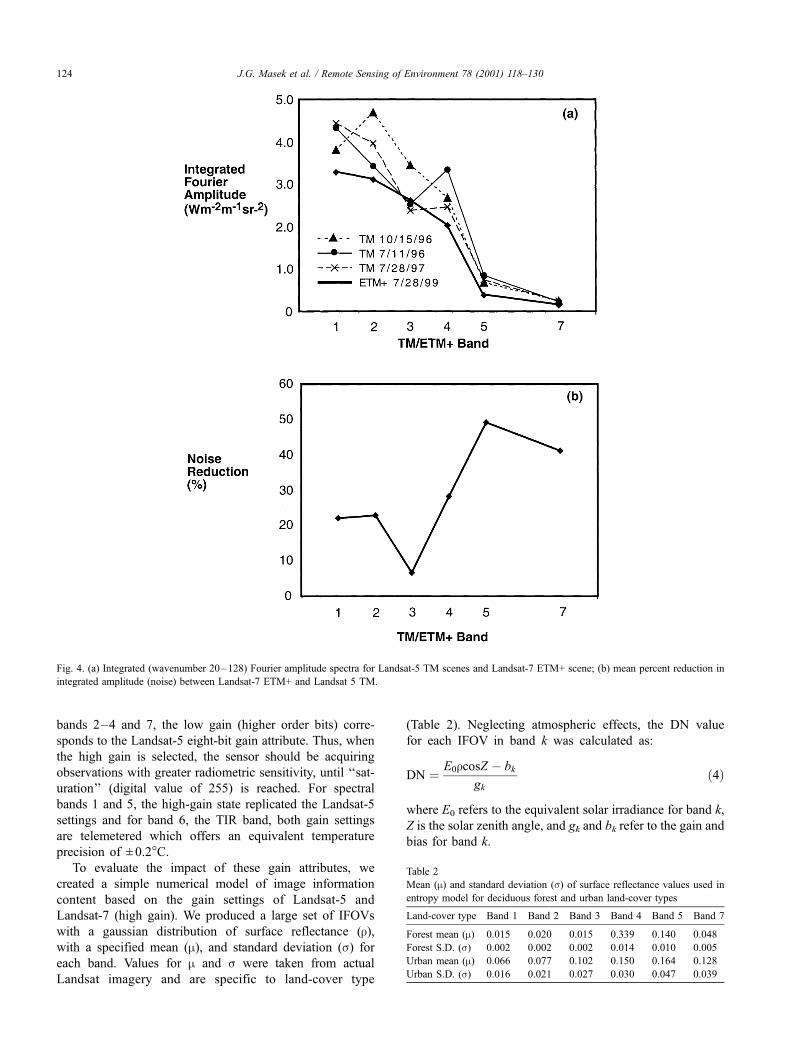
Integrating each radial amplitude spectrum from wave-
number k = 20 to k = 128 gives a rough measure of the total
noise content in each band (Fig. 4). This integration reveals
that Landsat-7 ETM+ exhibits about 20–40% less noise in
each band compared to Landsat-5. The greatest relative
improvement appears in bands 5 and 7, while the least
improvement appears in band 3. It should be noted that
these figures are only valid for dark targets. Since striping
may arise from errors in detector gains, some part of the
spatial noise is likely to be correlated with target brightness.
A future task will be to fully quantify ETM+ spatial noise
levels as a function of target brightness.
3.3. Radiometric information content
The two-gain state characteristic of the Landsat-7 ETM+
instrument presents the interesting potential of providing
more radiometric precision, and, thus, better land-cover
discrimination than previous TM observations. The gain
attributes of the ETM+ were set such that for spectral
Fig. 3. Fourier radial amplitude spectra for band 4, comparing two Landsat-5 TM images with the 7/28/99 Landsat-7 image. Although the peak noise levels are
comparable between the two sensors, the number of peaks and integrated noise level is considerably lower for Landsat-7.
J.G. Masek et al. / Remote Sensing of Environment 78 (2001) 118–130 123
bands 2–4 and 7, the low gain (higher order bits) corre-
sponds to the Landsat-5 eight-bit gain attribute. Thus, when
the high gain is selected, the sensor should be acquiring
observations with greater radiometric sensitivity, until ‘‘sat-
uration’’ (digital value of 255) is reached. For spectral
bands 1 and 5, the high-gain state replicated the Landsat-5
settings and for band 6, the TIR band, both gain settings
are telemetered which offers an equivalent temperature
precision of ± 0.2�C.To evaluate the impact of these gain attributes, we
created a simple numerical model of image information
content based on the gain settings of Landsat-5 and
Landsat-7 (high gain). We produced a large set of IFOVs
with a gaussian distribution of surface reflectance (r),with a specified mean (m), and standard deviation (s) for
each band. Values for m and s were taken from actual
Landsat imagery and are specific to land-cover type
(Table 2). Neglecting atmospheric effects, the DN value
for each IFOV in band k was calculated as:
DN ¼ E0rcosZ � bk
gkð4Þ
where E0 refers to the equivalent solar irradiance for band k,
Z is the solar zenith angle, and gk and bk refer to the gain and
bias for band k.
Fig. 4. (a) Integrated (wavenumber 20–128) Fourier amplitude spectra for Landsat-5 TM scenes and Landsat-7 ETM+ scene; (b) mean percent reduction in
integrated amplitude (noise) between Landsat-7 ETM+ and Landsat 5 TM.
Table 2
Mean (m) and standard deviation (s) of surface reflectance values used in
entropy model for deciduous forest and urban land-cover types
Land-cover type Band 1 Band 2 Band 3 Band 4 Band 5 Band 7
Forest mean (m) 0.015 0.020 0.015 0.339 0.140 0.048
Forest S.D. (s) 0.002 0.002 0.002 0.014 0.010 0.005
Urban mean (m) 0.066 0.077 0.102 0.150 0.164 0.128
Urban S.D. (s) 0.016 0.021 0.027 0.030 0.047 0.039
J.G. Masek et al. / Remote Sensing of Environment 78 (2001) 118–130124

A convenient measure of information content is the
entropy of an image (Malila, 1985; Price, 1984). Following
the pioneering information theory of Shannon (1948)
entropy (E) can be defined in terms of information content as:
E ¼ �XNi¼0
pðiÞlog2 pðiÞ ð5Þ
where p(i) gives the probability of occurrence of a specific
numerical value i (e.g. a specific DN) in the range 0–N. In
practice, p(i) is simply the normalized value of the ith bin of
the image DN histogram. For the case of Landsat,
N = 28 = 256, and a histogram for which all values are
equally filled (flat histogram) yields E = 8, which is the
maximum possible information content. Alternatively, if all
Fig. 5. Simulated entropy per band (bits) using gain settings from Landsat-5 TM and Landsat-7 ETM+, and representative surface reflectance distributions for
(a) urban and (b) forest land-cover types.
Fig. 6. Entropy per band (bits) for Landsat-5 TM (dashed line) and Landsat-7 ETM+ (solid line) from data acquired during the simultaneous underfly on June 2,
1999 of the Washington, DC region.
J.G. Masek et al. / Remote Sensing of Environment 78 (2001) 118–130 125

values reside in one bin, E = 0, which is the lowest possible
information content (Price, 1984). Thus, E records the
number of bits required to actually characterize the image
signal, with the maximum possible entropy set by the level
of digitization of the data. Using the set of calculated DN
values for TM and ETM+ from Eq. (4), the entropy for each
set can be obtained using Eq. (5).
Given typical reflectance spectra for forest and urban
land-cover types (Table 2), the simulated ETM+ entropy
distributions show increased information content in all
bands, except bands 1 and 5 (Fig. 5). This finding fits the
specification of the instrument, since the high-gain state for
ETM+ bands 1 and 5 nearly replicate the gain of the
equivalent TM bands. Bands 2 and 3 record the greatest
improvement compared to Landsat-5 TM, with slightly less
than 1 bit of additional information content present within
ETM+ imagery. Since the standard deviation of surface
reflectance tends to scale with brightness, absolute values
of entropy tend to scale with target brightness as well. For
example, forest targets in the visible wavelengths use only
2–3 bits of the full 8-bit image, while forest targets in the
infrared use 4–5 bits.
To compare the model predictions of information
content with actual Landsat imagery, entropy can be
calculated directly from actual image histograms using
Eq. (5). For this analysis, we used Landsat-5 and Land-
sat-7 data from Washington, DC, using scenes both from
different years, as well as imagery from the tandem
overflight of on June 2, 1999 (Table 1). Entropy was
calculated for seven of the most typical land-cover
categories within the scene, using 250–300 pixels per
class (Figs. 6 and 7). For Washington, DC, these land-
cover types included estuarine water, urbanized area,
residential area, grassland (dry), growing crops, wetlands,
and deciduous forest. In addition, entropy for larger areas
covering a mixture of the typical classes was also
calculated (DC mix in Figs. 6 and 7). For all ETM+
scenes, the VNIR SWIR bands were acquired in high-
gain mode, but the low-gain thermal band was used for
the entropy analysis.
Fig. 7. Entropy per band (bits) for Landsat-5 TM (acquired 7/11/96 — short dashed line; 7/14/97 — long dashed line) and Landsat-7 (acquired 7/28/99 — solid
line), for the Washington, DC region.
J.G. Masek et al. / Remote Sensing of Environment 78 (2001) 118–130126
Results from the Landsat-5/Landsat-7 overflight of the
Washington, DC area (Fig. 6) indicate that ETM+ in high-
gain mode records up to 1 bit of extra information for
specific bands and land-cover types, a finding in excellent
agreement with the gain model (Fig. 5). Again, bands 2, 3,
and 7 showed a pronounced increase in information
content for most land-cover types, while band 4 also
showed an increase for crops and grassland. ETM+ bands
1 and 5 showed little change compared to Landsat-5 TM.
The overall trend is summarized in the graph titled DC
mix (Fig. 6).
Using Landsat TM/ETM+ data from different years
yields similar results (Fig. 7). Slight differences reflect
differing atmospheric and/or land-cover conditions
between the image acquisitions. The atmospheric effect
on entropy values can be well observed by comparing the
7/11/96 and 7/14/97 Landsat-5 TM plots for urban areas,
which should be relatively invariant from year to year
(Fig. 7). Although the entropy values should be nearly
identical, a higher aerosol load on 7/14/97 caused a loss of
information in the visible and near-infrared bands. It is an
interesting design implication that, despite advanced engin-
eering to improve gain, atmospheric contamination can
readily decimate such improvements. The creation of
robust atmospheric correction algorithms must be a pri-
ority in order to recover the full information content from
current and future sensors.
It should be noted that differences in spatial noise
quantified in Section 3.2 will also affect the actual informa-
tion content (entropy) of Landsat imagery. While noise is
(by definition) not scientifically useful, it does add vari-
ability to an image, increasing the information content.
Thus, the entropy values for Landsat-5 TM data shown in
Figs. 6 and 7 would actually be lower if the spatial noise
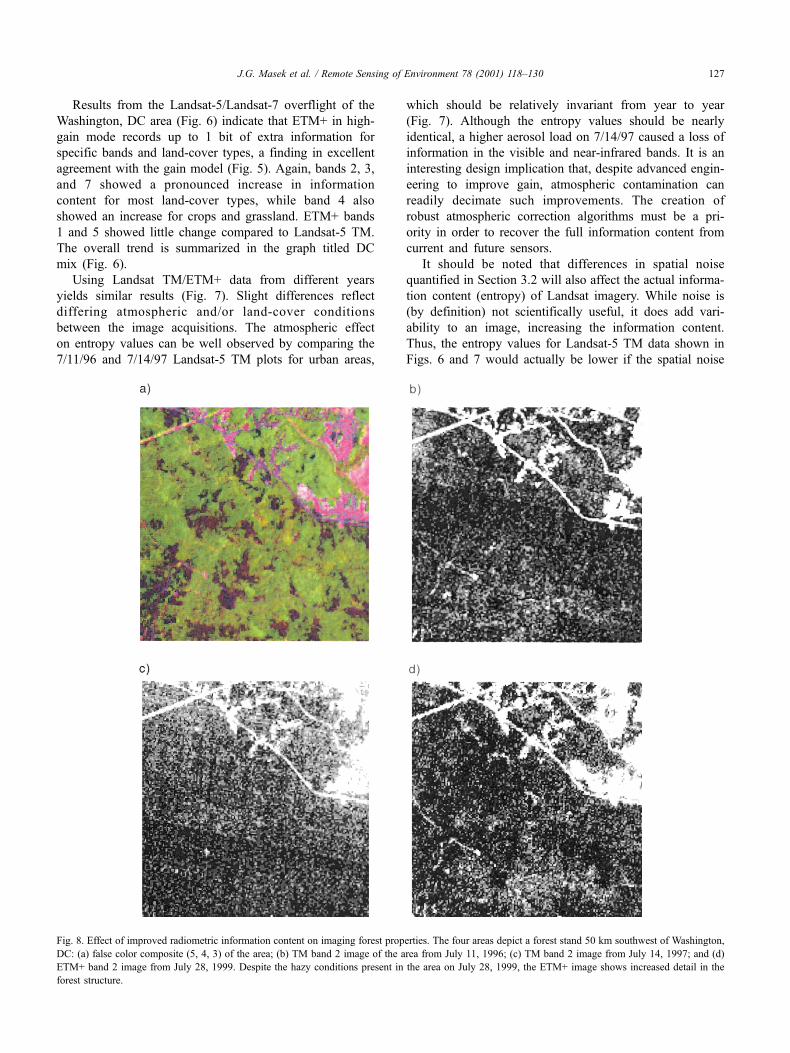
Fig. 8. Effect of improved radiometric information content on imaging forest properties. The four areas depict a forest stand 50 km southwest of Washington,
DC: (a) false color composite (5, 4, 3) of the area; (b) TM band 2 image of the area from July 11, 1996; (c) TM band 2 image from July 14, 1997; and (d)
ETM+ band 2 image from July 28, 1999. Despite the hazy conditions present in the area on July 28, 1999, the ETM+ image shows increased detail in the
forest structure.
J.G. Masek et al. / Remote Sensing of Environment 78 (2001) 118–130 127
were removed. Modeling suggests that removing an extra 1
DN of noise could lower entropy values by up to 0.5 bits
for dark targets. Therefore, the results presented in Figs. 5
and 6 must be considered as lower bounds on the actual
improvement in information content accomplished by
migrating to the ETM+ sensor.
4. Implications for land-cover characterization
The statistical comparisons presented above indicate that
the performance of the Landsat-7 ETM+ sensor represents a
substantial improvement over the earlier Landsat-5 TM. The
data are more accurately navigated, have a lower level of
noise, greater radiometric sensitivity, and appear to be
accurately (or at least consistently) calibrated. The real test,
however, is the extent to which these sensor improvements
translate to improved characterization of the terrestrial
environment. While a complete understanding of how Land-
sat-7 can be used to best advantage will take several years,
and is certainly beyond the scope of this paper, we present
here a few observations that might guide other researchers
using Landsat-7 data.
4.1. Radiometric precision and land-cover discrimination
Given the improved information content of ETM+, one
might hope that subtle land-cover features, previously
missed by the lower gain of the Landsat-5 sensor, could
be recorded. This should be particularly clear for dark
targets in bands 2 and 3 (e.g. forest, water), since these
bands show strong improvement in information content.
Our initial observations confirm this view. ETM+ band 2
images of forest cover from Central and Western Virginia
converted to at-sensor radiance and stretched to a uniform
radiance range indicate both less noise and slight improve-
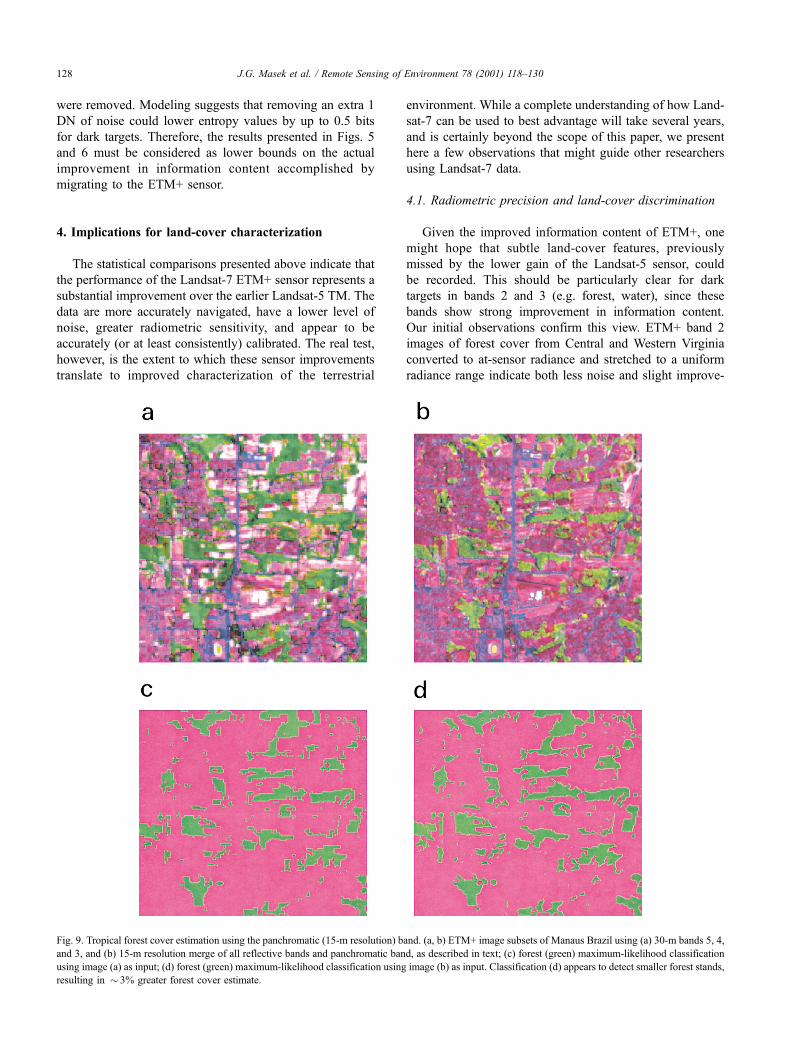
Fig. 9. Tropical forest cover estimation using the panchromatic (15-m resolution) band. (a, b) ETM+ image subsets of Manaus Brazil using (a) 30-m bands 5, 4,
and 3, and (b) 15-m resolution merge of all reflective bands and panchromatic band, as described in text; (c) forest (green) maximum-likelihood classification
using image (a) as input; (d) forest (green) maximum-likelihood classification using image (b) as input. Classification (d) appears to detect smaller forest stands,
resulting in � 3% greater forest cover estimate.
J.G. Masek et al. / Remote Sensing of Environment 78 (2001) 118–130128
ment in the ability to image subtle brightness variations
within the forest cover compared to TM (Fig. 8). The
improvement suggests that Landsat-7 may be able to
recover subtle variations attributable to vegetation pheno-
logy and health that are currently being missed by Landsat-
5. It also points to the importance of increasing the bit-depth
of future Landsat-type imagery, with 12-bit data now being
standard for the industry.
4.2. Panchromatic band
Unlike previous Landsat sensors, ETM+ includes a high-
resolution (15-m resolution) panchromatic band. Due to the
limitations of the scanning architecture of ETM+, obtaining
sufficient energy for15-m resolution required a wide band-
pass for the panchromatic band, effectively integrating the
visible and near-infrared spectrum. Two important roles for
the panchromatic band include precision coregistration of
images and developing more accurate classifications of land
cover. The first application simply requires that known
ground-control points (GCPs) be registered to the 15-m
panchromatic band rather than the 30-m multispectral
bands. Assuming a < 1 pixel RMS error associated with
image warping, use of the panchromatic band should enable
precision image-to-image registration with an accuracy of
< 15 m. This represents a substantial improvement over the
current TM system, and should be invaluable for calculating
accurate change detection estimates (Townshend, Justice,
Gurney, & McManus, 1992).
The second opportunity, improving land-cover clas-
sification, relies on using the 15-m panchromatic band as
an added input to the classification process. The finer
spatial resolution should change the calculated area of
individual classes in proportion to the degree of spatial
fragmentation. To evaluate this possibility, we have com-
pared forest/nonforest classification of fragmented tropical
forest in Manaus Brazil, using (a) just the 30-m resolution
reflective ETM+ bands and (b) both the 30-m bands and
the 15-m resolution panchromatic band. A spatial–spectral
image merge of ETM+ reflective bands (30 m) with
panchromatic band (15 m) was performed prior to the
classification process using a principal component (PC)
transformation. The original 30-m resolution data were
supersampled to 15-m resolution. After performing a
standard PC on the multispectral data, the panchromatic
band was substituted for the first PC, and then transformed
back to the original feature space. The back-transformed
data layers, with 15-m resolution, were then used as inputs
for a maximum-likelihood classification.
The two classifications were performed on a portion of
the L1G image of the Manaus area (Fig. 9). The 4� 4 km
area covers the urban center of Manaus city and includes
patches of tropical forest (mostly forest regeneration). Com-
paring the 30- and 15-m resolution classification, it is
apparent that the panchromatic band allows the detection
of small forest patches missed in the coarser, 30-m resolu-
tion class map. The total area of forest cover in the image
subset is 3% greater when calculated with the 15-m resolu-
tion data. While this appears insignificant when working at
the local scale, it could be important when monitoring forest
status at regional to global scales.
5. Conclusions
Our analyses show that ETM+ data continues the her-
itage of Landsat-5 TM, and, in some ways, substantially
improves on it. In particular, the ability to automatically
navigate pixels to within 50 m of the actual ground location
will promote the use of Landsat for large-area analysis, and
applications requiring multidate imagery such as change
detection. The improvements in ETM+ radiometric informa-
tion content, while more subtle, will likely be useful for
mapping spatial variability within vegetated landscapes. The
decreased levels of noise and increased radiometric pre-
cision inherent in ETM+ imagery paves the way for future
improvements in next-generation Landsat-type sensors.
Acknowledgments
The authors thank Dr. Phillipe Teillet and Jennifer
Seiferts for making Landsat-5/Landsat-7 underfly imagery
available. This work was supported by NASA grant NAG
53454 to the Landsat Science Team. Two anonymous
reviewers are thanked for providing constructive comments.
References
Bernard, A. (1997). Earth Sciences Data Information System (ESDIS)
Level 1 Product Generation System (LPGS) System Design Specifica-
tion. NASA Goddard Spaceflight Center, 510-4SDS/0196.
Chavez, P. S. (1996). Image-based atmospheric corrections — revisited and
improved. Photogrammetric Engineering and Remote Sensing, 62,
1025–1036.
Crippen, R. E. (1989). A simple spatial filtering routine for the cosmetic
removal of scan-line noise from Landsat TM P-tape imagery. Photo-
grammetric Engineering and Remote Sensing, 55, 327–331.
Goward, S. N., Haskett, J., Williams, D., Arvidson, T., Gasch, J., Lonigro,
M., Reeley, M., Irons, J., Dubayah, R., Turner, S., Campana, K., &
Bindschadler, R. (1999). Enhanced Landsat capturing all the Earth’s land
areas. EOS Transactions, American Geophysical Union, 26, 289–293.
Goward, S. N., &Williams, D. L. (1997). Landsat and Earth systems science:
development of terrestrial monitoring. Photogrammetric Engineering
and Remote Sensing, 63, 887–900.
Helder, D. L., Quirk, B. K., & Hood, J. J. (1992). A technique for the
reduction of banding in Landsat Thematic Mapper images. Photogram-
metric Engineering and Remote Sensing, 58, 1425–1431.
Malila, W. A. (1985). Comparison of the information contents of Landsat
TM and MSS data. Photogrammetric Engineering and Remote Sensing,
51, 1449–1457.
Markham, B. L., & Barker, J. (1985). Spectral characterization of the Land-
sat Thematic Mapper sensors. International Journal of Remote Sensing,
6, 697–716.
Poros, D. J., & Peterson, C. J. (1985). Methods for destriping Landsat
J.G. Masek et al. / Remote Sensing of Environment 78 (2001) 118–130 129
Thematic Mapper images — a feasibility study for an online destriping
process in the Thematic Mapper Image Processing System (TIPS).
Photogrammetric Engineering and Remote Sensing, 51, 1371–1378.
Press, W. H., Flannery, B. P., Teukolsky, S., & Vetterling, W. T. (1988).
Numerical recipes in C (p. 735). New York: Cambridge Univ. Press.
Price, J. (1984). Comparison of the information content of data from the
Landsat-4 Thematic Mapper and the Multispectral Scanner. IEEE
Transactions on Geoscience and Remote Sensing, GE-17, 272–280.
Shannon, C. E. (1948). A mathematical theory of communication. Bell
System Technical Journal, 27, 623–656.
Sheffner, E. J. (1994). The Landsat program: recent history and prospects.
Photogrammetric Engineering and Remote Sensing, 60, 735–744.
Teillet, P. M., Barker, J., Markham, B. L., Irish, R. R., Fedosejevs, G., &
Storey, J. C. (2001). Radiometric cross-calibration of the Landsat-7
ETM+ and Landsat-5 TM sensors based on tandem data sets. Remote
Sensing of Environment, 78 (1–2), 39–54.
Townshend, J. R. G., Justice, C. O., Gurney, C., & McManus, J. (1992).
The impact of misregistration on the detection of changes in land-
cover. IEEE Transactions on Geoscience and Remote Sensing, 30,
1054–1060.
Vogelmann, J. E., Choate, M. J., Helder, D., Merchant, J. W., & Bulley, H.
(1999). Effects of Landsat Thematic Mapper radiometric and geometric
calibrations on selected land cover analyses. In: Proceedings of the
Fourteenth William T. Pecora Memorial Remote Sensing Symposium.
(pp. 143–153). Bethesda MD: American Society for Photogrammetry
and Remote Sensing. (CD-ROM).
Vogelmann, J. E., Helder, D., Morfitt, R., Choate, M., & Merchant, J.
(1998). Characterization of Landsat Thematic Mapper radiometry
and geometry for land cover analysis. In: IGARSS ’98, Proceedings
of the International Symposium on Geoscience and Remote Sensing,
Seattle, WA, IEEE Geoscience and Remote Sensing Society (CD-
ROM, unpaginated).
J.G. Masek et al. / Remote Sensing of Environment 78 (2001) 118–130130