Embed Size (px)
Citation preview
Masoudi et al., JMES, 2017, 8 (8), pp. 2975-2985 2975
JMES, 2017 Volume 8, Issue 8, Page 2975-2985
http://www.jmaterenvironsci.com/
1. Introduction Land-use planning is the systematic assessment of land and water potential, alternatives for land-use and
economic and social conditions in order to select and adapt the best land-use options [1]. This definition
embraces the systematic approach of possibilities for different land-uses in the future, and also the (felt) need for
changes and the willingness to execute the plan all present land-use planning is caught up between two
seemingly contradictory dimensions: ecological conservation and economic existence. Both dimensions are, in
some way or another, related to sustainability in land-use planning, sustainability as a goal is often criticized as
being vague and a paradox. The conflicting problem of economic development and ecological conservation is
often mentioned: „„we cannot save the environment without development and that we cannot continue to
develop anywhere unless we save the environment [2].
In other hand, Unplanned and ungoverned development is one of the main problems in developing countries. To
achieve sustainable development goals, evaluation of ecological capability as a basic study and foundation of
land use planning, is a requisite action to accomplish development process in accordance with environmental
capabilities. Besides, human-nature relation has achieved the real understanding of “human with nature” notion
with gradual disappearing of old thoughts of “human on nature [3].
Arid and semi-arid lands cover more than 70% of Iran and are very prone to desertification [4, 5]. As a result of
the following factors, land degradation and desertification have accelerated in Iran during the recent decades:
first, the population has doubled over the last 25 years (since 1979); second, increased agricultural and pastoral
products have forced people to use land extensively or convert forest and rangelands to cultivated land; third,
overuse of wood and plants as fuel for household cooking and heating, and use of natural regulations tend to
denude the soil and intensify the desertification [6]. Abu Hammad and Tumeizi [7] investigated the
socioeconomic factors and causes of land degradation (e.g. population growth and urbanization, poverty,
overgrazing, pollution, biodiversity, erosion) in the eastern part of the Mediterranean region. Results revealed a
significant land use change from agricultural and natural vegetation to urbanized areas due to the high
population increase during the last 80 years.
In this regard, land use planning is a kind of long-term planning that considers the land as a determined factor in
supplying development goals. Land use planning based on regulations with permanent and suitable return view,
Journal of Materials and Environmental Sciences ISSN: 2028-2508
Copyright © 2017,
University of Mohammed V
Rabat Morocco
http://www.jmaterenvironsci.com/
Land Use Planning using a Quantitative model and Geographic Information
System (GIS) in Darab County, Iran
M. Masoudi*, P. Jokar, M. Sadeghi
Department of Natural Resources and Environmental Engineering, Shiraz University, Iran
Abstract Land use planning is a science that determines the type of land use through studying the
ecological character of the land as well as its socio-economic structure. The primary
objective of this study is to evaluate the land use and natural resources for future
sustainable land planning using GIS as a tool. So, In this study, a systematic method
known as the Makhdoum Model was used for the analysis of maps in relation to the
ecological and resources of the studied area. First, ecological capability maps of different
land uses including forestry, agriculture, range management, environmental conservation,
ecotourism and development of village, urban and industry were developed by overlaying
geographical maps based on Boolean overlay method (as a Multi-Criteria Evaluation
Method) in GIS for the Township. The final step of this study was the prioritization of
land uses considering the ecological and socio-economic characteristics of the study area
using a quantitative model. The results of the evaluation indicated that the maximum area
of proposed uses is 33.2% that is related to irrigation agriculture showing this land use has
high potential and socio-economic demands in study area. While minimum area of
proposed uses is related to dry farming.
Received 07 Nov 2016,
Revised 24 Feb 2017,
Accepted 28 Feb 2017
Keywords
Land use planning
Modified Model
GIS
Darab County
[email protected] , Phone: (+98) 917 339 9877
Masoudi et al., JMES, 2017, 8 (8), pp. 2975-2985 2976
according to the qualitative and quantitative capabilities and talents for different use of human from the land
shall render type of utilization. Thus waste of natural resources and ruining of the environment will be stopped.
In ecological evaluation, GIS is quickly becoming data management standard in planning the use of land and
natural resources. Virtually all environmental issues involve map–based data, and real world problems typically
extend over relatively large areas [8]. Actually a geographical information system (GIS) use to access for
geography patterns [9] as well as Nowadays, GIS has become an indispensable tool for land and resource
managers [10].
Land use, in general, consists of the coordination of the relation between humans and the land and their
activities on the land for the proper and long-term use of provisions for the betterment of the material and
spiritual condition of the society over time. Land planning requires extensive infrastructural research and
keeping the economic condition of the area under study in mind. It can be undeniably stated that land use
planning of an area without considering the socio-economic condition of that area is virtually impossible [11,
12, and 13]. While a part of an area in theory possibly has the potential for a certain use, it may be practically
impossible to implement. Hence, one must base the ecological potential of an area for a certain use on the socio-
economic ability of that area in addition to its ecological conditions. On the other hand, the lack of necessary
knowledge of land potential and the irrational use of the land by humans bring about further reduction of land
resources. In other words, the sustainable development or best use of the land will be carried out by assigning
the land use zones on the basis of capability, compatibility, use of proper technology and measures to protect
environmental degradability [14].
Bojo´rquez-Tapia et al [15] presenting a GIS-based multivariate application for land suitability assessment with
a public participation base is also a typical case. Oyinloye and Kufoniyi [16] analyzed the urban land use
change, 2000 and 2010 IKONOS are used in a post classification comparison analysis to map the land use
changes and identify the conversion process in Ikeja, GRA, Lagos. The results showed increase in commercial
land uses between the same periods. Also, the application of urban satellite images with higher ground
resolution was found to be effective in monitoring the land use changes and providing valuable information
necessary for planning and research.
Peel and Lloyd [17] consider four contemporary challenges facing land use planning practice, and suggest that a
new ethos for land use policy making is emerging. Biswas and Baran Pal [18] in the District Nadia, West
Bengal, investigated that how fuzzy goal programming can be efficiently used for modeling and solving land-
use planning problems in agricultural systems for optimal production of several seasonal crops in a planning
year. Gandasasmita and Sakamoto [19] addressed a multi-criteria analysis approach to agricultural landscape
planning. This case study was conducted in the Cianjurwatershed, West Java, Indonesia. Results showed that
proposed agro-ecological land-use was planned under which the land-utilization types would not cause more
than tolerable soil loss, would be at least marginally suitable with regard to land resources quality, and would be
economically feasible.
Current land use planning in Iran by Makhdoom Quantitative Method has some problems like difficulties in
assessment of ecological and socio-economic information used in related scenarios. Also it is possible because
of sum of scores derived from different scenarios in current model; a land use without ecological capability is
prioritized or part of city is recommended to change to a pasture. Therefore the main goal of this study is to
solve these problems and develop and modify the current quantitative method of Makhdoom Model to evaluate
better land use planning in Iran.
2. Materials and methods 2.1. Study area
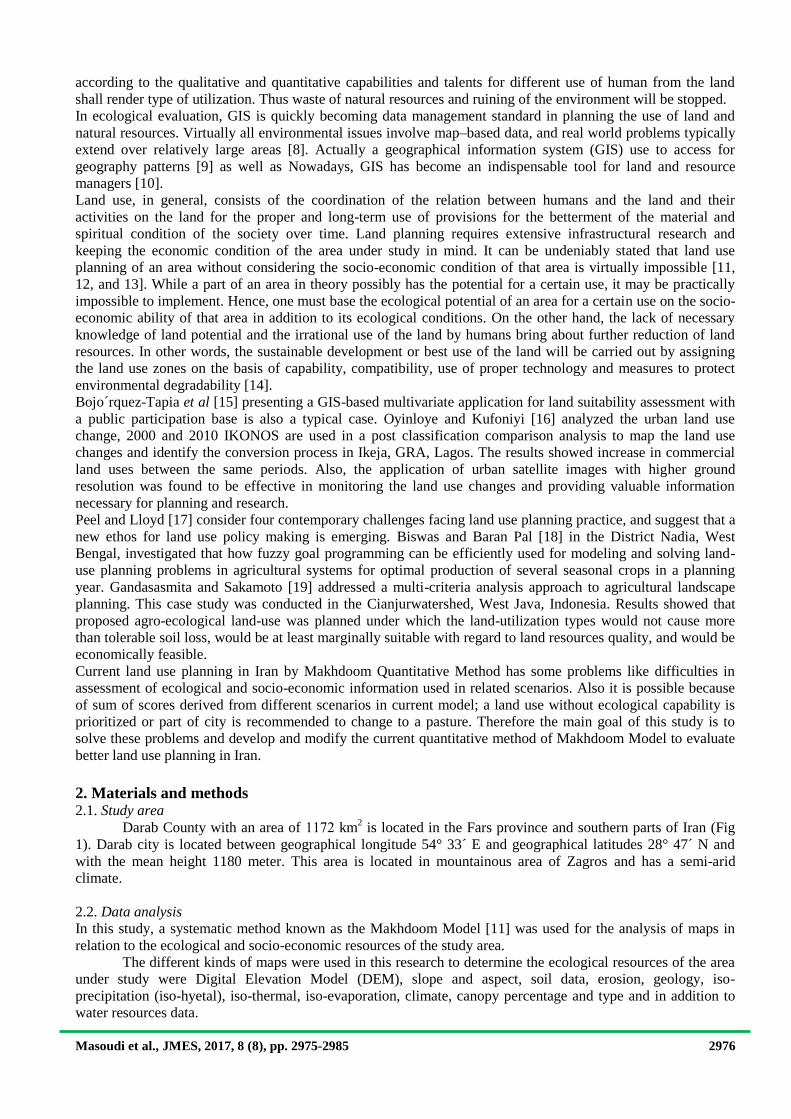
Darab County with an area of 1172 km2 is located in the Fars province and southern parts of Iran (Fig
1). Darab city is located between geographical longitude 54° 33´ E and geographical latitudes 28° 47´ N and
with the mean height 1180 meter. This area is located in mountainous area of Zagros and has a semi-arid
climate.
2.2. Data analysis
In this study, a systematic method known as the Makhdoom Model [11] was used for the analysis of maps in
relation to the ecological and socio-economic resources of the study area.
The different kinds of maps were used in this research to determine the ecological resources of the area
under study were Digital Elevation Model (DEM), slope and aspect, soil data, erosion, geology, iso-
precipitation (iso-hyetal), iso-thermal, iso-evaporation, climate, canopy percentage and type and in addition to
water resources data.
Masoudi et al., JMES, 2017, 8 (8), pp. 2975-2985 2977
Figure 1: Position of Darab in Fars Province
These data for this study have been gathered from the records and reports published by the different departments
of the Ministries of Agriculture and Energy and the Meteorological Organization of Iran. The data in this paper
are included in two types 1) numerical numerical and descriptive data and 2) thematic maps, but mainly in the
map format (vector) with mostly semi-detailed scale (1:50000 scale) for the GIS analysis. All such relevant data
(based on table1) were obtained from the local and main offices and institutes of the Ministries of Agriculture
and Energy and the Meteorological Organization of Iran. Also some soil samples and field data also were
gathered during field work to check and improve the maps and reports used, wherever needed.
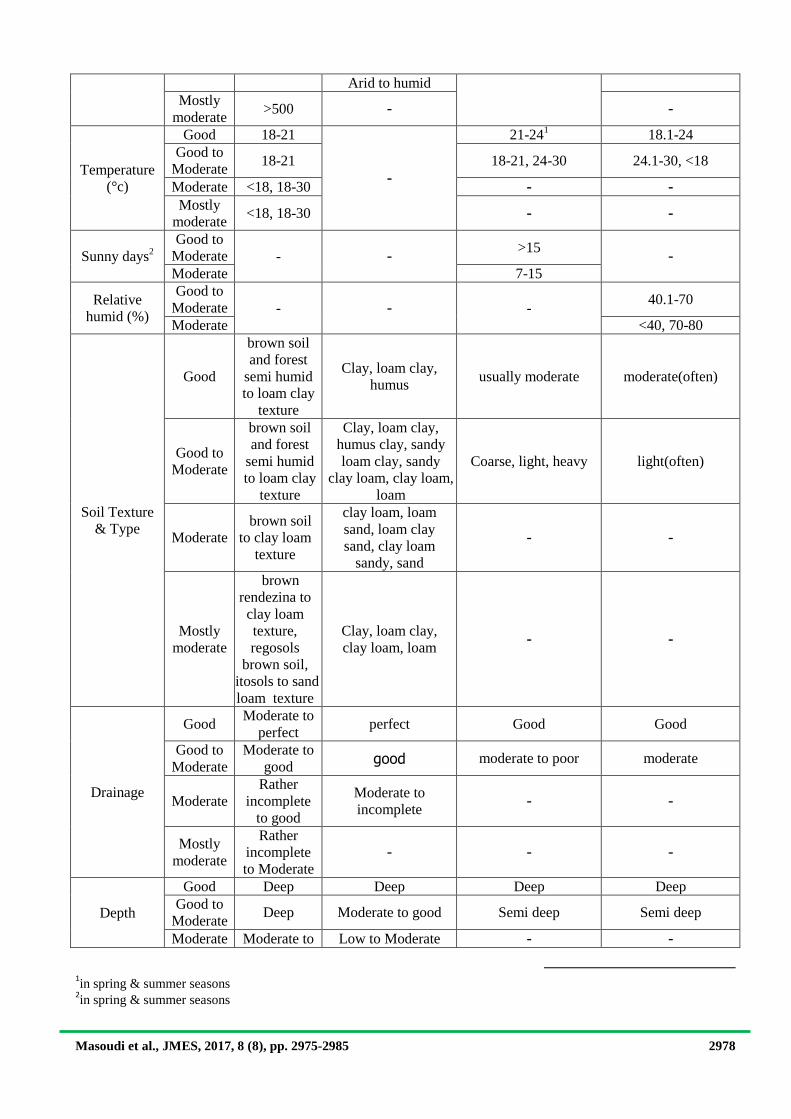
Table 1: Moderate and good classes for every use.
Indicators Class
Forestry
(classes 1-
4)
Agriculture & range
management(classes
1-4)
Ecotourism(intensive)
(classes 1-2)
Development(classes
1-2)
Elevation(m)
Good 0-1000
- -
400-1200
Good to
Moderate 0-1000 0-400, 1200-1800
Moderate 0-1400 - Mostly
moderate 400-1800 -
Slope (%)
Good 0-25 0-5 0-5 0-12 Good to
Moderate 0-35 5-8 5-15 12-20
Moderate 0-45 - - - Mostly
moderate 0-55 8-15 - -
Climate and
Precipitation
(mm)
Good >800
Warm & moderate
(Mediterranean to
humid)
-
501-800
Good to
Moderate >800
Warm & moderate
& cold (Semi-arid
to humid)
51-500, >800
Moderate >500 Warm & moderate
& cold & very cold) -
Masoudi et al., JMES, 2017, 8 (8), pp. 2975-2985 2978
Arid to humid
Mostly
moderate >500 - -
Temperature
(°c)
Good 18-21
-
21-241 18.1-24
Good to
Moderate 18-21 18-21, 24-30 24.1-30, <18
Moderate <18, 18-30 - - Mostly
moderate <18, 18-30 - -
Sunny days2
Good to
Moderate - - >15
- Moderate 7-15
Relative
humid (%)
Good to
Moderate - - - 40.1-70
Moderate <40, 70-80
Soil Texture
& Type
Good
brown soil
and forest
semi humid
to loam clay
texture
Clay, loam clay,
humus usually moderate moderate(often)
Good to
Moderate
brown soil
and forest
semi humid
to loam clay
texture
Clay, loam clay,
humus clay, sandy
loam clay, sandy
clay loam, clay loam,
loam
Coarse, light, heavy light(often)
Moderate
brown soil
to clay loam
texture
clay loam, loam
sand, loam clay
sand, clay loam
sandy, sand
- -
Mostly
moderate
brown
rendezina to
clay loam
texture,
regosols
brown soil,
litosols to sand
loam texture
Clay, loam clay,
clay loam, loam - -
Drainage
Good Moderate to
perfect perfect Good Good
Good to
Moderate
Moderate to
good good moderate to poor moderate
Moderate
Rather
incomplete
to good
Moderate to
incomplete - -
Mostly
moderate
Rather
incomplete
to Moderate - - -
Depth
Good Deep Deep Deep Deep Good to
Moderate Deep Moderate to good Semi deep Semi deep
Moderate Moderate to Low to Moderate - -
1in spring & summer seasons
2in spring & summer seasons

Masoudi et al., JMES, 2017, 8 (8), pp. 2975-2985 2979
good
Mostly
moderate
Moderate to
good - - -
Structure
Good
Granulating
fine to
moderate, a
bit Gravel,
Evoluted
Granulating fine to
moderate, none
Gravel, Evoluted,
low erosion
Perfect evolution
Slight erosion to
Granulating
Moderate and
Perfect evolution
Good to
Moderate
Granulating
fine to
moderate, by
Gravel,
Evoluted
Granulating fine to
moderate, none
Gravel, Evoluted,
low to moderate
erosion moderate evolution
moderate erosion to
Granulating Fine,
Coarse and moderate
evolution Moderate
Granulating
fine to
moderate,
by Gravel,
Evoluted
Granulating
moderate to coarse,
by Gravel, moderate
Evolution, moderate
erosion
Mostly
moderate
Granulating
fine to
moderate, by
Rubble, low to
moderate
Evolution
- - -
Fertility
Good perfect perfect Good, Moderate Good, Good to
Moderate Good Good Low Moderate
Moderate Moderate to
good Moderate - -
Mostly
moderate
Low to
Moderate - - -
Canopy
Cover (%)
Good >80
-
Forest lands(With
canopy cover of >50%) 0-25
Good to
Moderate 60-80
Forest lands
(With canopy cover
of 5-50%) 26-50
Moderate 50-70 - - Mostly
moderate 40-60 - -
Annual
Growth (m3)
Good >6
- - -
Good to
Moderate > 6
Moderate > 5
Mostly
moderate > 4
Quantity of
water
(Lit/day/person)
Good
-
6000-100003 >40 <225
Good to
Moderate 4000-6000 12-39.9 150-225
Moderate 3000-5000 - -
Mostly
moderate To 3000 - -
3m
3/ha
Masoudi et al., JMES, 2017, 8 (8), pp. 2975-2985 2980
Different ecological capability models of Makhdoom method based on ecological data were used to evaluate
ecological capability of different land uses including forestry, agriculture, range management, environmental
conservation, ecotourism and development of village, urban and industry [11]. We can classify an area based on
these models to different capability classes. Ecological capability classes for forestry, agriculture, range
management, environmental conservation, ecotourism and development of village, urban and industry are 7, 7,
4, 3, 3 and 3, respectively. The best capability class is class one and the worst capability class is the last class in
each model. The good and moderate ranges were shown in table 1 [11, 20].
In the next step, after producing ecological capability maps, the land use map was prepared. The model consists
of four scenarios in each land unit including: a) present land utilization of the study area b) economic needs of
the study area c) social needs of the study area d) ecological needs of the study area. All land uses are ranked for
each scenario and then are scored from 10 to lower base on their ranks and ecological capability. For example if
in one scenario, rank of forestry is third place and its ecological capability is class two in a land unit; its score in
first step is given 8 and then one score is lowered for its capability reduction (class two) that makes its score
number 7 for forestry in the land unit. It should say that this one point reduction for forestry in three other
scenarios is repeated because of one place of reduction compared to first class of ecological capability. If
ecological capability class is class three, the reduction in each scenario would be two.
First scenario to make its ranking was evaluated using current land use. But for other scenarios a questionnaire
was prepared to ask from experts of study area to rank different land uses for each scenario based on their
knowledge and experience from study area. In this study, 53 experts in different studied land uses in related
organizations and offices of study area filled out questionnaires. Average of results helped us to rank different
land uses for each scenario. Questionnaire filling is a good method especially for finding socio-economic needs
of an area that depends to many things like: socio-political characteristics, population composition, relative
earning conditions, immigration condition, present land utilization, agriculture and animal husbandry
conditions, hygiene, health, education and other public services. The above socio-economic information helped
the experts for ranking of utilizations in economic and social scenarios. On the other hand expertism evaluation
of socio-economic of agriculture and natural resources and other utilizations make study very difficult.
To achieve a systematic analytical model, all maps layers were used by a vector format in the ArcGIS software
environment. These maps were operated using ArcGIS and the appropriate utilization of each land unit was
determined and prioritized. The appropriate utilizations are those utilizations that have higher sum of scores
among used scenarios. Many of the units were seen fit for two appropriate uses by the systematic model to first
determine and subsequently select the best utilization for the area considering the socio-economic status of the
area, consistency of land uses and current land use.
It is necessary to say some modifications in the process of work were done like no preparation of environmental
units and using current land use map. In this research, current method of systemic analysis for preparation of
environmental units was not utilized for assessing the ecological capability maps and land use planning of
quantitative model. It may be used only for assessing the small areas with low diversity (e.g. small watershed).
Hence, for assessing the larger areas(e.g. large watersheds, counties and provinces), preparation of
environmental units eliminate a lot of information used in the ecological capability models. So, in the present
study all indicator maps related to different ecological capability models were overlaid in GIS. Other
modifications in the process of work done for assessing the land use planning model included:
a) Prioritization of each use was done based on the highest score derived after summing the scenarios' scores
(ecological, economic, social, area) [11]. But, it should be considered appropriate (suitable) capability for
the utilization with highest score.
b) To use current land use map in assessment mainly because of the socio-economic compulsions of the
population especially in rural area. Like to hold the following land utilizations in the end of land use
planning process:
1) Irrigated lands with suitable capability.
2) Settlement lands (urban, rural and industrial area).
3) Dense forests with taking into consideration of compatibility of uses (e.g. conservation).
4) Lake and river bed.
Finally, land use planning maps of the Darab County were developed considering the ecological and socio-
economic characteristics of the area. Process for evaluation included the following steps presented in Fig. 2.

Masoudi et al., JMES, 2017, 8 (8), pp. 2975-2985 2981
Figure 2: Process of evaluation.
3. Results and discussion In this study for each model the related indicators were overlaid. Then land capability maps were accessed. The
capability maps are shown in Figures 3 to 8 and percent of area for different ecological capabilities of land uses
is observed in Table 2.
Figure 3: Land capability map for irrigation agriculture.
Figure 4: Land capability map for range management and dry farming.
Resources
Recognition
Data Collection
(Ecological & Socio-
economic Resources)
Map Producing and
Inputting to ArcGIS
Classification of
Maps
Overlaying of
Information Layers
and Integration
Land-use Planning
Map
Masoudi et al., JMES, 2017, 8 (8), pp. 2975-2985 2982
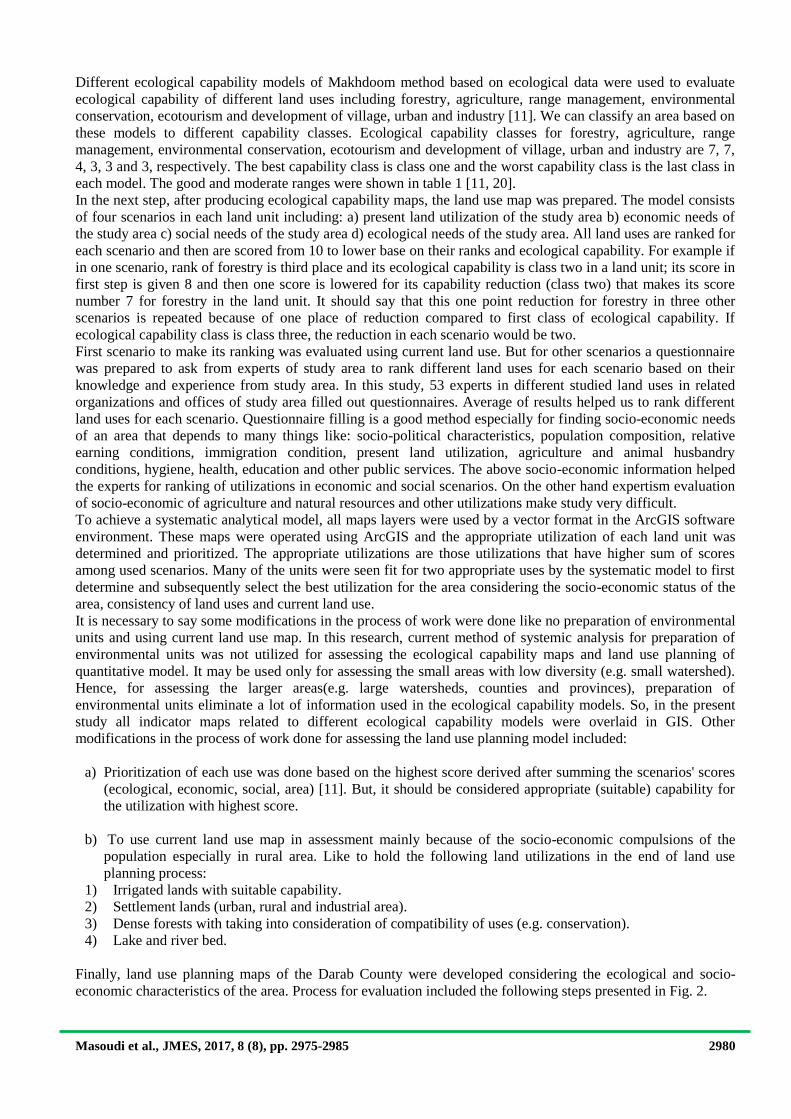
Figure 5: Land capability map for forestry.
Figure 6: Land capability map for environmental conservation.
Figure 7: Land capability map for ecotourism (intensive).
Masoudi et al., JMES, 2017, 8 (8), pp. 2975-2985 2983
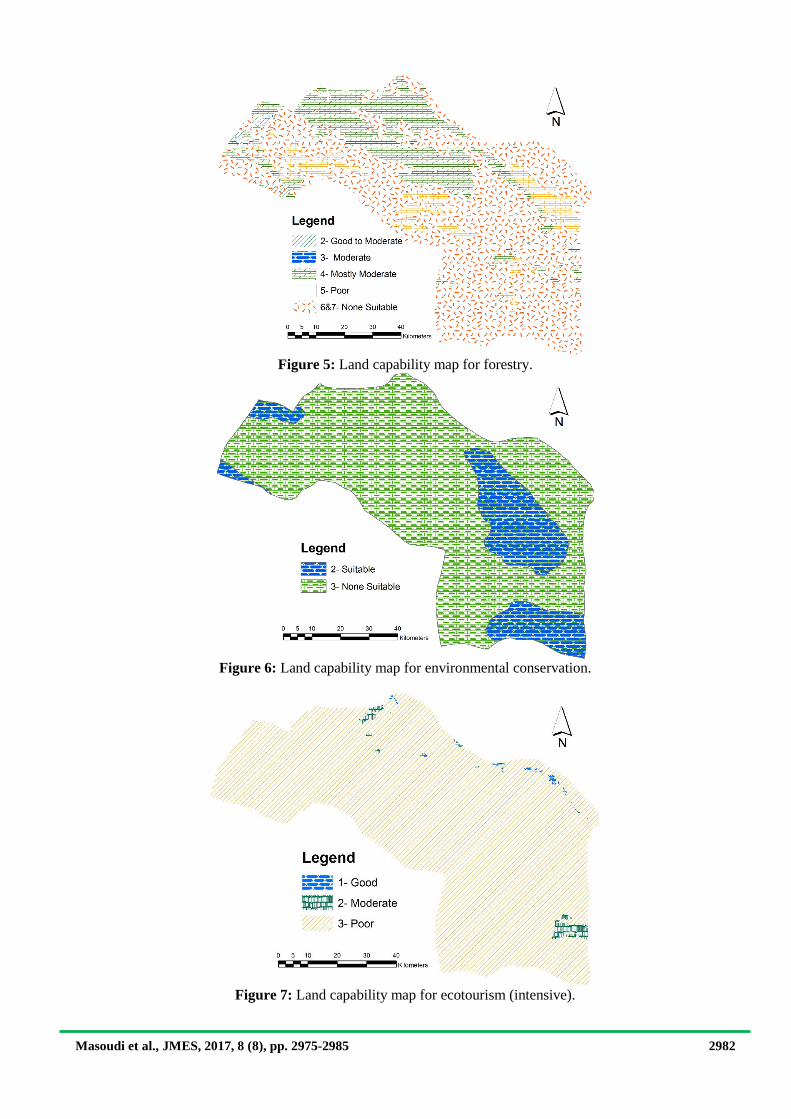
Figure 8: Land capability map for urban, rural and industrial development.
Table2: percent of area for different ecological capabilities of land uses.
Percent class Land Type
1.53 2
Agriculture 21.95 3
34.75 5
41.77 6
23.5 1 Range management & dry
farming 35.1 2
41.4 3
0.95 2
Forestry
0.03 3
20.82 4
8.29 5
16.44 6
53.45 7
21.08 2 Conservation
78.91 3
0.29 1
Ecotourism 1.3 2
98.41 3
11.03 2 Development of urban, rural and
industry 88.96 3
Then land capability maps were overlaid and land use planning map (Fig. 9) by quantitative approach was
assessed. A comparison of land percent in current land use and proposed land use maps is observed in Table 3.
The main results from this comparison indicate that current area is more than proposed area for forestry and
range management showing these land uses are located more than their capabilities in the study area. While
current area is less than proposed area for urban, rural and industrial development, irrigated and environmental
conservation showing these land uses are located less than their capabilities in the study area. Also Fig. 9 and
Masoudi et al., JMES, 2017, 8 (8), pp. 2975-2985 2984
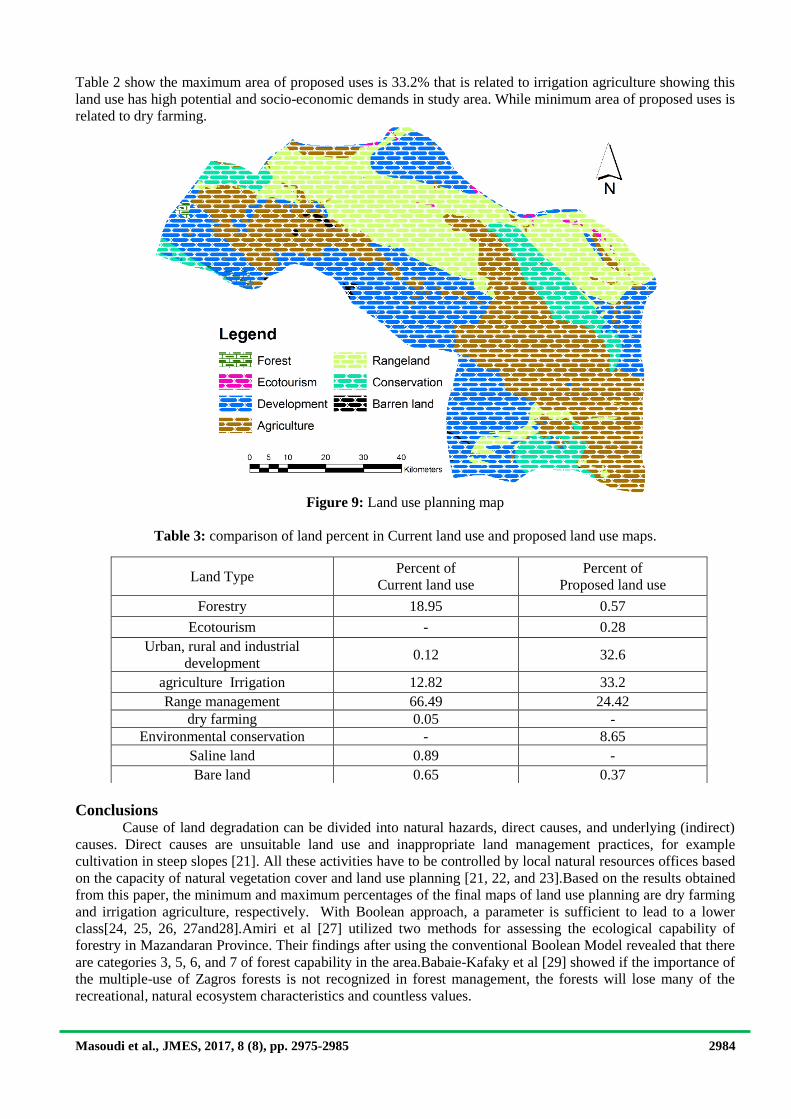
Table 2 show the maximum area of proposed uses is 33.2% that is related to irrigation agriculture showing this
land use has high potential and socio-economic demands in study area. While minimum area of proposed uses is
related to dry farming.
Figure 9: Land use planning map
Table 3: comparison of land percent in Current land use and proposed land use maps.
Conclusions Cause of land degradation can be divided into natural hazards, direct causes, and underlying (indirect)
causes. Direct causes are unsuitable land use and inappropriate land management practices, for example
cultivation in steep slopes [21]. All these activities have to be controlled by local natural resources offices based
on the capacity of natural vegetation cover and land use planning [21, 22, and 23].Based on the results obtained
from this paper, the minimum and maximum percentages of the final maps of land use planning are dry farming
and irrigation agriculture, respectively. With Boolean approach, a parameter is sufficient to lead to a lower
class[24, 25, 26, 27and28].Amiri et al [27] utilized two methods for assessing the ecological capability of
forestry in Mazandaran Province. Their findings after using the conventional Boolean Model revealed that there
are categories 3, 5, 6, and 7 of forest capability in the area.Babaie-Kafaky et al [29] showed if the importance of
the multiple-use of Zagros forests is not recognized in forest management, the forests will lose many of the
recreational, natural ecosystem characteristics and countless values.
Percent of
Proposed land use
Percent of
Current land use Land Type
0.57 18.95 Forestry
0.28 - Ecotourism
32.6 0.12 Urban, rural and industrial
development
33.2 12.82 agriculture Irrigation
24.42 66.49 Range management
- 0.05 dry farming
8.65 - Environmental conservation
- 0.89 Saline land
0.37 0.65 Bare land
Masoudi et al., JMES, 2017, 8 (8), pp. 2975-2985 2985
Through examining the prepared land planning maps, we determine that we cannot only use environmental units
for just a single purpose; the potential exists for multiple uses. However, in any one unit, no more than a single
type of utilization can, ultimately, be implemented [11]. In units where there are no socioeconomic limitations,
the priority is with the one demonstrating the highest potential [30].The priority of land use in some of the units
is determined based on political needs, and the possibility for changing it does not exist [31]. In some units
where one use has no advantage over another and from the priority point of view are close, multiple uses may be
proposed [11].
Acknowledgments-The authors are thankful to those governmental offices of Iran, for providing the data, maps and
reports for this land use planning work.
References 1. Food and Agriculture Organization of the United Nations (FAO), Soil Resources, Management and
Conservation Service, Rome. (1993) 96p.
2. Van Lier H., Landscape Urban Plan. 41 (1998) 83–91.
3. Jozi S.A., IJESD. 1 (2010) 273-277.
4. Ward D., Ngairorue B.T., Kathena J., Samuels R., Ofran Y., Arid Environ. 40 (1998) 357-371.
5. Jafari R., Bakhshandehmehr L., Land Degrad. Develop. (2013); DOI: 10.1002/ldr.2227.
6. Marani Barzani M., Khairulmaini O.S., J. Earth Syst. Sci. 122 (2013)1269–1282.
7. Abu Hammad A., Tumeizi A., Land Degrad. Develop. 23 (2010) 216-226.
8. Nouri J., Sharifipour R., Iran. J. Environ. Health Sci. Eng. 1 (2004) 81-90.
9. Pauleit S., Duhme F., J. Arboric. 26 (2000) 133-141.
10. Swanson E., Michigan Center for Geographic Information Department of Information Technology. (2003).
11. Makhdoom M., Tehran University Press, Tehran. (2001); 289 p. (In Persian)
12. Masoudi M., Jokar P., Environ. Sci. 14 (2016) 23-36. (In Persian)
13. Jokar P., Masoudi M., J. Environ. Stud. 42 (2016) 135-149.
14. National Environment Management Authority (NEMA), A publication of the National Environment
Management Authority (NEMA), Kenya. (2004); 176p.
15. Bojo´rquez-Tapia L., Di´Az-Mondrago N.S., Ezcurra E., Int. J. Geogr. Info. Sci. 15 (2001) 129-151.
16. Oyinloye M., Kufoniyi O., IJESI. 2 (2013) 1-10.
17. Peel D., Lloyd M., Land Use Policy. 24 (2007) 396–403.
18. Biswas A., Baran P. B., Omega. 33 (2005) 391- 398.
19. Gandasasmita K., Sakamoto K., Landscape Urban Plan. 79 (2007) 38–52.
20. Makhduom M., Darvishsefat A., Jafarzadeh H., Makhdom A., Tehran University Press. (2009). 304p. (In
Persian)
21. Masoudi M., Lambert Academic Publishing (LAP), ISBN 978-3-8383-7718-6, Germany. (2010).
22. Bocco G., Mendoza M., Velazquez A., Geomorphology. 39 (2001) 211-219.
23. Prato T., Land Use Policy. 24(2007) 165-174.
24. Burrough P.A., MacMallin R.A., van Deursen W., J. Soil Sci. 43 (1992) 193-210.
25. Davidson D.A., Theocharopoulos S.P., Bloksma R.J., Int. J. Geogr. Inf. Syst. 8 (1994) 369-384.
26. Baja S., Chapman D.M., Dragovich D. A, Environ Manage. 29 (2006) 647-661.
27. Amiri M.J., Salman Mahini A., Jalali S. GH., Hosseini S.M., Azari Dehkordi F. A., Environ. Sci. 7 (2010)
109-124. (In Persian)
28. Food and Agriculture Organization of the United Nations (FAO), Soils Bulletin 32, Soil resources
development and conservation service land and water development division, Rome. (1976) 87p.
29. Babaie Kafaky S., Mataji, A., Ahmadi Sani, N., Am. J. Environ. Sci. 5 (2009) 714-721.
30. Espejel I., Fischer D.W., Hinojosa A., GarcõÂa C., Leyva C., Landscape Urban Plan. 45 (1999) 219-232.
31. Pierce S.M., Cowling R.M., Knight A.T., Lombard A.T., Rouget M., Wolf T., Biol. Conserv. 125 (2005)
441-458.
(2017) ; http://www.jmaterenvironsci.com


![SERIES 1180 SERIES 1180Delivery package Proximity switch, 2 fixing nuts, instructions. [mm] s [mm] a 700 600 500 400 300 200 100 80 40 0 80 40 s a LTK-1180-301-LTS-1180-301-LTK-1180-303-LTS-1180-303-G,](https://img.pdfslide.us/doc/110x75/5fd8adb449e21042a454e611/series-1180-series-delivery-package-proximity-switch-2-fixing-nuts-instructions.jpg)