Embed Size (px)
Citation preview
I ;L g
WORLD BANK ENVIRONMENT PAPER NUMBER 5 IWAvAt44ffL
Land Resource Managementin Machakos District, Kenya1930-1990
John English, Mary Tiffen, and Michael Mortimore
In cooperation withOverseas Development Institute, London
ta' k 'V " E 'Inhi 'i
M.g ..... .iVfA
i~~~~~~~~~~~j P- .^ ';. 8..j
>3' AO< N s .\
,0,,,' __I ' to } k _~
. \__ t , t %~~~~~~~~~
Pub
lic D
iscl
osur
e A
utho
rized
Pub
lic D
iscl
osur
e A
utho
rized
Pub
lic D
iscl
osur
e A
utho
rized
Pub
lic D
iscl
osur
e A
utho
rized
Pub
lic D
iscl
osur
e A
utho
rized
Pub
lic D
iscl
osur
e A
utho
rized
Pub
lic D
iscl
osur
e A
utho
rized
Pub
lic D
iscl
osur
e A
utho
rized

RECENT WORLD BANK ENVIRONMENT PAPERS
No. 1 Cleaver, Munasinghe, Dyson, Egli, Peuker, and Wencelius, editors, Conservation of West and CentralAfrican Rainforests/Conservation de laforet dense en Afrique centrale et de l'Ouest
No. 2 Pezzey, Sustainable Development Concepts: An Economic Analysis
No. 3 Munasinghe, Environmental Economics and Sustainable Development
No. 4 Dewees, Trees, Land, and Labor
WORLD BANK ENVIRONMENT PAPER NUMBER 5
Land Resource Managementin Machakos District, Kenya
1930-1990
John English, Mary Tiffen, and Michael Mortimore
Prepared in cooperation withOverseas-Development Institute, London
The World BankWashington, D.C.
Copyright i) 1994The International Bank for Reconstructionand Development/THE WORLD BANK1818 H Street, N.W.Washington, D.C. 20433, U.S.A.
All rights reservedManufactured in the United States of AmericaFirst printing February 1994
Environment Papers are published to communicate the latest results of the Bank's environmental work tothe development community with the least possible delay. The typescript of this paper therefore has notbeen prepared in accordance with the procedures appropriate to formal printed texts, and the WorldBank accepts no responsibility for errors. Some sources cited in this paper may be informal docurnentsthat are not readily available.
The findings, interpretations, and conclusions expressed in this paper are entirely those of the author(s)and should not be attributed in any mamner to the World Bank, to its affiliated organizations, or tomembers of its Board of Executive Directors or the countries they represent. The World Bank does notguarantee the accuracy of the data included in this publication and accepts no responsibility whatsoeverfor any consequence of their use. The boundaries, colors, denominations, and other information shownon any map in this volume do not imply on the part of the World Bank Group any judgment on thle legalstatus of any territory or the endorsement or acceptance of such boundaries.
The material in this publication is copyrighted. Requests for permission to reproduce portions of it shouldbe sent to the Office of the Publisher at the address shown in the copyright notice above. The World Bankencourages dissemination of its work and will normally give permission promptly and, when thereproduction is for noncoammercial purposes, without asking a fee. Permission to copy portions forclassroom use is granted through the Copyright Clearance Center, Inc., Suite 910,222 Rosewood Drive,Danvers, Massachusetts 01923, U.S.A.
The complete backlist of publications from the World Bank is shown in the annual Index of Publications,which contains an alphabetical title list (with full ordering information) and indexes of subjects, authors,and countries and regions. The latest edition is available free of charge from the Distribution Unit, Officeof the Publisher, The World Bank, 1818 H Street, N.W., Washington, D.C. 20433, U.S.A., or fromPublications, The World Bank, 66, avenue d'Iena, 75116 Paris, France.
John English is principal economist in the Policy and Research Division of the Environment Departmentof the World Bank, and Mary Tiffen and Michael Mortimore are research fellows at the OverseasDevelopment Institute in London.
Library of Congress Cataloging-in-Publication Data
English, John, 1944-Land resource management in Machakos District, Kenya, 1930-1990 /
John English, Mary Tiffen and Michael Mortimore.p. cm. - (i'orld Bank environment paper ; no. 5)
Includes bibliographical references.ISBN 0-8213-2734-81. Land use, Rural--Kenya-Machakos (District)-Management-
History. 2. Agriculture-Economic aspects-Kenya-Machakos(District)-History. 3. Agricultural systems-Kenya-Machakos(District)-History. 4. Machakos (K enya: District)-Population.I. Tiffen, Mary. II. Mortimore, M. J., 1937- . III. Title.IV. Series.HD983.E53 1993333.76'13'096762-dc2C 93-43860
CIP
Contents
Supporting Papers viForeword viiAcknowledgment viiiSummary ix
1. Introduction 1
2. Background 3Earlier History 3The Nineteen Thirties 6
3. Land Resource Management and Agricultural Expansion 8Population Growth 8Agricultural Growth 12
Livestock 12Crop Production 15Drought Impact 17Productivity 18
The Resource Base 23Land Use Change 23Soil Erosion 24Soil Fertility 28Range Vegetation 29Trees and Woodfuel 34
Conclusions 35
4. Agricultural Intensification and Technological Change 37Agricultural System Change 39Farming Systems in AEZ 4 39Technologies 43
Terracing 43Katumani Composite Maizes 46Tillage: The Ox-Plough 48Livestock Feeding 48
Cash Crops 49Coffee 49Cotton 50Horticultural Crops 50
Sources of Innovations 50
iii
Population Growth and the Intensification of Resource Use 51Inicreases in the Ratio of Labor and Capital to Land 51Ratio of Pasture to Cropland 52Intensification and Farmn Size 52Intensification and Migration for Fanming 52Intensification and the Market 53
5. The Facilitators of Change 55Changes in the Basic Elements of Akamba Society 55
The Family 55Land 56Mutual Help Groups 56Local Leadership 57
Major Agents of Change 58The Missions and Churches 58M[arkets and Trade 58Education 60
Government as a Change Agent 61Direct Govermnent Programs 61Governance 63
6. Lessons of This Experience 67Background 67Perceptions of the "Problem" and of Solutions 69
The "Problem" 69Perceptions of Change 71
Conclusions 74The Broader Land Use Issue 75Imiplications 76Irmplications of This Approach for Land Resource Management Strateg:ies 77Further Research 77
Bibliography 79
Maps
24259 Kenya - Machakos District: Study Sites24260 Kenya - Machakos District: Agro-Ecological Zones24261 Kenya - Machakos District: Anmual Rainfall
iv
Figures
Figure 3.2 Output per Head and per kin2: Maize Equivalent, 1957 Prices 21Figure 3.3 Output per Head and per km2: Maize Equivalent, Current Prices 22Figure 6.1 Development Model 68
Tables
Table 2.1 Seasonal and Agricultural Year Rainfall Probabilities 4Table 3.1 Machakos District Population, Totals, Growth Rates, 13
Age Group, Sex and Tribe, 1932-79Table 3.2 Population Characteristics by Agro-Economic Zone 14
(a) Share of District Population (Percent)(b) Population Density (persons/kin).
Table 3.3 Machakos District Growth of Livestock Numbers, 1930-1990 15Table 3.4 Sales of Livestock and Products (5 year average) 16Table 3.5 Machakos District: Growth of Area Cultivated, 1930-1990 18Table 3.6 Machakos District: Production of Non-Staple Crops, 1960-1990 20Table 3.7 Machakos District: Changes in Land Use by Sample Area 1948-78 25Table 3.8 Areas of Terraced Land (%) 27Table 3.9 Soil Erosion and Land Use in a Sub-Catchment of the Wamui River
Basin, Kalama, 1948-72 27Table 3.10 Soil Chemical Properties, 1977 and 1990 30Table 3.11 Chemical Properties of Kilungu Soils 31Table 3.12 Changes in the Vegetation Structure of Kathonzweni and
Ngwata Between 1960 and 1990 33Table 3.13 Trees Grown on Cultivated Farmland Mbiuni, 1980-81 36Table 4.1 Social Indicators, 1982-83 38Table 4.2 Main Farm Cash Income Sources, 1945-1990 40Table 4.3 Changes in Agricultural Characteristics and Practices - 1940-81 -
Selected Locations and Years 42Table 4.4 Inventory of Production Technologies 44Table 4.5 Machakos District Areas Conserved 1956-61 (acres) 45Table 5.1 Leadership Patterns 59Table 5.2 Commercial Development 60Table 5.3 Expenditure of the African Land Development Board, 1948-62 62Table 5.4 Arid and Semi-Arid Lands Programs, 1978-91 64Table 6.1 Machakos District - Indicators of Land Resource Management 72
v
Supporting Papers
1. Michael Mortimore (ed), "Environmental Profile", Overseas Development Institute, ODI WorkingPaper No 53, Nov. 1991
A. "Rainfall", by S.K. Mutiso, Michael Mortimnore and Mary Tiffen.B. "Soil Erosion", by D.B. ThomasC. "Soil Fertility", by J.P. MbuviD. "Natural Vegetation", by Kassim 0. Farah
2. Mary Tiffen, "Population Profile", ODI Working Paper No. 54, Nov. 1991.
3. Mary Tiffen (ed), "Production Profile", ODI Working Paper No. 55, Nov. 1991.A. "Cro0) Production", by S.G. MbogohB. "Livestock Production", by C. Ackello-Ogutu
4. F.N.Gichuki, "Conservation Profile", ODI Working Paper No. 56, Nov. 1991.
5. Michael Mortimore and Kate 'Wellard, "Profile of Technological Change", ODI Working PaperNo. 57, Jan. 1992.
6. R.S.Rostom and Michael Mortimnore, "Land Use Profile", ODI Working Paper No. 58, Dec.1991.
7. Mary Tiffen, "Farming and Income Systems", ODI Working Paper No. 59, Feb. 1992
8. Mary Tiffen (ed), "Institutional Profile", ODI Working Paper No. 62, Mar. 1992.A. "Akanaba Institutions and Development, 1930-90", by Judith Mbula Bahemuka andMary TiffenB. "NGOs and Technological Change", by J.W.Kaluli.
9. Michael Mortimore, "Tree Management", ODI Working Paper No. 63, May 1992.
NOTE: These individual Working Papers are available from ODI Publications, Overseas DevelopmentInstitute, Regent's College, Inner Circle, Regent's Park, London NW1 4NS at £4.00 each pluspostage and packing.
vi
Foreword
The decade of the 1980s has witnessed a One issue which has generated muchfundamental change in the way governments and concern has been the potential link between lowdevelopment agencies think about environment incomes and resource degradation. This reportand development. The two are no longer presents the results of a study which investigatedregarded as mutually exclusive. It is now this question. Machakos District is a relativelyrecognized that a healthy environment is low income and agriculturally marginal districtessential to sustainable development and a in Kenya. Before World War II the colonialhealthy economy. Moreover, economists and administration was concerned that landplanners are beginning to recognize that degradation was becoming severe under theeconomic development which erodes natural pressure of population, aggravated by drought.capital is often not successful. In fact, The report analyses the changes whichdevelopment strategies and programs which do have taken place in the land resources,not take adequate account of the state of critical agricultural systems, and social structures of theresources--forests, soils, grasslands, freshwater, district over the period since 1930. Despite thecoastal areas and fisheries--may degrade the fact that there was considerable social turbulenceresource base upon which future growth is in the period prior to independence, the peopledependent. of the district have managed, building on good
Since its formation, the Environment market access and periodic governmnent support,Department has conducted research and policy to make substantial changes in their agriculturalwork on these important issues. The systems and bring about a dramatic increase inDepartment's work has focused, in particular, on the productivity of their land resources.the links between environment and development,and the implications of these linkages fordevelopment policy in general. The objective ofthe Environment Paper Series is to make the Andrew Steerresults of our work available to the general Deputy Directorpublic. Environment Department
vii
Acknowledgments
John English is Principal Economist in also participated. In Kenya the study alsothe Policy and Research Division of the benefitted from the active support of ProfessorEnvironment Department of the World Bank, Philip Mbithi (then Vice-Chancellor of theand Mary Tiffen and Michael Mortimore are University of Nairobi) and Mr George Mbate,Research Fellows at the Overseas Development Chief Planning Officer of the Ministry ofInstitute in London. The research on which this Reclamation and Development for Arid andreport is based was sponsored by the Semi-Arid Lands and Wastelands (and fornerlyEnvironmental Policy and Research Division, Programme Officer of the Machakos IntegratedEnvironment Department,, the World Bank, and Rural Development Project).supported in part by funds: from the Government This report has been written by Johnof Norway, the Overseas Development English, working in close collaboration withAdministration of the Government of the U.K. Drs. Tiffen and Mortimore. It draws heavily onand the Rockefeller Foundation. a series of 14 working papers and other
Leadership of the field research was materials prepared by the research team, whichundertaken by Mary Tiffen and Michael have been edited by Drs. Tiffen and M[ortimoreMortimore. Field work was undertaken in and published separately. Thanks are due toAugust-September 1990 amd January-February those too numerous to name who attended1991, with a major input from a team of seven workshops held in Machakos and London tomembers of the faculty of the University of review the initial findings of the study, and toNairobi; Professor C. Ackello-Ogutu, Dr. K.O. those inside and outside the World Bank whoFarah, Dr F.N. Gichuki. Professor J Mbula- commented on earlier drafts of this report, inBahemuka, Dr S.K. Mutiso, Dr. J.P. Mbuvi, particular John Peberdy, Nicholas Wallis, SteinDr.S.G. Mbogoh, Professor R.S. Rostom, and Hansen, Ernst Lutz, Kevin Clealver andProfessor D.B. Thomas. Mr. J.W. Kaluli, Raymond Noronha. Thanks are also due toDepartment of Agricultural Engineering, Jomo Olivia McNeal for her inputs into the final prepaKenyatta University, and Kate Wellard of ODI, ration of the report.
viii
Summary
In the late 1930s Machakos District, a semi-arid of nitrogen, phosphorus, potash, etc.) is lowerarea of East Central Kenya, inhabited by the than in the soils under natural vegetation, theirAkamba people, was considered by the colonial productive capacity has clearly been raisedadministration to be degrading alarmingly and to substantially, and there is no evidence to suggestbe rapidly approaching, if not exceeding, its that their quality is declining under current usecapacity to support its inhabitants and their practices. The rangeland areas appear to have alivestock. Today the area has a population five higher proportion of woody species than earlier,times as great and the value of agricultural and this could indicate poor grazing practicesoutput per head (at constant prices) is estimated and reduced capacity. However, it is not clearto be three times larger than it was then. At the that this is the cause, as prohibitions on bushsame time food production in the area is less fires, reductions in game populations (especiallysusceptible to drought than before, although still of elephants), and actions by users to encouragesubject to it. The objective of the study was to tree growth have all played a part. There arereview the experience of this district in relation certainly more trees than before and they areto management of its land resources over the being actively managed by farmers. Projectionspast 50 years and to attempt to identify the made in the 1950s, the 1960s and again in thefactors responsible for these changes. 1970s all foresaw severe fuel wood shortages,
While population has grown, there has but there is no evidence that such have occurred.also been some redistribution in the district. Therefore, the conclusions of the study are thatMovement has occured into the lower, more arid the agricultural growth which has occured hasarea, previously tsetse infested and virtually not been accompanied by resource degradation.unpopulated, which now houses about a third of The increased per capita value ofthe population. The area under cultivation has agricultural production has almost entirely beenexpanded by four or five times and there has in the form of cash crops. Initial emphasis wasbeen a corresponding reduction in the area of on coffee in particular, and cotton, with abush, scrub and general grazing area. Much of subsequent shift over the past decade into fruitthe area used is now under continuous and horticultural crops as the relative price ofcultivation, and almost 100% of the area coffee collapsed. Staple food production appearscultivated is now subject to some form of to have stabilized at about the level required forterracing. In the 1930s the main focus of the basic subsistence, about 200 kgs of maizepopulation was on livestock herding with equivalent per head per year. Trade in thesesubsistence cropping to meet basic needs. This items does take place between those withhas now changed to a primarily crop oriented surpluses and deficits. Substantial changes haveproduction of which a significant proportion is occured in agricultural practices. The studysold. enumerated about 45 new technologies which
One of the objectives of the study was to have been adopted, half of which are newassess the current status of the land resource products. In addition to terracing and the mainbase. This indicated that the rate of erosion has cash crops, some of the most important of thesebeen sharply reduced, although it does still have been use of ox-drawn ploughs requiringoccur. While soil analysis does show that the only two animals for traction (and theirchemical content of the soils (i.e., their content modification for weeding), early maturing maize
ix
varieties, use of crop residues for forage and use vacuum. Major changes have occured in theof animal manure (i.e., development of mixed social structure of the society. The importancefarming systems) and monocropping the main of the nuclear family has increased, relative toannual crops in rows to facilitate weeding etc. the extended one. The absence of men in theThese types of developments are closely in line 1940s and 50s required women to take a morewith the hypotheses of Boserup, Ruthenberg and active leadership role, and this has continued andothers on the changes and intensification induced also influenced family roles, including traditionalby population growth. agricultural tasks. Traditional self - help
The initial emphasis of the colonial groups have been modified (partly under theauthorities in the late 1930s to the perceived influence of the early terracing programs) todegradation crisis was to initiate a destocking have more development oriented goals andprogram (which was strongly resisted by the women have become more active in leadingAkamba and quickly de-emphasised), and them. The Akamba have always placedimplementation of a program of terracing. The emphasis on education and development of locallatter was not pursued fiilly until after World vocationally oriented schools has been marked.War II when in many areas local people were This has helped widen the range of availablerequired to turn out regularly to construct them. skills and assisted in the broadening of the rangeThe initial emphasis was on narrow-based of small scale commercial and artisanal activityterraces designed to control surface run-off. and in technological innovation.These were not popular with farmers as they The Akamba traditionally had antook land out of production, caused problems in individualistic view of land, especially foruse of ox-ploughs (which were just being cropping, and prior to the study period rightsintroduced) and did not help increase yields. akin to freehold were recognized. Thus, whileNot surprisingly, maintenance was poor. It later land registration has proceeded, it has not beenbecame clear that in the local conditions, with a prior condition for investment in land, becauserainfall of only 250 - 500 mm per cropping of the degree of security already available underseason, measures to assist in improved customary law. On the other hand, attitudesperculation of rainfall to increase its availability towards livestock have changed markedly. Thefor crops were more important. This led during importance of livestock for social functions hasthe 1950s to the development of "bench" declined and they are no longer the only form ofterraces, whose merits seem to have been security, since sources of income havequickly recognized by farmers. In the later multiplied. A major reason for owning cattle is1960s and 70s, as land became more scarce, now the maintenance of a plough-tearn andthese were almost universally adopted. The quality is preferred to quantity. Nevertheless,government began to reemphasise soil the district now supports many more livestockconservation in the late 19,70s, but by that time than in the 1930-1960 period.most of the cropped area in the more steeply The farmers of Machakos have made asloped and long settled parts of the district had very large investment in their land resources.already been terraced in some way. More than 200,000 ha have been terraced in
Thus, since the 1940s, there has been an some way. However, this has been achievedalmost continuous process of agricultural without significant use of credit in any formalinnovation and change in the district. Some of sense. Cash earned from off-farm work andthis has resulted directly from governmental from the sales of farm products have supportedefforts, e.g., breeding early maturing varieties. the use of families' own labor (or that mobilizedOthers, such as use of ox-jploughs and rmany of through groups) and paid for the necessary cashthe introductions of nevv crops, have had inputs. This calls into some question thevirtually no official support. These agricultural standard view that credit is essential for effectivechanges have also not taken place in a social soil conservation.
x
The principal conclusions from this measures which will assist in raising thestudy are that: value of farm products at the farmn gate,
(a) increased population growth and/or (e.g., improved road access, andagricultural intensification in a low elimination of marketing bottlenecks orincome area do not have to be unnecessary controls and costs) and inaccompanied by land resource widening the range of economically anddegradation. technically viable land use options(b) land resource management cannot (e.g.,through experimentation onbe divorced from the overall potential new crops and livestock,development process. including their impact on land resource(c) in fact, increased market orientation management);of agriculture and sales of the products (b) agricultural research and extensionof land are important in increasing its efforts might be better placed on a rangeperceived value and in providing an of possible technologies rather than aincentive for adoption of measures or very limited range of "best"systems which will permit continued technologies;intensive use. (c) research etc. by other than official(d) market outlets are also highly government stations be encouraged;important in providing as wide a range (d) emphasis be placed on otheras possible of economically and measures which will facilitate thetechnically viable land use options which development of other economicwill permit the user to devise an overall activities, e.g. the extension ofsustainable system and to modify it electricity and telecommunicationsunder changing economic and social networks; andconditions. (e) where, because of remoteness or(e) this adoption process is an integral physical limitations to production, few ifpart of the whole process of agricultural any viable land uses can be developed,innovation and should not be seen as emphasis should be placed on facilitatingsomething which can be tackled outmigration on a seasonal or permanentseparately. basis, or on other measures to improve(f) land resource management links with the rest of the economy.innovations will come from multiple However, these types of measures may createsources and their introduction will be conflicts in some cases. It is generallyenhanced by strong links between a local recognized that some conflicts over land usesociety and the economy at large, and cannot be resolved through the "marketwill be enhanced in an open society with mechanisms" implied above. For example, if ana broad, development oriented area contains a subregion of high biologicalleadership structure. value, improved returns to agricultural produc-(g) non-agricultural and urban growth tion will increase the pressures to bring the areawill in general enhance the above into production, if it is suitable for agriculturalprocesses, through reducing the share of use. This will require the strengthening of legalthe society which has to rely on the land powers or other incentives to restrict orresource for its livelihood and increasing otherwise control use of these areas, if athe options open to those who choose to balanced development of the area is to bedo so. achieved.
This leads to recommendations that:(a) primary emphasis be given to
xi
1. Introduction
Why study Machakos District? The district was earlier periods, and attempt to identify the majorchosen for a variety of reasons. In recent years factors which have enabled the district to tacklethere has been considerable concern over the its earlier problems. As will be seen, theproblem of land degradation in developing population of the district is now more than 5countries. "Desertification" was highlighted as times what it was in 1930, and agriculturalan issue in the 1970s and was one of the first production per capita is estimated to be threeissues taken up by UNEP as it established itself times what it was then. At the same time it isin the latter part of the decade. Despite the high clear that the land resource is in many respectslevel of concern, however, progress in achieving in better condition now than it was then, and itsa consensus on the nature of the land management is at a much higher level. This isdegradation problem in sub-humid and semi-arid not to say that there are now no landareas, and appropriate strategies for achieving management problems. There are. It will notsustainable land management in these areas, has be easy to continue to maintain past progress ifbeen slow. Under the impetus of a series of population continues to rise rapidly. However,dry/drought years in the Sahel in the 70s and it is also clear that the inhabitants of the districtearly 80s, a significant number of initiatives have shown an ability to identify and tackle theirhave been undertaken to attempt to assist local land management problems and there is nopopulations to mitigate the impact of dry years reason why they should not continue to do so.and to raise productivity and improve land While there is a good deal ofmanagement (Seve et. al. 1990). However, information on the district in the period we havemost of these initiatives are too recent to yield studied, most of it is not comprehensive orany definitive general guidance on land systematic. Thus, as will be seen, estimatingmanagement strategies. production in earlier years is difficult. In
Despite this recent flood of interest, general it has not been possible to undertakeconcern over land degradation is not new. detailed analysis of earlier periods, or toHowever, little systematic documentation exists combine data from different studies for thison the state of land resources on which to assess purpose. Much of the study is, therefore, likelong term trends in resource status. Thus, much the material it is based on, somewhat descriptiveof the data, on the basis of which judgements as in nature. Also, given the volume of nationalto the extent and rate of change in degradation available and the potentially almost unlimitedhave been made, has been very anecdotal. scope of the subject under review, we have hadMachakos district is somewhat unusual in this to be somewhat selective. However, it is ourregard. The colonial administration became judgement that the story does provide insights onconcerned about degradation of the land resource the potential for improvement in thein the 1930s and reports from that date are still management and status of land resources inavailable. Various efforts have been made to developing countries which are currently underaddress the problem over the subsequent period stress.of 60 years and, perhaps because the district is Support for the research was providedvery accessible from Nairobi, a considerable by the Bank (drawing on a grant from Norwaywritten record exists of the changes which have for work in dryland areas), the British ODA,occurred. In addition, while the district cannot and the Rockefeller Foundation. Field work wasbe characterized as arid, its rainfall is highly undertaken in Aug-Sept, 1990 and Jan-Feb 1991,variable and it is reasonably typical of many with a major input from a team of sevendryland areas in which land degradation is members of the faculty of the University ofconsidered to be a concern. Nairobi. This work was concentrated in five
The objectives of the study were to locations in the district selected to cover theassess the current status of the land resource in major archaeological conditions in the districtthe district, review the historical record of the (see maps 24259, 24260 and 24261). Based onpast 60 years, check this as and where possible this field work and review of available literatureby interviews with those involved during the covering the whole period of the study, a series
2
of fourteen background papers were prepared, attended by local persons involved with thecovering different aspects of the land resource agricultural sector, in addition to the study team.management story in the district (see contents). This paper attempts to provide a synthesis of theThese initial findings were reviewed at a findings of the study and is based primarily onworkshop in Machakos in September 1991, material contained in the background papers.
3
2. Background
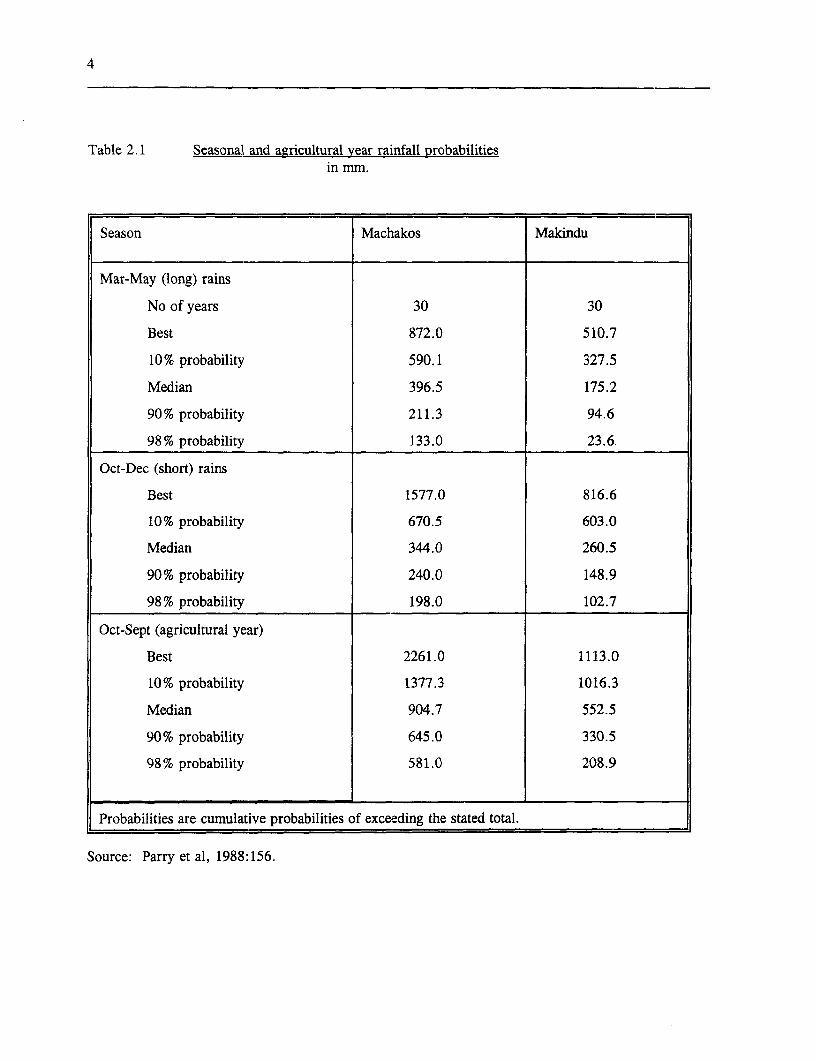
Machakos District extends to about 14,000 km2 sequences of dry seasons are not uncommon,and lies in the SE of Kenya between Nairobi, giving rise to significant droughts in the earlythe capital, and Mombasa, the seaport. In the 70's, and 1980/81, for example.NW of the district are a range of hills on the Agro-ecological zones have been definedeastern edge of the Athi Plains (elev 1,600m), indicating broad suitability for agriculturaland these rise to 1,800m. Most of the rest of purposes (Jaetzold and Schmidt, 1983. Thesethe district slopes to the SE and the lowest are shown in map 24260). Less than 10% of theelevation is about 700m. district (in the higher more humid areas with
Rainfall is similarly highest in the hills, rainfall over about 900 mm per annum), is inwith a mean there of about 1,000mm (see Map AEZs 2 and 3, suitable for coffee (3 marginally24261) declining to the SE where the mean so), and maize and similar crops. Just overrainfall falls to less than 600mm. Most of the 50% is in zones 5 and 6 (livestock-millet), withdistrict has a mean annual rainfall of less than mean rainfall of below about 750mm per year.800mm. This part of East Africa is Cropping of any sort is marginal in this area.characterized by two distinct wet seasons, The major zone (4), with rainfall between aboutnamely the Short Rains (October-December) and 750 and 900mm per year has been defined asthe Long Rains (March-May) with dry periods suitable for cotton, and marginally so for maize,between them. Despite the names, rainfall tends this suitability falling as rainfall declines.to be slightly higher in the district in the short,rather than in the long, rains (see Table 2.1) and Earlier Historythe agricultural year is considered to run fromOctober to September. At the end of the nineteenth century, the
The major characteristic of rainfall in the Akamba were mostly concentrated in the hillsarea is its interseasonal and interyear variability. and, although the indigenous forest had mainlyThe seasonal and agricultural year (October to disappeared, the areas that were not cultivatedSeptember) probabilities for Machakos and were well covered with thorn bush or grassMakindu are summarized in Table 2.1 (after (Lindblom, 1920). The plains between the hillsParry et al., 1988:156). The majority of crops were used by the Akamba for grazing, andare single-season annuals. But is should be sometimes by the Maasai. In his description ofnoted that some long season crops, notably the vegetation in about 1910, Lindblom (ibidpigeon pea, are planted in the short rains and pp25-6) made no mention of erosion features,harvested after the long rains. Only a small though he observed that the upper hillslopes hadproportion of the District can expect more than all been cleared for farming, and that the grass250 mm in either season in six or more years on the plains grew "in patches, between whichout of ten. This is the barest minimum for the soil is bare."producing a crop of maize even assuming a In 1898-99 there was an exceptionalsatisfactory distribution within the season. The drought when the numbers of people andseasonal and annual figures do not take into livestock were greatly reduced, and in 1909 theaccount the distribution of rainfall during the cattle population was decimated by rinderpest.growing season, evapotranspiration, and losses It is reasonable to conclude, therefore, thatto runoff and percolation. Thus, although total during the early years of the century there wereannual rainfall figures give an impression of relatively few signs of denudation or erosion.suitability for cropping, because of its seasonal "Glowing reports are found [in travellers'distribution and variability much of the district accounts] of the wonderful grass to be seen onis marginal for cropping. Furthermore, the caravan route (Peberdy, 1958:2)."
4
Table 2.1 Seasonal and agricultural year rainfall probabilitiesin mnm.
Season Machakos Makindu
Mar-May (long) rains
No of years 30 30
Best 872.0 510.7
10% probability 590.1 327.5
Median 396.5 175.2
90% probability 211.3 94.6
98% probability 133.0 23.6
Oct-Dec (short) rains
Best 1577.0 816.6
10% probability 670.5 603.0
Median 344.0 260.5
90% probability 240.0 148.9
98% probability 198.0 102.7
Oct-Sept (agricultural year)
Best 2261.0 1113.0
10% probability 1377.3 1016.3
Median 904.7 552.5
90% probability 645.0 330.5
98% probability 581.0 208.9
Probabilities are cumulative probabilities of exceeding the stated total.
Source: Parry et al, 1988:156.
5
Barnes (1937:1-2) interviewed Akamba Serious droughts occurred in 1907-8,elders and European settlers in order to 1910, 1913-14, and 1917-18. Livestockreconstruct the soil conditions of the country mortality was inevitable, especially during thearound the time of the British occupation. He dry seasons, and especially of cattle.describes bushland and grassland on the hills, "It cannot be denied that theabsorbent topsoil and an absence of storm run- position is serious and that largeoff; on the flatter country there was dense high numbers of native cattle die annually,grass, trees and a rich topsoil. The larger literally from starvation. The grantingstreams were perennial. Forest patches were of privileges outside the Reserve israre. However, it is significant that on the hills however open to objection... it is certain"there were some gulleys but they were covered that the more facilities the Kambawith vegetation," and that "there were a few obtain, the more they will need instony patches in the Mbuti area where grass was future" (Annual Report, Machakospoor." District, 1922; quoted in Otieno,
According to Barnes' Akamba 1984:62).informants (ibid pp3-6), settled administration Notwithstanding the administration'sremoved the fear of Maasai attacks, and they belief that the Reserve was overstocked, the firstextended cultivation and grazing into the lower stock census (in 1918-19: Peberdy, 1958:6)country, burning the long grass frequently to estimated that 963,000 acres of grazing wereobtain short grass for the livestock, and needed to carry the existing livestock - onlydestroying the bush trees for fuel and 70% of the Reserve as defined in 1932.construction uses. Veterinary services and Peberdy (1958) quotes the Districtprotection from theft increased their stock. Commissioner, Machakos writing as follows inTheir need for more farmland, use of the 1927:plough, and the administration's encouragement "Since 1917 the reserve has becomeof private land demarcation, led to a reduction desiccated beyond all knowledge. Largeof shifting cultivation. areas which were good pasture land, and
The Reserve was gazetted in 1906, and in some cases thick bush, are now onlysurrounded by European farms on the north-west tracts of bare soil." Cobb et al. (1929)and south, Crown land on the north-east, and reported that "A journey through theuninhabited, tsetse-infested bush on the south- area east and south of Machakos revealseast. In 1913, Akamba were banned from that over large stretches of hillsidesgrazing their animals on unoccupied European vegetation has been almost whollyfarms, and in 1924 grazing on Crown land on removed. The soil has been erodedthe Yatta Plateau was stopped (Otieno, 1984:62). down to the subsoil and its removal willThe use of the latter area was later permitted on continue at an ever increasing rate. Onlicense after payment of a fee. Thus encircled, less steep slopes and on better land,the Akamba lost access to large areas of free vegetation persists and though Wakambagrazing to which they later laid customary claim, are primarily a pastoral tribe patches ofand which were especially important during cultivation are in evidence. But evendrought. there, the grazing has been so persistent
Stock limitation became a prime that the ground is all beaten down intoobjective of the administration, since to extend little stock paths and has in turn becomethe Akamba's access to grazing land was open to erosion."considered politically unacceptable: And in the same year the Hall Commission
"It would be impolitic weakness, now to reported that "It is not too much to say that aopen the question of grazing lands. Instead, desert has already been created." It appears thatevery inducement should be made to encourage the period from 1929-30 saw a significantthe sale of surplus stock" (Annual Report, deterioration. Famine occurred in 1929 onUkamba Province, 1912; quoted in Otieno, account of low rainfall and locusts, and Kioko1984:61).
6
(1973) dates the rapid deterioration of land in they dug were not sufficient (mainly due toKalama from this time. inefficient tools).
In 1937, two substantial studies providedThe Nineteen Thirties the most ambitious attempts so far to document
soil erosion in the Reserve. These were writtenIn 1931, many patches of land were so badly by Maher (1937) and Barnes (1937). Maherdenuded that a massive program was considered began his Report by displaying his judgement innecessary to physically recondition deteriorating no uncertain terms (p.3):pasture land. In Mbooni, an area of 80 ha ofsteep, badly eroded land was contour-trenched "The Machakos Reserve is an appallingand black Mauritius beans sown along the trench example of a large area of land. which asbanks. Cattle were kept off the area which was been subjected to uncoordinated andplanted with indigenouis grass (particularly practically uncontrolled development byCynodon grass noted for its fast spreading and natives whose multiplication and thedrought resistant habits) and exotic drought increase of whose stock has beenresistant forage plants. Gullies were supplied and largely from those of disease, underwith wash-stops. This reconditioning exercise andvlent Brithose.was intended to serve as a demonstration; the benevolent British rule.reclamation of larger areas was to be left to the Elvery phase of misuse of land isAkamba people. A nursery was set up to supply vividly and poignantly displayed in thisfodder plants, trees, and wash-stop grasses to the Reserve, the inhabitants of which arereconditioning schemes and interested land rapidly drifting to a state of hopelessowners. The main species planted in the and miserable poverty and their land tonurseries included Mexican daisy, spineless a parching desert of rocks, stones andcactus, napier, woolly-finger, Bermrruda and sand.'crested wheat grass, Kudzu vine, black Maher claimed that "the greater part ofMauritius bean, drought resistant fodder trees the Akamba Reserve has lost the topsoil throughand shrubs (DoA, 1932). Reconditioning work erosion. A considerable portion has also lostby the Akamba was started at Kitete. The area most of the sub-soil" (ibid p.8). This waswas destocked and the government assisted in attributed, in descending order of importance, tosetting up three trials to assess the economics of the following: deforestation, overstocking,reconditioning extensive areas. The trials cultivation of slopes, over cultivation,included destocking alone, with contour ploughing, increases in the cultivated area, roadtrenching and with contour trenchling and drainage, and livestock damage. Thus, farmingplanting with indigenous grasses (Cynodon sp.). as well as livestock systems were now seen asThe latter treatment proved to be the most culpable. On the hills, he describes thesuccessful. Following such a demonstration, the intensification of surface run-off as forest wereAkamba started to fence and make contour removed, creating gullies up to 10m deep; andtrenches in small areas. Persuasion by the the stripping of the upper soil horizons ("blackadministration improved the adoption rate. soils change to grey, grey changes to yellow,
In September 1934, the Local African then ... sharp quartz stones become seeded overCouncil, in order to check and remnedy the the surface"). On the ridges he clescribedsevere soil erosion, empowered the Headmen of ravines more than 100m deep, with 30-40% sideKiteta and Masii Locations to restrict or prohibit slopes devoid of vegetation, every type of gully,grazing in locations set apart for reconditioning exposure of the quartz stone lines ("stringers")and planting of fodder producing plants and by surface erosion, all due to overstocking - ofgrasses. These efforts we:re complemented by a cattle, and the "ruin-bringing goat"-and shambasregular supply of prisoners' labor for on unsuitable sites. The rivers, once perennial,reconditioning work, because no matter how were now but seasonal, liable to "come down incommitted the Akamba volunteers were, they spate, carrying tons of the soil of the Reservewere very spasmodic and the type of trenches towards the Indian Ocean" and drying again
7
after a few hours. Maher proposed a scheme Now the whole area is suffering fromfor reconditioning the Reserve, arguing that erosion, natives will show you gulleys"strong and immediate measures are necessary" up to 30 feet deep with vertical sides(Gichuki, 1991). that used to be paths through the bush.
Barnes generally supported Maher's They say that many of these gulleysassessment although he used less provocative have increased from small watercourseslanguage:- to their present depth of over 20 feet in
"I can say that there is really no part of 10 or 20 years and two up to 18 feetthe inhabited reserve that is free from deep in the last three years. The largesterosion. Probably 75% suffers from of these gullies are about a mile long.severe erosion in various forms, parts of There is sheet erosion over the area andthis almost amounting to complete it is very severe to the north ofdestruction, 20% with less serious Matungulu Government school.erosion and there may be 5% that is The reason they give for theseprotected by trees or natural conditions" gulleys is that the cover is now off the(p.6). hills above but they do not realize that
He offered a more detailed account of the the enormously increased runoff is alsoMatungulu-Kangundo area: - due to the drop in humus content of
"..which must have been one of the these huge expanses of cultivation.finest stretches of agricultural land in They do attribute small washouts andKenya .. local natives say the land was gulleys to their own practice of markingnot worked extensively until the War of out their plots with drains, which catch1914-1918. Prior to the War the slopes and concentrate the water.were covered with thick Bush Type All natives agree that greatlyForest and had very fertile soil. One increased areas are responsible fornative told me that when he left to go to accelerated erosion on cultivated land.the War as a porter there was only They rightly blame the use of ploughsisolated cultivation ... [Now] in some without sufficient care and knowledge,parts cultivation is continuous for almost many used to plough up and down hill.a square mile in a block, and there are They also blame the use of cultivatorsonly odd trees left all over the area. with oxen." (p.4)
8
3. Land Resource Management and Agricultural Expansion
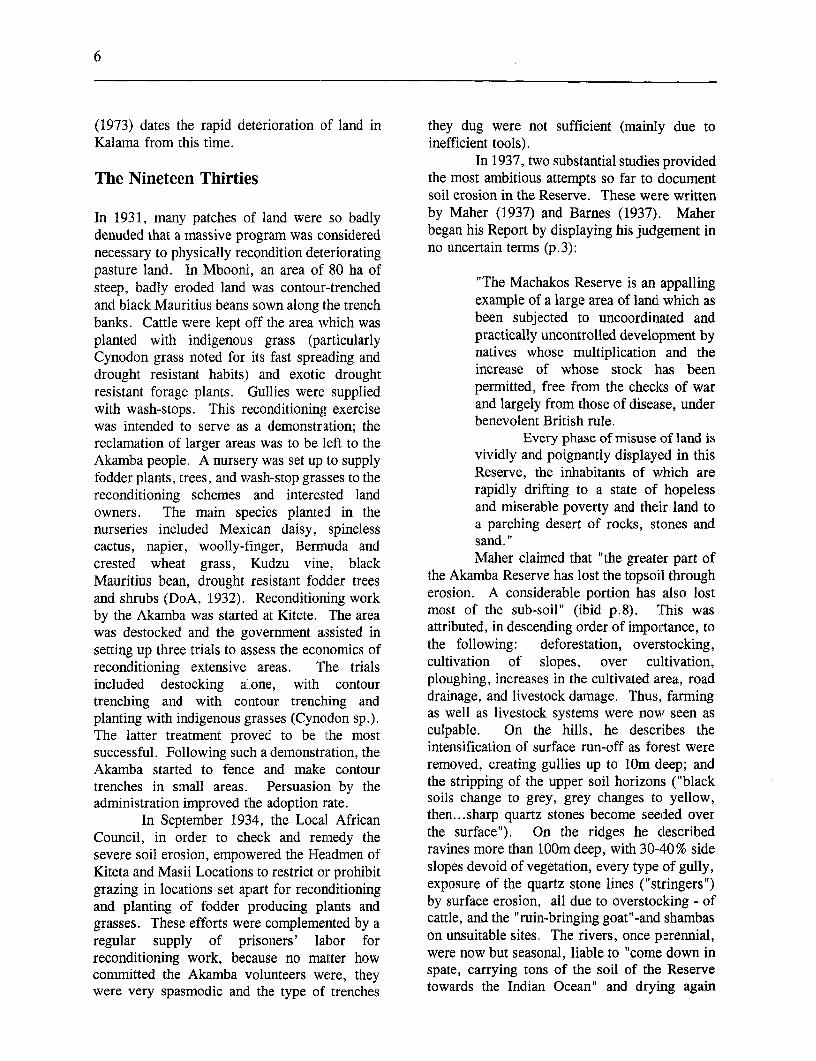
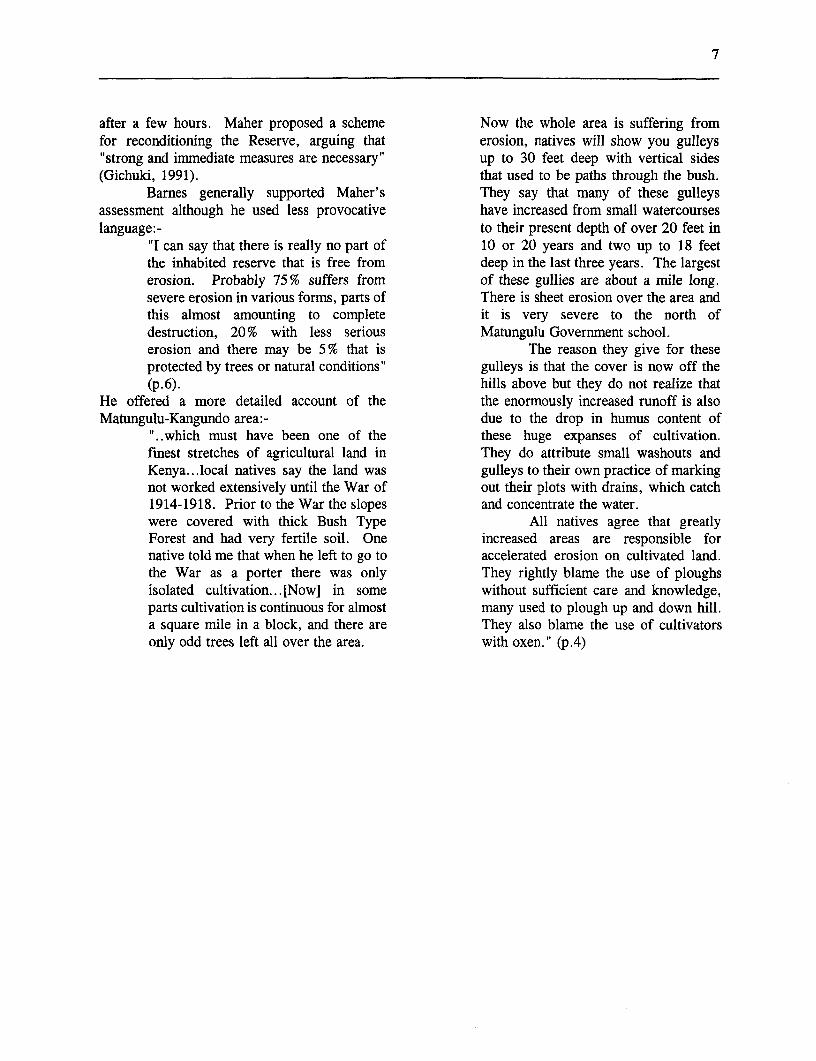
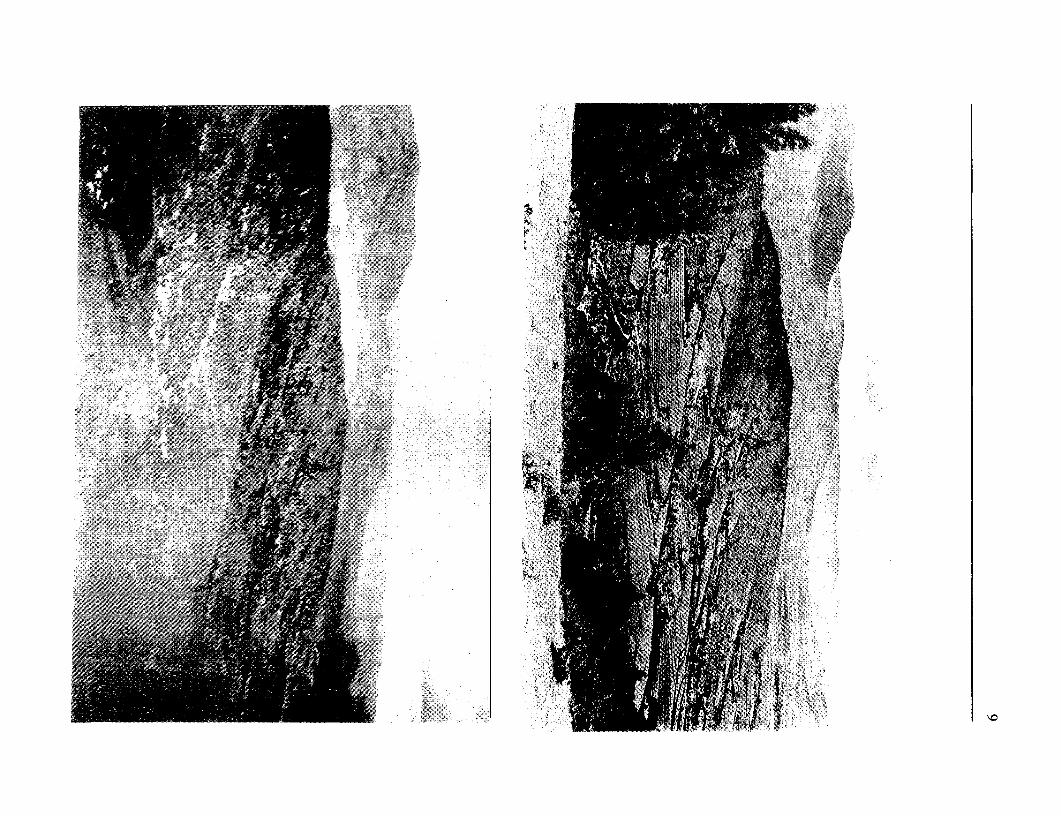
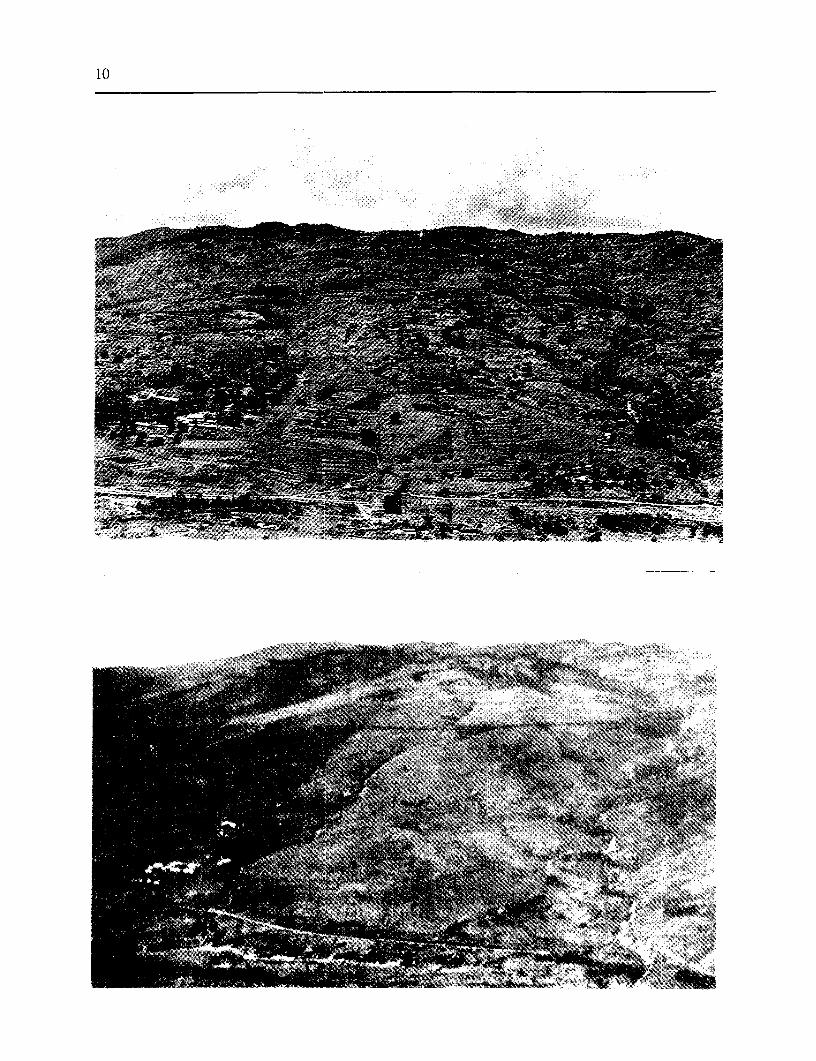
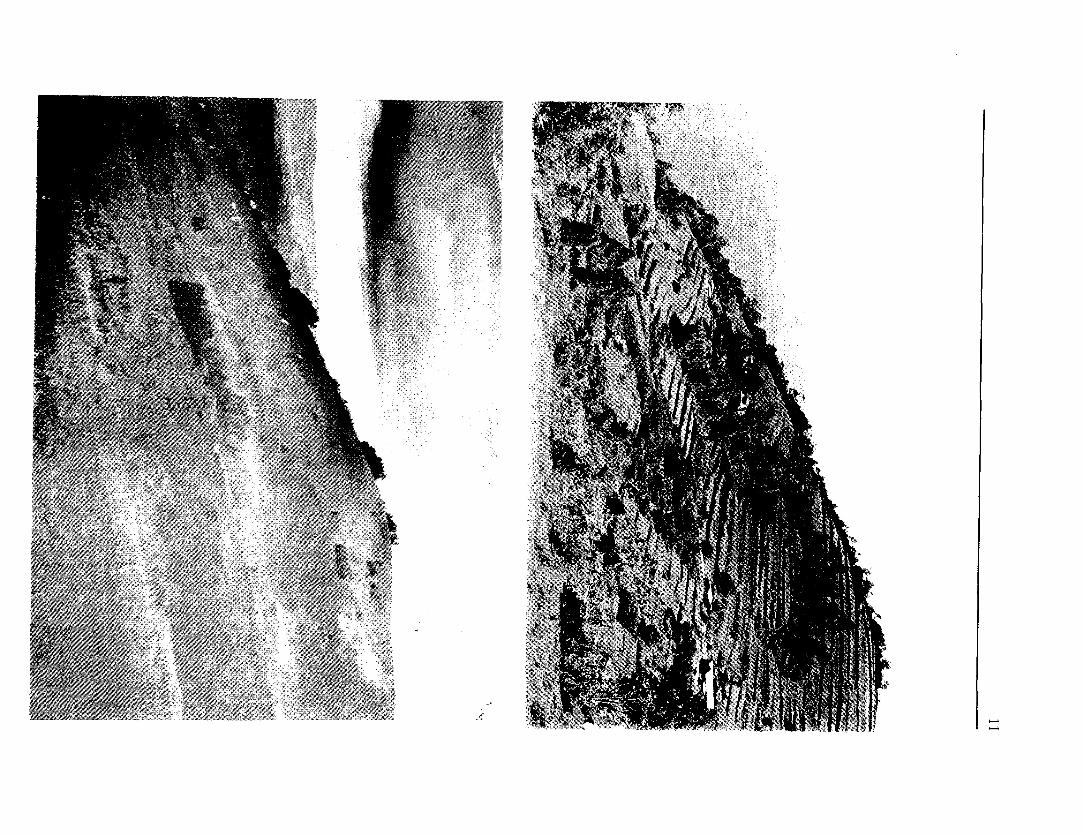
This then was the situation at the end of the In 1937 some tree planting had been started and1930s, as perceived by non-local authors. How areas cultivated with ox ploughs are visible onlocal people saw the situation we do not know. the upper slopes. The increase in tree coverThe extent of the changes in land management since that time is quite apparent and the terracespractices which have occurred over the are clearly well maintained and the patches ofintervening 50 years are dramatically illustrated grassland are not eroded. The scene as a wholein the accompanying photographs. Mr. Barnes suggests greatly enhanced prosperity andillustrated his 1937 report with a number of productivity.photos showing some of the areas of denuded This chapter will summarize the physicalslopes or erosion to which his report refers. changes which have occurred, as far as theyUnfortunately he did not indicate the exact could be documented by the study team.location from which his pictures were taken. Subsequent chapters will discuss how theseHowever, by drawing on. local knowledge it was changes came to occur and their implications forpossible to identify a number of the views and land management policy. Although the districtthe study team took follow up pictures in early has been well studied (and this was a reason for1991 illustrating, as far as possible, the current its selection) it has proven to be difficult tocondition of the same s:ites. The changes are obtain consistent data sets covering the wholedramatic. period. Much of the information on the early
The first pair of pictures show a years is partial and based on informed estimates,landscape typical of Agro-economic zone 4. In rather than on any systematically collected data.1937 a great deal of exposed rock or soil is Thus, a degree of caution is in order in makingvisible in the stream channels, as are erosion any comparisons.scars on the slopes of the hills in the middledistance and background. Now almost all the Population Growthcropped area is terraced and well manicured. Afew, limited areas look very much the same as The most basic of the factors driving thebefore, with scrub woodland and some exposed changes illustrated in the photographs has beenrock, and are probably still used for grazing. the continuous and rapid growth of population.However, the bulk of the scene, with its stable, In 1930 this was estimated to be 227,000. Sinceterraced farmlands, confounds the belief, often then it has increased more than five fold to anexpressed in the thirties and forties, that the estimated 1,382,264 in 1989, an average rate ofcultivable topsoils were being stripped and the growth of 3.2 percent per year. Prior to thisdegradation was irreversible. The second pair period, severe droughts were accompanied byof pictures show a long slope which in the 1930s starvation and death. For example, in. 1897-99was poorly managed grazing land, although a there were five successive seasons of failure offew planted hedges and woodlots (perhaps rainfall and it is estimated that over half thereflecting efforts of the Forestry Department) are population died. In the past 60 years, whilevisible. By 1991 the whole slope has occupied cro failures have occurred these have beenand the area is covered with farmsteads and * raccompanied by food relief efforts and migrationtrees. The gullies have become revegetated and of local people to other regions to seekall the cropland is terraced. Only one grazing employment. As a result mortality h-as beenarea remains. The third pair show in more kept to a minimum.detail the extent and the quality of theconservation work.
11 A,
T"M
10
-7>_72XaS~~~~~~~~~~~~~~~~~~~~~~~~~~A: i:1\
�ri K
A'
� V
'VK��<7"'"' " K K'
<7
'7
>7< "' 'K' ��AV
i//f ft'K 7 >K/Ž. A"
7
7K' '7A�
'K' ««K <7'K
7
<4
K K 4'«<�K'<�' 'K' '2A� K7,K7<�
<� K __
KJ K'KNw� 'K < -
12
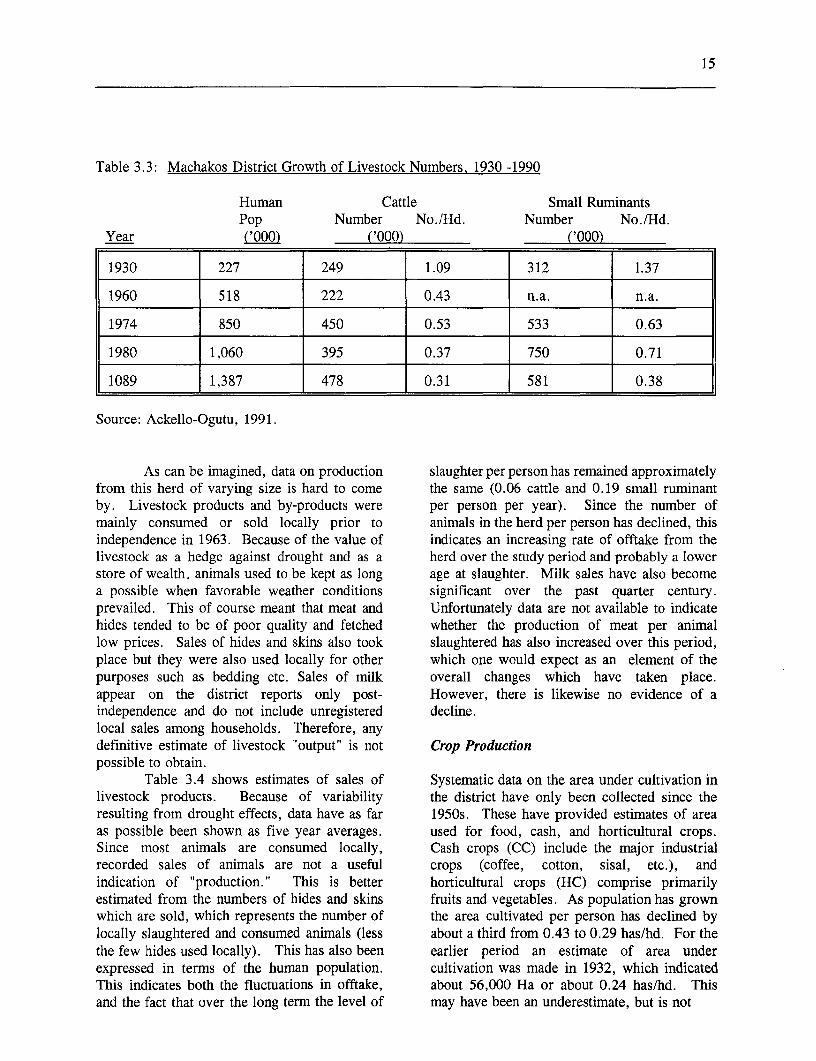
The population estimate for 1989 given Agricultural Growthabove is the preliminary estimate from the 1989census and has been disputed. Detailed Livestockpopulation figures are only available for theperiod to 1979, the date of the previous census. In the early 1930s the Akamba were essentiallyIn the period up to the end of World War II the subsistence pastoralists (as discussed earlier). Apopulation growth rate in the district was veterinary officer was posted to the district inabout 2.5% p.a. Since 1948, growth rates have 1924 with a specific brief to compile livestockbeen over 3% p.a. Between 1948 and 1969 numbers, and he carried out a census in 1930population growth rates in Machakos were below which may compare in general accuracy withthe national average; after 1969 they slightly later figures. This estimated that there wereexceeded the national average (see Table 3.1) 249,000 cattle in the district (Table 3 3) ownedThis appears to be due to a return of emigrants, by the indigenous population. In addition thereas there is no evidence of a local rise of birth were about 21,000 cattle on European ranches inrates, or of large scale immigratiori by non- the western sections of what is now thie district,indigenous people. Growth rates were as high giving a total of 271,000. This numberas 3.76% p.a. in the period 1969-79 but, fluctuated widely in subsequent years because ofaccording to preliminary estimates, fell back to droughts, government policies, and civiljust over 3% p.a. after 1979. disturbance, and the census of 1960 indicated
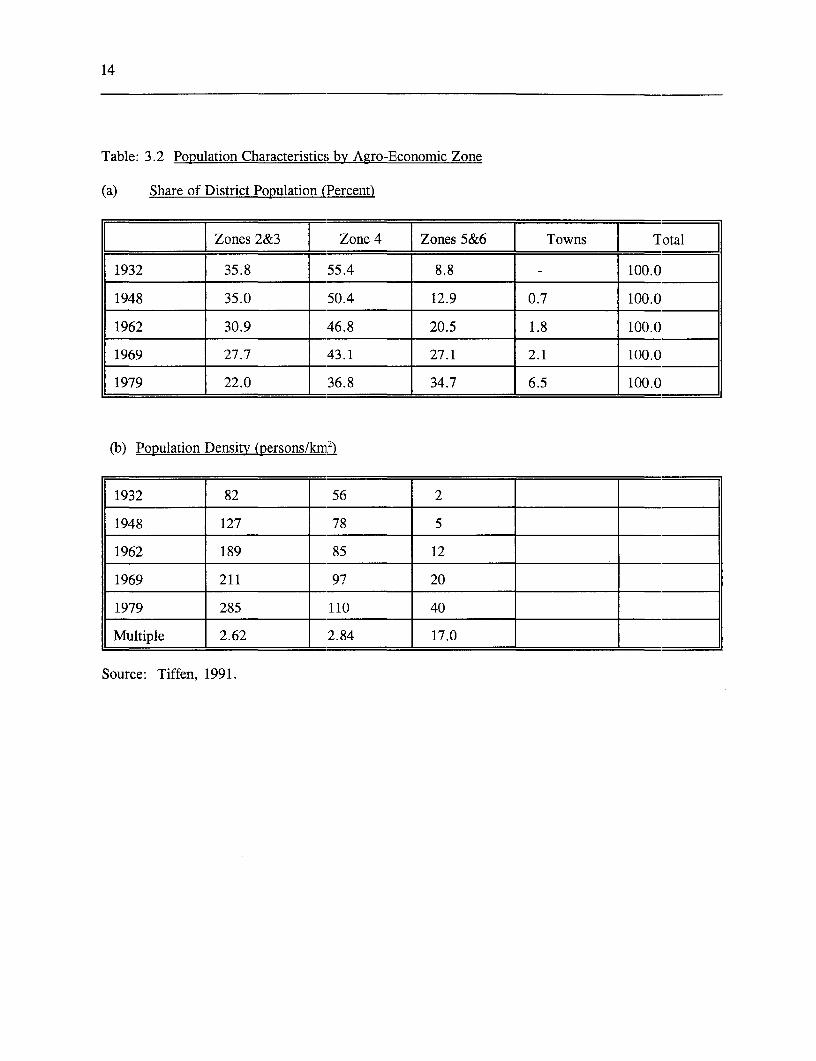
Considerable population movement virtually the same number of animals, 272,000.occurred both within and outside the district. Since that time numbers have continued toThere was a substantial difference in the nature fluctuate because of drought and outbreaks ofof these migrations, however. Movement disease, but have been on a clearer upwiard trendoutside the district was primarily by mnales, and and at the end of the 1980s were estimated atthe male-female ratio fell to very low levels. 478,000. However, as population has increasedImmediately after World War II about 20% of at an even faster rate, the number per head hasthe males over 15 years of age were absent fallen steadily through the whole period, from(Table 3.1). This level has gradually declined more than one in the 30s to 0.3 or less now.over time, apparently more as a result of A similar trend is seen in the numbers ofreduced absence by males than because of small ruminants (sheep and goats). Theseincreased outmigration by women. In the 1930s numbers show greater variation from year toa large section of the district, in the lower, more year as, with their higher reproduction rate thanarid areas (agro-economic zones 5 and 6), was cattle, it is easier to run down and rebuildessentially unpopulated. Since 1948 there has numbers to cope with drought periods. In thebeen a major shift of population into that region early 1930s there were over 300,000 of these(see Table 3.2), so muchi so that it now houses stock in the district, (or nearly 1.4 per head of35% of the population of the district. There the population). The total herd has risen tohave been corresponding declines in the shares 600,000 or so, but the per capita herd has fallenof the higher potential zones 2,3 and 4, (Table to less than 0.5 per head.3.2). Despite this shift, however, densitiesremain several times greater in the higherpotential areas.
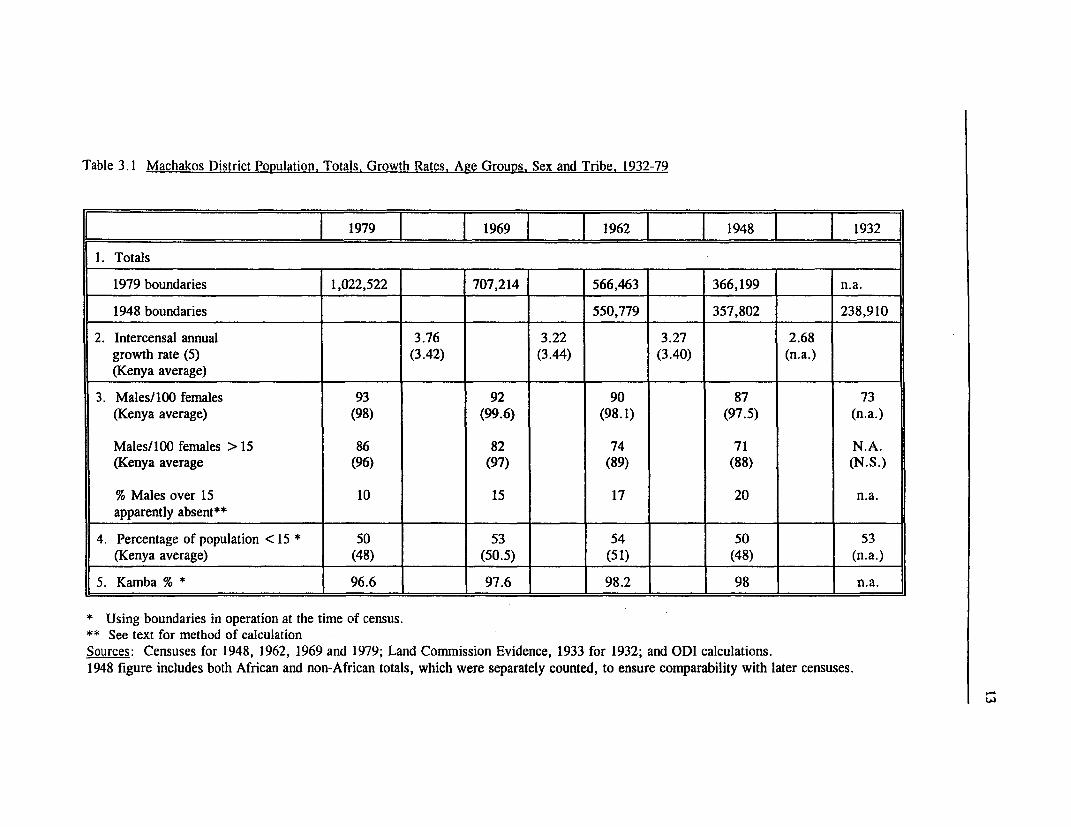
Table 3.1 Machakos District Population. Totals. Growth Rates. Age Groups. Sex and Tribe. 1932-79
1979 1969 1962 1948 1932
1. Totals
1979 boundaries 1,022,522 707,214 - 566,463 366,199 n.a.
1948 boundaries 550,779 357,802 238,910
2. Intercensal annual 3.76 3.22 3.27 2.68growth rate (5) (3.42) (3.44) (3.40) (n.a.)(Kenya average)
3. Males/100 females 93 92 90 87 73(Kenya average) (98) (99.6) (98.1) (97.5) (n.a.)
Males/100 females > 15 86 82 74 71 N.A.(Kenya average (96) (97) (89) (88) (N .S.)
% Males over 15 10 15 17 20 n.a.apparently absent**
|4. Percentage of population < 15 * 50 53 54 50 53(Kenya average) (48) (50.5) (51) (48) (n.a.)
5. Kamba % * 96.6 = 97.6 98.2 98 _ n.a.
* Using boundaries in operation at the time of census.** See text for method of calculationSources: Censuses for 1948, 1962, 1969 and 1979; Land Commission Evidence, 1933 for 1932; and ODI calculations.1948 figure includes both African and non-African totals, which were separately counted, to ensure comparability with later censuses.
14
Table: 3.2 Population C'haracteristics by Agro-Economic Zone
(a) Share of District Population (Percent)
[ Zones 2&3 Zone 4 Zones 5&6 | Towns Total
1932 35.8 55.4 8.8 - 100.0
1948 35.0 50.4 12.9 0.7 100.0
1962 30.9 46.8 20.5 1.8 100.0
1969 27.7 43.1 27.1 2.1 100.0
1979 22.0 36.8 34.7 6.5 100.0
(b) Population Density (persons/kh
1932 82 56 2
1948 127 78 5
1962 189 85 12
1969 211 97 20
1979 285 110 40
Multiple 2.62 2.84 17.0
Source: Tiffen, 1991.
15
Table 3.3: Machakos District Growth of Livestock Numbers. 1930 -1990
Human Cattle Small RuminantsPop Number No./Hd. Number No./Hd.
Year ('000) ('000) ('000)
1930 227 249 1.09 312 1.37
1960 518 222 0.43 n.a. n.a.
1974 850 450 0.53 533 0.63
1980 1,060 395 0.37 750 0.71
1089 1,387 478 0.31 581 0.38
Source: Ackello-Ogutu, 1991.
As can be imagined, data on production slaughter per person has remained approximatelyfrom this herd of varying size is hard to come the same (0.06 cattle and 0.19 small ruminantby. Livestock products and by-products were per person per year). Since the number ofmainly consumed or sold locally prior to animals in the herd per person has declined, thisindependence in 1963. Because of the value of indicates an increasing rate of offtake from thelivestock as a hedge against drought and as a herd over the study period and probably a lowerstore of wealth, animals used to be kept as long age at slaughter. Milk sales have also becomea possible when favorable weather conditions significant over the past quarter century.prevailed. This of course meant that meat and Unfortunately data are not available to indicatehides tended to be of poor quality and fetched whether the production of meat per animallow prices. Sales of hides and skins also took slaughtered has also increased over this period,place but they were also used locally for other which one would expect as an element of thepurposes such as bedding etc. Sales of milk overall changes which have taken place.appear on the district reports only post- However, there is likewise no evidence of aindependence and do not include unregistered decline.local sales among households. Therefore, anydefinitive estimate of livestock "output" is not Crop Productionpossible to obtain.
Table 3.4 shows estimates of sales of Systematic data on the area under cultivation inlivestock products. Because of variability the district have only been collected since theresulting from drought effects, data have as far 1950s. These have provided estimates of areaas possible been shown as five year averages. used for food, cash, and horticultural crops.Since most animals are consumed locally, Cash crops (CC) include the major industrialrecorded sales of animals are not a useful crops (coffee, cotton, sisal, etc.), andindication of "production." This is better horticultural crops (HC) comprise primarilyestimated from the numbers of hides and skins fruits and vegetables. As population has grownwhich are sold, which represents the number of the area cultivated per person has declined bylocally slaughtered and consumed animals (less about a third from 0.43 to 0.29 has/hd. For thethe few hides used locally). This has also been earlier period an estimate of area underexpressed in terms of the human population. cultivation was made in 1932, which indicatedThis indicates both the fluctuations in offtake, about 56,000 Ha or about 0.24 has/hd. Thisand the fact that over the long term the level of may have been an underestimate, but is not
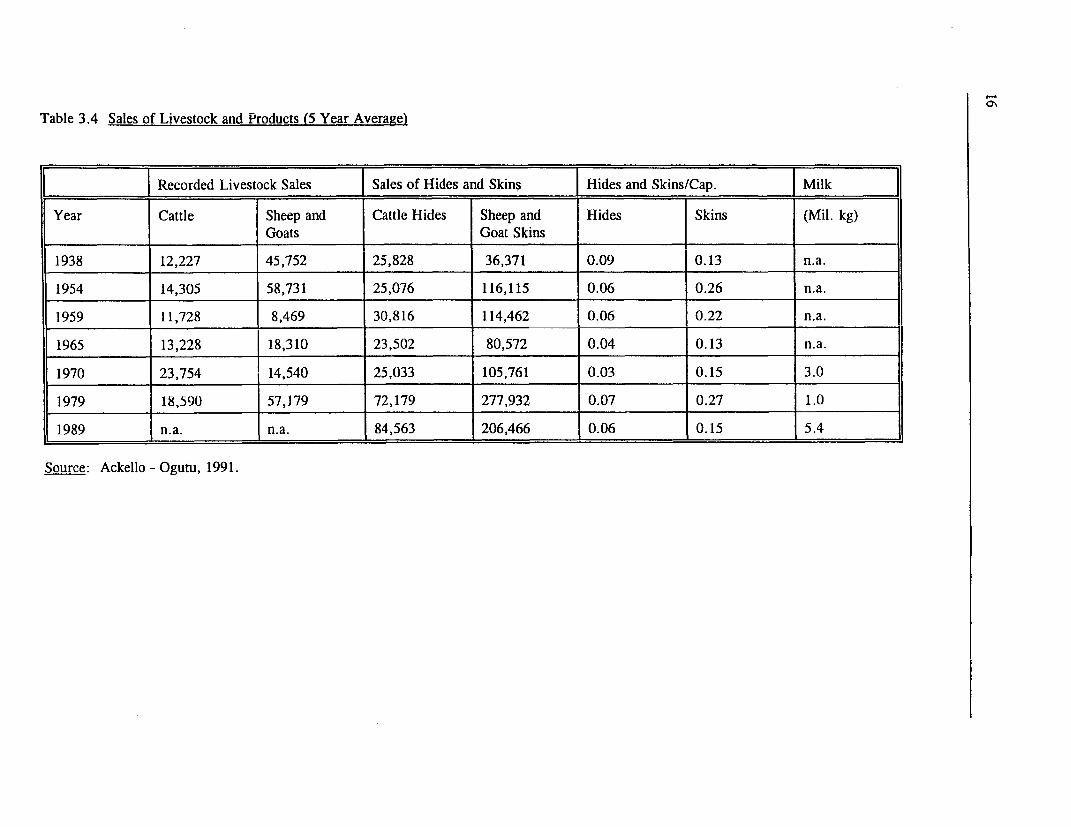
Table 3.4 Sales of Livestock and Products (5 Year Average)
Recorded Livestock Sales Sales of Hides and Skins Hides and_Skins/Cap. Milk
Year Cattle Sheep and Cattle Hides Sheep and Hides Skins (Mil. kg)[Goats Goat Skins
1938 12,227 45,752 25,828 36,371 0.09 0.13 n.a.
1954 14,305 58,731 25,076 116,115 0.06 0.26 n.a.
1959 11,728 8,469 30,816 114,462 0.06 0.22 n.a.
1965 13,228 18,310 23,502 80,572 0.04 0.13 n.a.
1970 23,754 14,540 25,033 105,761 0.03 0.15 3.0
1979 18,590 57,179 72,179 277,932 0.07 0.27 1.0
1989 n.a. n.a. 84,563 206,466 0.06 0.15 5.4
Source: Ackello - Ogutu, 1991.
17
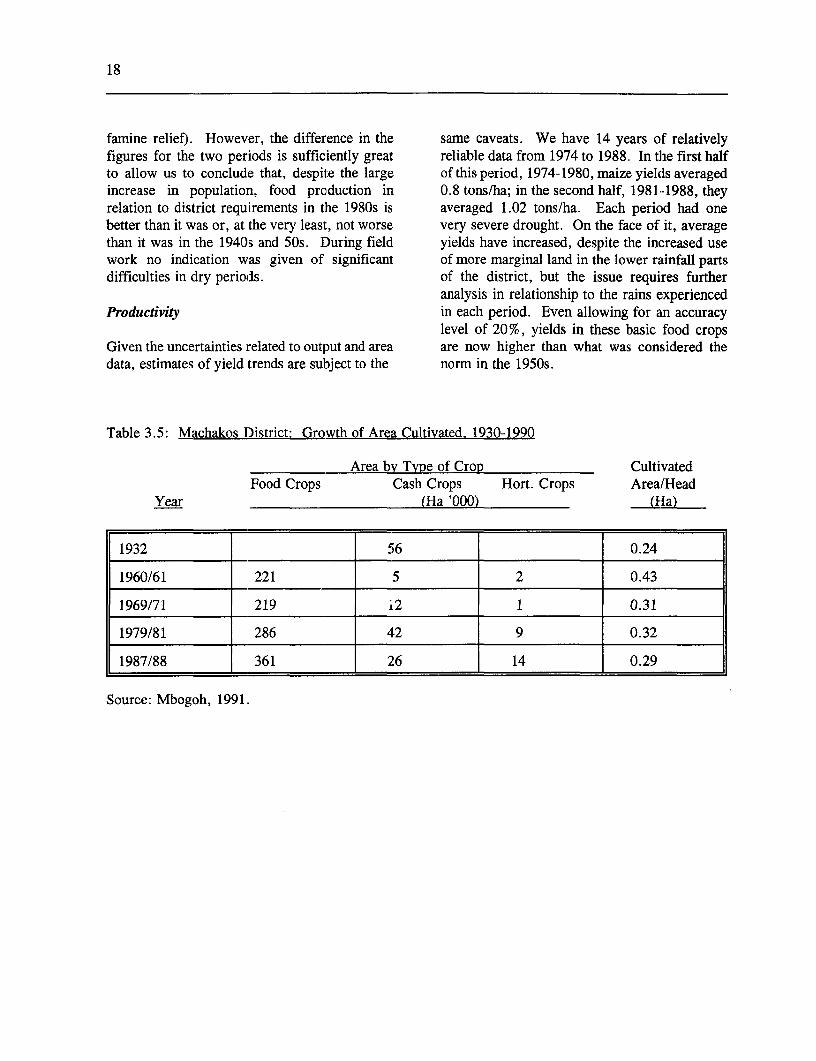
inconsistent with the earlier observation that at period under review, and secondly whether thethat time the Akamba were primarily pastoral, changes to be discussed below have resulted inso that any cultivation was on a relatively small increases in productivity of labor and land.scale. Thus, an increase in the per capita area Drought and semi-drought conditions are acultivated over the three decades 1930 - 1960, chronic problem in Machakos District. This wasand a relative shift towards crop production, and so even when the population was much smaller.relative stagnation in cattle numbers, are For instance, District Annual reports refer tocertainly plausible (see Table 3.5). 1934 and 1935 as difficult years with poor crop
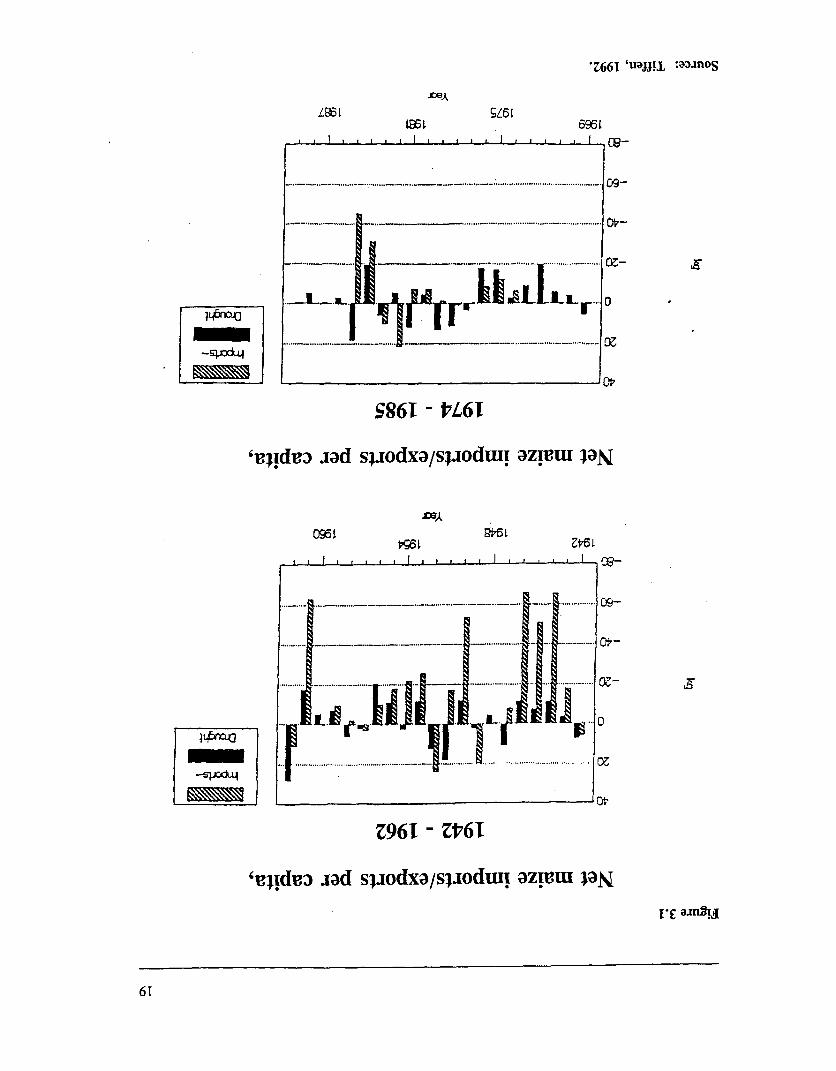
Despite the inadequacies of the data, it yields and/or total crop failure in some parts ofis clear that food crops (FC) have always the district. Despite the large proportion ofoccupied the bulk of the cultivated area, though cultivated area given to food crops, wheneverthere has been an increase in the proportion drought or semi-drought conditions have hitunder cash crops (CC) and horticultural crops Machakos District, the district has depended on(HC) since the 1960s. At the same time there food imports, especially maize grain and maizehas been a substantial increase in the production meal, to feed its population. Such food importsof cash crops. Data in the early years were have come sometimes as famine relief. On otherspotty and the district has long produced small occasions, sales of livestock, sisal and other cashamounts of a wide range of fruits and crops, as well as labor remittances, have enabledvegetables, partly for the Nairobi market. people to buy food.However, maize, beans and peas still remain the Figure 3.1 shows the imports of fooddominant food-cum-cash crops, occupying grains, including both famine relief andbetween 74 and 97 percent of the cultivated land purchases, and exports of maize, for the periodsin the district depending on the agro-ecological 1942 to 1962, and 1974 to 1985, years forzone. Nevertheless, because of their higher which data are available. This is on a per capitavalues, the CC and HC are vitally important as basis. The correlation with rainfall is veryincome generators. good, allowing for some lag effect. For
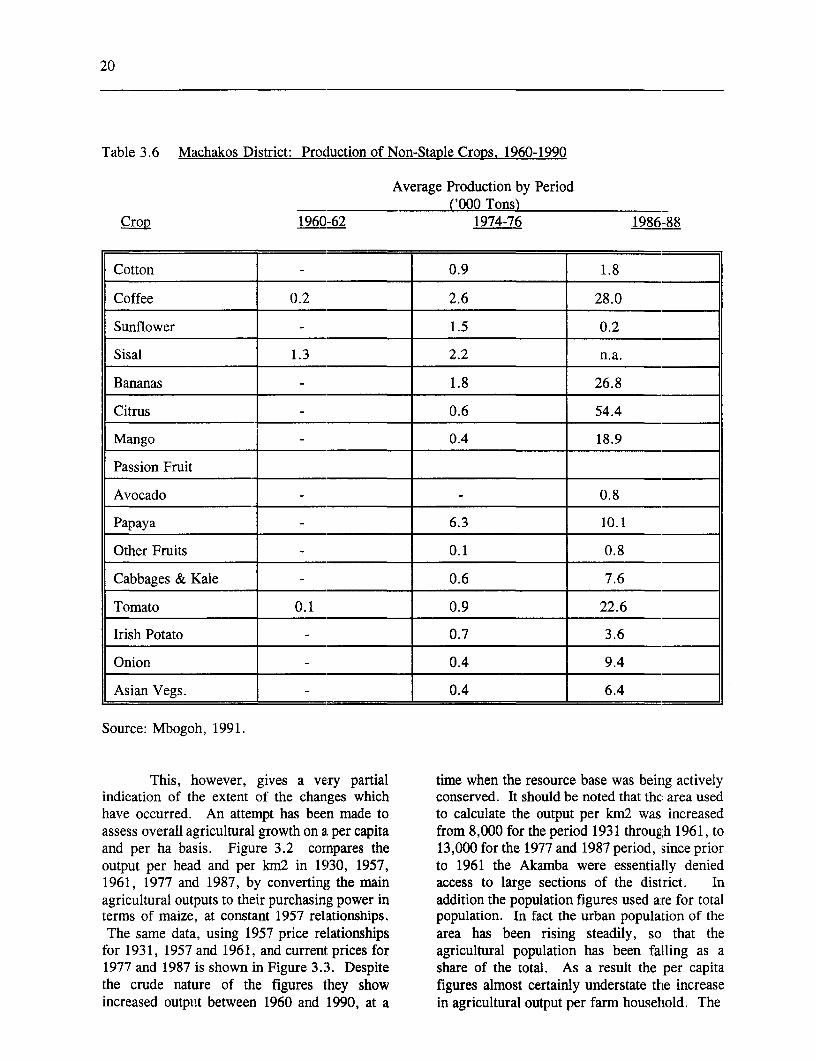
Table 3.6 shows that there has been a example, the 1984 output was low because of averitable explosion in the production of these medium droug,ht in the short rains of 1983 andnon-traditional cash crops, particularly in the a severe drought in the long rains of 1984. The1980s. For example, coffee production latter was the third successive drought season.increased 10 fold between the mid-70s and the Output in 1985 was high because oflate 80s, citrus and mango output increased exceptionally good short rains in the latter halfnearly 100 fold, tomatoes by 25 times, and so of 1984. However, the harvest was noton. Production of these crops can be highly available until March, and in the first quarter ofvariable, in part as a result of changes in market the year substantial imports of food weredemand and climatic variability, and figures required.shown are annual averages from a three year What is remarkable is that in the firstperiod to eliminate short term variability. series, 1942-62, net imports averaged 17.38 kg.Production of sisal and sunflower fell sharply in per capita. In the period 1975-85 they averagedthe 80s and cotton production declined rapidly in only 7.57 kg per capita, despite the substantialrecent years because of low profitability, increase in population (about 2 1/2 fold), a moveaggravated by marketing difficulties. Overall, by many farmers to more arid areas and ahowever, the picture is one of rapidly increasing substantial increase in the local urban populationcash oriented production. (see page 8). Purchase of food in bad years is
now more difficult to document as less isDrought Impact brought in officially and what trade there is
occurs through normal commercial channels. ItFrom the point of view of this study, perhaps is possible that in the second period more foodthe two most important issues related to was imported informally (the official figuresagricultural production are, firstly, whether the relate to net exports and imports of the Nationaldistrict is as drought prone as at the start of the Crop Production Board and its predecessor, plus
18
famine relief). However, the difference in the same caveats. We have 14 years of relativelyfigures for the two periods is sufficiently great reliable data from 1974 to 1988. In the first halfto allow us to conclude that, despite the large of this period, 1974-1980, maize yields averagedincrease in population, food production in 0.8 tons/ha; in the second half, 1981-1988, theyrelation to district requirements in the 1980s is averaged 1.02 tons/ha. Each pericid had onebetter than it was or, at the very least, not worse very severe drought. On the face of it, averagethan it was in the 1940s and 50s. During field yields have increased, despite the increased usework no indication was given of significant of more marginal land in the lower rainfall partsdifficulties in dry periods. of the district, but the issue requires further
analysis in relationship to the rains experiencedProductvity in each period. Even allowing for an accuracy
level of 20%, yields in these basic food cropsGiven the uncertainties related to output and area are now higher than what was considered thedata, estimates of yield trends are subject to the norm in the 1950s.
Table 3.5: Machakos District: Growth of Area Cultivated. 1930-1990
Area by Type of Crop CultivatedFood Crops Cash Crops Hort. Crops Area/Head
Year (Ha '000) (Ila)
1932 56 0.24
1960/61 221 5 2 0.43
1969/71 219 12 1 0.31
1979/81 286 42 9 0.32
1987/88 361 26 14 0.29
Source: Mbogoh, 1991.
*Z661 'UOJJ!L :aaanoS
L93 5Z6696l
. .. .. . I. . ...- . . I.. .,, I CB-
L... _ _L, LL_..O 9~~~~~~~~~~~. _ _. . ... _._,_...........I.................... .... M_
. . ........... . ...... . _ ........ .~ ~~~~. ...... _ . .... ........ ........ . oz...
.~~~~~~~wt . , . o
S861 - tL61
'Iledva sad spodxa/sIodtm azirmU JaN
09-
ca NS i LI A if_pa, ~~~~~~~~~~... ...... .......... ............. ...... .............. .................. ... o
Z961 - ZV61
61!dec aad spofta/spodi azi.tu laN
61
20
Table 3.6 Machakos District: Production of Non-Staple Crops. 1960-1990
Average Production by Period('000 Tons)
Crop 1960-62 1974-76 1986-88
Cotton 0.9 1.8
Coffee 0.2 2.6 28.0
Sunflower 1.5 0.2
Sisal 1.3 2.2 n.a.
Bananas 1.8 26.8
Citrus 0.6 54.4
Mango 0.4 18.9
Passion Fruit
Avocado 0.8
Papaya 6.3 10.1
Other Fruits 0.1 0.8
Cabbages & Kale - 0.6 7.6
Tomato 0.1 0.9 22.6
Irish Potato 0.7 3.6
Onion 0.4 9.4
Asian Vegs. 0.4 6.4
Source: Mbogoh, 1991.
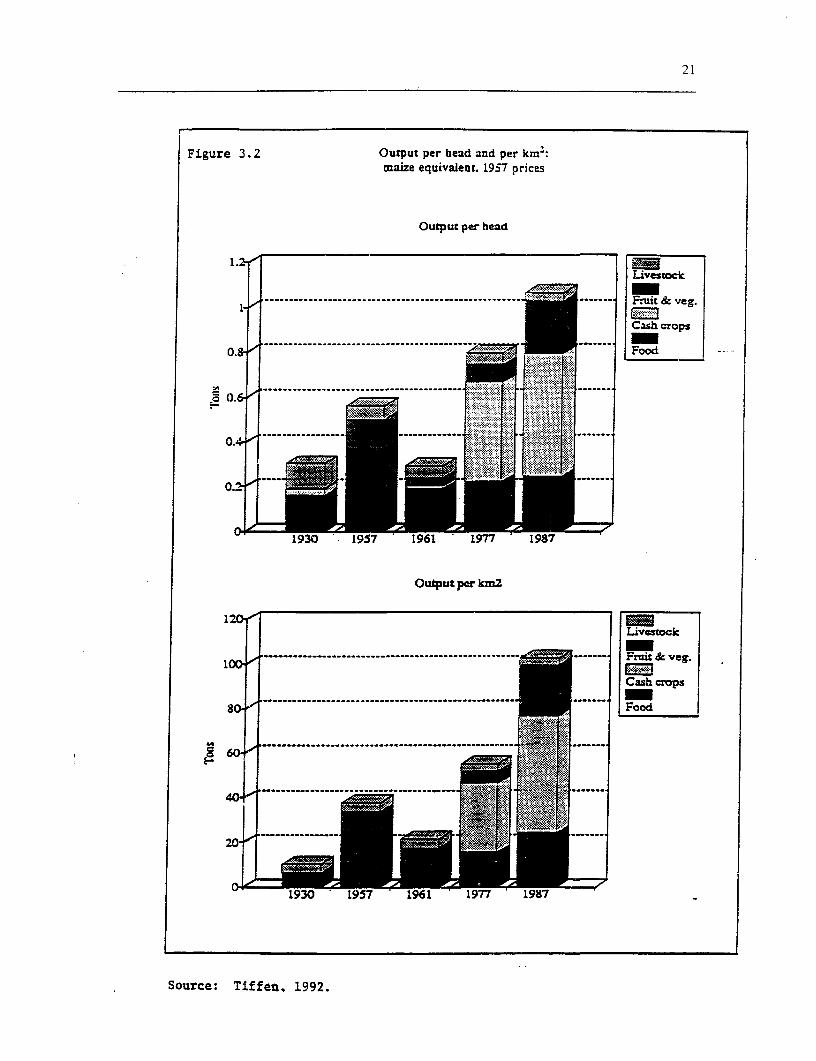
This, however, gives a very partial time when the resource base was being activelyindication of the extent of the changes which conserved. It should be noted that the area usedhave occurred. An attempt has been made to to calculate the output per km2 was increasedassess overall agricultural growth on a per capita from 8,000 for the period 1931 througrh 1961, toand per ha basis. Figure 3.2 cornpares the 13,000 for the 1977 and 1987 period, since prioroutput per head and per km2 in 1930, 1957, to 1961 the Akamba were essentially denied1961, 1977 and 1987, by converting the main access to large sections of the district. Inagricultural outputs to their purchasing power in addition the population figures used are for totalterms of maize, at consitant 1957 relationships. population. In fact the urban population of theThe same data, using 1957 price relationships area has been rising steadily, so that the
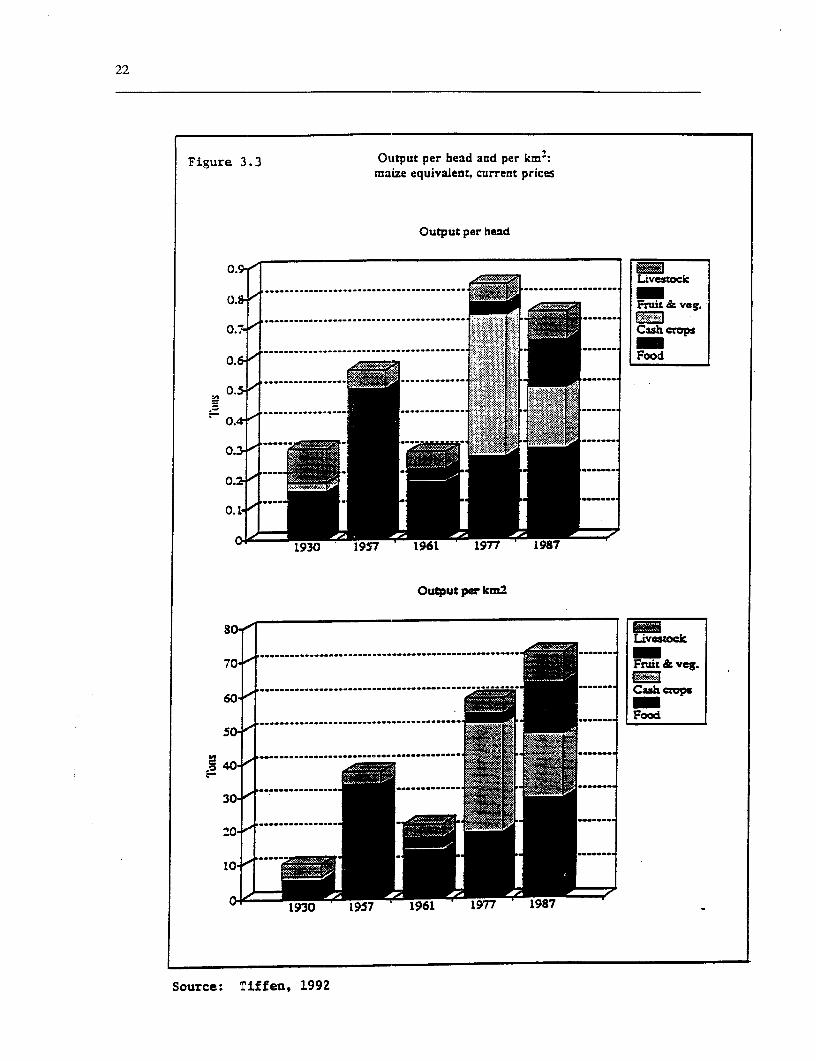
for 1931, 1957 and 1961, and current prices for agricultural population has been falling as a1977 and 1987 is shown in Figure 3.3. Despite share of the total. As a result the per capitathe crude nature of the figures they show figures almost certainly understate the increaseincreased outpnt between 1960 and 1990, at a in agricultural output per farm household. The
21
Figure 3.2 Output per head and per km.:maize equivalent. 19i7 prices
Output per head
1.> /
I_ / .. . .. . . ... ........ ~~~Fmuit & veg.
Cash crops
0.8. , Food
---------------------------. __------ -------- : R:: :, B [ 0.6-
.1~~~~~~~~~~~~~~~~~~~~~~~~~~~~~~~~~~~~~~~~~~~~~~~~~
0.*w
1930 .197 1961 197 1987
Output per kmn2
120 / _ | ~~~~~~~~~~Lvicsrock
100 ------------------------------------------ . -- - F & veg.Cash crops
8o Food
~60,
20 / .. ....... ...
1930 1957 1961 1977 1987
Source: Tiffeu, 1992.
22
Figure 3.3 Output per head and per kmz:maize equivalent, current prices
Output per hend
0.9 /. Livestock
0.8F <.ffiww F :rui: & veg.
0 . ....................................... ....... a3O.& 000' ~~~~~~~~~~~Food
O .--- *--*---- - ------- - - s ............. ................ Fo
M os~ ~ ~~ ~.. ........ -------O.,*~' ............. ,......
0.
1930 1957 1961 1977 1987
Output per kIm2
80 - - . m k
...................................................... ..... '''''m l70 O' Fruit & veg.
60 ....... ... ............. ........ Food_600
0 _._.............. .. _..... ........
3-
so-
10,
19a Ii30 1957 1961 1977 1987
Source: Tiffen, 1992
23
data also show the great importance of higher been absorbed since 1950 in Machakos, by avalue crops, produced for the market, in combination of developing new farmland,increasing the value of output. In this case, capitalising new farms, and diversifying incomecoffee was particularly important and the current sources into the non-farm sectors.price data show the impact of the fluctuations incoffee prices on cash incomes in the area. The Resource Base
During the steep phase of productivitygrowth in Machakos, a population growth of Section B of this chapter has outlined the natureabout 3.4% per annum was experienced. The of the changes in agricultural production andgrowing density of population and its relative productivity which have been achieved in theshift into the low potential AEZs 5 & 6 has been district over the past 60 years. A major issue isshown in Table 3.2. Rising values of whether this growth has been achieved at theproductivity per km2 between 1960 and 1980 expense of the land based resources of thecoincided with an increase in the proportion of district and, therefore, whether the presentcultivated area that was in the lower potential situation appears to be sustainable. The studylands. Agricultural settlement of these lands in team examined five aspects of the resource basethe 1970s was accompanied by predictions of to assess this issue: changes in land use, soilenvironmental and economic disaster by erosion, soil fertility, the condition of the naturalacademics and officials. Wisner, for example, range, and of trees.regarded this movement as the product ofmarginalization, likely to lead to man-made Land Use Changefamine.
Between the 1979 and 1989 censuses The agricultural data has indicated substantialoverall population growth seems to have dropped increases in the area used for crop productionto about 3% per annum. At the same time, and in outputs of both crop and livestockthere was no new land to be occupied. During products. At the same time there werethis decade, value of output per hectare substantial changes in the mix of products and,continued to grow, but fell behind population thus, of farming systems. From what uses hasgrowth rates, as shown by the value of output this agricultural land been drawn?per capita at current price ratios. This suggests The study team were fortunate that datathat a second danger point may be being are available from three types of remote sensingreached. However, the evidence does not permit (Rostom and Mortimore, 1991). These covercertainty on this point. It is possible that in different periods: (a) four sets of vertical black-some areas the point of diminishing returns is and-white air photography (AP) carried outbeing reached. The flattening curve may be due between 1948 and 1978 at scales ranging fromto difficulty with keeping up with rising 1:20,000 to 1:50,000; (b) earth satellite imagerypopulation growth in the older settled areas, or data such as the Landsat thematic mapperwhen all the new land has been occupied. (TM) covering the period since 1978; and (c)However, it could be due to temporary systematic reconnaissance flight (SRF) low leveleconomic circumstances, as Figure 3.2 shows air photography from 1981 and 1985 at a scalethat at constant 1957 relative prices, output per of 1:6,770. Since the air photography data onlyhead was still rising. In the 1980s the covered the period 1948-78, in order to providedeficiencies in marketing and policy were a data series from 1948 to the present, twodepressing some farm gate prices. possibilities were investigated: earth satellite
Despite the hesitations in growth in the data, and systematic reconnaissance flight (SRF)1980s, the recovery of the district from the data, for which post 1978 data were available.position of the 1930s shows that the point of With regard to the first, earth satellite data arediminishing marginal returns may be further technically available for many points in timealong the production/population density curve from the 1970s to the present. However,than many experts had predicted earlier. Thus, considerable difficulties were faced inpopulation growth exceeding 3 % per annum has reconciling the resulting data, largely because of
24
the presence of shadow effects in hilly areas, From the air photos it was ,possible towhich confounds interpretation. It was, identify terrace structures. Each block wastherefore concluded that the false color imagery assigned to its class according to whether terracewas incapable of harmonization by visual structures are visible on the photographs assistedinterpretation with the land use classes identified by stereoscopic viewing. Table 3.8 presents theon air photographs. sub-categorization of cultivated land on this
In 1981 and 1985, systematic low-level basis. This shows that by 1978 the use ofreconnaissance flights were carried out over the terraces was virtually universal in the morewhole District, generating large scale color slide populated areas. However, the 100% figurephotographs according to a discontinuous, should be interpreted with care as it does notsystematic sampling procedure (Ecosystems mean that 100% of the area was terraced, only1982; 1986). Each photograph covers a surface that 100% of the blocks measured werearea of approximately 4 ha, and its large scale predominantly terraced and, furthermore, terracepermits extremely detailed land cover data to be maintenance cannot be assessed, nor theinterpreted. Land cover areas are not mapped, adequacy of the structures in terms of design orbut measured within reasonable statistical bounds spacing. Nevertheless, the data give anof probability from counts, carried out on each approximation of progress in conservation worksslide projected on a screen. The issue of on farm land.compatibility of this material with the airphotography was investigated thorougyhly, and it Soil Erosionwas concluded that this, data set could not beused in conjunction with the 1978 photography. The major factor leading to governmental
The result of these compatibility problems concern which resulted in the reports citedwas, therefore, that detailed analysis could only earlier in the 1930's was the perception that soilbe undertaken of the 1948-78 period. The erosion was occurring in the district on a majormethod used is described fully in the background scale. How far has this problem been containedpaper (Rostom and Mortimore, 1991). Maps in the succeeding half century? Two studies,were prepared for three dates (1948, 1960-61 covering periods between the late 40s and theand 1978), in each of the five study areas in mid 80s, provide some insights into this issuewhich field work by the study team was (Thomas, 1991). Unfortunately, these coveredconcentrated. The whole of Mbiuni, Masii and different areas and used different approaches, soKalama locations were mapped. In Makueni and that a direct "before and after" comparison is notNgwata locations, in view of their size, the feasible.mapping was restricted to sample areas. Erosion in Kalama, 1948-74. The firstAltogether, 84,050 ha were mapped in 1948 and attempt to use air photographs in erosion1978, and a slightly reduced area (83.,250 ha) in assessment was made by Thomas (1974) in the1961. Wamui River basin in Kalama Location, which
In Table 3.7 the areas of each land use Hobbs considered almost 60% eroded in 1937.category in 1948 and 1978 are given, both in Thomas used air photography of February,hectares and as percentages. In calculating the 1948 and January, 1972. The results of hispercentages, areas of unclassified land use have analysis in a sub-catchment of 1.73 Km2 arebeen subtracted form the total. This indicates shown in Table 3.9. A technique of micro-that, even in Mbiuni and Masii, the most analysis at 29 controlled sites was applied todensely populated areas at the beginning, the both sets of photographs. Of the 29 sites, 10area under cultivation was increased by over showed no change in the extent of erosion, 5100% by 1978. Forest areas were insignificant showed a decrease and 14 an increase.throughout the period and the increase in This study drew attention to acultivated area was obtained by conversion of fundamental divergence between the impact of"Bush, Scrub and Grazing" land. By 1978, grazing and that of cultivation on erosion.more than 50% of land in the more populated Notwithstanding the fact that crops provide poorAEZ 2 and 3 areas, was under cultivation.
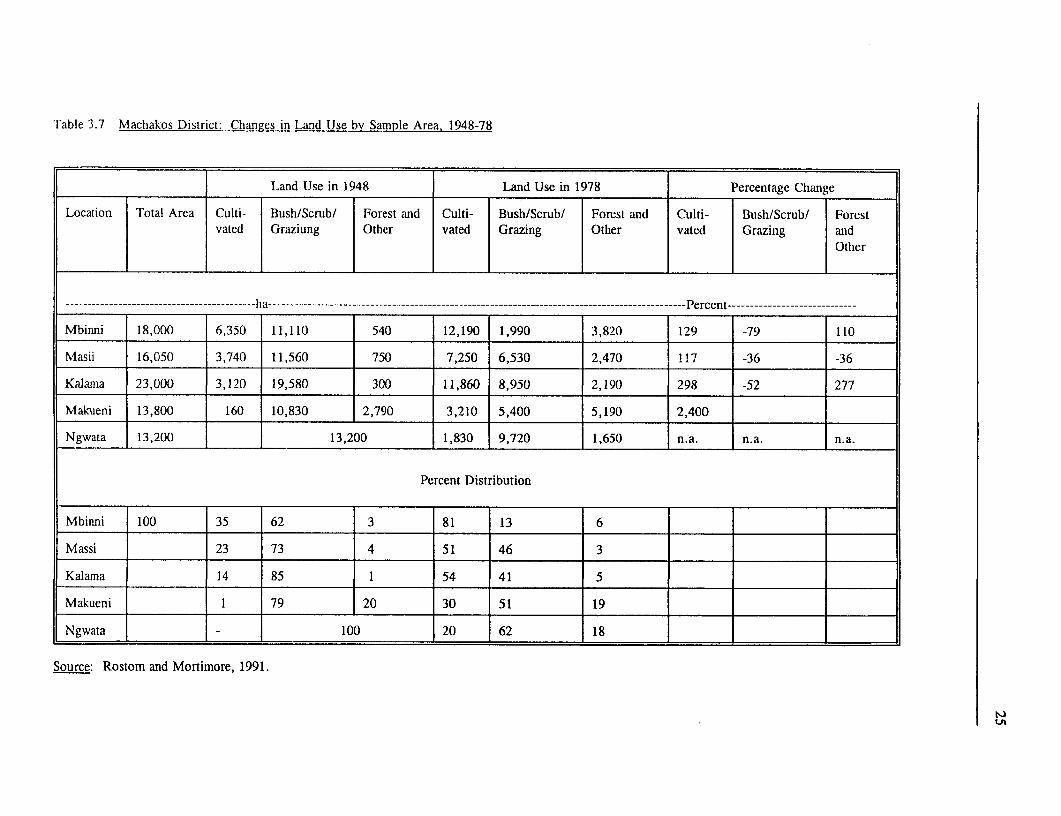
Table 3.7 Machakos District: Changes in Land Use by Sample Area. 1948-78
Land Use in 1948 Land Use in 1978 Percentage Change
Location Total Area Culti- Bush/Scrub/ Forest and Culti- Bush/Scrub/ Forest and Culti- Bush/Scrub/ Forestvated Graziung Other vated Grazing Other vated Grazing and
Other
------------------------------------------- ha ------------------------------------------------------------ ----------------------------------Percent -----------------------------
Mbinni 18,000 6,350 11,110 540 12,190 1,990 3,820 129 -79 110
Masii 16,050 3,740 11,560 750 7,250 6,530 2,470 117 -36 -36
Kalaina 23,000 3,120 19,580 300 11,860 8,950 2,190 298 -52 277
Maklueni 13,800 160 10,830 2,790 3,210 5,400 5,190 2,400
Ngwata 13,200 13,200 1,830 9,720 1,650 n.a. n.a. n.a.
Percent Distribution
Mbinni 100 35 62 3 81 13 6
Massi 23 73 4 51 46 3
Kalama 14 85 1 54 41 5
Mak-ueni 1 79 20 30 51 19
Ngwata = 100 20 62 18
Source: Rostom and Mortimore, 1991.
26
ground cover in the early part of the rainy documented through a single drought cycle forseason, when rainfall intensity is high, 1974 the first time. By comparison, the increase inestimates of ground cover at 19 sites on grazing gully activity was less significant. Given theland showed that 42% of the surface was bare relatively short period and the fact that non-and soil was much more compacted than on coincident cells were used, the reliability of thiscultivated land (pp 63-7). result is considered to be uncertain.
Gully formation is an extension of the That this was a temporary setback in annatural drainage networlk, and often occurs in otherwise declining long term trend cannot be incycles set off by natural or man-made events. doubt, for reasons given below. The changesThe Kalama study showed that the main show a clear relationship with ecology. Evenextension in gully length was completed by though the locational boundaries do not fit1948, though the 1972 photographs indicated exactly into agro-ecological zones, when thecontinuing widening, and ground surveys locations are so allocated, it appears that theshowed some deepening. Evidence obtained average erosion indices for 1985 were lowest infrom informants who could remember the zones 2/3 and highest in zones 5/6, and thehistories of gullies, together with an absence of percentage changes in the average erosionany mention of them by travellers who passed indices vary in the same way. If we accept thatthrough the area in the 1890s (Lugard, quoted in the deterioration during the period was due toPerham, 1959), lead to the following conclusion. drought, this table demonstrates theDeterioration in ground cover led to high rates susceptibility of the drier areas to drought-of runoff, rapid erosion and a rapid extension of induced degradation, and the greaterthe drainage network thtrough the inicision of vulnerability of conservation efforts in suchwatercourses and gulling between about 1915 areas.and 1950, with peak rates of deterioration in the Reid (1982) also estimated the rates of1930s and 1940s. During these decades the soil loss from gulling and from rill andincidence of drought was high. sheetwash erosion throughout the District.
Erosion in 1981-85. An assessment of For estimating soil loss from rill and sheetwashsoil erosion in the District in 1981 was carried erosion, she used the USLE with local values forout by Reid (1982), usin1g low level color air the indices (rainfall erosivity, slope, croppingphotographs taken in a reconnaissance sample factor and management or conservation factor).frame (Ecosystems, 1982), and other sources. The analysis showed a sharp differentiationErosion "events" - gullies, rills on agricultural among the regions in the rates of erosion and inland, sheetwash and streambank erosion - were the proportions of soil loss contributed byquantified in 25 km2 ce].ls. The gullies were grazing land, cultivated land, roads and gullies.analyzed in terms of a. number of possible Assuming that most of the cultivated land is wellexplanatory variables. An analysis was made of terraced, the major contribution to soil losschanges between 1981 and 1985 in the areas comes from grazing land. The analysis isaffected by erosion (Ecosystems, 1986), using a elaborated in the background paper (Thomas,second set of low level photographs taken four 1991).and a half years after the first. The overall conclusion from the data
This indicated that there was available is that erosion rates have been verydeterioration during the period. However, high, especially on grazing land which wasbetween the two surveys, there were three denuded of ground cover, on cultivated landsuccessive drought seasons: in the long rains of where there were no conservation measures, and1983 (a severe drought), the following short on unpaved roads. As noted by Barber (1983)rains ( a moderate drought), and the long rains most estimates are liable to gross errors andof 1984 (severe). This accounted for the should be used with caution. Although there isincreased amount of bare ground on grazing little data, there are strong reasons to believelands, a feature noticed by observers since the that the rate of soil erosion on crop land and on1920s as symptomatic oif the linkage between grazing land has been much reduced in recentstocking rates, drought znd erosion, and here years. Farmers are now well aware oi the
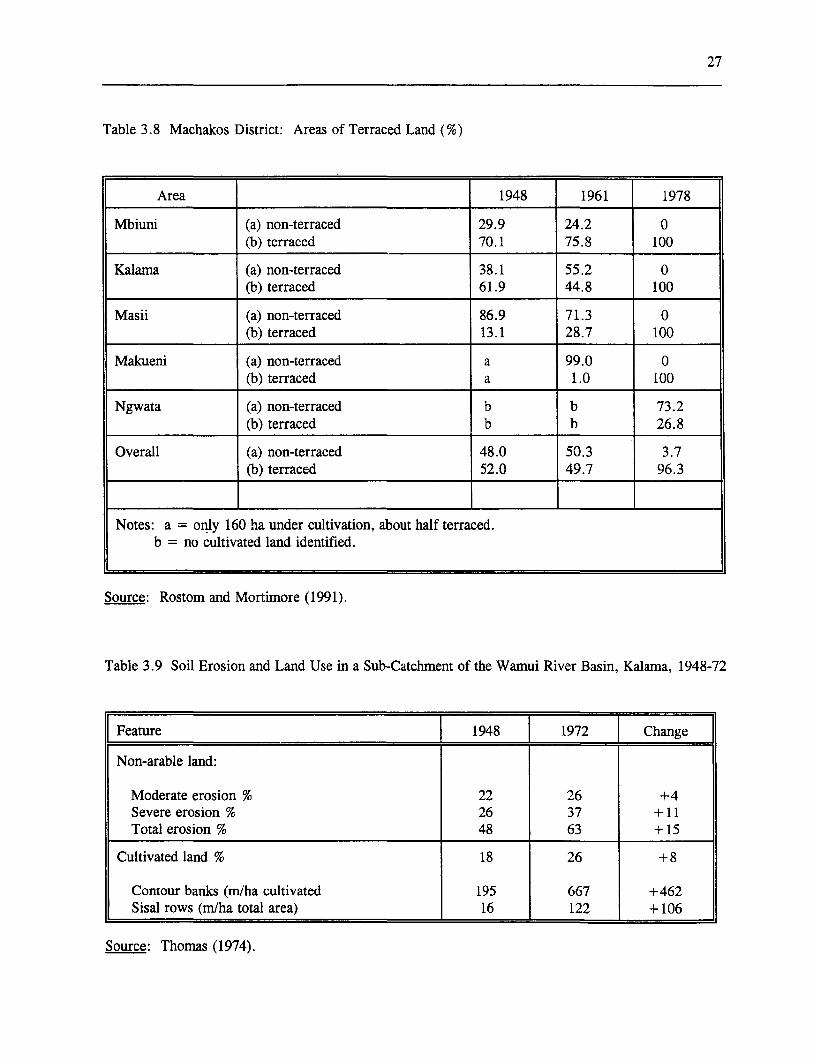
27
Table 3.8 Machakos District: Areas of Terraced Land (%)
Area 1948 1961 1978
Mbiuni (a) non-terraced 29.9 24.2 0(b) terraced 70.1 75.8 100
Kalama (a) non-terraced 38.1 55.2 0(b) terraced 61.9 44.8 100
Masii (a) non-terraced 86.9 71.3 0(b) terraced 13.1 28.7 100
Makueni (a) non-terraced a 99.0 0(b) terraced a 1.0 100
Ngwata (a) non-terraced b b 73.2(b) terraced b b 26.8
Overall (a) non-terraced 48.0 50.3 3.7(b) terraced 52.0 49.7 96.3
Notes: a = only 160 ha under cultivation, about half terraced.b = no cultivated land identified.
Source: Rostom and Mortimore (1991).
Table 3.9 Soil Erosion and Land Use in a Sub-Catchment of the Wamnui River Basin, Kalama, 1948-72
Feature | 1948 [ 1972 Change
Non-arable land:
Moderate erosion % 22 26 +4Severe erosion % 26 37 +11Total erosion % 48 63 +15
Cultivated land % 18 26 + 8
Contour banks (mlha cultivated 195 667 +462Sisal rows (m/ha total area) 16 122 + 106
Source: Thomas (1974).
28
significance of the erosion hazard, the need to hilly areas. They suggest that soils, generallycontrol it and the ways in which this can be low in organic matter, carbon and nitrogen, anddone. They are also well aware that land is phosphorus, have tended to decline further inseverely restricted and free land is no longer carbon content (see Table 3.10). No clear trendavailable. They are, therefore, putting much in nitrogen has been shown. Exchangeablemore effort into soil conservation than in the bases have shown small changes (positive forpast and, as has been noted above, the use of calcium and negative for potassiurn), or noterraces on slopes is now almost universal on change (magnesium), with the exception ofcropped land. The time lag between clearing sodium, which appears to have increasednew land for cultivation and installing suitable noticeably. Phosphorus has remained stableconservation measures is much less now than in except under cultivation, where it declined.the past (as in areas of Ngwata settled in the Infiltration and runoff have brought. about a1970s). It can, therefore, be assumed that the small increase in the sand fraction of the soils.rate of erosion is being reduced. However, there is a high degree of variation
between sites, as would be expected.Soil Fertility In order to broaden the analysis an
alternative method was used with the objectiveA major concern related to agricultural of inferring change from the differences betweenintensification is the decline in soi:l nutrient soils under cultivation and grazing managementcontent frequently observed following the regimes and those on control sites under naturalcultivation of land previously under permanent vegetation. Twenty-seven samples werevegetative cover. One of the difficulties in collected from Kilungu Location. The samplesaddressing this issue is that the monitoring of were collected from three categories of site,soil properties over time is not normally representing different land uses. The first (Siteincluded in the mandates of soil survey 1) represented areas which have not beenorganizations, and few systematic attempts have cultivated for over sixty years and aLre underbeen made to do it. In the present study, natural vegetation cover. The second, (Site 2)(Mbuvi, 1991) it was initially hoped that soil represented areas which have been fallow forsamples from soil surveys undertaken in the mid twenty years or more and are currently used as1970s might be located, in order to re-analyze grazing land, and the third (Site 3) representedthem alongside fresh samples of topsoil from the areas which have been under annual cultivationsame sites (this method has been tried in for 40-60 years or more without any knownNigeria: Mortimore, Essiet and Patrick, 1990). additions of fertilizer and little manuring. InHowever, the soil archives of the Kenya Soil one area, site 3 was on a terrace; in the otherSurvey were destroyed a few years ago and two areas, it had not benefitted from any landunfortunately, most of the data files for the improvement.earlier surveys could also not be found. In the If the Kilungu soils are representative, asevent data were found on only 30 of the earlier they are thought to be, of the hill masses in thesites and these were located. However, 26 of densely and long settled areas of the District,these were in the Makueni area, one of the driest they give a graphic picture of the impact ofparts of the district, ancl only 4 were in the permanent cultivation (without compensatingnorthern more humid and populated part of the inputs) on the natural soils of the area. Adistrict. comparison of the analytical results from sites 1
Since all these sites were uncultivated in and 3, averaged for the three areas, shows falls1977, and 23 of them remained so in 1990, the in carbon (by a factor of about 3.5), nitrogenlongitudinal analysis offers little guidance on the (3.0), phosphorus (0.5), calcium. (8.0),impact of cultivation, but does suggest a picture magnesium (3.5) and potassium (0.5) (Tableof trends on grazing land. with the proviso that 3.11). Soils have also become somewhat morethe findings are limited by the sample acid. Inspection of the soil reveals that the darkdistribution to the southern part of the District, brown surface horizon of the naturally woodedand may not be applicable in full to the northern sites gives way to lighter colored, saLndy soil
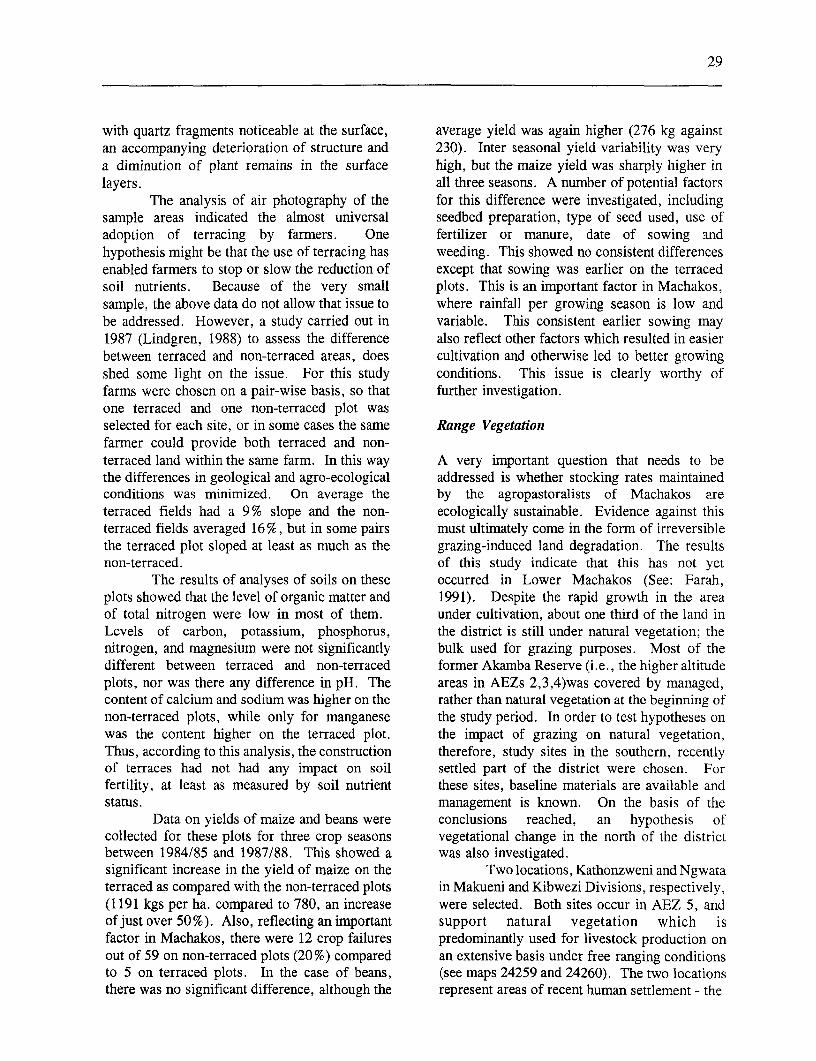
29
with quartz fragments noticeable at the surface, average yield was again higher (276 kg againstan accompanying deterioration of structure and 230). Inter seasonal yield variability was verya diminution of plant remains in the surface high, but the maize yield was sharply higher inlayers. all three seasons. A number of potential factors
The analysis of air photography of the for this difference were investigated, includingsample areas indicated the almost universal seedbed preparation, type of seed used, use ofadoption of terracing by farmers. One fertilizer or manure, date of sowing andhypothesis might be that the use of terracing has weeding. This showed no consistent differencesenabled farmers to stop or slow the reduction of except that sowing was earlier on the terracedsoil nutrients. Because of the very small plots. This is an important factor in Machakos,sample, the above data do not allow that issue to where rainfall per growing season is low andbe addressed. However, a study carried out in variable. This consistent earlier sowing may1987 (Lindgren, 1988) to assess the difference also reflect other factors which resulted in easierbetween terraced and non-terraced areas, does cultivation and otherwise led to better growingshed some light on the issue. For this study conditions. This issue is clearly worthy offarms were chosen on a pair-wise basis, so that further investigation.one terraced and one non-terraced plot wasselected for each site, or in some cases the same Range Vegetationfarmer could provide both terraced and non-terraced land within the same farm. In this way A very important question that needs to bethe differences in geological and agro-ecological addressed is whether stocking rates maintainedconditions was minimized. On average the by the agropastoralists of Machakos areterraced fields had a 9% slope and the non- ecologically sustainable. Evidence against thisterraced fields averaged 16%, but in some pairs must ultimately come in the form of irreversiblethe terraced plot sloped at least as much as the grazing-induced land degradation. The resultsnon-terraced. of this study indicate that this has not yet
The results of analyses of soils on these occurred in Lower Machakos (See: Farah,plots showed that the level of organic matter and 1991). Despite the rapid growth in the areaof total nitrogen were low in most of them. under cultivation, about one third of the land inLevels of carbon, potassium, phosphorus, the district is still under natural vegetation; thenitrogen, and magnesium were not significantly bulk used for grazing purposes. Most of thedifferent between terraced and non-terraced former Akamba Reserve (i.e., the higher altitudeplots, nor was there any difference in pH. The areas in AEZs 2,3,4)was covered by managed,content of calcium and sodium was higher on the rather than natural vegetation at the beginning ofnon-terraced plots, while only for manganese the study period. In order to test hypotheses onwas the content higher on the terraced plot. the impact of grazing on natural vegetation,Thus, according to this analysis, the construction therefore, study sites in the southern, recentlyof terraces had not had any impact on soil settled part of the district were chosen. Forfertility, at least as measured by soil nutrient these sites, baseline materials are available andstatus. management is known. On the basis of the
Data on yields of maize and beans were conclusions reached, an hypothesis ofcollected for these plots for three crop seasons vegetational change in the north of the districtbetween 1984/85 and 1987/88. This showed a was also investigated.significant increase in the yield of maize on the Two locations, Kathonzweni and Ngwataterraced as compared with the non-terraced plots in Makueni and Kibwezi Divisions, respectively,(1191 kgs per ha. compared to 780, an increase were selected. Both sites occur in AEZ 5, andof just over 50%). Also, reflecting an important support natural vegetation which isfactor in Machakos, there were 12 crop failures predominantly used for livestock production onout of 59 on non-terraced plots (20%) compared an extensive basis under free ranging conditionsto 5 on terraced plots. In the case of beans, (see maps 24259 and 24260). The two locationsthere was no significant difference, although the represent areas of recent human settlement - the
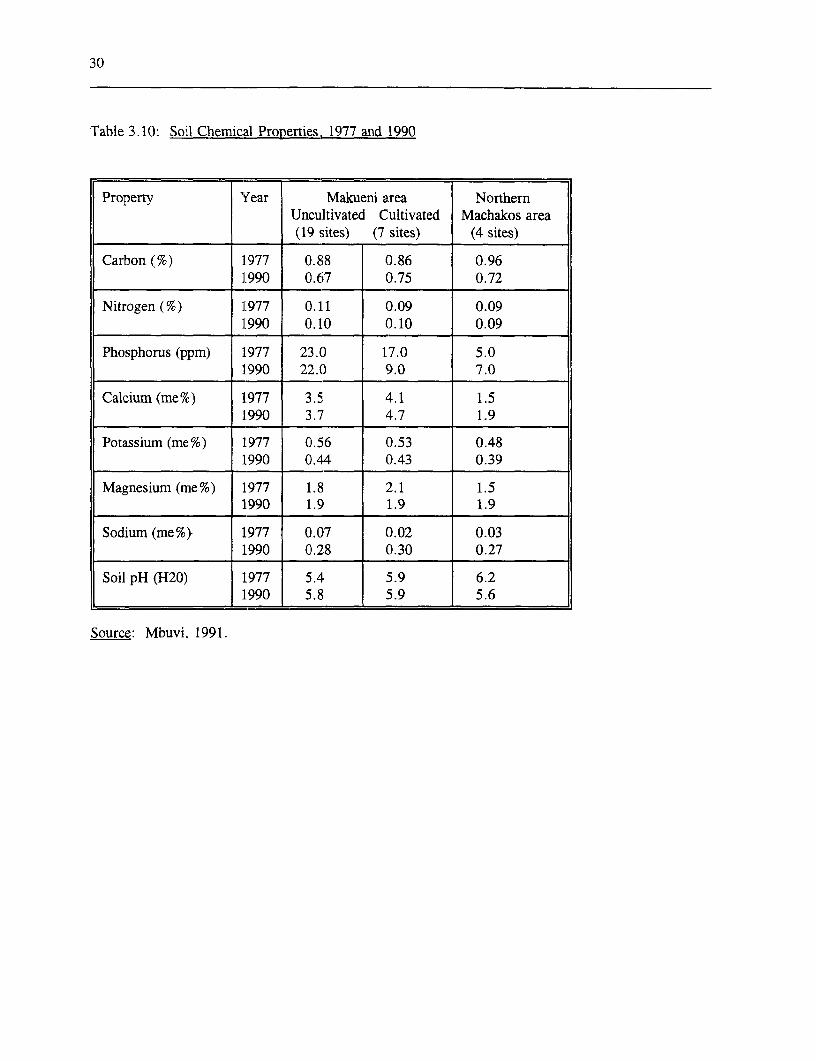
30
Table 3.10: Soil Chemical Properties, 1977 and 1990
Property Year Makueni area NorthernUncultivated Cultivated Machakos area
______ ___ _ (19 sites) (7 sites) (4 sites)
Carbon (%) 1977 0.88 0.86 0.961]990 0.67 0.75 0.72
Nitrogen (%) 1977 0.11 0.09 0.091.990 0.10 0.10 0.09
Phosphorus (ppm) 1.977 23.0 17.0 5.01990 22.0 9.0 7.0
Calcium (me%) 1977 3.5 4.1 1.51990 3.7 4.7 1.9
Potassium (me%) 1977 0.56 0.53 0.481990 0.44 0.43 0.39
Magnesium (me%) 1977 1.8 2.1 1.51990 1.9 1.9 1.9
Sodium (me%} 1977 0.07 0.02 0.031990 0.28 0.30 0.27
Soil pH (H20) 1977 5.4 5.9 6.21990 5.8 5.9 5.6
Source: Mbuvi, 1991.
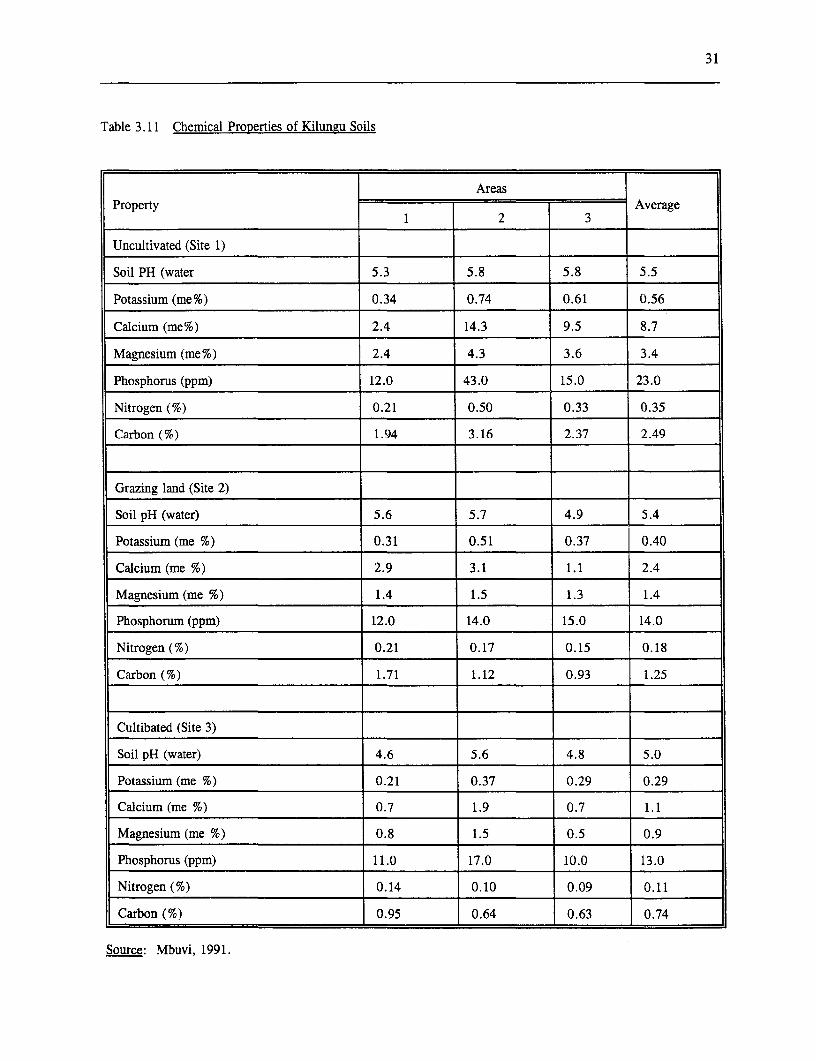
31
Table 3.11 Chemical Properties of Kilungu Soils
AreasProperty 3 Average
1 ~~~~2 3
Uncultivated (Site 1)
Soil PH (water 5.3 5.8 5.8 5.5
Potassium (me%) 0.34 0.74 0.61 0.56
Calcium (me%) 2.4 14.3 9.5 8.7
Magnesium (me%) 2.4 4.3 3.6 3.4
Phosphorus (ppm) 12.0 43.0 15.0 23.0
Nitrogen (%) 0.21 0.50 0.33 0.35
Carbon (%) 1.94 3.16 2.37 2.49
Grazing land (Site 2)
Soil pH (water) 5.6 5.7 4.9 5.4
Potassium (me %) 0.31 0.51 0.37 0.40
Calcium (me %) 2.9 3.1 1.1 2.4
Magnesium (me %) 1.4 1.5 1.3 1.4
Phosphorum (ppm) 12.0 14.0 15.0 14.0
Nitrogen(%) 0.21 0.17 0.15 0.18
Carbon (%) 1.71 1.12 0.93 1.25
Cultibated (Site 3)
Soil pH (water) 4.6 5.6 4.8 5.0
Potassium (me %) 0.21 0.37 0.29 0.29
Calcium (me %) 0.7 1.9 0.7 1.1
Magnesium (me %) 0.8 1.5 0.5 0.9
Phosphorus (ppm) 11.0 17.0 10.0 13.0
Nitrogen (%) 0.14 0.10 0.09 0.11
Carbon (%) 0.95 0.64 0.63 0.74
Source: Mbuvi, 1991.
32
1950s for Kathonzweni and the 1960s for hence killed. In the management of rangelands,Ngwata - and, therefore, can serve to bring out the prescribed burning is used for regulating thethe impact of human activities on vegetation relative proportions of woody and grass species.over tine. In post-independence Kenya, fire has been
A field inventory of the vegetation was proscribed. However, early vegetationundertaken in August/September 1990 (Farah, descriptions identified fire as one of the1991). In each sample plot, several vegetation determinants for maintaining some vegetationparameters were measured including species list, types, for example the Orchard type of Makuenipercent cover of each species by life form, and (Parsons, 1952; Trapnell 1958). It is, therefore,the density and heights of selected desirable probable that increased woodiness may bewoody species. Field analysis showed that the explained in part by lack of fire. InteraLction ofvegetation of Kathonzweni and Ngwata locations grazing pressure and fire control with anare physiognomically similar and can be episodic and fluctuating rainfall regime hasdescribed as dense wooded shrubland, although probably led to increased woodiness. Grazing-the percent cover of woody species is much induced land degradation, in the form of soilgreater in Ngwata. Conversely, the he:rb cover loss, a widely held belief among conservationistsis greater at Kathonzweni than at Ngwata. and development planners, is not supported by
There was a marked increase of the the results of this study. On the other hand,woody component of the vegetation in both vegetation degradation with respect to cattlelocations between 1960 and 1990 (Table 3.12). production has occurred in both study a:reas.In both, the vegetation has changed In the 1930s, when considerablephysiognomically from grassed shrubland to concerns over land degradation were recorded,dense wooded shrubland. It is significant to the intensity of use of these southern areas waspoint out that Ngwata's vegetation had become low. The emphasis was more in the north of thedense wooded shrubland by 1978, whereas district, and this is where Barnes took hisKathonzweni remained a grassed shrubland until photos. By that time, the clearance of woodlandafter 1978. In both Makueni and Kibwezi from the hillslopes (as in Mutituni, describedDivisions, the principal domestic livestock is above) had already created a fuelwood shortage.cattle, which are graziers rather than browsers. As the population increased and shifted
Lightly and heavily grazed portions of downslope, the remaining trees, never large orthe two study areas show a marked difference in abundant (according to Lindblom) would havevegetation structure and cornposition, suggesting come under exponential pressure. Thethat grazing by cattle plays an important role in photographs taken by Barnes in 1937, show thatstructuring the vegetation. In heavily utilized some natural regeneration of woody plantsareas, there was an increase in "increaser occurred nearly everywhere. But wherespecies", which further supports the inference individual plants can be discerned, they arethat cattle grazing is a. significant factor sparse, small, ill-formed and heavily cut.contributing to a change in vegetation structure The demarcation of private rights totowards woody species. It can thus be stated land, including the "kisese" or grazing land, wasthat with respect to cattle production, the encouraged by the administration from the 1930svegetation of both Kathonzweni and Ngwata is onwards, and the registration of individual titledegrading and grazing capacity is on the decline. was progressively extended to more and moreThese results are in agreement with established locations. The enclosure of kisese permitted itprinciples of range management and most to be managed as an integrated grazing,community ecology literature regarding the fuelwood, charcoal and beekeeping resource, asimpact of herbivores on plant cormmunity well as permitting produce to be harvested fromstructure. multipurpose trees (Gielen, 1982). Increasing
Fire is an ecological factor that tends woodiness of grazing lands in northernselectively to kill woody vegetation and promote Machakos is, therefore, likely to be due to bothgrass species, mainly because the perennating shrub regrowth under heavy cattle grazing andorgans of the former are above the ground and the managed regeneration of canopied trees.
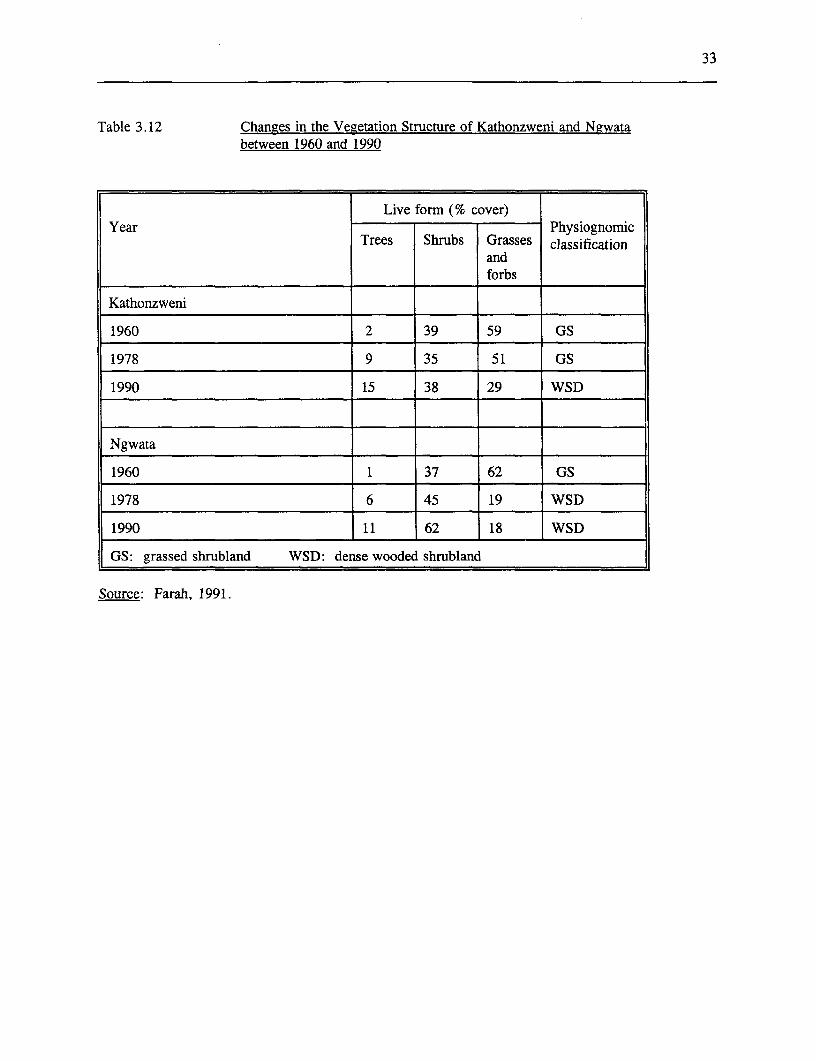
33
Table 3.12 Changes in the Vegetation Structure of Kathonzweni and Ngwatabetween 1960 and 1990
Live form (% cover)Year Physiognomic
Trees Shrubs Grasses classificationandforbs
Kathonzweni
1960 2 39 59 GS
1978 9 35 51 GS
1990 15 38 29 WSD
Ngwata
1960 1 37 62 GS
1978 6 45 19 WSD
1990 11 62 18 WSD
GS: grassed shrubland WSD: dense wooded shrubland
Source: Farah, 1991.
34
Evidence in support of this hypothesis is Inspection of the 1991 photographsprovided at sites on managed grazing land which indicates that this projection was wicle of thewere investigated by the study team in Masii mark. What has happened? There is littleLocation in August, 1990 (Farah, 1991). If evidence of the use of alternative, substitutethese sites are representative (and they appear to fuels. Nor is there evidence of importation ofbe), it can be concluded that grazing areas in woodfuels from elsewhere. There are 14,000 hanorthern Machakos district are coming under of gazetted forest reserve, but planting has onlyincreasingly conservationary management. They twice exceeded 500 ha per year. Other possibleare important as fuel resources (Hayes, 1986). explanations are that the estimated rates ofIn this case, increasing woodiness is not an consumption used in the projections were toounwanted byproduct of cattle grazing but the high, or the estimates of the mean annualresult of protecting trees. increment may be too low. However, it is clear
that other sources, particularly farmland, areTrees and Woodfuel more important than implied by the earlier
estimates. Farmers have been growing trees toTrees have been strongly associated with a significant degree (or perhaps managing is aperceptions of environmental problems in semi- better description).arid areas. The lack of trees in the photographs The previous section indicated that ataken by Barnes is particularly noticeable, as is factor in the increasing content of woody speciesthe fact that far more trees are seen in the 1991 in the range was conscious selection by farmers.views of the same landscapes. Heavy emphasis The same thing has happened in cultivated land.has been placed on the problems associated with Surveys in the mid eighties (Ecosystemrs, 1986)the reduction in the supply of fuel wood and indicated that hedgrows alone covered about 6%subsequent destruction of trees in areas such as of the cultivated area. In addition, many treesMachakos. However, despite a more than are grown. A survey of 56 households infivefold increase in population there is now no Mbiuni location (Gielen, 1982) showed that 50%evidence of major inflows of fuelwoocl or of a of the households had both fruit and indigenouscrisis. trees on their land, and that only 6, of the
However, there has been concern over households grew no trees. In another study inthe fuelwood problem in the district for most of Masii, Hayes (1986) found that 93% ofthe period under review (Mortimore, 1992). households planted trees. Gielen's data showThe first estimate found by the study, that by (See Table 3.13) that the overall density of treesLogan in 1948, was reasonably sanguine. It is high, even if bananas are excluded. [Thisestimated that plantations of 2,000 ha would be actually understates the number of t:rees asrequired by 1958 to meet the expected demand hedgerows and other exotics were excluded.]at that time. This meant an additional 800 ha by One particularly noticeable feature of 'Gielen's1980. A more detailed estimate was prepared in sample is the declining density from 59 trees/ha1977 by Mung'ala and Openshaw. This on the smallest holdings to 21/ha on the largest.concluded that consumption in 1977 was, already This does not support hypotheses that the land-running at four times the rate of natural growth poor cannot invest in trees; but rather is anand that if "estimates of consumption and indication of general investment in intensificationgrowing stock are anything near correct, the of the farming system, even in the smallesttrees will be depleted by 1986; even if volume holdings.estimates were doubled or tripled, the stock Mortimore summarizes the findings ofwould be exhausted by 1991 or 2005, several studies and shows that woodfuel use isrespectively. Thus, an acute shortage of gender specific, with firewood collecting andwoodfuel is imminent" (pll7). This was consumption in the hands of women andaccompanied by an estimate that 226,000 ha of charcoal production and marketing being largelyplantations would be required by 2000 to meet the responsibility of the men. Women'sthe demand. fuelwood collection sites are reported to include:
the household's cultivated land (hedgerows,
35
trimming or pollarding of farm trees); grazing of the period under review, while at the sameland; roadsides, pathways and river banks; other time the production and range of cash croppingcommon access woodland; government forests, has expanded substantially, despite a relativeif within reach; and the lands of other shift of activity into areas less well suited forhouseholds, by consent of the owners or, if crop production. While there has beenabsent, their wives. The overall evidence continuing soil erosion, all the evidence suggestssuggests that sustainable production of fuelwood that, as a result of the efforts of the farmers, thishas been attained as an outcome of continuing has been markedly reduced and appears to be onintensification of the farming system, which has a continuing downward trend.included the planting and management of trees. There has been a shift in range
What has happened has been well vegetation towards woody species, usually a signsummarized by Shepherd, "What has gone on is of heavy grazing pressure and a change whicha process of improvement upon what nature gave reduces the productivity of the range as ain the first place. A tract of bush is turned into grazing resource. However, there is littlea farm with trees on it, through careful evidence that irreversible, grazing induced,processes of selection and enrichment. While "degradation" of the resource has occurred butthe diversity of good hardwood species is rather, that the reduction of the impact of firegradually lost, the gain in fruit trees, in and managed regeneration of trees have beenappropriately placed trees of all kinds and in significant factors in the shift towards woodyspecies which are really wanted, is enormous" species. Meanwhile, in the face of this change,(Shepherd, 1989, p27). Taken somewhat more livestock "output" has increased. There is alsobroadly, this encapsulates the whole process of evidence of a decline in the chemical "fertility"resource management and improvement in this of the soil under cultivation, and an indicationdistrict which was considered to be in such a that the use of terraces has not had a significantparlous condition less than a lifetime ago. impact on this factor. However, yields have
been shown to be higher on terraced land, andConclusions overall productivity has increased. In short, any
deleterious effects of changes in the nature of theThere is, therefore, a degree of ambiguity in the land resource base have been more than offsetresults of this survey. The agricultural output of by improvements in the resource base due tothe district has risen substantially despite rapid terracing etc., and the farmers have learned howpopulation growth and a shift to non-agricultural to manage the resource better. The next chapteractivity. The production of basic staples appears discusses the nature of the major innovationsto be higher in relation to needs than at the start which were adopted and the factors which led to
these changes.
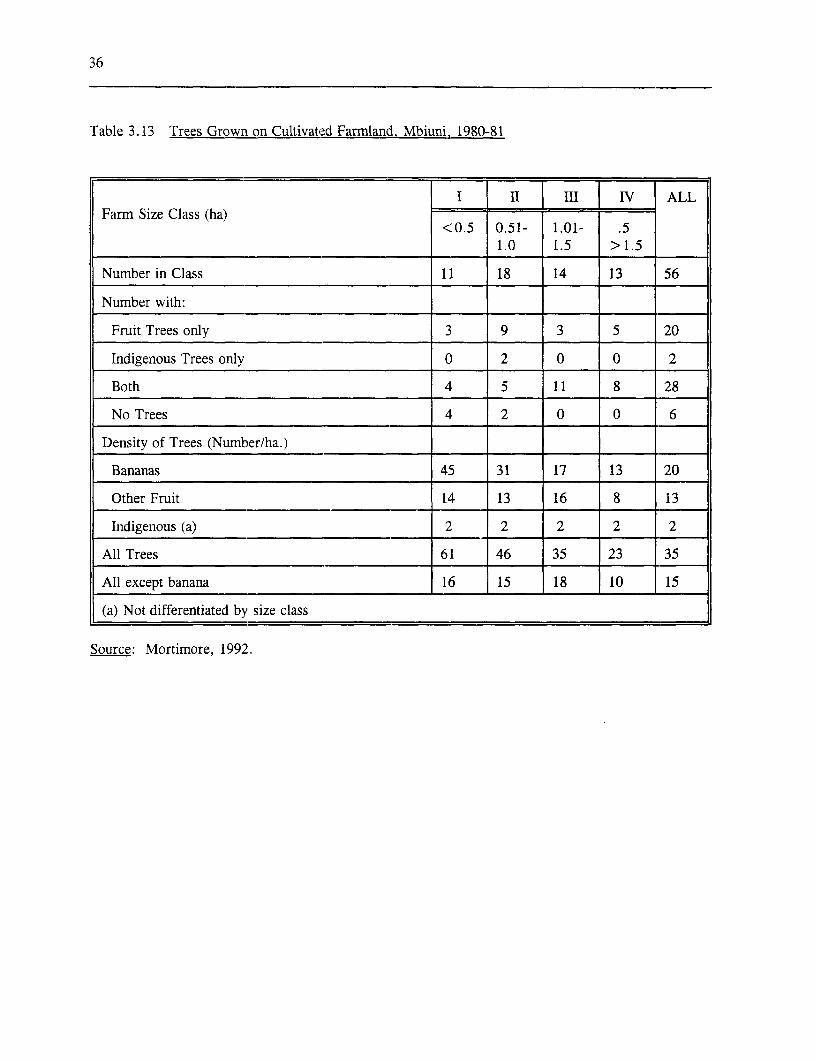
36
Table 3.13 Trees Grown on Cultivated Farmland, Mbiuni, 1980-81
lI II | III IV ALLFarm Size Class (ha)
<0.5 0.51- 1.01- .51.0 1.5 > 1.5
Number in Class 11 18 14 13 56
Number with:
Fruit Trees only 3 9 3 5 20
Indigenous Trees only 0 2 0 0 2
Both 4 5 11 8 28
No Trees 4 2 0 0 6
Density of Trees (Number/ha.) .-
Bananas 45 31 17 13 20
Other Fruit 14 13 16 8 13
Indigenous (a) 2 2 2 2 2
All Trees 61 46 35 23 35
All except banana 16 15 18 10 15
(a) Not differentiated by size class
Source: Mortimore, 1992.
37
4. Agricultural Intensification and Technological Change
The massive increase in population which has Those who thought that life had got worsebeen accommodated in the district and the complained of having to work harder, havingrelated increase in agricultural production have smaller farms and inflation. As one woman saidnot been achieved on the basis of a simple "My father could sing and dance, but I have nocontinuation of the farming systems in place at time." The impression this small and non-the beginning of the period under study. In fact random sample gives of improvements for thesubstantial changes in these systems have majority in standard of life since the 1940-1960occurred in order to accommodate significant period, though at the cost of harder work, isintensification. This chapter will review these confirmed by some statistical indicators. Bychanges and some of the major technological 1981-82 the Machakos farmer was in the middlechanges which underpinned them. of the income range for Kenya (Ksh 864 per
However, before discussing the nature of month compared with Ksh 829 nationally),the agricultural change which has occurred we whereas in the 1940s and early 50s the Districtshould consider whether this change has been at was seen as a problem area, needing faminethe expense of the well-being of the population relief in most years. By the first half of thein the area, in the sense that it has lagged behind 1980s the assets of the people were above theother regions of Kenya. A historical study of national average in terms of improved housingdevelopment such as this is dependent upon and benefit from education (see table 4.1). Theavailable analyses from earlier periods and their main deficiencies they suffer are in publiclyparticular limitations and analytic premises. provided physical infrastructure, lack ofFarm incomes in an area of erratic rainfall may transport facilities and difficulties with water. Abe strikingly different from one year to the next. second, very relevant in this case, indicator ofHowever, relatively few farm income surveys welfare is nutrition. The nutrition studies ofgive adequate information on the timing and 1974-81, despite the droughts of the period,quantity of rainfall at the period of the survey, found the habitual diet of good quality, butnor do they usually inquire whether farmers somewhat low in quantity, compared with thethought yields were above or below average. recommended intakes. Amongst pre-schoolQuite apart from the difficulty of assessing children severe malnutrition was rare. The CBSwhether the reported farm income was study in 1983 found district children to besomething near the average, reported incomes average for Kenya in terms of height for age andcannot easily be compared over a period of time weight for height. As a result, it thereforebecause of the changes in prices and differences appears safe to conclude that the increasedin the methodologies of the surveys. It follows population has not been accommodated in thethat it is also difficult to relate information on district at the expense of the basic wellbeing ofeither farm or total rural incomes to a standard that population, in either relative or absoluteof welfare that measures poverty, or which terms. It is important to note that in 1981-2enables comparison with other parts of Kenya. only 50% of rural income derived from farming.
As for changes over time, two thirds of Most families endeavor to have at least onethe community leaders and farmers interviewed person in a non-farm job to provide an elementby the study team thought themselves better off of stability while farm incomes may vary withthan their fathers and one third worse off. rainfall.
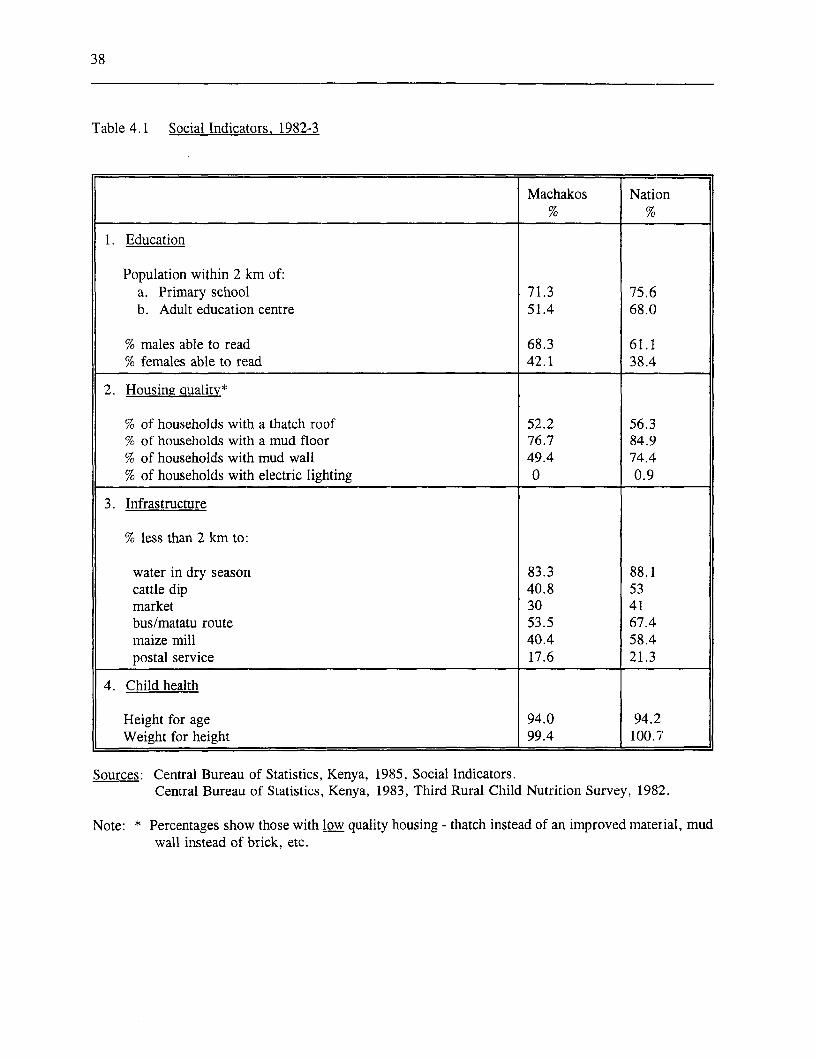
38
Table 4.1 Social Indicators, 1982-3
Machakos Nation
1. Education
Population within 2 km of:a. Primary school 71.3 75.6b. Adult education centre 51.4 68.0
% males able to read 68.3 61.1% females able to read 42.1 38.4
2. Housing qualitv*
% of households with a thatch roof 52.2 56.3% of households with a mud floor 76.7 84.9% of households with mud wall 49.4 74.4% of households with electric lighting 0 0.9
3. Infrastructure
% less than 2 km to;
water in dry season 83.3 88.1cattle dip 40.8 53market 30 41bus/matatu route 53.5 67.4maize mill 40.4 58.4postal service 17.6 21.3
4. Child health
Height for age 94.0 94.2Weight for height 99.4 100.7
Sources: Central Bureau of Statistics, Kenya, 1985, Social Indicators.Central Bureau of Statistics, Kenya, 1983, Third Rural Child Nutrition Survey, 1982.
Note: * Percentages show those with low quality housing - thatch instead of an improved material, mudwall instead of brick, etc.
39
Agricultural System Change problem.However, since that time the range of
One handicap in reviewing the changes in farming activities has increased dramatically.agricultural systems in Machakos District is that Table 4.2 shows the chief farm cash incomethere are no farming system studies from before sources in 1945, 1960 and 1990 by sub-region,1962 and few after 1981. Farming systems in as reported by village leaders. It shows anthe district have undergone considerable interesting gradient, in which livestock initiallymodification since 1980 because, by that time, formed the chief cash source. This is followedthere was no more new land to settle. As a by the sale of food crops and then by cashresult, average farm size has decreased more crops, particularly high value crops such asrapidly than in the previous two decades.For the coffee (where feasible), fruits and vegetables.situation before 1960 and since 1982 the study Strongly promoted field crops for semi-aridhas been dependent upon the interviews with areas, such as sunflower and cotton, come out asvillage leaders and with a quick non-random relatively unimportant. The gradient flows fromsample of farmers in the five study areas chosen the old settled areas with high populationas representative of the district. The village densities (Kangundo, Mbooni, Masii) to the arealevel interviews authenticated much of what had settled in the 1950s (Makueni) and the areasbeen found in the literature and give a reliable, settled from the late 1960s (Ngwata). Thereif broad, picture of farming in the district to the also appears to be a second gradient, by whichpresent. the fruits and vegetables appear first in the
The farming system in the 1930s in all higher potential areas well served by marketsthe settled areas of the district was based on (Kangundo), spread to high potential areas lesssubsistence foods and livestock. Typically a well served by markets (Mbooni) and then tosmall area for cultivation of crops was combined lower potential zones, starting again in thosewith extensive livestock raising. However, the best served by markets (Masii) and passing on tolivestock system was in crisis by the 1930s as a less well served areas (Makueni) as populationresult of population growth. In the first three density increases. This of course will not bedecades of the century, the Akamba were surprising to many readers, as it is entirelyprevented from using grazing land which they consistent with standard regional economicshad previously used occasionally, because it was predictions.taken over for white ranches, or was deemedCrown Land, on whose use the Government Farming Systems in AEZ 4could impose restrictions. In the 1930s there issome evidence of extension of the cultivated As has been noted, conditions vary widelyarea in the reserve, which would have reduced across the district, both in terms of the physicalthe nearby grazing areas. The main technical conditions for agricultural production, andinnovation of the period was the plough, which economically, in terms of accessibility toenabled some farmers to increase arable markets. Agro-ecological Zone 4 representscultivation. conditions which are at neither extreme of those
In the 1940s, because of a series of existing in the district and will be used as ansevere droughts, famine relief was required in example of the ways in which farmers have1943, 1944, 1945, 1946, and 1949 (Owako, adapted to the changing circumstances (see map1969). Partly as a result of these crop failures, 24260). The greatest change occurred in AEZa large proportion of the male labor force was 2 and 3 areas, especially those nearest to theabsent from the district, working elsewhere or market, where the food and livestock system hasserving in the military. While eventually this been replaced by a major emphasis on growingprobably brought in a flow of capital (gratuities coffee and vegetables for the market, whilstetc.) after World War II, the immediate result retaining some food crops. In the most denselywas a further reduction in the capacity of the populated of these areas livestock have beenlocal farm households to expand agricultural almost crowded out. In the less denselyproduction, exacerbating the food supply populated areas a 'grade cow' is maintained to
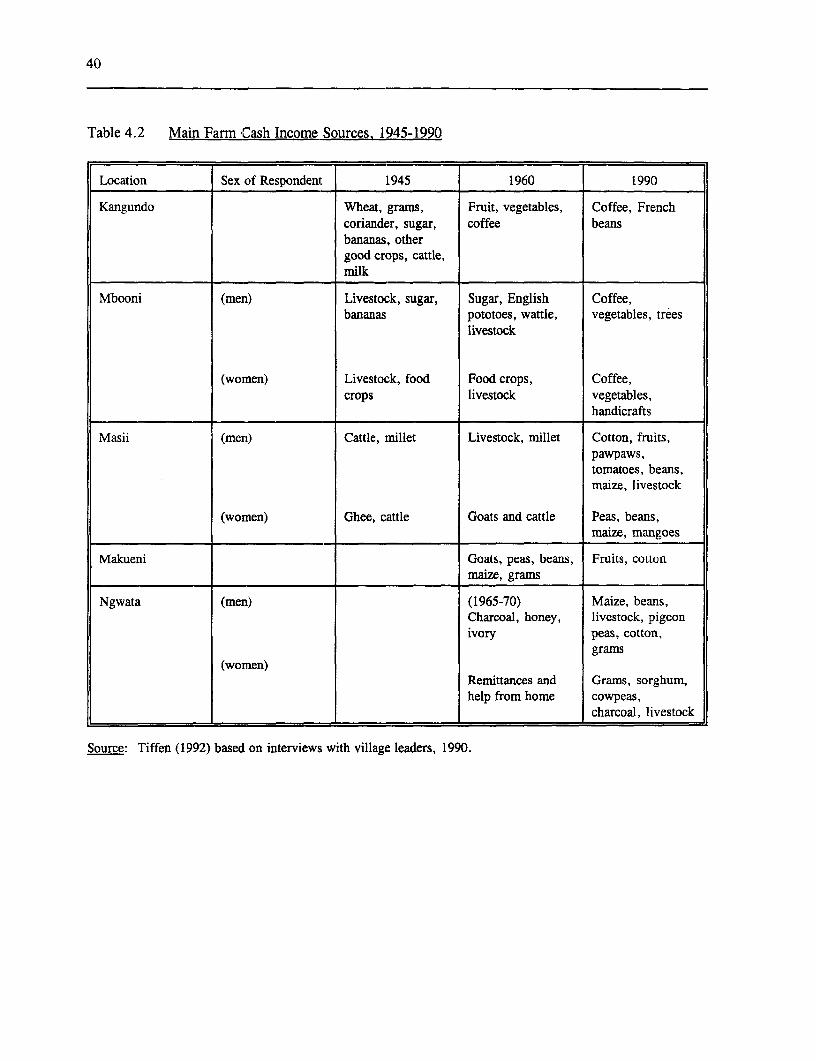
40
Table 4.2 Main Farm Cash Income Sources, 1945-1990
Location Sex of Respondent 1945 1960 1990
Kangundo Wheat, grams, Fruit, vegetables, Coffee, Frenchcoriander, sugar, coffee beansbananas, othergood crops, cattle,milk
Mbooni (men) Livestock, sugar, Sugar, English Coffee,bananas pototoes, wattle, vegetables, trees
livestock
(women) Livestock, food Food crops, Coffee,crops livestock vegetables,
handicrafts
Masii (men) Cattle, millet Livestock, millet Cotton, fruits,pawpaws,tomatoes, beans,maize, livestock
(women) Ghee, cattle Goats and cattle Peas, beans,maize, mangoes
Makueni Goats, peas, beans, Fruits, cottonmaize, grams
Ngwata (men) (1965-70) Maize, beans,Charcoal, honey, livestock, pigeonivory peas, cotton,
grams(women)
Remittances and Grams, sorghum,help from home cowpeas,
charcoal, livestock
Source: Tiffen (1992) based on interviews with village leaders, 1990.
41
produce milk for the family and manure for the show that better use was made of the long rainsfarm. Commercial crops generate a compared to the 1960s. Lynam thought that theconsiderable amount of local, non-farm jobs, important benefit of Katumani maize varietiesand there is now considerable variety in the local was that they enabled farmers to double crop.economy. Rather, it appears that Katumani was one of the
However, we concentrate on the larger, elements that enable farmers to get an earliermore typical AEZ 4 areas to illustrate change. start in the second season and plant more, onData drawn from a series of studies largely time. Farmers interviewed by the study teamcarried out in the late 70s and early 80s are ascribe their improved results at present bysummarized in table 4.3, and compared with a saying that they "are now better organized."1964 survey and, in one case, with some 1940 Improved crop husbandry, compared to the middata. This shows a clear reduction in the 60s, is indicated by a number of changes:average farm size. More of this smaller farm (a) The traditional broadcasting methodwas cropped and, by 1980, there was virtually has been replaced by row planting,no communal grazing. Nevertheless, the which requires more labor but is alsoaverage farm appears to have supported more more productive. Mixed croppinglivestock in the 80s than in the mid 60s. This continues, but it now takes the form ofmeans that methods of livestock feeding had intercropping, alternating rows ofbecome more productive, for all the evidence is different crops. Row planting has alsothat there was no great deterioration of grazing led to an increase in the percentage oflands between 1960 and 1980 (see paras 3.44- maize and beans which are sole cropped.51). Maize, beans, cowpeas and pigeon peas (b) The increase in row planting hasremained the main food crops, occupying 75- enabled an increase in weeding using85% of the cropped area in 1979. There was a animal traction and ploughs, which haslarger area under cash crops such as cotton, reduced one of the major earlier laborcompared with 1964, but crop farming remained bottlenecks. This has a double benefit,primarily food crop oriented. From about 1980 through more timely control of weedscommercial fruit production entered the systems. and, through ridging up, leading to
More important than the relatively small better utilization of rainfall, especiallychanges in the crops grown were changes in when rows are planted along themethods of husbandry, which led to better use of contour.available rainfall and more stability in yields. (c) More use is being made of quickerVillage leaders commented that the effects of maturing varieties, based largely on thebad seasons were worse in the 1960s and before, locally developed Katumani varieties.when they were taking cropping less seriously This makes it easier to get a timely startand livestock were more important in the income in the second season.system. The women said that the improvement (d) Early planting and dry planting arewas because they "now plant enough." Before more frequently practiced.they had experienced famine, but now there was (e) An increase in the use of manure.better knowledge of ploughing and other Most farmers are well aware of thecropping techniques. The difference with 1960 importance of manure for maintainingis that now both seasons are fully utilized. fertility, and most feel that they cannotThere is also probably a higher average yield, get enough.particularly in the long rains. In consequence of (f) Almost universal use of terracing.the higher yields, unless rains are very bad, Significant changes have also been mademany farmers are able to sell some of their in the livestock production systems. Theproduction in both seasons. Therefore, crops complete integration of livestock and cropare, in their mind, now the more important part farming was confirmed by the interviews withof their farming system, despite the increase in village leaders who said that the importance ofthe average livestock herd. cattle was now for ploughing, manure, cash,
Yield data from surveys in the late 1970s food security and milk. The method of keeping
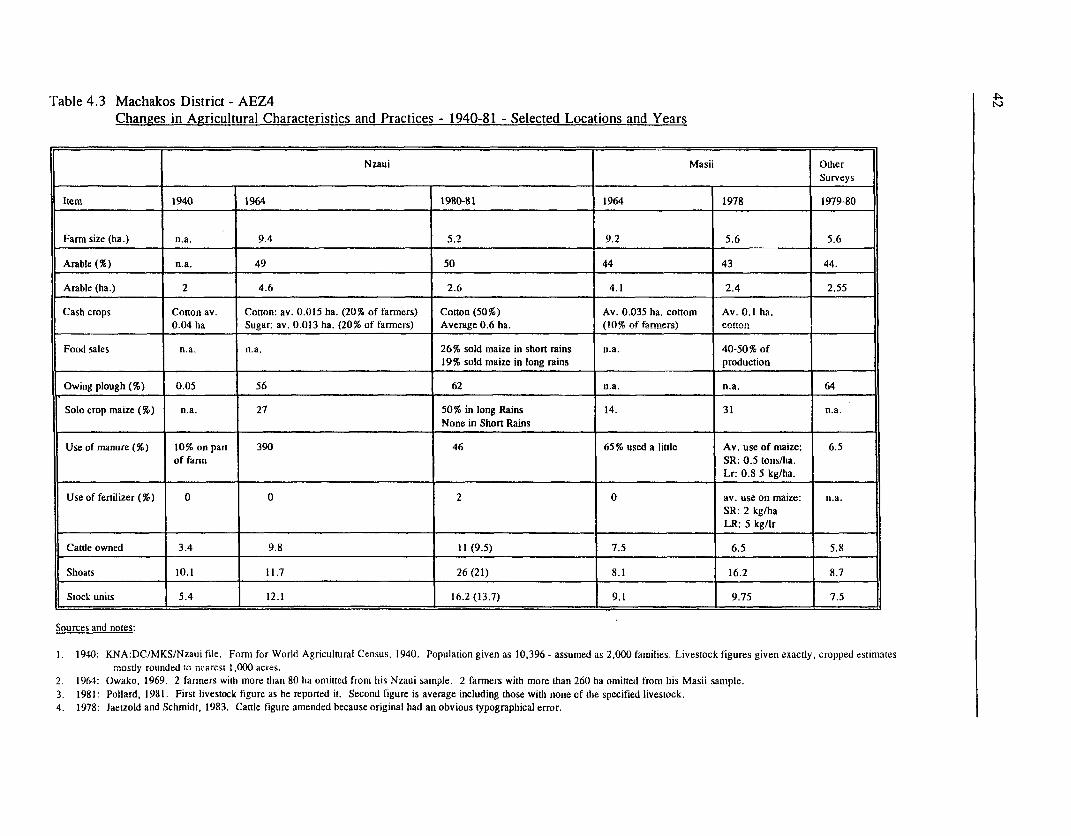
Table 4.3 Machakos District - AEZ4Changes in Agricultural Characteristics and Practices - 1940-81 - Selected Locations and Years
Nzaui Masii OtherSurveys
Item 1940 1964 1980-81 1964 1978 1979-80
Fami size (ha.) n.a. 9.4 5.2 9.2 5.6 5.6
Arable t%) n.a. 49 50 44 43 44.
Arable (ha.) 2 4.6 2.6 4.1 2.4 2.55
Cash crops Cotton av. Cotton: av. 0.015 ha. (20% of farmers) Cotton (50%) Av. 0.035 ha. cottom Av. 0.1 ha.0.04 ha Sugar: av. 0.013 ha. (20% of farmers) Average 0.6 ha. (10% of farmners) cotton
Food sales n.a. n.a. 26% sold maize in short rains n.a. 40-50% of19% sold maize in long rains production
Owing plough (%) 0.05 56 62 n.a. n.a. 64
Solo crop maize (%) n.a. 27 50% in long Rains 14. 31 n.a.None in Short Rains
Use of manure (Y) 10% on part 390 46 65% used a little Av. use of maize: 6.5of farm SR: 0.5 tons/ha.l _________________ ____________ __________________________________ ____________________ L r: 0 .8 5 kg/ha.
Use of fertilizer (%) 0 0 2 0 av. use on maize: n.a.SR: 2 kg/haLR: 5 kg/Ilr _
Catle owned 3.4 9.8 11 (9.5) 7.5 6.5 5.8
Shoats 10.1 11.7 26 (21) 8.1 16.2 8.7
Szock units 5.4 12.1 16.2 (13.7) 9.1 9.75 7.5
Sources and notes:
I. 1940: KNA:DC/MKS/Nzaui file. Foni for World Agricultural Census, 1940. Population given as 10,396 - assumed as 2,000 families. Livestock figures given exactly, cropped estimatesmosdly rounded to n 1ares;0 acres.2. 1964: Owako, 1969. 2 fanmers wilh more than 80 ha omilted from his Nzaui sample. 2 fanmers with more than 260 ha omitted from hiis Masii sample.3. 1981: Pollard, 1981. First livestock figure as he reported it. Second figure is average including those with none of the specified livestock.4. 1978: Jaezold and Schmidt, 1983. Cattle figure amended because original had an obvious typographical error.
43
cattle has become much more intensive. The farming systems of the district. Perhaps theloss of grazing on common areas, either local or most significant of these many innovations inmore distant, has been compensated for by an production technologies, have been terracing,increased use of crop residues. Cattle are now short duration maizes, the plough, and improvedconfined to permanent grazing land belonging to animal feed.the farm. These fields are generally small andare often grazed only in the wet seasons. In the Terracingdry season, if grazing areas show signs ofdeterioration, livestock are confined and fed on The most immediately visible agriculturalcrop residues. The grazing fields are managed innovation in Machakos District, particularly inwith three purposes in mind: to produce an the more highly populated, hilly areas, isincome from charcoal and building timber; fuel terracing. As indicated in Chapter 3, essentiallyfor domestic use; and grazing for animals. Men all the land in the high and medium potentialand women both said that there are more trees in areas is now terraced. Soil and waterthe area now because they are on private land, conservation measures, of which terracing isare perceived as having value, and people take only one, have been the subject of a series ofcare of them. official programs to foster technological change
which have been pursued periodically in theTechnologies district since the late 1930s (see Gichuki, 1991).
The initial reports of Barnes and Maher
The farming system changes discussed above led on the condition of the soil resources of theto a shift from what was a system based upon district stressed the need for measures to controllimited cropping and extensive livestock runoff and thereby reduce erosion. Two basicproduction to relatively intensive, mixed farming types of terraces have been used in the district;based on integrated crop and livestock narrow based terraces (fanya chini) mainly usedproduction. Change of this nature requires, as to remove or contain water, and bench terracesa minimum, the availability of appropriate (fanya juu) which reduce the land slope (for atechnologies, the resources and "know-how" to discussion of these terrace types see Gichuki ppadopt them, and the ability of the society to 19-25). Narrow based terraces were introducedadapt to the changing circumstances it confronts into Kenya following Maher's visit to the Unitedwithout falling apart. The balance of this States in 1940. He recommended the use ofchapter will review a few of the major shallow, narrow based terraces in what weretechnologies which underpinned the agricultural then "the African Reserves" due to the shortagechange discussed above, draw lessons from the of tools, the high labor requirements of the otherdifferent ways in which they were introduced, types of terraces, and because the principaland review a number of factors which have been problem was seen as control of runoff.related to the intensification of agricultural Substantial programs were initiated to constructproduction which has occurred. The following these terraces in areas considered to be at risk.chapter will then review the social changes in The programs were usually implemented on athe district which have facilitated the changes in watershed basis, using compulsory communalagriculture and land resource management. labor, which was unpopular. A mechanized unit
The literature on Machakos District was established in 1952 which helped expand thedocuments a wealth of production technologies program. The length of terraces constructed inwhich have, in one way or another, contributed Machakos district increased from 587 miles into the observable changes in production systems. 1945 to 1,995 in 1947 (Throup 1987), protectingAn inventory of these technologies is contained in the latter year over 4,000 ha., and to aboutin Table 4.4 (Mortimore and Wellard, 1991). 35,000 in 1957.Several of these have been discussed at some Partly because of the methods used tolength by Mortimore and Wellard, who show the construct them, maintenance by farmers of theimportance of these innovations, in the terraces constructed was often inadequate.aggregate, in increasing the flexibility of the There was also a continuing controversy over
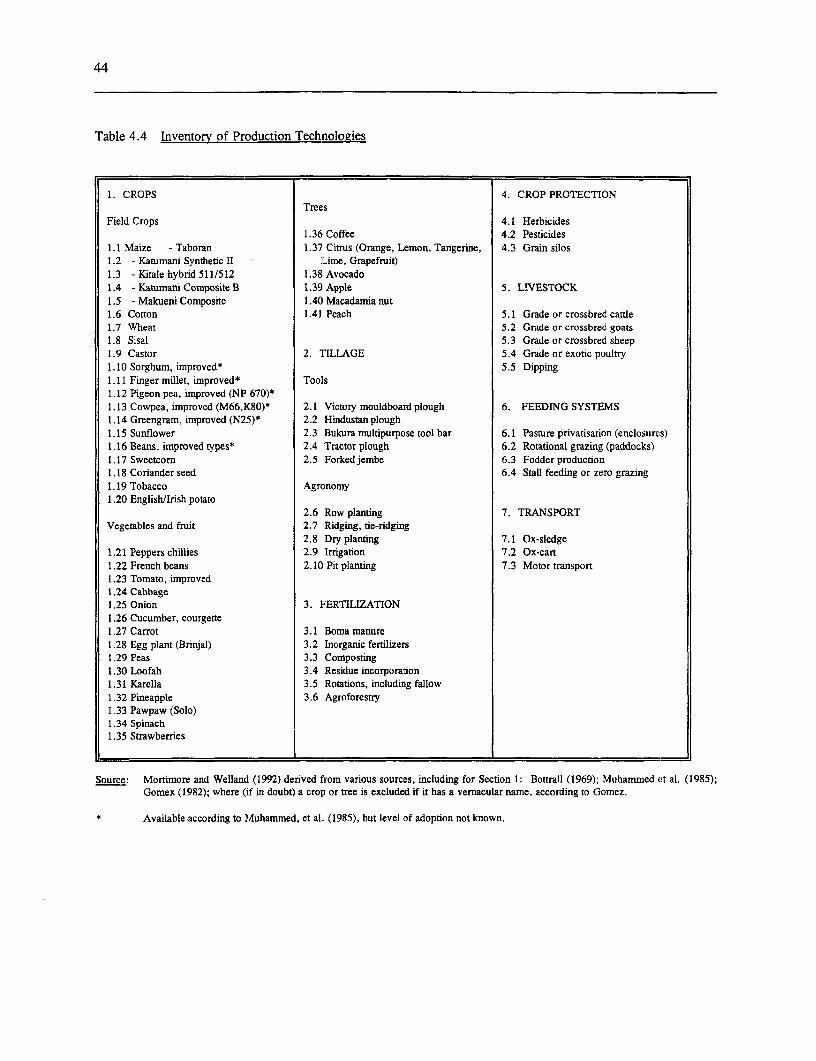
44
Table 4.4 Inventory of Production Technologies
1. CROPS 4. CROP PROTECTIONTrees
Field Crops 4.1 Herbicides1.36 Coffee 4.2 Pesticides
1.1 Maize - Taboran 1.37 Citrus (Orange, Lemon, Tangerine, 4.3 Grain silos1.2 - Karumani Synthetic II Lime, Grapefruit)1.3 -Kitale hybrid 511/512 1.38 Avocado1.4 - Katumani Composite B 1.39 Apple 5. LIVESTOCK1.5 - Makueni Composite 1.40 Macadamia nut1.6 Cotton 1.41 Peach 5.1 Grade or crossbred cattle1.7 Wheat 5.2 Grade or crossbred goats1.8 Sisal 5.3 Grade or crossbred sheep1.9 Castor 2. TILLAGE 5.4 Grade or exotic poultry1.10 Sorghum, improved* 5.5 Dipping1I.11 Finger millet, improved* Tools1.12 Pigeon pea, improved (NP 670)*1.13 Cowpea, improved (M66,K80)* 2.1 Victory mouldboard plough 6. FEEDING SYSTEMS1.14 Greengram, improved (N25)* 2.2 Hindustan plough1.15 Sunflower 2.3 Bukura multipurpose tool bar 6.1 Pasture privatisation (enclosures)1.16 Beans, improved types* 2.4 Tractor plough 6.2 Rotational grazing (paddocks)1.17 Sweetcorn 2.5 Forked jembe 6.3 Fodder production1.18 Coriander seed 6.4 Stall feeding or zero grazing1.19 Tobacco Agronomy1.20 English/lrish potato
2.6 Row planting 7. TRANSPORTVegetables and fruit 2.7 Ridging, tie-ridging
2.8 Dry planting 7.1 Ox-sledge1.21 Peppers chillies 2.9 Irrigation 7.2 Ox-cart1.22 French beans 2.10 Pit planting 7.3 Motor transport1.23 Tomato, improved1.24 Cabbage1.25 Onion 3. FERTILIZATION1.26 Cucumber, courgette1.27 Carrot 3.1 Boma manure1.28 Egg plant (Brinjal) 3.2 Inorganic fertilizers1.29 Peas 3.3 Composting1.30 Loofah 3.4 Residue incorporation1.31 Karella 3.5 Rotations, including fallow1.32 Pineapple 3.6 Agroforestry1.33 Pawpaw (Solo)1.34 Spinach1.35 Strawberries
Source: Mortimore and Welland (1992) derived fiom various sources, including for Section 1: Bottrall (1969); Muhammed et al. (1985);Gomex (1982); where (if in doubt) a crop or tree is excluded if it has a vernacular name, according to Gomez.
* Available according to Muhammed, et al. (1985), but level of adoption not known.
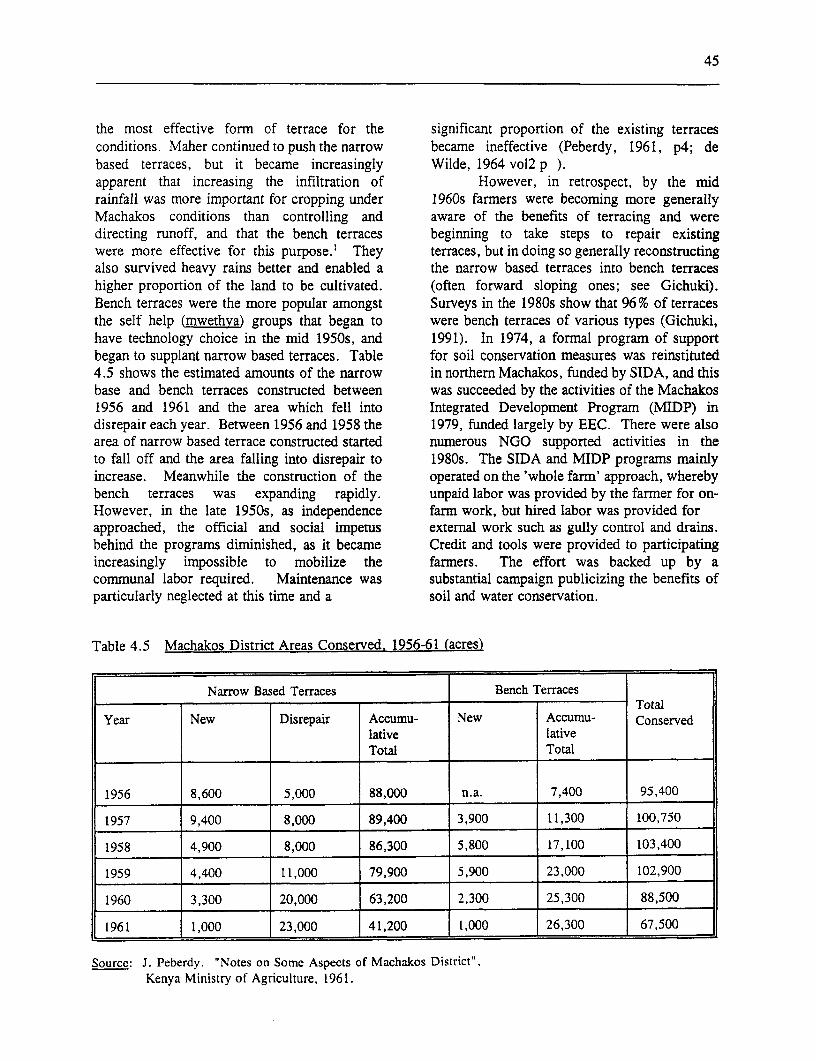
45
the most effective form of terrace for the significant proportion of the existing terracesconditions. Maher continued to push the narrow became ineffective (Peberdy, 1961, p4; debased terraces, but it became increasingly Wilde, 1964 vol2 p ).apparent that increasing the infiltration of However, in retrospect, by the midrainfall was more important for cropping under 1960s farmers were becoming more generallyMachakos conditions than controlling and aware of the benefits of terracing and weredirecting runoff, and that the bench terraces beginning to take steps to repair existingwere more effective for this purpose.' They terraces, but in doing so generally reconstructingalso survived heavy rains better and enabled a the narrow based terraces into bench terraceshigher proportion of the land to be cultivated. (often forward sloping ones; see Gichuki).Bench terraces were the more popular amongst Surveys in the 1980s show that 96% of terracesthe self help (mwethva) groups that began to were bench terraces of various types (Gichuki,have technology choice in the mid 1950s, and 1991). In 1974, a formal program of supportbegan to supplant narrow based terraces. Table for soil conservation measures was reinstituted4.5 shows the estimated amounts of the narrow in northern Machakos, funded by SIDA, and thisbase and bench terraces constructed between was succeeded by the activities of the Machakos1956 and 1961 and the area which fell into Integrated Development Program (MIDP) indisrepair each year. Between 1956 and 1958 the 1979, funded largely by EEC. There were alsoarea of narrow based terrace constructed started numerous NGO supported activities in theto fall off and the area falling into disrepair to 1980s. The SIDA and MIDP programs mainlyincrease. Meanwhile the construction of the operated on the 'whole farm' approach, wherebybench terraces was expanding rapidly. unpaid labor was provided by the farmer for on-However, in the late 1950s, as independence farm work, but hired labor was provided forapproached, the official and social impetus external work such as gully control and drains.behind the programs diminished, as it became Credit and tools were provided to participatingincreasingly impossible to mobilize the farmers. The effort was backed up by acommunal labor required. Maintenance was substantial campaign publicizing the benefits ofparticularly neglected at this time and a soil and water conservation.
Table 4.5 Machakos District Areas Conserved. 1956-61 (acres)
Narrow Based Terraces Bench TerracesTotal
Year New Disrepair Accumu- New Accumu- Conservedlative lativeTotal Total
1956 8,600 5,000 88,000 n.a. 7,400 95,400
1957 9,400 8,000 89,400 3,900 11,300 100,750
1958 4,900 8,000 86,300 5,800 17,100 103,400
1959 4,400 11,000 79,900 5,900 23,000 102,900
1960 3,300 20,000 63,200 2,300 25,300 88,500
1961 1,000 23,000 41,200 1,000 26,300 67,500
Source: J. Peberdy. "Notes on Somc Aspects of Machakos District",Kenya Ministry of Agriculture, 1961.
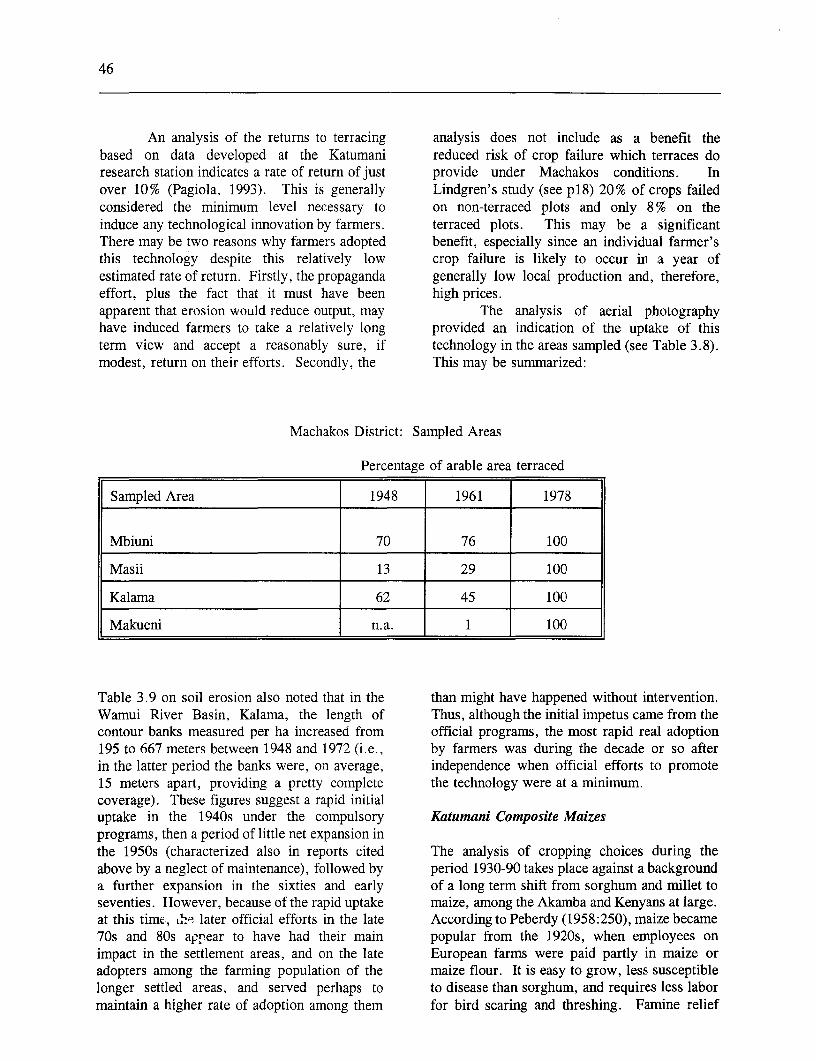
46
An analysis of the returns to terracing analysis does not include as a benefit thebased on data developed at the Katumani reduced risk of crop failure which terraces doresearch station indicates a rate of return of just provide under Machakos conditions. Inover 10% (Pagiola, 1993). This is generally Lindgren's study (see p18) 20% of crops failedconsidered the minimum level necessary to on non-terraced plots and only 8% on theinduce any technological innovation by farmers. terraced plots. This may be a significantThere may be two reasons why farmers adopted benefit, especially since an individual farmer'sthis technology despite this relatively low crop failure is likely to occur in a year ofestimated rate of return. Firstly, the propaganda generally low local production and, therefore,effort, plus the fact that it must have been high prices.apparent that erosion would reduce output, may The analysis of aerial photographyhave induced farmers to take a relatively long provided an indication of the uptake of thisterm view and accept a reasonably sure, if technology in the areas sampled (see T'able 3.8).modest, return on their efforts. Secondly, the This may be summarized:
Machakos District: Sampled Areas
Percentage of arable area terraced
Sampled Area 1948 1961 1978
Mbiuni 70 76 100
Masii 13 29 100
Kalama 62 45 100
Makueni n. a. 1 100
Table 3.9 on soil erosion also noted that in the than might have happened without intervention.Wamui River Basin, Kalama, the length of Thus, although the initial impetus came from thecontour banks measured per ha increased from official programs, the most rapid real adoption195 to 667 meters between 1948 and 1972 (i.e., by farmers was during the decade or so afterin the latter period the banks were, on average, independence when official efforts to promote15 meters apart, providing a pretty complete the technology were at a minimum.coverage). These figures suggest a rapid initialuptake in the 1940s under the compulsory Katumani Composite Maizesprograms, then a period of little net expansion inthe 1950s (characterized also in reports cited The analysis of cropping choices during theabove by a neglect of ma:intenance), followed by period 1930-90 takes place against a backgrounda further expansion in the sixties and early of a long term shift from sorghum and millet toseventies. However, because of the rapid uptake maize, among the Akamba and Kenyans at large.at this time, Lhe later off"icial efforts in the late According to Peberdy (1958:250), maize became70s and 80s appear to have had their main popular from the 1920s, when employees onimpact in the settlement areas, and on the late European farms were paid partly in maize oradopters among the farrning population of the maize flour. It is easy to grow, less susceptiblelonger settled areas, and served perhaps to to disease than sorghum, and requires less labormaintain a higher rate of adoption among them for bird scaring and threshing. Famine relief
47
programs, and commercial imports in dry years, varieties, and a third were not using Katumanireinforced the trend to maize. Because it was a seed at all. It is unlikely that cost was deterring"new" crop local farmers experimented with them. For example, in Mbooni (AEZ 3) KCBdifferent varieties and, starting in 1932, the is grown along with a quick maturing varietyAgriculture Department carried out trials on 10 known as Kangundo that outyields it, thoughor more varieties in Machakos. KCB does better in drought. In Masii (AEZ 4)
The rainfall distribution in the district KCB is preferred owing to its drought escaping(see para 2.3) means that the two main properties. In Makueni (AEZ 4/5) earlychallenges to crop husbandry are the shortness adoption of Taboran was a logical response toof the growing seasons and the frequency of the rainfall conditions. Later, KCB, which isdroughts. High probability of drought, and higher yielding, was adopted in its place, butrelated shortness of season, calls for a crop that some farmers have reverted to older types asyields well under drought conditions. Shortness KCB has proved to be more susceptible toof season also calls for a crop that can develop weevil damage.quickly so that by the time the rains end, it has The crucial question with regard to KCBcompleted the development stages most sensitive maize is whether it has improved food securityto water stress. Initial emphasis in the research by increasing the reliability of yields in dryprogram at the Katumani station (near Machakos seasons. Experimental results appear to suggesttown) was placed on drought resistance but the such a conclusion, but representative farm levelpotential in this direction was seen to be limited data are lacking. Relevant for its bearing on theand priority was switched to drought escape. question is the nearly universal preference ofThis led to the introduction of Taboran, a short farmers for mixed strategies, combiningduration variety developed in Tanzania, and to improved with "local" varieties. The manner ofthe development of the "Katumani Composites" its adoption is characterized by varietalof which strain B (KCB) has proven to be the diversity, strategic flexibility, and adaptivemost popular. experimentation, though perhaps unexpected,
The new maize varieties were actively suggests that the system is now less vulnerablepromoted by the extension services, along with than had been supposed.associated technologies and, in particular, early It cannot be known with any certaintyplanting recommendations, and they were what percentage of farmers use KCB, how muchsteadily, if unspectactularly, adopted by farmers. of the maize area is planted with it, or whatIn the short rains of 1975 it was estimated that proportion of total output it contributes. What44% of the maize area was planted to the is known is that its adoption is incomplete, andKatumani varieties, although Lynam reported is likely to remain so. From a "greenthat over 70 % of the farmers in his sample used revolution" standpoint, such an outcome appearsthem. Sales of pure seed for the district were to qualify the success of the breeding program.only about 30 tons per year in this period. The But, from the standpoint of the goals of smallopen-pollinated characteristic of the Katumani farmers, it is a measure of some success, forcomposites does, however, enable farmers to three reasons.save seeds from their own harvests and to sell to (a) The observed levels of adoption,each other. Farmers tend to renew their sustained over two decades, show thatcomposite seeds only after every third season, or KCB is perceived to contributeafter a crop failure. This makes it difficult to positively to meeting the primarydetermine the actual share of the variety in total objective of smallholder agriculture,plantings. namely securing household subsistence
Group and farmer interviews conducted by maximizing yields under thein five locations in 1990 throw some light on constraint of a variable semi-arid rainfalluser rationales. Of 40 farmers interviewed in regime.the five locations only one third used the (b) KCB strengthens, rather thanKatumani varieties exclusively, whilst another undermines the flexibility or adaptivethird planted KCB along with local or hybrid choice that is essential for coping with
48
such a regime and with the range of Many types of plough have beenmicro-environments found. in the marketed and promoted under different namesDistrict. That is to say, it increases over the years, and it was not possible, with theoptions open Ito farmers rather than information collected by the study team, toreplacing alternatives. construct a technical inventory cir a clear(c) Its open pollinating characteristic is chronology of types. The early ploughs wereconsistent with smallholder very heavy, and there are reports of up to 12experimentation, which is a major oxen (in Masii) being required for draft. Inresource of the farming system, and 1935, a smaller Hindustan plough, introduced byreleases the farmer from total the Department of Agriculture, was said to bedependence on external sources of seed. becoming popular. The lighter moldboard
plough came into use in the 1940s, introducedTillage: The Ox-Plough by traders (according to the interviews quoted
above). It used only one pair of oxen and wasSmallholders in the Kangundo area of the district more easily manageable, though fanmers say itare reported to have started buying ploughs, and is less strong than the early ploughs.training their own oxen, by the 'late 1920s. The significance of the transition toPerhaps because of concerns over the impact of lighter ploughs lies in their compatibility withplough use on land management and the risk of reduced livestock holdings, smaller grazingerosion there appears to have been no systematic areas, and the less frequent need to break newpromotion of the ox-plough in the district by the ground as cultivated areas stabilized. It is alsoAgriculture Department until an Agricultural compatible with increased participation ofMechanization Service Unit was established at women in ploughing work. Further, it may beMakueni in the late 1940s in connection with the supposed that teams of several span weresettlement scheme. This promoted ox- difficult, if not impossible, to manipulate on thetechnology, ox-training and cultivator courses. terraces that became increasingly cornmon fromInterviews conducted for the present study the 1950s, and on the small fields of thesuggest that in the lowland locations of Masii uplands.(AEZ 4) and Ngwata (AEZ 5) most farmers are The type of plough now being generallysaid to own ploughs. But in the hilly areas in used (the Victory moldboard plough) is criticizedAEZs 2 and 3, where holdings are now small as inefficient in several respects, and for beingand highly terraced, tlhe proportion is lower. inefficiently used. Yet attempts by theUse of ox-ploughs was reported to be more government and other bodies to intervene inwidespread than their ownership. promoting improved technologies have not had
Interviews conducted for the present a significant impact in the District. Especiallystudy indicate that the following r easons are unsuccessful was the MIDP's tool-bar. Oneinfluential in farmers' changing to ox-ploughing: study (ODI, 1982) concluded frorn this that(1) its superiority for loosening the soil; (2) its expert assessment of the moldboard plough hadrate of work; (3) the saving of labor time and been overly pessimistic. An imperfectdrudgery; (4) better timeliness of operations; and technology, in the hands of skillful users, is(5) improved crop yields. This evidence, taken better than a poorly tested innovation, whosetogether, leaves no doubt why adoption (in terms adoption, furthermore, calls for major newof use, if not ownership) is very high; but little investment.work has been done to quantify or prioritizethese benefits under smallholder conditions. Livestock FeedingGiven its technical and economic advantages,and social acceptance, within the constraints of A fundamental change has occurred in the socialthe Akamba farming system, the most important value of cattle. At the beginning of the periodquestion to be answered about its adoption is the of study, cattle were the "leading edge" of thesources of investment capital. Akamba economic system - a repository of
49
investment funds, indicator of socio-economic Cash Cropsstatus, and dominant consumers of naturalresources. Now, their investment function is Some Akamba farmers were selling maize,secondary to other forms of savings, their bananas, sweet potatoes, beans, sugar, tobacco,possession no longer exclusively determines and millet, to the railway company in 1902, andwealth or status, they are frequently bought and in 1912 the District Commissioner reported ansold and their access to biological resources has increase in the area of cash crops. Thebecome subsidiary to the demands of farming. administration was promoting the cultivation ofA major reason for owning cattle is now the cash crops long before the posting of the firstmaintenance of a plough-team. Small ruminants agricultural officer (AO) to the district in 1932.have perhaps changed less, but less is also The problem as always perceived was to findknown of their management. suitable crops, for the cooler, moister hills
The challenge of supporting a minimal (AEZs 2 and 3), and for the hotter, drierviable livestock herd on a diminishing lowlands (AEZs 4 and 5). Coffee and cotton,landholding has dominated the evolution of respectively, eventually emerged as the officiallyfeeding systems. This evolution from extensive preferred candidates, the first after Europeangrazing in the 1930s, through increasingly labor- farmers' opposition to African cultivation hadintensive methods, to the growing popularity of been overcome, and the second after the failurestall-feeding in the 1990s, is consistent with a of sisal.general trend towards agricultural intensification,driven by population growth and land scarcity. Coffee
The transfer of grazing land tocultivation has added impetus to the trend noted Some Akamba were employed on Europeanabove, and reflects a fundamental shift in the coffee farms and had learned to grow the croprelative priority of cropping and livestock but, in 1938, the Government expressly forbadeenterprises in the farm system, in favor of the "native" coffee growing in order to protectformer. This has required a redefinition of the European producers' interests. This policy wasrole of livestock in which nutrient recycling is eventually reversed, in response to persistent andincreasingly important. Stall feeding and fodder organized pressure from African farmers.crops further the integration of crop and Influential in this reversal was the realizationlivestock enterprises on the family holding. that coffee was a suitable component ofIndividual holdings, expressed in the rehabilitation programs, being both profitabledemarcation and enclosure of grazing areas, was and consistent with conservation objectives.a necessary condition for the intensification of Planting was at first confined to selected areas.the feeding systems on smallholdings. Its The Department of Agriculture regulatedimportance for the evolution of livestock planting, production and processing closely,husbandry cannot be overstated. under the coffee rules. Nurseries provided
There is a marked divergence between seedlings for planting in the short rains.development in the uplands (AEZ 2/3) and in the Planters had to belong to cooperatives; all coffeelowlands (AEZ 4/5). But although the upland had to be grown on terraces; and standards wereenvironment appears to offer better possibilities enforced by inspectors with regard to spacing,than the lowland for sustainable productivity, manuring, mulching, pruning and windbreaks.lowland mixed farming, even in AEZ 5, has Grading was carried out at the factories.been shown to be more sustainable (in economic Producers were paid a flat rate, irrespective ofterms) in severe drought than specialist livestock grade, but cooperatives were paid by grade.husbandry in a similar environment. Lower This was a disincentive to producer quality, butproportionate losses, in time of drought, were forced loss making cooperatives to eventuallyattributable to the supply of crop residues, improve supervision.smaller herds, better market outlets and superior The labor and other requirements ofanimal condition (Mukhebi et al., 1991). coffee are considerable and conflict with the
50
demands of food crops. Pruning, picking and markets. Both coffee and cottorn requireddrying, and crop protection required labor governrnent interventions in extension, theduring the growing season of the food crops. provision of inputs, supervision of production,Labor hiring and input purchase increased the grading and marketing of output. They haveoutlays required for production. T'he plants' recently run into marketing difficulties, andneed for land, manure and mulches competed these can be traced to rigidities in pricing anddirectly with other crops. Such competition set marketing, which are controlled by state-runlimits to the coffee area per holding. However, monopolies. By contrast, horticultural and fruitreturns to coffee were high until the world price crops, developed with far less governmentdeclines of the 1980s. A declining production involvement (and expense), are sold throughtrend was observed after 1980. Although low more fragmented and less controlled channels,rainfall was a major factor in some years, many and have been more dynamic over time.farmers were neglecting husbandry practices. In Adaptatior. arnd innovation are characteristic1990, according to interviews by the study team, attributes of Akamba agriculture. With little orcoffee producers in AEZ 3 remained heavily no official pressure, the performance of thecommitted to the crop, but the decline in the sector, even in the drier areas, is in sharpworld price has been passed on directiy to the contrast to that of cotton. In the long run,producers, together with increased marketing horticulture may turn out to be more stable incharges and taxes, and abandoned or neglected the District than coffee. The generally highcoffee is reported to be common in some areas. value per hectare of vegetable production for the
market, when not reduced by drought or otherColton factors, permits optimal use of micro-
environments with a favorable moisture balance.Cotton is agro-ecologically suited to AEZ 4, High value per hectare also minimizes the entrywhere land was not considered to be scarce until cost in terms of food grain production foregone.recently. With regard to labor, cotton competes Similarly, fruit trees offer women farmers bothdirectly with maize in this area. Early planting sources of food and disposable income, withoutis desirable for both crops. Cotton is planted in a major reduction in the area under food crops.the short rains and harvested after the long rains. This is because some are grown scattered onMaize is grown in both seasons. Cotton arable land, representing a form ofrequires costly chemical inputs and under intensification (Hayes, 1986).prevailing prices returns both to land and laborhave been below those of food crops. When thecrop was readily saleable farmers were willing Sources of Innovationsto grow it as a source of ready cash. Lowreturns serve to further marginalize a crop In addition to the centrality of intensification toalready affected by price changes and. marketing the reduction of degradation in Machakos, theinefficiencies. The minimization of these study has also shown that this reduction has notremains the best policy option. just been a question of the introduction of a
single resource conserving technology.Horticultural Crops Adoption of a large number of changes in
GivenK sexport oriented farning sector, technology has enabled the overall system to beGiven Kenya's exn orket, and tector modified so as to increase production and reducestrongly developed urban market, and technical resource degradation. The Machakos experienceresources it is not s,urprising that interest also illustrates the difficulties inherent in thedeveloped early in marketing perennial and operation of the "one source model ofannual fruits and vegetables. The history of agricultural innovation" (Biggs 1989). In thistheir promotion and adoption is largely the model there is a hierarchy of official technologygrowth of the urban, canning and export development which puts the scientist in themarkets, and of marketing channels adapted to design chair at the top of the pyramid, and thethe diversity and variability of both products and farmers, who are supposed to adopt the
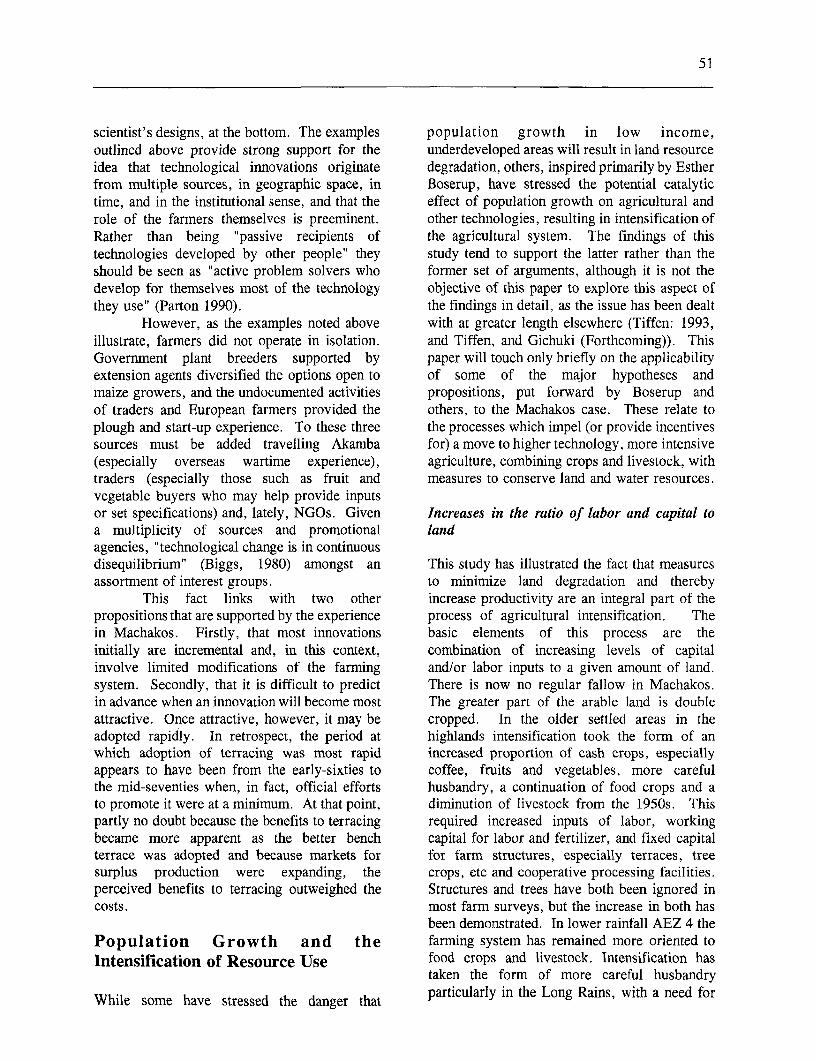
51
scientist's designs, at the bottom. The examples population growth in low income,outlined above provide strong support for the underdeveloped areas will result in land resourceidea that technological innovations originate degradation, others, inspired primarily by Estherfrom multiple sources, in geographic space, in Boserup, have stressed the potential catalytictime, and in the institutional sense, and that the effect of population growth on agricultural androle of the farmers themselves is preeminent. other technologies, resulting in intensification ofRather than being "passive recipients of the agricultural system. The findings of thistechnologies developed by other people" they study tend to support the latter rather than theshould be seen as "active problem solvers who former set of arguments, although it is not thedevelop for themselves most of the technology objective of this paper to explore this aspect ofthey use" (Parton 1990). the findings in detail, as the issue has been dealt
However, as the examples noted above with at greater length elsewhere (Tiffen: 1993,illustrate, farmers did not operate in isolation. and Tiffen, and Gichuki (Forthcoming)). ThisGovernment plant breeders supported by paper will touch only briefly on the applicabilityextension agents diversified the options open to of some of the major hypotheses andmaize growers, and the undocumented activities propositions, put forward by Boserup andof traders and European farmers provided the others, to the Machakos case. These relate toplough and start-up experience. To these three the processes which impel (or provide incentivessources must be added travelling Akamba for) a move to higher technology, more intensive(especially overseas wartime experience), agriculture, combining crops and livestock, withtraders (especially those such as fruit and measures to conserve land and water resources.vegetable buyers who may help provide inputsor set specifications) and, lately, NGOs. Given Increases in the ratio of labor and capital toa multiplicity of sources and promotional landagencies, "technological change is in continuousdisequilibrium" (Biggs, 1980) amongst an This study has illustrated the fact that measuresassortment of interest groups. to minimize land degradation and thereby
This fact links with two other increase productivity are an integral part of thepropositions that are supported by the experience process of agricultural intensification. Thein Machakos. Firstly, that most innovations basic elements of this process are theinitially are incremental and, in this context, combination of increasing levels of capitalinvolve limited modifications of the farming and/or labor inputs to a given amount of land.system. Secondly, that it is difficult to predict There is now no regular fallow in Machakos.in advance when an innovation will become most The greater part of the arable land is doubleattractive. Once attractive, however, it may be cropped. In the older settled areas in theadopted rapidly. In retrospect, the period at highlands intensification took the form of anwhich adoption of terracing was most rapid increased proportion of cash crops, especiallyappears to have been from the early-sixties to coffee, fruits and vegetables, more carefulthe mid-seventies when, in fact, official efforts husbandry, a continuation of food crops and ato promote it were at a minimum. At that point, diminution of livestock from the 1950s. Thispartly no doubt because the benefits to terracing required increased inputs of labor, workingbecame more apparent as the better bench capital for labor and fertilizer, and fixed capitalterrace was adopted and because markets for for farm structures, especially terraces, treesurplus production were expanding, the crops, etc and cooperative processing facilities.perceived benefits to terracing outweighed the Structures and trees have both been ignored incosts. most farm surveys, but the increase in both has
been demonstrated. In lower rainfall AEZ 4 thePopulation Growth and the farming system has remained more oriented toIntensification of Resource Use food crops and livestock. Intensification has
taken the form of more careful husbandry
While some have stressed the danger that particularly in the Long Rains, with a need for
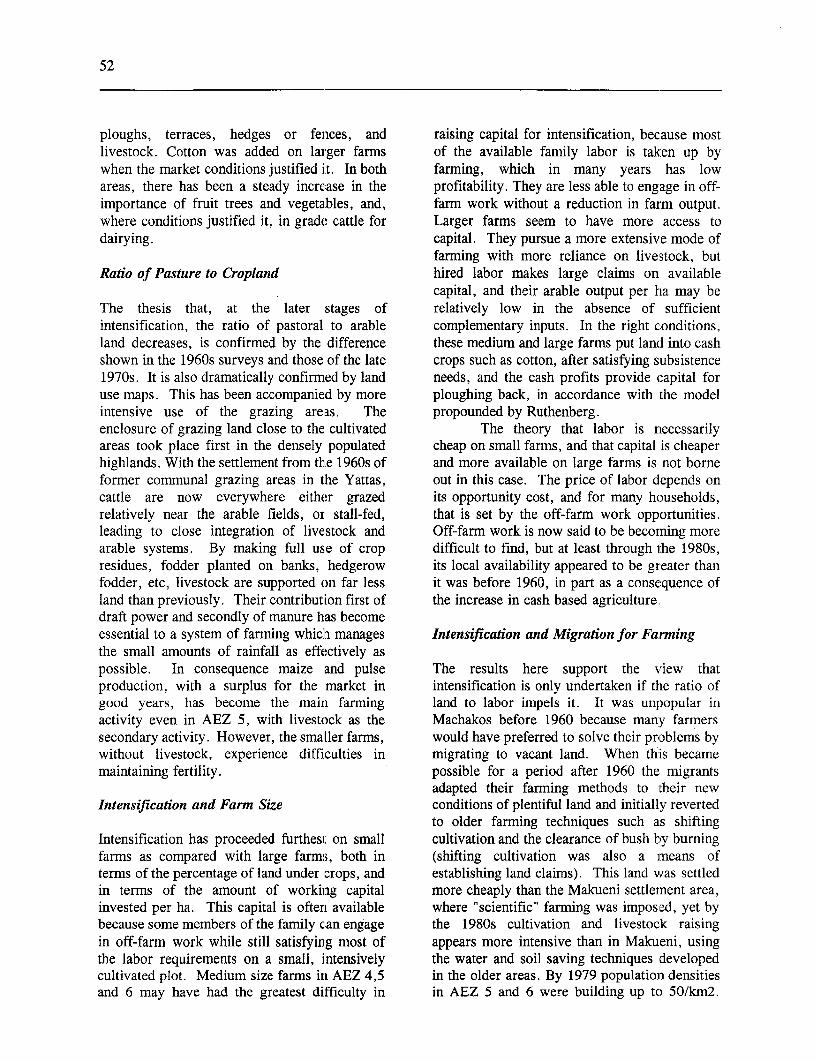
52
ploughs, terraces, hedges or fences, and raising capital for intensification, because mostlivestock. Cotton was added on larger farms of the available family labor is taken up bywhen the market conditions justified i.t. In both farming, which in many years has lowareas, there has been a steady increase in the profitability. They are less able to engage in off-importance of fruit trees and vegetables, and, farm work without a reduction in farm output.where conditions justified it, in grade cattle for Larger farms seem to have more access todairying. capital. They pursue a more extensive mode of
farming with more reliance on livestock, butRatio of Pasture to Cropland hired labor makes large claims on available
capital, and their arable output per ha may beThe thesis that, at the later stages of relatively low in the absence of sufficientintensification, the ratio of pastoral to arable complementary inputs. In the right conditions,land decreases, is confirmed by the difference these medium and large farms put land into cashshown in the 1960s surveys and those of the late crops such as cotton, after satisfying subsistence1970s. It is also dramatically confirmed by land needs, and the cash profits provide capital foruse maps. This has been accompanied by more ploughing back, in accordance with the modelintensive use of the grazing areas. The propounded by Ruthenberg.enclosure of grazing land close to the cultivated The theory that labor is necessarilyareas took place first in the densely populated cheap on small farms, and that capital is cheaperhighlands. With the settlement from the 1960s of and more available on large farms is not borneformer communal grazing areas in the Yattas, out in this case. The price of labor depends oncattle are now everywhere either grazed its opportunity cost, and for many households,relatively near the arable fields, or stall-fed, that is set by the off-farm work opportunities.leading to close integration of livestock and Off-farm work is now said to be becorning morearable systems. By making full use of crop difficult to find, but at least through the 1980s,residues, fodder planted on banks, hedgerow its local availability appeared to be greater thanfodder, etc, livestock are supported on far less it was before 1960, in part as a consequence ofland than previously. Their contribution first of the increase in cash based agriculture.draft power and secondly of manure has becomeessential to a system of farming which manages Intensification and Migration for Farmingthe small amounts of rainfall as effectively aspossible. In consequence maize and pulse The results here support the view thatproduction, with a surplus for the market in intensification is only undertaken if the ratio ofgood years, has become the main farming land to labor impels it. It was unpopular inactivity even in AEZ 5, with livestock as the Machakos before 1960 because many farmerssecondary activity. However, the smaller farms, would have preferred to solve their problems bywithout livestock, experience difficulties in migrating to vacant land. When this becamemaintaining fertility. possible for a period after 1960 the migrants
adapted their farming methods to their newIntensification and Farm Size conditions of plentiful land and initially reverted
to older farming techniques such as shiftingIntensification has proceeded furthest on small cultivation and the clearance of bush by burningfarms as compared with large farms, both in (shifting cultivation was also a means ofterms of the percentage of land under crops, and establishing land claims). This land was settledin terms of the amount of working capital more cheaply than the Makueni settleinent area,invested per ha. This capital is often available where "scientific" farming was imposed, yet bybecause some members of the family can engage the 1980s cultivation and livestock raisingin off-farm work while still satisfying most of appears more intensive than in Makueni, usingthe labor requirements on a small, intensively the water and soil saving techniques developedcultivated plot. Medium size farms inI AEZ 4,5 in the older areas. By 1979 population densitiesand 6 may have had the greatest difficulty in in AEZ 5 and 6 were building up to 50/km2.
53
Cultivation of this "marginal" land has not so far infrastructure and policies are still such thatled to the degradational and poverty spiral purchase from better endowed parts of Kenyapredicted in the 1970s, although severe remains extremely expensive and risky in poordroughts, such as 1974-5 and 1983-4, still seasons. Farmers aim to keep enough landrequire famine relief. under staple foods to provide for their families
Emigration from the older areas limited in all but the worst seasons, selling surpluses inpopulation growth in the older areas in the 1960s good seasons. The larger farmer in the lowerand 1970s to 1 - 2% per annum. This led to the part of the district moves into cotton when thepace of intensification being slower than it price is right and the marketing system adequate.would otherwise have been. After the end of the Livestock are important as a reserve cash1970s, farm size is said to have diminished more source, but even more important in providingrapidly than before, as the agricultural frontier the necessary manure and draft for the foodhas closed and migration to new areas to farm is crops. In these circumstances, necessaryno longer an option. This coincides with the improvements in their food production areadoption of horticulture and fruit as further largely still financed through off-farm work,stages in intensification. which also helps to provide cash and stabilize
incomes. Recently, in some areas, fruitIntensification and the Market production has become profitable.
Machakos farmers have proved veryBoserup assumed that, as population increases, responsive to new market opportunities. Thethe cost of infrastructure provision decreases, study indicates process of change in which,leading to the emergence of new market towns, when farming is extensive and marketingto increased demand, and higher farm gate infrastructure poor, the main cash income isprices. This has happened only to a limited derived from livestock. As the emphasis onextent in Machakos, with the exception of the arable increases, livestock sales are firstnorthern part of the District. Machakos remains supplemented and then overtaken by crop sales.the only town of any size. Secondary marketing At this stage the main intention of arablecenters developed in the north in the farming is subsistence, but some surpluses areKangundo/Tala area in the 1950s, and in Matuu produced. At a third stage, investment isfrom the late 1970s, with the improvement of undertaken to support produced purely for theroad communications. Elsewhere, road market, such as coffee, cotton and horticulture,infrastructure is still poor, except along the line as and when the marketing infrastructure permitsof the Machakos-Mombasa road, which passes attractive farm gate prices. A fourth stage, notthrough AEZ 5-6. yet reached in Machakos, is likely when
A good marketing system is important in marketing infrastructure and market policiesspeeding intensification, since profits from sales permit specialization on the products for whichprovide both the incentive to invest in fixed and the region has comparative advantage, and foodworking capital to improve farm output, and one is purchased from the regions of its comparativeof the means to do so. When there are no advantage, such as the Rift Valley where maizeopportunities for profitable sales, people satisfy yields are more than twice as high (Lele andtheir cash needs by migrant labor. Market Stone, 1989).production became an important part of total Farming systems have intensified infarm production in the northern hills first. accordance with the ecological gradient, but withThere is some suggestion that some farmers in a strong modification from market access. Thethese areas have moved to a second stage of most favorable areas for cultivation were settledcommercialization, and regularly buy some of first and became densely settled first. Thetheir staple food needs, but data are insufficient northern hills had built up to population densitiesto be certain. In the drier areas, market exceeding 100/km2 by 1948, and led the way inconditions affect both the priority which farmers food crop production for the market, in fruit andhave to give to food crops, and their willingness vegetable development, and in coffee growing.to produce alternative crops. Marketing By the 1960s, livestock were already relatively
54
unimportant in these areas, except to provide other factors related to societal change acted tomilk, and ploughing for the bigger farmns, and facilitate the agricultural changes discussed inthese areas led in using chemical fertilizers on this chapter. The report will review these andcoffee and maize. However, in the ecologically other facilitators of change before turning tosimilar southern hills, poorer market access assess the overall lessons of this study for landdelayed population build-up, and, with currently resource management.a little more land per capita than in the north,farmers have developed intensive dairying NOTEsystems for zero-grazed dairy cattle, incombination with coffee, fruit and vegetables 1. It has been pointed out that a simi3ar evolution
and food crops. These systems are now occurred in the U.S. Early U.S. conservation efforts werestrongly influenced by research in more humid areas, e.g., the
spreading into AEZ 4 arid even 5. However, upper Mississippi Valley (S.W. wisconsin, S.E. Minnesota and
requirements of many of these cha[nges are N.E. Iowa) and in parts of the Tennessee Valley. These first U.S.
market access and a certain minimum of water. experiment station devoted to soil conservation was at La Crosse,wisconsin with a focus on light, unglaciated and hilly soils, many
However, the process of the development of overlying karst limestone. As a result an emphasis on sheet and
sustainable farming systems was not a gully erosion was not surprising. Attempts to apply these ideas in
mechanical process of intensificatiorn. At the more arid areas e.g., the Great Plains encountered the sameresponse as in Machakos, and as experience7 was accumulated in
same time the Akamba society itself' was not the 1940s and 1950s, greater stress was placed on water spreadingstanding still and it is clear that a number of and retaining moisture. (PM Raup. Pers. Communication).
55
5. The Facilitators of Change
This report has described a wide range of the herd, is no longer the ideal. Since thechanges in agricultural and agricultural practices. 1930s, the family has become cash orientedImplicitly, if infrequently explicitly, it has because of needs beyond those which can beindicated significant changes in attitudes which supplied within the family, such as school fees,were important in the introduction of changed clothing, medication and household effects. Thepractices which have enabled the farmers of the pressure for a minimum cash income led todistrict to increase their intensity of land rural-urban migration. At first this was almostresource use in a sustainable manner. This was exclusively by men so it enforced change in sexmost explicitly noticeable in the case of cattle, roles. Studies by Heyer (1966); Matingu (1973)but more generally the approach to land and Mbithi (1971) indicated that at times overmanagement has become more businesslike, "we 40% of families in rural Machakos had absenteeare better organized now." The agricultural male adults. An increased acquisition of malediscussion in the report has touched upon a roles and tasks by women - such as housenumber of significant social changes which have repairs, breaking ground for planting, using thebeen fundamental in these other areas, eg the plough and determining family policy on youthabsence (on a varying scale) of a significant education - was being experienced. It led to anshare of the young male population, leaving the increasing, economically and/or politicallywomen to handle the major burden of day to day imposed, maternal dominance. The resultanthousehold affairs and agricultural production. change brought about higher proportions of splitBefore developing conclusions to the agricultural and single parent families. Divorce, which wasstory which has been told, this chapter will traditionally frowned upon, became moreoutline the social changes which also appear to comnmon. Concerns were expressed that malebe essential to the whole picture, and assess the migration, absenteeism and, more importantly,role of government. the frequent inability of the male to obtain
gainful employment and exert his role inChange in the Basic Elements of supporting his family could lead to maleAkamba Society alienation and alcoholism (Mbula, 1974).
However, many families successfully
The Family surmounted these strains, and evolved a newmarital relationship based on shared decision
The Akamba family is the basic unit of making, and shared work roles on the eversocialization, production, consumption and smaller farms.investment. The ideal family in the conception There has been an increasing tendency toof the 1930s was an extended family based on nuclear families which had become the norm inpolygyny, including adult children, which was older settled areas, although polygyny remainedpart of a more diffuse clan. The larger the common in the newly settled areas. For a longfamily, the greater a man's territorial sphere of time, the Akamba family relied on the clan andinfluence, through clan and kinship mechanisms, kinship during times of disaster and conflicts.as his older sons settled elsewhere. In the 1930s With family members searching for employmentthere was still fairly strict division of labor by and for land to settle, clan social controlage and sex. mechanisms have diminished. A positive aspect
The Akamba family, however, has of the change to nuclear families is that men noexperienced change over the years in size and longer confine themselves to clearing land forstr-ucture, (Mbula 1974; 1977). The traditional new farms and caring for livestock, but, if theirfamily, where wealth and prestige were main role is farming, like the women, they maymeasured bythe numberof wives andthe sizeof contribute to all stages of crop production.
Now, one woman leader in Mbooni told the
56
study team, "men have become more helpful." boundaries (demarcation), hearing of objectionsThe farm labor force has become more flexible. and resolution of disputes, and finally, when allIt is, however, reduced in size and it is still disputes and appeals have been heard, the issuepredominantly female, since more imen than of certificates against payment of a fee. Inwomen have off-farm jobs. With young people Machakos there were many objections andgoing to school or working off-farm, parents or delays and the process is still incomplete. Onlyhired labor have taken over most of the: activities 35 % of sub-locations were fully registered bychildren traditionally performed. If the father is 1992.away or in a non-farm occupation, these Legal registration of title has been lessadditional tasks add to the daily load on women. important in Machakos than in some other areas,At times of peak labor requirements, many of because tenure had already evolved to a statusthe off-farm workers, male and female, may akin to freehold. A formal title is valued for thereturn to give a hand. extra security it gives, particularly in situations
where there may be disputes about rights ofLand ownership or rights to settle on specific areas (as
for example, where there is also government orTraditionally the usual mechanism for acquiring estate land and where, therefore, settlers may bearable land among the Akamba was by a person deemed "squatters"). Apart from suchi areas, itor family moving into an unsettled area. Once has not been a prior condition for agriculturalcultivated, land became heritable property which development, because of the degree o:f securitycould be fallowed or used for grazing with already available through customary law.security. This encouraged the investment offamily labor in permanent improvements. It is Mutual Help Groupssaid irrigation systems were built in the Mboonihills from the eighteenth century. The Three types of mutual help groups existed in theconstructor obtained water rights (Penwill, 1930s and '40s; a rotational group for1950:53). Much grazing land was a common neighboring farmers; mwethya, a group calledresource belonging to a particular village or for a day by a host for a special purpose; and aclan, if near the settlement, or to the tribe more larger group consisting of mwethya froim severalgenerally if more distant. However, there was a villages when a rich "host" could call for a bigright to mark trees to define a grazing area project. The word mwethya is now aLpplied towhich was private as long as used. all types of group. The colonial authorities tried
In 1938 the Local Native Council, at the to use the mwethva to create communityinstigation of the colonial government, enforced improvements by compulsory labor. To anfencing of individual grazing land as part of its extent this was accepted for desirable communityefforts to prevent land degradation. As time assets. They were also used to build dams, towent on, more and more of the unsettled land plant grass on bare, degraded land, to blockbecame either private cultivated land or private gullies and to build terraces across cultivated andfenced grazing, initially under customary rules. uncultivated land. After 1946 more funds andFrom the mid 1950s the government favored more government staff became available for theindividual legal title, with consolidation of Machakos Betterment Scheme and the workscattered plots. Land consolidation was became more continuous and spread over moreopposed in Machakos District because farmers locations. It differed fundamentally fromvalued having land in different ecological niches. traditional mwethya; it was compulsory, it wasAs consolidation was initially a condition for for a long continuing activity rather than aregistration the land adjudication process was special day-long project, it was instigated bydelayed. Machakos District was not declared government officers and led, not by anfor registration until 1965, and only got its own individual host who wanted the project, but byadjudication officer in 1968. In the older areas the chief, government officials or those whomthe process of registration can take six to seven the government regarded as elders.years since it involves establishing and. mapping Furthermore, non-compliance was punishable by
57
fines. Informants in several villages in 1990 certainly not registering all groups, since churchagreed that compulsion helped to kill traditional dioceses and other NGOs did not necessarilymwethya at this time. Other factors were the register groups assisted by their ownabsence of men on migratory labor, and the development and support personnel. Althoughrounding up of many remaining young men for some groups failed, they have been importantmore or less compulsory contract work in agents for collecting and concentrating localMakueni, which broke traditional mechanisms contributions of work and capital, and securingfor handing on the customs connected with supplementation of these by outside sources ofmwethya. finance and expertise. Although most external
Informants said that the current self-help publicity has been given to those involved in soilgroup and women's groups are different from conservation, this is not their chief activity. Onethe older mwethya. They evolved in the 1960s. survey found in 1987 that for every one groupSelf-help groups are distinguished from involved in "ecological" activity such astraditional mwethya by having long-term terracing or tree planting, there were threeobjectives and a program to achieve them, engaged in some form of income generatingelected officers, legal recognition and projects (Ondiege, 1992).registration with the Ministry of Social Servicesso that they can operate bank accounts, etc., and Local Leadershipthe contribution of money as well as worktowards the objective in hand. The objectives During the 1930s and 1940s traditional socialare agreed by the group. They may range from leadership survived, but was becomingthe provision of a community amenity (a school, undermined and dominated by colonialdip, dam, etc.), to the establishment of an institutions. The ability of the colonialincome-earning activity (tailoring business, government to diagnose the causes of thepoultry rearing, etc.), to mutual assistance environmental degradation that was occurring,(terracing members' farms in turn, improving and to bring in remedies, was limited partly bykitchens, etc.). For example, during 1962-68 its thinness on the ground (there was noone village constructed four dams, two local agricultural officer till 1932), partly by a rapidroads, a secondary school, a nursery school, and turnover of personnel which inhibited a goodcleared bush for cotton (Mbithi, 1971, 183-86). knowledge of local conditions and institutions,
The compulsory work in the 1950s and partly because of the low valuation put upondeveloped women leaders. Indeed, because of Akamba knowledge, which led in turn to athe absence of many men, they were the failure to develop truly representativeinformal leaders and rhythm leaders (Mutiso, institutions, or to incorporate the real local1975:259), using traditional music and dance to leaders into the governmental machinery.help along the work. Women formed clan- Leadership at the District level wasbased groups at the locational and divisional provided by the appointed Districtlevels, for soil conservation, harambee schools, Commissioner. Government appointed chiefshealth centers, etc. By 1969 struggles within were placed in charge of "Locations", whichKANU meant that these clan-based groups were grouped several villages. The Chiefs' powerseen as undesirable political organizations. The came from the colonial authorities, backed ifCommunity Development Department was told necessary by the police. They were chosen forto register groups only for particular projects, their willingness to carry out governmentrather than as clans carrying out a series of policies, although by the 1940s the authoritiesprojects; Project-based groups, however, elect were taking more trouble to see that the chief, atsub-location committees, and upwards to district least when first appointed, was acceptable.level. At the Divisional and District level the They were frequently able to use their positionGovernment's Social Development Department to acquire land, livestock or other forms ofkeeps an eye on the groups as well as assisting wealth.them to plan new projects. By 1990 the As in other parts of Kenya, a LocalCommunity Development Assistants were Native Council was set up in 1924 to provide
58
the District Commissioner with advice at the the mission schools. Together with the teachinglevel of the District. Although chiefs and other of the Bible and related academic subjects,appointed persons were in the majority the technical material was also taught, carpentry andelected element was influential (Forbes Munro, house construction using non-traditional1975; 131 et seq). The latter were often from a materials, general hygiene, and non-t-raditionalnew class of people known as asomi. who had methods of farming. The impact of this activitymoved somewhat outside tradition by acquiring was greatly enhanced by the return of soldierssome education, and who perhaps had had a job from the war, when many had acceptedaway from the District for some time. Christian teaching in the army, by an increase inHowever, the Council was not seen by ordinary the number of white missionaries after the war,people as a means through which they could and by the rapid expansion of education, often atinfluence government policy. Informnants were the demand of ex-soldiers, with most schoolssurprisingly agreed that as late as 1945 the under mission supervision.people who took the decisions and had influence During the early 1950s local leadershipwere the District Commissioner, the Chief, and of the churches developed. The Akambaperhaps the elders on local matters (see Table Christian elite were mobilizing the local people5.1). Government was an alien institution over to work toward independence, one aspect ofwhich people had no control and in which they which was independent churches. Withdid not participate. The elected Councillor independence, religious denominations cameseems to have become more influential when he together to work towards development. Theacquired national links through the political party churches developed the human resource base byand the local MP, after Irndependence. providing new local leadership roles, no longer
The consequence of the changes within confined to traditional elders, through organizingthe family and mutual help groups, together with and implementing projects such as new churchesother developments in education, in the and schools. In the late 1970s the churches,churches, and in governrnent policy which will particularly the Roman Catholic and Church ofbe discussed in the following sections, is a much the Province of Kenya (Episcopalian), beganenlarged and more competent leadership base at moving actively into the development field,local level. This now includes women as well as recruiting their own staff for activities such asmen. Local leaders include those such as self- distributing relief foods, teaching terracehelp group leaders, pastors, teachers, traders, construction, and advising on water tanks,and retired civil servants. They are well mainly by supporting local self-help groups.connected with national and even internationalinstitutions through the party, the Councillors Markets and Tradeand MPs, the churches, the old-boy and old-girlnetworks. The wider range of leadership in Despite the handicaps of bad local roads and1990 as perceived by respondents to the study unnecessary regulations, traders have played anteam, as compared with 1945, is shown in Table important role in Machakos, by stimulating5.1. In the same way a wider range of production, specialization and exchange. Somedevelopment organizations is seen as playing a of the traders have been outsiders, others haverole in development than in the past. developed locally, often starting off either as
farmer-traders, or as migrant workers who haveMajor Agents of Change returned home to start a business. Most of the
first Akamba plough owners, transport owners,
The Missions and Churches shop owners had accumulated capital throughwork away from home. With outmigration on a
The period before 1930 was characterized by large scale first starting in the 1920s, theseintensive evangelization efforts. Akamba results started coming through in the 1 930s, andtraditional religion was slowly replaced by were boosted by the return of soldiers fromChristianity. The establishment of mission World War II. The effect of good market accessstations went hand in hand with the opening of in bringing information and stimulating
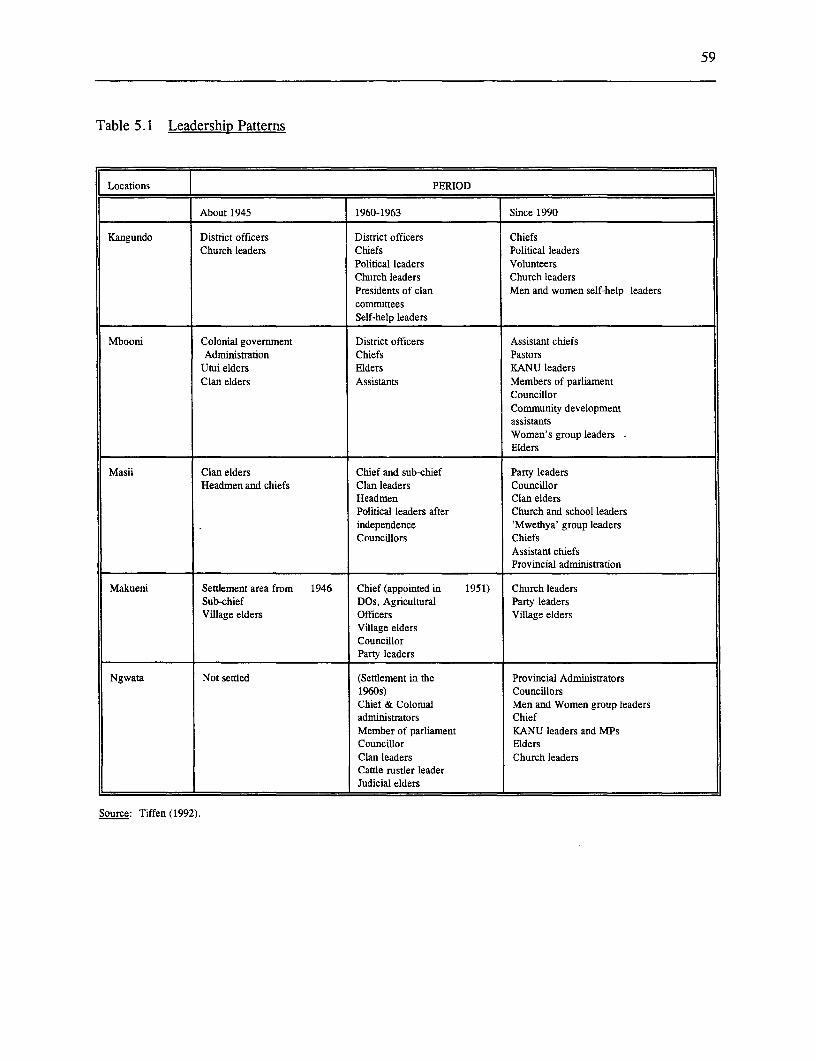
59
Table 5.1 Leadership Patterns
Locations | PERIOD
About 1945 1960-1963 Since 1990
Kangundo District officers District officers ChiefsChurch leaders Chiefs Political leaders
Political leaders VolunteersChurch leaders Church leadersPresidents of clan Men and women self-help leaderscommittees
X___________________________ Self-help leaders
Mbooni Colonial government District officers Assistant chiefsAdministration Chiefs Pastors
Utui elders Elders KANU leadersClan elders Assistants Members of parliament
CouncillorCommunity developmentassistantsWomen's group leaders -
Elders
Masii Clan elders Chief and sub-chief Party leadersHeadmen and chiefs Clan leaders Councillor
Headmen Clan eldersPolitical leaders after Church and school leadersindependence 'Mwethya' group leadersCouncillors Chiefs
Assistant chiefsProvincial administration
Makueni Settement area from 1946 Chief (appointed in 1951) Church leadersSub-chief DOs, Agricultural Party leadersVillage elders Officers Village elders
Village eldersCouncillorParty leaders
Ngwata Not settled (Settlement in the Provincial Administrators1960s) CouncillorsChief & Colonial Men and Women group leadersadministrators ChiefMember of parliament KANU leaders and MPsCouncillor EldersClan leaders Church leadersCattle rustler leaderJudicial elders
Source: Tiffen (1992).
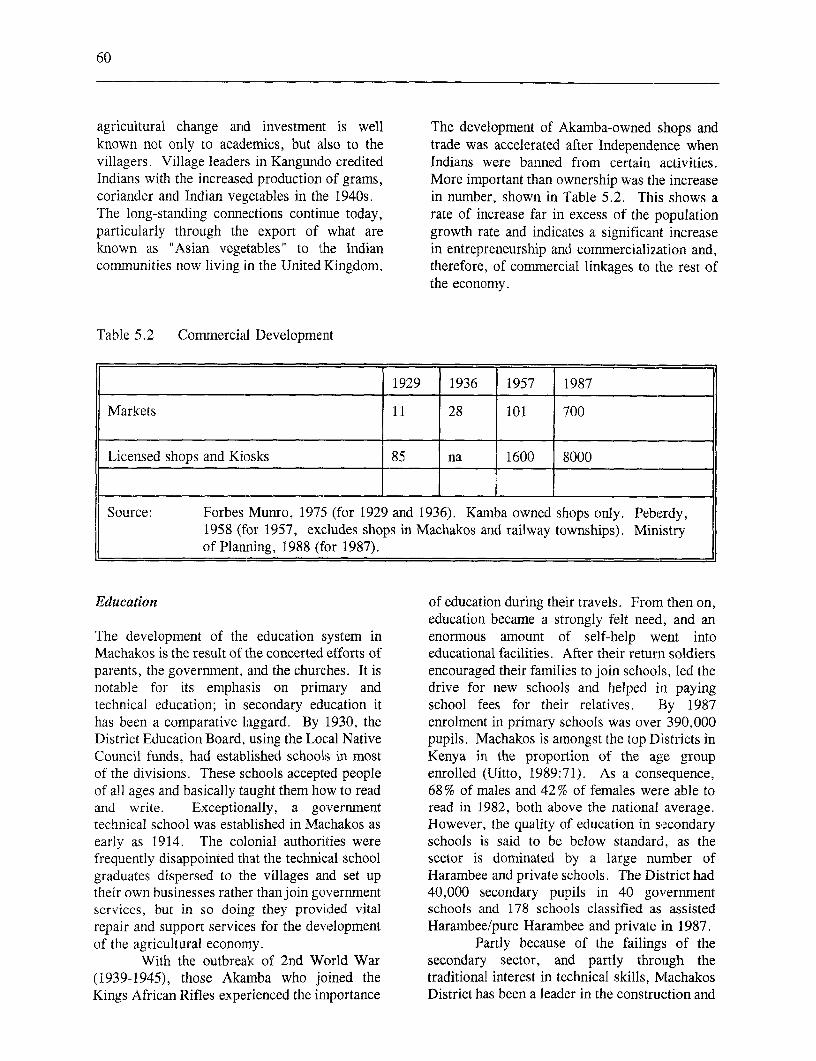
60
agricultural change and investment is well The development of Akamba-owned shops andknown not only to academics, but also to the trade was accelerated after Independence whenvillagers. Village leaders in Kangundo credited Indians were banned from certain activities.Indians with the increased production of grams, More important than ownership was the increasecoriander and Indian vegetables in the 1940s. in number, shown in Table 5.2. This shows aThe long-standing connections continue today, rate of increase far in excess of the populationparticularly through the export of what are growth rate and indicates a significant increaseknown as "Asian vegetables" to the Indian in entrepreneurship and commercialization and,communities now living in the United Kingdom. therefore, of commercial linkages to the rest of
the economy.
Table 5.2 Commercial Development
1929 1936 1957 1987
Markets 11 28 101 700
Licensed shops and Kiosks 85 na 1600 8000
Source: Forbes Munro, 1975 (for 1929 and 1936). Kamba owned shops only. Peberdy,1958 (for 1957, excludes shops in Machakos and railway townships). Ministryof Planning, 1988 (for 1987).
Education of education during their travels. From then on,education became a strongly felt neecl, and an
The development of the education system in enormous amount of self-help went intoMachakos is the result of the concerted efforts of educational facilities. After their return soldiersparents, the government, and the churches. It is encouraged their families to join schools, led thenotable for its emphasis on primary and drive for new schools and helped in payingtechnical education; in secondary education it school fees for their relatives. By 1987has been a comparative laggard. By 1930, the enrolment in primary schools was over 390,000District Education Board, using the Local Native pupils. Machakos is amongst the top Districts inCouncil funds, had established schools in most Kenya in the proportion of the age groupof the divisions. These schools accepted people enrolled (Uitto, 1989:71). As a consequence,of all ages and basically taught them how to read 68% of males and 42% of females were able toand write. Exceptionally, a government read in 1982, both above the national average.technical school was established in Machakos as However, the quality of education in secondaryearly as 1914. The colonial authorilties were schools is said to be below standard, as thefrequently disappointed that the technical school sector is dominated by a large number ofgraduates dispersed to the villages and set up Harambee and private schools. The District hadtheir own businesses rather than join government 40,000 secondary pupils in 40 governmentservices, but in so doing they provided vital schools and 178 schools classified as assistedrepair and support services for the development Harambee/pure Harambee and private in 1987.of the agricultural economy. Partly because of the failings of the
With the outbreak of 2nd World War secondary sector, and partly through the(1939-1945), those Akarrba who jo:ined the traditional interest in technical skills, M/lachakosKings African Rifles experienced the importance District has been a leader in the construction and
61
maintenance of Village (since renamed Youth) district have been concentrated into two periods.Polytechnics. Village Polytechnics were first Following World War II there was a majorestablished in 1967 in response to a 1966 report effort focussing on the erosion control work ofwhich was written by the National Christian the African Land Development Board (ALDEV)Council of Kenya (NCCK) on the plight of (1947-1962). There followed a period ofschool-leavers. The Kenya Government made it relative inactivity, when public agriculturalclear that Youth Polytechnics are village efforts were concentrated in areas of higherprojects; the community has therefore to support potential elsewhere in Kenya. By the latethe projects. Teachers are paid partly by 1970s, however, attention was returning to thegovernment and partly by parents. Linkages semi-arid lands and under the Machakoswith NGOs, have assisted them in developing Integrated Development Project (MIDP) majornew intermediate technology products such as funding was received through most of the 1980s.carts, water storage items, etc. which form the The regional distribution of expenditurefoundation of new businesses, and earnings from under the ALDEV programs is summarized inwhich supplement the polytechnics' own income. Table 5.3(a). This indicates that almost 32% ofAlthough many are under-equipped, a sample the total expenditures of 4.6 million poundssurvey in 1986 found their graduates were quite were made in Machakos district, although itsuccessful in securing employment, and a study accounted for less than 7 % of the population. Itby Yambo (1987) showed that, at a national should be noted however, that the total figurescale, Machakos District had better organized does not include a total of 1.95 million poundspolytechnics than the average. which were spent on irrigation schemes, outside
Older people, particularly women, who of the main ALDEV program, or almostmissed out on education earlier, have taken 750,000 pounds which was spent on cottonadvantage of adult education classes so that they related programs in Coast and Nyanza Provincescan participate more fully in self-help groups, (ALDEV, 1962). The breakdown ofuse banks, and acquire information more easily. expenditures in Machakos District is shown inThe first pilot adult literacy scheme in Kenya Table 5.3(b). Some 325,000 pounds were spentwas planned for Kangundo in 1954 (RH: Penwill on the Yatta irrigation scheme, the main workspapers; Machakos District Development Plan, of which were in Machakos, but which also1953). However, the program seems to have served areas in Kitui district as well aslapsed, and in 1977 there were only 456 students Machakos. It facilitated settlement in the 1960s(Consortium, Report 7, 170). As part of a and arable farming, although the originalnational literacy drive, MIDP provided intention was to provide water for grazingadditional funds and in 1982 Machakos was one schemes. Another 335,000 pounds, or almost aof the national leaders in this activity, with quarter of expenditure, went on the Makueninearly 35,000 women and 4,000 men in classes. settlement. There was also some obvious
wastage, however. About 50,000 pounds wasGovernment as a Change Agent spent on a program of investigation and
development of water supplies in the lower,
Direct Government Programs more arid areas, which was eventuallyabandoned with little success. A similar amount
While the intensification of agriculture in the was spent on the development of sisaldistrict, discussed above, has been carried production, which also never took off and, whilethrough by the farmers, they clearly did not it appears to have been of particular value as aachieve the success described solely by their source of cash during the severe 1961 drought,own efforts. In fact it has been implied by it has since been virtually abandoned as a cashsome that the success in the district has been the crop. Later experience also showed that farmersresult of attention lavished by government over could settle themselves far more cheaply than inthe years. This response, though quite the supervised settlement scheme.commonly offered, should be treated with a The components of expenditure whichdegree of caution. The public efforts in the probably had the most lasting effect on the
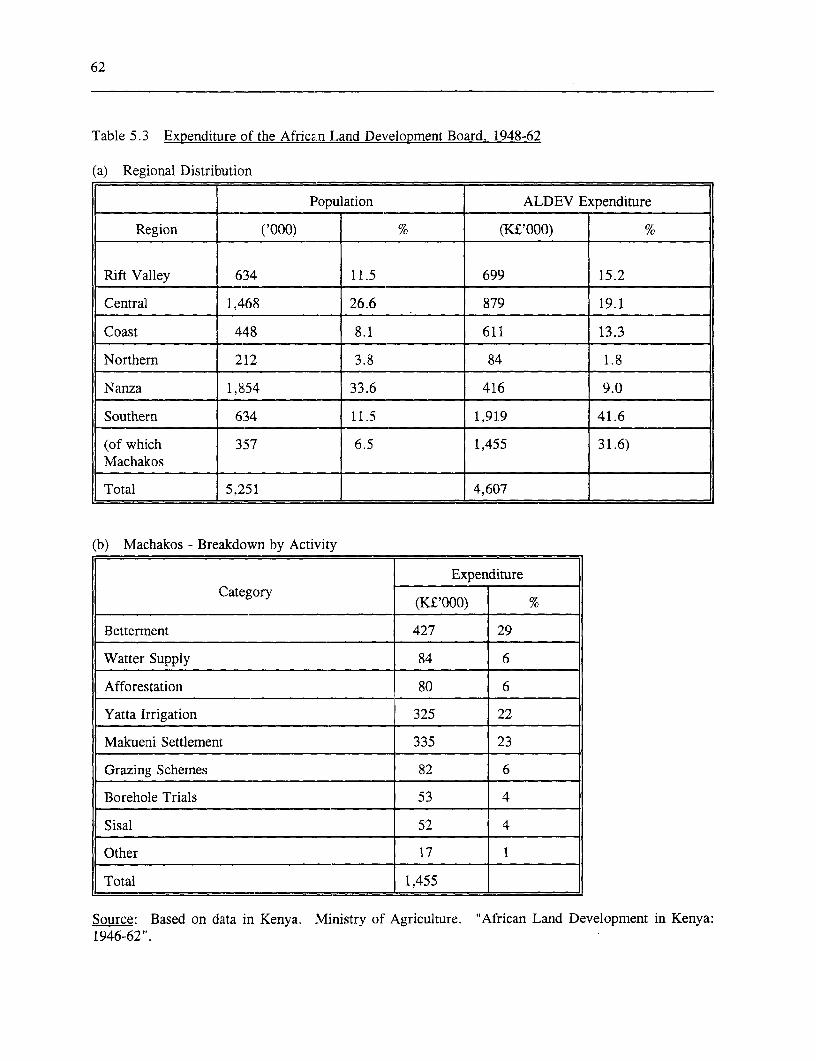
62
Table 5.3 Expenditure of the African Land Development Board. 1948-62
(a) Regional Distribution
.______________ Population ALDEV Expenditure
Region ('000) % (K£'000) _
Rift Valley 634 11.5 699 15.2
Central 1,468 26.6 879 19.1
Coast 448 8.1 611 13.3
Northern 212 3.8 84 1.8
Nanza 1,854 33.6 416 9.0
Southern 6:34 11.5 1,919 41.6
(of which 357 6.5 1,455 31.6)Machakos
Total 5,251 _ 4,607
(b) Machakos - Breakdown by Activity
ExpenditureCategory (K£'000) %
Betterment 427 29
Watter Supply 84 6
Afforestation 80 6
Yatta Irrigation 325 22
Makueni Settlement 335 23
Grazing Schemes 82 6
Borehole Trials 53 4
Sisal 52 4
Other 17 1
Total 1,455
Source: Based on data in Kenya. Ministry of Agriculture. "African Land Development in Kenya:1946-62 ".
63
development in the district as a whole were the (i.e., extension, research etc.) which may (as is"District Betterment" and water supply often the case) have tended to concentrate in theprograms, and the grazing area programs which more productive areas. However, a judgementincluded anti-tsetse efforts. The latter in fact as to the importance of the ALDEV program infacilitated settlement in the area by mixed the overall scheme of things is extremelyfarmers. In terms of overall expenditure these difficult to make. The long term effectivenesscomprised about 40% of the total. A large part of elements of the betterment program may beof the effort under the betterment program went questioned. It has been noted that theinto use of machinery for terracing and related maintenance of the narrow based terraces waswork for reconditioning "badlands" and for dam poor and therefore it may be assumed that theconstruction. Some 300 dams were built. These benefits derived by the local population fromwere mostly small and undertaken with ox- this effort were low. Much of this "investment"scoops and hand labor. Much of the terracing, was carried out by communal groups under greatin so far as it concerned narrow based terraces, pressure from the colonial administration. It iswas not adequately maintained, as we have seen. difficult to believe that local people in these
Beyond this infrastructural activity, a circumstances could not have found more costsubstantial effort was made to broaden the range effective investments to undertake with theirof agricultural activity and promote cash crops, time. In addition these forced labor programs,including fruits and vegetables. This activity combined with low rewards in agriculture,complemented and supplemented activities by encouraged young men to go elsewhere fortraders and a canning factory in a neighboring work, which also hampered intensificationdistrict. By the later fifties a regular trade in efforts by reducing the locally active proportiontomatoes shipped by air to Aden had developed, of the population.and a wide range of "improved" farming On the other hand, the ALDEVpractices were promoted by the agricultural programs must have left most rural land users atextension staff. least somewhat familiar with soil conservation
Also in the 1950s the national dryland methods, and with a range of alternativeresearch station was established at Katumani, products which had the potential to be saleablenear Machakos town. While its focus was for cash, and of technologies. Many of the cashnational, its presence in the area must have had crops whose production has expanded rapidly insome positive impact on agricultural change, recent years had been tried during this earliereven if only a few farmers actually visited it or period and this undoubtedly helped provide aobserved the results of trials from the roadside. basis for the later private sector activity. Other
Following Independence, ALDEV ideas promoted in the 1950s have not beenactivities were wound down and the relative subsequently picked up to any degree, e.g.,emphasis in official effort shifted to higher silage production, or are only now experiencingpotential areas elsewhere in Kenya, where the greater interest, e.g., composting.bulk of the population is situated. During theseventies and eighties specific programs for the Governancesemi-arid and arid areas were initiated, includingthe Machakos Integrated Development Project The effect of "good governance" onwhich began in 1979. Table 5.4 shows that development is currently the subject of muchduring this period expenditure in the district debate. Governance includes such things asunder the national Arid and Semi-Arid Lands political accountability and representation, the(ASAL) programs was about average for the rule of law, and effective, competentdistricts covered. administration. Concepts of good government
Thus, the major period during which the have varied over time, and have always beendistrict did receive a significant level of support subject to a difference between practice andwas through the ALDEV program prior to 1962. theory. At one end of the spectrum is theIt should be noted that this was outside the concept of a wise central government whichnormal effort to support indigenous agriculture takes decisions on the allocation of scarce
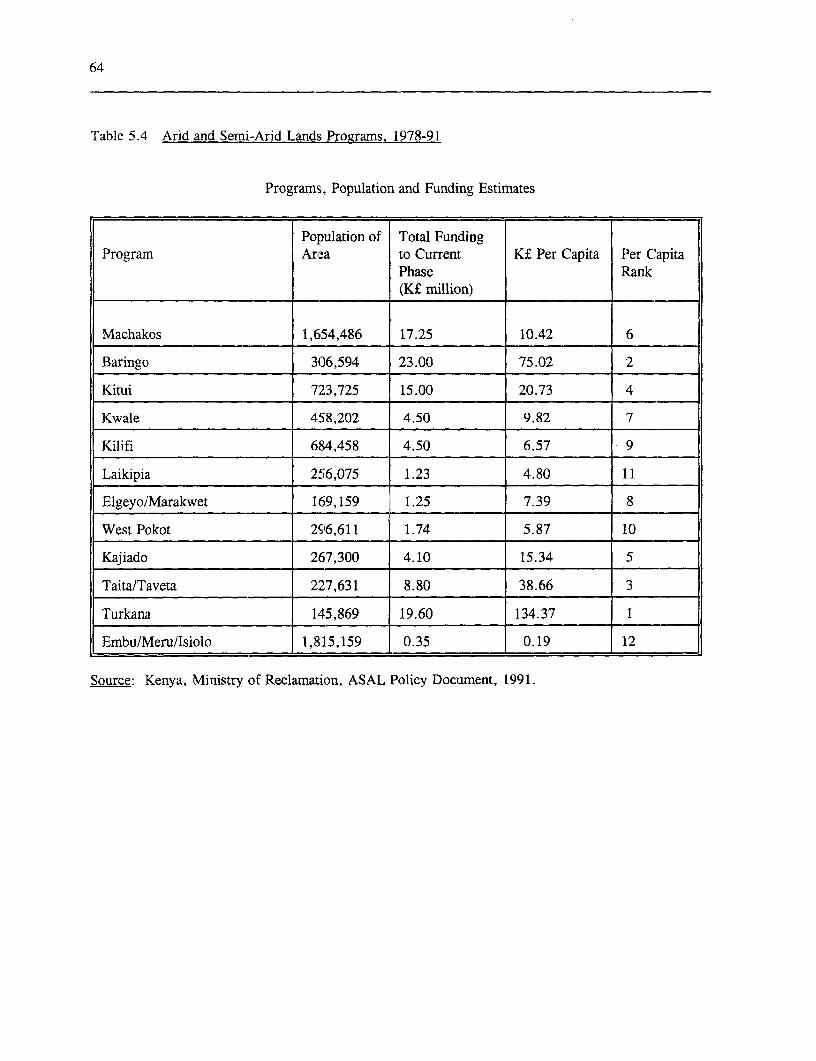
64
Table 5.4 Arid and Semi-Arid Lands Programs, 1978-91
Programs, Population and Funding Estimates
Poipulation of Total FundingProgram Area to Current K£ Per Capita Per C'apita
Phase Rank(K£ million) l
Machakos 1,654,486 17.25 10.42 6
Baringo 306,594 23.00 75.02 2
Kitui 723,725 15.00 20.73 4
Kwale 458,202 4.50 9.82 7
Kilifi 684,458 4.50 6.57 9
Laikipia 256,075 1.23 4.80 11
Elgeyo/Marakwet 169,159 1.25 7.39 8
West Pokot 296,611 1.74 5.87 10
Kajiado 267,300 4.10 15.34 5
Taita/Taveta 227,631 8.80 38.66 3
Turkana 145,869 19.60 134.37 1
Embu/Meru/Isiolo 1,815,159 0.35 0.19 12
Source: Kenya, Ministry of Reclamation, ASAL Policy Document, 1991.
65
national priorities; this central government may or through locally-based pressure groups. Theor may not be elected. In Kenya in the colonial latter have become constantly more effective andperiod it was not. In practice central now embrace a very large segment of the totalgovernments are subject to internal pressure population. On the whole government policiesgroups and external influences, either of which, have had much more positive results forif sufficiently powerful and organized, secure for development and conservation of naturalat least some of the time favorable policies or resources when they have been based on someallocations of resources. In the colonial period degree of consultation than when they have beenexternal influences were the Colonial Office in based on compulsion. For example, most of theLondon and UK public opinion. Since terraces built by compulsion in the 1940s andIndependence they have been aid agencies and early 1950s were not maintained; those built inpublic opinion in donor countries. association with mwethya groups in the late
A second concept is that planning and 1950s and by private investment in 1965-85,the allocation of resources should be from the (latterly with assistance and joint planning bybottom up, reflecting the wishes of the people in government officers and farmers under MIDP)their different localities. The fullest reflection of have lasted. Similarly, coffee, a requested crop,this concept is an elected local government with has always been more successful than cotton, aa wide range of powers including the allocation promoted and sometimes semi-compulsory crop.of revenues, some of which it itself raises. A Overall, a number of government effortsfinal concept is that of participation and consul- have assisted in increased organizational ability,tation either with small groups or on an ad hoc the uptake and development of new types ofbasis. Even centralizing governments acknow- enterprise, and the improvement of farms (andledge the need to adjust policies to local circum- thereby in upgrading overall land resourcestances, and find that implementation is easier management in the district). These are:where policies are acceptable to local people. (a) A long tradition of official
Independent Kenya has to a large extent community development support, goingevolved in the direction of a powerful central back to the 1950s.government, with elections in a one-party (b) Education. Education has beenframework, combined with consultation with and financed in part by government, in partparticipation by local interest groups. However, by families. While great sacrifices areas we have seen, these groups have become part made for secondary education, notableof national networks. They have become adept features in Machakos as compared withat manipulating politicians, influencing the the rest of Kenya is the almostallocation of government resources through universality of primary education, theunofficial channels. If they are unsuccessful self-help village polytechnics turning outwith the government, they have learnt how to craftsmen, and adult education. Suchget assistance from many other agencies. In education has improved informationMachakos District it was noticeable in talks with flows, provided backup services in thethe local leaders at village level that they all villages and, through the contribution ofthought they had much more influence over what educated children, brought in capital.they saw as their own government than when (c) The individualization of land tenurethey were under an alien colonial authority. through custom, reinforced byThey understood and could work the system. legislation and adjudication officers.This does not mean that they passively accepted (d) Increased agricultural information.govermnent plans or government inaction. The extension services have sufferedIndeed, self-help at local level can be in direct many weaknesses, but the majority ofconflict with government plans. farmers seem to have had contact with
The story in Machakos is one of constant them. New ideas have also come in viatension and swings of the pendulum between soldiering in the war, traders, andcentral government planning and local priorities farmers' exchange of ideas andas expressed either through elective mechanisms materials. An Akamba proverb is the
66
equivalent of seeing is believing: mentation may require complementary facilitiesdemonstrations (formal or informal) are which only governments can easily provide, orwhat count. it may require a change in government policy.Thus, during the period under One must also, therefore, be concerned with
consideration, Machakos District experienced those institutions which facilitate goodtremendous economic, social and political communication between government andchange. To be able to respond to these governed. Economic development reflects notsituations in a positive way, and improve the merely what is happening to the average farmer,overall standard of life, social structure became but also growth in the capacity of socialmore complex or differentiated, with more institutions. The emphasis here on the socialspecialized institutions. Clearly a key factor institutions which diffuse knowledge is based onenabling this to happen has been the mechanisms the belief that sustained economic growth over awhich facilitate the communication of long period of years can only be understood ifknowledge. To be effective, knowledge has to knowledge and the ability to apply it arebe implemented, which requires ability to raise considered as an additional factor of production.capital and organize labor. Successful imple-
67
6. Lessons of This Experience
Much, if not most, of the material presented in Backgroundthe preceding chapters will not have beensurprising to readers who are familiar with The development and resource managementagricultural and rural development in lower problem facing an area experiencing populationincome countries. Many studies have analyzed growth may perhaps best be summarized asdifferent aspects of such development and shown shown in Figure 6. 1, which is derivedsimilar responses to such conditions, or adoption essentially from Boserup. There are three basicof similar technologies. What this study does do alternatives open to the people of the area:is show the extent of the aggregate changes they can migrate (perhaps temporarily)which have been made by those living in elsewhere for work to obtain cashMachakos district over a period of two income. This is a relatively easy option.generations in response to the pressure on, and It requires little in initial capital andthreat to, their land resources. The photographs usually promises a better reward toshown in chapter 3 dramatically illustrate the labor than a deteriorating environment.physical expression of these changes. Chapters a second option is movement to and4 and 5 have shown that this gross change has development of new land, perhaps withbeen made up of many incremental changes and establishment of new settlement. Thishow the responses of the major parties involved may require considerable "capital."have interacted and contributed to this Eventually, if population continues totransformation. grow, a new resource constraint may
It is beyond the scope of this paper to develop.make a comparison with other countries in Sub- more intensive agriculture on aSaharan Africa, but it is fair to assert that the sustainable basis in the old area. ThisGovernments of Kenya have provided as will require that investments andconsistent a level of support for the agriculture technological changes are made whichsector over the past 40 years as any of the raise the output per unit of land fastergovernments in the region. This support has than population growth. The ability tobeen both technical and in promoting overall do this generally is dependent upon thecommercialization of the sector, even among incentives and opportunities provided bysmall farmers. Certainly Machakos district got access to markets. This process may inits share of this support but it would be a fact be assisted by adoption of the firstmistake to attribute the change which has option, outmigration, which improvesoccurred primarily to government initiatives. links with, and knowledge of, potentialCertainly, appropriate government actions are market areas, and can also providenecessary for the evolution of sustainable capital and new technical knowledge.farming systems and land management, but the The point we wish to make is thatresults of this study emphasize that they are by population growth in a rural area inevitablyno means sufficient to achieve this result. On entails change in farming and income systems.the other hand we do not wish to give the It is incompatible with maintenance of animpression that the processes discussed are existing extensive farming system, unless one ofautomatic and the major requirement is to get the first two options is open.markets operating and the rest will follow. This The experience in Machakos clearly fitschapter attempts to assess the developments in this framework. Outmigration for work to earnthe district against models of agricultural change cash had begun in the 1920s, and expandedunder population pressure and to draw out rapidly when military opportunities expandedgeneral development policy conclusions. during World War II. Restrictions on access
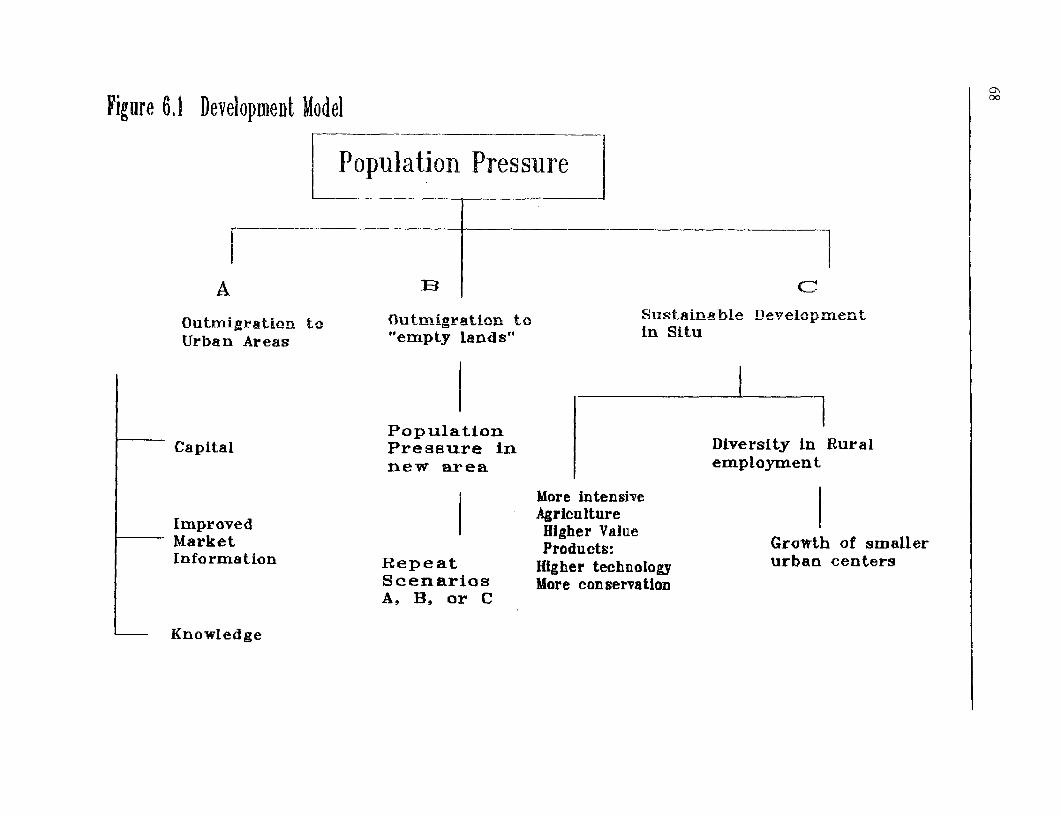
Figure 6A1 Development M1odel
Population Pressure
IA IEI
Outmijration to Ouitmigration to Sustainable DevelopmeentUrban Areas "empty lands" in Situ
I~~~~~~~~~~~~~~~~~~~~~ I Population
~ Capital Pressure in Diversity in Ruralnew area employment
More intensiveAgriculture
Markved Higher Value Gowho mlelMarkvet Products: Grotah of smallerlnformation Repeat Higher technology urban centers
ScenarioEs More conservationA, B. or C
Knowledge
69
prevented movement onto new lands at that time Perceptions of the "Problem"' and ofand were a factor in the destocking controversy. SolutionsGovernment did provide support for controlledmovement after the war, but more rapid However, other reviews of agriculturalmovement followed the relaxation of control in development in Machakos in the interveningthe late 50s. Intensification gradually took over
as te man thust f te efort s lad beame period have not been so sanguine as this report.as the main thrust of the effort as land became Bfr oigt ics h ao esn,Before moving to discuss the major lessonsoccupied and agricultural prospects improved. arising from the changes which have beenFuture trends are by no means certain but there achieved in Machakos district it will perhaps becould be a resumption of migration for work, or useful to consider the whole question of thean increase in non-agricultural activity in situ.
It ha freuenty bee assrtedthat perceptions which still underlay much of theIt has frequently been asserted that discussion of the land degradation "problem"povensificatyio an major con ainttothenaocess of and of the appropriate policy response to theintensification and of the maintenance of type of situation which was faced by the districtsustainable agricultural systems, especially under 50 years ago.pressure of population growth. In the 1930s There are two aspects to this. Firstly,Machakos was an area characterized by a the generally top down approach to thesubsistence based agriculture and incomes were perception of the problem and of the proposedcertainly low. In the 1940s food aid was "solutions." This is well characterized by theconstantly necessary, malnutrition certainly reports prepared in the late 30s and quoted inoccurred, and average incomes may have been chapter 2 of this report. The second aspect isdeclining. Despite this unpromising set of the whole perception of "change" under suchconditions, the people of the district have conditions and its impact. There is asubsequently been able to tackle their land presumption, implicit in much of the discussionmanagement problems, and poverty and of the land resource problem, that change inpopulation growth have not been precursors to farming systems in low income areas is forcedenvironmental degradation. However, success is by the pressure of population and will,not inevitable and the report has discussed a therefore, have an undesirable outcome, whichnumber of factors, external to the district which the local population is powerless to avoidhave helped provide an overall favorable without direct assistance and guidance.framework for change and development.
The study has also shown that, in The "Problem"Machakos District, the changes which have beenmade, and the greatly increased output which Blaikie (1985), has outlined what he has definedhas been achieved, have not been at the expense as the "classic approach" to land degradation.of the resource base. Fifty years ago there was . ,,a legitimate question as to whether the area 1 . the identification of anwhich is now Machakos District was not environmental problem with anbeginning to exceed its "carrying capacity" and environmental solution;to enter a cycle of increasing resource 2. subsistence oriented production;degradation. Clearly the dire predictions of the 3. an official perception of (a)time have not been realized. The question iswhether this is still a live prospect. The thrust misimanagem ent ouf theof this review has been to suggest that the environment by the users, andchanges which have occurred in the district, both b overpulton."in agricultural practices themselves and in Such a diagnosis tends to be assoclatedbroader social conditions, have meant that the with a three step approach to the problem.population is much better equipped to tackle the '1. identification of the problem as
serious - soil conservation andtypes of challenges posed by population growth land reclamation are urgentlyand limited land resources than it was two needed;generations ago. 2. technical measures requiring the
70
cooperation of the comrnunity chap 4). Given the relatively low total amountare recommended; of rainfall in each rainy season in Machakos it is
3. plans are implemented through a preferable to retain and utilize as much of thecombination of encouragement, rain as feasible, rather than recreate structures topersuasion, and subtle threats guide it off. However, the latter was thesometimes backed by more primary objective of the initial approachserious coercive powers. promoted by government. Thus, there was little
Key points to note are the lack of any or no benefit to the crops in place from theaccount of the position of the participant, and actions undertaken, and future benefits werethe reliance on experts." clearly uncertain. Subsequently, when the
The initial efforts in Machakos to improved bench type ("fanya juu") terracingaddress the land degradation issue arn a classic (which does help in water conservation and thusexample of this top down approach and its improved yields) was developed in the 1950s, itlimitations. The problem, as seen in the late was much more readily adopted.thirties, had been caused by the growth of The perceptions of the problem whichpopulation, dependant on subsistence oriented underlay the government approach have also, notproduction, and brought to a head by a series of surprisingly, been reflected in somre of theabnormally dry seasons. These were considered reviews of the situation in the district. Forto have exacerbated the problems resulting from example, in their wide ranging review ofpractices which led to overstocking, h.aphazard "Experiences with Agricultural Development incultivation techniques ancl a failure to respond to Tropical Africa," de Wilde et. al., writing inerosion caused by surface runoff. Given the 1964, were not optimistic on the outlook for theapparent position in the 1930s and 1940s, the district:colonial administration, looking at the condition "The last few decades have witnessedof the resource, pressed two main measures to repeated government efforts to improvecounteract the resource degradation then conditions through soil conservation andperceived; so as bunding to control and channel development of water supplies, generalrunoff to reduce erosion resulting from improvement in crop and animal husbandry andcropping; and reducing stocking rates to permit introduction of cash crops. Some limitedsome recovery of natural range and reduce success has been achieved. In the better anderosion there. higher areas the cultivation of fruits and
These were not unreasonable things to vegetables and, above all, of arabica coffeedo. However, they did not help -meet the developed, and in the lower and drier areas, theAkamba's main objectives. The latter, primarily production of sisal and, more recently, cotton.dependent upon subsistence production for their Yet standards of agriculture have remained verylivelihood, especially since the slump of the low over most of the district; virtually no1930s reduced the demand for their labor or improvement has taken place in animalother products, wanted to continue to have husbandry. The Kamba who inhabit the districtaccess to areas of land which they had used in have often been reproached for their lack ofthe past to meet their subsistence needs. interest in agriculture and in theirGovernment policy, restricting access to adjacent unresponsiveness to government efforts tograzing areas, reduced their ability to use their change them" (vol 2, p84).traditional drought strategies for livestock, i.e. And further: "The record in M[achakosrange further afield (chap 3). They saw has not been one of unmitigated failure. TheGovernment's solution as another method of partial rehabilitation of land resources, coupledrestricting their ability to achieve subsistence, probably with some improvements in agriculturaland resisted it. practices, has enabled the district to cope more
It probably did not help that the effectively with the problem of feeding itsapproach to erosion control, which depended on growing population.... Here and there othertechnologies developed in the US in the early signs of progress may be noted. By and large,and mid 1930s, may have been misguided (see however, the record has been disappointing.
71
Development has encountered many difficulties. before the rains, and forage for livestock.Owing to limitations of data, we found a Many of these innovations, as isdefinitive analysis of the reasons for the commonly the case, grew from and reinforcedcomparatively slow progress of Machakos one another. For example, use of forage helpedDistrict to be very difficult" (Vol 2 ppll7-118). maintain animals in overall better condition.
By the time de Wilde et. al. wrote, The improved condition of oxen made earliergovernment efforts to address the environmental cultivation, before the rains had softened up theproblems of the district had been in place for 15 soil, more feasible. In particular, it enabled thisyears or more. As Blaikie has noted, "The to be done with a two-animal team, which istypical response to the [apparent lack of success much more suited to operating on narrowwhich has often accompanied the] terraces than larger teams. What is more, usingimplementation of this [top down] approach has fewer animals reduces the cost and makes thebeen to find "escape hatches," blaming technology accessible to a larger proportion ofunfavorable weather, lack of cooperation by all farmers.different Departments, or lazy and uncooperative How does one get this process started?farmers." (Blaikie, 1993). This is essentially the People do those things which seem to contributeview as expressed in the de Wilde et. al. report. to the achievement of their overall objectives.The same spirit is still reflected in much of the For most people, at a minimum, these are thewriting and commentary on the land degradation survival of themselves and their family. Beyond"problem." that they are interested in higher levels of well
being. They will avoid, if they can, actionsThe Perception of Change which will put these objectives at risk. Clearly
for a community dependent upon land basedIn another report assessing the prospects for the production for subsistence or exchange,district, Bernard (in Consortium, Report 6, maintaining the land resource is a high priority.1978) quoted Hance 's list of 11 indicators of The greater the number of economically viablepopulation pressure, defined as a long term options open to an individual, the lower the levelprocess of deteriorating physical and human of overall risk and the easier it is to achieve aconditions. These indicators and our assessment range of objectives. Looking at what hasof the current situation with regard to them are happened in Machakos, in general the range ofindicated in Table 6,1. Contrary to Bernard's options open to land users has been increasingjudgements, which were based on observations and continues to do so. Change is essential toafter six consecutive dry years in the early/mid the process of adaptation, rather than something1970s (one of the worst runs in a century) it is to be resisted.clear that the thrust of the present study is that However, looking at the set of criteriathere is now no evidence of Machakos being used by Hance/Bernard, it is intriguing how theycaught up in such a vicious circle of do not reflect in any way the ability of thedegradation, and the overall perspective is population to manage change, or of the range ofclearly more upbeat than that of these earlier options open to resource users. Rather, thestudies. majority of them appear to reflect an assumption
The present study has illustrated the fact that change will be for the worse, e.g., use ofthat managing this resource base under marginal lands, breakdown of indigenousconditions of population growth and of economic systems, reduction of fallow. Yes, theseand social change is basically a story of changes have occurred, but the change has beeninnovation. The old methods of resource to improved systems which enabled better use tomanagement were no longer satisfactory and had be made of the resource base. A number of theto be changed. New methods had to be other indicators are primarily symptoms ofdeveloped, tried, and modified. A few of those problems which, in many cases, can bewhich were perhaps most important here were ambiguous in their effects, e.g., indebtedness.terraces (and the means of constructing them), What one does not see are indicators which getcontour cultivation with oxen, land preparation
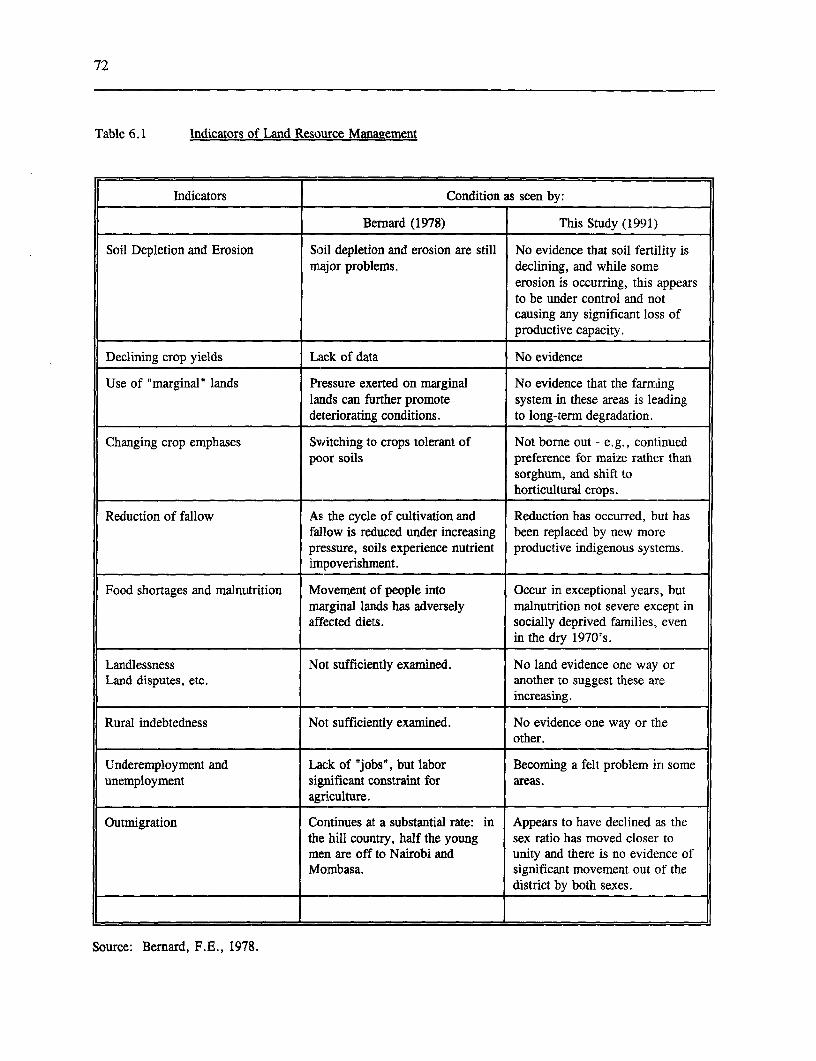
72
Table 6.1 Indicators of Land Resource Management
Indicators Condition as seen by:
Bernad (1978) This Study (1991)
Soil Depletion and Erosion Soil depletion and erosion are still No evidence that soil fertility ismajor problems. declining, and while some
erosion is occurring, this appearsto be under control and notcausing any significant loss of
l__________________________ productive capacity.
Declining crop yields Lack of data No evidence
Use of "marginal" lands Pressure exerted on marginal No evidence that the farminglands can further promote system in these areas is leadingdeteriorating conditions. to long-term degradation.
Changing crop emphases Switching to crops tolerant of Not borne out - e.g., continuedpoor soils preference for maize rather than
sorghum, and shift tohorticultural crops.
Reduction of fallow As the cycle of cultivation and Reduction has occurred, but hasfallow is reduced under increasing been replaced by new morepressure, soils experience nutrient productive indigenous systems.impoverishment.
Food shortages and malnutrition Movement of people into Occur in exceptional years, butmarginal lands has adversely malnutrition not severe except inaffected diets. socially deprived families, even
in the dry 1970's.
Landlessness Not sufficiently examined. No land evidence one way orLand disputes, etc. another to suggest these are
I_________________________ increasing.
Rural indebtedness Not sufficiently examined. No evidence one way or theother.
Underemployment and Lack of "jobs", but labor Becoming a felt problem in someunemployment significant constraint for areas.
l _______________________________ agriculture.
Outmigration Continues at a substantial rate: in Appears to have declined as thethe hill country, half the young sex ratio has moved closer tomen are off to Nairobi and unity and there is no evidence ofMombasa. significant movement out o:f the
district by both sexes.
Source: Bernard, F.E., 1978.
73
at the basic processes of change which have been productive.occurring: intensification of production; changes On the other hand this study has shownin capital:labor ratios and shares of marketed that there were a number of changes in train atproduction; new leadership patterns in the the time that de Wilde et.al. wrote which werecommunity; technical change; and rises in the strengthening the ability of the farmers in thelevel of knowledge. The approach of the district to innovate and to solve problems as theypresent study was designed to identify such arose; the broadening base of local leadership;changes. the growth of development oriented social
Similarly, there are also implicit groups under the leadership of the churches andassumptions in the approach of de Wilde et. al. others; the steady increase in marketedwhich may have made it likely that their review production; new land appropriation bywould lean on the pessimistic side. "The last individuals; travel and education; and growth offew decades have witnessed repeated government local enterprises and marketing systems.efforts to improve conditions through soil Characteristic of the period under review is anconservation... The Kamba who inhabit the expansion in the number and complexity ofdistrict have often been reproached for their lack institutions which convey and processof interest in agriculture and in their knowledge, or which allow manipulation of theunresponsiveness to government efforts to changing economic and political situation, and achange them"(vol 2, p84). There is a tendency broadening of the leadership base at villagehere to place the primary onus for fostering level. Furthermore, the political process madeadaptation by the local population to changed both necessary and possible directcircumstances onto government programs. communication between politicians andAside from anything else, in conditions such as supporters, and thus more direct access tothe drive for independence in the 1950s, any government. As a consequence, people feelgovernment initiatives were likely to be viewed somewhat more in control of their lives; theywith suspicion. Furthermore, there is no still have to contend with an uncontrollable andguarantee that the approach pushed by uncertain environment, and have only limitedgovernment would be the most appropriate in the means to affect general government policies,circumstances. De Wilde et.al. do hint at this but, as compared with the colonial period, theyquestion, e.g.,.; " On the other hand, some are more able to pool knowledge, capital, anddoubts have been thrown on the past methods of labor on private and community projects and tohandling the Kamba. For example, one achieve improvements at the farm and villageinvestigation has led one anthropologist to the level. This has led to a greater expansion ofconclusion that the "Kamba are not resistant to facilities at village level, at little cost tochange unless the change is phrased in terms of government. Many of these facilities (schools,coercion; indeed in many areas they welcome it" roads, bars, shops, etc.) have still further(Oliver p. 424) If this judgement is sound, the expanded information exchange. The self-helpvirtual mobilization of the Kamba in the groups pull in capital and expertise from nationalagricultural rehabilitation and improvement and international sources to supplement localprograms of the 'fifties could have engendered self-help, through upward links to the politicaldeep-seated and long-lasting reactions, entailing system, the churches and other NGOs. Manyunfavorable consequences which outweighed the rural families belong to a self-help group; mosttemporary or partial successes achieved"(de are also church members.Wilde et.al.p 118). The results of the present Capital for the improvement of farmingstudy indicate that, while the effect of the has come mainly from extended familyprograms in the 40s and 50s may not have been resources. Within the family, capital flowsas dramatic as this forecast, the researchers for between different enterprises, and betweenthis study were struck in 1990 by the way older members based in the village and relatives wholeaders still recalled the 1950s as a time of have achieved good positions in urban areas duehardship and oppression. The earlier coercive to their education. Families have investedprograms may at best have been counter- heavily in education, both through payment of
74
fees for their own children, and through their process which we term development. Thisself-help support to schools, etc. Education and challenge requires the society to be able to makethe church have helped to change the family, effective use of the knowledge and thewhich suffered stress due to male out-mnigration, technologies which are available and to adaptbut which has proved in most cases sufficiently them to their particular circumstances. Whereflexible to survive. Within the family as within individuals cannot tackle the problems bythe village, women are now playing a greater themselves, there have to be, within the group,role in decision-making, so that the talents of all structures which can be used to mobilize themembers are now more fully utilized than when human or other resources necessary. (These maysociety was dominated by male patriarchs. be formal or informal structures). Clearly such
a response is more likely when the society doesConclusions not have a rigid social structure which inhibits
individuals, or subgroups from collaborating,
Clearly every situation is to some extent unique e.g., rigid barriers based on factors such asand some of the factors noted above are sui religion, ethnic or political group, sex, class,generis. Are there any general conclusions and caste.which can be drawn from this study iFor policy Third, the study has shown thaton combatting land degradation? managing the land resource base under
First, what has happened in Machakos conditions of population growth and of economiccalls into question approaches which are based and social change is basically a story ofon a static view of the resource management innovation. Thus, conditions likely to fosteroptions available in an area e.g.,. as exemplified effective land resource management by farmersby the concept of carrying capacity, or calls to are also likely to be the same as those whichprevent the fallow periods in shifting cultivation foster agricultural innovation in general.systems from falling below a certain level Programs which focus heavily on promoting one(which thereby prevents the development of or two soil conservation technologies, perhapsmore intensive and sustainable continuous with some form of subsidy to overcome farmers'cultivation systems). In part this type of perceived reluctance, may have limnitecd impact.approach was tried in the destocking campaign In particular approaches based on the belief thatand abandoned. The present levels of what is required is "getting farmers to adoptproduction in the district far exceed anything ways which will enable them to increasethat might have been contemplated in the 1930s agricultural production in a sustainable way,as the appropriate "carrying capacilLy," and while there is still time to avoid the worst,"orattempts to have held levels of use to such that the problem is a "failure to promotestandards would have been disastrous. While resource conserving, environmentally sound,what has happened in Machakos may not be the agricultural practices aggressively enough," arenorm, it is also not unique. Production systems not likely to be successful, and may beare being intensified in many areas and it is not counterproductive.clear that the evolving systems are not Fourth, this experience also stronglysustainable. Currently, bans on the uprooting of suggests that the most important factor incoffee may be inhibiting dLesirable adaptation in addressing land degradation is to increase thethe same way that bans on planting coffee did viable land use options available to land users.earlier. This is highly unlikely to be achieved through
Second, the above discussion appears to public sector efforts alone. It is noticeable thatplace the land resource management issue half the new "technologies" listed in Table 4.4squarely in the middle o:f the larger issue of are new crops, almost all of which have beendevelopment. Managing the land resource in solely grown for sale, and almost all cf whichconditions of climatic variability, population were introduced through private traders. In thepressure and low incomes is a severe challenge sixties and seventies international cornmodityfor a society, but it's ability to do so requires markets were growing rapidly enough thatattributes that are part and parcel of the whole publicly sponsored programs to promote one or
75
two export cash crops among smallholders could estimate of the cost of such work, the total sumhave a marked effect in generating cash incomes involved must exceed $50 million at 1990and provide a basis for agricultural change. prices. In addition they have made considerableHowever, these markets are themselves subject investments in trees, including coffee, citrus andto change and cash sales are based more on local woodlots, dams and buildings. However, thisurban markets (or those of adjacent countries) or has been done without significant use of "credit"on the wider range of exotic products for which in any formal sense. Cash earned from externalinternational demand is growing. The relative work and from sales of agricultural productsshift in Machakos is dramatically illustrated in have supported the use of the families' ownFigures 3.2 and 3.3. The importance of this labor (or that mobilized through groups) andchange was that it provided the farmers with paid for those necessary cash inputs. This callsadditional production options outside of the into some question the standard claim that credit"menu" offered through official channels. In is essential for effective soil resourcethis regard, market access was greatly facilitated conservation.by the fact that the Machakos districtheadquarters is only 60 km from Nairobi, the The Broader Land Use Issuenational capital and largest city and market, withits airport providing rapid access to international There is perhaps a broader set of issues relatedmarkets. to sustainable land use in the context of a small
Fifth, both the importance of a wide region like Machakos. One point is that it isrange of potential products, and of the multiple highly unlikely that the district can continue tosources of innovations, indicate the need to support an ever increasing population using theencourage as broad a range of contacts between same pattern of production as it does now. Thea given area and the economy and society as a proportion of non-farm population has beenwhole. This may mean measures to facilitate increasing and will almost certainly continue torather than discourage seasonal migration to do so, and the share of direct agriculturalgenerate income and broaden contacts. production in total income will fall. ProximityDiscouragement of outmigration reinforces the to Nairobi and the resultant easy access tosubsistence orientation of the production system markets and communications will facilitate thisand reduces the development of markets for process.alternative products, thus limiting the potential As this process continues is there reasonflexibility of the production systems and making for concern that the likelihood of a land-the adoption of a resource conserving pattern of degrading pattern of use will increase? It is notproduction less likely. clear why. As income and population continue
Sixth, the study further highlights the to increase and the economy shifts to non-importance of the compatibility of new agricultural activities, the land base will becometechnologies, or activities, with existing farming more of a consumption than a production good.systems, and the desirability of farmers being People will continue to live in the districtable to experiment with these technologies etc. because they like it and it is "home."and modify them to fit their own particular Therefore, they will be likely to want toneeds. This means that the required changes in maintain the land resource base both as a c.apitalproduction systems should preferably be asset and as an attractive part of theincremental rather than fundamental and, if environment.feasible, the technology should be divisible, This issue gets to the heart of the(i.e., its introduction should not be a matter of question of land use decisions under conditions"all or nothing"), and complex packages should of reasonable stability, alternative economicbe avoided. opportunities, and functioning markets. Such a
The farmers of Machakos have made a situation is illustrated by the results of a study ofvery large investment in their land resources. the management of woodlots in Muranga'aMore than 200,000 ha of land has been terraced, district, Kenya (Dewees, 1993). That studyat least to some degree. Even on a conservative examined the factors related to the decision to
76
clear or to establish woodlots, and compared which have taken place over the past halfsamples of households which had cleared a century, which in some periods did disruptwoodlot in the previous 20 years or which were family life but have not caused sufficient turmoiloperating a woodlot at the time of the survey to lead to abandonment of land etc. and,(1990). This showed that the mean slope of although hardly any farmers have formal titles toplots used for wattle woodlots was greater than their land, the traditional land occupancyfor other uses, and that used for household arrangements provided adequate security for thecompounds was least sloping, and also that users. Similarly the overall economicannual crops were grown on more gently sloped environment has been reasonably stable andplots than perennials. This strongly suggests access to markets has been maintained. Thethat farmers are aiming for sustainable use in evidence obtained by the study sugges,ts that thetheir choices. farming systems which have been developed are
In the same study, logistic regression sustainable. There are variations in theanalysis showed that changes in land use performance of individual farmers, but thataccompany changes over time in household should not override the general picture.composition. The likelihood that a household Many readers will ask how applicableestablishes a woodlot increases as the number of this picture is to developing countries in generalnon-resident members of the immediate family and to sub-saharan Africa in particular and,increases. This is linked with the age structure thus, whether the results are generalizable.of the household. Woodlot establishment While the external economic environment facedbecomes more common as households age, by the land users of Machakos may have beenwhich may reflect constraints on labor supply, relatively favorable, the initial physical andbut also more general resource use strategies. social conditions they faced were not easy.Thus, older households are likely to have lower Other studies, although not specificallycash demands for items related to their children, addressed towards land resource management,such as school fees, and are less likely to want indicate similarly active innovation in farmingto extract every possible cent of income from the systems in directions which would enhanceland. Also, for land which will be eventually rather than reduce sustainability (e.g., see Speirspassed on to the next generation, parents may and Olsen, 1992 and Ay, 1992).have an incentive to estlablish a crop which, The present study has suggested t'iatwhen harvested, yields a significant amount of greater attention be focussed on the ove?:allcapital, while being easy to manage in the conditions facing farmers and less on measuresinterim. Decisions of this type suggest that which tend to micromanage their resources. Infamilies take a long-term view in making their other words, focussing on measures to improveland use choices, and aim to enhance the value accessibility to markets (including improvementsof the resource, if possible. in infrastructure and transport) and the operation
of markets themselves, thus facilitatingcommercial activities. This would include
Implications measures to develop an environment in whichthe options open to land users are not sharply
The overall results of this study convey a limited, e.g., by actions such as closure ofrelatively upbeat story of land resource markets because of quotas or monopoly controlmanagement. Production in value terms has by small groups, credit, excessive bureaucraticincreased markedly, partly through increases in red tape, corruption, and rigid centralizedphysical outputs from the district, and partly planning. Under present economic and socialfrom changes in the farming system towards conditions in many parts of Africa, this is nothigher value products. While significant easy, but much experience (see Lete et.al.)attention is given by farmers to basic household shows that without such improvements ]little willfood needs, the farming system is clearly be achieved.commercially oriented. The study hasdocumented the considerable social changes
77
Implications of This Approach for Land focussing on land management aspectsResource Management Strategies of technologies being adopted by
farmers, e.g., planting densities,The above conclusions have a number of cultivation techniques, use of cropimplications for land management and related residues, to determine practices whichagricultural development policy. Broadly facilitate soil management. Given thespeaking they argue for an indirect rather than a resource constraints facing manydirect strategy for land resource management. national, publicly funded researchThey also suggest that the primary focus should systems, active collaboration withbe on measures to create the conditions in which informal groups with research interests,agricultural innovation and change is likely to e.g., church or other NGQ basedflourish rather than to attempt to force land groups, can have a significant payoff,users to adopt specific land use practices. This especially in improving the farmer-suggests the following areas of emphasis: researcher dialogue.- Infrastructure. The report has implied - Other linkages. Where, because of
the value of a market led approach to remoteness or other physical limitationsagricultural development and land to production, few if any viable landmanagement. This places prime uses can be developed, emphasis mightimportance on measures which will raise be placed on facilitating outmigration onthe farm level profitability of a seasonal or permanent basis or onagricultural production through increases other measures to improve economicin the efficiency of supporting sectors. and/or social linkages to the broaderThis will include the development of economy and society.physical and institutional infrastructure - Land use policy. This report has tendedto foster the development of the to imply that reliance can be placed oncommercial systems for marketing, input a "laissez-faire"!" market-oriented"supply, etc., measures to eliminate approach to land resource management.marketing or input supply bottlenecks, This clearly has its limitations whereincluding corrupt practices. external effects are significant, (e.g.,
- Agricultural extension. Once farmers effects of gullying on upstream orstart to respond to market demands they downstream occupiers, or of release ofwill begin to modify their technology to pollutants, or where land has high valuemeet market requirements and will for some non-market use, (e.g., as agenerate requirements for additional biological reserve). In these conditions aknowledge. Extension should be in a zoning policy, or legal restraints will beposition to respond to these needs and required.seek out solutions, rather than promoteexternally determined messages. In Further Researchparticular the study suggests that lessemphasis be placed on complex Much of the approach to land degradation"packages," especially those that imply problems has been based upon physicalthat the farmer will be a full time perceptions of what constituted environmentaloperator. problems, e.g., reduced numbers of trees,
- Agricultural research. The research- changes in range composition, and reductions inextension link should be a bottom up nutrient elements in tested soils, and theone with an emphasis on response to adoption of physical practices designed toextension identified problems. directly counter these characteristics. The initialEspecially under conditions where soil approach of the colonial authorities in Machakosmanagement is difficult, e.g., sloping District was of this type, forcing adoption ofareas with soils subject to erosion, terracing and destocking. The study hasemphasis might be given to trials suggested the benefits of a more indirect
78
approach, the elements of which have been of hindsight, too pessimistic. This leaves usoutlined above. However, there are a number of with the question of what they should have beenareas where additional research would be looking at in order to get a better fix on the realvaluable in strengthening these conclusions. We situation. What are the relevant indicators of awould argue that the Machakos case is by no capacity to respond to the land managementmeans an isolated example of the development of challenge? This is a particularly relevant issuesustainable, intensive farming systems. Further if we are to move away from the heavilywork identifying the principal characteristics of physical identification/response syndrome whichthese systems and the key factors in their has been the norm in the past.development would provide useful guidance in The Machakos experience stronglythe development of policies to foster them. suggests that the key role for public policy in theSimilarly, a limited nuraber of case studies of area of land resource management is to focus onother examples of land management successes those actions which will help facilitate a processand failures would also throw light on key of change. This includes support of basicfeatures of this process. educational services, provision of basic physical
Most specifically, it was noted earlier infrastructure such as roads andthat the Bank sponsored study of agricultural telecommunications, avoiding attempts todevelopment in Africa (De Wilde et. al) misread monopolize political and related power,the situation in Machakos. Hindsight shows provision of an appropriate legal framework forthat, at the time they were reporting on the poor secure access to resources and management ofprospects for the development of a sustainable enterprises, and fostering plurality in ideas andsystem in the district, the elements of the activities such as research so as to broaden thecurrently used system were being developed, and range of alternative approaches to problemsthe district was developing the capacity to which can be tried. The principal lesson ofrespond to the land management. challenge. Machakos is that, under such circumstances, oneBernard et. al. also examined a number of can be reasonably confident that the landindicators in the later 1970s, but came to resource will be managed in a sustainableconclusions which were also, given the benefit manner.
Bibliography 79
Bibliography
Ackello-Ogutu, C., 1991. "Livestock creativity rather than backwardness,"Production," In Tiffen, M. (ed), Ceres. Vol 13 No4; pp23-26."Environmental Change and Dryland Biggs, S.D., 1989. "A Multiple Source ModelManagement in Machakos District, of Agricultural Research andKenya, 1930-1990: ProductionProfile." Technology Promotion." AgriculturalLondon; ODI Working Paper No. 55. Administration Network Paper No 6,
ALDEV, 1962. "African Land Development in London Overseas Development Institute.Kenya, 1946-62." Nairobi: Ministry of Biot, Y., P. Blaikie, S. Jackson, and R. Palmer-Agriculture, Animal Husbandry and Jones, 1993. "Rethinking Research andWater Resources. Land Degradation in Developing
Bahemuka, J.M. and Tiffen, M., 1992. Countries." Washington, D.C. World"Akamba Institutions and Bank, Environment Working Paper No.Development," In Tiffen, M., (ed), _ (Forthcoming)."Environmental Change and Dryland Blaikie, P. 1985. "The Political Economy ofManagement in Machakos District, Soil Erosion in Developing Countries."Kenya, 1930-1990; Institutional London, Longman.Profile," London; ODI Working Paper Boserup, E. 1965. "The Conditions ofNo 62. Agricultural Growth. London: Allen
Barber, R.G. 1983. "The magnitude and and Unwin.sources of soil erosion in some humid Boserup, E. 1981. "Population andand semi-arid parts of Kenya and the Technological Change; A Study of Longsignificance of soil loss tolerance values Term Trends." Chicago: University ofin soil conservation in Kenya," in Chicago Press.Thomas, D.B. and Senga, W.M., eds. Consortium for International Development;"Soil and Water Conservation in Kenya: Hash, C.T. and Mbatha, G. 1978.Proceedings of the Second National "Kenya Marginal/Semi-Arid Lands Pre-Workshop, Nairobi 10-16 Marchy, investment Inventory. Report No. 31982." Nairobi: Institute of Economics: the economics of small-Development Studies, University of holder agriculture in two areas of theNairobi. semi-arid lands of Kenya: Final
Barnes, R.C.. 1937. "Report on the Ukamba Report." Mimeo prepared for theReserve, July 1937 - Memorandum on Government of Kenya.Soil Erosion, Ukamba Reserve KNA Consortium for International Development;DC/MKS/lOA/29/1 unpublished Mutiso, G.C.M. 1978. "Kenya
Bernard, F.E., 1978. "Population Pressure in Marginal/Semi-Arid Lands Pre-Machakos and Kitui Districts": in Investment Inventory: Report No. 7;Consortium for International Institutions." Mimeo prepared for theDevelopment; "Kenya Marginal/Semi- Government of Kenyua.arid Lands Pre-investment Inventory: Dewees, P.A. 1993. "Trees, Land, andHuman Resources and Social Labor." Washington, World BankCharacteristics. Final Report: Machakos Environment Paper No. 4./Kitui/Embu - Baring/Kerio Valley, " de Wilde, J.C. et.al., 1967. "Experiences withReport No 6. Mimeo prepared for the Agricultural Development in TropicalGovernment of Kenya. Africa." 2 Volumes. Baltimore, Johns
Biggs, S.D. 1980. "Informal R&D: the failure Hopkins Press.of farmers to adopt new technological Ecosystems LTD., 1986. "Baseline Survey ofpackages entirely may be a sign of machakos District 1985: Report to the
80 B:ibliography
Machakos Integrated Development Kioko, J.N. 1973. "Report on SoilProgramme." Vols. a,b.,c and d. Conservation in Kyangala sub-location,Nairobi, Ecosystems. Kalama Location, Machakos District."
Farah, K.O., 1991. "Natural Vegetation," In Unpublished manuscript, University ofMortimore, M., (ed), "Environmental Nairobi.Change and Dryland Management in Lele, U. and Stone, S.W. 1989. "PopulationMachakos District, Kenya, 1930-1990: Pressure, the Environment andEnvironmental Profile." London; ODI Agricultural Intensification in Sub-Working paper No 53. Saharan Africa: Variations on the
Forbes-Munro, J. 1975. "Colonial Rue and the Boserup Hypothesis." Washington,Kamba: Social Change in the Kenyan World Bank, MADIA Discussion PaperHighlands, 1889-1939." Oxford, 4.Clarendon Press. Lindblom, K.G. 1920. "The Akamba of British
Gichuki, F.N., 1991. "Environmental Change East Africa," Uppsala:and Dryland Management in Machakos Logan, W.E.M., 1948. "Forest Reservation inDistrict, Kenya, 19:30-1990: Machakos Native Reserve. " Report toConservation Profile." London; ODI the Conservator of Forests. KenyaWorking Paper No 56. National Archives, Nairobi.
Gielen, H. 1982. "Report on an Agroforestry Lynam, J.K., "AN Analysis of PopulationSurvey in Three Villages oiF Northern Growth, Technical Change and Risk inMachakos, Kenya." Wageningen; Peasant, Semi-arid Farming Systems, aICRAF. Case Study of Machakos District." PhD
Hance, W.A. 1970. "Population, Migration, Thesis, Stanford University.and Urbanisation in Africa," New Maher, C. 1937. "Soil Erosion and LandYork, Columbia University Press. Utilisation in the Ukamba Reserve
Hayes, J.J. 1986. "Not Enough Wood for the (Machakos)," Report to the DepartmentWomen: How Modernization limits of Agriculture.access to Resources in the Domestic Matingu, M.N. 1974. "Rural to RuralEcomnomy of Rural Kenya" MA Migration and Employment: A CaseThesis, Clark University. Study in a Selected area oi. Kenya."
Heyer, J. 1966. "Agricultural Development and Unpublished MA Thesis, University ofPeasant Farming in Kenya," Nairobi.Unpublished PhD Thesis, University of Mbithi, P.M. 1971. "Social Differentiation andLondon. Agricultural Development in East
Heyer, J. 1967. "The Economics of Small Africa.," Unpublished PhD. Thesis,Scale Farming in Lowland M[achakos," Cornell University.Occasional Paper no. 1. Nairobi: Mbogoh, S.G., 1991, "Crop Production" inSocial Science Division, Institute of Tiffen, M. (ed), "Environmental ChangeDevelopment Studies, University of and Dryland Management in MachakosNairobi. District, Kenya, 1930-1990: Production
Jaetzold, R. and Schmidt, H. 1983. "Farm Profile." London; ODI Working PaperManagement Handbook of Kenya No. 55.Volume 2," Nairobi, Kenya: Ministry of Mbula, J. 1974. "Penetration of ChristianityAgriculture. into the Akamba Traditional Family."
Kaluli, J.W., 1992. "NGOs and Technical Unpublished MA Thesis, University ofChange," In Tiffen, M., (ed), Nairobi."Environmental Management and Mbula, J. 1977. "The Impact of Christianity onDryland Management in Machakos Family Structure and Stability: the CaseDistrict, Kenya, 1930-1990: Institutional of the Akamba of Eastern Kenya."Profile," London; ODI Working Paper Unpublished PhD Thesis, University ofNo 62. Nairobi.
Bibliography 81
Mbuvi, J., 1991. "Soil Fertility," In Unpublished MSc. Thesis, University ofMortimore, M., (ed), "Environmental Nairobi.Change and Dryland Management in Ondiege, P.O. 1992. "Local Coping StrategiesMachakos District, Kenya, 1930-1990: in Machakos District, Kenya," In:Environmental Profile." London; ODI Taylor, D.R.F. and Mackenzie, F.Working Paper No 53. (eds), "Development from within:
Mortimore, M., 1992. "Environmental Change Sorvival in Rural Africa." London,and Dryland Management in Machakos Routledge.District, Kenya, 1930-1990: Tree Otieno, A.K. 1984. "Soil Erosion inManagement." London, ODI Working Ukambani: A Geographical andPaper No 63. Historical Perspective," MA Thesis,
Mortimore, M. and Wellard, K., 1992, Ohio State University"Environmental Change and Dryland Overseas Development Institute (ODI) 1982.Management in Machakos District, "Machakos Integrated DevelopmentKenya, 1930-1990: Profile of Programme, Phase 1: Evaluation."Technological Change," London; ODI Unpublished Report.Working Paper No 57. Owako, F.N. 1969. "The Machakos Problem:
Mortimore, M., Essiet, E.U., and Patrick, S.P. A Study of some aspects of the agrarian1990. "The Nature, Rate, and Lirnits of problems of Machakos District ofIntensification in the Farming System of Kenya" PhD Thesis, University ofthe Kano Close Settled Zone, Nigeria." London.Report to the Federal Agricultural Peberdy, J.R. 1958, "Machakos DistrictCoordinating Unit, Ibadan, Nigeria. Gazetteer." Kenya: Machakos District
Mukhebi, A.W., 1981. "Income and Office, Ministry of Agriculture.Employment Generation in Kenyan Pagiola, S., "Cost-benefit analysis of soilSmall-Scale Agriculture," PhD Thesis, conservation," Chap 2 in: Lutz, E.Washington State University. Pagiola, S., and Reiche, C.,
Mung'ala, P., and Openshaw, K., 1984. (Forthcoming), "Economic and"Estimation of present and future Institutional Analysis of On-Farm anddemand for woodfuel in Machakos Water Conservation Projects in CentralDistrict, Kenya," In: Bames, C., America and the Caribbean."Ensminger, J., and O'Keefe, P., (eds), Washington, World Bank."Wood, Energy, amd Households: Parry, M.L., Carter, T.R. and Konijn, N. eds.Perspectives on Rural Kenya." 1987. "The Impact of ClimaticStockholm/Uppsala: The Beijer Variations on Agriculture. Vol 2:Institute/Scandinavian Institute of Assessments in Semi-Arid Regions,"African Studies. Dordrecht: Kluwer Academic
Mutiso, C.G.M. 1975. "Kenya: Politics, Publishers.Policy and Society." Nairobi, East Parsons, B.T. 1952. "Makueni Vegetation."African Literature Bureau. Unpublished Manuscript, Archives of
Mutiso, S.K., Mortimore, M, and Tiffen, M., Kenya.1991. "Rainfall," In: Mortimore, M. Parton, K.A., 1990. "Central issues in the(ed), "Environmental Change and development of tecnologies for resourceDryland Management in Machakos poor farmers: A socioeconomicDistrict, Kenya, 1930-1 990: perspective. " KARI-ACIAR-CSIROEnvironmental Profile." London; ODI Symposium "A Search for Strategies forWorking Paper No 53. Sustainable Dryland Cropping in Semi-
Onchere, S.R. 1976. "Structure and Arid Eastem Kenya." Nairobi, 10-11Performance of Agricultural Product and December, 1990.Input Markets in the Northem Division Peberdy, J.R. 1961, "Notes on Some Economicof Machakos District, Kenya." Aspects of Machakos District, "
82 Bibliography
Machakos; District Agricultural Office. Sahel." Washington, World Bank,Peberdy, J.R. 1958. "Machakos District Technical paper No. 179.
Gazetteer." Kenya: Machakos District Thomas, D.B., 1974. "Air Photo Analysis ofOffice, Ministry of Agriculture. Trends in Soil Erosion and Land Use in
Penwill, D.J. 1957. "Kamba Customary Law." Part of Machakos District," MSc.London, Macmillan. Thesis, Reading University.
Perham, M. ed. 1959. "The Diaries of Lord Thomas, D.B., 1991. "Soil Erosion," inLugar: Vol 1." London: Faber and Mortimore, M. (ed): "EnvironmentalFaber Change and Dryland Management in
Pollard, S.J., 1981. "Report on the Machakos District, Kenya 1930-1990:Nzaui/Machakos Farming Systems Environmental Profile," London; ODIStudy, Nov. 1980 to Feb. 1981," Working Paper No 53.Agricultural Economics Unit Report, Throup, D.W. 1987. "Economic and SocialAgricultural Mechani3ation Station, Origins of Mau Mau." London: JamesP.O.Box 470 Nakuru, Kenya. Currey.
Raup, P.M. 1992. Personal Conmmunication. Tiffen, M. 1991. "Environmental C'hange andReid, L. 1982. "Soil Erosion in Machakos Dryland Management in Machakos
District." Nairobi; Ecosystems Ltd. District, Kenya. 1930-1990:Rostom, R.S. and Mortimore, M., 1991. Population Profile," London; ODI
"Environmental Change and Dryland Working Paper, No 54.Management in Machakos District, Tiffen, M. 1992(a). "Environmental ChangeKenya, 1930-19,90: Land Use Profile." and Dryland Management in MachakosLondon: ODI Working Paper No 58. District, Kenya, 1930-1990: Farming
Rukandema, M. Mavua, J.K. and Audi, P.O., and Income Systems." London: ODI1981. "The Farrning System of Lowland Working Paper No 59.Mac,hakos, Kenya; Farm Survey Results Tiffen, M. 1992(b). "Environment, Populationfrom Mwala District." Farming Growth and Productivity in Kenya: ASystems Economic Research Programme Case Study of Machakos District."Technical Report (Kenya) No 1. London; ODI, Mimeo.Nairobi, Ministry of Agriculture. Tiffen, M., Mortimore, M., and Gichuki, F.
Ruthenberg, H., 1980. "Farming Systems in (Forthcoming), "more People - Lessthe Tropics." Oxford: Clareridon Press. Erosion: Environmental Recovery in
Seve, J., Ross-Sheriff, B.A., Impara, P.C., and Kenya." London, Wylie and Sons.de Treville, D., 1990. "World Bank Trapnell, C.G. 1958. "Notes on EcologicalDrylands Management Study: Lessons Zones i n North Machakos."of Experience." Environment Unpublished Manuscript, Archives ofDepartment, Divisional Working Paper Kenya.No 1990-9. Uitto, J.I. 1989. "The Kenyan Conurndrum: A
Shepherd, G., 1989. "Assessing farmers' tree Regional Analysis of Population Growthuse and tree-planting priorities. A and Primary Education in Kenya."report to guide the ODA/Government of Lund, Sweden, Lund University Press.Kenya Embu-Meru-Isiolo Forestry Yambo, M. 1986. "Technical training andProject. " London, Overseas work experience in Kenya: A nationalDevelopment Institute. tracer study of the leavers of Harambee
Speirs, M. and Olsen, 0., 1992. "I[ndigenous Institutes of Technology and YouthIntegrated Farming Systems in the Polytechnics. Vol. 5". Report to
DANIDA, Mimeo, Nairobi.
Distributors of World Bank PublicationsARGENTINA The Middle East Observer ITALY PORTUGALCarlos Hirsch. SRL 41, Shenf Street Licosa Commissionaria Sansoni SPA Livraria PortugalGaieria Guemes Cairo Via Duca Di Calabria, 1/1 Rua Do Carmo 70-74Florida 165, 4th Floor-Ofc. 453/465 Casella Postale 552 1200 Lisbon1333 Buenos Aires FINLAND 50125 Firenze
Akateeminen Kirjakauppa SAUDI ARABIA, QATARAUSTRALIA, PAPUA NEW GUINEA, P.O. Box 128 JAPAN jarir Book StoreFIJI, SOLOMON ISLANDS, SF-00101 Helsinki 10 Eastern Book Service P.O. Box 3196VANUATU, AND WESTERN SAMOA Hongo 3-Chome, Bunkyo-ku 113 Riyadh 11471DA Information Services FRANCE Tokyo648 Whitehorse Road World Bank Publications SINGAPORE, TAIWAN,Mitcham 3132 66, avenue d'1ena KENYA MYANMAR,BRUNEIVictoria 75116 Paris Africa Book Service (EA.) Ltd. Gower Asia Pacific Pte Ltd.
Quaran House, Mfangano Street Golden Wheel BuildingAUSTRIA GERMANY P.O. Box 45245 41, Kallang Pudding, #04-03Gerold and Co. UNO-Verlag Nairobi Singapore 1334Graben 31 Poppelsdorfer Ailee 55A-1011 Wien D-5300 Bonn I KOREA, REPUBLIC OF SOUTH AFRICA, BOTSWANA
Pan Korea Book Corporation For single titlsBANGLADESH HONG KONG, MACAO P.O. Box 101, Kwangwhamun Oxford University PressMAcr Instries Development Asia 2000 Ltd Seoul Southern Africa
Assistasce Socety (MIDAS) 46-48 Wyndham Street P.O. Box 1141House 5, Road 16 Winning Centre Korean Stock Book Centre Cape Town 8000Dhanmondi RtArea 2nd Floor P.O. Box 34Dhaka 1209 Central Hong Kong Yeoeido For semaonaiSubs orders:
Seoul International Subscription ServiceBranch oces: HUNGARY P.O. Box 41095Pine View, Ist Floor Foundation for Market Economy MALAYSIA Craighall100 Agrabad Commercial Area Dombovari Ut 17-19 University of Malaya Cooperative Johannesburg 2024Chittagong 4100 H-1117 Budapest Bookshop, Lunited
P.O. Box 1127, jalan Pantal Baru SPAINBELGIUM INDIA 59700 Kuala Lumpur Mundi-Prensa Libros, S.A.jean De Lannoy Allied Publishers Private Ltd. Castello 37Av. du Roi 202 751 Mount Road MEXaCO 28001 Madrid1060 Brussels Madras- 600 002 INFOTEC
Apartado Postal 22-860 Libreria Intemacional AEDOSCANADA Branch oeis: 14060 Tlalpan, Mexico D.F. Consell de Cent, 391Le Diffuseur 15 J.N. Heredia Marg 08009 Barcelona151A Boul. de Mortagne Ballard Estate NETHERLANDSBoucherville, Quebec Bombay - 400 038 De Lindeboom/InOr-Publikaties SRI LANKA AND THE MALDIVESJ4B5E6 P.O. Box 202 Lake House Bookshop
13/14 Asaf Ali Road 7480 AE Haaksbergen P.O. Box 244Renouf Publishing Co. New Delhi - 110 002 100, Sir Chittampalam A.1294 Algoma Road NEW ZEALAND Gardiner MawathaOttawa, Ontario 17 Chittaranjan Avenue EBSCO NZ Ltd. Colombo 2KIB3W8 Calcutta - 700 072 PrivateMail Bag99914
New Market SWEDENCHILE Jayadeva Hostel Building Auckland ForsingletitlesnInvertec IGT SA 5th Main Road, Gandhinagar Fritres FackboksforetagetAv. Santa Maria 6400 Bangalore - 560 009 NIGERIA Regeringsgatern 12, Box 16356Edificio INTEC, Of. 201 University Press Limited S-103 27 StockholmSantiago 3-5-1129 Kachiguda Three Crowns BuildingJericho
Cross Road Private Mail Bag 5095 For sbscrirtion orders:CHINA Hyderabad - 500 027 ibadan Wennergren-Williams ABChina Flnancial & Economic d. O. Box 1305
Publishing House Prarthana Flats, 2nd Floor NORWAY 5-171 25 Solna8, Da Fo Si Dong Jie Near Thakore Baug, Navrangpura Narvesen Information CenterBeijing Ahmedabad - 380 009 Book Department SWITZERLAND
P.O. Box 6125 Etterstad For single- titls:COLOMBIA Patiala House N 0602 Oslo 6 Libraine PayotInfoenlace Ltda. 16-A Ashok Marg Case postale 3212Apartado Aereo 34270 Lucknow - 226 001 PAKISTAN CH 1002 LausanneBogota D.E Mirza Book Agency
Central Bazaar Road 65, Shahrah-e-Quaid-e-Azam For suscritian ordem:COTE D'IVOIRE 60 Bajaj Nagar P.O. Box No. 729 Librairie PayotCentre d'Edition et de Diffusion Nagpur 440 010 Lahorm 54000 Service des Abonnemenb
Alricaines TCEDAI Case postale 331204 B.P. 541 INDONESIA PERU CH 1002 LausanneAbidjan 04 Piateau Pt. Indira Limited Editorial Desarrollo SA
Jalan Borobudur 20 Apartado 3824 THAILANDCYPRUS P.O. Box 181 Lima I Central Department StoreCenter of Applied Research Jakarta 10320 306 Silom RoadCyprus College PHILIPPINES Bangkok6, Diogenes Street, Engomi IRAN International Book CenterP.O. Box 2006 Kowkab Publishers Suite 1703, Cityland 10 TRINIDAD & TOBAGO, ANTIGUANicosia P.O. Box 19575-511 Condominium Tower I BARBUDA, BARBADOS,
Tehran Ayala Avenue, H.V. dela DOMINICA, GRENADA, GUYANA,DENMARK Costa Extension JAMAICA, MONTSERRAT, ST.SamfundsLitteratur IRELAND Makati, Metro Manila KITTS & NEVIS. ST. LUCIA,Rosenoerns A11e 11 Government Supplies Agency ST. VINCENT & GRENADiNESDK-1970 Frederiksberg C 4-5 Harcourt Road POLAND Systematics Studies Unit
Dublin 2 International Punlishing Service #9 Watts StreetDOMINICAN REPUBLIC UI. Piekna 31/37 CurepeEditora Taller, C por A. ISRAEL 00-677Warzawa Trinidad, West IndiesRestauraci6n e Isabel ia Cat6lica 309 Yozmot Uterature Ltd.Apartado de Ccrreos 2190 Z-1 P.O. Box 56055 For subscriptin ordm: UNITED KINGDOMSanto Domingo Tel Aviv 61560 IPS Joumais Microinfo Ltd.
Ul. Okrezna 3 P.O. Box 3EGYPT, ARAB REPUBLiC OF 02-916Warszawa Alton, Hampshire GU342PGAl Ahram EnglandAl Galaa StreetCairo
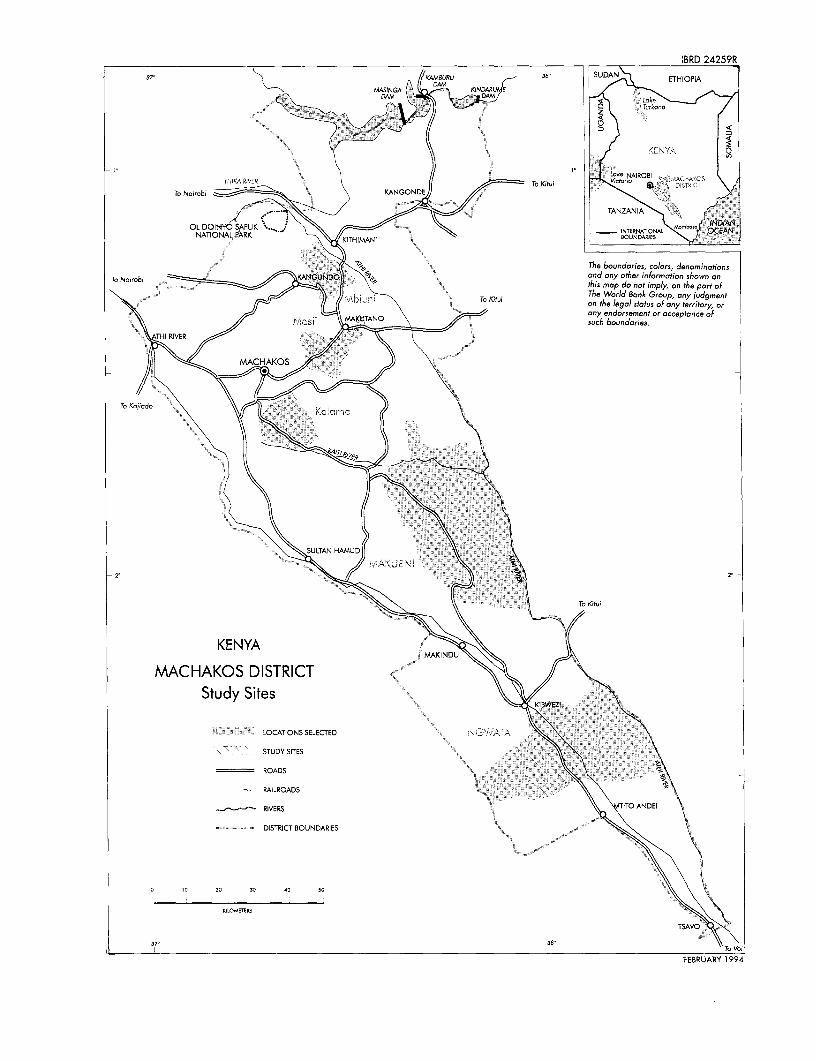
________________________________________________________________________BRD BR 2259R37t KAMBURU SUDAN RTHIOPIA
MAsrINGA DAM KIND AMM
70~~ ~ ~~~~~~~~ ~ ~~~~~~~~~~~ ~~~~~~~~~~~ \ urkor ;E'''.n
Z
0
Tu~~tui Lu~~ke N4AIROB]ThlKA RIVER do" ||: t;ru-J ,='AC,<S1'
To Nairobi KANGONDE/ .2\
TANZANIA
OL D OINY6iSAPUK 5 ........ . ....... ,. > , ............... \< INTERNATIO O NA<MOOCEANNATIONAL PARK B9 sITHIMANI _ EOUNDAEJES
The boundaries, colors, denominationsTo Nairobi KANG7ND , and any ofther informatin on shown onthis map do not imply, on the part of
The Worldl Bank Groupayjdmnon the legal status afay territory, orany endorsement or acceptance ofN, r, I@s i MAKUTANsuch boundaries,
I RIVER RIVERS
MACHAKOSER
T. Kojirdo .< -ixiil t
~~~~~~~~~~~~~~~~~~~FBUR 1994
+ < < X o~~~~~~~~~~~~~~~~T K tui
KENYA ^AX MACHAKOS DISTRICT-J
Study Sites X8
LOCATIONS SELECTED AN:!,,,4 \
STUDY SITES ,A
ROADS \ j
RAILROADS..,- ;
_-~~~~~~~ RIVERS \\~~~~~~~~~~~~~~~~ITO ANDEI '
DISTRICT BOUNDARIES <
0 lO 20 30 40 50\
KILOMETERS S
a 38> o oFEBRUARY 1994
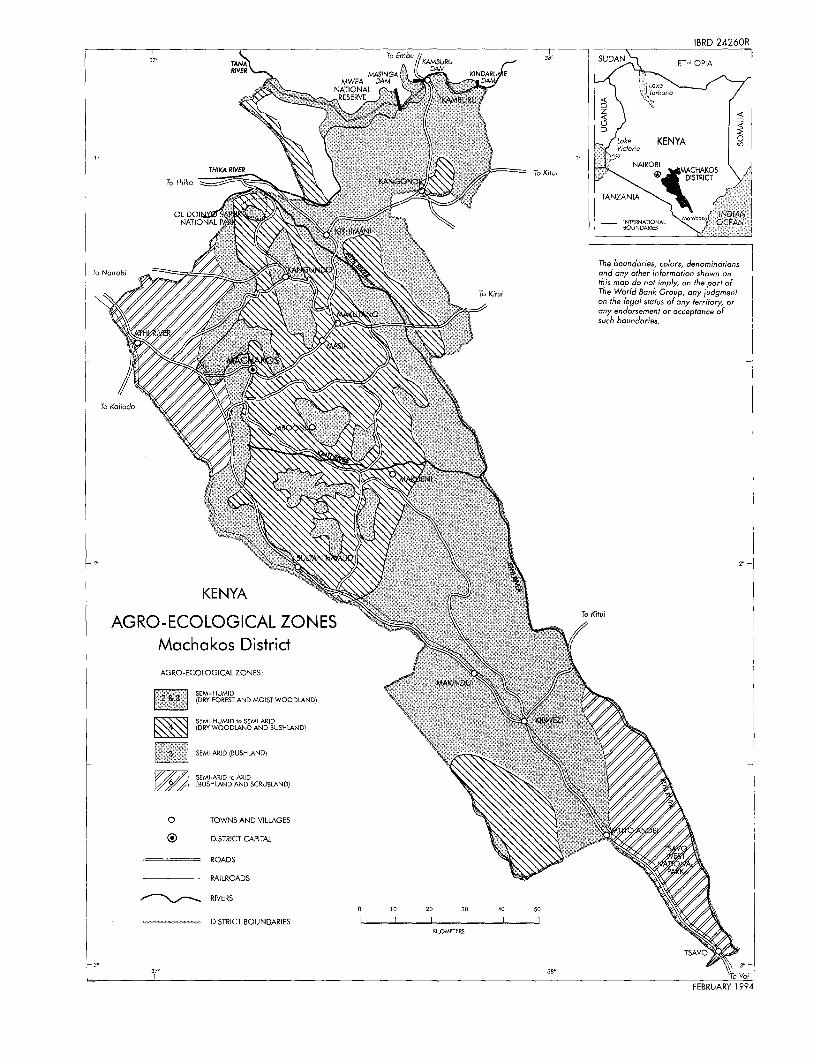
IBRD 24260R
37' To Emb~~~~~~~~~~~~~~~~~~~~~~~~~~~~T ,o
37 TAIINa //KAMSUR0 s ' SUDANA ETHIOPIAN7RIVI- ERNATIONOLRUOCEA
~~~~~~~~~~~~~~~~~~~~~~~The bouNdAris cooseoiain
7~~ ~ ~ ~ ~~~~~~~~~~~~~~~~~~~~~~~~~~~~~~ti ma doit notX imly on the var:o
~~~~~~~~~~~~~~~~~~~~~~~~~~~~~z <
-~~~~~~~~~~~~~~~~~~~~~~~~~~~~~~~~~~~'
KENYA~~~~~~~~~~~~~~~~~~~~~~~~~~~~~EY 0.. AGRO-ECOLOGTICAL RIVES To Kit KituiO
ToTik) DSTRICT CPTLS
NAIIA INTERATI
EEBRUARY 1994
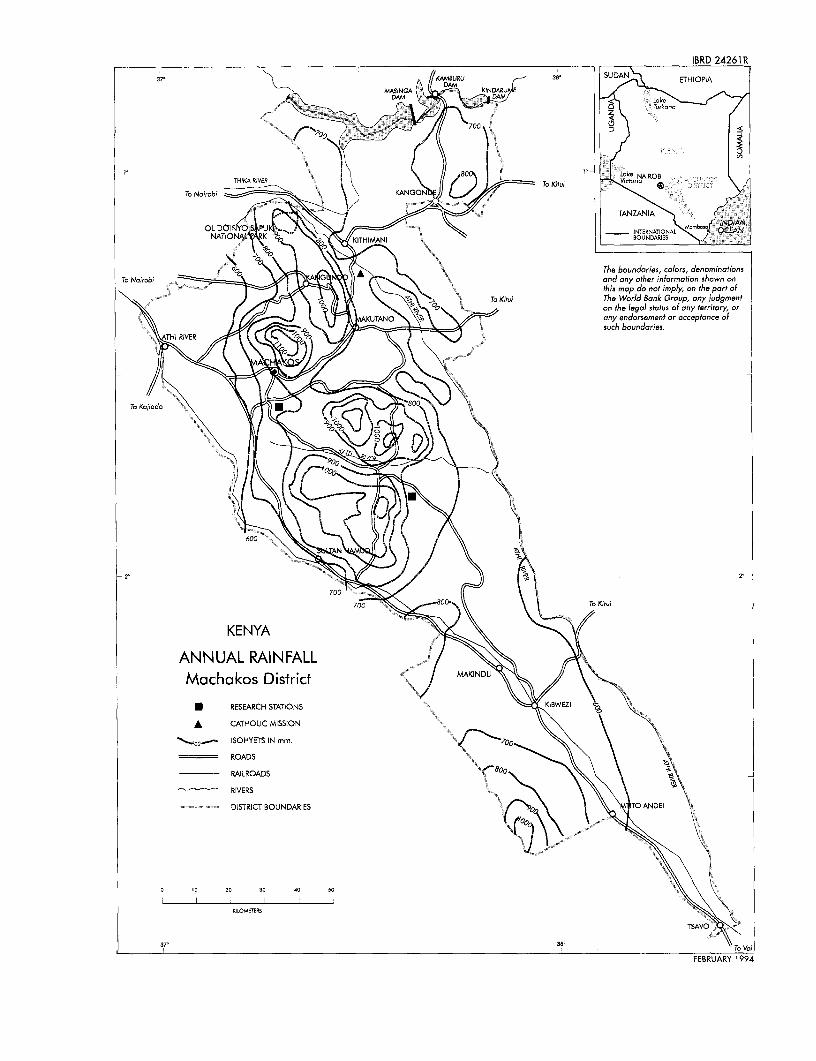
IBRD 24261R
37- 1- _ 38(('KMBURU ss3 SUDAN ETHIOPIA
700~~~~~
THIKA RIVER |\S /0)T iu ft'NI° To Ncirobi -. \ KANGON* To t . _
TANZANI
OL 001 ) s INTER N~~~~~~~~~~~~~~~~~~~~~NDAOL DOg jUKn ............ ,,f> .gNTENATINONAL OrAN
00, ~~~~~~~~~~~~~~~~~~~~~~~The boundaries, colors, denominotionsTo Ncirobi , Q 1 At$ oand any other information shown on
this map co not imply, on the part of
o> To KiEli The World Bank Group, any judgment
-o ~~~~~~~~~~~on the legal status of any territory, orUANo ' any endorsement or acceptance of
such boundacries.
ANNUA RAIVERL./
2'~~~~~~~~~~~~~~~~~~~~~~~~~~~~~~~~~~~~~~~~~~~~~~~~~~~~~~~~~~~~~~~2
Machakos District
U RESEARCH STATIONS BWEZI
A CATHOLIC MISSION
_ ISOHYETS IN mm. / 00
ROADS
RAILROADS
RIVERS
DISTRICT BOUNDARIES AN EI
0 10 20 30 40 50
KILOMETERS
FEBRUARY 1994
The World Bank
Headquarters European Office Tokyo Office U1818 H Street, N.W. 66, avenue d'1ena Kokusai BuildingWashington, D.C. 20433, U.S.A. 75116 Paris, France 1-1 Marunouchi 3-chome
Chiyoda-ku, Tokyo 100, JapanTelephone: (202) 477-1234 Telephone: (1) 40.69.30.00Facsimile: (202) 477-6391 Facsimile: (1) 40.69.30.66 Telephone: (3) 3214-5001Telex: WUi 64145 WORLDBANK Telex: 640651 Facsimile: (3) 3214-3657
RCA 248423 WORLDBK Telex: 26838Cable Address: INTBAFRAD
WASHiNGTONDC
ISBN 0-8213-2734-8