Embed Size (px)
Citation preview
Sahel atlas of changing landscapes
tracing trends and variations in vegetation cover and soil condition
SAHEL ATLAS OF CHANGING LANDSCAPES
This atlas aims to illustrate a rigorous scientific basis for understanding processes of landscape change in the Sahel and describes landscapes, climate, vegetation, and trends in vegetation and soil health.
The atlas provides a pictorial overview of the application of land degradation surveillance – a science-based approach to land health monitoring and assessment. Systematic sampling and observation of ground conditions are combined with new technology for rapid soil characterization and with fine to moderate resolution satellite imagery to provide powerful inference about soil, vegetation and socioeconomic conditions at local to regional scales.
Investments in regional application of this approach will provide a sound scientific basis for understanding and managing climate-vegetation-management processes and feedbacks in the Sahel and elsewhere.
Sahel atlas of changing landscapes
tracing trends and variations in vegetation cover and soil condition
Copyright 2012, United Nations Environment Programme
ISBN: 978-92-807-3300-6
UNEP Job Number: DEW/1611/NA
Disclaimers
This publication may be reproduced in whole or in part and in any form for
educational or nonprofit services without special permission from the copyright
holder, provided acknowledgement of the source is made. UNEP would appreciate
receiving a copy of any publication that uses this publication as a source. No
use of this publication may be made for resale or any other commercial purpose
whatsoever without prior permission in writing from the United Nations
Environment Programme. Applications for such permission, with a statement of the
purpose and extent of the reproduction, should be addressed to the Director, DCPI,
UNEP, P.O. Box 30552, Nairobi, 00100, Kenya.
The designations employed and the presentation of material in this publication do
not imply the expression of any opinion whatsoever on the part of UNEP concerning
the legal status of any country, territory or city or its authorities, or concerning the
delimitation of its frontiers or boundaries.
This report should be cited as:
UNEP (2012). Sahel Atlas of Changing Landscapes: Tracing trends and variations
in vegetation cover and soil condition. United Nations Environment Programme,
Nairobi.
This Atlas is a companion to the report:
UNEP (2012). Land Health Surveillance: An Evidence-Based Approach to Land
Ecosystem Management. Illustrated with a Case Study in the West Africa Sahel.
Summary for Decision Makers. United Nations Environment Programme, Nairobi.
Acknowledgements
This document is a product of UNEP’s project “An Ecosystem Approach to Restoring
West African Drylands and Improving Rural Livelihoods through Agroforestry-based
Land Management Interventions”.
We are grateful to the Governments of Burkina Faso, Mauritania, Niger and Senegal
for their participation in the project, and especially to the Government of Mali’s
Institut d’Economie Rural (IER) for hosting the project operations in Mali. We also
thank the Directorate for Nature Conservation (DNCN) in Segou for field support. We
gratefully acknowledge field and laboratory assistance from staff of IER, especially
Oumar Doumbia, Lassana Dioni and Mamadou Doumbia; and regional coordination
support from Bocary Kaya and Serigne Kandji from the World Agroforestry Centre.
We are very grateful to the Government of Norway for providing the principal
funding for this project.
Project manager:
Gemma Shepherd/UNEP.
Email: [email protected]
Printed and bound in Malta by Progress Press Ltd, Malta Progress Press Ltd, P.O. Box
328, 341 St. Paul Street, Cmr 01 Valletta, Malta
UNEP promotes environmentally sound practices
globally and in its own activities. This report is printed on paper from sustainable
chlorine free and the inks vegetable-based. Our distribution policy aims to reduce
UNEP’s carbon footprint.
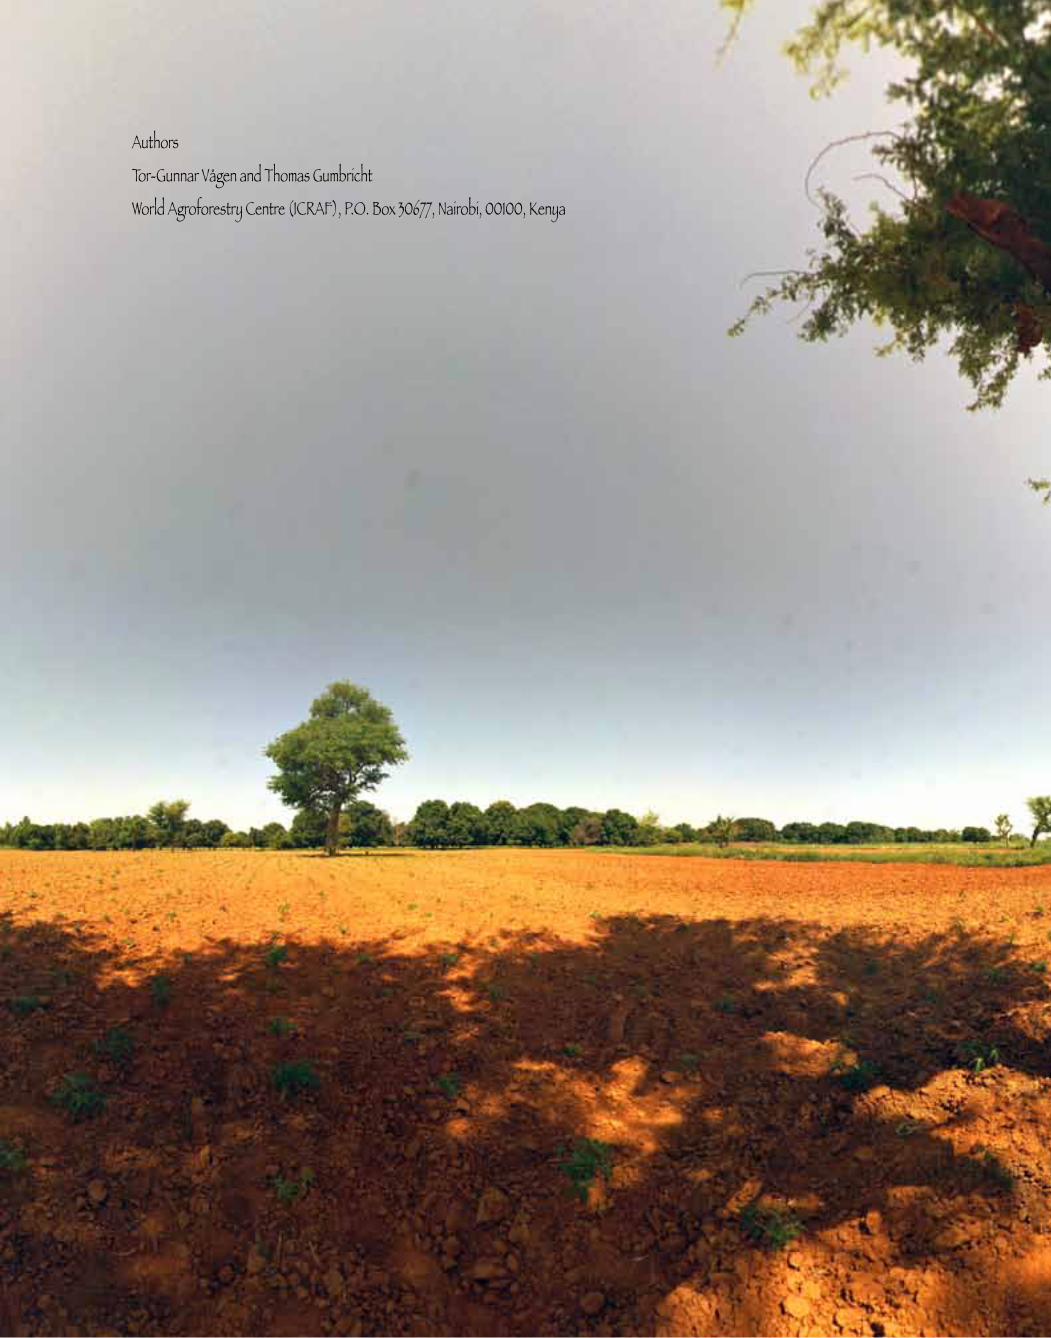
Authors
Tor-Gunnar Vågen and Thomas Gumbricht
World Agroforestry Centre (ICRAF), P.O. Box 30677, Nairobi, 00100, Kenya
Table of ContentsForeword vPreface vii
Overview and Summary 8Introduction 16 The Sahel 16 Landscapes 18Climate 26 External climate forcing 27 Internal climate feedback 27 The Inter-Tropical Convergence Zone 28 Annual climate cycles 30 Long term trends in climate 32 Climate during the last century – rains and droughts 34Vegetation 38 Satellite mapping of vegetation 40 Vegetation variations 44 Rainfall Normalized NDVI (rNDVI) 48 The MODIS Enhanced Vegetation Index (EVI) 50Land degradation hotspots 54 Agriculture in the Sahel 56 Mapping land degradation hotspots in the Sahel 58Land degradation surveillance 76 Regional mapping of woody cover 92 Rapid assessment of soil health 95 Soil organic carbon and soil condition 96
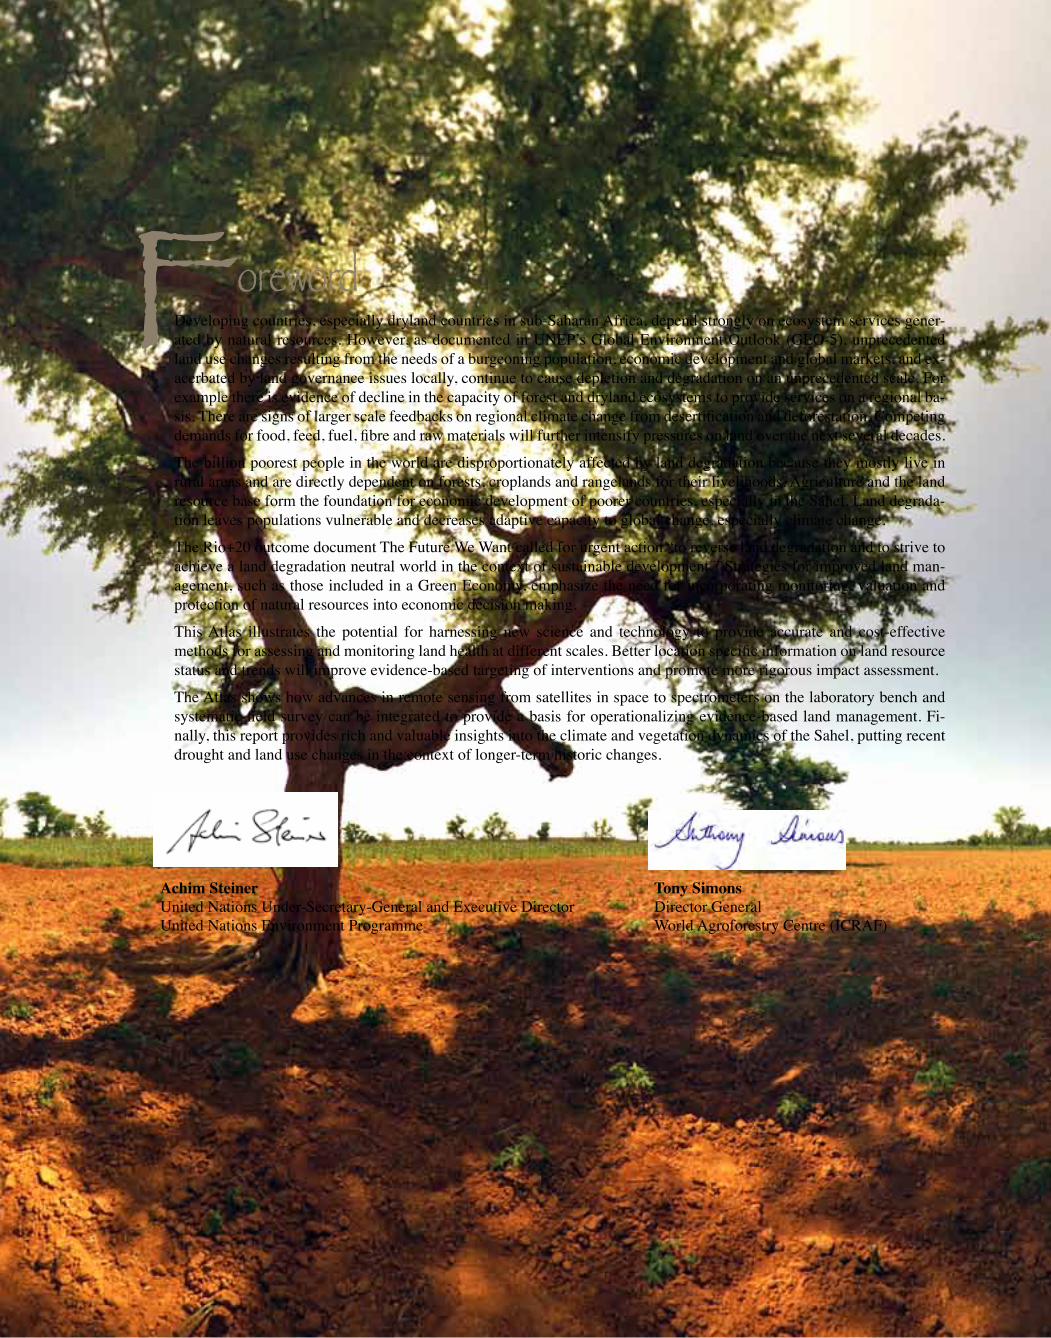
Developing countries, especially dryland countries in sub-Saharan Africa, depend strongly on ecosystem services gener-ated by natural resources. However, as documented in UNEP’s Global Environment Outlook (GEO-5), unprecedented land use changes resulting from the needs of a burgeoning population, economic development and global markets, and ex-acerbated by land governance issues locally, continue to cause depletion and degradation on an unprecedented scale. For example there is evidence of decline in the capacity of forest and dryland ecosystems to provide services on a regional ba-sis. There are signs of larger scale feedbacks on regional climate change from desertification and deforestation. Competing demands for food, feed, fuel, fibre and raw materials will further intensify pressures on land over the next several decades.
The billion poorest people in the world are disproportionately affected by land degradation because they mostly live in rural areas and are directly dependent on forests, croplands and rangelands for their livelihoods. Agriculture and the land resource base form the foundation for economic development of poorer countries, especially in the Sahel. Land degrada-tion leaves populations vulnerable and decreases adaptive capacity to global change, especially climate change.
The Rio+20 outcome document The Future We Want called for urgent action “to reverse land degradation and to strive to achieve a land degradation neutral world in the context of sustainable development.” Strategies for improved land man-agement, such as those included in a Green Economy, emphasize the need for incorporating monitoring, valuation and protection of natural resources into economic decision making.
This Atlas illustrates the potential for harnessing new science and technology to provide accurate and cost-effective methods for assessing and monitoring land health at different scales. Better location specific information on land resource status and trends will improve evidence-based targeting of interventions and promote more rigorous impact assessment.
The Atlas shows how advances in remote sensing from satellites in space to spectrometers on the laboratory bench and systematic field survey can be integrated to provide a basis for operationalizing evidence-based land management. Fi-nally, this report provides rich and valuable insights into the climate and vegetation dynamics of the Sahel, putting recent drought and land use changes in the context of longer-term historic changes.
Foreword
Tony Simons Director General World Agroforestry Centre (ICRAF)
Achim Steiner United Nations Under-Secretary-General and Executive Director United Nations Environment Programme
DIOWARA
MANSARAFALEMA KATIENA
TESSERELA
KOLONI
NGAKOROKONODIMINI
ZINZANA
NOUGOURE
FANI
KOUARA
KANZANGASSO
DIAFORONGOYANGASSO
NENESSODIENA
TIESALAKONOBOUGOU
BLA
KIMPARANA
SIGUINE
NIONO
YEBEMARKABOUGOU KALANKOROLOTAIMANANIARO
SOULEI
DIAFARABE
MIO
TENE
SAGALA
BOKI-WERETOUMAKORO
KOUIMASARO
KOMANTIEBOUGOU
MARKALA
KABAN
ZANVALENASOUGOUBA
KE-MACINA
NGODLA
TYONGO
SOUBA
KOUAKOUROU
YOLO
DOLONGUEBOUGOUSONANGO
DIONVOLA TONGUE
MANIMPE
SAI
SIMINAFATIME
GANIA
BOUSSETOGO
SEGOU
SAN
SokouraZebougou
Monimpebougou
Dianvola
Konobougou0 12.5 25 37.5 50 km
Legend
Sentinel site
Town/City
Small town/Village
Location of trend line(s)
Surface water
Greening-up
None
Browning-down
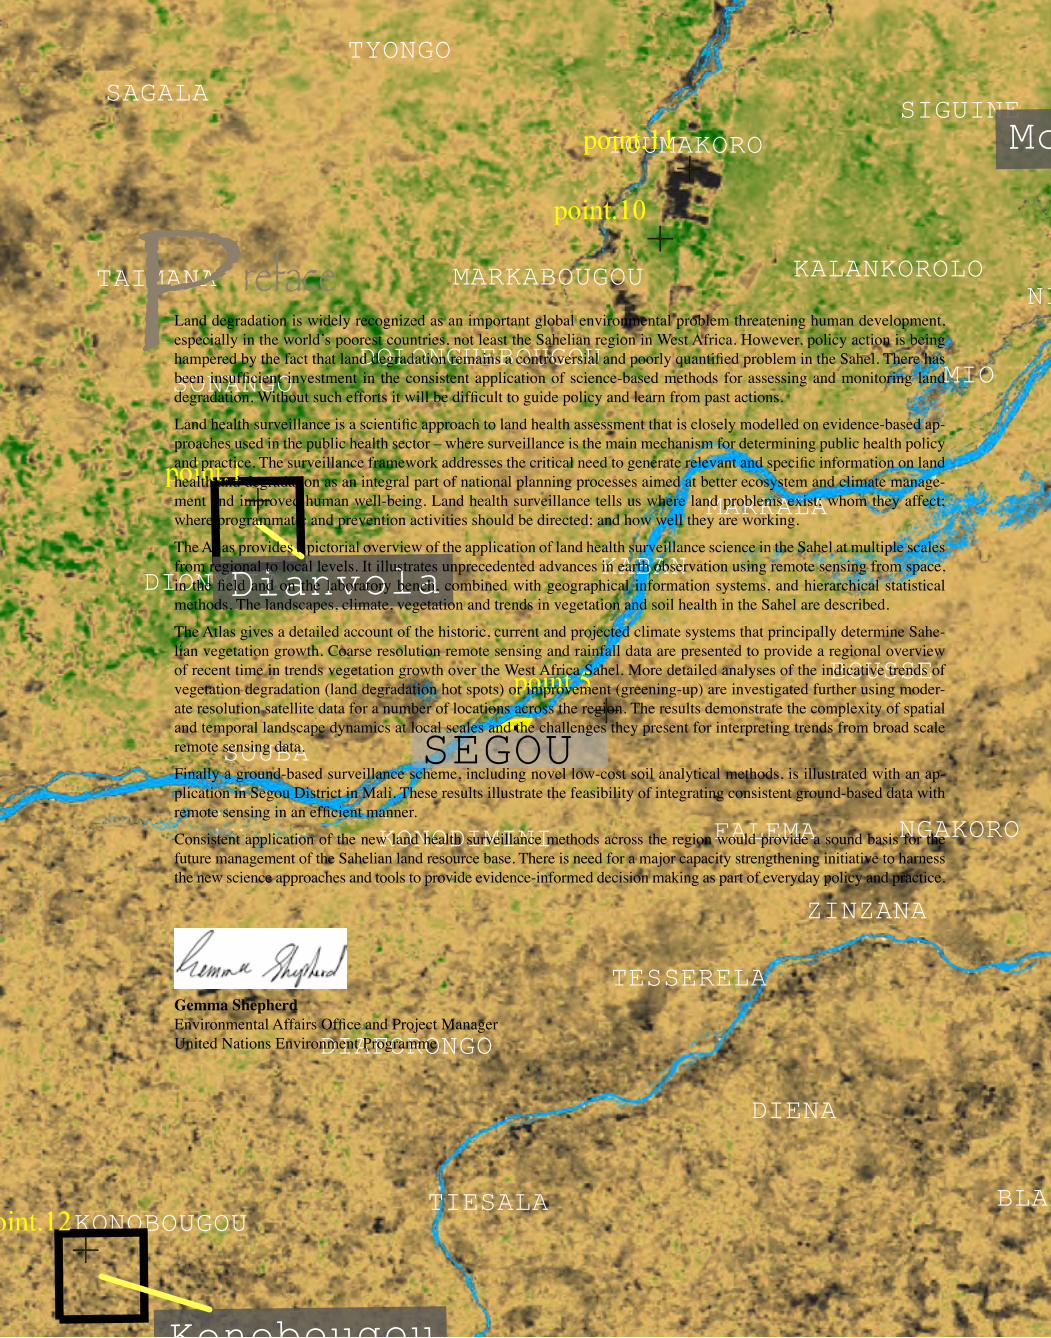
Land degradation is widely recognized as an important global environmental problem threatening human development, especially in the world’s poorest countries, not least the Sahelian region in West Africa. However, policy action is being hampered by the fact that land degradation remains a controversial and poorly quantified problem in the Sahel. There has been insufficient investment in the consistent application of science-based methods for assessing and monitoring land degradation. Without such efforts it will be difficult to guide policy and learn from past actions.
Land health surveillance is a scientific approach to land health assessment that is closely modelled on evidence-based ap-proaches used in the public health sector – where surveillance is the main mechanism for determining public health policy and practice. The surveillance framework addresses the critical need to generate relevant and specific information on land health and degradation as an integral part of national planning processes aimed at better ecosystem and climate manage-ment and improved human well-being. Land health surveillance tells us where land problems exist; whom they affect; where programmatic and prevention activities should be directed; and how well they are working.
The Atlas provides a pictorial overview of the application of land health surveillance science in the Sahel at multiple scales from regional to local levels. It illustrates unprecedented advances in earth observation using remote sensing from space, in the field and on the laboratory bench, combined with geographical information systems, and hierarchical statistical methods. The landscapes, climate, vegetation and trends in vegetation and soil health in the Sahel are described.
The Atlas gives a detailed account of the historic, current and projected climate systems that principally determine Sahe-lian vegetation growth. Coarse resolution remote sensing and rainfall data are presented to provide a regional overview of recent time in trends vegetation growth over the West Africa Sahel. More detailed analyses of the indicative trends of vegetation degradation (land degradation hot spots) or improvement (greening-up) are investigated further using moder-ate resolution satellite data for a number of locations across the region. The results demonstrate the complexity of spatial and temporal landscape dynamics at local scales and the challenges they present for interpreting trends from broad scale remote sensing data.
Finally a ground-based surveillance scheme, including novel low-cost soil analytical methods, is illustrated with an ap-plication in Segou District in Mali. These results illustrate the feasibility of integrating consistent ground-based data with remote sensing in an efficient manner.
Consistent application of the new land health surveillance methods across the region would provide a sound basis for the future management of the Sahelian land resource base. There is need for a major capacity strengthening initiative to harness the new science approaches and tools to provide evidence-informed decision making as part of everyday policy and practice.
Gemma ShepherdEnvironmental Affairs Office and Project ManagerUnited Nations Environment Programme
Preface
8
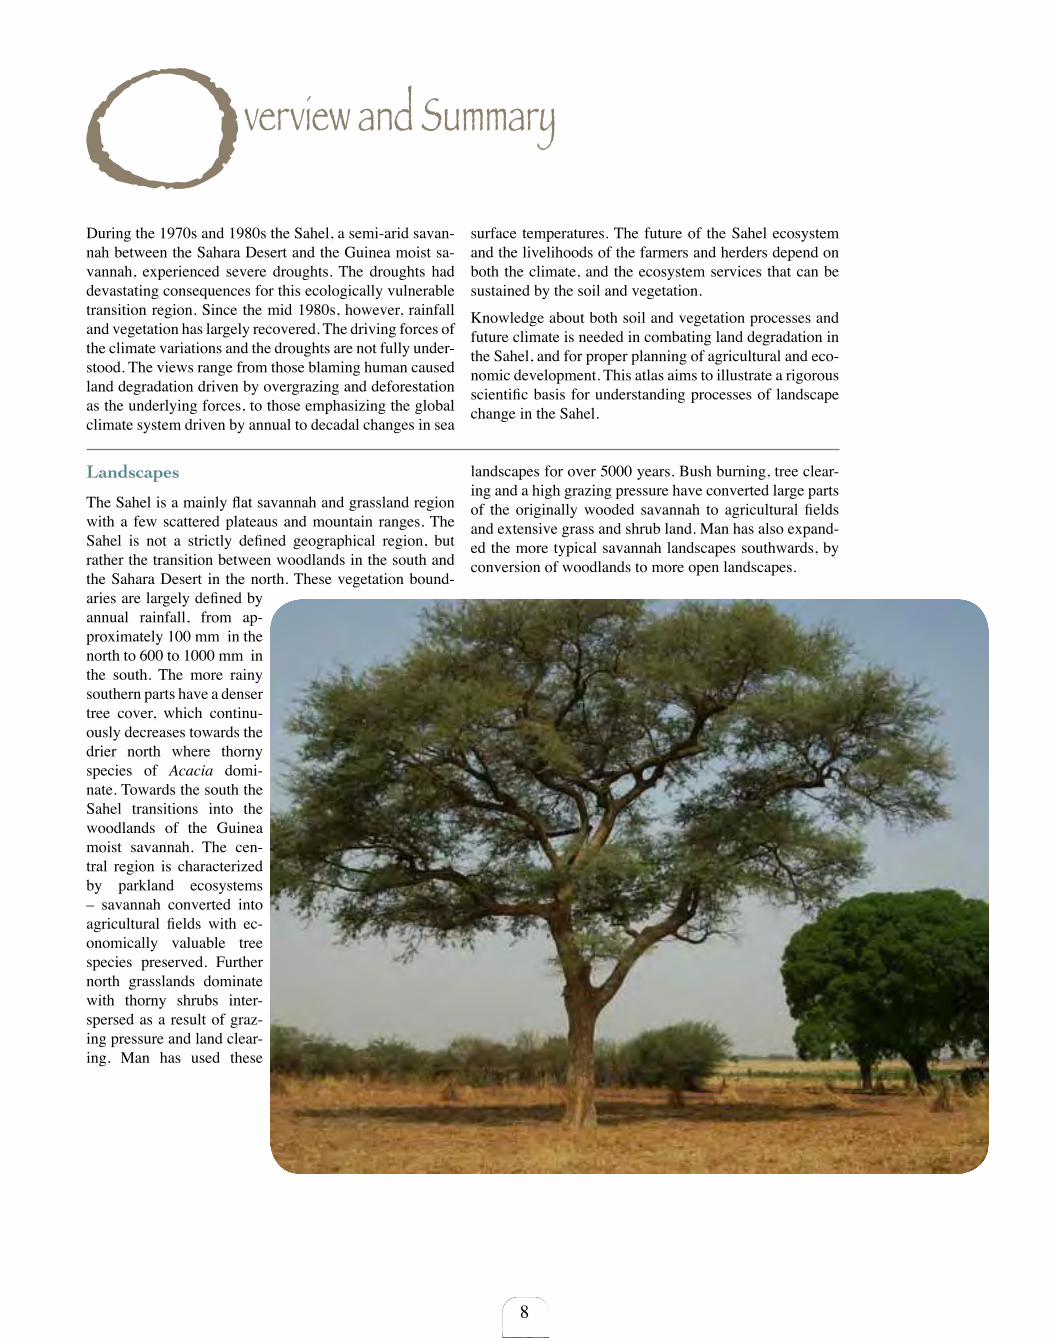
Landscapes
The Sahel is a mainly flat savannah and grassland region with a few scattered plateaus and mountain ranges. The Sahel is not a strictly defined geographical region, but rather the transition between woodlands in the south and the Sahara Desert in the north. These vegetation bound-aries are largely defined by annual rainfall, from ap-proximately 100 mm in the north to 600 to 1000 mm in the south. The more rainy southern parts have a denser tree cover, which continu-ously decreases towards the drier north where thorny species of Acacia domi-nate. Towards the south the Sahel transitions into the woodlands of the Guinea moist savannah. The cen-tral region is characterized by parkland ecosystems – savannah converted into agricultural fields with ec-onomically valuable tree species preserved. Further north grasslands dominate with thorny shrubs inter-spersed as a result of graz-ing pressure and land clear-ing. Man has used these
landscapes for over 5000 years. Bush burning, tree clear-ing and a high grazing pressure have converted large parts of the originally wooded savannah to agricultural fields and extensive grass and shrub land. Man has also expand-ed the more typical savannah landscapes southwards, by conversion of woodlands to more open landscapes.
During the 1970s and 1980s the Sahel, a semi-arid savan-nah between the Sahara Desert and the Guinea moist sa-vannah, experienced severe droughts. The droughts had devastating consequences for this ecologically vulnerable transition region. Since the mid 1980s, however, rainfall and vegetation has largely recovered. The driving forces of the climate variations and the droughts are not fully under-stood. The views range from those blaming human caused land degradation driven by overgrazing and deforestation as the underlying forces, to those emphasizing the global climate system driven by annual to decadal changes in sea
surface temperatures. The future of the Sahel ecosystem and the livelihoods of the farmers and herders depend on both the climate, and the ecosystem services that can be sustained by the soil and vegetation.
Knowledge about both soil and vegetation processes and future climate is needed in combating land degradation in the Sahel, and for proper planning of agricultural and eco-nomic development. This atlas aims to illustrate a rigorous scientific basis for understanding processes of landscape change in the Sahel.
Overview and Summary
9
Climate
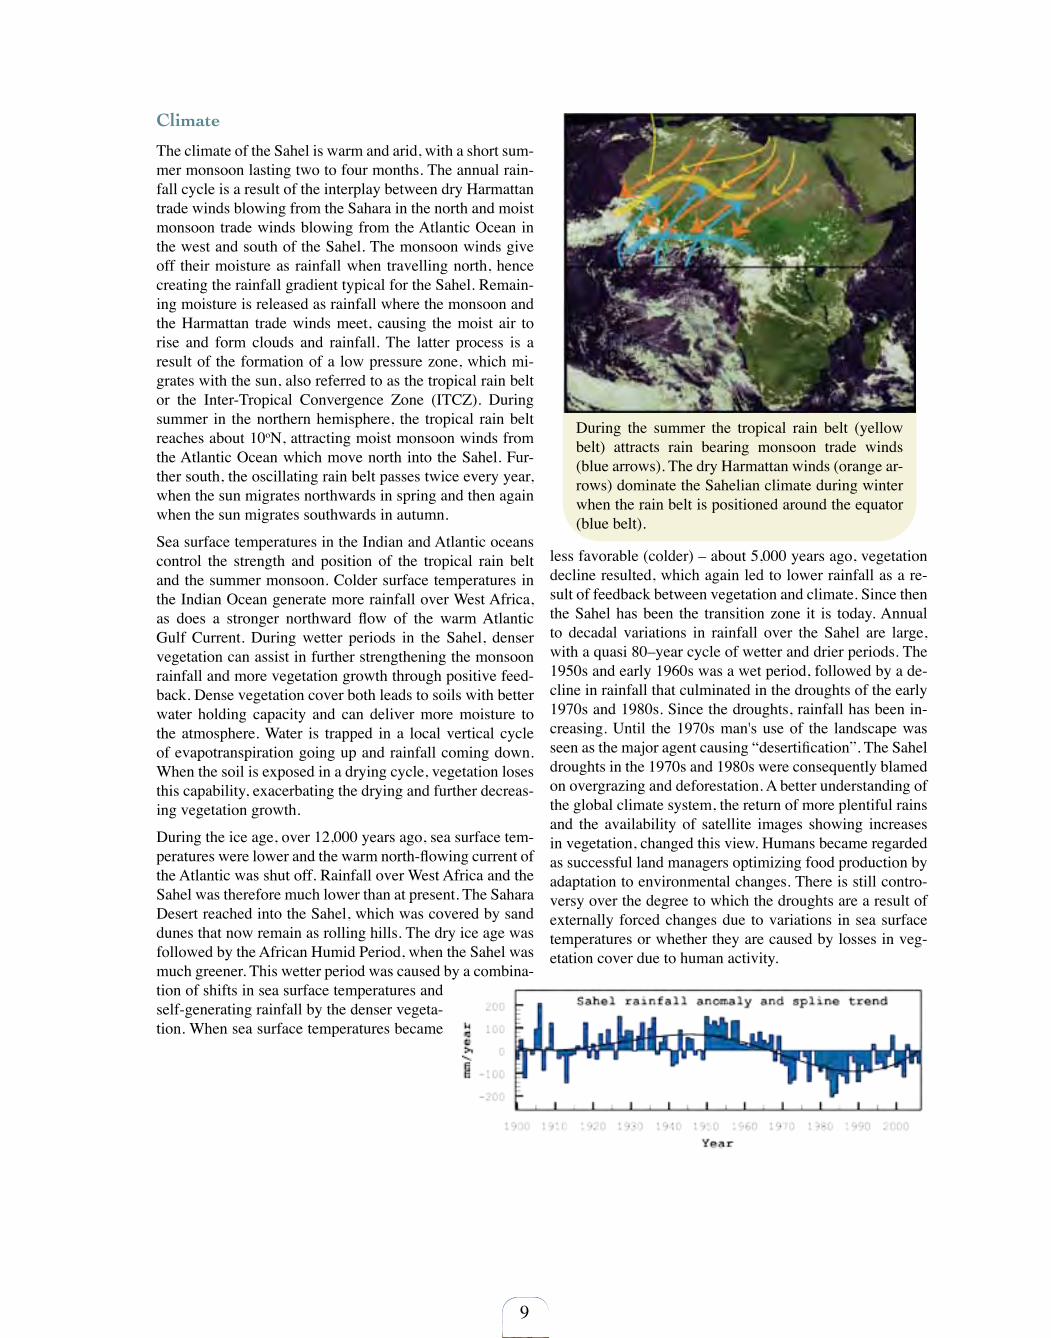
The climate of the Sahel is warm and arid, with a short sum-mer monsoon lasting two to four months. The annual rain-fall cycle is a result of the interplay between dry Harmattan trade winds blowing from the Sahara in the north and moist monsoon trade winds blowing from the Atlantic Ocean in the west and south of the Sahel. The monsoon winds give off their moisture as rainfall when travelling north, hence creating the rainfall gradient typical for the Sahel. Remain-ing moisture is released as rainfall where the monsoon and the Harmattan trade winds meet, causing the moist air to rise and form clouds and rainfall. The latter process is a result of the formation of a low pressure zone, which mi-grates with the sun, also referred to as the tropical rain belt or the Inter-Tropical Convergence Zone (ITCZ). During summer in the northern hemisphere, the tropical rain belt reaches about 10oN, attracting moist monsoon winds from the Atlantic Ocean which move north into the Sahel. Fur-ther south, the oscillating rain belt passes twice every year, when the sun migrates northwards in spring and then again when the sun migrates southwards in autumn.
Sea surface temperatures in the Indian and Atlantic oceans control the strength and position of the tropical rain belt and the summer monsoon. Colder surface temperatures in the Indian Ocean generate more rainfall over West Africa, as does a stronger northward flow of the warm Atlantic Gulf Current. During wetter periods in the Sahel, denser vegetation can assist in further strengthening the monsoon rainfall and more vegetation growth through positive feed-back. Dense vegetation cover both leads to soils with better water holding capacity and can deliver more moisture to the atmosphere. Water is trapped in a local vertical cycle of evapotranspiration going up and rainfall coming down. When the soil is exposed in a drying cycle, vegetation loses this capability, exacerbating the drying and further decreas-ing vegetation growth.
During the ice age, over 12,000 years ago, sea surface tem-peratures were lower and the warm north-flowing current of the Atlantic was shut off. Rainfall over West Africa and the Sahel was therefore much lower than at present. The Sahara Desert reached into the Sahel, which was covered by sand dunes that now remain as rolling hills. The dry ice age was followed by the African Humid Period, when the Sahel was much greener. This wetter period was caused by a combina-tion of shifts in sea surface temperatures and self-generating rainfall by the denser vegeta-tion. When sea surface temperatures became
less favorable (colder) – about 5,000 years ago, vegetation decline resulted, which again led to lower rainfall as a re-sult of feedback between vegetation and climate. Since then the Sahel has been the transition zone it is today. Annual to decadal variations in rainfall over the Sahel are large, with a quasi 80–year cycle of wetter and drier periods. The 1950s and early 1960s was a wet period, followed by a de-cline in rainfall that culminated in the droughts of the early 1970s and 1980s. Since the droughts, rainfall has been in-creasing. Until the 1970s man's use of the landscape was seen as the major agent causing “desertification”. The Sahel droughts in the 1970s and 1980s were consequently blamed on overgrazing and deforestation. A better understanding of the global climate system, the return of more plentiful rains and the availability of satellite images showing increases in vegetation, changed this view. Humans became regarded as successful land managers optimizing food production by adaptation to environmental changes. There is still contro-versy over the degree to which the droughts are a result of externally forced changes due to variations in sea surface temperatures or whether they are caused by losses in veg-etation cover due to human activity.
During the summer the tropical rain belt (yellow belt) attracts rain bearing monsoon trade winds (blue arrows). The dry Harmattan winds (orange ar-rows) dominate the Sahelian climate during winter when the rain belt is positioned around the equator (blue belt).

10
Vegetation
In general, climatic factors such as rainfall and relative humidity have a dominant influence on vegetation growth and composition. The Sahel vegetation is therefore a reflection of the steep south to north decline in rainfall. However, local factors such as soil and water availability are important, especially near climatic margins and where hardened (lateritic) crusts, saline or water logged soils occur. Grass cover is fairly con-tinuous across the region, dominated by annual grass species. Plant species variations are larger towards the wetter south, with Acacia species becoming more dominant further north. In the northern fringes of the Sahel, areas of desert shrub alternate with areas of grassland and savannah. During the long dry season the predominantly annual grasses die and many trees lose their leaves. The large variation in rainfall also causes annual to decadal changes in species compositions, especially in annual grasses.
Grass- and shrub lands have become more prominent from frequent burning and high grazing pressure. The extent of the woodlands in the south has decreased as a result of logging for timber and fuel wood, and conversion to agroforestry, farmland and grazing land. These processes have been ongoing since the end of the African Humid Period, 5,000 years ago, but have accelerated in the last century.
The growing archives of satellite imagery have become a major source for screening and exploring regional and global vegetation change. The longest available vegeta-tion time-series is from 1981 to present, and comes from the AVHRR (Advanced Very High Resolution Radiometer) sensor. This data has a spatial resolution of eight km. The more recent MODIS (Moderate Resolution SpectroRadiometer) sensor is a much more accurate sensor with automatic calibration, and provides vegetation data at 250 m resolution. MODIS has been producing global vegetation data since 2000. Both sen-sors produce daily global satellite images. Using cloud free images for mapping an-nual vegetation production, these sensors show that vegetation growth in the Sahel has increased since the droughts in the 1980s. The recovery in vegetation has, however, not been as strong as the rainfall recovery. While rainfall has moved north at a pace of around nine km per year over the period 1982 to 2006, vegetation has responded by moving only a third to half this distance northwards.
Vegetation growth alone cannot be used for mapping land degradation in drylands with large fluctuations in rainfall like the Sahel. A simple way to separate rainfall driven vegetation growth from other factors is to normalize the annual vegetation produc-tion by annual rainfall. The ratio of vegetation growth over rainfall is a measure of the vegetation's capacity to turn available rainfall into green biomass, and hence a way of comparing the effectiveness of vegetation growth between years with varying rainfall.
Average vegetation cover 1982–2006 derived from AVHRR satellite data at eight km reso-lution. Denser vegetation cover is shown as dark green.
Rain normalized vegetation production
1982–2006 derived from the ratio of annual vegetation cover (AVHRR) to annual rain-fall. Rain normalized vegetation production disentangles vegetation changes caused by rainfall variation from other factors. It is a method applied for screening regional veg-etation data for potential areas affected by land degradation.
Rainfall normalized vegetation production 2001–2006 derived from the ratio of annual vegetation cover (MODIS) to annual rainfall.
11
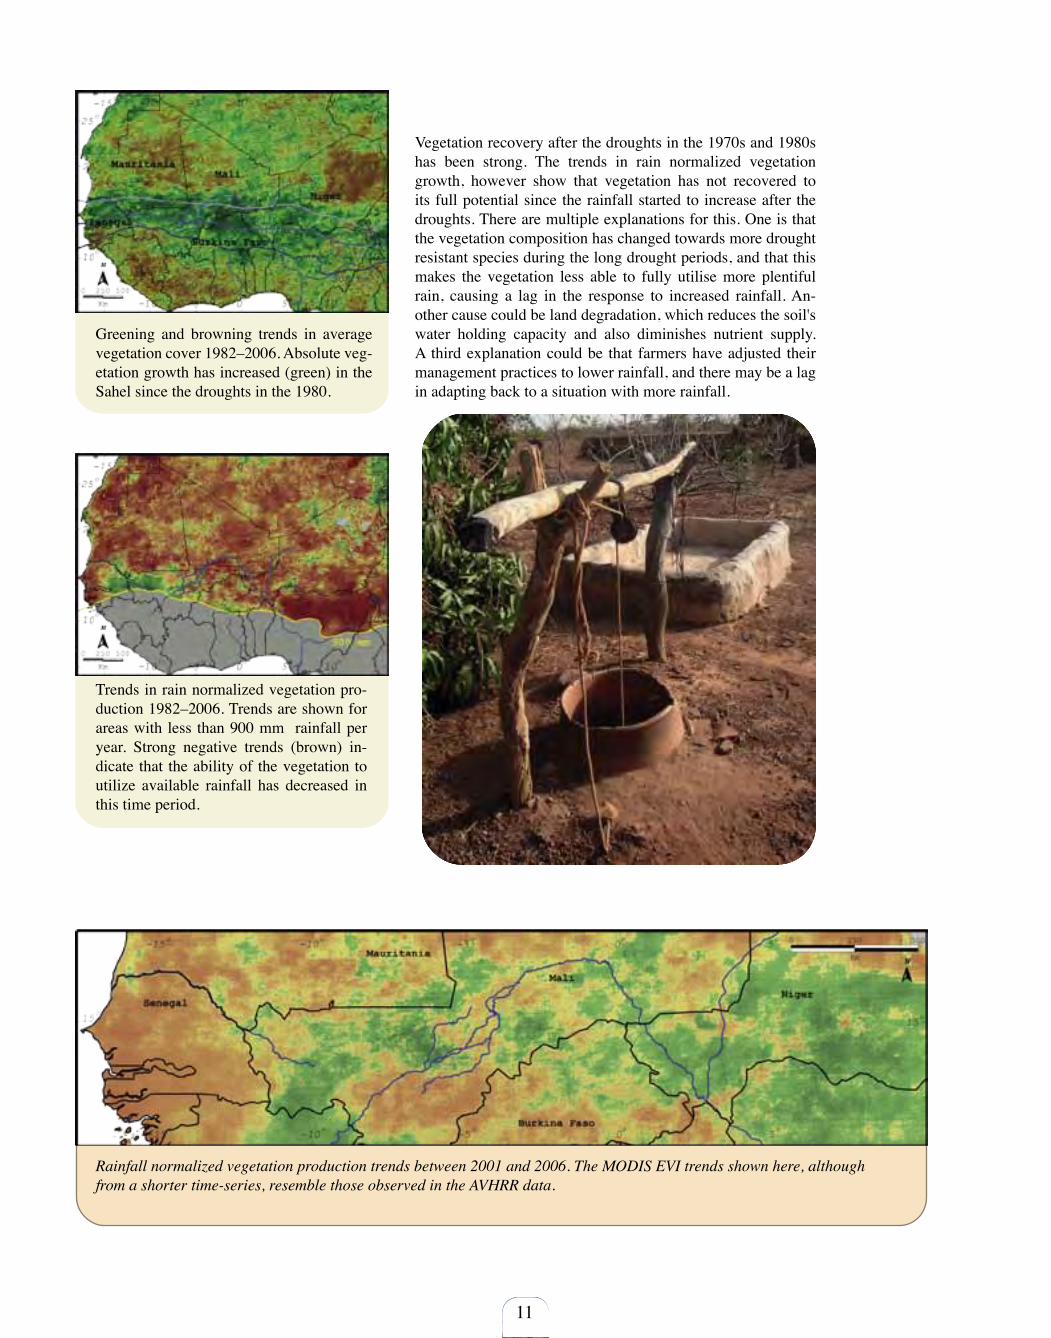
Vegetation recovery after the droughts in the 1970s and 1980s has been strong. The trends in rain normalized vegetation growth, however show that vegetation has not recovered to its full potential since the rainfall started to increase after the droughts. There are multiple explanations for this. One is that the vegetation composition has changed towards more drought resistant species during the long drought periods, and that this makes the vegetation less able to fully utilise more plentiful rain, causing a lag in the response to increased rainfall. An-other cause could be land degradation, which reduces the soil's water holding capacity and also diminishes nutrient supply. A third explanation could be that farmers have adjusted their management practices to lower rainfall, and there may be a lag in adapting back to a situation with more rainfall.
Greening and browning trends in average vegetation cover 1982–2006. Absolute veg-etation growth has increased (green) in the Sahel since the droughts in the 1980.
Trends in rain normalized vegetation pro-duction 1982–2006. Trends are shown for areas with less than 900 mm rainfall per year. Strong negative trends (brown) in-dicate that the ability of the vegetation to utilize available rainfall has decreased in this time period.
Rainfall normalized vegetation production trends between 2001 and 2006. The MODIS EVI trends shown here, although from a shorter time-series, resemble those observed in the AVHRR data.
12
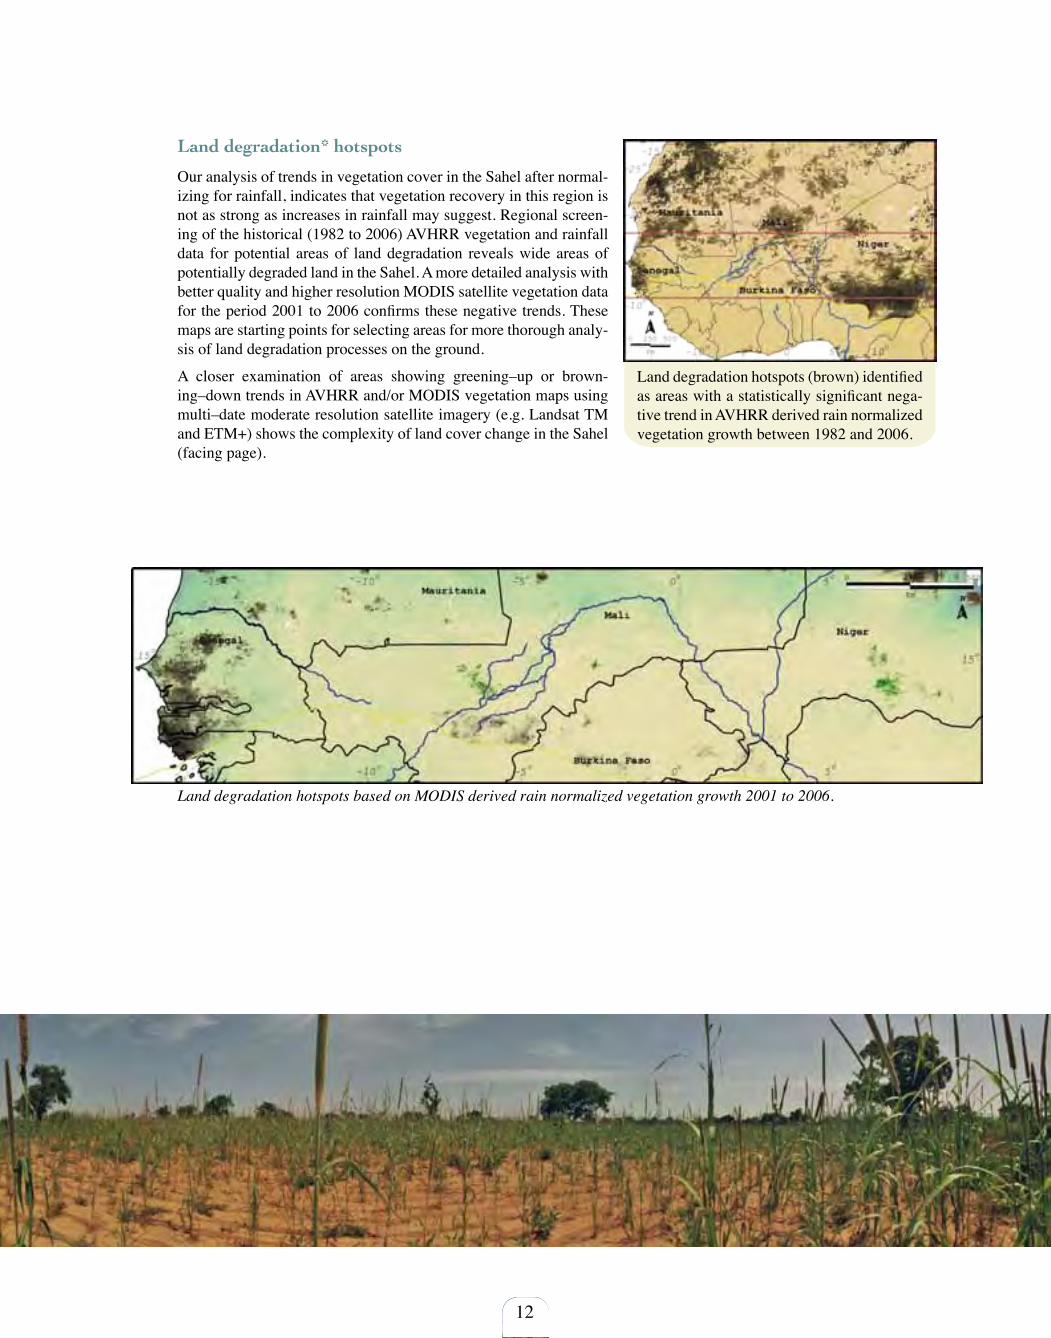
Land degradation hotspots based on MODIS derived rain normalized vegetation growth 2001 to 2006.
Land degradation* hotspots
Our analysis of trends in vegetation cover in the Sahel after normal-izing for rainfall, indicates that vegetation recovery in this region is not as strong as increases in rainfall may suggest. Regional screen-ing of the historical (1982 to 2006) AVHRR vegetation and rainfall data for potential areas of land degradation reveals wide areas of potentially degraded land in the Sahel. A more detailed analysis with better quality and higher resolution MODIS satellite vegetation data for the period 2001 to 2006 confirms these negative trends. These maps are starting points for selecting areas for more thorough analy-sis of land degradation processes on the ground.
A closer examination of areas showing greening–up or brown-ing–down trends in AVHRR and/or MODIS vegetation maps using multi–date moderate resolution satellite imagery (e.g. Landsat TM and ETM+) shows the complexity of land cover change in the Sahel (facing page).
Land degradation hotspots (brown) identified as areas with a statistically significant nega-tive trend in AVHRR derived rain normalized vegetation growth between 1982 and 2006.

13
Land cover change between 1988 and 1999 near Kalanbouli, Burkina Faso, from Landsat TM (left) and ETM+ (right).
*Defining desertification and land degradation
Despite a century of debate and research on desertification and land degradation, often focusing on the African Sahel, these concepts are difficult to define and identify. Hundreds of definitions have been sug-gested. One of the most widely used being that applied by the United Nations Convention to Combat Desertification (UNCCD);
“Land degradation in arid, semiarid and sub-humid areas resulting from various factors, including climate variations and human activities”, where land degradation refers to the UN (1994) definition; “reduction or loss of the biological and economic productivity and complexity of terrestrial ecosystems, including soils, vegetation, other biota, and the ecological biogeochemical, and hydrological processes that operate therein”.
The major bottleneck is a lack of scientific approaches applied consis-tently at local, national and regional scales. This means that manag-ers and policy makers have little reliable information for assessing and managing land degradation.
14
Land Degradation Surveillance
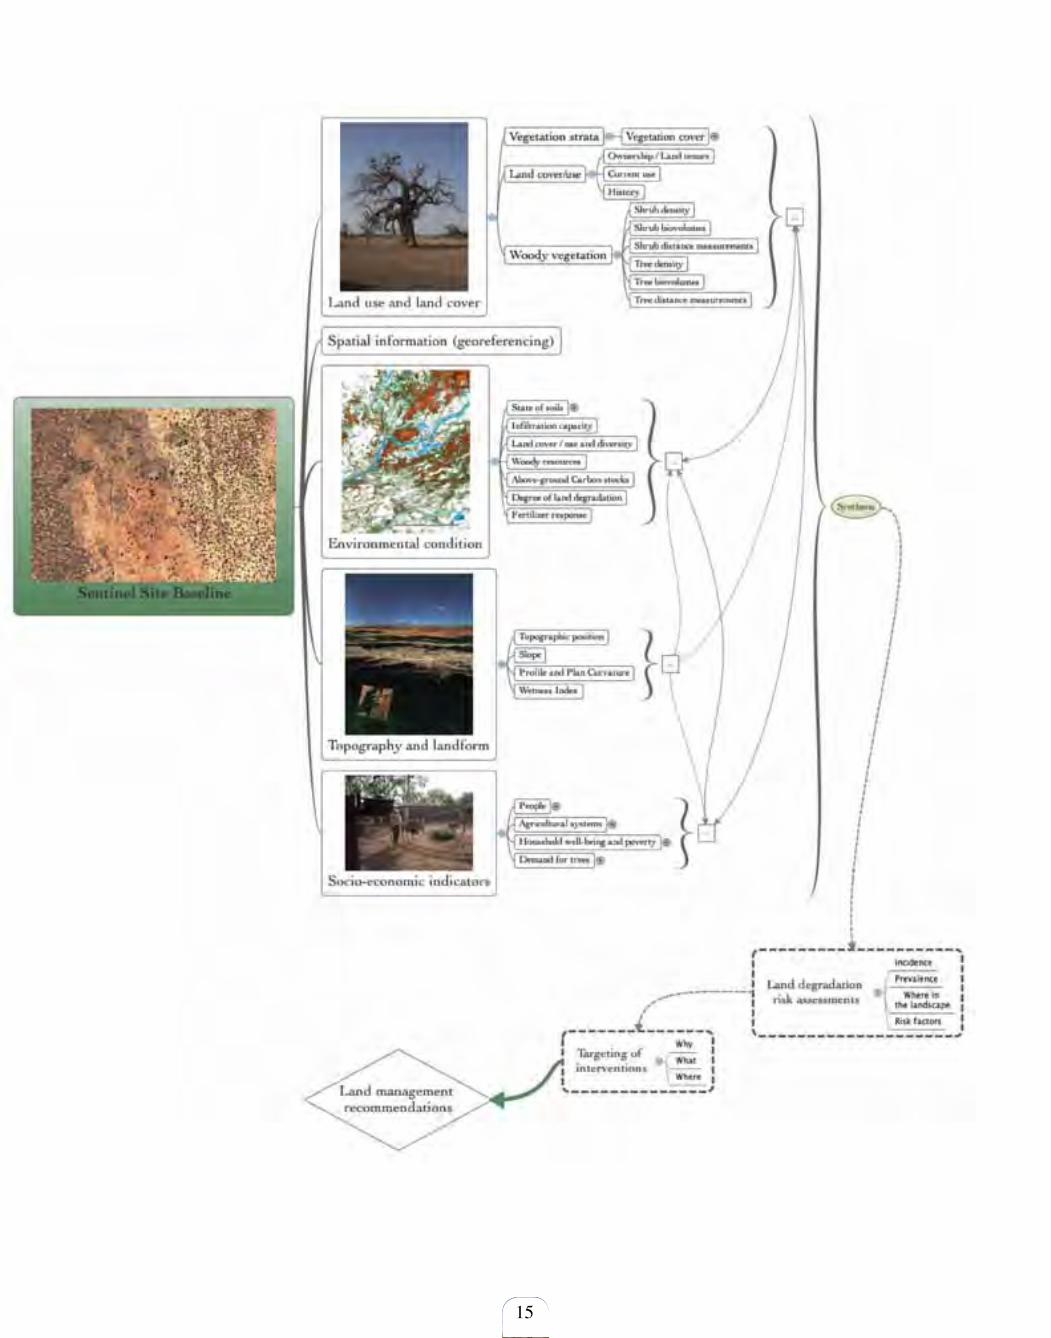
There is generally little systematic information about the state of water, soil and vegetation in the Sahel. This is largely due to a lack of systematic approaches to the measurement and monitoring of changes in for example land cover and use. Yet, such information is necessary to establish appropriate baselines for example for soil and vegetation condition, and to reliably determine the direction and extent of land cover change and processes of land degrada-tion. The same applies to processes of recovery. The Land Deg-radation Surveillance Framework (LDSF) is the result of several years of active research in various parts of the African continent, and in particular in Western Kenya and Madagascar. This atlas is a product of a UNEP project1 where the LDSF was applied.
Five “sentinel sites”, each 10 by 10 km in size, were established in the Segou Region in Mali, near the villages of Konobougou, Dianvola, Monimpebougou, Zebougou and Sokoura. These sites provide a starting point for reliable change detection and project impact attribution related to afforestation activities in the region, as well as agroforestry interventions and improved soil fertility management in cultivated areas.
1 An Ecosystem Approach to Restoring West African Drylands and Improving Rural Livelihoods through Agroforestry-based Land Management Interventions.”
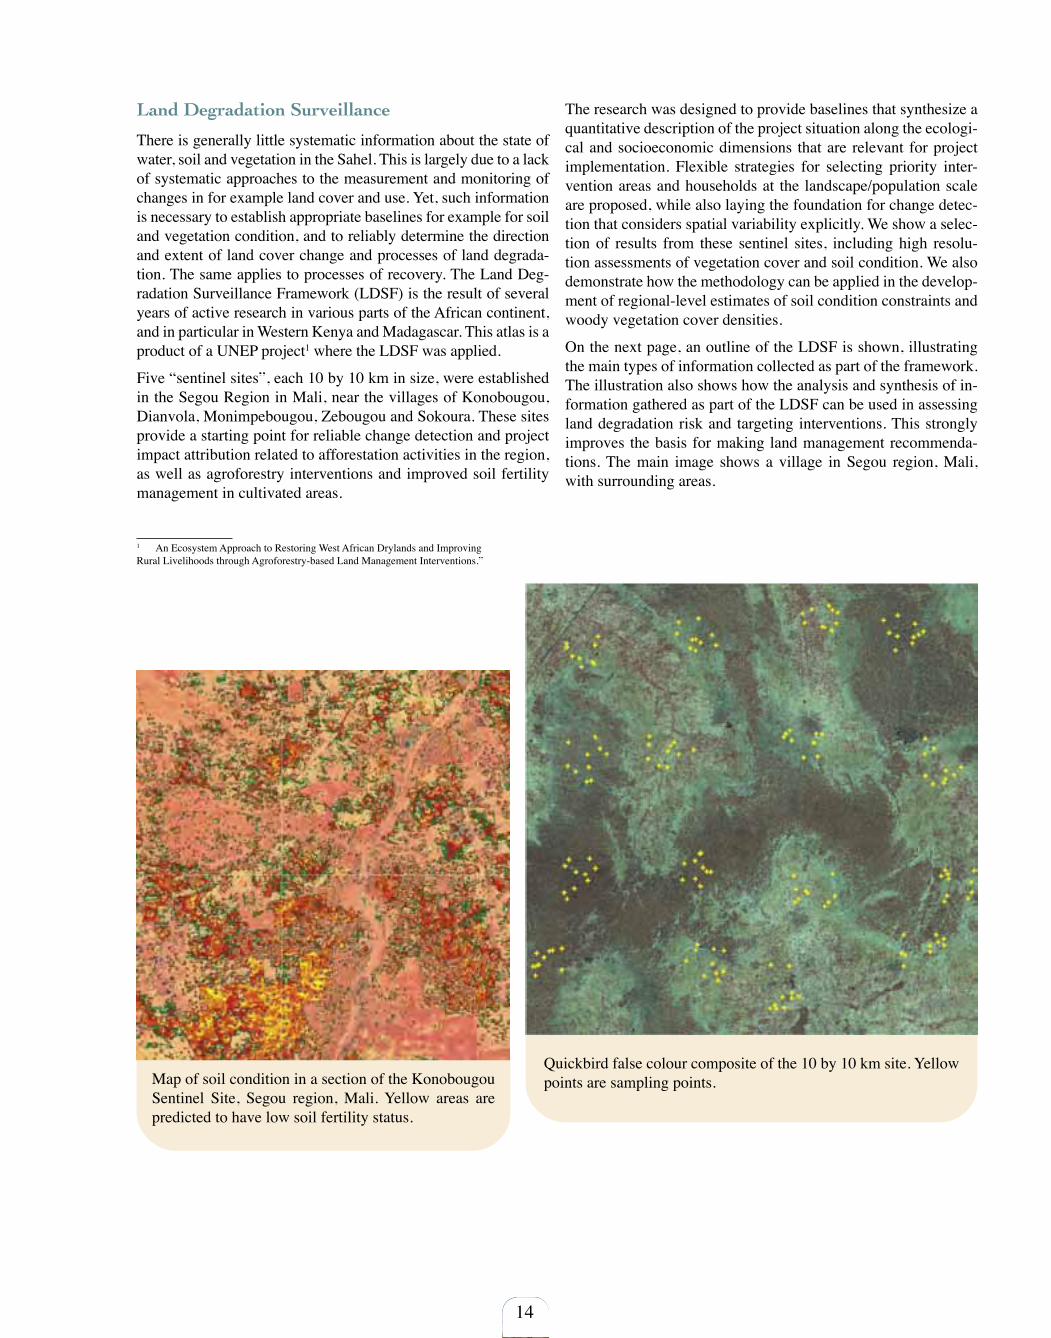
The research was designed to provide baselines that synthesize a quantitative description of the project situation along the ecologi-cal and socioeconomic dimensions that are relevant for project implementation. Flexible strategies for selecting priority inter-vention areas and households at the landscape/population scale are proposed, while also laying the foundation for change detec-tion that considers spatial variability explicitly. We show a selec-tion of results from these sentinel sites, including high resolu-tion assessments of vegetation cover and soil condition. We also demonstrate how the methodology can be applied in the develop-ment of regional-level estimates of soil condition constraints and woody vegetation cover densities.
On the next page, an outline of the LDSF is shown, illustrating the main types of information collected as part of the framework. The illustration also shows how the analysis and synthesis of in-formation gathered as part of the LDSF can be used in assessing land degradation risk and targeting interventions. This strongly improves the basis for making land management recommenda-tions. The main image shows a village in Segou region, Mali, with surrounding areas.
Map of soil condition in a section of the Konobougou Sentinel Site, Segou region, Mali. Yellow areas are predicted to have low soil fertility status.
Quickbird false colour composite of the 10 by 10 km site. Yellow points are sampling points.
15
16
Introduction
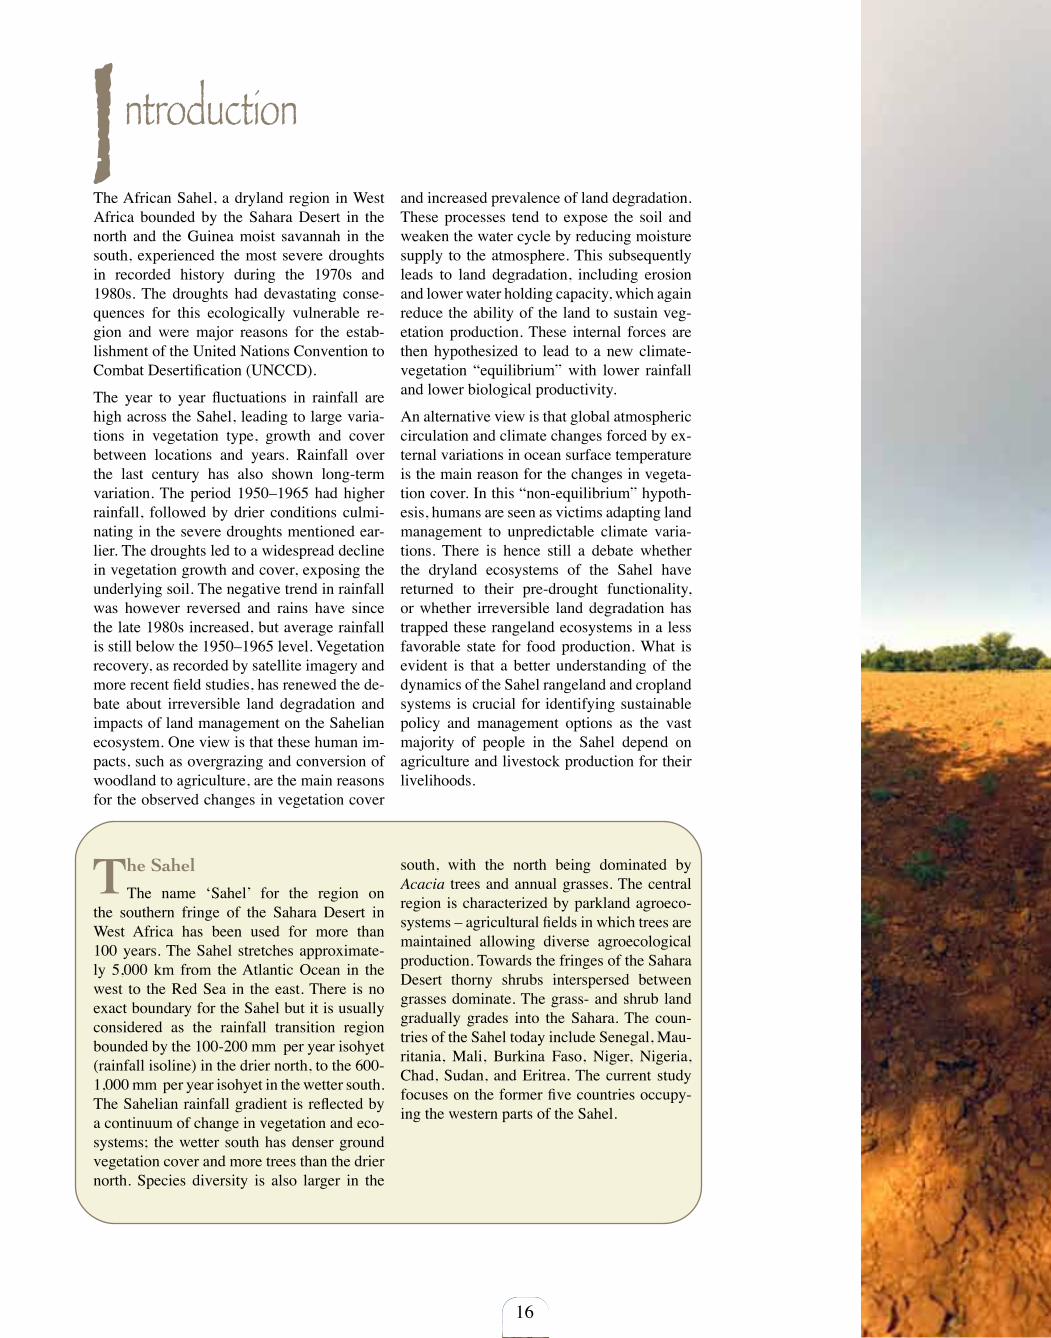
The African Sahel, a dryland region in West Africa bounded by the Sahara Desert in the north and the Guinea moist savannah in the south, experienced the most severe droughts in recorded history during the 1970s and 1980s. The droughts had devastating conse-quences for this ecologically vulnerable re-gion and were major reasons for the estab-lishment of the United Nations Convention to Combat Desertification (UNCCD).
The year to year fluctuations in rainfall are high across the Sahel, leading to large varia-tions in vegetation type, growth and cover between locations and years. Rainfall over the last century has also shown long-term variation. The period 1950–1965 had higher rainfall, followed by drier conditions culmi-nating in the severe droughts mentioned ear-lier. The droughts led to a widespread decline in vegetation growth and cover, exposing the underlying soil. The negative trend in rainfall was however reversed and rains have since the late 1980s increased, but average rainfall is still below the 1950–1965 level. Vegetation recovery, as recorded by satellite imagery and more recent field studies, has renewed the de-bate about irreversible land degradation and impacts of land management on the Sahelian ecosystem. One view is that these human im-pacts, such as overgrazing and conversion of woodland to agriculture, are the main reasons for the observed changes in vegetation cover
and increased prevalence of land degradation. These processes tend to expose the soil and weaken the water cycle by reducing moisture supply to the atmosphere. This subsequently leads to land degradation, including erosion and lower water holding capacity, which again reduce the ability of the land to sustain veg-etation production. These internal forces are then hypothesized to lead to a new climate-vegetation “equilibrium” with lower rainfall and lower biological productivity.
An alternative view is that global atmospheric circulation and climate changes forced by ex-ternal variations in ocean surface temperature is the main reason for the changes in vegeta-tion cover. In this “non-equilibrium” hypoth-esis, humans are seen as victims adapting land management to unpredictable climate varia-tions. There is hence still a debate whether the dryland ecosystems of the Sahel have returned to their pre-drought functionality, or whether irreversible land degradation has trapped these rangeland ecosystems in a less favorable state for food production. What is evident is that a better understanding of the dynamics of the Sahel rangeland and cropland systems is crucial for identifying sustainable policy and management options as the vast majority of people in the Sahel depend on agriculture and livestock production for their livelihoods.
The Sahel
The name ‘Sahel’ for the region on the southern fringe of the Sahara Desert in West Africa has been used for more than 100 years. The Sahel stretches approximate-ly 5,000 km from the Atlantic Ocean in the west to the Red Sea in the east. There is no exact boundary for the Sahel but it is usually considered as the rainfall transition region bounded by the 100-200 mm per year isohyet (rainfall isoline) in the drier north, to the 600-1,000 mm per year isohyet in the wetter south. The Sahelian rainfall gradient is reflected by a continuum of change in vegetation and eco-systems; the wetter south has denser ground vegetation cover and more trees than the drier north. Species diversity is also larger in the
south, with the north being dominated by Acacia trees and annual grasses. The central region is characterized by parkland agroeco-systems – agricultural fields in which trees are maintained allowing diverse agroecological production. Towards the fringes of the Sahara Desert thorny shrubs interspersed between grasses dominate. The grass- and shrub land gradually grades into the Sahara. The coun-tries of the Sahel today include Senegal, Mau-ritania, Mali, Burkina Faso, Niger, Nigeria, Chad, Sudan, and Eritrea. The current study focuses on the former five countries occupy-ing the western parts of the Sahel.
17
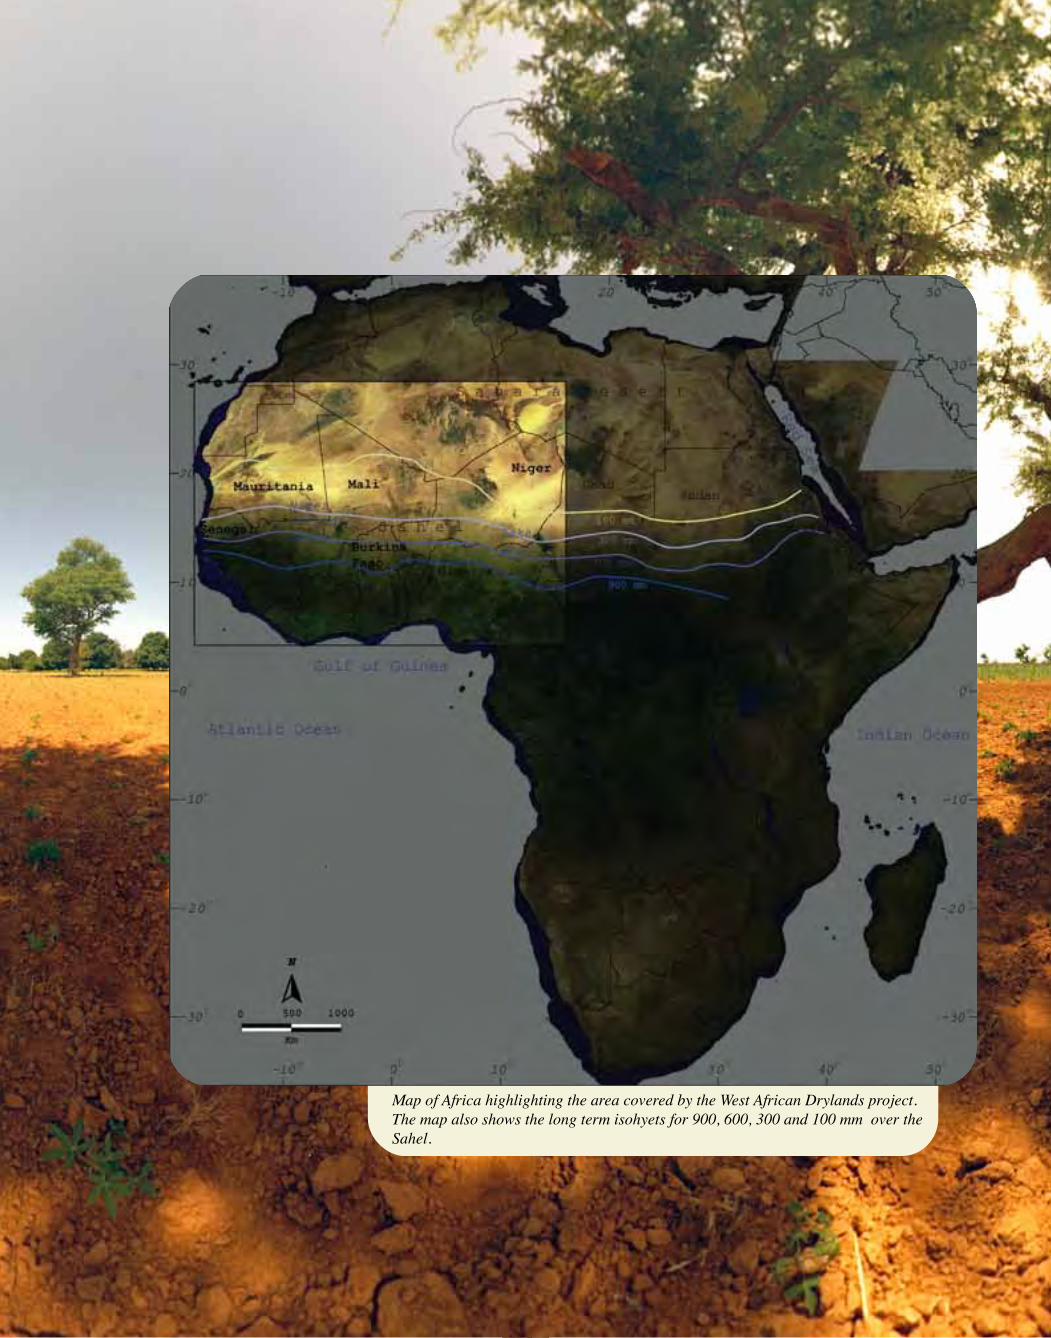
Map of Africa highlighting the area covered by the West African Drylands project. The map also shows the long term isohyets for 900, 600, 300 and 100 mm over the Sahel.
18
Landscapes
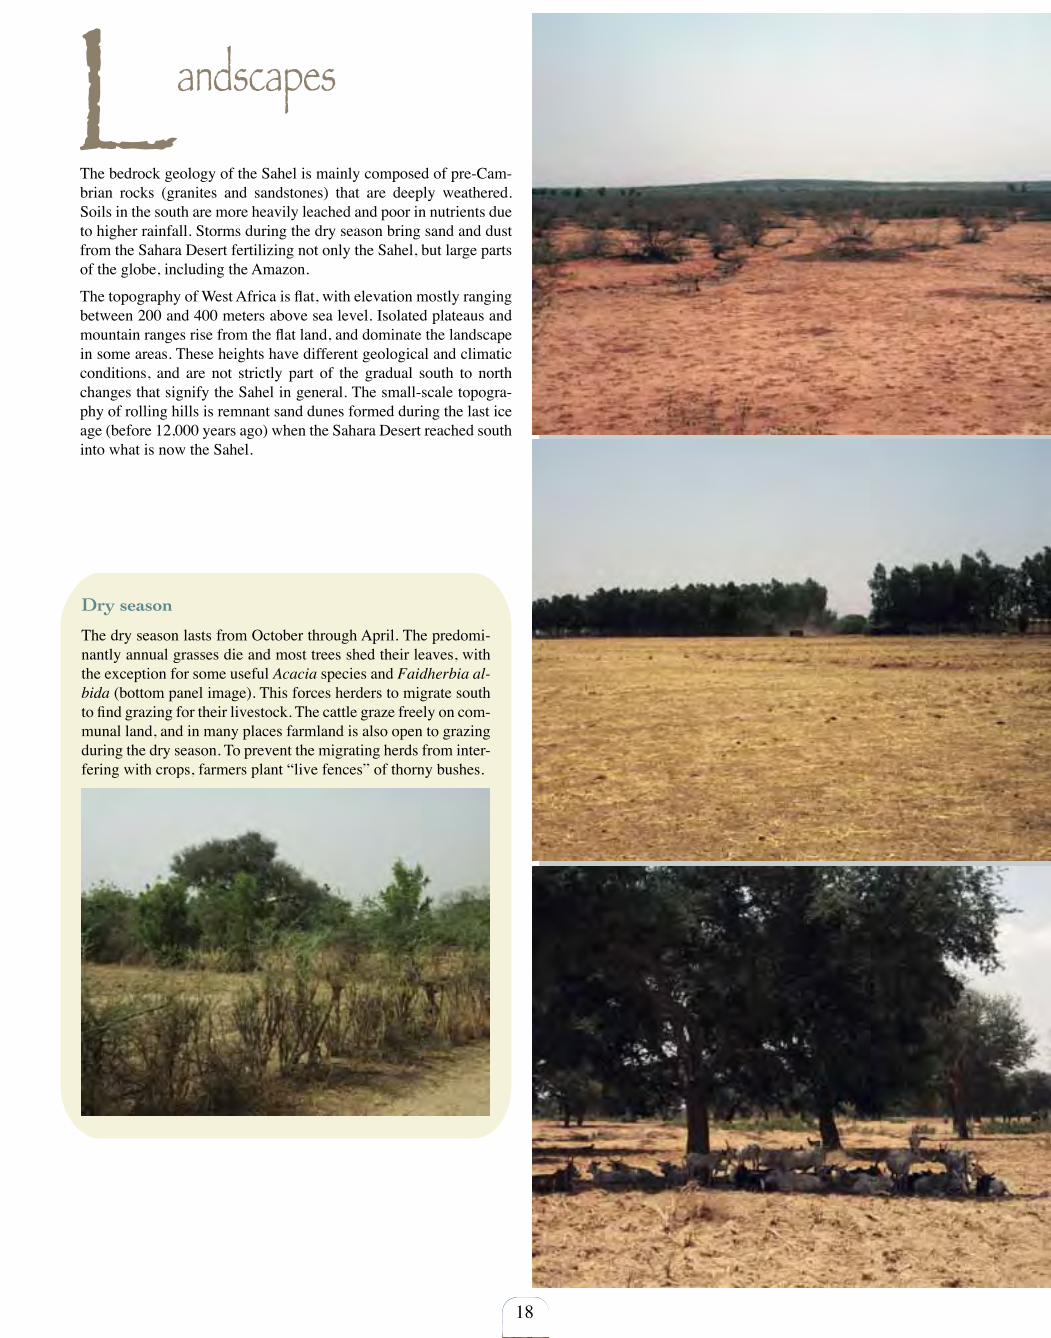
The bedrock geology of the Sahel is mainly composed of pre-Cam-brian rocks (granites and sandstones) that are deeply weathered. Soils in the south are more heavily leached and poor in nutrients due to higher rainfall. Storms during the dry season bring sand and dust from the Sahara Desert fertilizing not only the Sahel, but large parts of the globe, including the Amazon.
The topography of West Africa is flat, with elevation mostly ranging between 200 and 400 meters above sea level. Isolated plateaus and mountain ranges rise from the flat land, and dominate the landscape in some areas. These heights have different geological and climatic conditions, and are not strictly part of the gradual south to north changes that signify the Sahel in general. The small-scale topogra-phy of rolling hills is remnant sand dunes formed during the last ice age (before 12,000 years ago) when the Sahara Desert reached south into what is now the Sahel.
Dry season
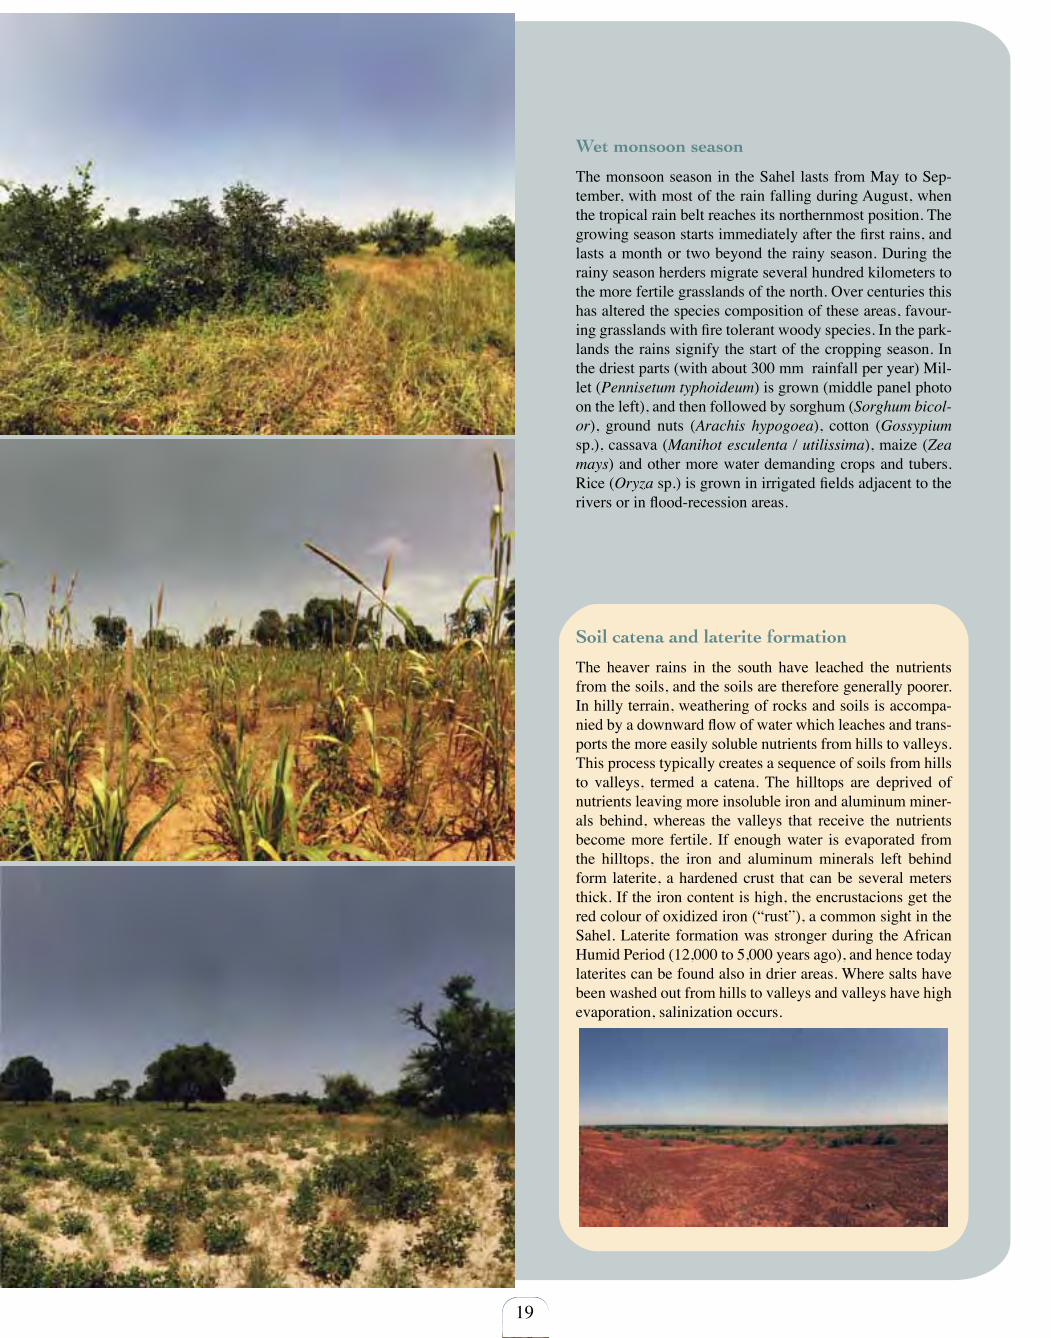
The dry season lasts from October through April. The predomi-nantly annual grasses die and most trees shed their leaves, with the exception for some useful Acacia species and Faidherbia al-bida (bottom panel image). This forces herders to migrate south to find grazing for their livestock. The cattle graze freely on com-munal land, and in many places farmland is also open to grazing during the dry season. To prevent the migrating herds from inter-fering with crops, farmers plant “live fences” of thorny bushes.
19
Wet monsoon season
The monsoon season in the Sahel lasts from May to Sep-tember, with most of the rain falling during August, when the tropical rain belt reaches its northernmost position. The growing season starts immediately after the first rains, and lasts a month or two beyond the rainy season. During the rainy season herders migrate several hundred kilometers to the more fertile grasslands of the north. Over centuries this has altered the species composition of these areas, favour-ing grasslands with fire tolerant woody species. In the park-lands the rains signify the start of the cropping season. In the driest parts (with about 300 mm rainfall per year) Mil-let (Pennisetum typhoideum) is grown (middle panel photo on the left), and then followed by sorghum (Sorghum bicol-or), ground nuts (Arachis hypogoea), cotton (Gossypium sp.), cassava (Manihot esculenta / utilissima), maize (Zea mays) and other more water demanding crops and tubers. Rice (Oryza sp.) is grown in irrigated fields adjacent to the rivers or in flood-recession areas.
Soil catena and laterite formation
The heaver rains in the south have leached the nutrients from the soils, and the soils are therefore generally poorer. In hilly terrain, weathering of rocks and soils is accompa-nied by a downward flow of water which leaches and trans-ports the more easily soluble nutrients from hills to valleys. This process typically creates a sequence of soils from hills to valleys, termed a catena. The hilltops are deprived of nutrients leaving more insoluble iron and aluminum miner-als behind, whereas the valleys that receive the nutrients become more fertile. If enough water is evaporated from the hilltops, the iron and aluminum minerals left behind form laterite, a hardened crust that can be several meters thick. If the iron content is high, the encrustacions get the red colour of oxidized iron (“rust”), a common sight in the Sahel. Laterite formation was stronger during the African Humid Period (12,000 to 5,000 years ago), and hence today laterites can be found also in drier areas. Where salts have been washed out from hills to valleys and valleys have high evaporation, salinization occurs.
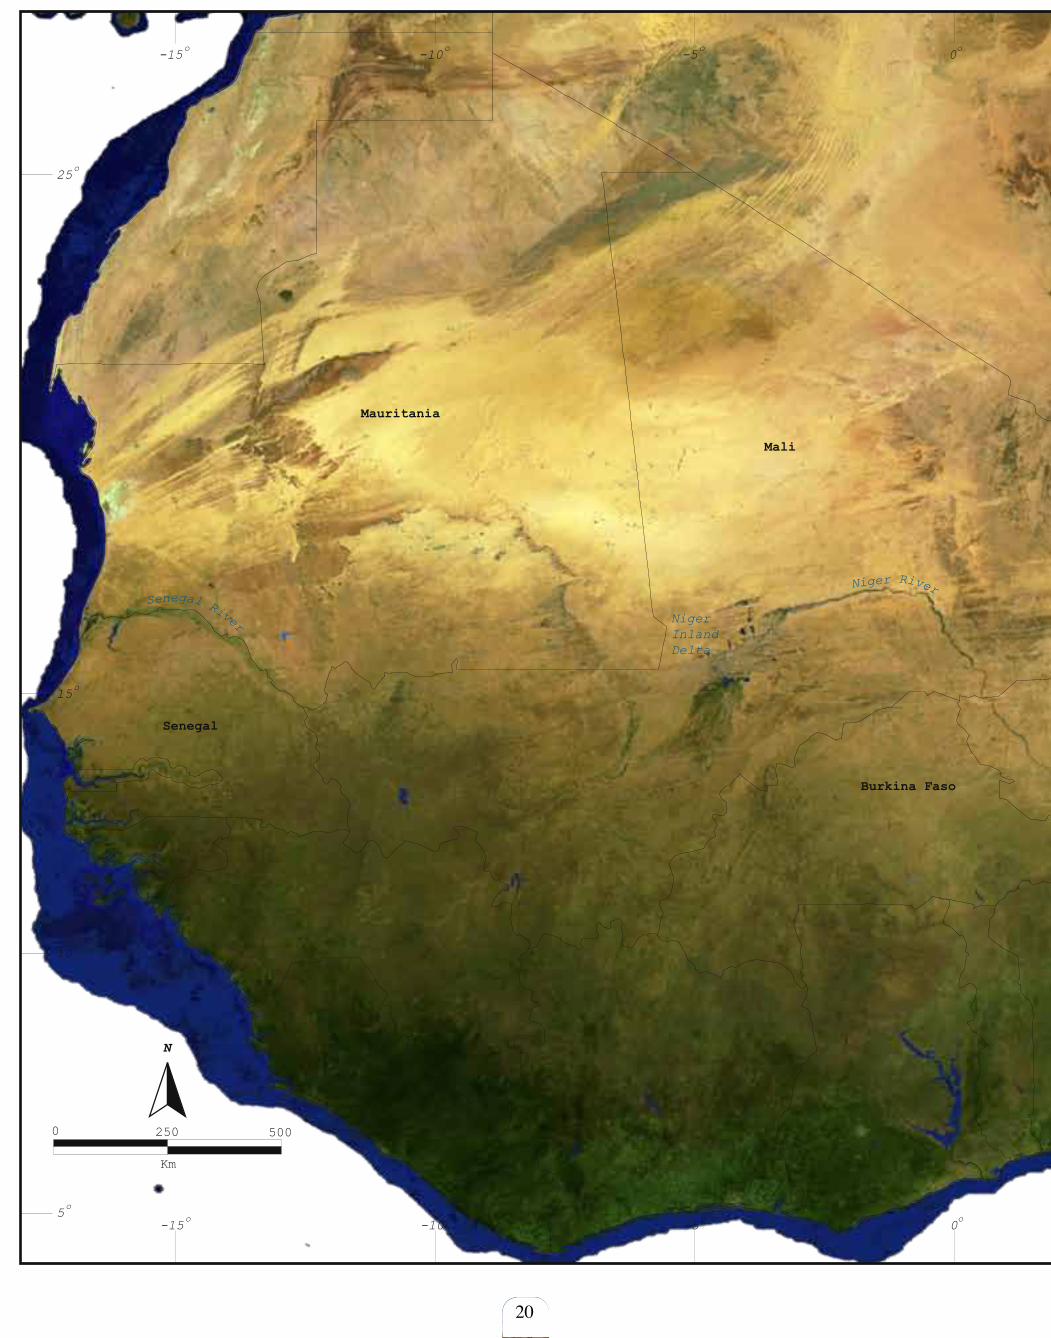
20
0 250 500
Km
N
Senegal River
Niger River
Mauritania
Mali
Niger
Burkina Faso
Senegal
5o
10o
15o
20o
25o
-15o
-10o
-5o
0o
5o
10o
15o
-15o
-10o
-5o
0o
5o
10o
15o5
o
10o
15o
20o
25o
NigerInlandDelta
LakeChad
21
0 250 500
Km
N
Senegal River
Niger River
Mauritania
Mali
Niger
Burkina Faso
Senegal
5o
10o
15o
20o
25o
-15o
-10o
-5o
0o
5o
10o
15o
-15o
-10o
-5o
0o
5o
10o
15o5
o
10o
15o
20o
25o
NigerInlandDelta
LakeChad
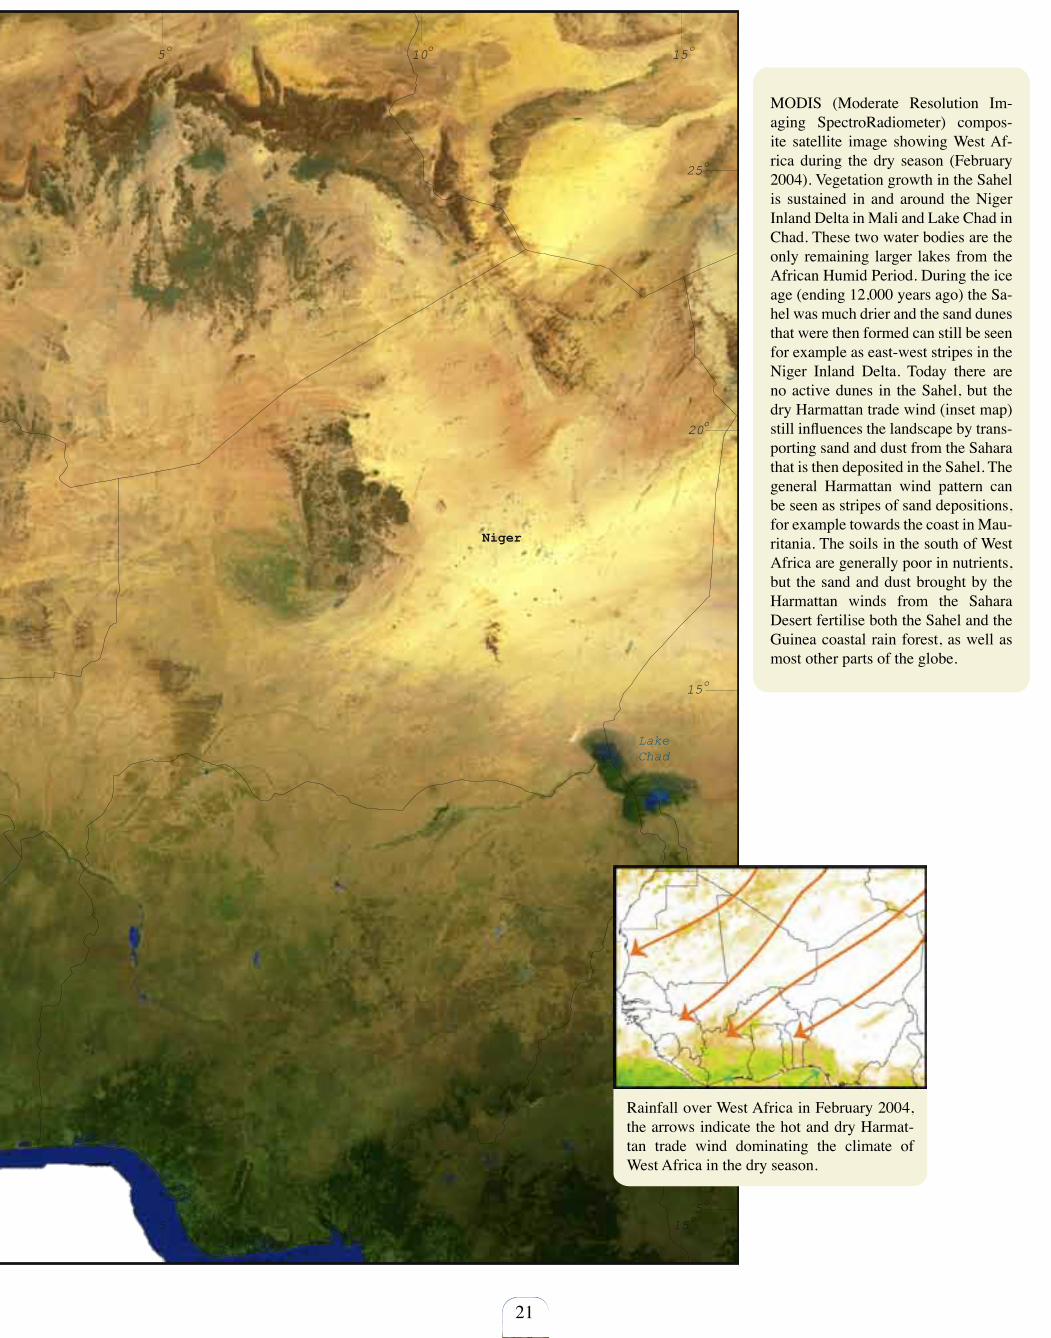
MODIS (Moderate Resolution Im-aging SpectroRadiometer) compos-ite satellite image showing West Af-rica during the dry season (February 2004). Vegetation growth in the Sahel is sustained in and around the Niger Inland Delta in Mali and Lake Chad in Chad. These two water bodies are the only remaining larger lakes from the African Humid Period. During the ice age (ending 12,000 years ago) the Sa-hel was much drier and the sand dunes that were then formed can still be seen for example as east-west stripes in the Niger Inland Delta. Today there are no active dunes in the Sahel, but the dry Harmattan trade wind (inset map) still influences the landscape by trans-porting sand and dust from the Sahara that is then deposited in the Sahel. The general Harmattan wind pattern can be seen as stripes of sand depositions, for example towards the coast in Mau-ritania. The soils in the south of West Africa are generally poor in nutrients, but the sand and dust brought by the Harmattan winds from the Sahara Desert fertilise both the Sahel and the Guinea coastal rain forest, as well as most other parts of the globe.
Rainfall over West Africa in February 2004, the arrows indicate the hot and dry Harmat-tan trade wind dominating the climate of West Africa in the dry season.

22
23
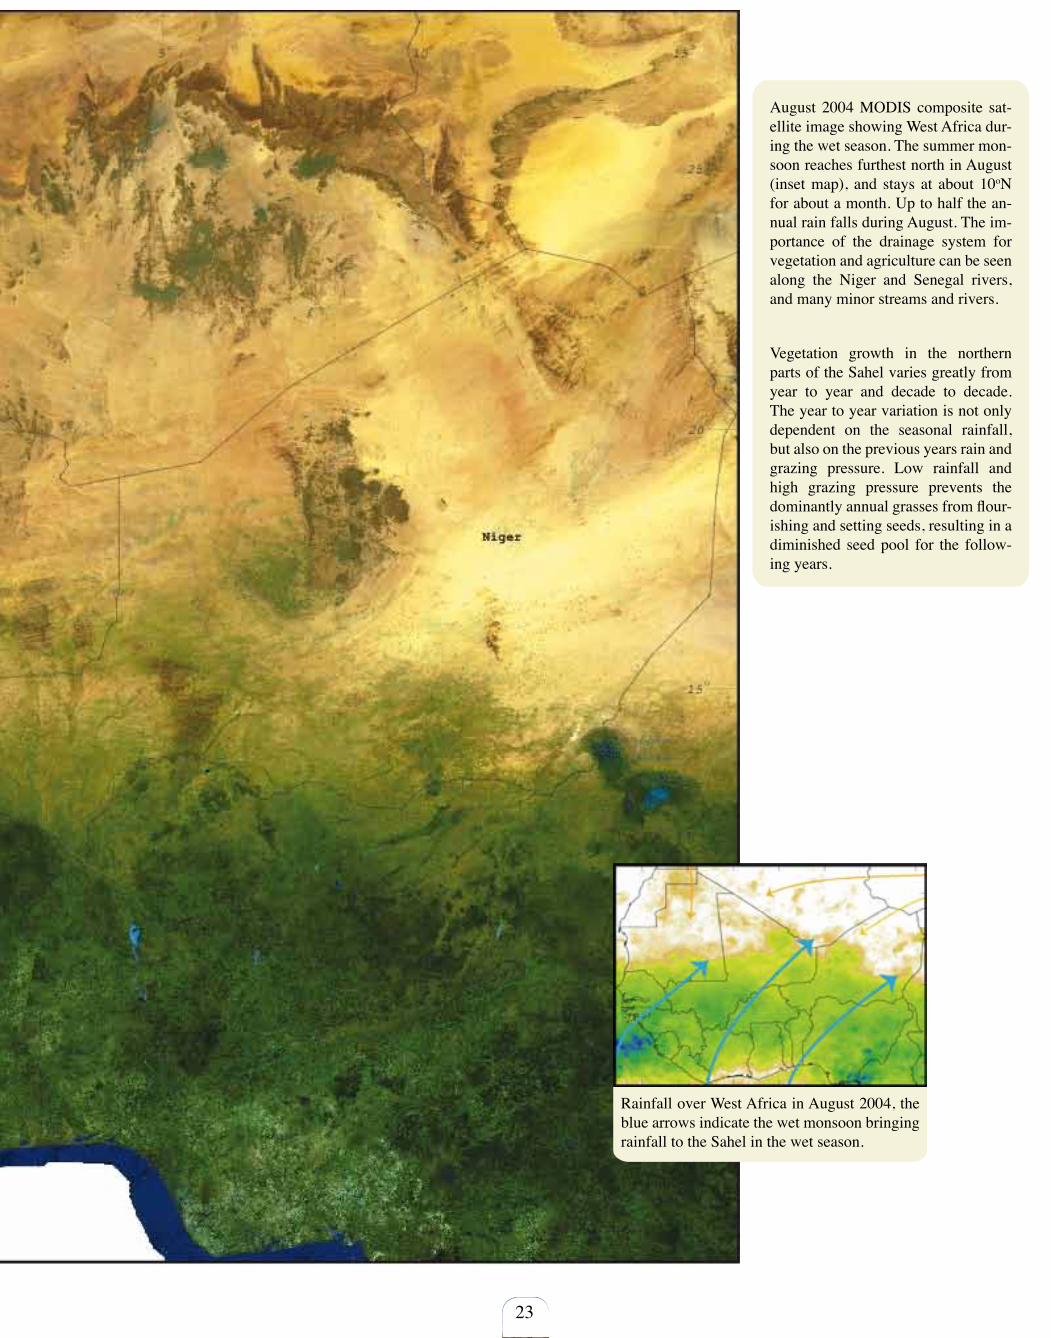
August 2004 MODIS composite sat-ellite image showing West Africa dur-ing the wet season. The summer mon-soon reaches furthest north in August (inset map), and stays at about 10oN for about a month. Up to half the an-nual rain falls during August. The im-portance of the drainage system for vegetation and agriculture can be seen along the Niger and Senegal rivers, and many minor streams and rivers.
Vegetation growth in the northern parts of the Sahel varies greatly from year to year and decade to decade. The year to year variation is not only dependent on the seasonal rainfall, but also on the previous years rain and grazing pressure. Low rainfall and high grazing pressure prevents the dominantly annual grasses from flour-ishing and setting seeds, resulting in a diminished seed pool for the follow-ing years.
Rainfall over West Africa in August 2004, the blue arrows indicate the wet monsoon bringing rainfall to the Sahel in the wet season.
24
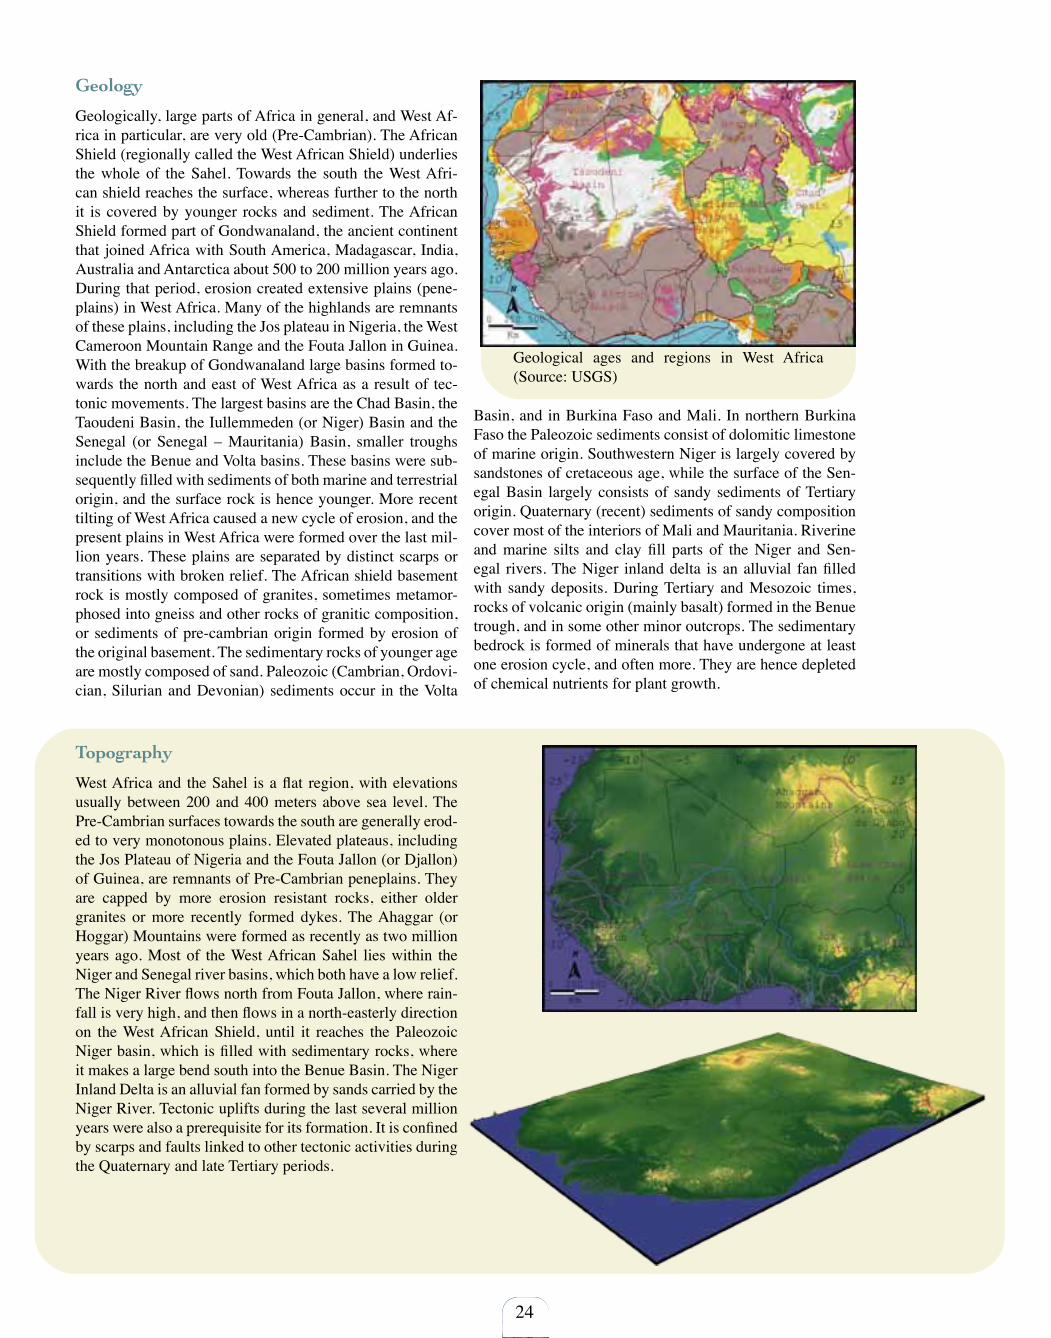
Geological ages and regions in West Africa (Source: USGS)
Geology
Geologically, large parts of Africa in general, and West Af-rica in particular, are very old (Pre-Cambrian). The African Shield (regionally called the West African Shield) underlies the whole of the Sahel. Towards the south the West Afri-can shield reaches the surface, whereas further to the north it is covered by younger rocks and sediment. The African Shield formed part of Gondwanaland, the ancient continent that joined Africa with South America, Madagascar, India, Australia and Antarctica about 500 to 200 million years ago. During that period, erosion created extensive plains (pene-plains) in West Africa. Many of the highlands are remnants of these plains, including the Jos plateau in Nigeria, the West Cameroon Mountain Range and the Fouta Jallon in Guinea. With the breakup of Gondwanaland large basins formed to-wards the north and east of West Africa as a result of tec-tonic movements. The largest basins are the Chad Basin, the Taoudeni Basin, the Iullemmeden (or Niger) Basin and the Senegal (or Senegal – Mauritania) Basin, smaller troughs include the Benue and Volta basins. These basins were sub-sequently filled with sediments of both marine and terrestrial origin, and the surface rock is hence younger. More recent tilting of West Africa caused a new cycle of erosion, and the present plains in West Africa were formed over the last mil-lion years. These plains are separated by distinct scarps or transitions with broken relief. The African shield basement rock is mostly composed of granites, sometimes metamor-phosed into gneiss and other rocks of granitic composition, or sediments of pre-cambrian origin formed by erosion of the original basement. The sedimentary rocks of younger age are mostly composed of sand. Paleozoic (Cambrian, Ordovi-cian, Silurian and Devonian) sediments occur in the Volta
Basin, and in Burkina Faso and Mali. In northern Burkina Faso the Paleozoic sediments consist of dolomitic limestone of marine origin. Southwestern Niger is largely covered by sandstones of cretaceous age, while the surface of the Sen-egal Basin largely consists of sandy sediments of Tertiary origin. Quaternary (recent) sediments of sandy composition cover most of the interiors of Mali and Mauritania. Riverine and marine silts and clay fill parts of the Niger and Sen-egal rivers. The Niger inland delta is an alluvial fan filled with sandy deposits. During Tertiary and Mesozoic times, rocks of volcanic origin (mainly basalt) formed in the Benue trough, and in some other minor outcrops. The sedimentary bedrock is formed of minerals that have undergone at least one erosion cycle, and often more. They are hence depleted of chemical nutrients for plant growth.
Topography
West Africa and the Sahel is a flat region, with elevations usually between 200 and 400 meters above sea level. The Pre-Cambrian surfaces towards the south are generally erod-ed to very monotonous plains. Elevated plateaus, including the Jos Plateau of Nigeria and the Fouta Jallon (or Djallon) of Guinea, are remnants of Pre-Cambrian peneplains. They are capped by more erosion resistant rocks, either older granites or more recently formed dykes. The Ahaggar (or Hoggar) Mountains were formed as recently as two million years ago. Most of the West African Sahel lies within the Niger and Senegal river basins, which both have a low relief. The Niger River flows north from Fouta Jallon, where rain-fall is very high, and then flows in a north-easterly direction on the West African Shield, until it reaches the Paleozoic Niger basin, which is filled with sedimentary rocks, where it makes a large bend south into the Benue Basin. The Niger Inland Delta is an alluvial fan formed by sands carried by the Niger River. Tectonic uplifts during the last several million years were also a prerequisite for its formation. It is confined by scarps and faults linked to other tectonic activities during the Quaternary and late Tertiary periods.
25
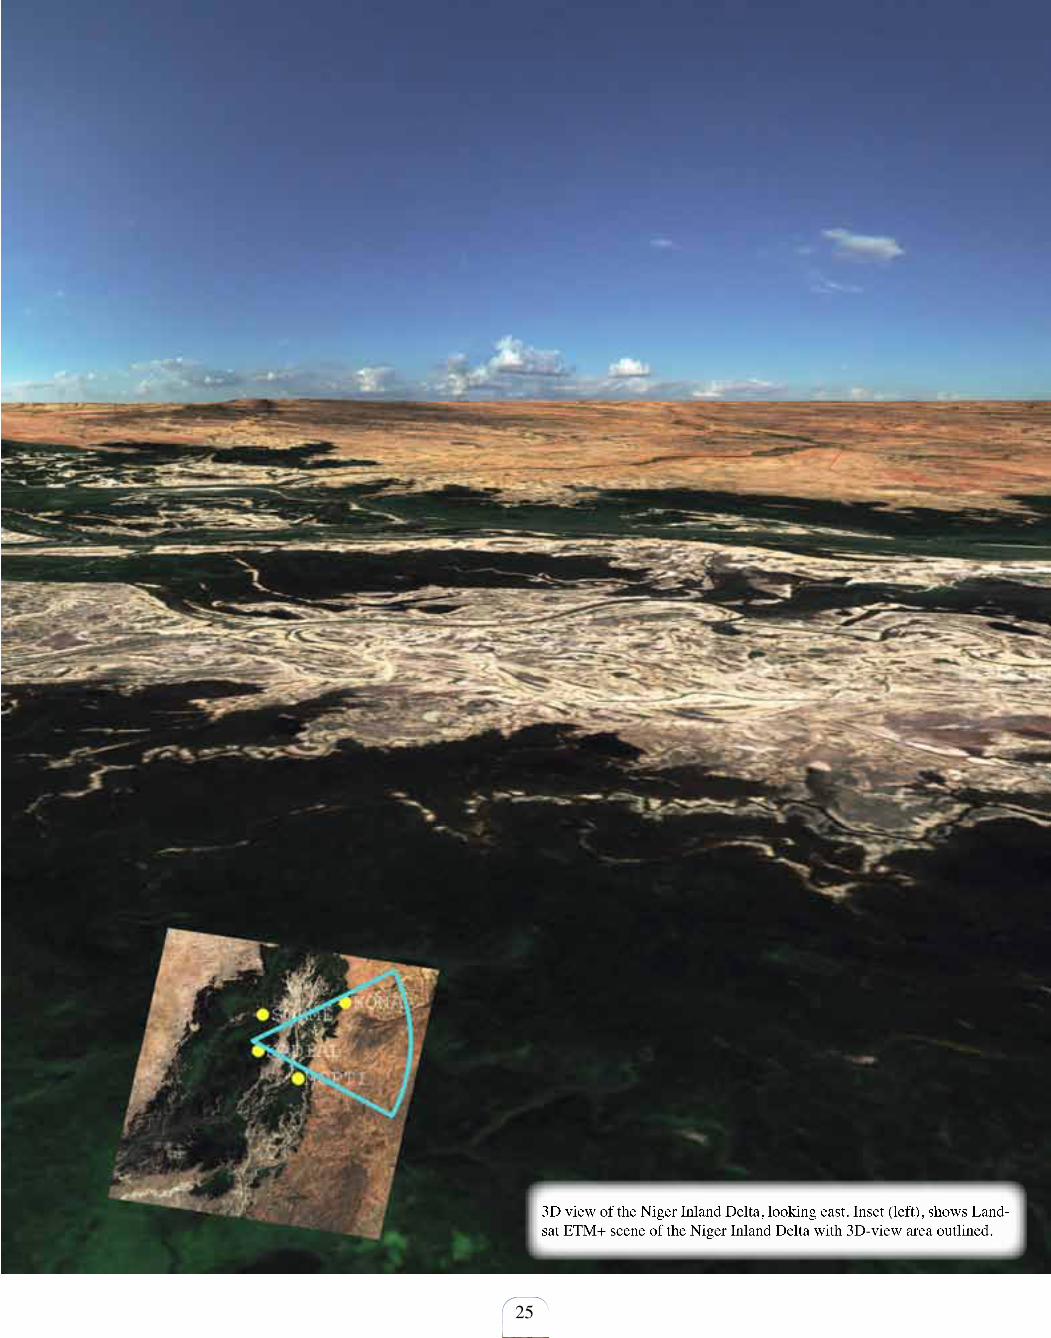
3D view of the Niger Inland Delta, looking east. Inset (left), shows Land-sat ETM+ scene of the Niger Inland Delta with 3D-view area outlined.
26
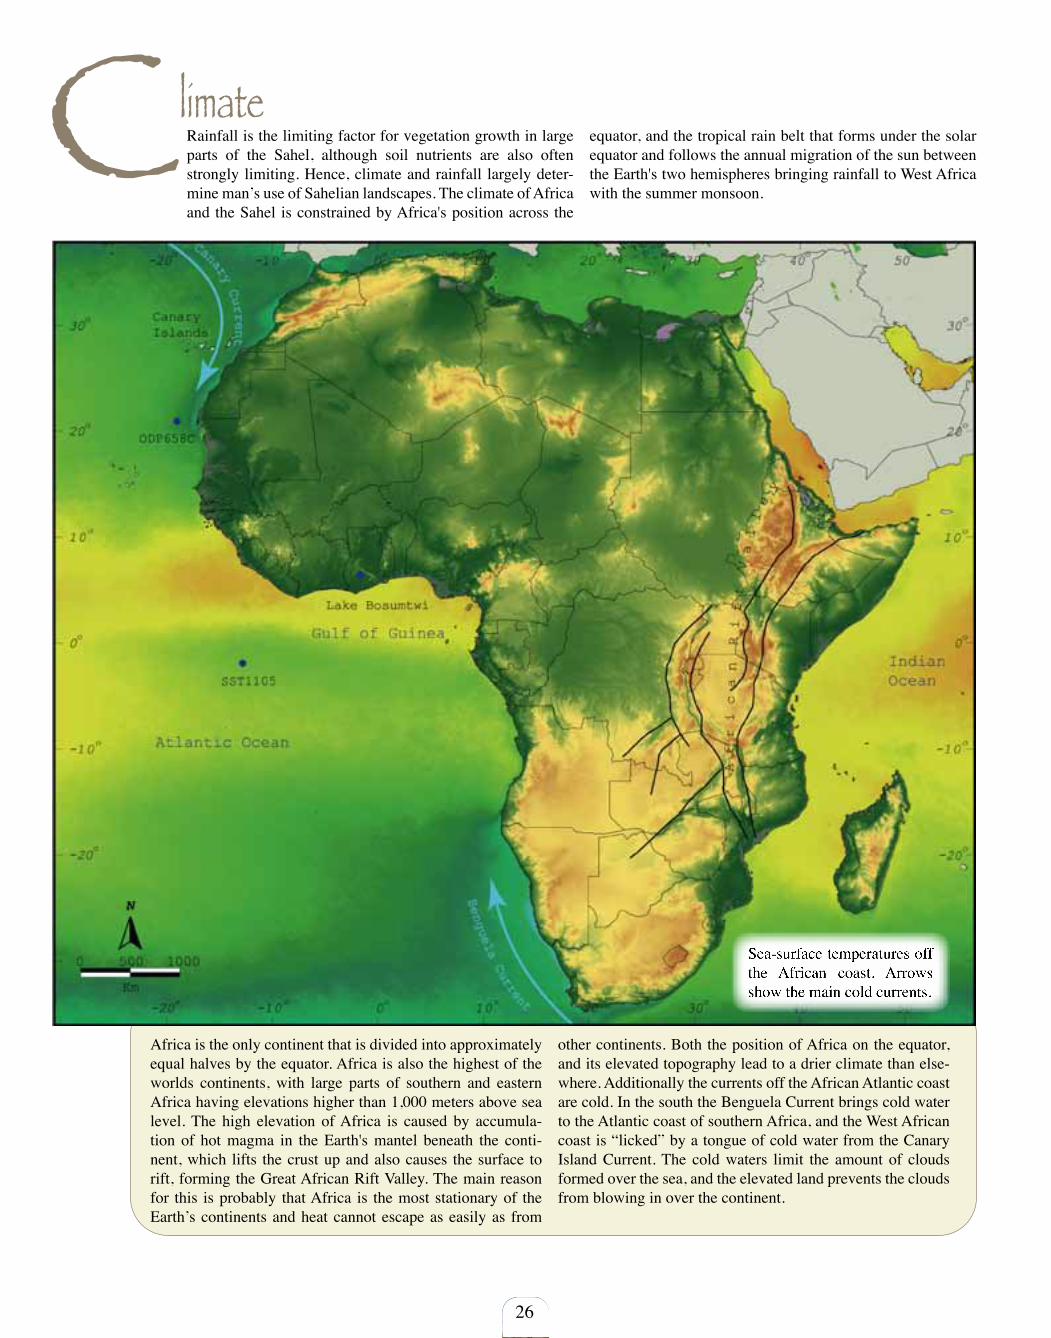
Climate Rainfall is the limiting factor for vegetation growth in large parts of the Sahel, although soil nutrients are also often strongly limiting. Hence, climate and rainfall largely deter-mine man’s use of Sahelian landscapes. The climate of Africa and the Sahel is constrained by Africa's position across the
equator, and the tropical rain belt that forms under the solar equator and follows the annual migration of the sun between the Earth's two hemispheres bringing rainfall to West Africa with the summer monsoon.
Africa is the only continent that is divided into approximately equal halves by the equator. Africa is also the highest of the worlds continents, with large parts of southern and eastern Africa having elevations higher than 1,000 meters above sea level. The high elevation of Africa is caused by accumula-tion of hot magma in the Earth's mantel beneath the conti-nent, which lifts the crust up and also causes the surface to rift, forming the Great African Rift Valley. The main reason for this is probably that Africa is the most stationary of the Earth’s continents and heat cannot escape as easily as from
other continents. Both the position of Africa on the equator, and its elevated topography lead to a drier climate than else-where. Additionally the currents off the African Atlantic coast are cold. In the south the Benguela Current brings cold water to the Atlantic coast of southern Africa, and the West African coast is “licked” by a tongue of cold water from the Canary Island Current. The cold waters limit the amount of clouds formed over the sea, and the elevated land prevents the clouds from blowing in over the continent.
Sea-surface temperatures off the African coast. Arrows show the main cold currents.
27
Climate change and biophysical feedback
The global climate depends on cyclic variations in solar ra-diation related to the position of the Sun relative to the Earth, and the tilt of the Earth's rotational axis. These variations are reinforced by a sequence of physical and biological responses primarily related to changes in the Earth’s ground cover, atmo-spheric content of greenhouse gases, and ocean circulation and bioproduction. The major mechanism behind this reinforced change (or positive feedback) is that a general cooling (warm-ing) will lead to growth (decline) of ice sheets reflecting more (less) of the incoming solar radiation, leading to further cooling (warming). In a cooling phase the growing ice sheets will de-plete the oceans of water. The sinking water surface will erode accumulated near-shore sediments and thence fertilise the ocean.
The nutrients released from the sediments will promote aquatic biological growth that will consume carbon dioxide from the at-mosphere – the most important of the greenhouse gases. The oceans will also get cooler and more of the greenhouse gases (notably carbon dioxide and methane) can be dissolved in the colder waters – further depleting the atmosphere of greenhouse gases. The thermohaline circulation is also affected by the global climate and can further reinforce climate changes as deep water formation is a key process for transferring climate gases from the atmosphere to the deep ocean. The loss of greenhouse gases from the atmosphere will lead to further global cooling. A cooler land surface will also lead to more reflection of solar radiation as vegetation cover decreases and is replaced by more reflective soils, and as more dust is produced from the exposed soil.
External climate forcing
Rainfall over West Africa is strongly influenced by global atmo-spheric circulation patterns and annual variations in sea surface tem-perature (SST). Both the Atlantic and the Indian Ocean are thought to play major roles in controlling the tropical rain belt and the Sahel summer monsoon. In general the tropical rain belt (see next page) will reach further north into the Sahel if the Atlantic Gulf Current transporting warm water northwards in the Atlantic is strong, and when the Indian Ocean cools down. The northward flow in the Atlan-tic is largely regulated by the Atlantic Ocean overturning driven by surface water sinking in the North Atlantic Ocean around Greenland, a process driven by the northward flowing water becoming heavier as the water cools down and salts are concentrated by evaporation. This process of heavier cold and salt water sinking towards the deep ocean is called thermohaline (meridional) circulation, and is of ma-jor importance for the ocean global circulation, sometimes called the conveyor belt. The surface temperature of the Atlantic Ocean along the West Africa coast is however also related to the Canary Current and Atlantic turnover at mid latitudes.
Annual to decadal variations in rainfall over West Africa and the Sa-hel are related to the surface temperatures in the Indian Ocean, with a warmer ocean depriving the Sahel of rainfall. Over longer time pe-riods, the thermohaline driven circulation of the Atlantic Ocean is thought to be more important, with a stronger northward current in the Atlantic dragging the summer monsoon further north into the Sa-hel. This is generally accepted as the cause of desert conditions in the Sahel during the last ice age, when the thermohaline driven cycling of the Atlantic Ocean was largely shut off. Reduced thermohaline circu-lation probably also initiated the drying cycle that led to the droughts in the 1970s and 1980s. The thermohaline overturning of the Atlantic has however continued to decrease also after the rains returned to the Sahel, whereas the transport of Atlantic surface water across 25°N (outside West Africa) has remained nearly constant.
Internal climate feedback
Most of the solar radiation that is received by the Earth is ex-changed (or dissipated) at the Soil-Vegetation-Atmosphere interface. Part of the incoming radiation is reflected, dependent on the albedo (brightness) of the surface. Snow has a very high albedo reflecting most of the incoming radiation, and soil usually has a higher albedo than vegetation. A dry surface has a higher albedo than a wet surface.
Part of the incoming radiation is absorbed, for instance by vegetation for driving the process of photosynthesis, or directly by the soil or water surface that then warms up. A large fraction of the incoming ra-diation is used for evaporating water, transferring liquid water at the surface to water vapor in the atmosphere. As evaporation is a highly energy demanding process (boiling water needs large amounts of heat) it keeps the surface cool (hence it is cooler near a water body on a sunny day compared to inland). Vegetation has the ability to transfer water from deep in the soil to the surface. Plants transfer water from the roots to the leaves and then to the atmosphere, which cools the surface and fills the atmosphere with water vapor. Where vegetation is dense it therefore controls surface temperature, and saturates the atmosphere with water. If this process is effective, the lower atmo-sphere will get saturated with water towards the afternoon when solar radiation decreases and the air temperature sinks. This causes water vapor to condensate into drops and form clouds. If conditions are favorable, afternoon rain will fall after a morning with cloud buildup. In drylands this in an important process for rainfall generation, often in the form of thunderstorms. Vegetation therefore assists in creating a closed vertical loop with evapotranspiration going up and rainfall coming down. If vegetation cover is lost, this closed vertical loop is broken, leading to the land surface heating up. This results in further deterioration of conditions for vegetation growth. This is an impor-tant internal climate feedback mechanism thought to have played a role during recent droughts in the Sahel and also in ending the Afri-can Humid Period 5,000 years ago.
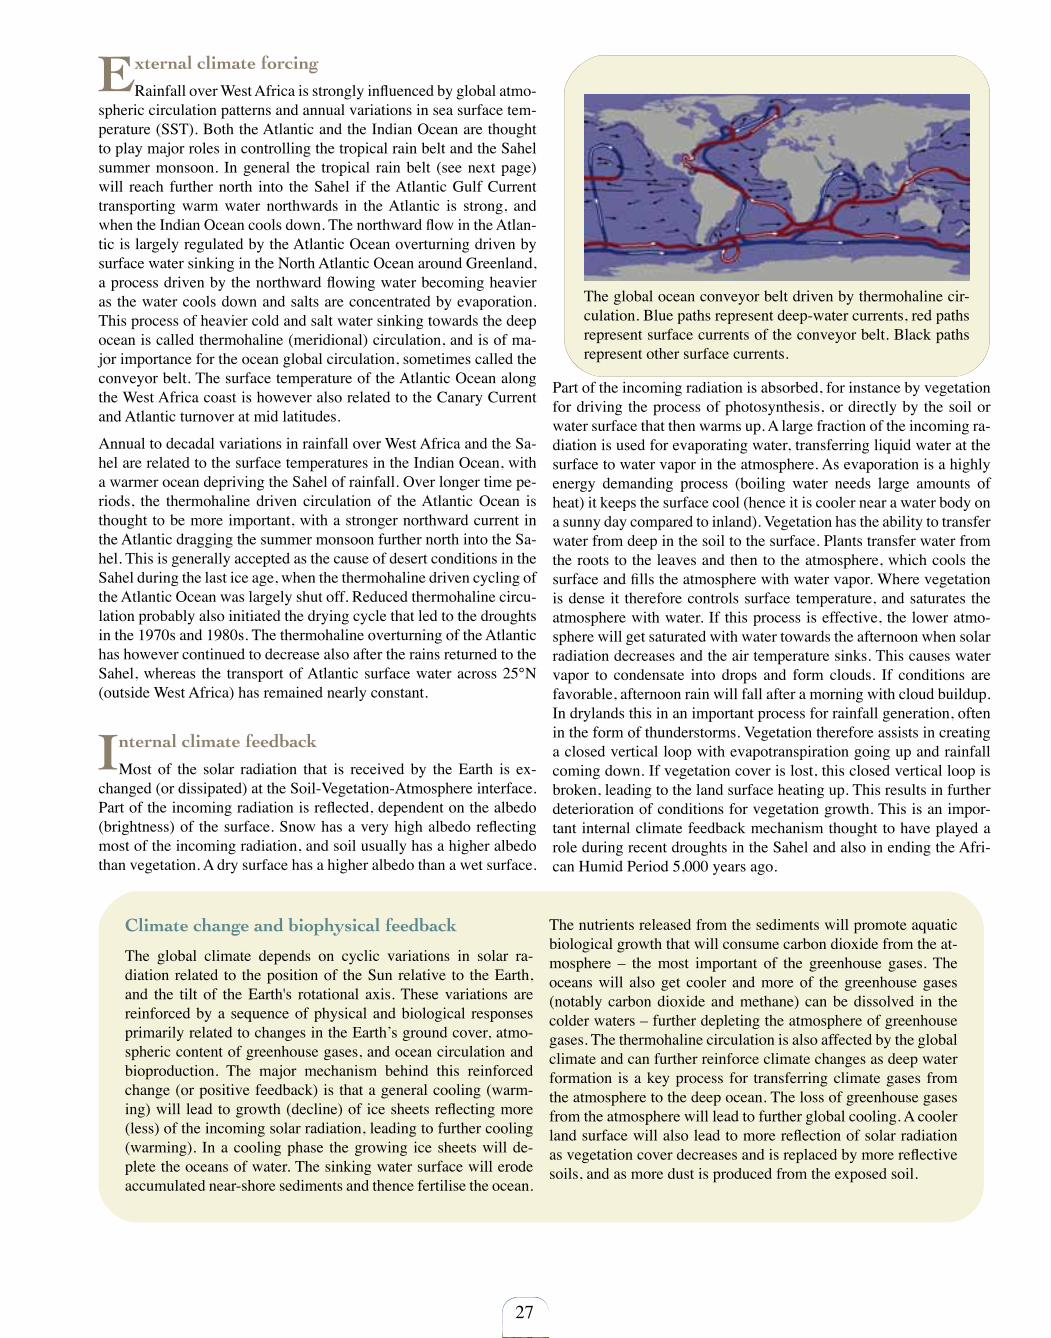
The global ocean conveyor belt driven by thermohaline cir-culation. Blue paths represent deep-water currents, red paths represent surface currents of the conveyor belt. Black paths represent other surface currents.
28
ITCZ annual cycle over West Africa (facing page)
The ITCZ is attracted towards the warmer hemisphere. During the southern hemisphere summer, the ITCZ passes the equator south of West Africa (February – top panel). Over the African continent it reaches as far south as Mozambique and Madagascar, and is usual-ly called the South Indian Convergence Zone. The large land mass of West Africa together with the warm surface waters in the Atlan-tic Ocean, keeps the ITCZ in a more northerly position over West
Africa compared to elsewhere. During the northern hemispheres summer, the ITCZ reaches about 10oN in August (bottom panel) and attracts the rain-bearing monsoon far into the Sahel. Over West Africa the ITCZ passes the region between the equator and 10oN twice every year, in the Boreal spring (May – right panel) when it moves northwards, and in the Boreal autumn (November – left panel) when it migrates south. These regions hence receive two annual rainfall seasons. The coast of the Bay of Guinea receives rainfall almost the whole year, with a short dry season in the Boreal summer.
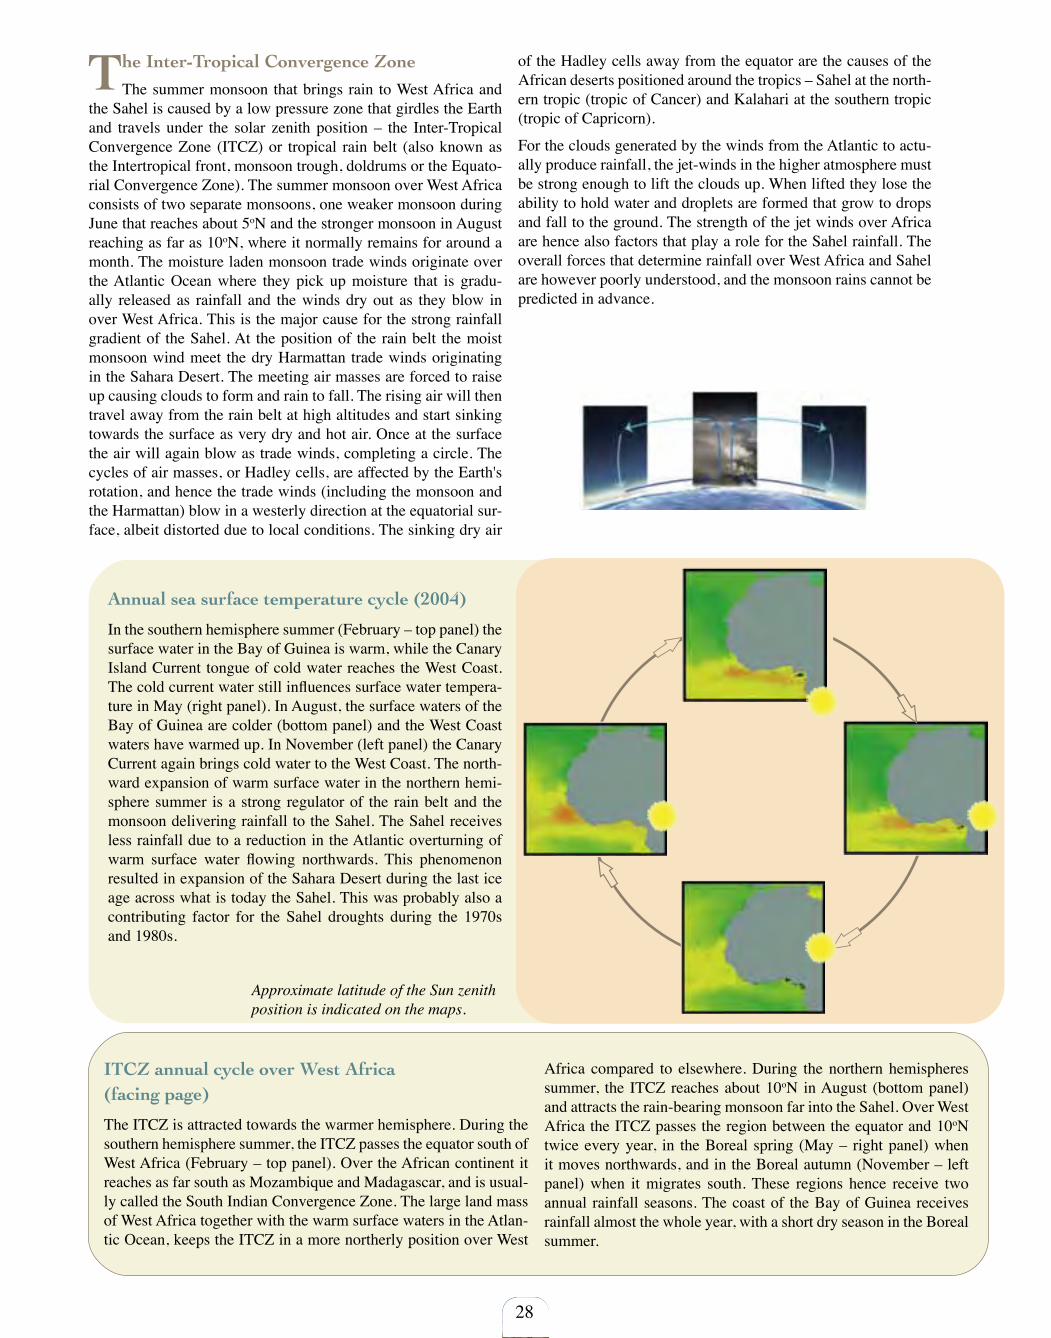
The Inter-Tropical Convergence Zone
The summer monsoon that brings rain to West Africa and the Sahel is caused by a low pressure zone that girdles the Earth and travels under the solar zenith position – the Inter-Tropical Convergence Zone (ITCZ) or tropical rain belt (also known as the Intertropical front, monsoon trough, doldrums or the Equato-rial Convergence Zone). The summer monsoon over West Africa consists of two separate monsoons, one weaker monsoon during June that reaches about 5oN and the stronger monsoon in August reaching as far as 10oN, where it normally remains for around a month. The moisture laden monsoon trade winds originate over the Atlantic Ocean where they pick up moisture that is gradu-ally released as rainfall and the winds dry out as they blow in over West Africa. This is the major cause for the strong rainfall gradient of the Sahel. At the position of the rain belt the moist monsoon wind meet the dry Harmattan trade winds originating in the Sahara Desert. The meeting air masses are forced to raise up causing clouds to form and rain to fall. The rising air will then travel away from the rain belt at high altitudes and start sinking towards the surface as very dry and hot air. Once at the surface the air will again blow as trade winds, completing a circle. The cycles of air masses, or Hadley cells, are affected by the Earth's rotation, and hence the trade winds (including the monsoon and the Harmattan) blow in a westerly direction at the equatorial sur-face, albeit distorted due to local conditions. The sinking dry air
of the Hadley cells away from the equator are the causes of the African deserts positioned around the tropics – Sahel at the north-ern tropic (tropic of Cancer) and Kalahari at the southern tropic (tropic of Capricorn).
For the clouds generated by the winds from the Atlantic to actu-ally produce rainfall, the jet-winds in the higher atmosphere must be strong enough to lift the clouds up. When lifted they lose the ability to hold water and droplets are formed that grow to drops and fall to the ground. The strength of the jet winds over Africa are hence also factors that play a role for the Sahel rainfall. The overall forces that determine rainfall over West Africa and Sahel are however poorly understood, and the monsoon rains cannot be predicted in advance.
Annual sea surface temperature cycle (2004)
In the southern hemisphere summer (February – top panel) the surface water in the Bay of Guinea is warm, while the Canary Island Current tongue of cold water reaches the West Coast. The cold current water still influences surface water tempera-ture in May (right panel). In August, the surface waters of the Bay of Guinea are colder (bottom panel) and the West Coast waters have warmed up. In November (left panel) the Canary Current again brings cold water to the West Coast. The north-ward expansion of warm surface water in the northern hemi-sphere summer is a strong regulator of the rain belt and the monsoon delivering rainfall to the Sahel. The Sahel receives less rainfall due to a reduction in the Atlantic overturning of warm surface water flowing northwards. This phenomenon resulted in expansion of the Sahara Desert during the last ice age across what is today the Sahel. This was probably also a contributing factor for the Sahel droughts during the 1970s and 1980s.
Approximate latitude of the Sun zenith position is indicated on the maps.
29
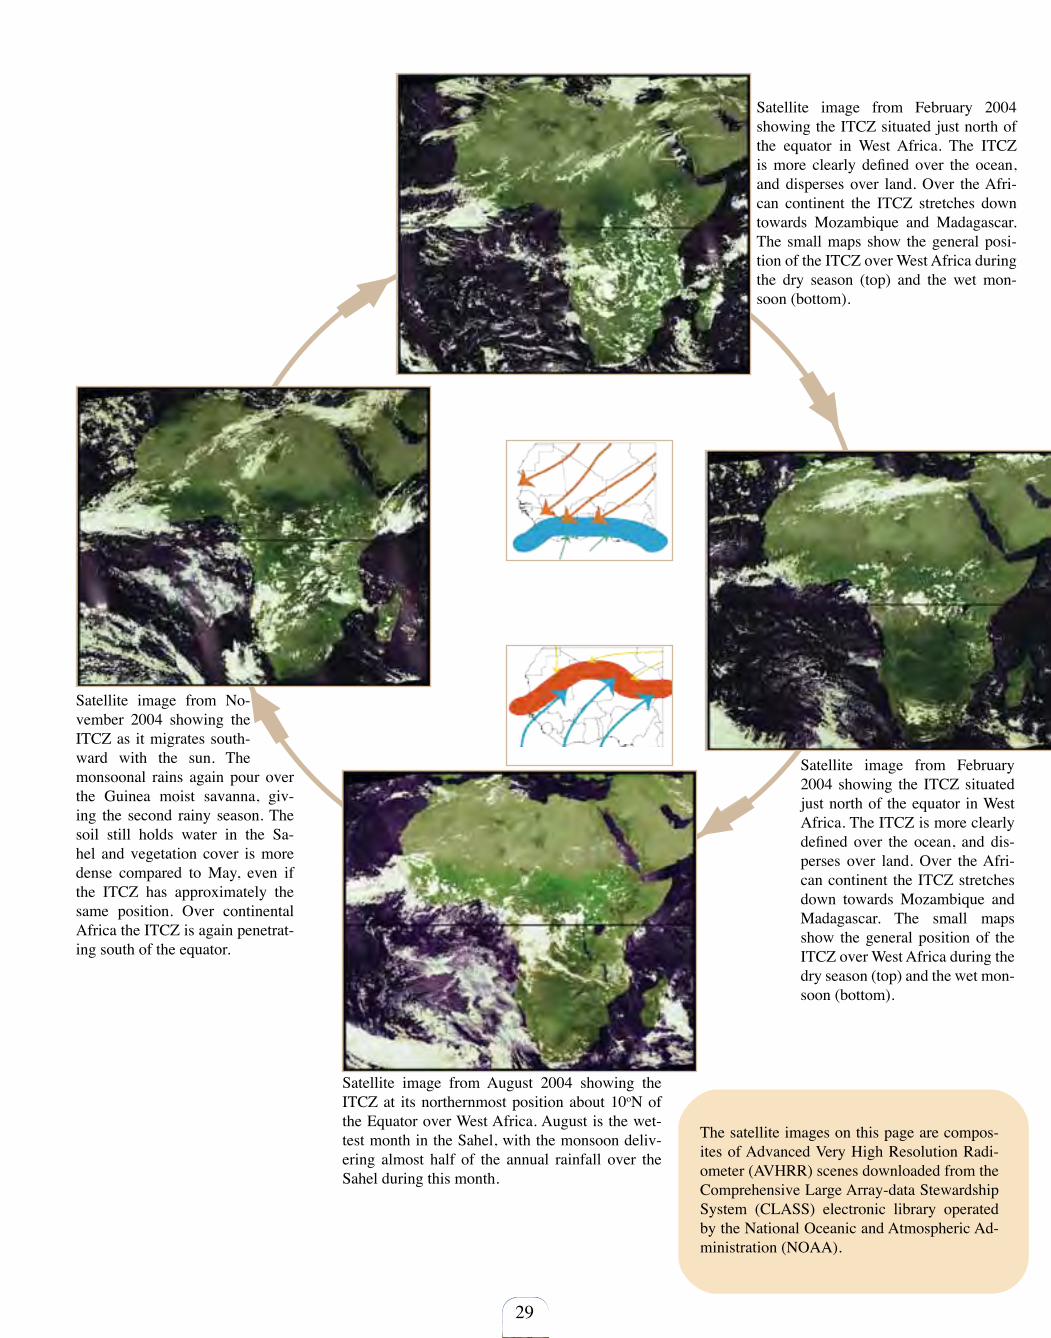
Satellite image from February 2004 showing the ITCZ situated just north of the equator in West Africa. The ITCZ is more clearly defined over the ocean, and disperses over land. Over the Afri-can continent the ITCZ stretches down towards Mozambique and Madagascar. The small maps show the general posi-tion of the ITCZ over West Africa during the dry season (top) and the wet mon-soon (bottom).
Satellite image from February 2004 showing the ITCZ situated just north of the equator in West Africa. The ITCZ is more clearly defined over the ocean, and dis-perses over land. Over the Afri-can continent the ITCZ stretches down towards Mozambique and Madagascar. The small maps show the general position of the ITCZ over West Africa during the dry season (top) and the wet mon-soon (bottom).
The satellite images on this page are compos-ites of Advanced Very High Resolution Radi-ometer (AVHRR) scenes downloaded from the Comprehensive Large Array-data Stewardship System (CLASS) electronic library operated by the National Oceanic and Atmospheric Ad-ministration (NOAA).
Satellite image from August 2004 showing the ITCZ at its northernmost position about 10oN of the Equator over West Africa. August is the wet-test month in the Sahel, with the monsoon deliv-ering almost half of the annual rainfall over the Sahel during this month.
Satellite image from No-vember 2004 showing the ITCZ as it migrates south-ward with the sun. The monsoonal rains again pour over the Guinea moist savanna, giv-ing the second rainy season. The soil still holds water in the Sa-hel and vegetation cover is more dense compared to May, even if the ITCZ has approximately the same position. Over continental Africa the ITCZ is again penetrat-ing south of the equator.
30
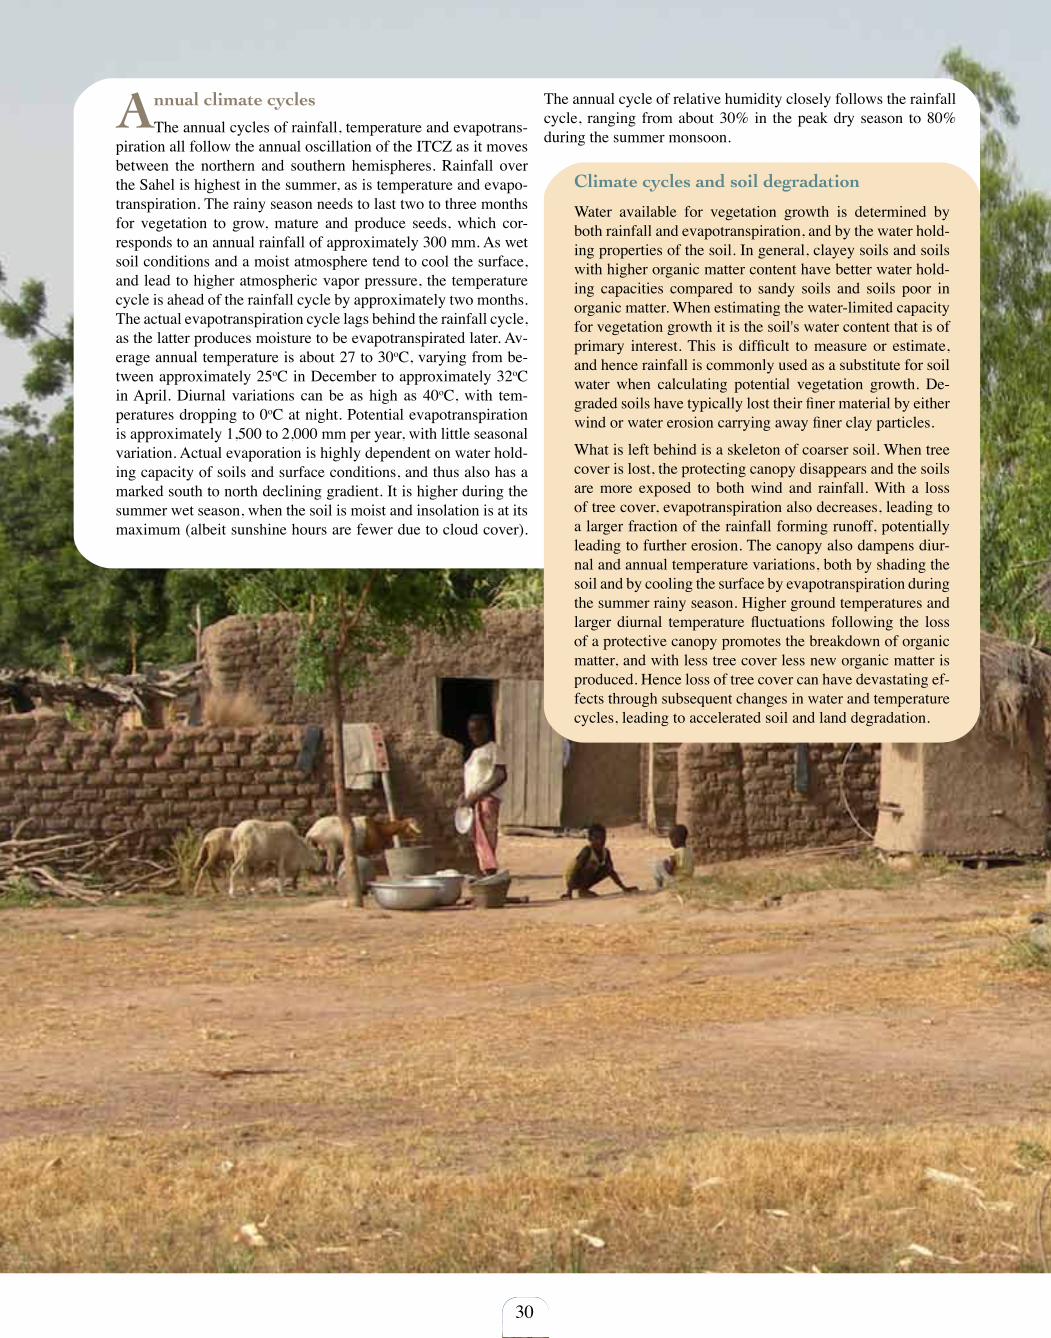
Climate cycles and soil degradation
Water available for vegetation growth is determined by both rainfall and evapotranspiration, and by the water hold-ing properties of the soil. In general, clayey soils and soils with higher organic matter content have better water hold-ing capacities compared to sandy soils and soils poor in organic matter. When estimating the water-limited capacity for vegetation growth it is the soil's water content that is of primary interest. This is difficult to measure or estimate, and hence rainfall is commonly used as a substitute for soil water when calculating potential vegetation growth. De-graded soils have typically lost their finer material by either wind or water erosion carrying away finer clay particles.
What is left behind is a skeleton of coarser soil. When tree cover is lost, the protecting canopy disappears and the soils are more exposed to both wind and rainfall. With a loss of tree cover, evapotranspiration also decreases, leading to a larger fraction of the rainfall forming runoff, potentially leading to further erosion. The canopy also dampens diur-nal and annual temperature variations, both by shading the soil and by cooling the surface by evapotranspiration during the summer rainy season. Higher ground temperatures and larger diurnal temperature fluctuations following the loss of a protective canopy promotes the breakdown of organic matter, and with less tree cover less new organic matter is produced. Hence loss of tree cover can have devastating ef-fects through subsequent changes in water and temperature cycles, leading to accelerated soil and land degradation.
Annual climate cycles
The annual cycles of rainfall, temperature and evapotrans-piration all follow the annual oscillation of the ITCZ as it moves between the northern and southern hemispheres. Rainfall over the Sahel is highest in the summer, as is temperature and evapo-transpiration. The rainy season needs to last two to three months for vegetation to grow, mature and produce seeds, which cor-responds to an annual rainfall of approximately 300 mm. As wet soil conditions and a moist atmosphere tend to cool the surface, and lead to higher atmospheric vapor pressure, the temperature cycle is ahead of the rainfall cycle by approximately two months. The actual evapotranspiration cycle lags behind the rainfall cycle, as the latter produces moisture to be evapotranspirated later. Av-erage annual temperature is about 27 to 30oC, varying from be-tween approximately 25oC in December to approximately 32oC in April. Diurnal variations can be as high as 40oC, with tem-peratures dropping to 0oC at night. Potential evapotranspiration is approximately 1,500 to 2,000 mm per year, with little seasonal variation. Actual evaporation is highly dependent on water hold-ing capacity of soils and surface conditions, and thus also has a marked south to north declining gradient. It is higher during the summer wet season, when the soil is moist and insolation is at its maximum (albeit sunshine hours are fewer due to cloud cover).
The annual cycle of relative humidity closely follows the rainfall cycle, ranging from about 30% in the peak dry season to 80% during the summer monsoon.
31
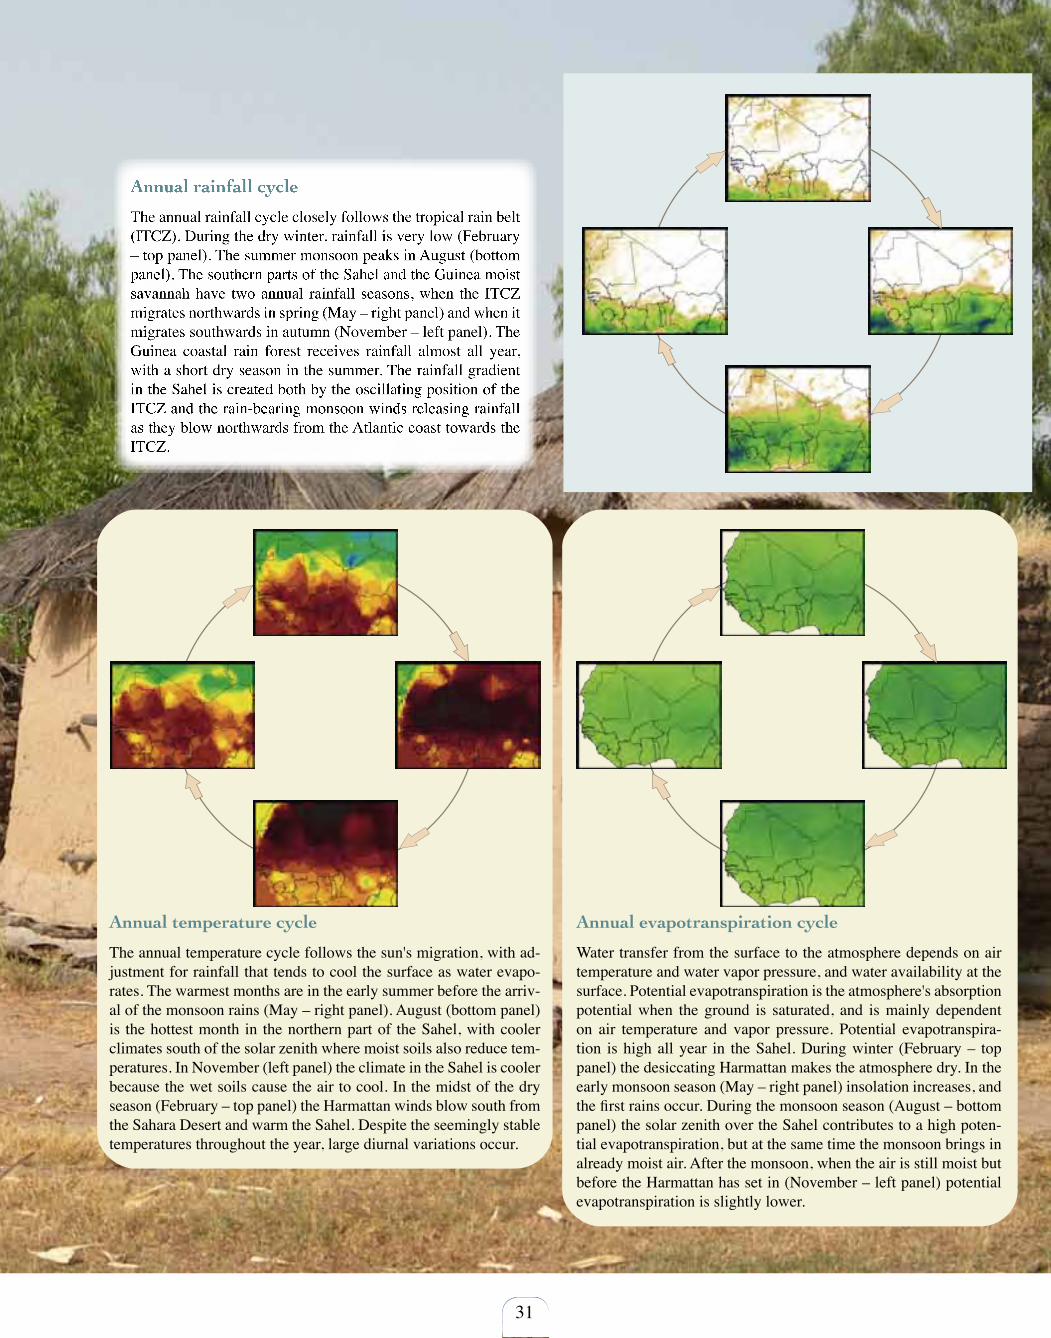
Annual temperature cycle
The annual temperature cycle follows the sun's migration, with ad-justment for rainfall that tends to cool the surface as water evapo-rates. The warmest months are in the early summer before the arriv-al of the monsoon rains (May – right panel). August (bottom panel) is the hottest month in the northern part of the Sahel, with cooler climates south of the solar zenith where moist soils also reduce tem-peratures. In November (left panel) the climate in the Sahel is cooler because the wet soils cause the air to cool. In the midst of the dry season (February – top panel) the Harmattan winds blow south from the Sahara Desert and warm the Sahel. Despite the seemingly stable temperatures throughout the year, large diurnal variations occur.
Annual evapotranspiration cycle
Water transfer from the surface to the atmosphere depends on air temperature and water vapor pressure, and water availability at the surface. Potential evapotranspiration is the atmosphere's absorption potential when the ground is saturated, and is mainly dependent on air temperature and vapor pressure. Potential evapotranspira-tion is high all year in the Sahel. During winter (February – top panel) the desiccating Harmattan makes the atmosphere dry. In the early monsoon season (May – right panel) insolation increases, and the first rains occur. During the monsoon season (August – bottom panel) the solar zenith over the Sahel contributes to a high poten-tial evapotranspiration, but at the same time the monsoon brings in already moist air. After the monsoon, when the air is still moist but before the Harmattan has set in (November – left panel) potential evapotranspiration is slightly lower.
Annual rainfall cycle
The annual rainfall cycle closely follows the tropical rain belt (ITCZ). During the dry winter, rainfall is very low (February – top panel). The summer monsoon peaks in August (bottom panel). The southern parts of the Sahel and the Guinea moist savannah have two annual rainfall seasons, when the ITCZ migrates northwards in spring (May – right panel) and when it migrates southwards in autumn (November – left panel). The Guinea coastal rain forest receives rainfall almost all year, with a short dry season in the summer. The rainfall gradient in the Sahel is created both by the oscillating position of the ITCZ and the rain-bearing monsoon winds releasing rainfall as they blow northwards from the Atlantic coast towards the ITCZ.

32
Long term trends in climate
Over tens of thousands of years it is the average tempera-ture of the Earth that regulates ocean temperatures, and hence rainfall over the Sahel. During the latest ice age, which ended about 12,000 years ago, rainfall was much lower over the Sahel, and desert conditions prevailed. During the ice age, sea surface temperatures were lower and the northward flow of warm water in the Atlantic Ocean was periodically strangled. At the end of the ice age, during the period called Younger Dryas, the melting ice created a blanket of fresh water on the surface of the North Atlantic Ocean, prolonging the Sahel dry spell by reducing the
northward flow of warm water from the tropical Atlantic Ocean. The ice age was followed by the African Humid Period (AHP), when the Sahel was much greener compared to today. During this period a stronger overturning of the Atlantic Ocean brought warm Atlantic waters further north generating a stronger sum-mer monsoon over West Africa. This green period came to an end about 5,000 years ago. Probably initiated by a reduction in the Atlantic circulation, and then exacerbated by vegetation losses leading to lower evapotranspiration rates and lower soil water holding capacities, further reducing rainfall in the Sahel.
Holocene climate change
Climate variations during the end of the last ice age and the Ho-locene period (from 12,000 years ago to present). The bottom panel shows the temperature variations as recorded from the Vostok ice core in Antarctica. The two middle panels show ex-port of dust from the Sahara and the Sahel to the Atlantic Ocean, as recorded in a borehole at the Ocean floor (ODP658C), and to Lake Bosumtwi in Ghana. The top panel shows percentage or-ganic matter in the bottom of Lake Bosumtwi with high organic levels indicating more dense vegetation in the area around the lake. As temperatures rose at the end of the ice age, dust export from West Africa decreased and vegetation cover increased. Other studies from bore-holes in the Sahel show that during AHP less drought tolerant trees grew much further north than at present, that water levels in lakes were much higher, and that lakes were less saline than today. Lake Chad and the Niger Inland Delta are the only large remaining water bodies from the AHP. The climate during this period was characterized by a stronger summer monsoon.
Ice age climate cycles
Temperatures over the last 400,000 years recorded from ice cores in Antarctica (Vostok ice core – bottom graph) and an ocean core (SST1105 – top graph) from the Atlantic Ocean, outside West Africa (see map on page 26). The variations are strikingly similar, indicating that the Atlantic was cooler during the ice ages and that the cooler periods have recurred at regular intervals of approximately 100,000 years. The ultimate cause of these temperature cycles is regular variations in solar radia-tion received by the Earth as the distance and angle between the Sun and the Earth oscillates (called Milankovich cycles). Apart from being cooler with a weaker northward flow, the At-lantic Ocean was also about 100 m lower than today during the last ice age (water being bound in extended ice sheets). This resulted in less cloud-formation as less water was evaporated from the colder sea surface, and the clouds that actually formed had difficulties reaching inland from the coast. Consequently, rainfall over West Africa was much lower.

33
Vegetation in West Africa 10,000 years ago
When the last glacial period came to a rapid end, it was followed by a cooler period (Younger Dryas), discussed earlier. After Younger Dryas, rapid warming allowed the woodlands and savannahs to expand northwards, and the tropical rain-forest colonized larger patches along the coast of Bay of Guinea. Condi-tions were similar to at present, and the vegetation 10,000 years also represents potential vegetation cover (without human interference) of West Africa today.
Vegetation in West Africa during the AHP (6,000 years ago)
During the African Humid Period, the more northerly position of the summer monsoon allowed the woodlands and savannah vegetation belts to migrate into what is now the Sahara Desert, and the lakes and wetlands also expanded. The river networks grew larger, connecting ancient dry riverbeds (wadis) to actively flowing rivers. The evergreen forests expanded further inland from the coastline of the Bay of Guinea.
Map showing vegetation conditions 6,000 years ago (data from Dieter Anhuf)
On the right we have compiled a map showing vegetation conditions 10,000 years ago (data from Dieter Anhuf).
West Africa rainfall during Holocene
The amount of sunlight received by the Earth increased after the latest ice age and peaked over West Africa around 7,000 years ago. The map on the right shows estimated rainfall distribution over West Africa during the African Humid Period (AHP), which lasted about 5,000 years and ended around 5,000 years ago.
As is evident from the map on the right, higher rainfall extended further north (into what is today the Sahara Desert) than at present (map on page 34).
Map showing rainfall over West Africa during the African Humid Period.
Vegetation in West Africa during the last glacial maximum(22,000 to 13,000 years ago)
During the latest glacial maximum the Sahara Desert extended several hundred kilometers further south than at present. Sand dunes extended far into present-day Sahel and lakes dried out. Pollen found in old lake cores indicate both a drier and a cooler climate over West Africa. The vegetation belts of grasslands (brown), savannahs (orange) and woodlands (shades of light green) were com-pressed, and the tropical rain forest (dark green) was restricted to a few patches along the Bay of Guinea coast.The map on the right shows vegetation conditions 18,000 years ago (data from Dieter Anhuf).
34
Climate during the last century – rains and droughts
The last century has seen extended periods of both high and low rain-fall over the Sahel. Rainfall increased quite strongly in early 20th century, followed by a wet period in the 1920s and 1930s. The 1950s and early 1960s had very high rainfall, followed by a striking decline in the 1970s and 1980s of about 40%. Such declines in rainfall have not been observed elsewhere on Earth during the last century. The Sahel experienced droughts also in earlier centuries, with recordings for the coastal region from the 1640s, 1660s–1670s, 1710s, 1750s, 1770s–1780s. Famines also raged in the coastal regions during the first half of the 19th century. Closer scrutiny of rainfall records in the Sahel, and elsewhere in Africa, reveal (quasi) cycles of 80 years. Whether this cycle is linked to variations in sea surface tem-perature or ocean circulation patterns is not understood. Recent droughts were most likely initiated by lower rates of overturning circulation in the Atlantic Ocean. The slowdown of the Atlantic thermohaline circulation has, however, continued after the rains have recovered, while the currents in the mid-latitude Atlantic Ocean (at latitudes outside West Africa) have re-mained relatively constant. On this shorter time scale it is more probable that sea surface temperatures in the Indian Ocean have the major influence on rainfall in the Sahel.
Variations in rainfall over the Sahel from 1900 to 2006.
The rainfall data over the last century show a quasi 80-year cycle of high and low rainfall periods (line in graph below). This quasi 80-year cycle is well known from many hydrological time-series in Africa. If the cycle con-tinues into the future, the rainfall increase over the Sahel over the last two decades will continue for approximately another two decades before the next drying cycle begins.
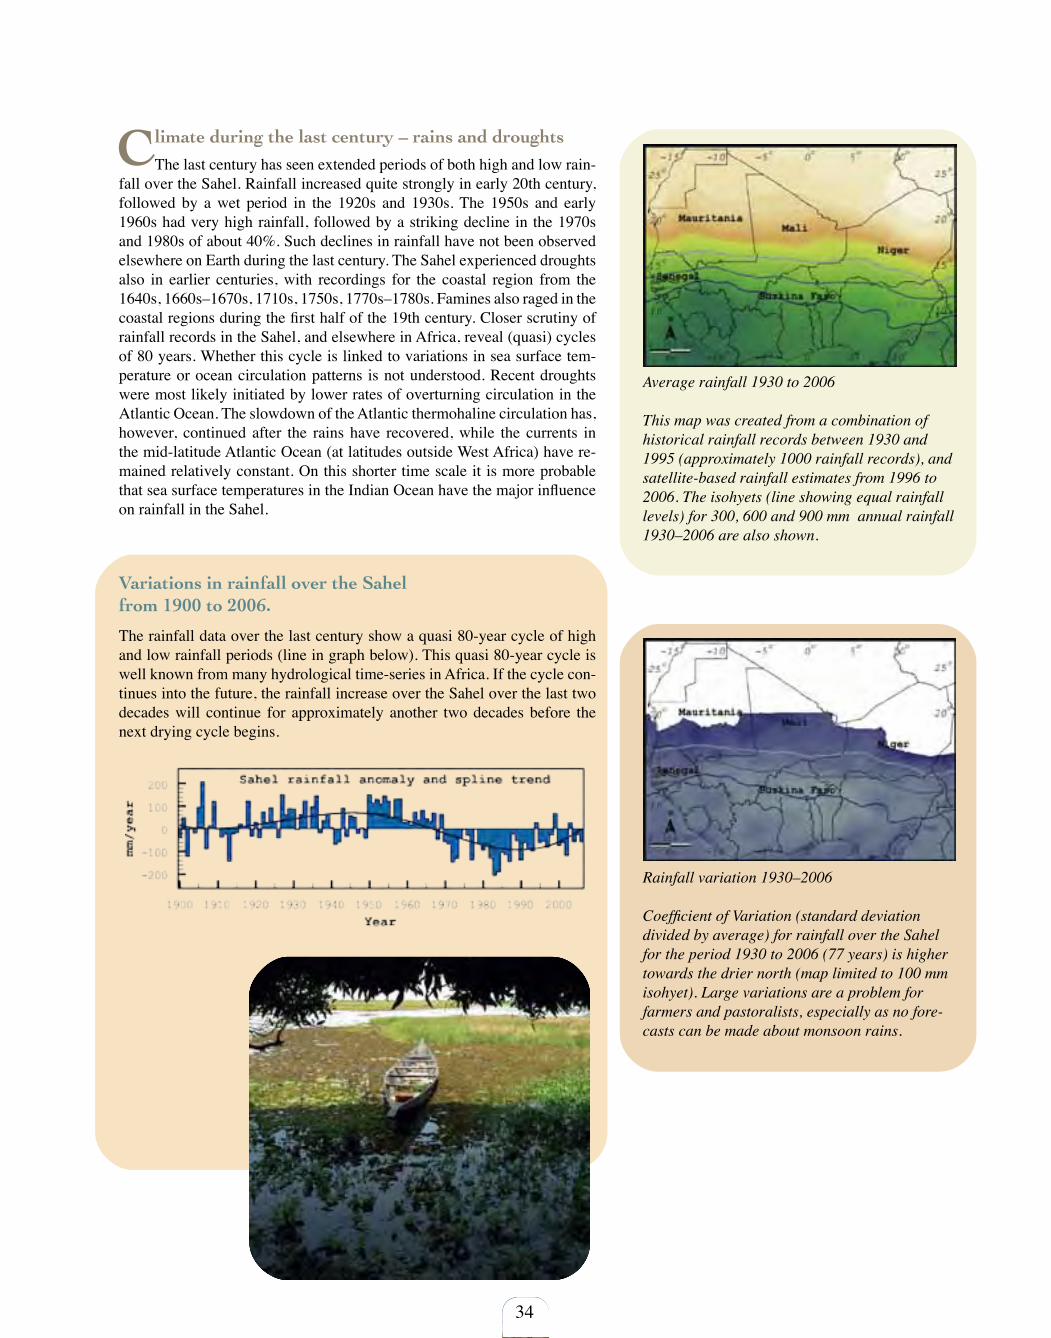
Average rainfall 1930 to 2006
This map was created from a combination of historical rainfall records between 1930 and1995 (approximately 1000 rainfall records), and satellite-based rainfall estimates from 1996 to2006. The isohyets (line showing equal rainfall levels) for 300, 600 and 900 mm annual rainfall1930–2006 are also shown.
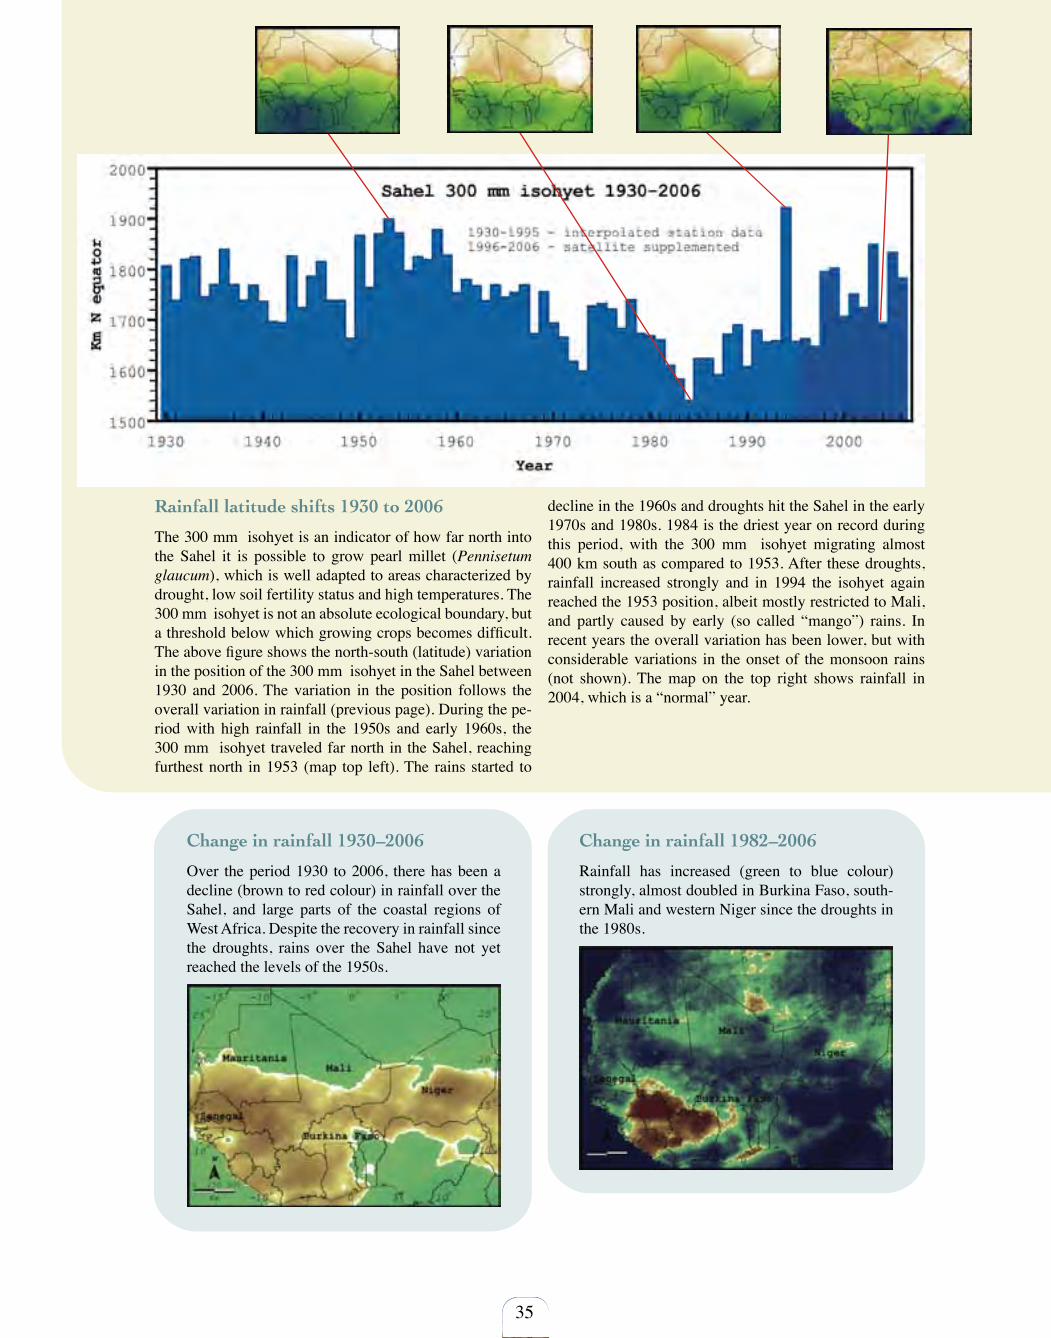
Rainfall variation 1930–2006
Coefficient of Variation (standard deviation divided by average) for rainfall over the Sahel for the period 1930 to 2006 (77 years) is higher towards the drier north (map limited to 100 mm isohyet). Large variations are a problem for farmers and pastoralists, especially as no fore-casts can be made about monsoon rains.
35
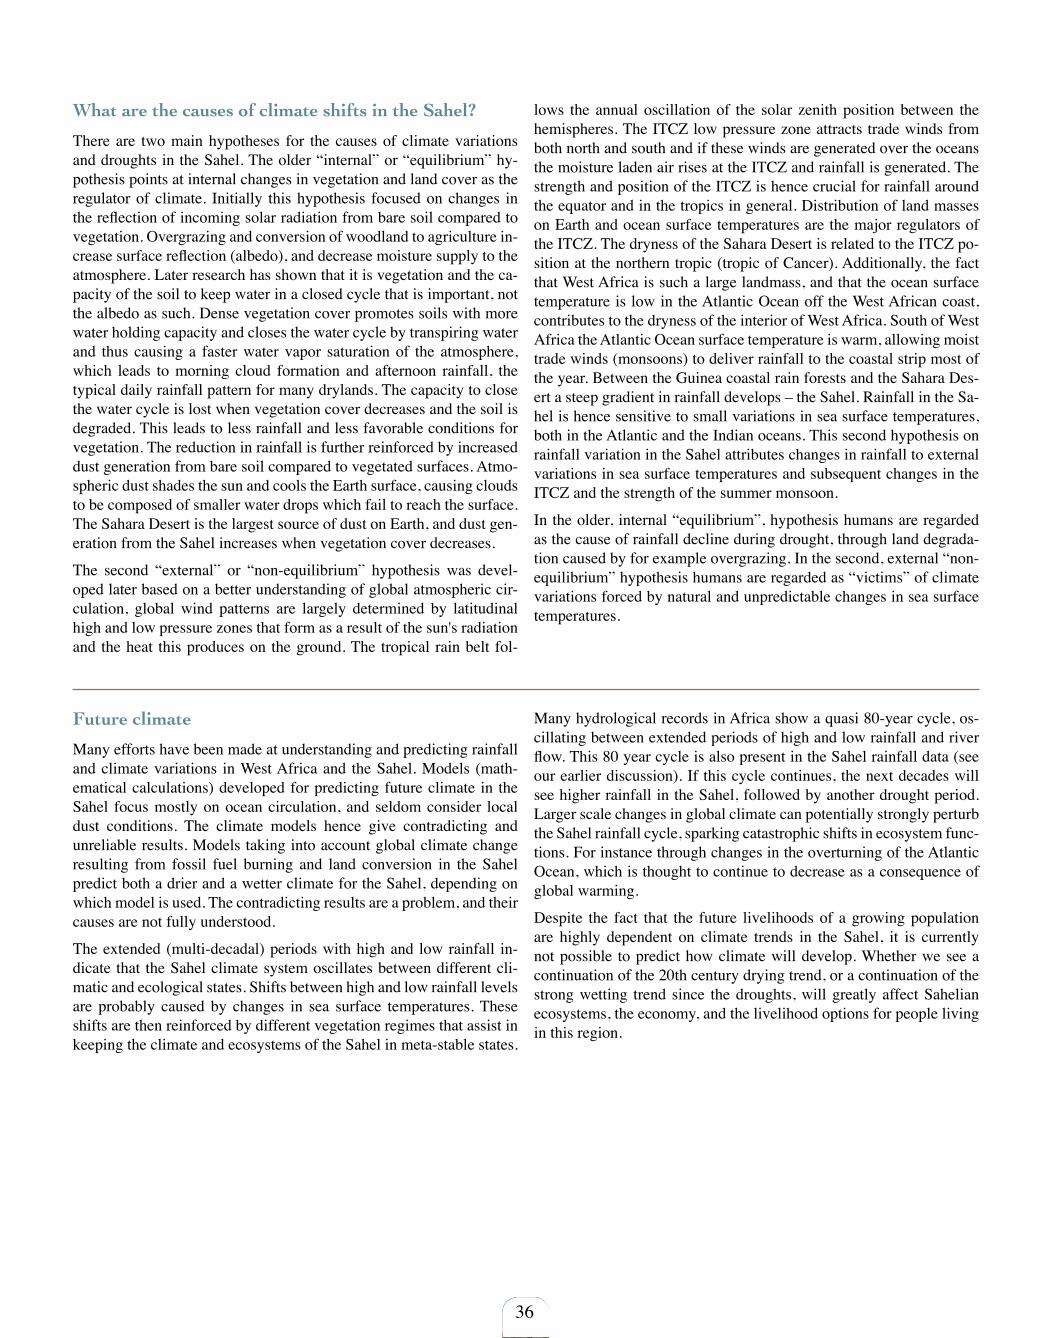
Rainfall latitude shifts 1930 to 2006
The 300 mm isohyet is an indicator of how far north into the Sahel it is possible to grow pearl millet (Pennisetum glaucum), which is well adapted to areas characterized by drought, low soil fertility status and high temperatures. The 300 mm isohyet is not an absolute ecological boundary, but a threshold below which growing crops becomes difficult. The above figure shows the north-south (latitude) variation in the position of the 300 mm isohyet in the Sahel between 1930 and 2006. The variation in the position follows the overall variation in rainfall (previous page). During the pe-riod with high rainfall in the 1950s and early 1960s, the 300 mm isohyet traveled far north in the Sahel, reaching furthest north in 1953 (map top left). The rains started to
decline in the 1960s and droughts hit the Sahel in the early 1970s and 1980s. 1984 is the driest year on record during this period, with the 300 mm isohyet migrating almost 400 km south as compared to 1953. After these droughts, rainfall increased strongly and in 1994 the isohyet again reached the 1953 position, albeit mostly restricted to Mali, and partly caused by early (so called “mango”) rains. In recent years the overall variation has been lower, but with considerable variations in the onset of the monsoon rains (not shown). The map on the top right shows rainfall in 2004, which is a “normal” year.
Change in rainfall 1930–2006
Over the period 1930 to 2006, there has been a decline (brown to red colour) in rainfall over the Sahel, and large parts of the coastal regions of West Africa. Despite the recovery in rainfall since the droughts, rains over the Sahel have not yet reached the levels of the 1950s.
Change in rainfall 1982–2006
Rainfall has increased (green to blue colour) strongly, almost doubled in Burkina Faso, south-ern Mali and western Niger since the droughts in the 1980s.
36
Future climate
Many efforts have been made at understanding and predicting rainfall and climate variations in West Africa and the Sahel. Models (math-ematical calculations) developed for predicting future climate in the Sahel focus mostly on ocean circulation, and seldom consider local dust conditions. The climate models hence give contradicting and unreliable results. Models taking into account global climate change resulting from fossil fuel burning and land conversion in the Sahel predict both a drier and a wetter climate for the Sahel, depending on which model is used. The contradicting results are a problem, and their causes are not fully understood.
The extended (multi-decadal) periods with high and low rainfall in-dicate that the Sahel climate system oscillates between different cli-matic and ecological states. Shifts between high and low rainfall levels are probably caused by changes in sea surface temperatures. These shifts are then reinforced by different vegetation regimes that assist in keeping the climate and ecosystems of the Sahel in meta-stable states.
Many hydrological records in Africa show a quasi 80-year cycle, os-cillating between extended periods of high and low rainfall and river flow. This 80 year cycle is also present in the Sahel rainfall data (see our earlier discussion). If this cycle continues, the next decades will see higher rainfall in the Sahel, followed by another drought period. Larger scale changes in global climate can potentially strongly perturb the Sahel rainfall cycle, sparking catastrophic shifts in ecosystem func-tions. For instance through changes in the overturning of the Atlantic Ocean, which is thought to continue to decrease as a consequence of global warming.
Despite the fact that the future livelihoods of a growing population are highly dependent on climate trends in the Sahel, it is currently not possible to predict how climate will develop. Whether we see a continuation of the 20th century drying trend, or a continuation of the strong wetting trend since the droughts, will greatly affect Sahelian ecosystems, the economy, and the livelihood options for people living in this region.
What are the causes of climate shifts in the Sahel?
There are two main hypotheses for the causes of climate variations and droughts in the Sahel. The older “internal” or “equilibrium” hy-pothesis points at internal changes in vegetation and land cover as the regulator of climate. Initially this hypothesis focused on changes in the reflection of incoming solar radiation from bare soil compared to vegetation. Overgrazing and conversion of woodland to agriculture in-crease surface reflection (albedo), and decrease moisture supply to the atmosphere. Later research has shown that it is vegetation and the ca-pacity of the soil to keep water in a closed cycle that is important, not the albedo as such. Dense vegetation cover promotes soils with more water holding capacity and closes the water cycle by transpiring water and thus causing a faster water vapor saturation of the atmosphere, which leads to morning cloud formation and afternoon rainfall, the typical daily rainfall pattern for many drylands. The capacity to close the water cycle is lost when vegetation cover decreases and the soil is degraded. This leads to less rainfall and less favorable conditions for vegetation. The reduction in rainfall is further reinforced by increased dust generation from bare soil compared to vegetated surfaces. Atmo-spheric dust shades the sun and cools the Earth surface, causing clouds to be composed of smaller water drops which fail to reach the surface. The Sahara Desert is the largest source of dust on Earth, and dust gen-eration from the Sahel increases when vegetation cover decreases.
The second “external” or “non-equilibrium” hypothesis was devel-oped later based on a better understanding of global atmospheric cir-culation, global wind patterns are largely determined by latitudinal high and low pressure zones that form as a result of the sun's radiation and the heat this produces on the ground. The tropical rain belt fol-
lows the annual oscillation of the solar zenith position between the hemispheres. The ITCZ low pressure zone attracts trade winds from both north and south and if these winds are generated over the oceans the moisture laden air rises at the ITCZ and rainfall is generated. The strength and position of the ITCZ is hence crucial for rainfall around the equator and in the tropics in general. Distribution of land masses on Earth and ocean surface temperatures are the major regulators of the ITCZ. The dryness of the Sahara Desert is related to the ITCZ po-sition at the northern tropic (tropic of Cancer). Additionally, the fact that West Africa is such a large landmass, and that the ocean surface temperature is low in the Atlantic Ocean off the West African coast, contributes to the dryness of the interior of West Africa. South of West Africa the Atlantic Ocean surface temperature is warm, allowing moist trade winds (monsoons) to deliver rainfall to the coastal strip most of the year. Between the Guinea coastal rain forests and the Sahara Des-ert a steep gradient in rainfall develops – the Sahel. Rainfall in the Sa-hel is hence sensitive to small variations in sea surface temperatures, both in the Atlantic and the Indian oceans. This second hypothesis on rainfall variation in the Sahel attributes changes in rainfall to external variations in sea surface temperatures and subsequent changes in the ITCZ and the strength of the summer monsoon.
In the older, internal “equilibrium”, hypothesis humans are regarded as the cause of rainfall decline during drought, through land degrada-tion caused by for example overgrazing. In the second, external “non-equilibrium” hypothesis humans are regarded as “victims” of climate variations forced by natural and unpredictable changes in sea surface temperatures.
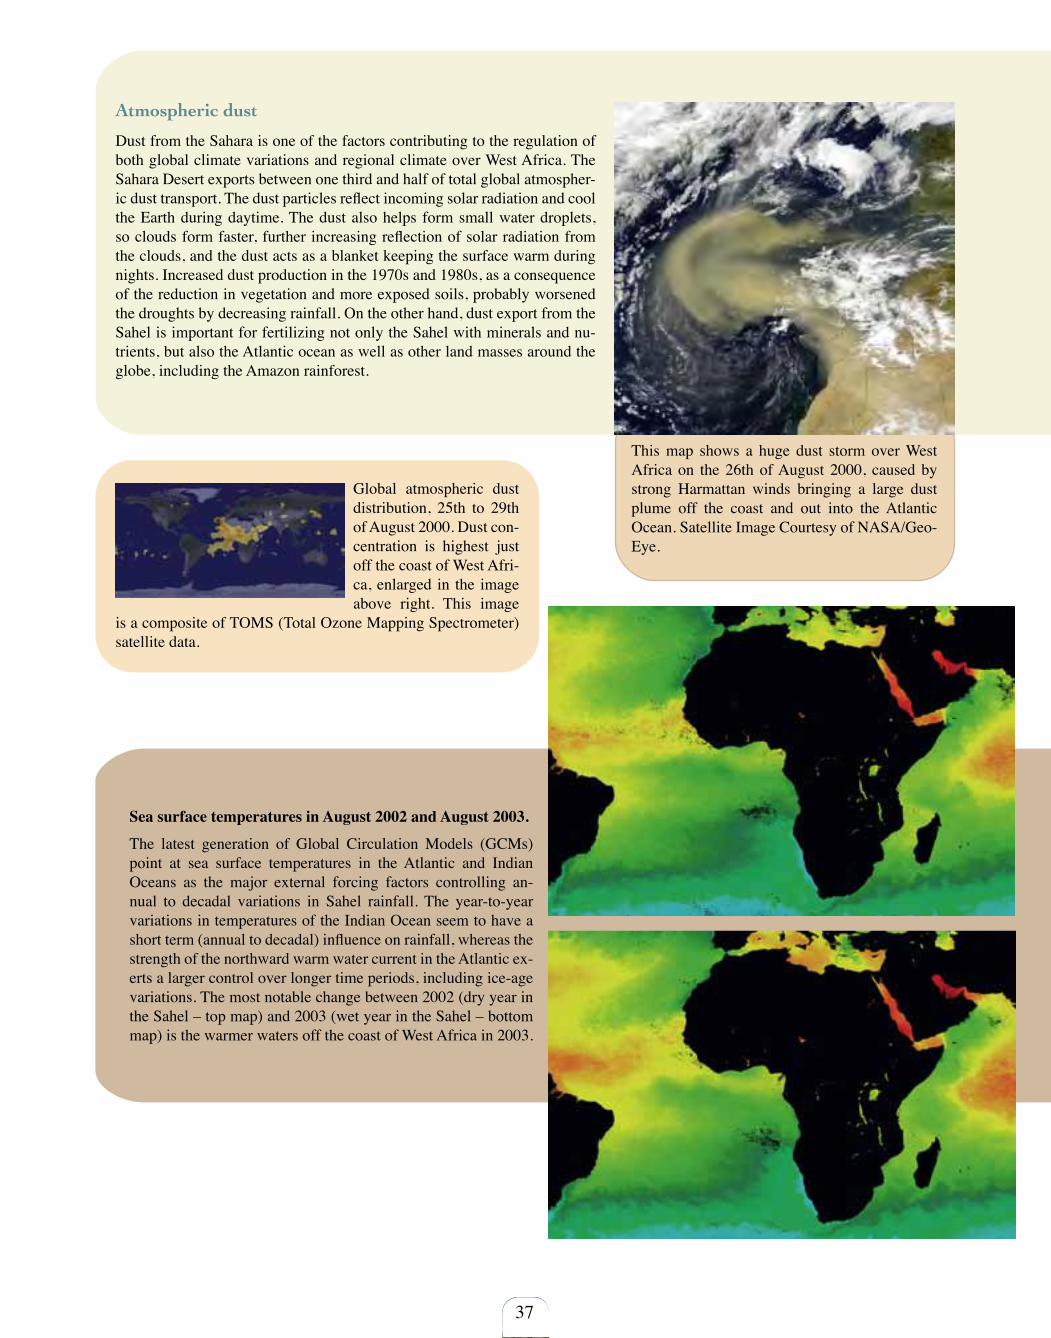
37
Atmospheric dust
Dust from the Sahara is one of the factors contributing to the regulation of both global climate variations and regional climate over West Africa. The Sahara Desert exports between one third and half of total global atmospher-ic dust transport. The dust particles reflect incoming solar radiation and cool the Earth during daytime. The dust also helps form small water droplets, so clouds form faster, further increasing reflection of solar radiation from the clouds, and the dust acts as a blanket keeping the surface warm during nights. Increased dust production in the 1970s and 1980s, as a consequence of the reduction in vegetation and more exposed soils, probably worsened the droughts by decreasing rainfall. On the other hand, dust export from the Sahel is important for fertilizing not only the Sahel with minerals and nu-trients, but also the Atlantic ocean as well as other land masses around the globe, including the Amazon rainforest.
This map shows a huge dust storm over West Africa on the 26th of August 2000, caused by strong Harmattan winds bringing a large dust plume off the coast and out into the Atlantic Ocean. Satellite Image Courtesy of NASA/Geo-Eye.
Global atmospheric dust distribution, 25th to 29th of August 2000. Dust con-centration is highest just off the coast of West Afri-ca, enlarged in the image above right. This image
is a composite of TOMS (Total Ozone Mapping Spectrometer) satellite data.
Sea surface temperatures in August 2002 and August 2003.
The latest generation of Global Circulation Models (GCMs) point at sea surface temperatures in the Atlantic and Indian Oceans as the major external forcing factors controlling an-nual to decadal variations in Sahel rainfall. The year-to-year variations in temperatures of the Indian Ocean seem to have a short term (annual to decadal) influence on rainfall, whereas the strength of the northward warm water current in the Atlantic ex-erts a larger control over longer time periods, including ice-age variations. The most notable change between 2002 (dry year in the Sahel – top map) and 2003 (wet year in the Sahel – bottom map) is the warmer waters off the coast of West Africa in 2003.
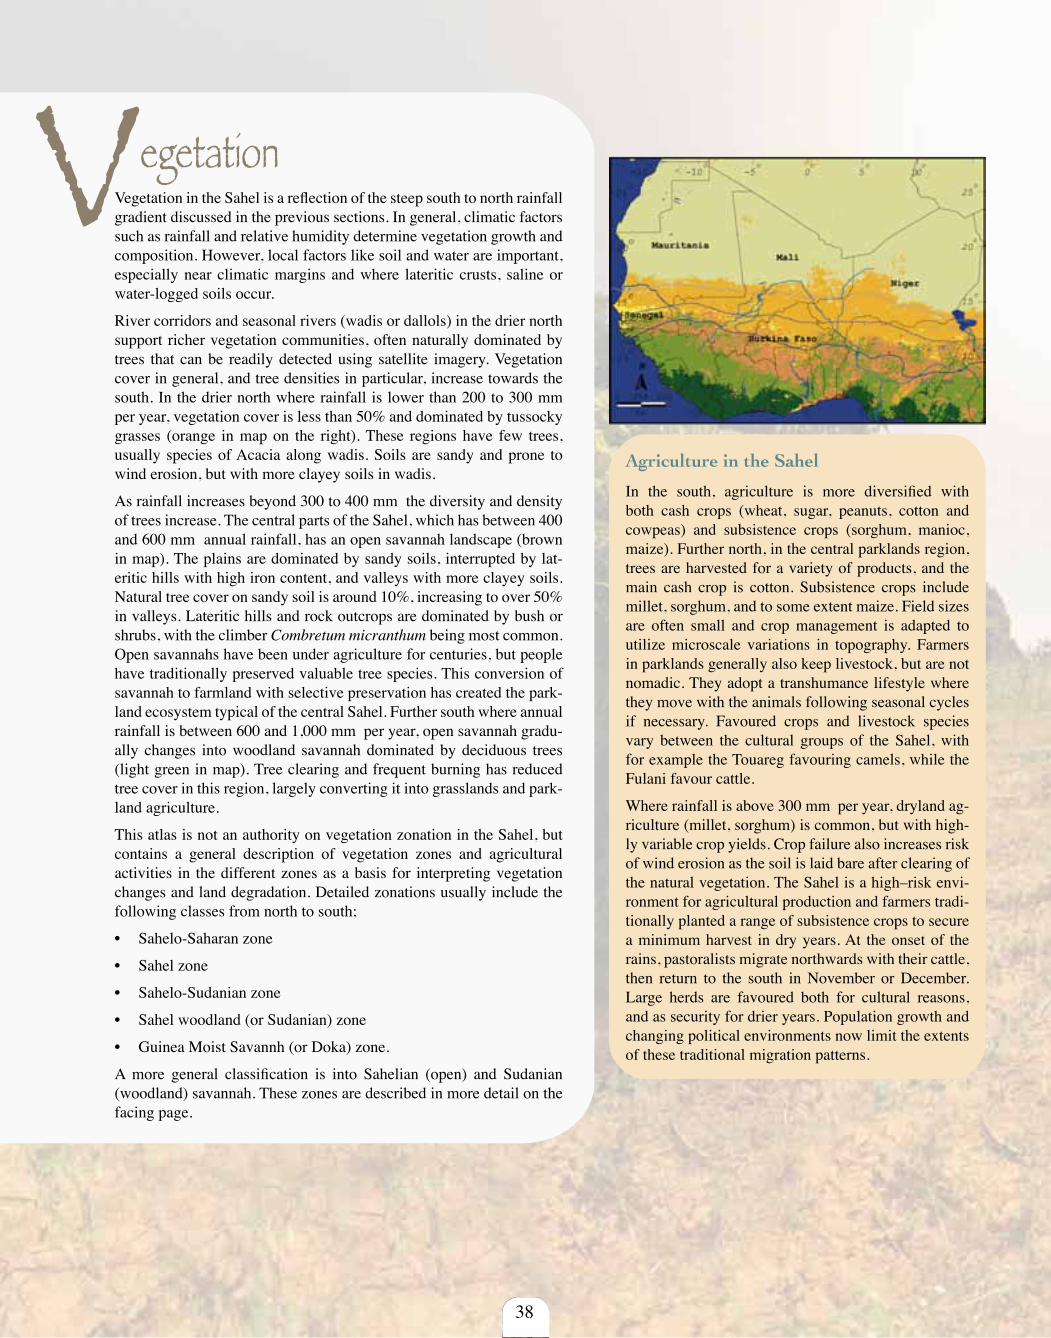
38
Vegetation in the Sahel is a reflection of the steep south to north rainfall gradient discussed in the previous sections. In general, climatic factors such as rainfall and relative humidity determine vegetation growth and composition. However, local factors like soil and water are important, especially near climatic margins and where lateritic crusts, saline or water-logged soils occur.
River corridors and seasonal rivers (wadis or dallols) in the drier north support richer vegetation communities, often naturally dominated by trees that can be readily detected using satellite imagery. Vegetation cover in general, and tree densities in particular, increase towards the south. In the drier north where rainfall is lower than 200 to 300 mm per year, vegetation cover is less than 50% and dominated by tussocky grasses (orange in map on the right). These regions have few trees, usually species of Acacia along wadis. Soils are sandy and prone to wind erosion, but with more clayey soils in wadis.
As rainfall increases beyond 300 to 400 mm the diversity and density of trees increase. The central parts of the Sahel, which has between 400 and 600 mm annual rainfall, has an open savannah landscape (brown in map). The plains are dominated by sandy soils, interrupted by lat-eritic hills with high iron content, and valleys with more clayey soils. Natural tree cover on sandy soil is around 10%, increasing to over 50% in valleys. Lateritic hills and rock outcrops are dominated by bush or shrubs, with the climber Combretum micranthum being most common. Open savannahs have been under agriculture for centuries, but people have traditionally preserved valuable tree species. This conversion of savannah to farmland with selective preservation has created the park-land ecosystem typical of the central Sahel. Further south where annual rainfall is between 600 and 1,000 mm per year, open savannah gradu-ally changes into woodland savannah dominated by deciduous trees (light green in map). Tree clearing and frequent burning has reduced tree cover in this region, largely converting it into grasslands and park-land agriculture.
This atlas is not an authority on vegetation zonation in the Sahel, but contains a general description of vegetation zones and agricultural activities in the different zones as a basis for interpreting vegetation changes and land degradation. Detailed zonations usually include the following classes from north to south;
• Sahelo -Saharan zone
• Sahel zone
• Sahelo -Sudanian zone
• Sahel woodland (or Sudanian) zone
• Guinea Moist Savannh (or Doka) zone.
A more general classification is into Sahelian (open) and Sudanian (woodland) savannah. These zones are described in more detail on the facing page.
Agriculture in the Sahel
In the south, agriculture is more diversified with both cash crops (wheat, sugar, peanuts, cotton and cowpeas) and subsistence crops (sorghum, manioc, maize). Further north, in the central parklands region, trees are harvested for a variety of products, and the main cash crop is cotton. Subsistence crops include millet, sorghum, and to some extent maize. Field sizes are often small and crop management is adapted to utilize microscale variations in topography. Farmers in parklands generally also keep livestock, but are not nomadic. They adopt a transhumance lifestyle where they move with the animals following seasonal cycles if necessary. Favoured crops and livestock species vary between the cultural groups of the Sahel, with for example the Touareg favouring camels, while the Fulani favour cattle.
Where rainfall is above 300 mm per year, dryland ag-riculture (millet, sorghum) is common, but with high-ly variable crop yields. Crop failure also increases risk of wind erosion as the soil is laid bare after clearing of the natural vegetation. The Sahel is a high–risk envi-ronment for agricultural production and farmers tradi-tionally planted a range of subsistence crops to secure a minimum harvest in dry years. At the onset of the rains, pastoralists migrate northwards with their cattle, then return to the south in November or December. Large herds are favoured both for cultural reasons, and as security for drier years. Population growth and changing political environments now limit the extents of these traditional migration patterns.
Vegetation
39
Vegetation history and human impacts
Over the last 5,000 years, humans have been a major agent in changing the vegetation of the Sahel. During prehistoric times, livestock and slash and burn activities for creating tem-porary fields were probably the main factors leading to chang-es in vegetation cover. The records of Hanno the Navigator lend support to bush burning 2,500 year ago, and other records support accentuated bush burning in the then woodland domi-nated empires along the Niger River during medieval times. The human impact has resulted in expansion of grasslands, caused both by tree clearing and extensive grazing and burn-ing of shrub lands and woodlands. In areas with very high grazing pressure the grasslands are replaced by less palatable grasses and shrub lands.
West Africa was the first part of Africa to be opened up for trade with the outside world. Coastal rainforests were cleared to give way to agroforestry cultivation of oil palm (Elaeis guineensis), cocoa (Theobroma cacao), coffee (Coffea spp.), bananas (Musa spp.) and rubber (Hevea brasiliensis). The woodlands to the north were cut for timber, and converted
to agriculture. In some regions (mainly in Senegal) ground nuts became the dominating crop, and still is today. The tree species cut for timber included mahogany (Khaya ivorensis and K. anthotheca), Sapele (Entandrophragma cylindricum), Guarea (Guarea cedrata), Makoré (Mimusops heckelii), Afri-can Walnut (Lovoa trichiloides) and Dahoma or Ekhimi (Pip-tadeniastrum africanum). Tree-clearing today is mostly done to create more arable land, and for production of fuel wood and charcoal. Pressure is particularly high in savannah wood-lands and moist savannah woodlands as population densities are high in these regions.
During the droughts in the 1970s and 1980s, trees succumbed under the climate pressure, and were also cut for economic rea-sons. With the recovery of the rains trees were again planted, especially in regions with the strongest recovery (e.g. Burkina Faso). But overall the last century has seen a strong decline in woodlands in preference for grasslands and farmlands. The large clearings of forests and woodlands in the Guinea coastal rain forest and moist savannah may also have contributed to a drying of the summer monsoon that brings rainfall to the Sahel.
Sahel savannah
Where rainfall is less than 500 mm per year and the grow-ing season shorter than four months, the drier savannah or Sahel savannah dominates. This zone includes southern Mau-ritania and northern Senegal, Mali north of the Niger River and northern Niger. This heavily grazed region is dominated by thorny Acacia. The small tree A. seyal dominates valleys with finer soils. The taller A. radiana is common on sandy soils. A. senegal, A. laeta and A. ehrenbergiana grow on fixed dunes. Along streams and rivers A. nilotica and A. sieberiana are found in profusion. Shrubs in this region are also thorny, and can form a steppe landscape. Common shrubs include Commiphora africana, desert date (Balanites aegyptiaca) and balsam spurge (Euphorbia balsamifera). Grasses are tussocky and heavy grazing keeps the grasslands short. Fires are less severe than further south.Sudan savannah
The central region of the Sahel, with rainfall roughly between 500 and 1,000 mm per year hosts the typical savannah land-scape or Sudan savannah. The dry season typically lasts seven months. Species composition varies in this region, with spe-cies from the drier north and wetter south interwoven depen-dent on both edaphic conditions and man’s use of the land-scape. Common tree species throughout most of the Sudan
savannah include the dum (or doum) palm (Hyphaene theba-ica), desert date (Balanites aegyptia) and baobab (Adansonia digitata). However, the most common tree species are various species of Acacia.Savannah woodland expansion
The southern fringes of the Sahel, with rainfall above 1,000 mm per year and a dry season of approximately six months, is dominated by moist savannah woodlands. The sa-vannah then gradually changes into a lowland rainforest to-wards the wetter south. The margin between the savannah woodland and the rainforest is today dominated by fire tolerant species, including red oak/ironwood (Lophira lanceolata), idi (Terminalia schimperiana: synonym: glaucescens), digbe (fr) (Hymenocardia acida), meru-oak (Vitex doniana), tallow tree (Detarium microcarpum) and Afzelia africana. These trees have invaded the transition region as a result of cutting of the original forest, and frequent fires and high grazing pressure. The frequent fires cause the trees to be twisted and gnarled, and also prevent the rainforest from regaining foothold. In ar-eas with less fires, common species include Isoberlina species (Isoberlina spp.), red cedar (Uapaca togoensis: synomym U. somon) and Monotes kerstingii. Most of Burkina Faso, and the southern parts of Mali and Niger lay within the savannah woodland region.
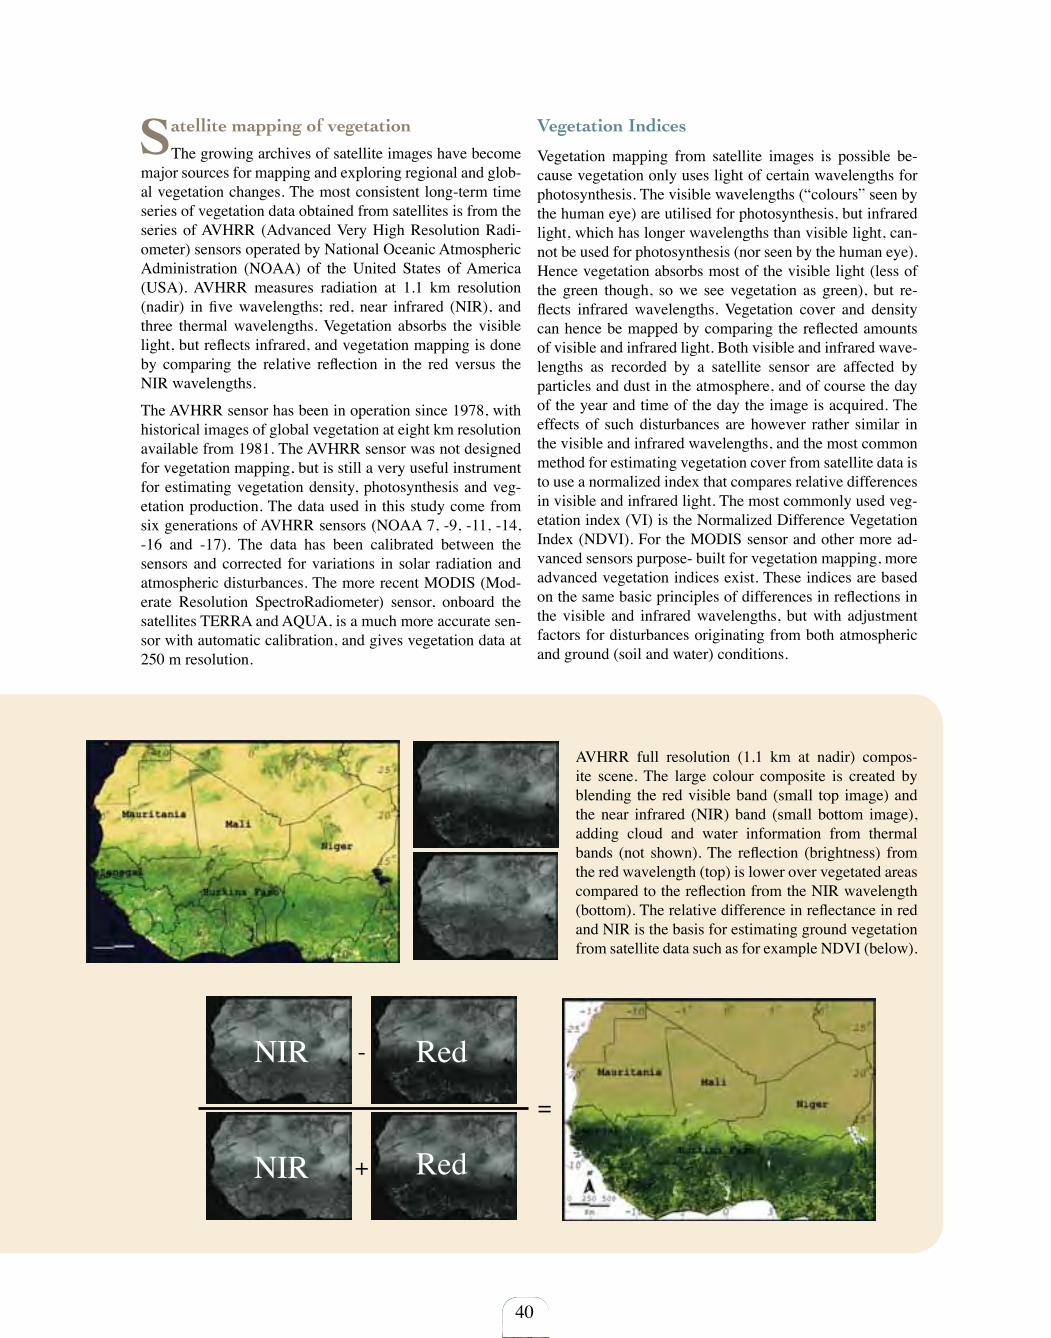
AVHRR full resolution (1.1 km at nadir) compos-ite scene. The large colour composite is created by blending the red visible band (small top image) and the near infrared (NIR) band (small bottom image), adding cloud and water information from thermal bands (not shown). The reflection (brightness) from the red wavelength (top) is lower over vegetated areas compared to the reflection from the NIR wavelength (bottom). The relative difference in reflectance in red and NIR is the basis for estimating ground vegetation from satellite data such as for example NDVI (below).
-
+
=
NIR
NIR
Red
Red
40
Satellite mapping of vegetation
The growing archives of satellite images have become major sources for mapping and exploring regional and glob-al vegetation changes. The most consistent long-term time series of vegetation data obtained from satellites is from the series of AVHRR (Advanced Very High Resolution Radi-ometer) sensors operated by National Oceanic Atmospheric Administration (NOAA) of the United States of America (USA). AVHRR measures radiation at 1.1 km resolution (nadir) in five wavelengths; red, near infrared (NIR), and three thermal wavelengths. Vegetation absorbs the visible light, but reflects infrared, and vegetation mapping is done by comparing the relative reflection in the red versus the NIR wavelengths.
The AVHRR sensor has been in operation since 1978, with historical images of global vegetation at eight km resolution available from 1981. The AVHRR sensor was not designed for vegetation mapping, but is still a very useful instrument for estimating vegetation density, photosynthesis and veg-etation production. The data used in this study come from six generations of AVHRR sensors (NOAA 7, -9, -11, -14, -16 and -17). The data has been calibrated between the sensors and corrected for variations in solar radiation and atmospheric disturbances. The more recent MODIS (Mod-erate Resolution SpectroRadiometer) sensor, onboard the satellites TERRA and AQUA, is a much more accurate sen-sor with automatic calibration, and gives vegetation data at 250 m resolution.
Vegetation Indices
Vegetation mapping from satellite images is possible be-cause vegetation only uses light of certain wavelengths for photosynthesis. The visible wavelengths (“colours” seen by the human eye) are utilised for photosynthesis, but infrared light, which has longer wavelengths than visible light, can-not be used for photosynthesis (nor seen by the human eye). Hence vegetation absorbs most of the visible light (less of the green though, so we see vegetation as green), but re-flects infrared wavelengths. Vegetation cover and density can hence be mapped by comparing the reflected amounts of visible and infrared light. Both visible and infrared wave-lengths as recorded by a satellite sensor are affected by particles and dust in the atmosphere, and of course the day of the year and time of the day the image is acquired. The effects of such disturbances are however rather similar in the visible and infrared wavelengths, and the most common method for estimating vegetation cover from satellite data is to use a normalized index that compares relative differences in visible and infrared light. The most commonly used veg-etation index (VI) is the Normalized Difference Vegetation Index (NDVI). For the MODIS sensor and other more ad-vanced sensors purpose- built for vegetation mapping, more advanced vegetation indices exist. These indices are based on the same basic principles of differences in reflections in the visible and infrared wavelengths, but with adjustment factors for disturbances originating from both atmospheric and ground (soil and water) conditions.
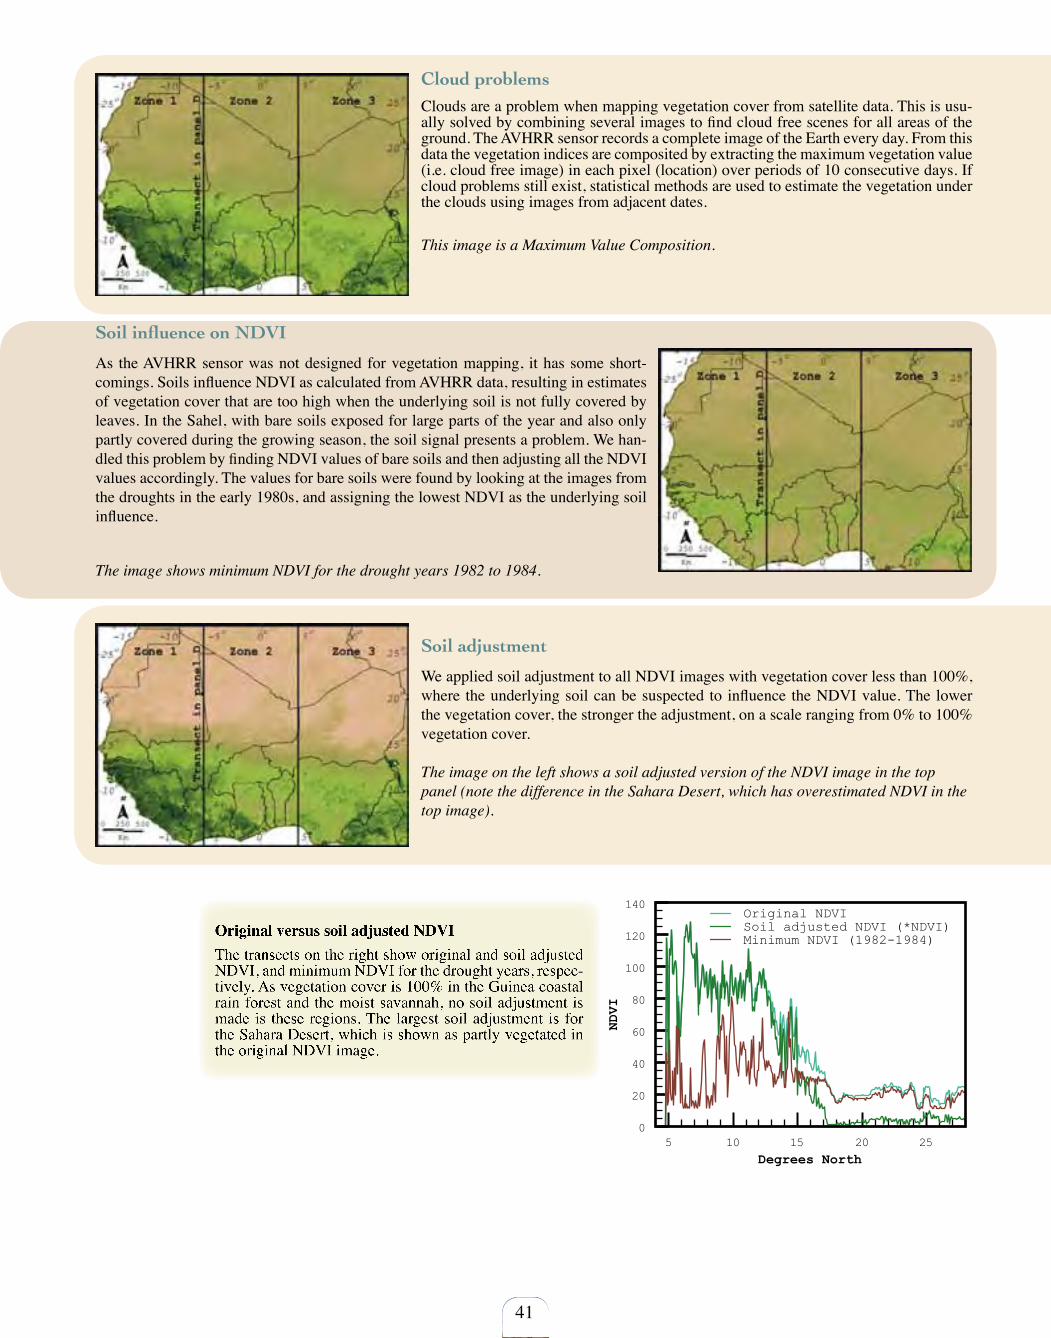
5 10 15 20 25
Degrees North
0
20
40
60
80
100
120
140
NDVI
Original NDVI Soil adjusted NDVI (*NDVI)Minimum NDVI (1982-1984)
41
Original versus soil adjusted NDVIThe transects on the right show original and soil adjusted NDVI, and minimum NDVI for the drought years, respec-tively. As vegetation cover is 100% in the Guinea coastal rain forest and the moist savannah, no soil adjustment is made is these regions. The largest soil adjustment is for the Sahara Desert, which is shown as partly vegetated in the original NDVI image.
Soil adjustment
We applied soil adjustment to all NDVI images with vegetation cover less than 100%, where the underlying soil can be suspected to influence the NDVI value. The lower the vegetation cover, the stronger the adjustment, on a scale ranging from 0% to 100% vegetation cover.
The image on the left shows a soil adjusted version of the NDVI image in the top panel (note the difference in the Sahara Desert, which has overestimated NDVI in the top image).
Soil influence on NDVI
As the AVHRR sensor was not designed for vegetation mapping, it has some short-comings. Soils influence NDVI as calculated from AVHRR data, resulting in estimates of vegetation cover that are too high when the underlying soil is not fully covered by leaves. In the Sahel, with bare soils exposed for large parts of the year and also only partly covered during the growing season, the soil signal presents a problem. We han-dled this problem by finding NDVI values of bare soils and then adjusting all the NDVI values accordingly. The values for bare soils were found by looking at the images from the droughts in the early 1980s, and assigning the lowest NDVI as the underlying soil influence.
The image shows minimum NDVI for the drought years 1982 to 1984.
Cloud problemsClouds are a problem when mapping vegetation cover from satellite data. This is usu-ally solved by combining several images to find cloud free scenes for all areas of the ground. The AVHRR sensor records a complete image of the Earth every day. From this data the vegetation indices are composited by extracting the maximum vegetation value (i.e. cloud free image) in each pixel (location) over periods of 10 consecutive days. If cloud problems still exist, statistical methods are used to estimate the vegetation under the clouds using images from adjacent dates.
This image is a Maximum Value Composition.
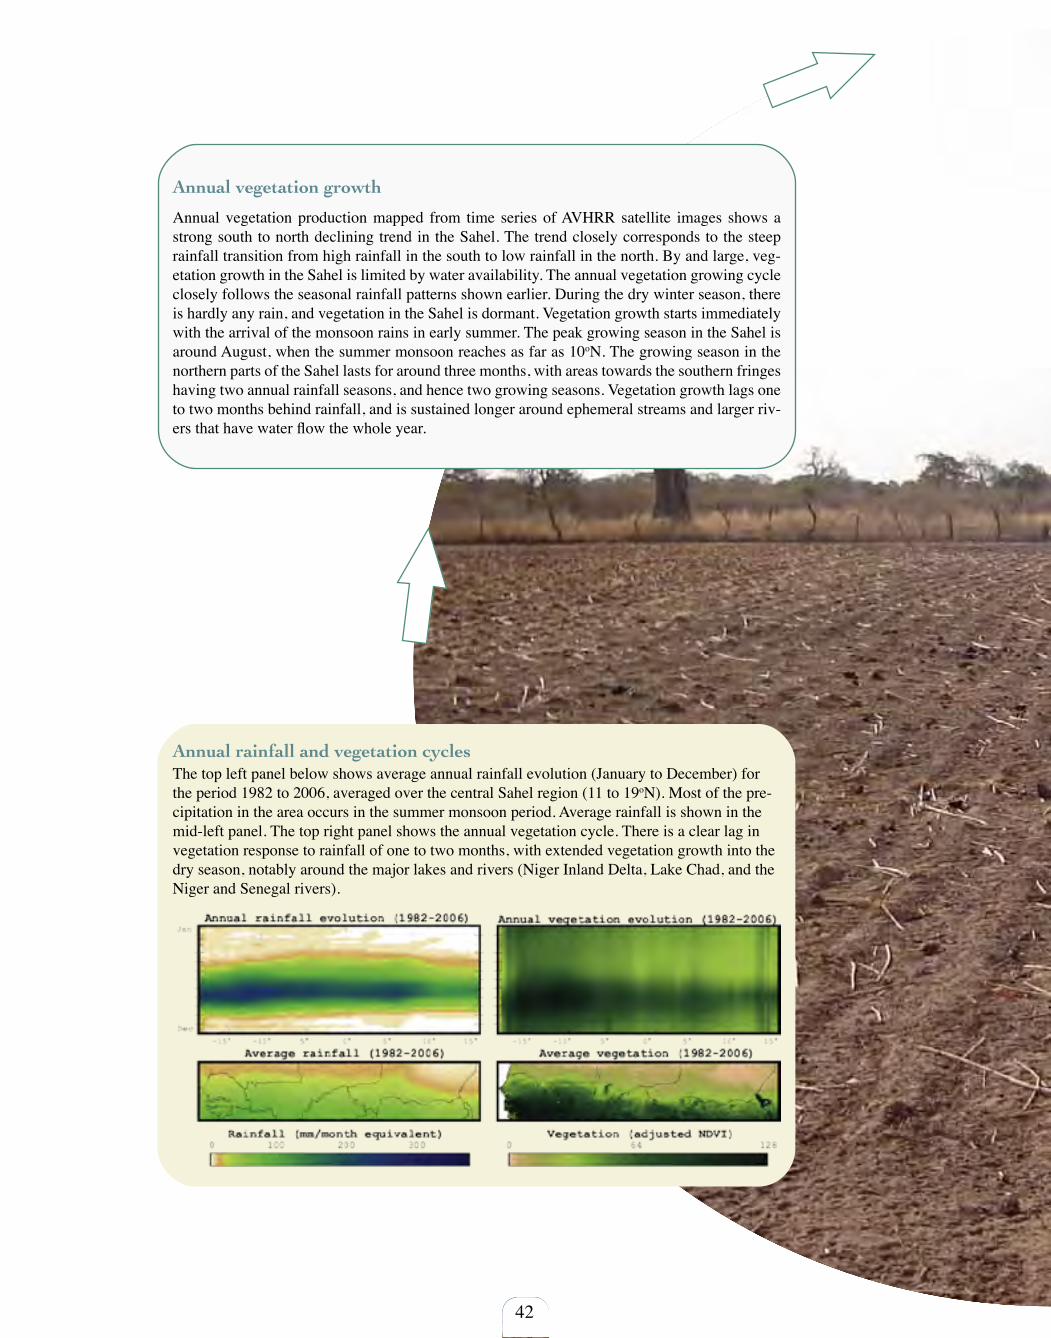
42
Annual vegetation growth
Annual vegetation production mapped from time series of AVHRR satellite images shows a strong south to north declining trend in the Sahel. The trend closely corresponds to the steep rainfall transition from high rainfall in the south to low rainfall in the north. By and large, veg-etation growth in the Sahel is limited by water availability. The annual vegetation growing cycle closely follows the seasonal rainfall patterns shown earlier. During the dry winter season, there is hardly any rain, and vegetation in the Sahel is dormant. Vegetation growth starts immediately with the arrival of the monsoon rains in early summer. The peak growing season in the Sahel is around August, when the summer monsoon reaches as far as 10oN. The growing season in the northern parts of the Sahel lasts for around three months, with areas towards the southern fringes having two annual rainfall seasons, and hence two growing seasons. Vegetation growth lags one to two months behind rainfall, and is sustained longer around ephemeral streams and larger riv-ers that have water flow the whole year.
Annual rainfall and vegetation cyclesThe top left panel below shows average annual rainfall evolution (January to December) for the period 1982 to 2006, averaged over the central Sahel region (11 to 19oN). Most of the pre-cipitation in the area occurs in the summer monsoon period. Average rainfall is shown in the mid-left panel. The top right panel shows the annual vegetation cycle. There is a clear lag in vegetation response to rainfall of one to two months, with extended vegetation growth into the dry season, notably around the major lakes and rivers (Niger Inland Delta, Lake Chad, and the Niger and Senegal rivers).
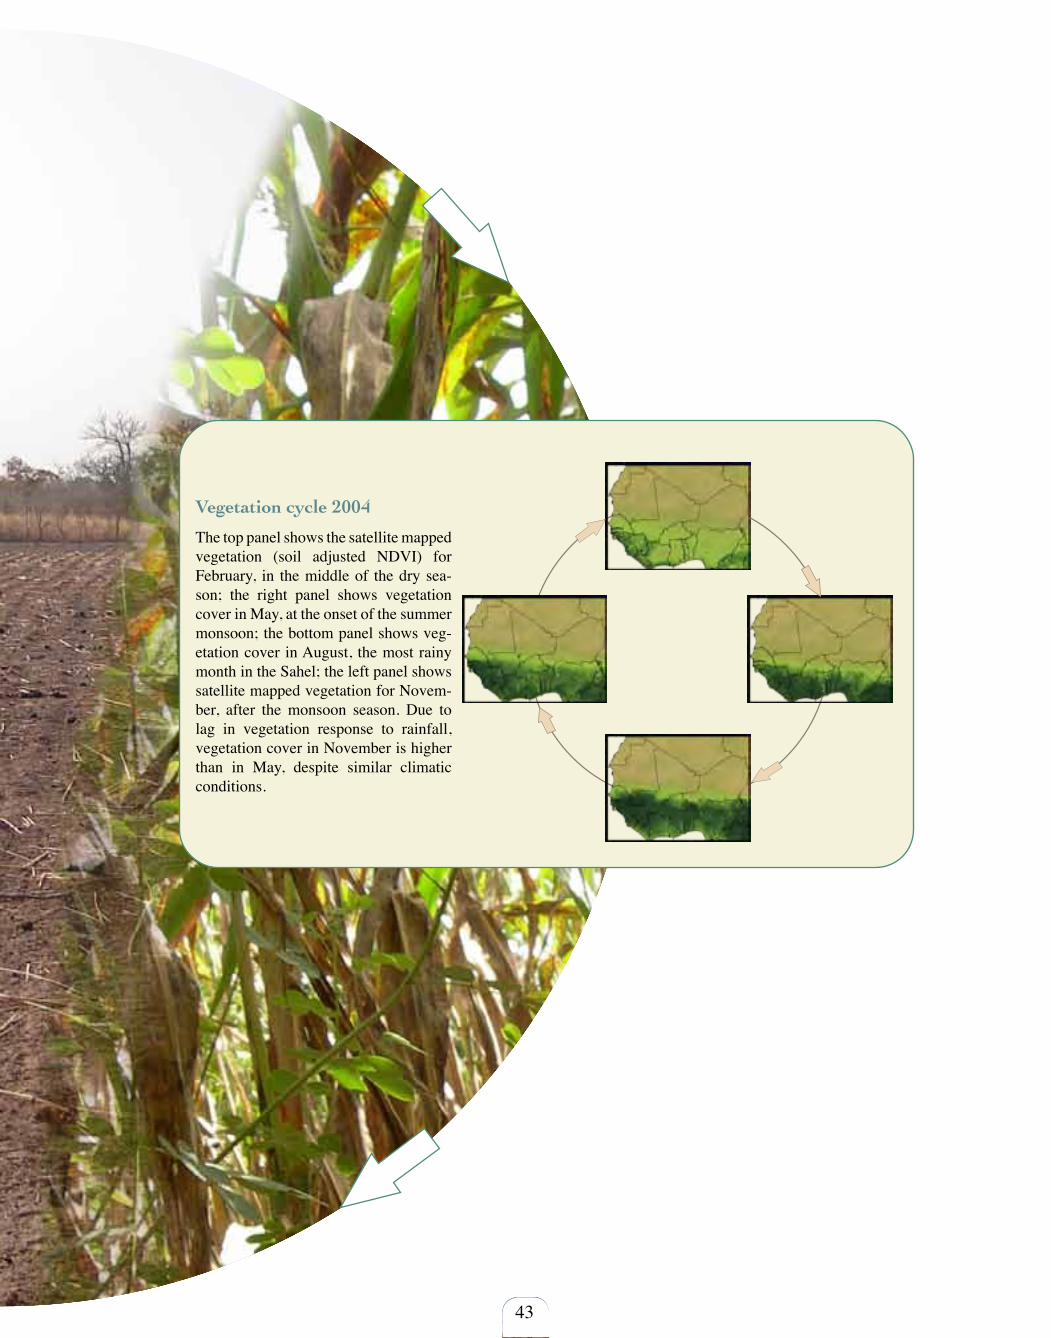
43
Vegetation cycle 2004
The top panel shows the satellite mapped vegetation (soil adjusted NDVI) for February, in the middle of the dry sea-son; the right panel shows vegetation cover in May, at the onset of the summer monsoon; the bottom panel shows veg-etation cover in August, the most rainy month in the Sahel; the left panel shows satellite mapped vegetation for Novem-ber, after the monsoon season. Due to lag in vegetation response to rainfall, vegetation cover in November is higher than in May, despite similar climatic conditions.

44
Vegetation variations
Vegetation growth in the Sahel is almost directly (linearly) related to rainfall up to about 800 mm annual rainfall. Variation in annual veg-etation production has, however, been high over the period 1982 to 2006, driven by a climatic transition from dry to wet conditions. During the droughts, reductions in livestock numbers and migration from drought stricken regions led to changes in the vegetation communities of these areas. Grazing pressure after the return of higher rainfall was lower than previous to the droughts and the production of seed pools less affected by grazing. Years with both plentiful rains and a good seed pool tend to produce good grazing and hence attract large herds of cattle. This can cause the seed pool in the following year(s) to diminish, causing a lagged fluctuation pattern in vegetation growth compared to the rainfall pattern.
Vegetation variation 1982–2006
Coefficient of Variation for annual vegetation growth between 1982 and 2006. The variation in annual vegetation growth is largest in the Guinea rain forest, which is largely due to artifacts in the data caused by cluod contamination, and through-out most of the Sahel transitional ecological region.
Average vegetation production 1982–2006 The close relation between vegetation growth and rainfall in the Sahel transition zone is indicated by the positions of the isohyets for 300, 600 and 900 mm. The points (dots) on the map show the locations for the rainfall and vegetation distribution graphs on the opposite page.
Shifts (km north of the equator) in annual isohyets and average NDVI by year for countries in the Sahel (zones 1 to 3 in maps on page 41)
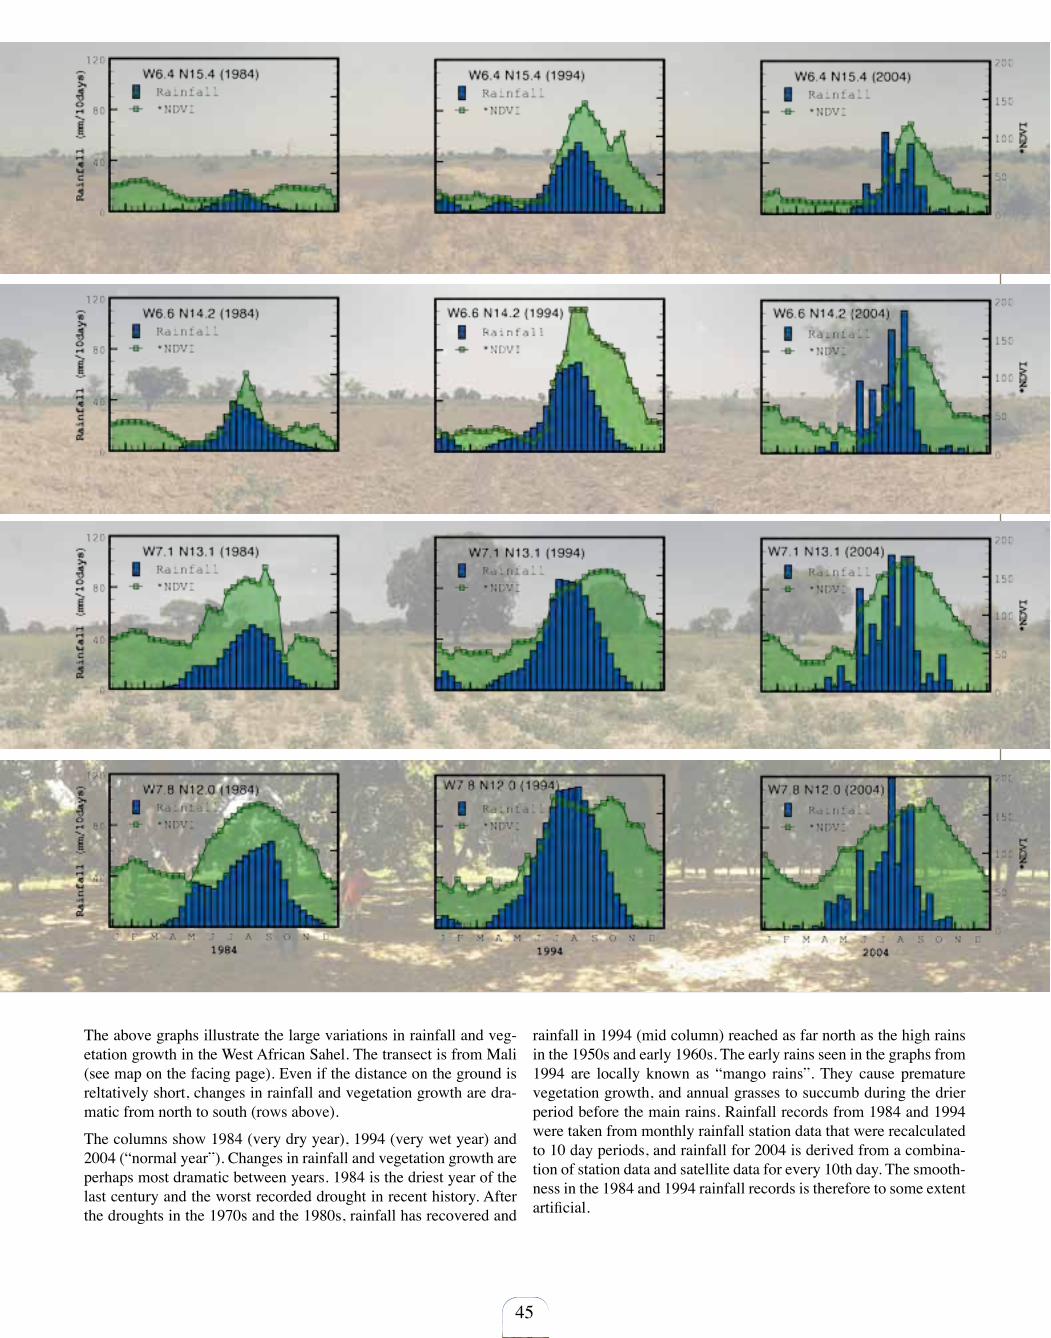
45
The above graphs illustrate the large variations in rainfall and veg-etation growth in the West African Sahel. The transect is from Mali (see map on the facing page). Even if the distance on the ground is reltatively short, changes in rainfall and vegetation growth are dra-matic from north to south (rows above).
The columns show 1984 (very dry year), 1994 (very wet year) and 2004 (“normal year”). Changes in rainfall and vegetation growth are perhaps most dramatic between years. 1984 is the driest year of the last century and the worst recorded drought in recent history. After the droughts in the 1970s and the 1980s, rainfall has recovered and
rainfall in 1994 (mid column) reached as far north as the high rains in the 1950s and early 1960s. The early rains seen in the graphs from 1994 are locally known as “mango rains”. They cause premature vegetation growth, and annual grasses to succumb during the drier period before the main rains. Rainfall records from 1984 and 1994 were taken from monthly rainfall station data that were recalculated to 10 day periods, and rainfall for 2004 is derived from a combina-tion of station data and satellite data for every 10th day. The smooth-ness in the 1984 and 1994 rainfall records is therefore to some extent artificial.

46
Vegetation evolution 1981 to 2006
In the graphs below, the top diagrams show the evolution of rain-fall (left) and vegetation (right) for each 10-day period from July 1981 to December 2006 across the parklands of the Sahel, between 11 and 18oN (mid-panels).
The low rainfall (droughts) in the early 1980s (especially 1984) is evident, as is the higher rainfall in for example 1994 and 1998. The “mango rains” of 1994 are also visible in the graph, but are more or less restricted to Mali. The evolution of vegetation over this 25 year period closely follows the rainfall pattern, with the lowest vegetation in 1984 and the highest in 1994. Note that the vegeta-tion is differently scaled in this figure compared to the maps.
Calculating annual vegetation production
For AVHRR, an annual cycle is composed of 36 images, each cov-ering a 10 day period. The annual average NDVI is often used as a proxy for annual vegetation production. As the growing season in the Sahel starts around April and lasts until around November, we calculate annual vegetation production using the calender year from January to December.
In farmlands, where crops can be assumed to grow from seed to plant and then be harvested, it is better to use annual maximum NDVI, assuming that this is vegetation cover before harvest. Ei-ther of these methods work well in landscapes with stable vegeta-tion cover types and land use. In the Sahel, however, large changes in rainfall have driven changes in vegetation types and land use. Grazing areas and fallows have been converted to farmland, and trees have been planted. These changes in vegetation cover and land use alter average and maximum NDVI values, even where there has been no change in vegetation production. In general, woodlands will have higher NDVI.
Vegetation production in rangelands (grazing land) may be as high as in fallows or farmlands, but vegetation cover rarely reaches its potential due to intermittent grazing. This effect is probably af-fecting most of the Sahel where free-grazing on communal lands is widely practiced.
To overcome the problems of using average or maximum NDVI to estimate annual vegetation production in the changing environ-ments of the Sahel, an alternative annual production index was developed in this study. The alternative index calculates the annual
increment in vegetation growth, if NDVI is higher in one period compared to the previous it is added to the annual index, if it is lower it is not considered. In an ideal situation with a crop start-ing from seed, reaching maximum growth just before harvest, the increment index will have exactly the same value as maximum NDVI. On grazing land, the index captures vegetation growth after each intermittent grazing period. The increment index also has the advantage of adjusting for initial conditions on the ground at the start of the growing season.
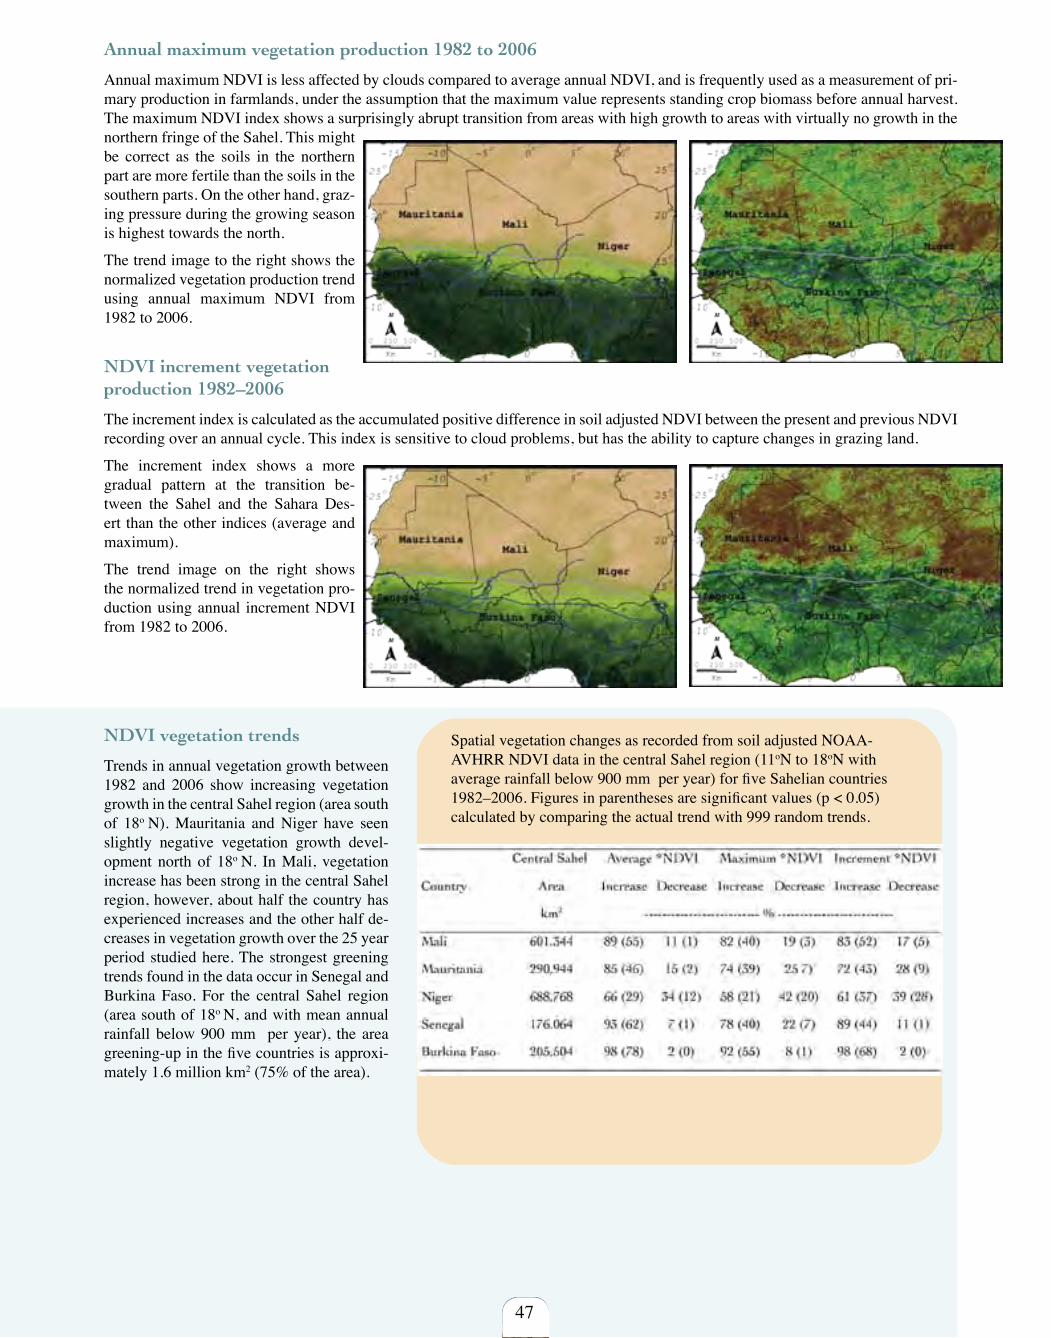
NDVI vegetation trends
Trends in annual vegetation growth between 1982 and 2006 show increasing vegetation growth in the central Sahel region (area south of 18o N). Mauritania and Niger have seen slightly negative vegetation growth devel-opment north of 18o N. In Mali, vegetation increase has been strong in the central Sahel region, however, about half the country has experienced increases and the other half de-creases in vegetation growth over the 25 year period studied here. The strongest greening trends found in the data occur in Senegal and Burkina Faso. For the central Sahel region (area south of 18o N, and with mean annual rainfall below 900 mm per year), the area greening-up in the five countries is approxi-mately 1.6 million km2 (75% of the area).
Spatial vegetation changes as recorded from soil adjusted NOAA-AVHRR NDVI data in the central Sahel region (11oN to 18oN withaverage rainfall below 900 mm per year) for five Sahelian countries1982–2006. Figures in parentheses are significant values (p < 0.05)calculated by comparing the actual trend with 999 random trends.
47
Annual maximum vegetation production 1982 to 2006
Annual maximum NDVI is less affected by clouds compared to average annual NDVI, and is frequently used as a measurement of pri-mary production in farmlands, under the assumption that the maximum value represents standing crop biomass before annual harvest. The maximum NDVI index shows a surprisingly abrupt transition from areas with high growth to areas with virtually no growth in the northern fringe of the Sahel. This might be correct as the soils in the northern part are more fertile than the soils in the southern parts. On the other hand, graz-ing pressure during the growing season is highest towards the north.
The trend image to the right shows the normalized vegetation production trend using annual maximum NDVI from 1982 to 2006.
NDVI increment vegetation production 1982–2006
The increment index is calculated as the accumulated positive difference in soil adjusted NDVI between the present and previous NDVI recording over an annual cycle. This index is sensitive to cloud problems, but has the ability to capture changes in grazing land.
The increment index shows a more gradual pattern at the transition be-tween the Sahel and the Sahara Des-ert than the other indices (average and maximum).
The trend image on the right shows the normalized trend in vegetation pro-duction using annual increment NDVI from 1982 to 2006.
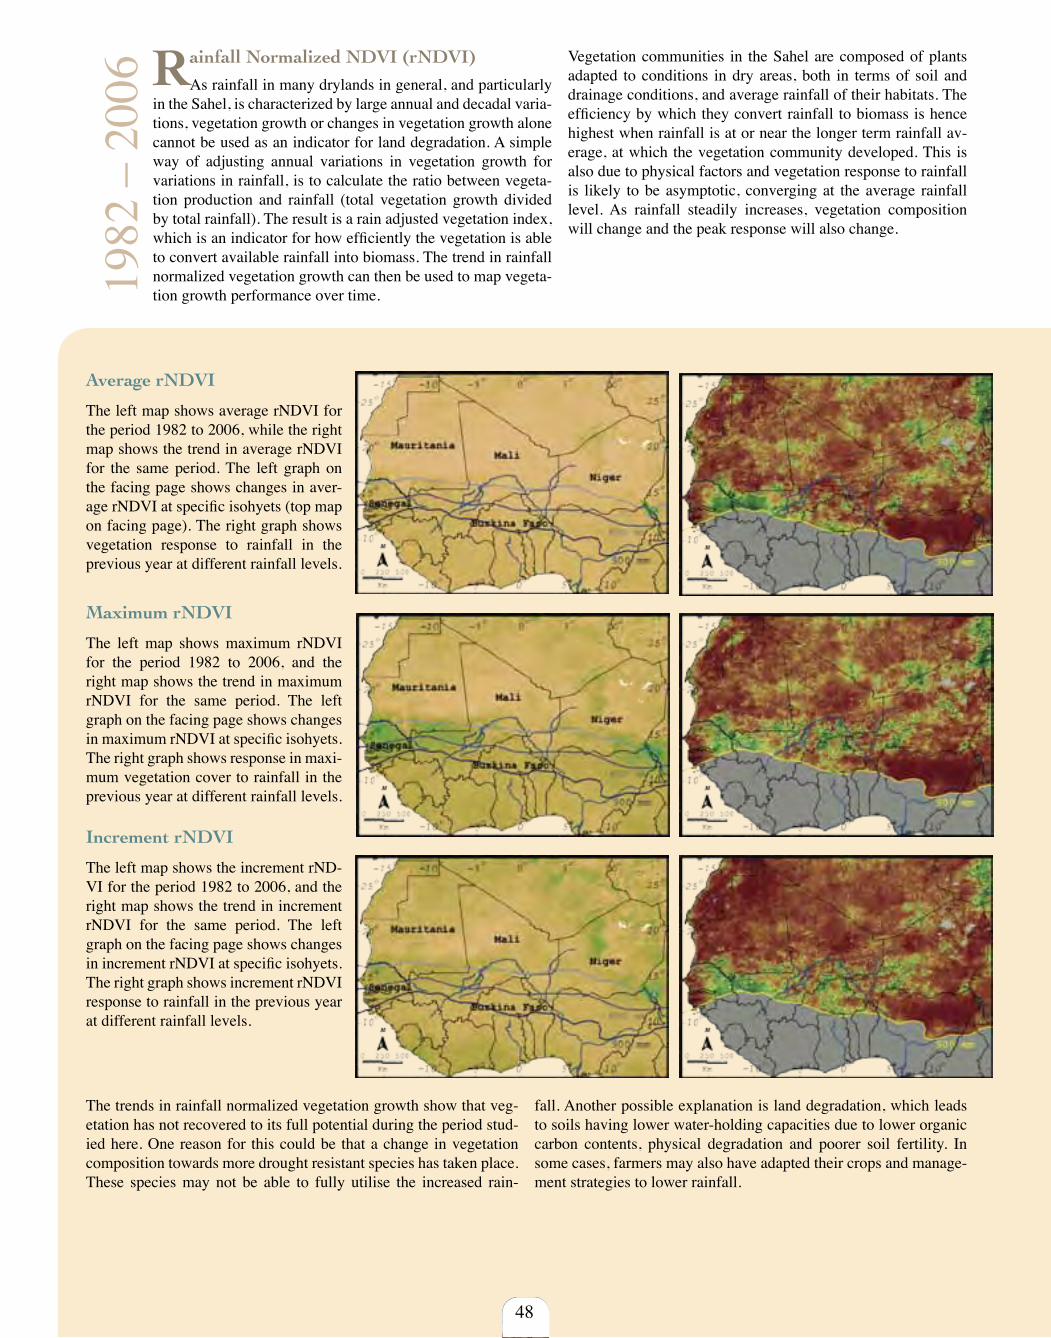
Average rNDVI
The left map shows average rNDVI for the period 1982 to 2006, while the right map shows the trend in average rNDVI for the same period. The left graph on the facing page shows changes in aver-age rNDVI at specific isohyets (top map on facing page). The right graph shows vegetation response to rainfall in the previous year at different rainfall levels.
Maximum rNDVI
The left map shows maximum rNDVI for the period 1982 to 2006, and the right map shows the trend in maximum rNDVI for the same period. The left graph on the facing page shows changes in maximum rNDVI at specific isohyets. The right graph shows response in maxi-mum vegetation cover to rainfall in the previous year at different rainfall levels.
Increment rNDVI
The left map shows the increment rND-VI for the period 1982 to 2006, and the right map shows the trend in increment rNDVI for the same period. The left graph on the facing page shows changes in increment rNDVI at specific isohyets. The right graph shows increment rNDVI response to rainfall in the previous year at different rainfall levels.
48
Rainfall Normalized NDVI (rNDVI)
As rainfall in many drylands in general, and particularly in the Sahel, is characterized by large annual and decadal varia-tions, vegetation growth or changes in vegetation growth alone cannot be used as an indicator for land degradation. A simple way of adjusting annual variations in vegetation growth for variations in rainfall, is to calculate the ratio between vegeta-tion production and rainfall (total vegetation growth divided by total rainfall). The result is a rain adjusted vegetation index, which is an indicator for how efficiently the vegetation is able to convert available rainfall into biomass. The trend in rainfall normalized vegetation growth can then be used to map vegeta-tion growth performance over time.
Vegetation communities in the Sahel are composed of plants adapted to conditions in dry areas, both in terms of soil and drainage conditions, and average rainfall of their habitats. The efficiency by which they convert rainfall to biomass is hence highest when rainfall is at or near the longer term rainfall av-erage, at which the vegetation community developed. This is also due to physical factors and vegetation response to rainfall is likely to be asymptotic, converging at the average rainfall level. As rainfall steadily increases, vegetation composition will change and the peak response will also change.
The trends in rainfall normalized vegetation growth show that veg-etation has not recovered to its full potential during the period stud-ied here. One reason for this could be that a change in vegetation composition towards more drought resistant species has taken place. These species may not be able to fully utilise the increased rain-
fall. Another possible explanation is land degradation, which leads to soils having lower water-holding capacities due to lower organic carbon contents, physical degradation and poorer soil fertility. In some cases, farmers may also have adapted their crops and manage-ment strategies to lower rainfall.
1982
– 2
006
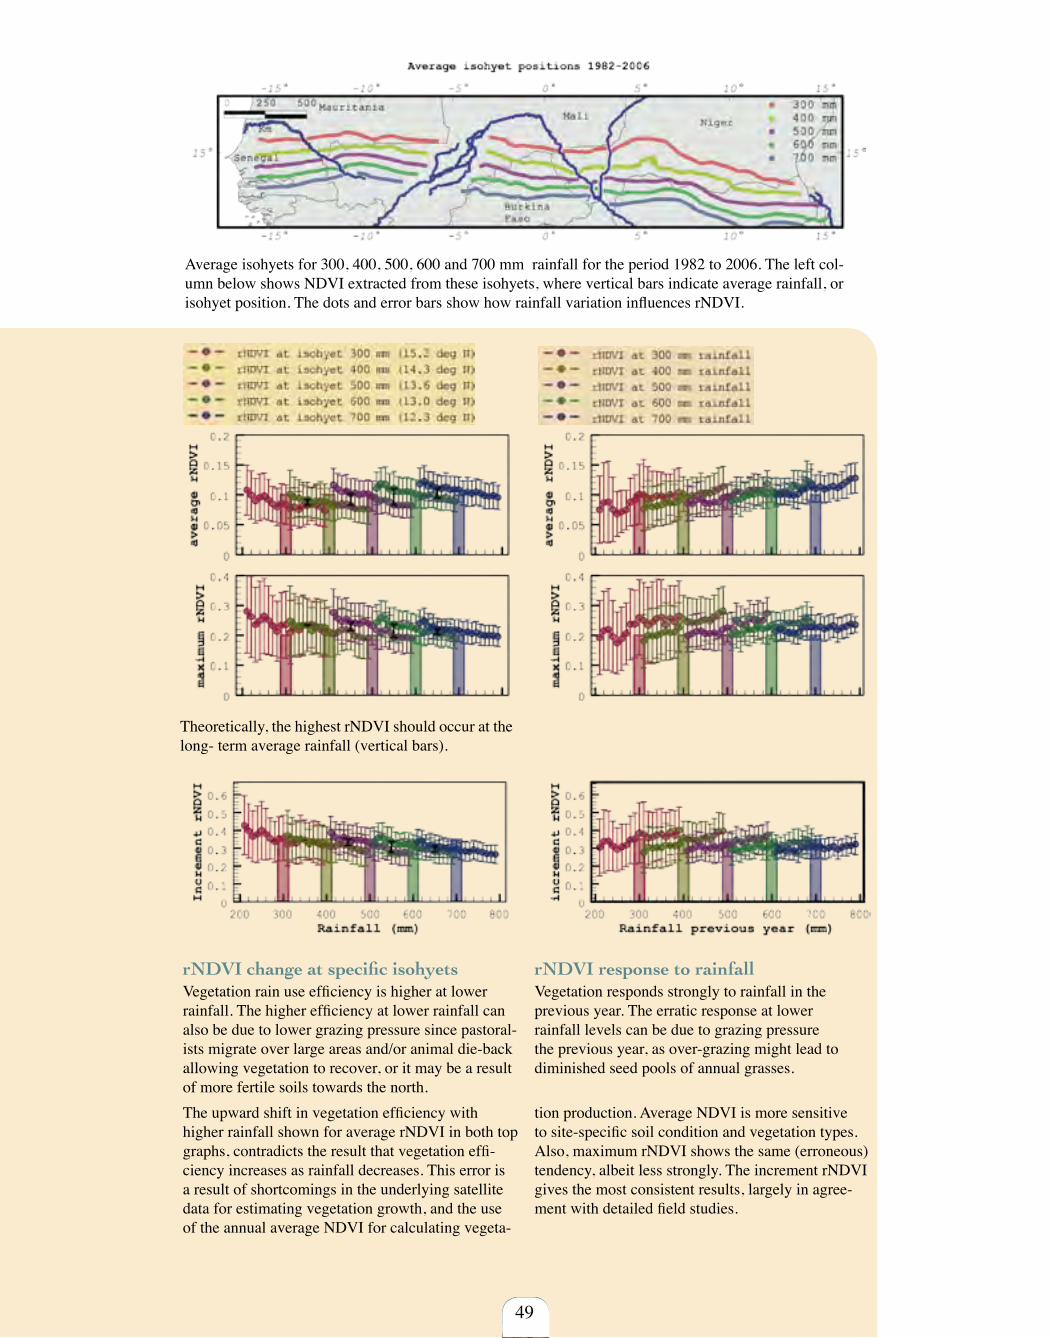
The upward shift in vegetation efficiency with higher rainfall shown for average rNDVI in both top graphs, contradicts the result that vegetation effi-ciency increases as rainfall decreases. This error is a result of shortcomings in the underlying satellite data for estimating vegetation growth, and the use of the annual average NDVI for calculating vegeta-
tion production. Average NDVI is more sensitive to site-specific soil condition and vegetation types. Also, maximum rNDVI shows the same (erroneous) tendency, albeit less strongly. The increment rNDVI gives the most consistent results, largely in agree-ment with detailed field studies.
49
Theoretically, the highest rNDVI should occur at the long- term average rainfall (vertical bars).
Average isohyets for 300, 400, 500, 600 and 700 mm rainfall for the period 1982 to 2006. The left col-umn below shows NDVI extracted from these isohyets, where vertical bars indicate average rainfall, or isohyet position. The dots and error bars show how rainfall variation influences rNDVI.
rNDVI change at specific isohyetsVegetation rain use efficiency is higher at lower rainfall. The higher efficiency at lower rainfall can also be due to lower grazing pressure since pastoral-ists migrate over large areas and/or animal die-back allowing vegetation to recover, or it may be a result of more fertile soils towards the north.
rNDVI response to rainfallVegetation responds strongly to rainfall in theprevious year. The erratic response at lowerrainfall levels can be due to grazing pressurethe previous year, as over-grazing might lead todiminished seed pools of annual grasses.
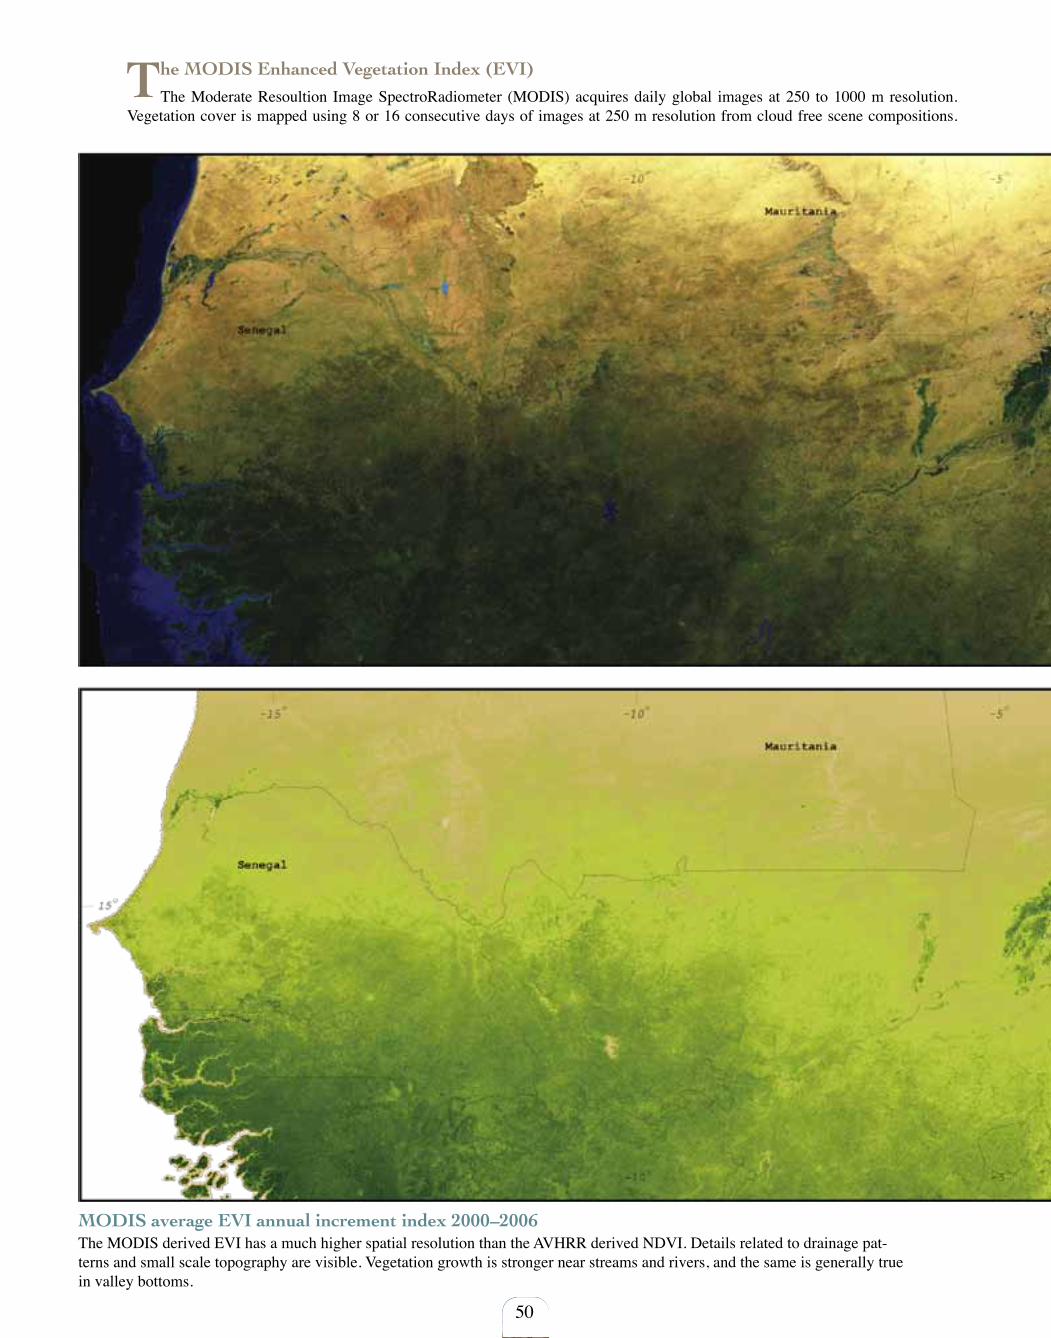
MODIS average EVI annual increment index 2000–2006The MODIS derived EVI has a much higher spatial resolution than the AVHRR derived NDVI. Details related to drainage pat-terns and small scale topography are visible. Vegetation growth is stronger near streams and rivers, and the same is generally true in valley bottoms.
50
The MODIS Enhanced Vegetation Index (EVI)
The Moderate Resoultion Image SpectroRadiometer (MODIS) acquires daily global images at 250 to 1000 m resolution. Vegetation cover is mapped using 8 or 16 consecutive days of images at 250 m resolution from cloud free scene compositions.
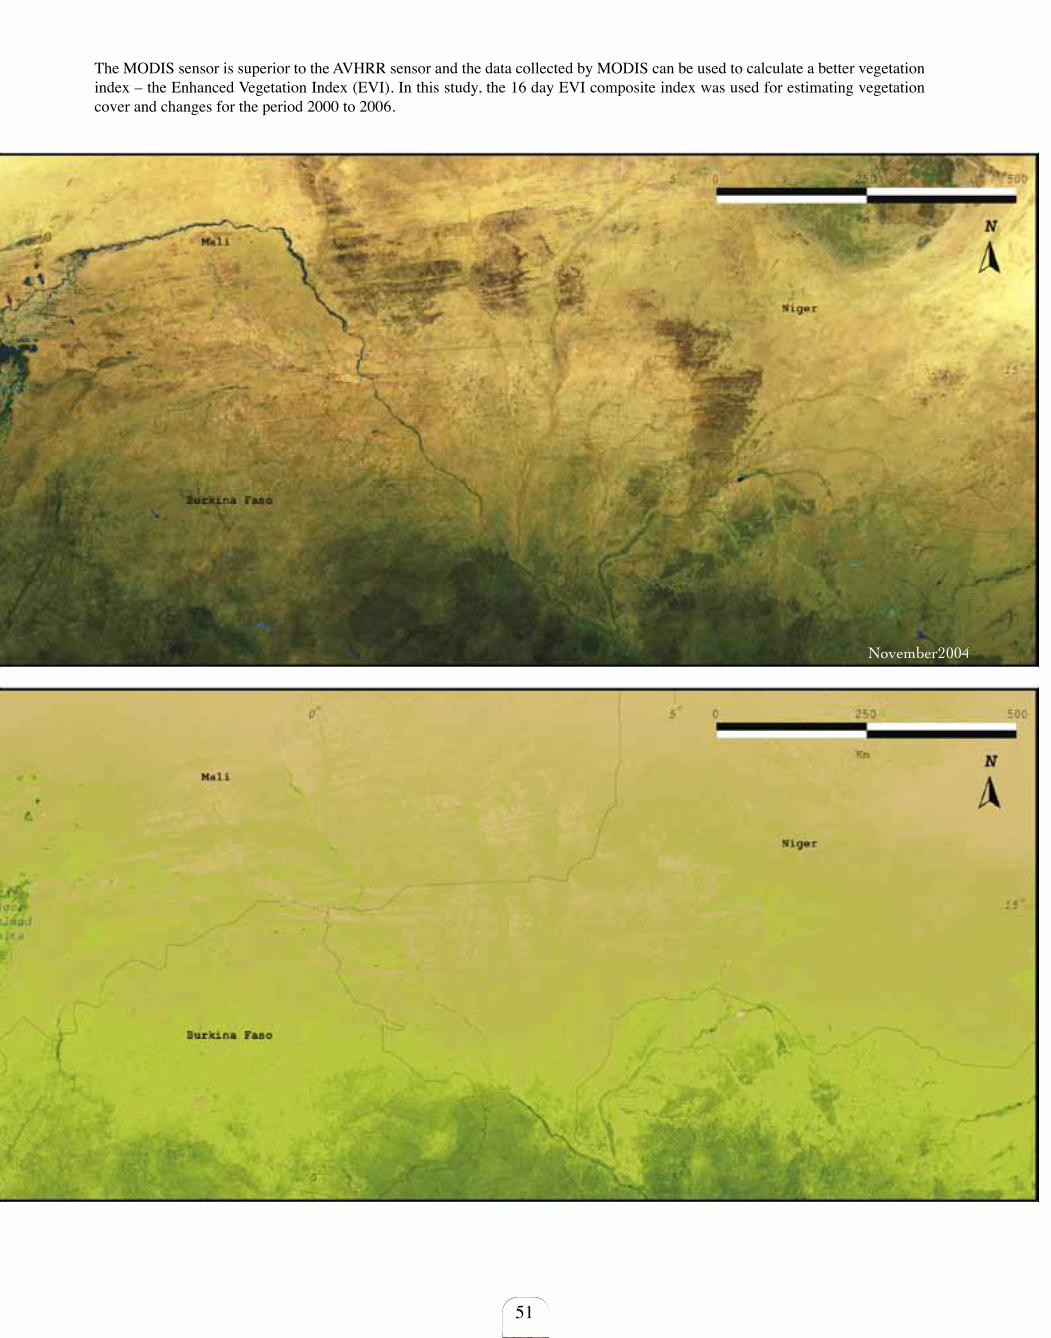
51
The MODIS sensor is superior to the AVHRR sensor and the data collected by MODIS can be used to calculate a better vegetation index – the Enhanced Vegetation Index (EVI). In this study, the 16 day EVI composite index was used for estimating vegetation cover and changes for the period 2000 to 2006.
November2004
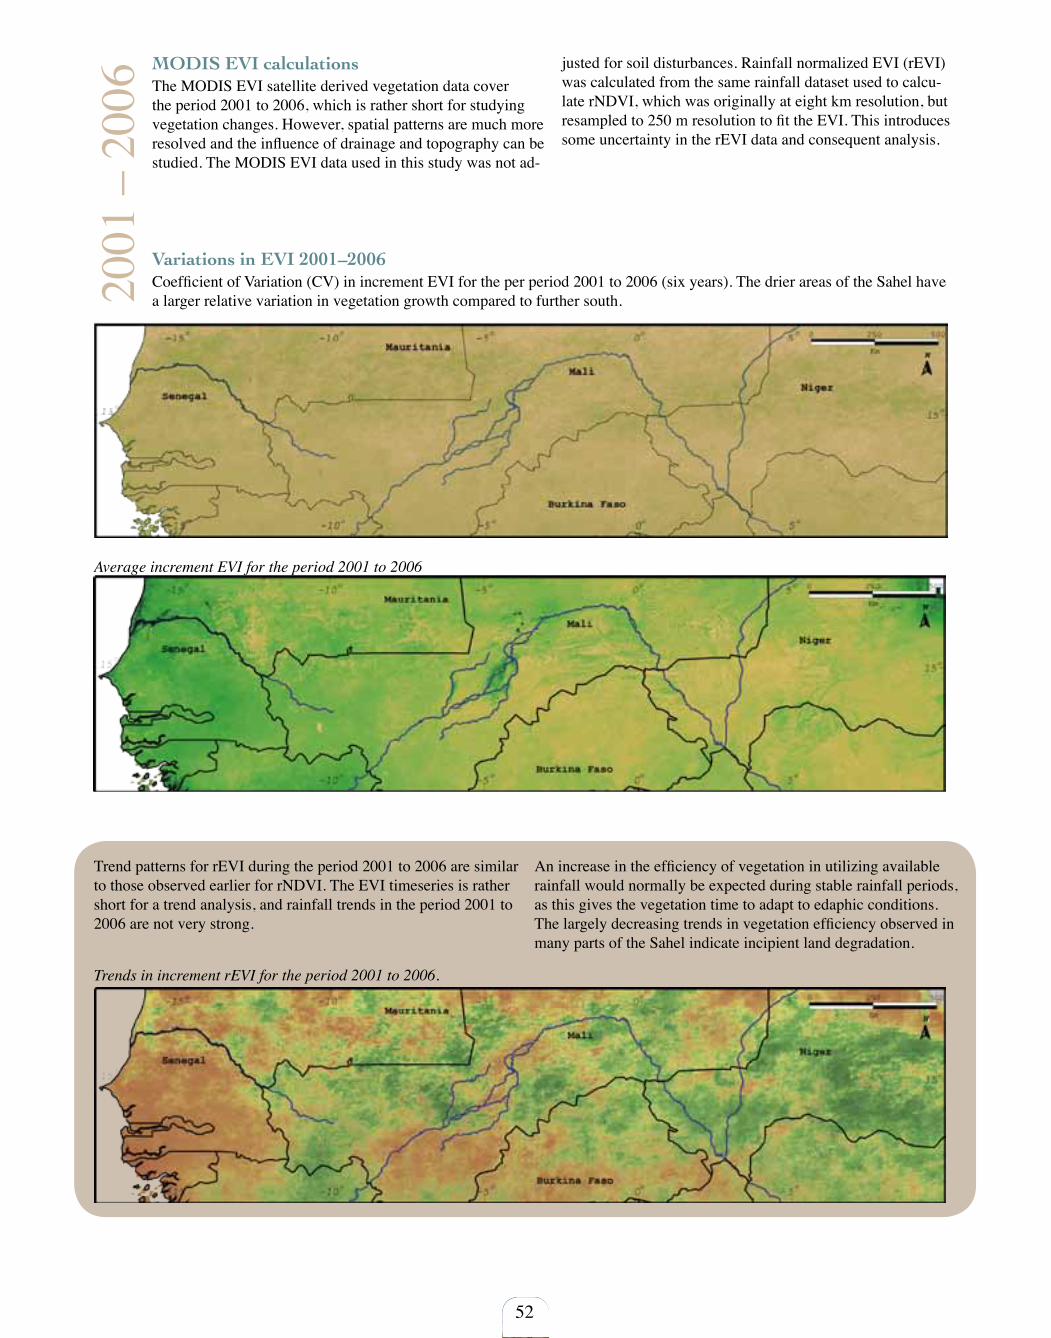
52
MODIS EVI calculationsThe MODIS EVI satellite derived vegetation data cover the period 2001 to 2006, which is rather short for studying vegetation changes. However, spatial patterns are much more resolved and the influence of drainage and topography can be studied. The MODIS EVI data used in this study was not ad-
justed for soil disturbances. Rainfall normalized EVI (rEVI) was calculated from the same rainfall dataset used to calcu-late rNDVI, which was originally at eight km resolution, but resampled to 250 m resolution to fit the EVI. This introduces some uncertainty in the rEVI data and consequent analysis.
Variations in EVI 2001–2006Coefficient of Variation (CV) in increment EVI for the per period 2001 to 2006 (six years). The drier areas of the Sahel have a larger relative variation in vegetation growth compared to further south.
Average increment EVI for the period 2001 to 2006
Trend patterns for rEVI during the period 2001 to 2006 are similar to those observed earlier for rNDVI. The EVI timeseries is rather short for a trend analysis, and rainfall trends in the period 2001 to 2006 are not very strong.
An increase in the efficiency of vegetation in utilizing available rainfall would normally be expected during stable rainfall periods, as this gives the vegetation time to adapt to edaphic conditions. The largely decreasing trends in vegetation efficiency observed in many parts of the Sahel indicate incipient land degradation.
Trends in increment rEVI for the period 2001 to 2006.
2001
– 2
006
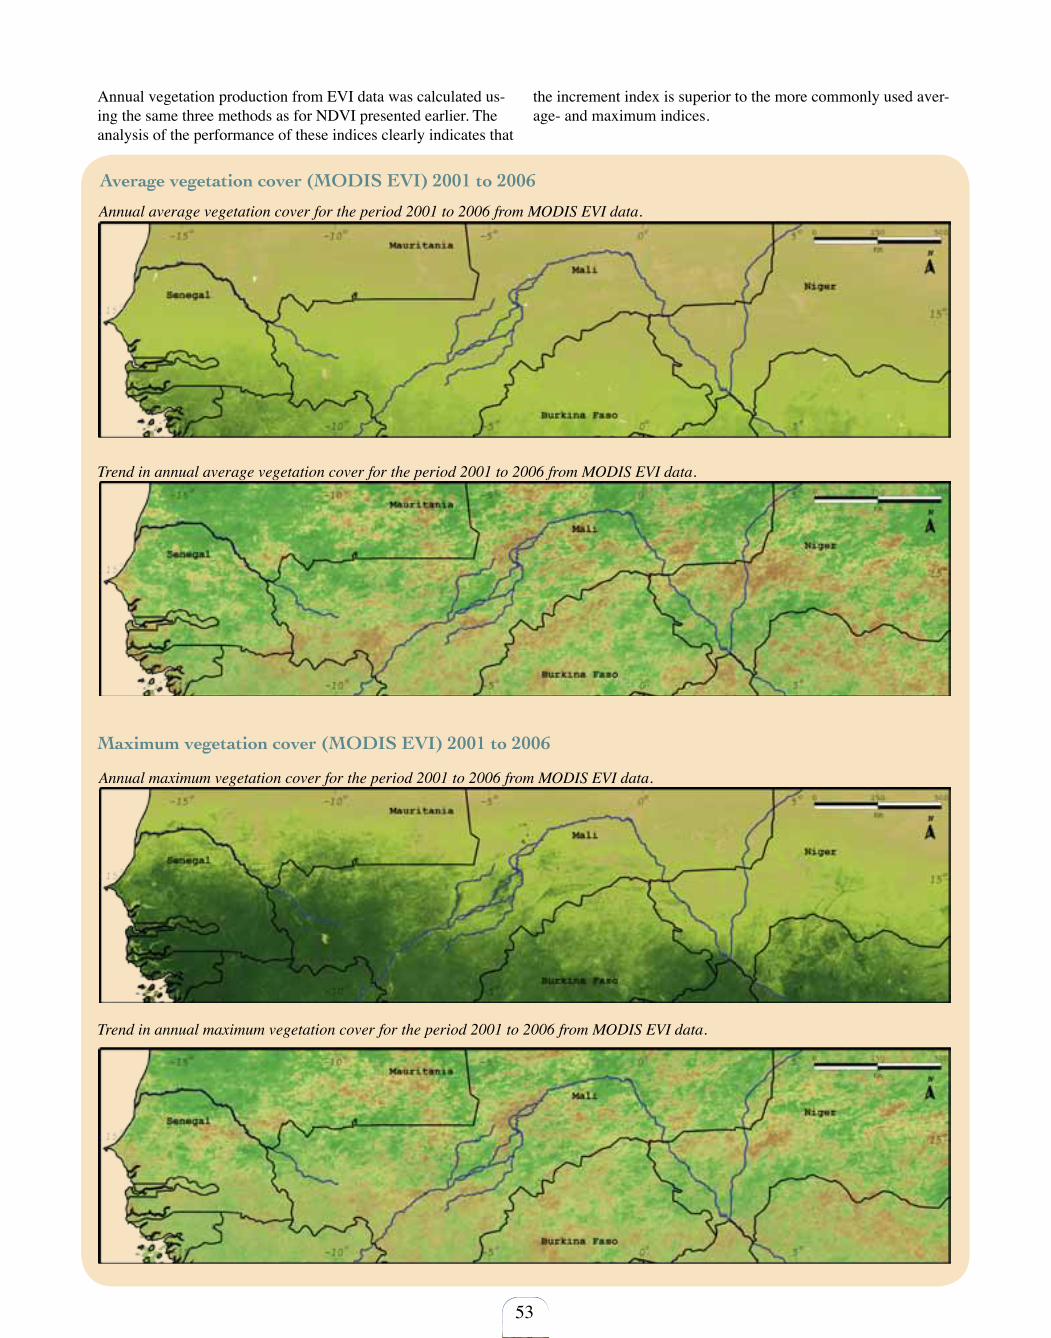
Average vegetation cover (MODIS EVI) 2001 to 2006
Annual average vegetation cover for the period 2001 to 2006 from MODIS EVI data.
Annual maximum vegetation cover for the period 2001 to 2006 from MODIS EVI data.
Trend in annual maximum vegetation cover for the period 2001 to 2006 from MODIS EVI data.
53
Annual vegetation production from EVI data was calculated us-ing the same three methods as for NDVI presented earlier. The analysis of the performance of these indices clearly indicates that
the increment index is superior to the more commonly used aver-age- and maximum indices.
Trend in annual average vegetation cover for the period 2001 to 2006 from MODIS EVI data.
Maximum vegetation cover (MODIS EVI) 2001 to 2006
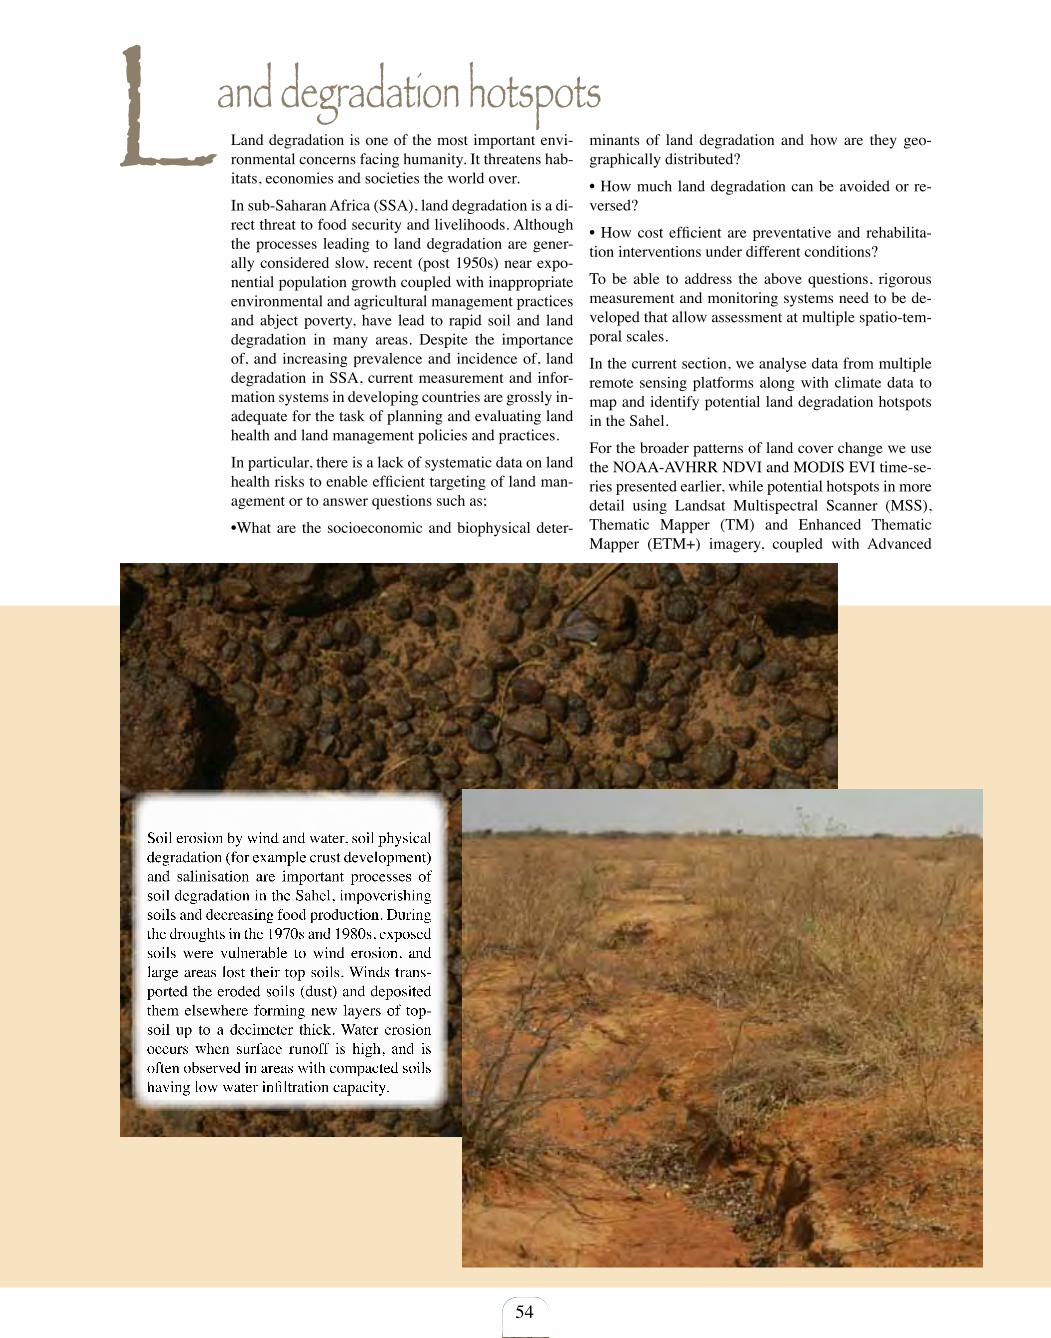
54
Land degradation hotspotsLand degradation is one of the most important envi-ronmental concerns facing humanity. It threatens hab-itats, economies and societies the world over.
In sub-Saharan Africa (SSA), land degradation is a di-rect threat to food security and livelihoods. Although the processes leading to land degradation are gener-ally considered slow, recent (post 1950s) near expo-nential population growth coupled with inappropriate environmental and agricultural management practices and abject poverty, have lead to rapid soil and land degradation in many areas. Despite the importance of, and increasing prevalence and incidence of, land degradation in SSA, current measurement and infor-mation systems in developing countries are grossly in-adequate for the task of planning and evaluating land health and land management policies and practices.
In particular, there is a lack of systematic data on land health risks to enable efficient targeting of land man-agement or to answer questions such as;
•What are the socioeconomic and biophysical deter-
minants of land degradation and how are they geo-graphically distributed?
• How much land degradation can be avoided or re-versed?
• How cost efficient are preventative and rehabilita-tion interventions under different conditions?
To be able to address the above questions, rigorous measurement and monitoring systems need to be de-veloped that allow assessment at multiple spatio-tem-poral scales.
In the current section, we analyse data from multiple remote sensing platforms along with climate data to map and identify potential land degradation hotspots in the Sahel.
For the broader patterns of land cover change we use the NOAA-AVHRR NDVI and MODIS EVI time-se-ries presented earlier, while potential hotspots in more detail using Landsat Multispectral Scanner (MSS), Thematic Mapper (TM) and Enhanced Thematic Mapper (ETM+) imagery, coupled with Advanced
Soil erosion by wind and water, soil physical degradation (for example crust development) and salinisation are important processes of soil degradation in the Sahel, impoverishing soils and decreasing food production. During the droughts in the 1970s and 1980s, exposed soils were vulnerable to wind erosion, and large areas lost their top soils. Winds trans-ported the eroded soils (dust) and deposited them elsewhere forming new layers of top-soil up to a decimeter thick. Water erosion occurs when surface runoff is high, and is often observed in areas with compacted soils having low water infiltration capacity.
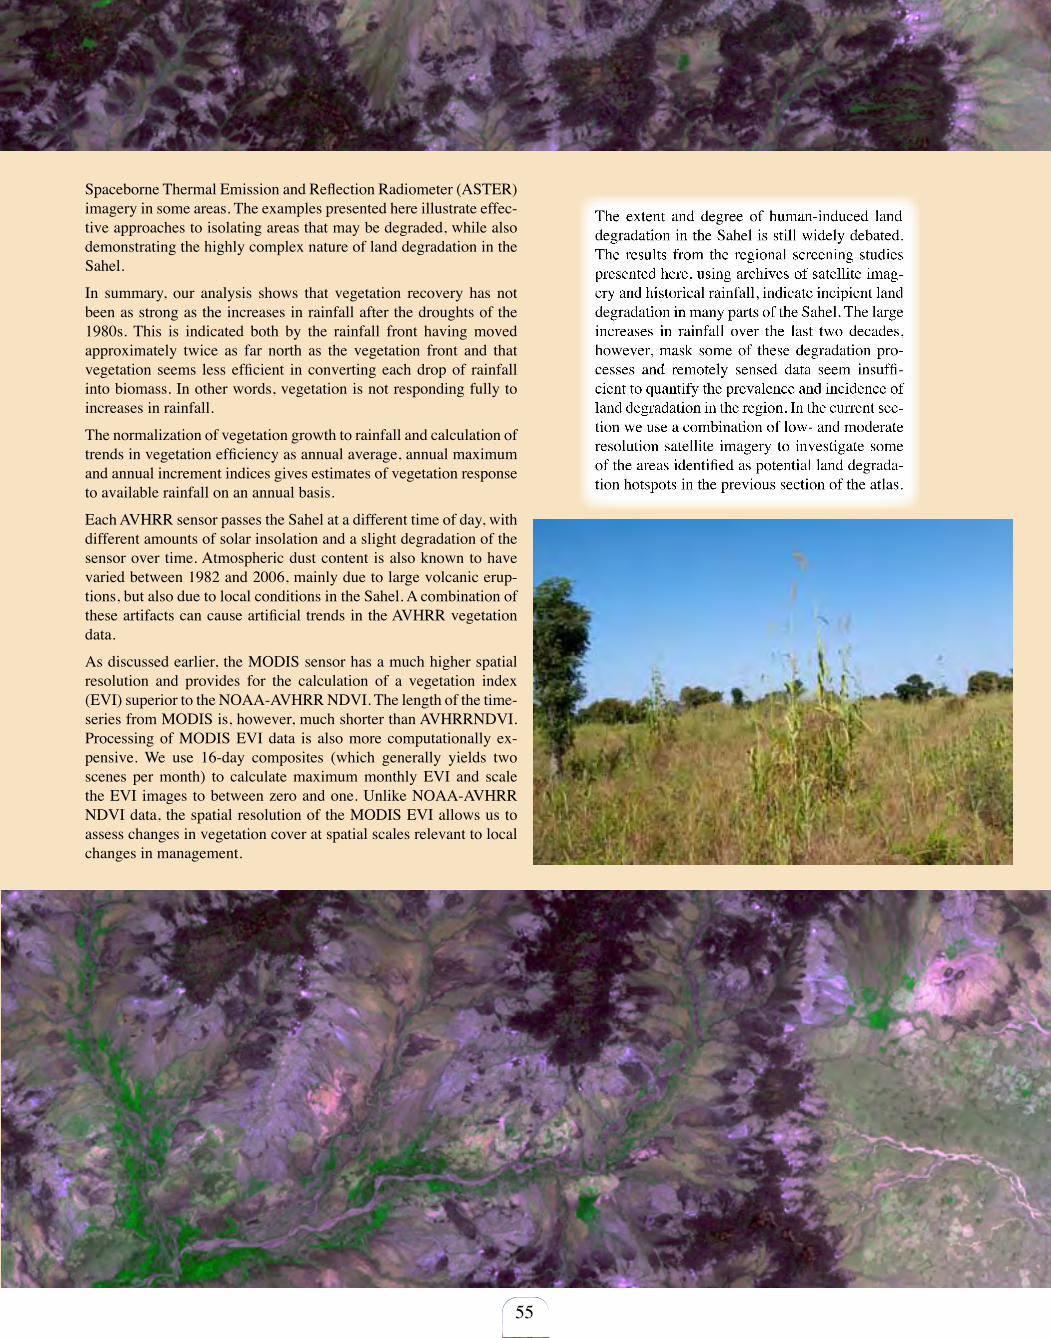
55
Spaceborne Thermal Emission and Reflection Radiometer (ASTER) imagery in some areas. The examples presented here illustrate effec-tive approaches to isolating areas that may be degraded, while also demonstrating the highly complex nature of land degradation in the Sahel.
In summary, our analysis shows that vegetation recovery has not been as strong as the increases in rainfall after the droughts of the 1980s. This is indicated both by the rainfall front having moved approximately twice as far north as the vegetation front and that vegetation seems less efficient in converting each drop of rainfall into biomass. In other words, vegetation is not responding fully to increases in rainfall.
The normalization of vegetation growth to rainfall and calculation of trends in vegetation efficiency as annual average, annual maximum and annual increment indices gives estimates of vegetation response to available rainfall on an annual basis.
Each AVHRR sensor passes the Sahel at a different time of day, with different amounts of solar insolation and a slight degradation of the sensor over time. Atmospheric dust content is also known to have varied between 1982 and 2006, mainly due to large volcanic erup-tions, but also due to local conditions in the Sahel. A combination of these artifacts can cause artificial trends in the AVHRR vegetation data.
As discussed earlier, the MODIS sensor has a much higher spatial resolution and provides for the calculation of a vegetation index (EVI) superior to the NOAA-AVHRR NDVI. The length of the time-series from MODIS is, however, much shorter than AVHRRNDVI. Processing of MODIS EVI data is also more computationally ex-pensive. We use 16-day composites (which generally yields two scenes per month) to calculate maximum monthly EVI and scale the EVI images to between zero and one. Unlike NOAA-AVHRR NDVI data, the spatial resolution of the MODIS EVI allows us to assess changes in vegetation cover at spatial scales relevant to local changes in management.
The extent and degree of human-induced land degradation in the Sahel is still widely debated. The results from the regional screening studies presented here, using archives of satellite imag-ery and historical rainfall, indicate incipient land degradation in many parts of the Sahel. The large increases in rainfall over the last two decades, however, mask some of these degradation pro-cesses and remotely sensed data seem insuffi-cient to quantify the prevalence and incidence of land degradation in the region. In the current sec-tion we use a combination of low- and moderate resolution satellite imagery to investigate some of the areas identified as potential land degrada-tion hotspots in the previous section of the atlas.
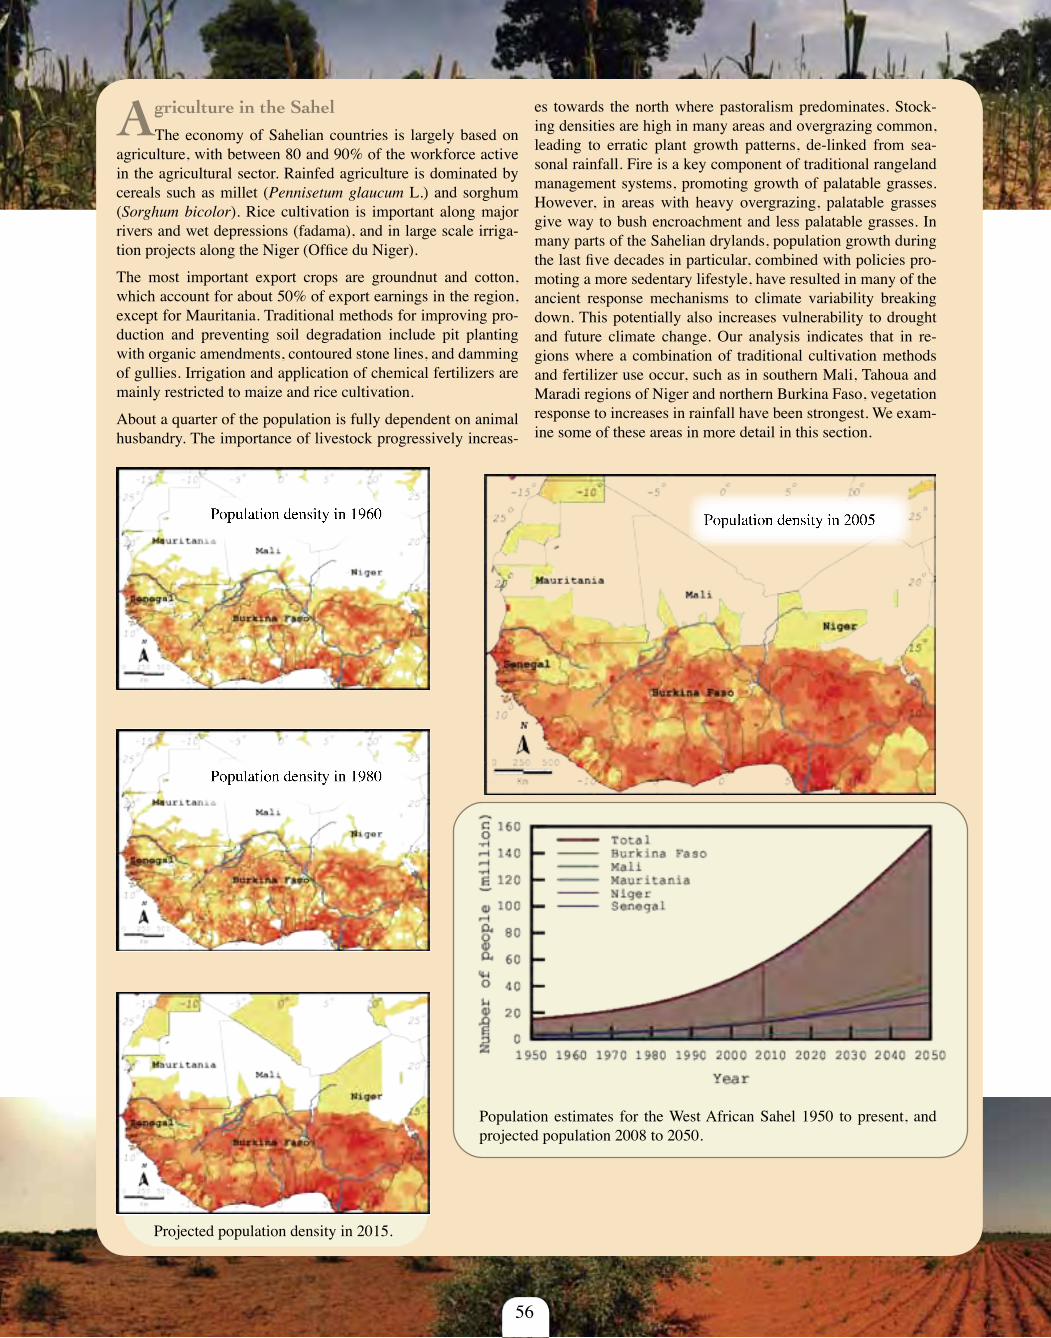
56
Agriculture in the Sahel
The economy of Sahelian countries is largely based on agriculture, with between 80 and 90% of the workforce active in the agricultural sector. Rainfed agriculture is dominated by cereals such as millet (Pennisetum glaucum L.) and sorghum (Sorghum bicolor). Rice cultivation is important along major rivers and wet depressions (fadama), and in large scale irriga-tion projects along the Niger (Office du Niger).
The most important export crops are groundnut and cotton, which account for about 50% of export earnings in the region, except for Mauritania. Traditional methods for improving pro-duction and preventing soil degradation include pit planting with organic amendments, contoured stone lines, and damming of gullies. Irrigation and application of chemical fertilizers are mainly restricted to maize and rice cultivation.
About a quarter of the population is fully dependent on animal husbandry. The importance of livestock progressively increas-
es towards the north where pastoralism predominates. Stock-ing densities are high in many areas and overgrazing common, leading to erratic plant growth patterns, de-linked from sea-sonal rainfall. Fire is a key component of traditional rangeland management systems, promoting growth of palatable grasses. However, in areas with heavy overgrazing, palatable grasses give way to bush encroachment and less palatable grasses. In many parts of the Sahelian drylands, population growth during the last five decades in particular, combined with policies pro-moting a more sedentary lifestyle, have resulted in many of the ancient response mechanisms to climate variability breaking down. This potentially also increases vulnerability to drought and future climate change. Our analysis indicates that in re-gions where a combination of traditional cultivation methods and fertilizer use occur, such as in southern Mali, Tahoua and Maradi regions of Niger and northern Burkina Faso, vegetation response to increases in rainfall have been strongest. We exam-ine some of these areas in more detail in this section.
Population density in 1960
Population density in 1980
Projected population density in 2015.
Population density in 2005
Population estimates for the West African Sahel 1950 to present, and projected population 2008 to 2050.
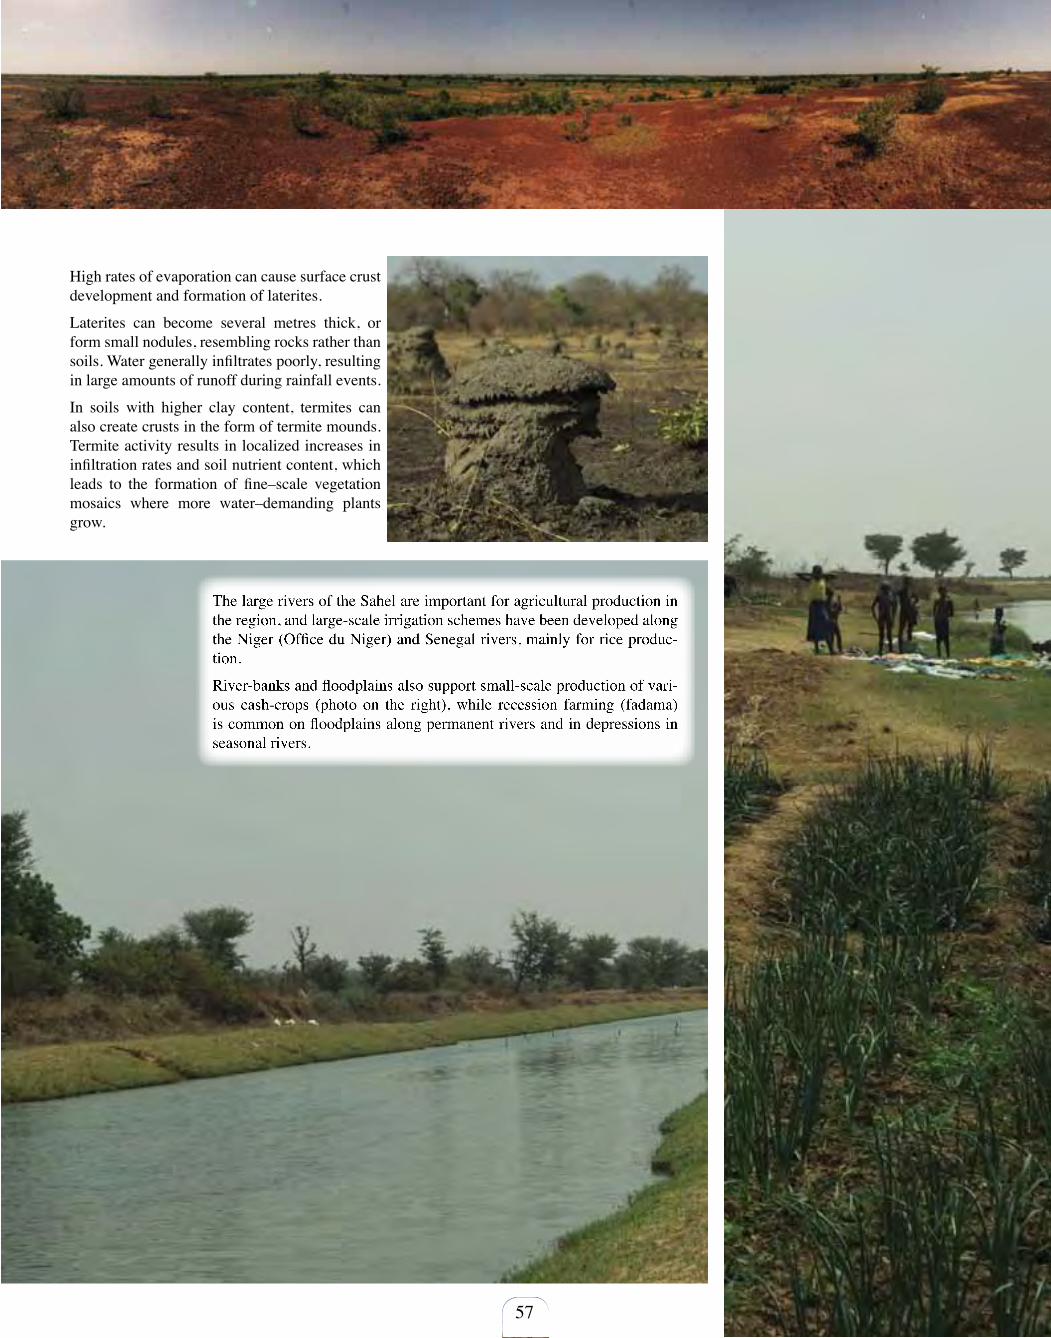
The large rivers of the Sahel are important for agricultural production in the region, and large-scale irrigation schemes have been developed along the Niger (Office du Niger) and Senegal rivers, mainly for rice produc-tion.
River-banks and floodplains also support small-scale production of vari-ous cash-crops (photo on the right), while recession farming (fadama) is common on floodplains along permanent rivers and in depressions in seasonal rivers.
57
High rates of evaporation can cause surface crust development and formation of laterites.
Laterites can become several metres thick, or form small nodules, resembling rocks rather than soils. Water generally infiltrates poorly, resulting in large amounts of runoff during rainfall events.
In soils with higher clay content, termites can also create crusts in the form of termite mounds. Termite activity results in localized increases in infiltration rates and soil nutrient content, which leads to the formation of fine–scale vegetation mosaics where more water–demanding plants grow.
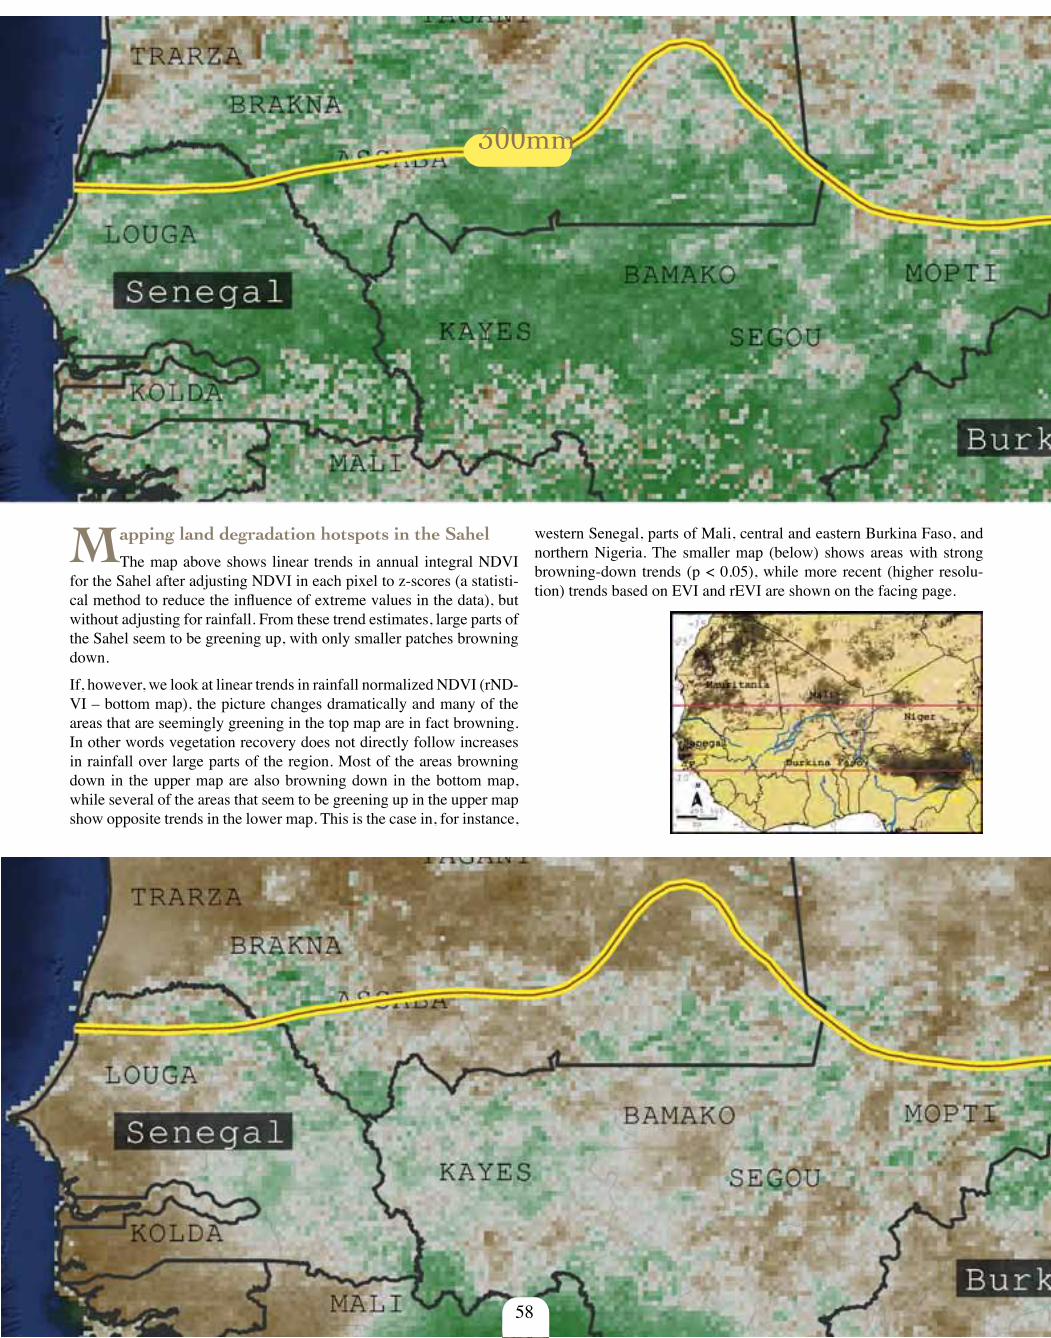
58
300mm
Mapping land degradation hotspots in the Sahel
The map above shows linear trends in annual integral NDVI for the Sahel after adjusting NDVI in each pixel to z-scores (a statisti-cal method to reduce the influence of extreme values in the data), but without adjusting for rainfall. From these trend estimates, large parts of the Sahel seem to be greening up, with only smaller patches browning down.
If, however, we look at linear trends in rainfall normalized NDVI (rND-VI – bottom map), the picture changes dramatically and many of the areas that are seemingly greening in the top map are in fact browning. In other words vegetation recovery does not directly follow increases in rainfall over large parts of the region. Most of the areas browning down in the upper map are also browning down in the bottom map, while several of the areas that seem to be greening up in the upper map show opposite trends in the lower map. This is the case in, for instance,
western Senegal, parts of Mali, central and eastern Burkina Faso, and northern Nigeria. The smaller map (below) shows areas with strong browning-down trends (p < 0.05), while more recent (higher resolu-tion) trends based on EVI and rEVI are shown on the facing page.
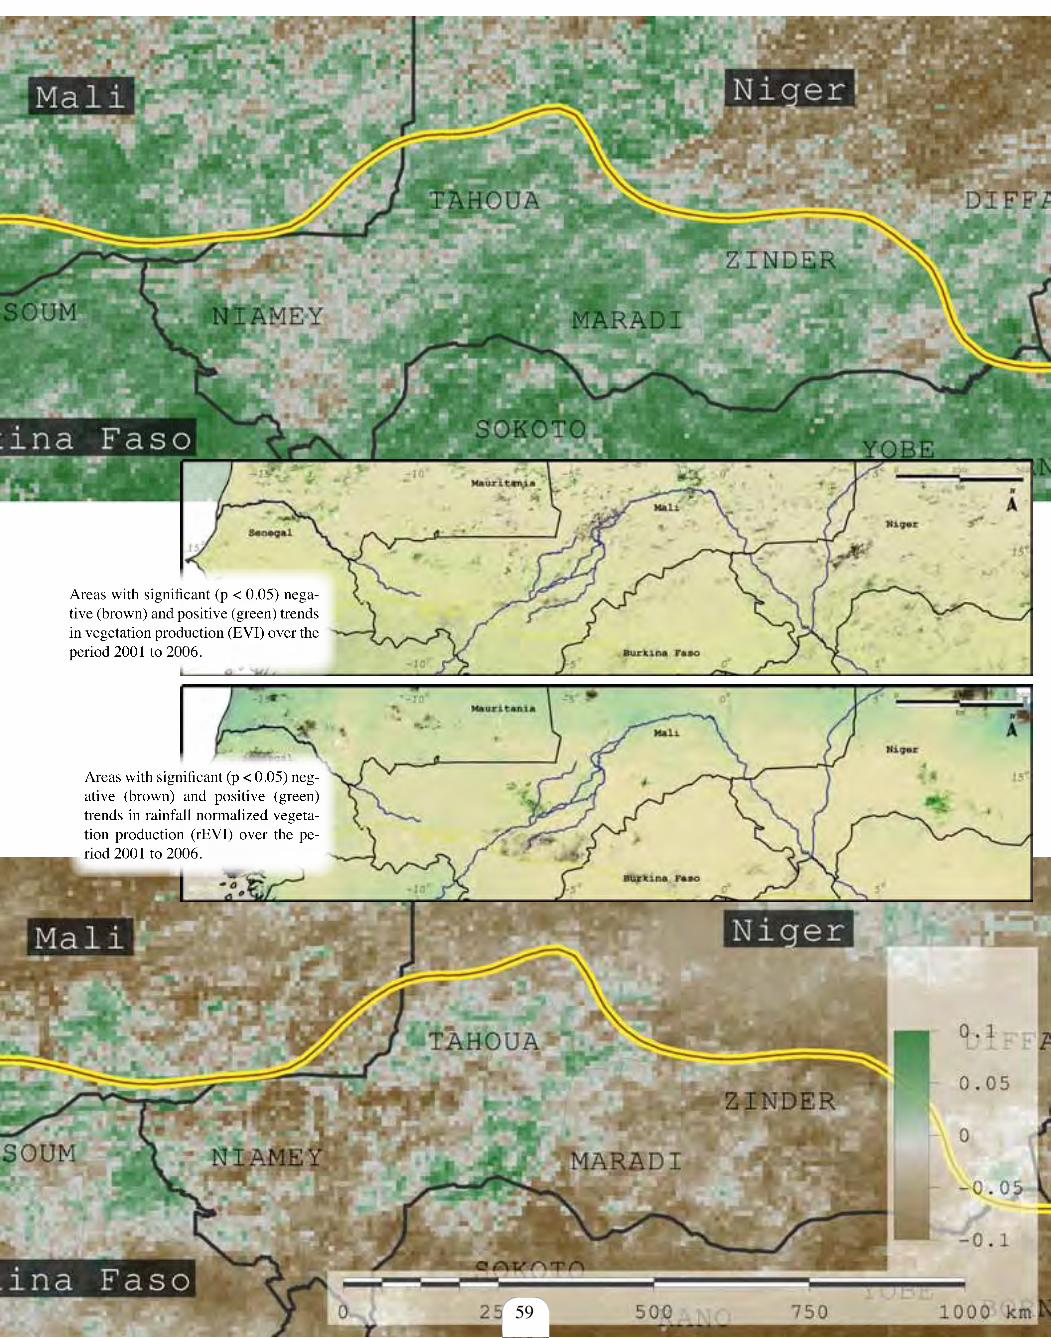
59
Areas with significant (p < 0.05) nega-tive (brown) and positive (green) trends in vegetation production (EVI) over the period 2001 to 2006.
Areas with significant (p < 0.05) neg-ative (brown) and positive (green) trends in rainfall normalized vegeta-tion production (rEVI) over the pe-riod 2001 to 2006.
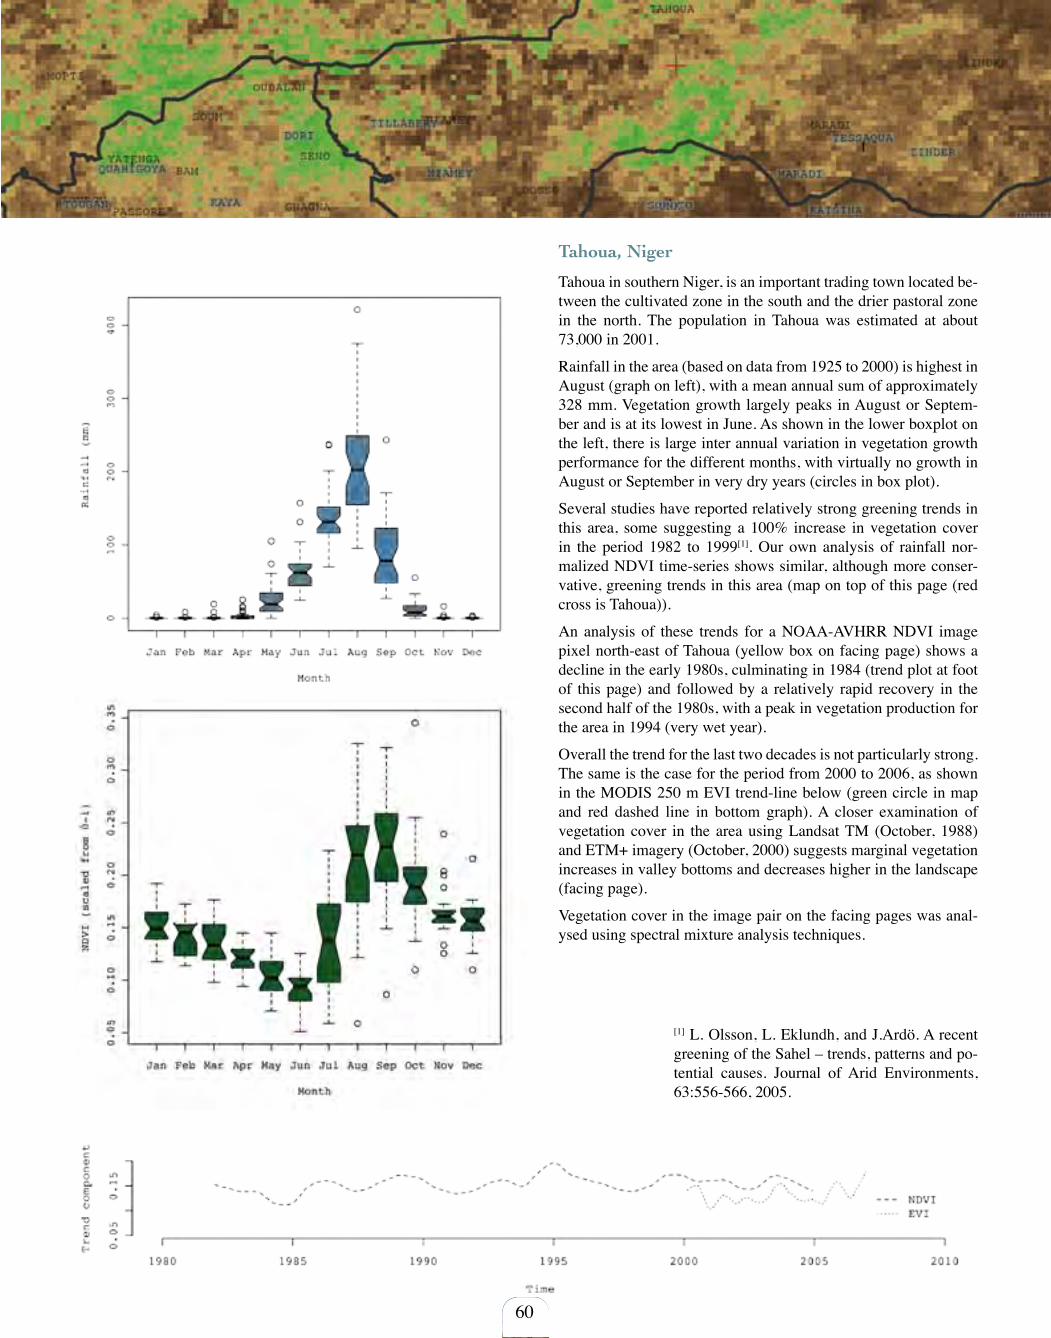
Tahoua, Niger
Tahoua in southern Niger, is an important trading town located be-tween the cultivated zone in the south and the drier pastoral zone in the north. The population in Tahoua was estimated at about 73,000 in 2001.
Rainfall in the area (based on data from 1925 to 2000) is highest in August (graph on left), with a mean annual sum of approximately 328 mm. Vegetation growth largely peaks in August or Septem-ber and is at its lowest in June. As shown in the lower boxplot on the left, there is large inter annual variation in vegetation growth performance for the different months, with virtually no growth in August or September in very dry years (circles in box plot).
Several studies have reported relatively strong greening trends in this area, some suggesting a 100% increase in vegetation cover in the period 1982 to 1999[1]. Our own analysis of rainfall nor-malized NDVI time-series shows similar, although more conser-vative, greening trends in this area (map on top of this page (red cross is Tahoua)).
An analysis of these trends for a NOAA-AVHRR NDVI image pixel north-east of Tahoua (yellow box on facing page) shows a decline in the early 1980s, culminating in 1984 (trend plot at foot of this page) and followed by a relatively rapid recovery in the second half of the 1980s, with a peak in vegetation production for the area in 1994 (very wet year).
Overall the trend for the last two decades is not particularly strong. The same is the case for the period from 2000 to 2006, as shown in the MODIS 250 m EVI trend-line below (green circle in map and red dashed line in bottom graph). A closer examination of vegetation cover in the area using Landsat TM (October, 1988) and ETM+ imagery (October, 2000) suggests marginal vegetation increases in valley bottoms and decreases higher in the landscape (facing page).
Vegetation cover in the image pair on the facing pages was anal-ysed using spectral mixture analysis techniques.
[1] L. Olsson, L. Eklundh, and J.Ardö. A recent greening of the Sahel – trends, patterns and po-tential causes. Journal of Arid Environments, 63:556-566, 2005.
60
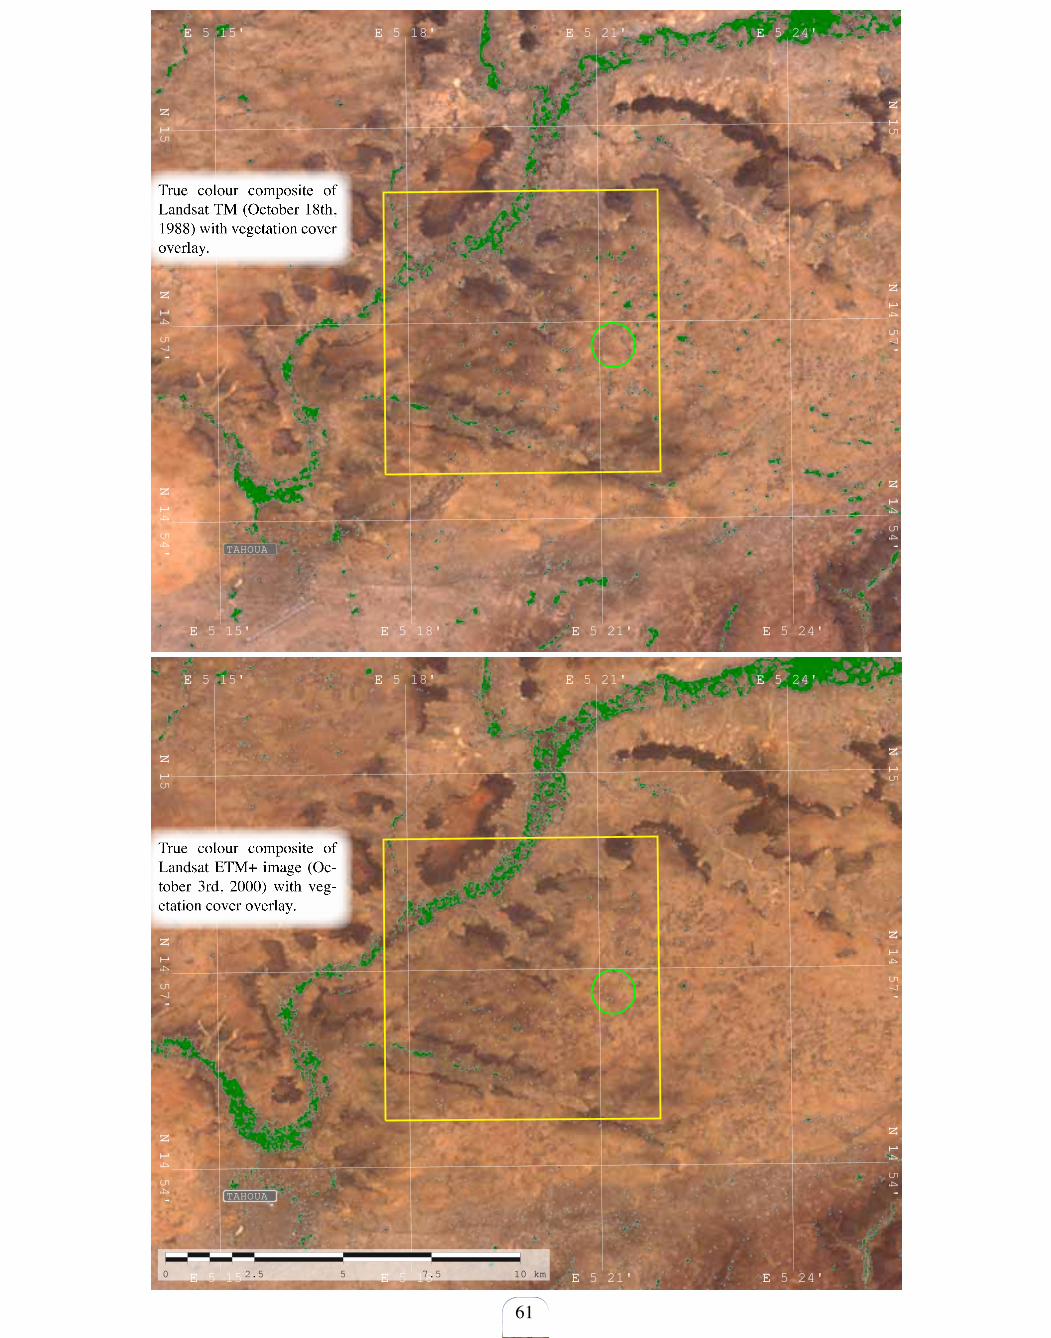
TAHOUA
N 1
N 14 54'
N 1
N 14 57'
N 1
N 15
E E 5 15' E E 5 18' E E 5 21' E E 5 24'
N 1
N 14 54'
N 1
N 14 57'
N 1
N 15
E E 5 15' E E 5 18' E E 5 21' E E 5 24'
TAHOUA
N 1
N 14 54'
N 1
N 14 57'
N 1
N 15
E E 5 15' E E 5 18' E E 5 21' E E 5 24'
N 1
N 14 54'
N 1
N 14 57'
N 1
N 15
E E 5 15' E E 5 18' E E 5 21' E E 5 24'
0 2.5 5 7.5 10 km
61
True colour composite of Landsat TM (October 18th, 1988) with vegetation cover overlay.
True colour composite of Landsat ETM+ image (Oc-tober 3rd, 2000) with veg-etation cover overlay.
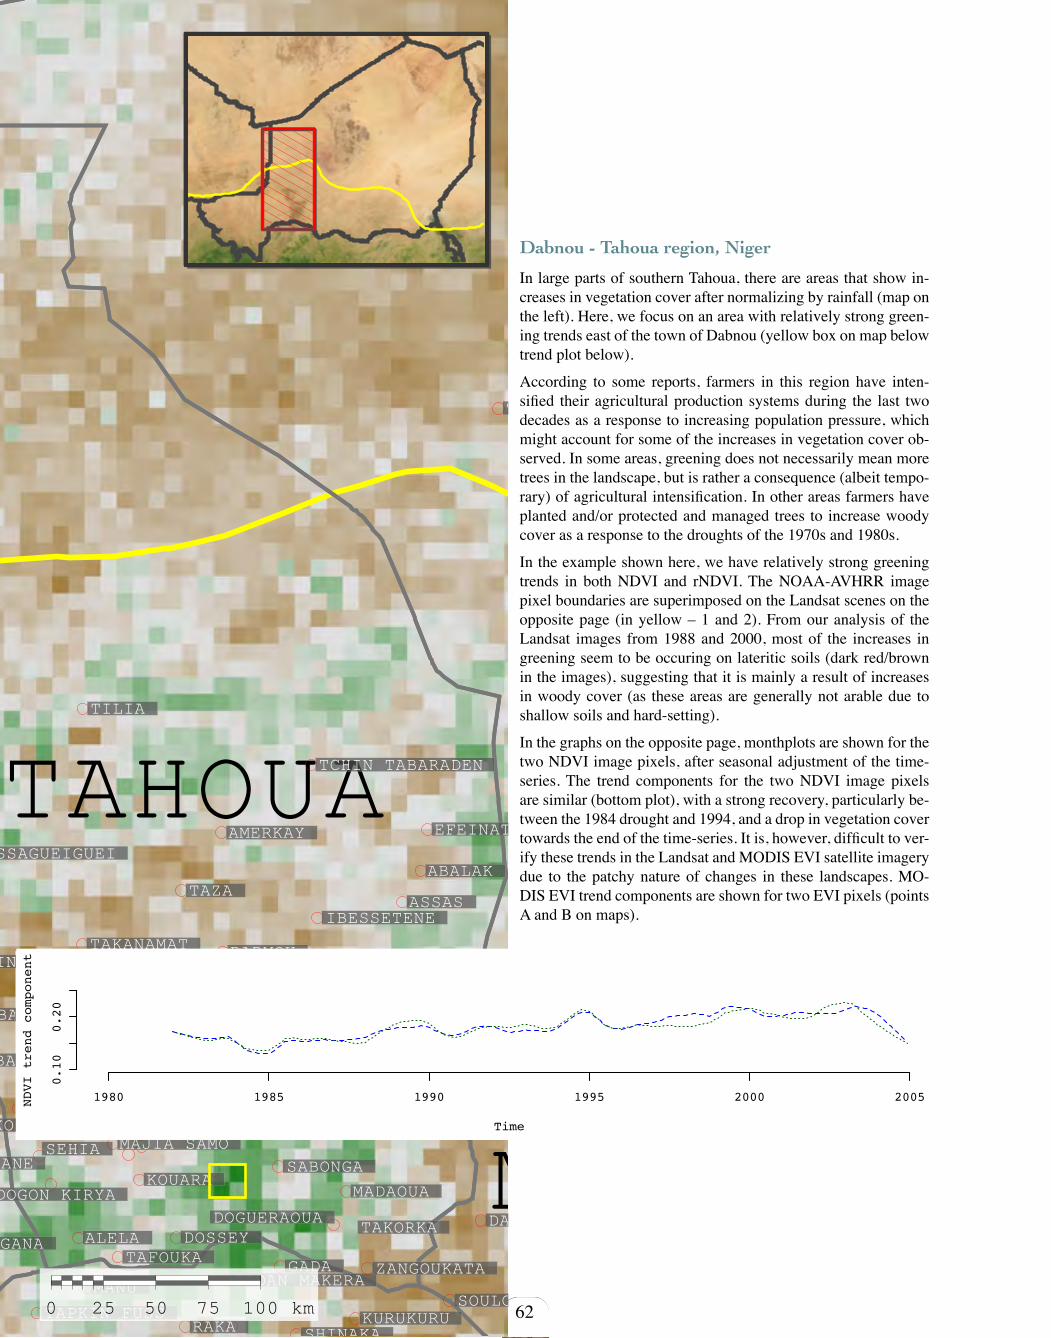
62
TAHOUA
MARADIALELA
IN SAFARI TAHOUA
SANAM
DOSSEY
SEHIA
KURUKURU
TOUGANA
TABOTAKIATARABABAGAROUA
IN TIGAR TEBARAM
MAY FARIN KAY EDIR
SABONGASOUKOUKOUTANE
KEITAMOZA
ABALAK
SHINAKA
TAFOUKA
RAKA
GIDAN MAKERA
DAN GOULBI
MANUSOULOULOUBONIZAMBO
TAPKIN FUSS
TAKORKA
DOGON KIRYA
SABARA
DOUBELMA
BADEGUICHERI
KARKAMAT
MADAOUA
DEOULE
TILIA
TCHIN TABARADEN
EFEINATASASSAGUEIGUEIDIGUE DIGA
TAZAASSAS
IBESSETENE
AMERKAY
MERIZABARMOUTAKANAMAT
ABAREY IN LELOU IN AOUARA
KOUARA
GADA
MAKOURDI
DOGUERAOUA
KOARA ABDOU RWAFI MAYNAAI ILLELA
MAULELA
DJINGINES
ZANGOUKATA
MAJIA SAMO
TEGGUIADA IN TESSOUM
0 25 50 75 100 km
Dabnou - Tahoua region, Niger
In large parts of southern Tahoua, there are areas that show in-creases in vegetation cover after normalizing by rainfall (map on the left). Here, we focus on an area with relatively strong green-ing trends east of the town of Dabnou (yellow box on map below trend plot below).
According to some reports, farmers in this region have inten-sified their agricultural production systems during the last two decades as a response to increasing population pressure, which might account for some of the increases in vegetation cover ob-served. In some areas, greening does not necessarily mean more trees in the landscape, but is rather a consequence (albeit tempo-rary) of agricultural intensification. In other areas farmers have planted and/or protected and managed trees to increase woody cover as a response to the droughts of the 1970s and 1980s.
In the example shown here, we have relatively strong greening trends in both NDVI and rNDVI. The NOAA-AVHRR image pixel boundaries are superimposed on the Landsat scenes on the opposite page (in yellow – 1 and 2). From our analysis of the Landsat images from 1988 and 2000, most of the increases in greening seem to be occuring on lateritic soils (dark red/brown in the images), suggesting that it is mainly a result of increases in woody cover (as these areas are generally not arable due to shallow soils and hard-setting).
In the graphs on the opposite page, monthplots are shown for the two NDVI image pixels, after seasonal adjustment of the time-series. The trend components for the two NDVI image pixels are similar (bottom plot), with a strong recovery, particularly be-tween the 1984 drought and 1994, and a drop in vegetation cover towards the end of the time-series. It is, however, difficult to ver-ify these trends in the Landsat and MODIS EVI satellite imagery due to the patchy nature of changes in these landscapes. MO-DIS EVI trend components are shown for two EVI pixels (points A and B on maps).
Time
NDVI
tre
nd c
ompo
nent
1980 1985 1990 1995 2000 2005
0.10
0.20
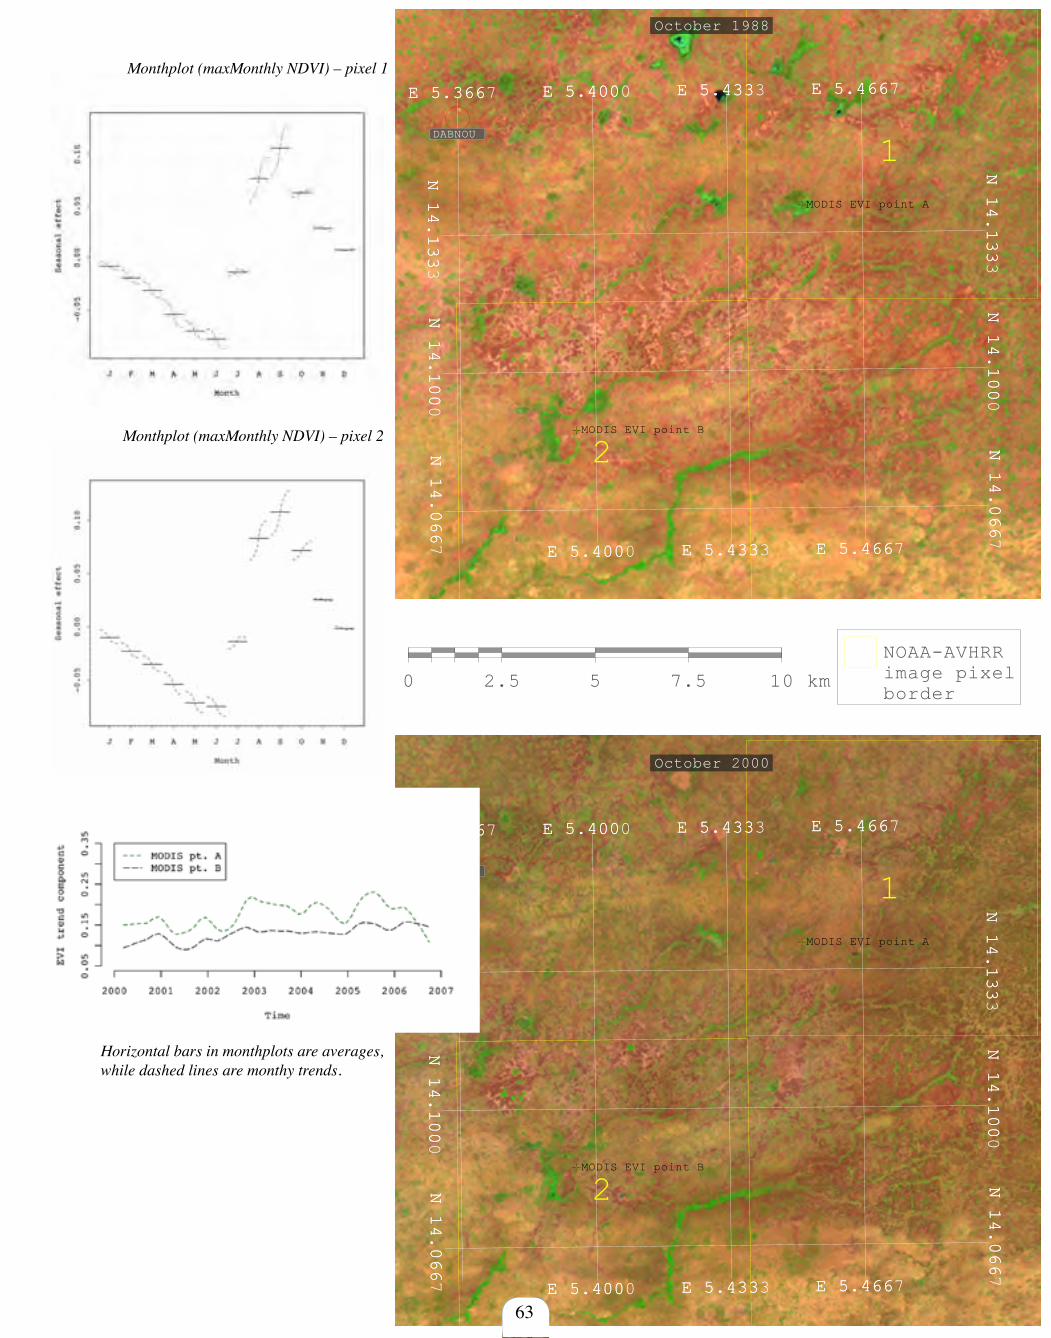
N14.066
N14.0667
N14.100
N14.1000
N14.133
N14.1333
E 5.400E 5.4000 E 5.433E 5.4333 E 5.466E 5.4667
N14.066
N14.0667
N14.100
N14.1000
N14.133
N14.1333
E 5.366E 5.3667 E 5.400E 5.4000 E 5.433E 5.4333 E 5.466E 5.4667
1
2
DABNOU
MODIS EVI point A
MODIS EVI point B
N14.066
N14.0667
N14.100
N14.1000
N14.133
N14.1333
E 5.400E 5.4000 E 5.433E 5.4333 E 5.466E 5.4667
N14.066
N14.0667
N14.100
N14.1000
N14.133
N14.1333
E 5.366E 5.3667 E 5.400E 5.4000 E 5.433E 5.4333 E 5.466E 5.4667
1
2
DABNOU
MODIS EVI point A
MODIS EVI point B
October 1988
0 2.5 5 7.5 10 km
NOAA-AVHRRimage pixelborder
October 2000
63
Monthplot (maxMonthly NDVI) – pixel 1
Monthplot (maxMonthly NDVI) – pixel 2
Horizontal bars in monthplots are averages, while dashed lines are monthy trends.
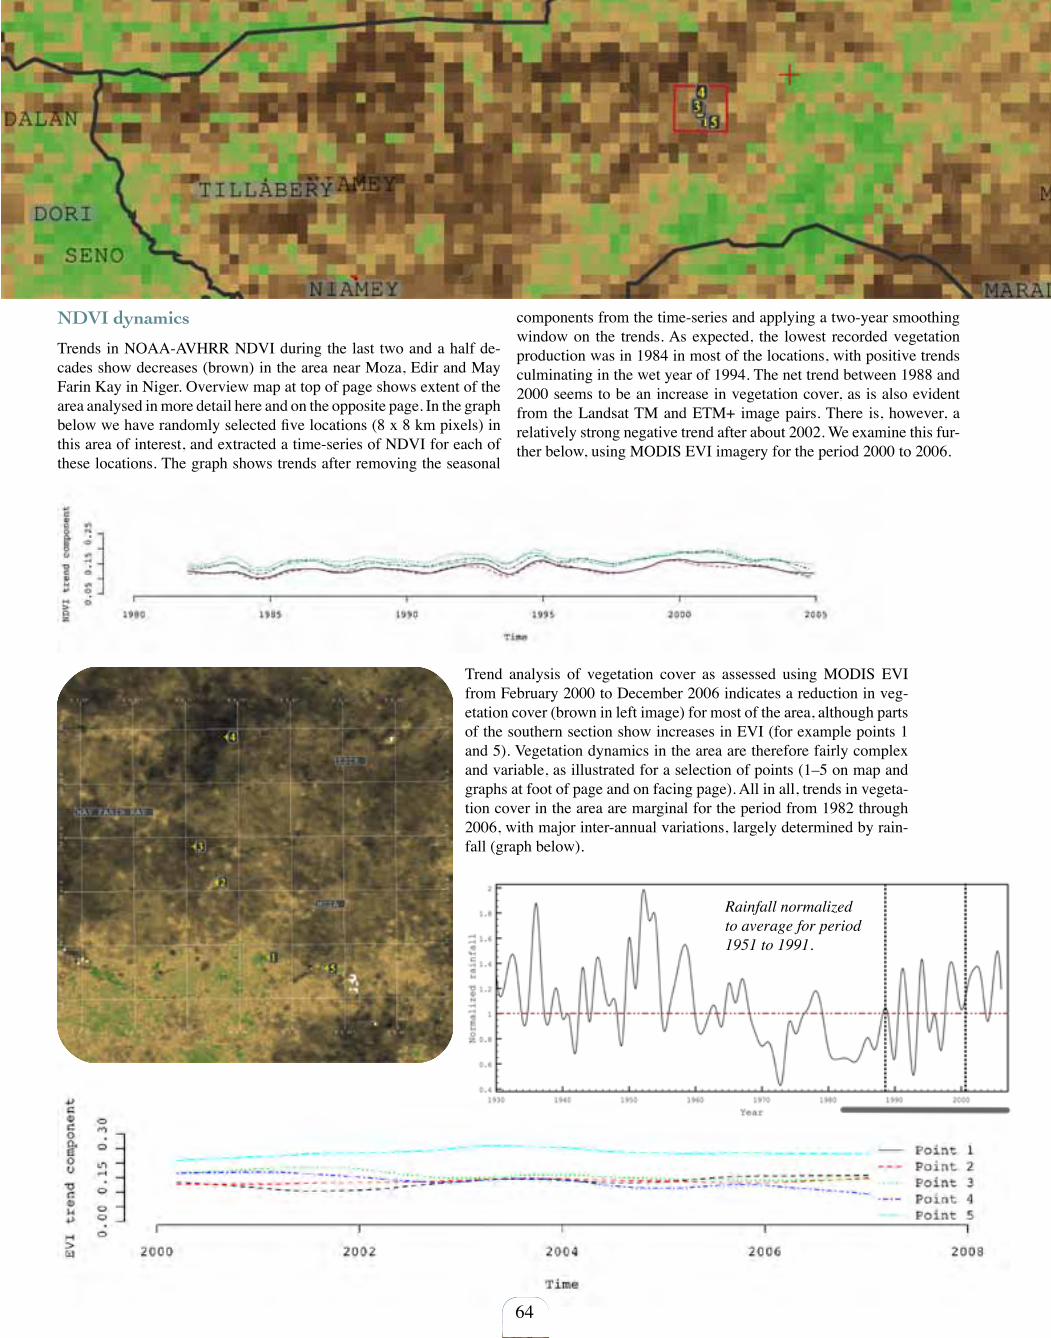
NDVI dynamics
Trends in NOAA-AVHRR NDVI during the last two and a half de-cades show decreases (brown) in the area near Moza, Edir and May Farin Kay in Niger. Overview map at top of page shows extent of the area analysed in more detail here and on the opposite page. In the graph below we have randomly selected five locations (8 x 8 km pixels) in this area of interest, and extracted a time-series of NDVI for each of these locations. The graph shows trends after removing the seasonal
components from the time-series and applying a two-year smoothing window on the trends. As expected, the lowest recorded vegetation production was in 1984 in most of the locations, with positive trends culminating in the wet year of 1994. The net trend between 1988 and 2000 seems to be an increase in vegetation cover, as is also evident from the Landsat TM and ETM+ image pairs. There is, however, a relatively strong negative trend after about 2002. We examine this fur-ther below, using MODIS EVI imagery for the period 2000 to 2006.
Trend analysis of vegetation cover as assessed using MODIS EVI from February 2000 to December 2006 indicates a reduction in veg-etation cover (brown in left image) for most of the area, although parts of the southern section show increases in EVI (for example points 1 and 5). Vegetation dynamics in the area are therefore fairly complex and variable, as illustrated for a selection of points (1–5 on map and graphs at foot of page and on facing page). All in all, trends in vegeta-tion cover in the area are marginal for the period from 1982 through 2006, with major inter-annual variations, largely determined by rain-fall (graph below).
Rainfall normalized to average for period 1951 to 1991.
64

114 36'
114 39'
114 42'
114 45'
114 48'
114 51'
4 30' 4 33' 4 36' 4 39' 4 42' 4 45' 4 48'
114 36'
114 39'
114 42'
114 45'
114 48'
114 51'
4 30' 4 33' 4 36' 4 39' 4 42' 4 45' 4 48'
MAY FARIN KAY
EDIR
MOZA
114 36'
114 39'
114 42'
114 45'
114 48'
114 51'
4 30' 4 33' 4 36' 4 39' 4 42' 4 45' 4 48'
114 36'
114 39'
114 42'
114 45'
114 48'
114 51'
4 30' 4 33' 4 36' 4 39' 4 42' 4 45' 4 48'
MAY FARIN KAY
EDIR
MOZA
0 2500 5000 7500 10000 m
65
The Landsat TM and ETM+ image pair shown on the right are true-colour composites produced after correcting the images for atmospheric disturbances. The green ar-eas overlain are areas having dense (mainly woody) vegeta-tion cover. The area has very low vegetation cover densi-ties. Cultivated fields (light brown to beige in image) can be clearly seen, and are more widespread in the early (1988 – top) image than in the lower image, which was acquired in 2000.
The Landsat scenes clearly il-lustrate the patchy nature of vegetaton in drylands, with changes occuring on a very local scale. Annual rainfall was lower in 1988 than in 2000, which may account for some of the apparent in-creases in vegetation cover in 2000. Some areas, however, clearly have more woody cov-er (point 3). The same area (point 3) shows a decline in MODIS recorded vegeta-tion cover between October 2001 and October 2006, as shown in the bottom graph on the facing page.
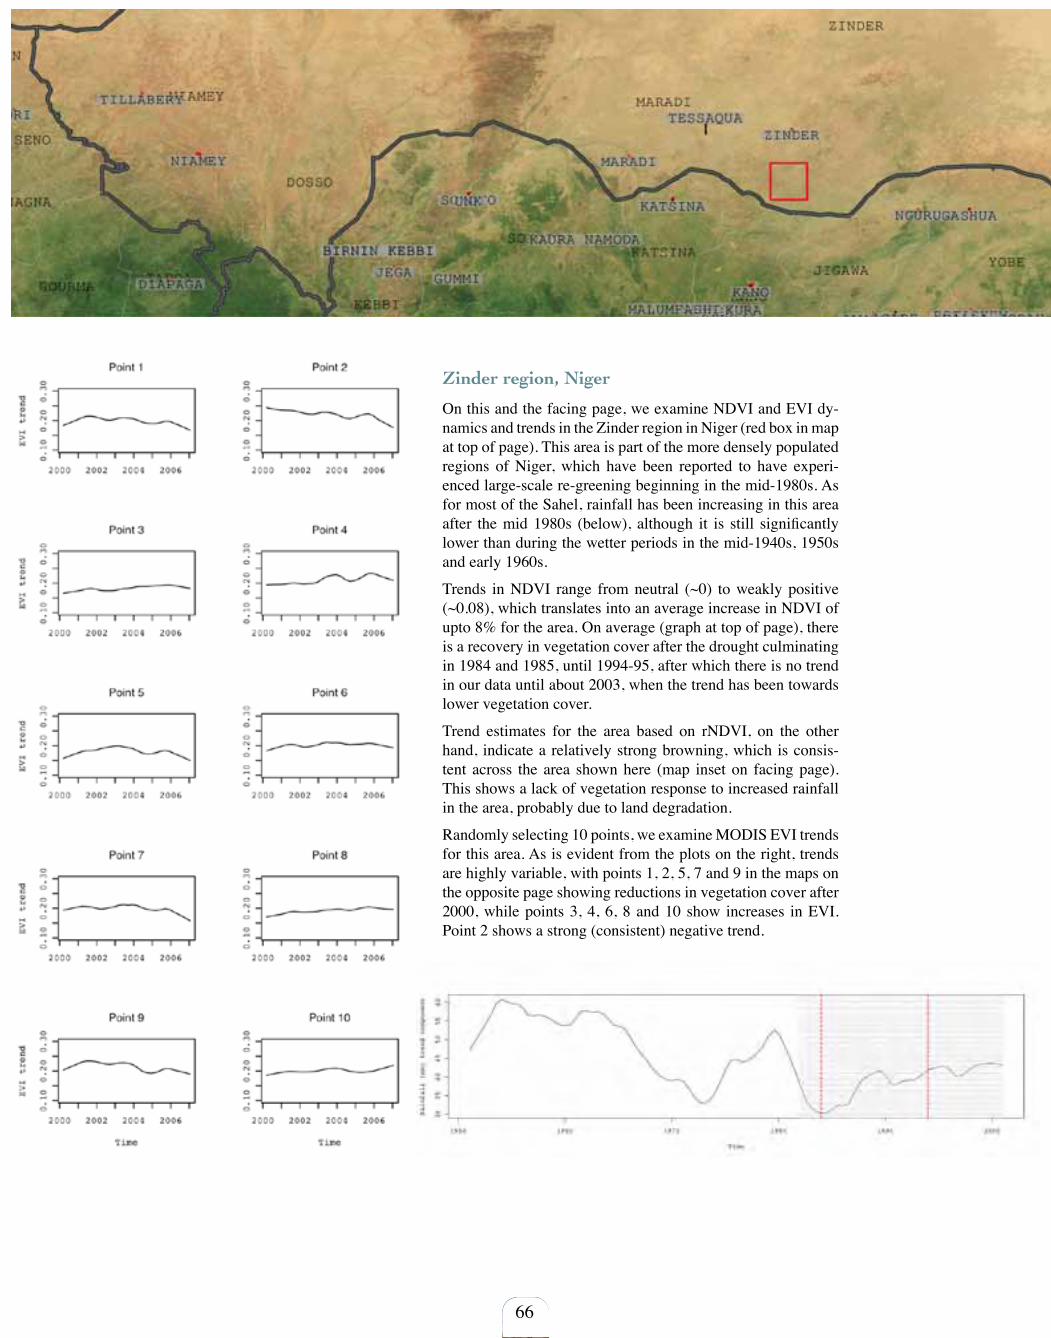
113 3'
113 6'
113 9'
113 12'
113 15'
113 18'
113 21'
8 45' 8 48' 8 51' 8 54' 8 57' 9 9 3' 9 6'
113 3'
113 6'
113 9'
113 12'
113 15'
113 18'
113 21'
8 45' 8 48' 8 51' 8 54' 8 57' 9 9 3' 9 6'
GOCHOLO
MAGARIA
113 3'
113 6'
113 9'
113 12'
113 15'
113 18'
113 21'
8 45' 8 48' 8 51' 8 54' 8 57' 9 9 3' 9 6'
113 3'
113 6'
113 9'
113 12'
113 15'
113 18'
113 21'
8 45' 8 48' 8 51' 8 54' 8 57' 9 9 3' 9 6'
GOCHOLO
MAGARIA
66
Zinder region, Niger
On this and the facing page, we examine NDVI and EVI dy-namics and trends in the Zinder region in Niger (red box in map at top of page). This area is part of the more densely populated regions of Niger, which have been reported to have experi-enced large-scale re-greening beginning in the mid-1980s. As for most of the Sahel, rainfall has been increasing in this area after the mid 1980s (below), although it is still significantly lower than during the wetter periods in the mid-1940s, 1950s and early 1960s.
Trends in NDVI range from neutral (~0) to weakly positive (~0.08), which translates into an average increase in NDVI of upto 8% for the area. On average (graph at top of page), there is a recovery in vegetation cover after the drought culminating in 1984 and 1985, until 1994-95, after which there is no trend in our data until about 2003, when the trend has been towards lower vegetation cover.
Trend estimates for the area based on rNDVI, on the other hand, indicate a relatively strong browning, which is consis-tent across the area shown here (map inset on facing page). This shows a lack of vegetation response to increased rainfall in the area, probably due to land degradation.
Randomly selecting 10 points, we examine MODIS EVI trends for this area. As is evident from the plots on the right, trends are highly variable, with points 1, 2, 5, 7 and 9 in the maps on the opposite page showing reductions in vegetation cover after 2000, while points 3, 4, 6, 8 and 10 show increases in EVI. Point 2 shows a strong (consistent) negative trend.
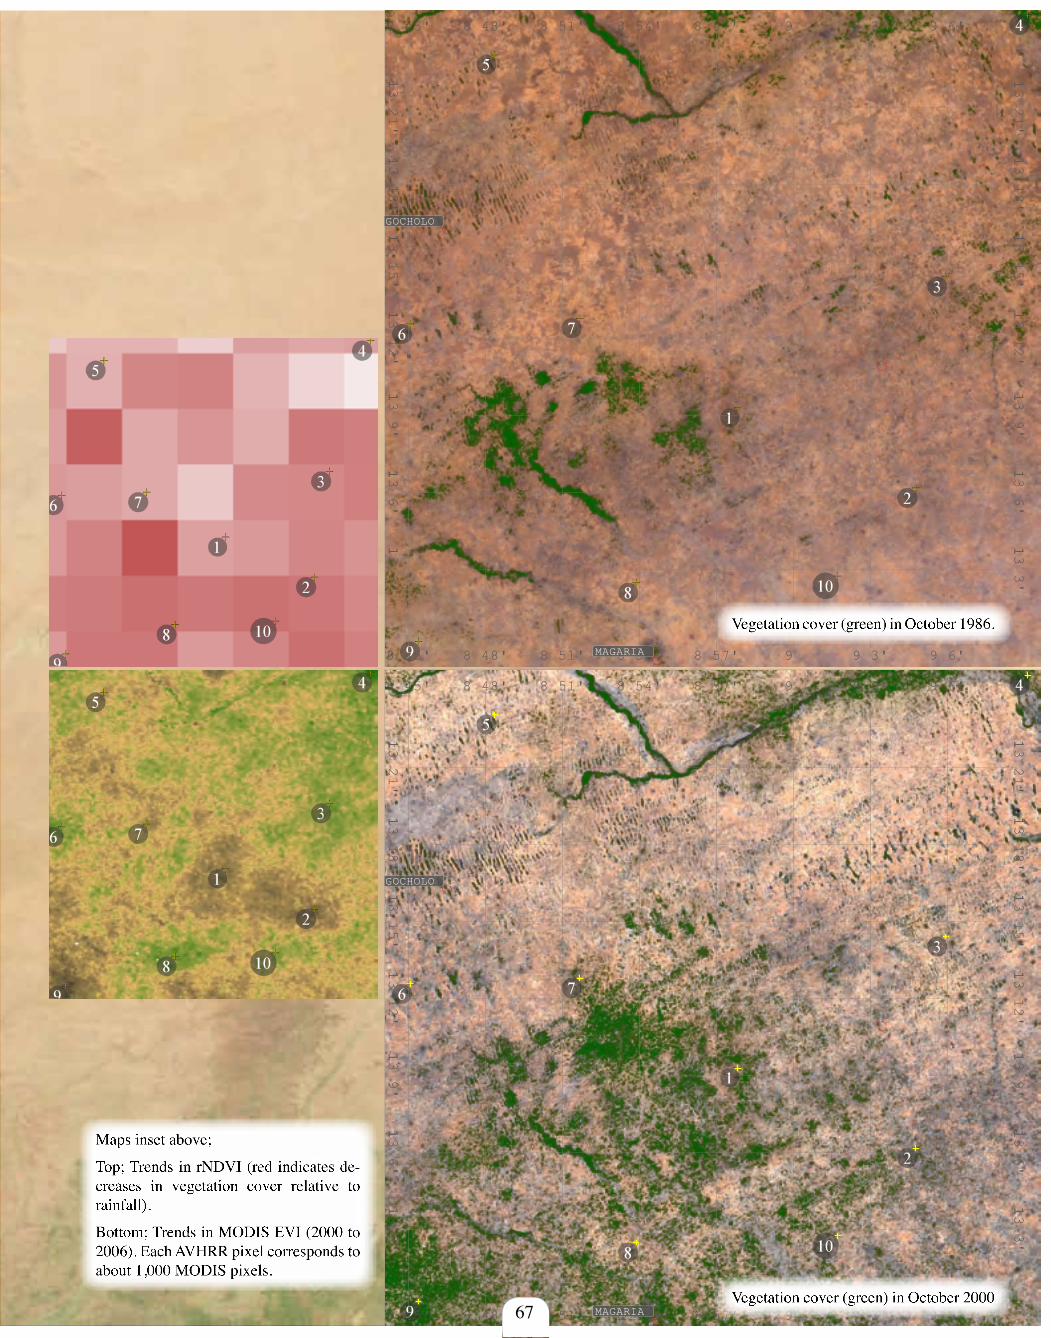
113 3'
113 6'
113 9'
113 12'
113 15'
113 18'
113 21'
8 45' 8 48' 8 51' 8 54' 8 57' 9 9 3' 9 6'
113 3'
113 6'
113 9'
113 12'
113 15'
113 18'
113 21'
8 45' 8 48' 8 51' 8 54' 8 57' 9 9 3' 9 6'
GOCHOLO
MAGARIA
113 3'
113 6'
113 9'
113 12'
113 15'
113 18'
113 21'
8 45' 8 48' 8 51' 8 54' 8 57' 9 9 3' 9 6'
113 3'
113 6'
113 9'
113 12'
113 15'
113 18'
113 21'
8 45' 8 48' 8 51' 8 54' 8 57' 9 9 3' 9 6'
GOCHOLO
MAGARIA
67
Vegetation cover (green) in October 1986.
Vegetation cover (green) in October 2000
Maps inset above;
Top; Trends in rNDVI (red indicates de-creases in vegetation cover relative to rainfall).
Bottom; Trends in MODIS EVI (2000 to 2006). Each AVHRR pixel corresponds to about 1,000 MODIS pixels.
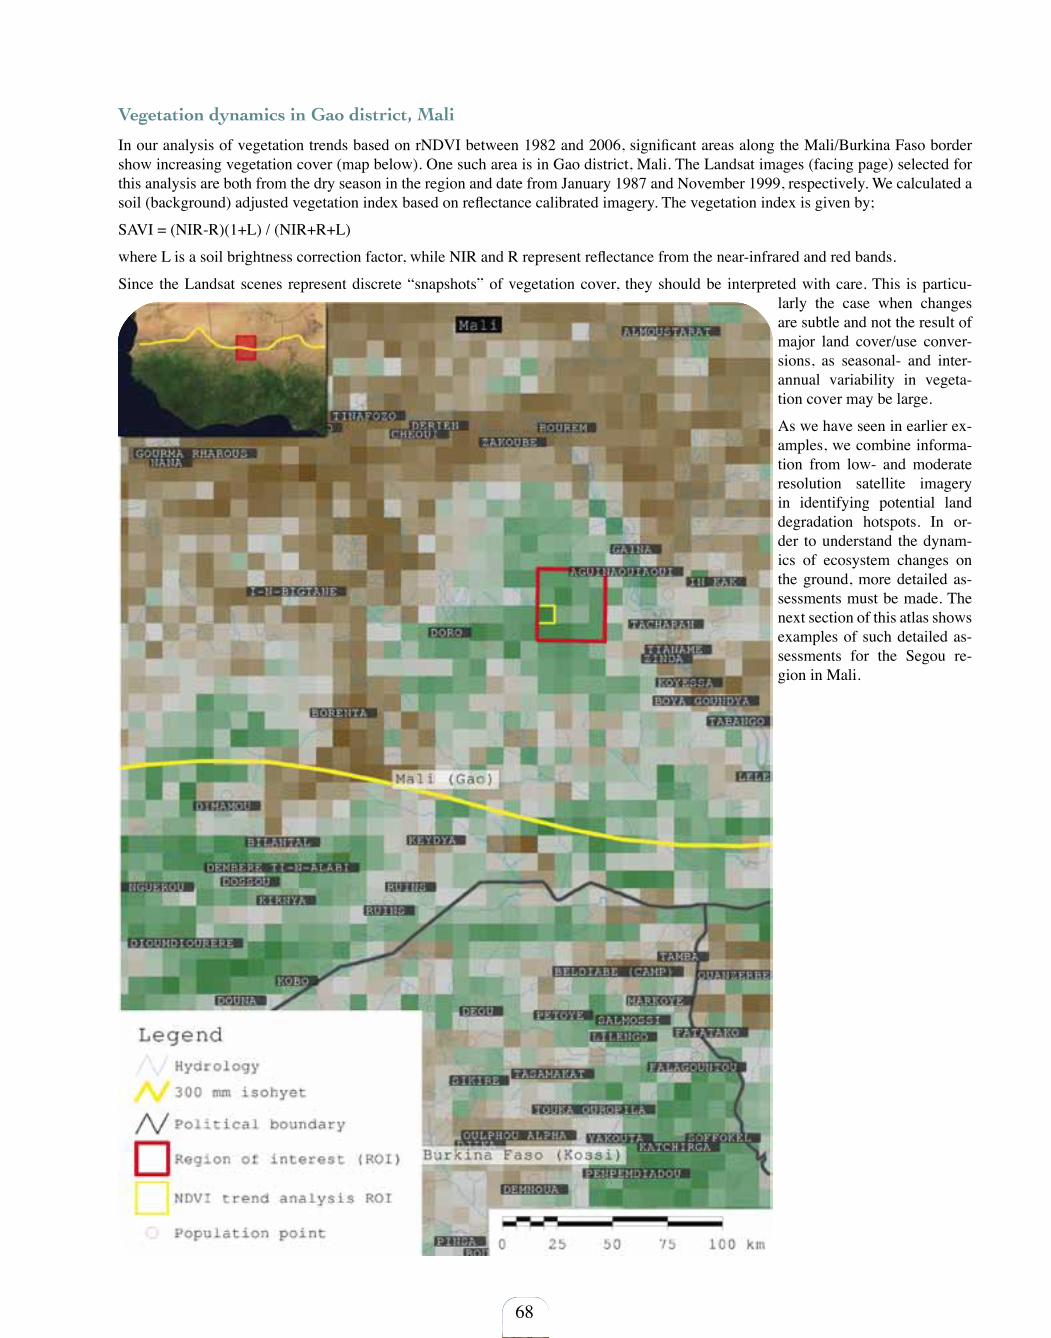
68
Vegetation dynamics in Gao district, Mali
In our analysis of vegetation trends based on rNDVI between 1982 and 2006, significant areas along the Mali/Burkina Faso border show increasing vegetation cover (map below). One such area is in Gao district, Mali. The Landsat images (facing page) selected for this analysis are both from the dry season in the region and date from January 1987 and November 1999, respectively. We calculated a soil (background) adjusted vegetation index based on reflectance calibrated imagery. The vegetation index is given by;
SAVI = (NIR-R)(1+L) / (NIR+R+L)
where L is a soil brightness correction factor, while NIR and R represent reflectance from the near-infrared and red bands.
Since the Landsat scenes represent discrete “snapshots” of vegetation cover, they should be interpreted with care. This is particu-larly the case when changes are subtle and not the result of major land cover/use conver-sions, as seasonal- and inter-annual variability in vegeta-tion cover may be large.
As we have seen in earlier ex-amples, we combine informa-tion from low- and moderate resolution satellite imagery in identifying potential land degradation hotspots. In or-der to understand the dynam-ics of ecosystem changes on the ground, more detailed as-sessments must be made. The next section of this atlas shows examples of such detailed as-sessments for the Segou re-gion in Mali.
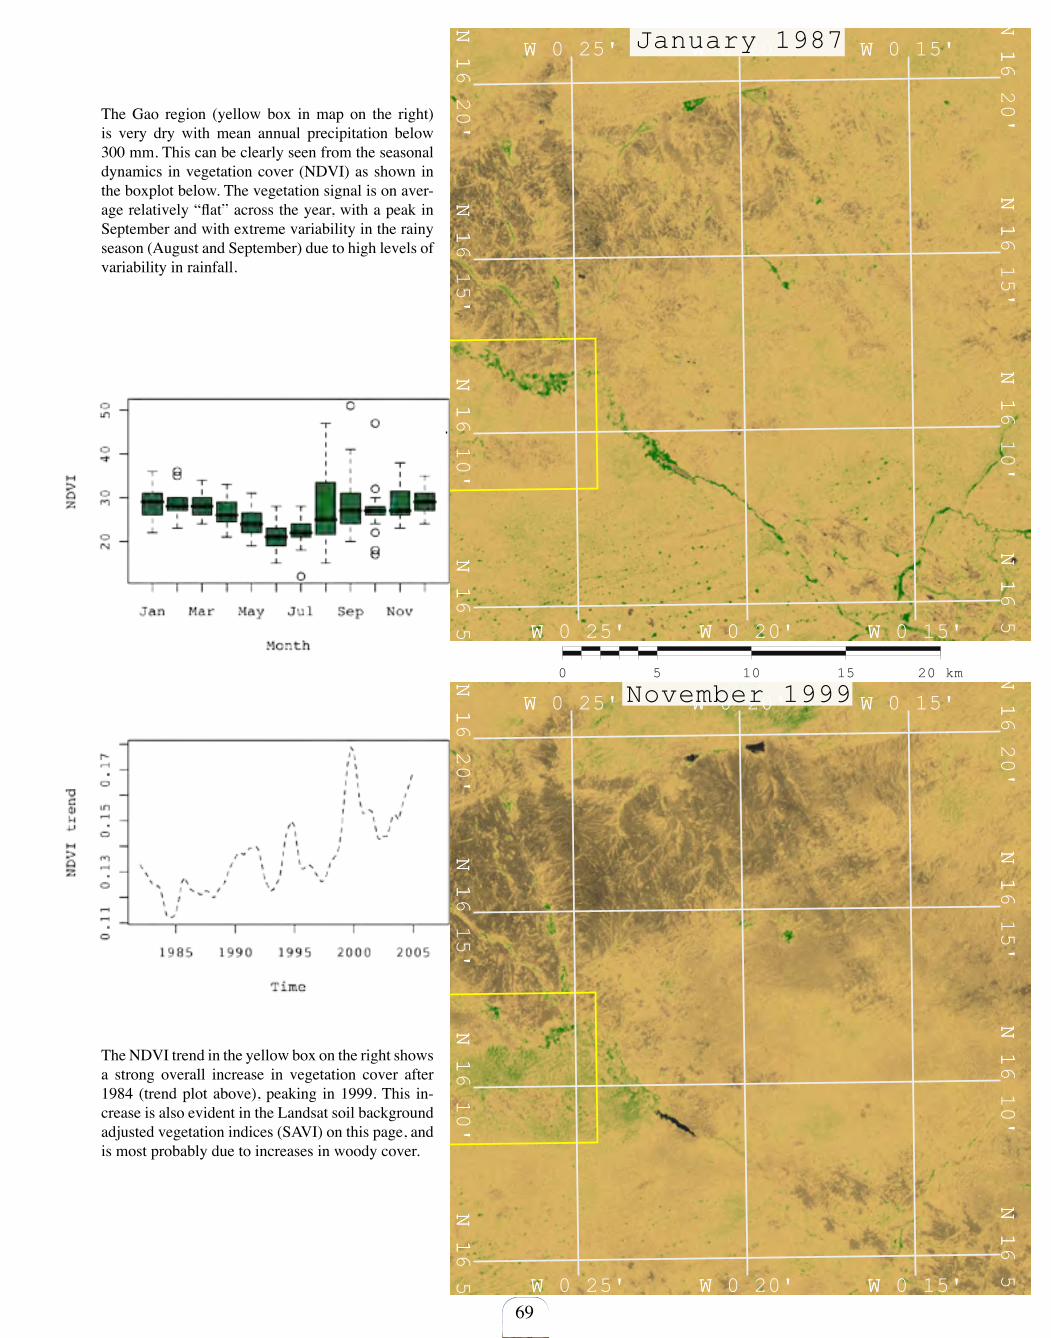
N1
N16 5'
N1
N16 10'
N1
N16 15'
N1
N16 20'
WW 0 25' WW 0 20' WW 0 15'
N1
N16 5'
N1
N16 10'
N1
N16 15'
N1
N16 20'
WW 0 25' WW 0 20' WW 0 15'
N1
N16 5'
N1
N16 10'
N1
N16 15'
N1
N16 20'
WW 0 25' WW 0 20' WW 0 15'
N1
N16 5'
N1
N16 10'
N1
N16 15'
N1
N16 20'
WW 0 25' WW 0 20' WW 0 15'
0 5 10 15 20 km
January 1987
November 1999
69
The Gao region (yellow box in map on the right) is very dry with mean annual precipitation below 300 mm. This can be clearly seen from the seasonal dynamics in vegetation cover (NDVI) as shown in the boxplot below. The vegetation signal is on aver-age relatively “flat” across the year, with a peak in September and with extreme variability in the rainy season (August and September) due to high levels of variability in rainfall.
The NDVI trend in the yellow box on the right shows a strong overall increase in vegetation cover after 1984 (trend plot above), peaking in 1999. This in-crease is also evident in the Landsat soil background adjusted vegetation indices (SAVI) on this page, and is most probably due to increases in woody cover.
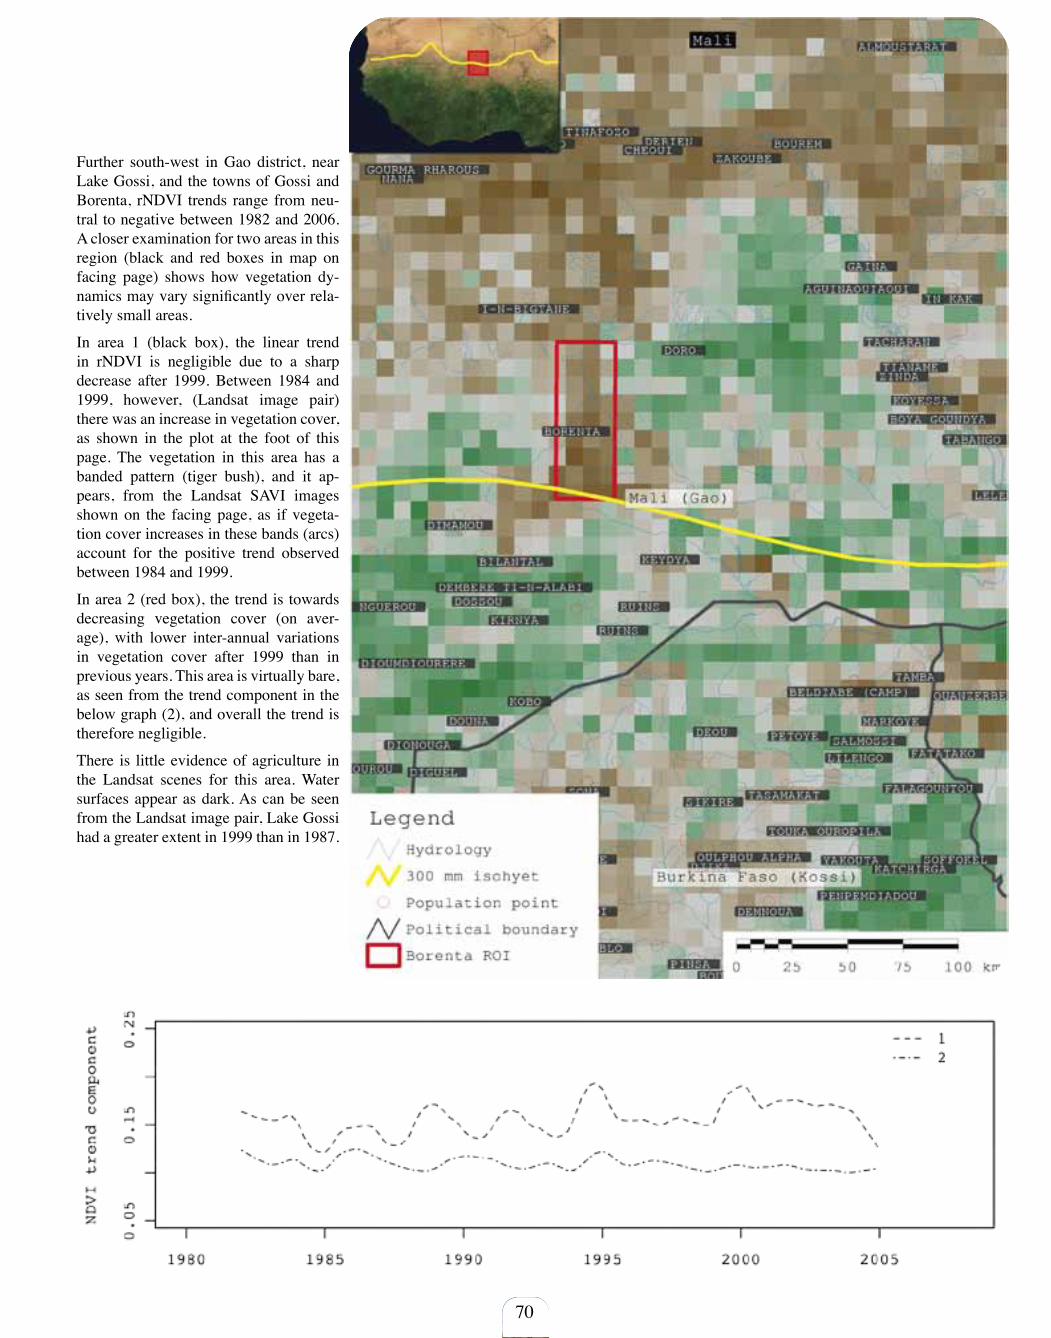
Further south-west in Gao district, near Lake Gossi, and the towns of Gossi and Borenta, rNDVI trends range from neu-tral to negative between 1982 and 2006. A closer examination for two areas in this region (black and red boxes in map on facing page) shows how vegetation dy-namics may vary significantly over rela-tively small areas.
In area 1 (black box), the linear trend in rNDVI is negligible due to a sharp decrease after 1999. Between 1984 and 1999, however, (Landsat image pair) there was an increase in vegetation cover, as shown in the plot at the foot of this page. The vegetation in this area has a banded pattern (tiger bush), and it ap-pears, from the Landsat SAVI images shown on the facing page, as if vegeta-tion cover increases in these bands (arcs) account for the positive trend observed between 1984 and 1999.
In area 2 (red box), the trend is towards decreasing vegetation cover (on aver-age), with lower inter-annual variations in vegetation cover after 1999 than in previous years. This area is virtually bare, as seen from the trend component in the below graph (2), and overall the trend is therefore negligible.
There is little evidence of agriculture in the Landsat scenes for this area. Water surfaces appear as dark. As can be seen from the Landsat image pair, Lake Gossi had a greater extent in 1999 than in 1987.
70
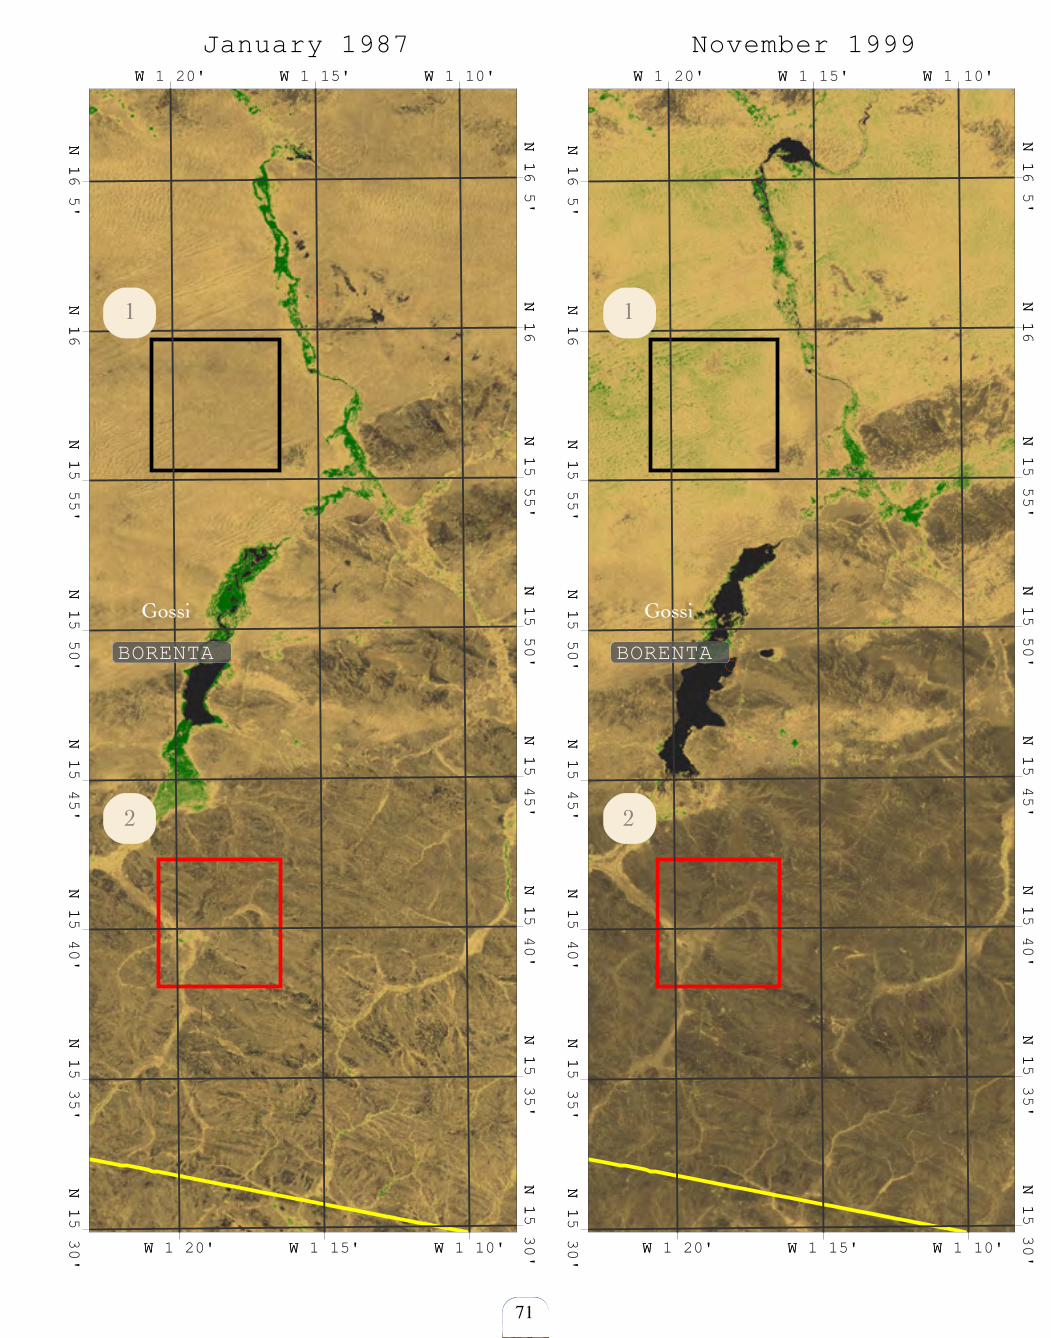
71
N1
N15 30'
N1
N15 35'
N1
N15 40'
N1
N15 45'
N1
N15 50'
N1
N15 55'
N1
N16
N1
N16 5'
WW 1 20' WW 1 15' WW 1 10'
N1
N15 30'
N1
N15 35'
N1
N15 40'
N1
N15 45'
N1
N15 50'
N1
N15 55'
N1
N16
N1
N16 5'
WW 1 20' WW 1 15' WW 1 10'
BORENTA
N1
N15 30'
N1
N15 35'
N1
N15 40'
N1
N15 45'
N1
N15 50'
N1
N15 55'
N1
N16
N1
N16 5'
WW 1 20' WW 1 15' WW 1 10'
N1
N15 30'
N1
N15 35'
N1
N15 40'
N1
N15 45'
N1
N15 50'
N1
N15 55'
N1
N16
N1
N16 5'
WW 1 20' WW 1 15' WW 1 10'
BORENTA
0 7.5 15 22.5 30 km
January 1987 November 1999
1 1
Gossi Gossi
2 2
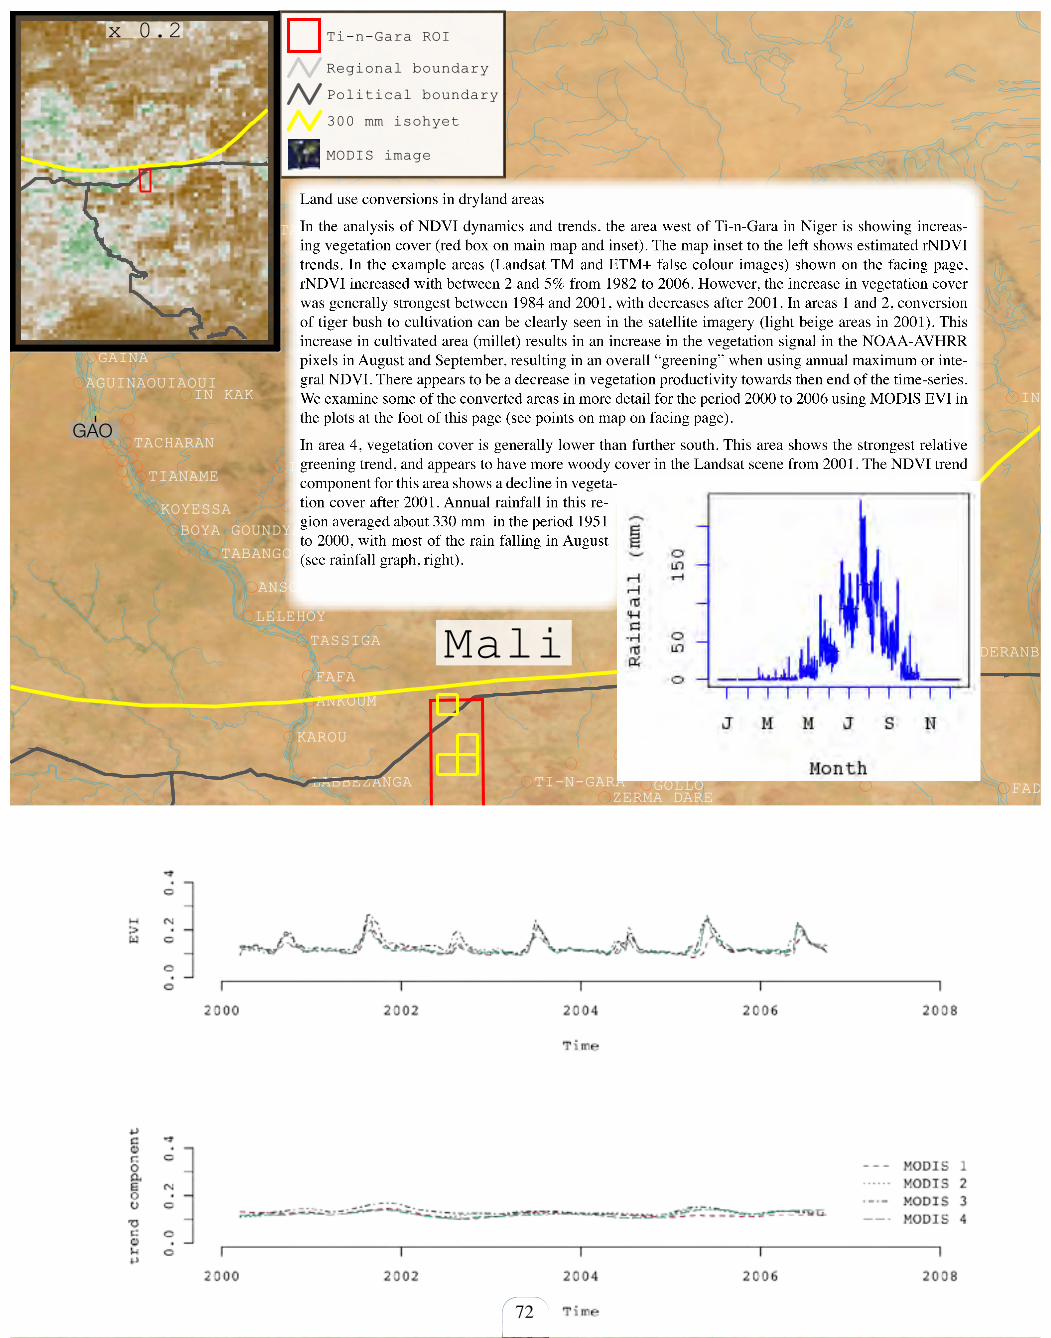
MANI
BOURGOUTIABONGOU LAMORDE TORODI
BANGEL HARIKANASSOU
OURO SAWABE SAY
BOYENGA
TOLEBA BIRNI NGAOURE
DIAKINDIKAKOULIPTOUGOU
BOSSE BANGOU
TAMBOLESAMFOLGA
AOULA KWARA
KOBODE
THION
BOGANDEDOSSO
TARATAKO
GOLLOZERMA DARE
BANI
SEBANGOU
ATALOGA
BANIMATE
KORONBAL
TEGUEYMARKOYE
FONDEZANGOU
TUIZEGOROULABBEZANGA
NAZEYBANDIO
GAIGOROU
TAMBA
TI-N-GARA
AYOROU
YAKOUTA
SOUMASSOU
GOLBEGUI GOSSO
BANKILARE
GOTHEYE
SASSONO
KOURORI
SIMIRI
OUANZERBE
TOUKA OUROPILA GUILIMAN
NAMAGA
BOUKANDA
ANSONGO
ANDERANBOUKAN
BANGOU TAWEY
BONI
BANI BANGOU
KOLO BOSSEY
YELOUNADANTYANDOUKOALA
NAMARO
GARDAMA KWARA
PENPEMDIADOU
SALMOSSI
FANDOU BERI
DEY TAGUI
NYAFANOU
BANGARE
SAKOYRAKABAY
TYELOLMOREBOUBONTYAWA
HAMDILAYE
LILENGO
FALAGOUNTOU
MANGAIZE
FATATAKOZIBAN
DANGA
SOFFOKEL
TONDI BIA
TACHARAN
TIANAME
KOYESSA
IN TAGATEN
BOYA GOUNDYA MENAKA
TABANGO
LELEHOY
TASSIGA
AKABAR
ANKOUM
FAFA
BOUROBOUREKAROU
TILOA
KATCHIRGA
BANIZONGOUGASSA ZIBAN
BELDIABE (CAMP)
TATARKO
ZAMA
TONDYA
DIOURE
FEFANDOU
KARGOUZI
DOUNGOURO
DARGOL KOMO BANGOU
GARBEY
MATOUM
TERA
MAOUREYKORO GOUSSOU
FADAMA
GOROUGINDE
LOGA
TOUKOUNOUS
FILINGUE
BONKOUKOU
GAINA
AGUINAOUIAOUIIN KAK
TELATAI
ALMOUSTARAT
TAGUELALF
IN TALAK
NIAMEY
TILLABERY
DORI
GAO
DOSSO
NIAMEY
SENO
NAMENTENGA
GNAGNA
OUDALAN
Ti-n-Gara ROI
Regional boundary
Political boundary
300 mm isohyet
MODIS image
Niger
Burkina Faso
Mali
0 75 150 225 300 km
x 0.2
72
Land use conversions in dryland areas
In the analysis of NDVI dynamics and trends, the area west of Ti-n-Gara in Niger is showing increas-ing vegetation cover (red box on main map and inset). The map inset to the left shows estimated rNDVI trends. In the example areas (Landsat TM and ETM+ false colour images) shown on the facing page, rNDVI increased with between 2 and 5% from 1982 to 2006. However, the increase in vegetation cover was generally strongest between 1984 and 2001, with decreases after 2001. In areas 1 and 2, conversion of tiger bush to cultivation can be clearly seen in the satellite imagery (light beige areas in 2001). This increase in cultivated area (millet) results in an increase in the vegetation signal in the NOAA-AVHRR pixels in August and September, resulting in an overall “greening” when using annual maximum or inte-gral NDVI. There appears to be a decrease in vegetation productivity towards then end of the time-series. We examine some of the converted areas in more detail for the period 2000 to 2006 using MODIS EVI in the plots at the foot of this page (see points on map on facing page).
In area 4, vegetation cover is generally lower than further south. This area shows the strongest relative greening trend, and appears to have more woody cover in the Landsat scene from 2001. The NDVI trend component for this area shows a decline in vegeta-tion cover after 2001. Annual rainfall in this re-gion averaged about 330 mm in the period 1951 to 2000, with most of the rain falling in August (see rainfall graph, right).
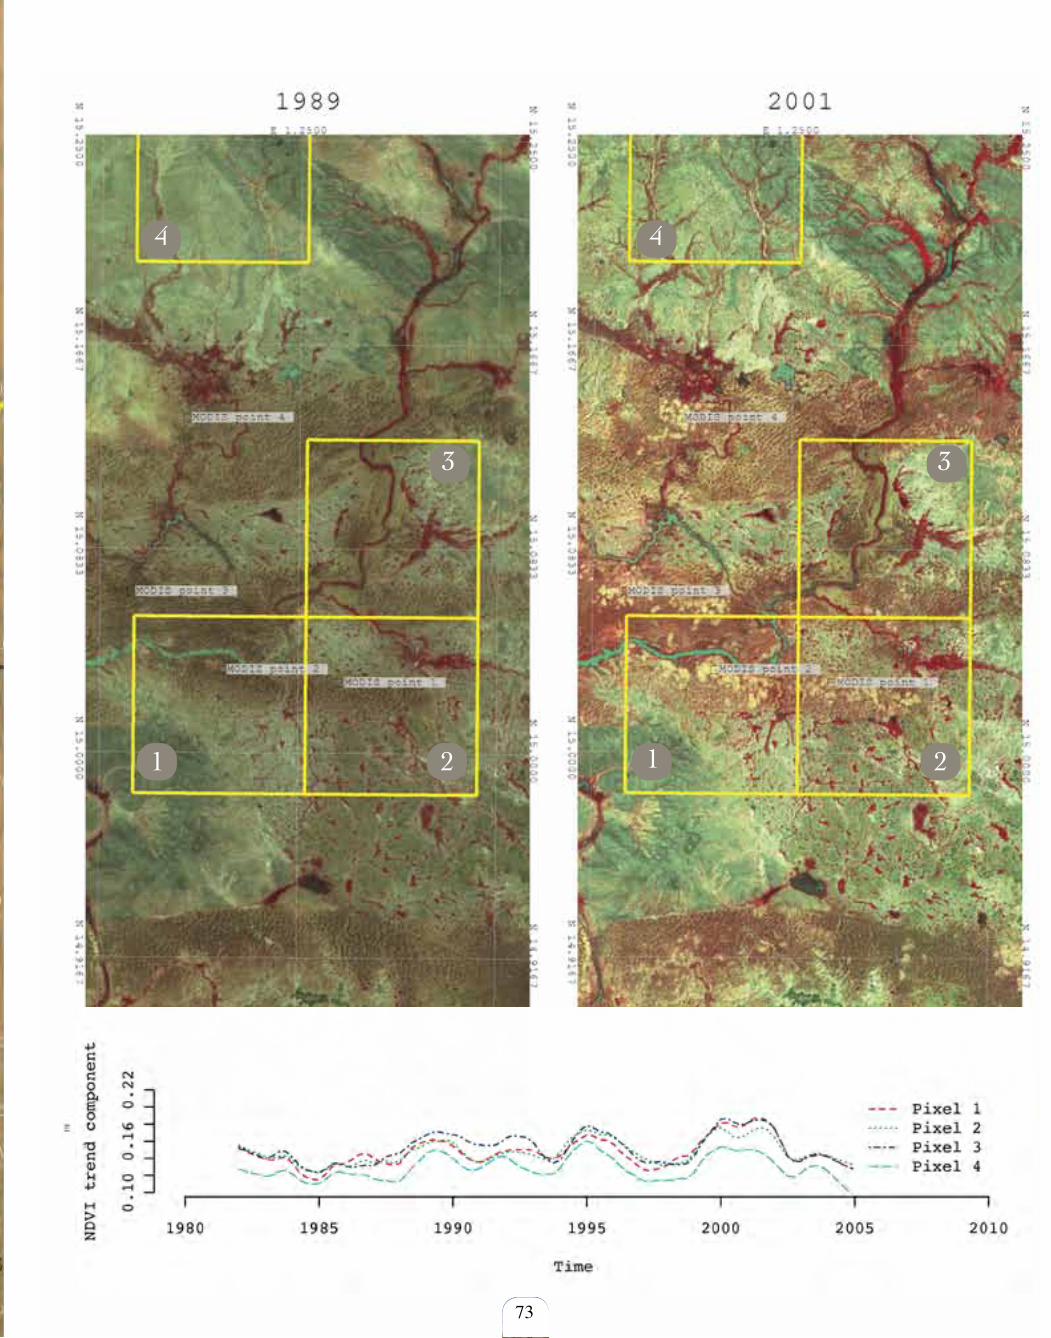
73
4 4
3 3
1 2 2 1
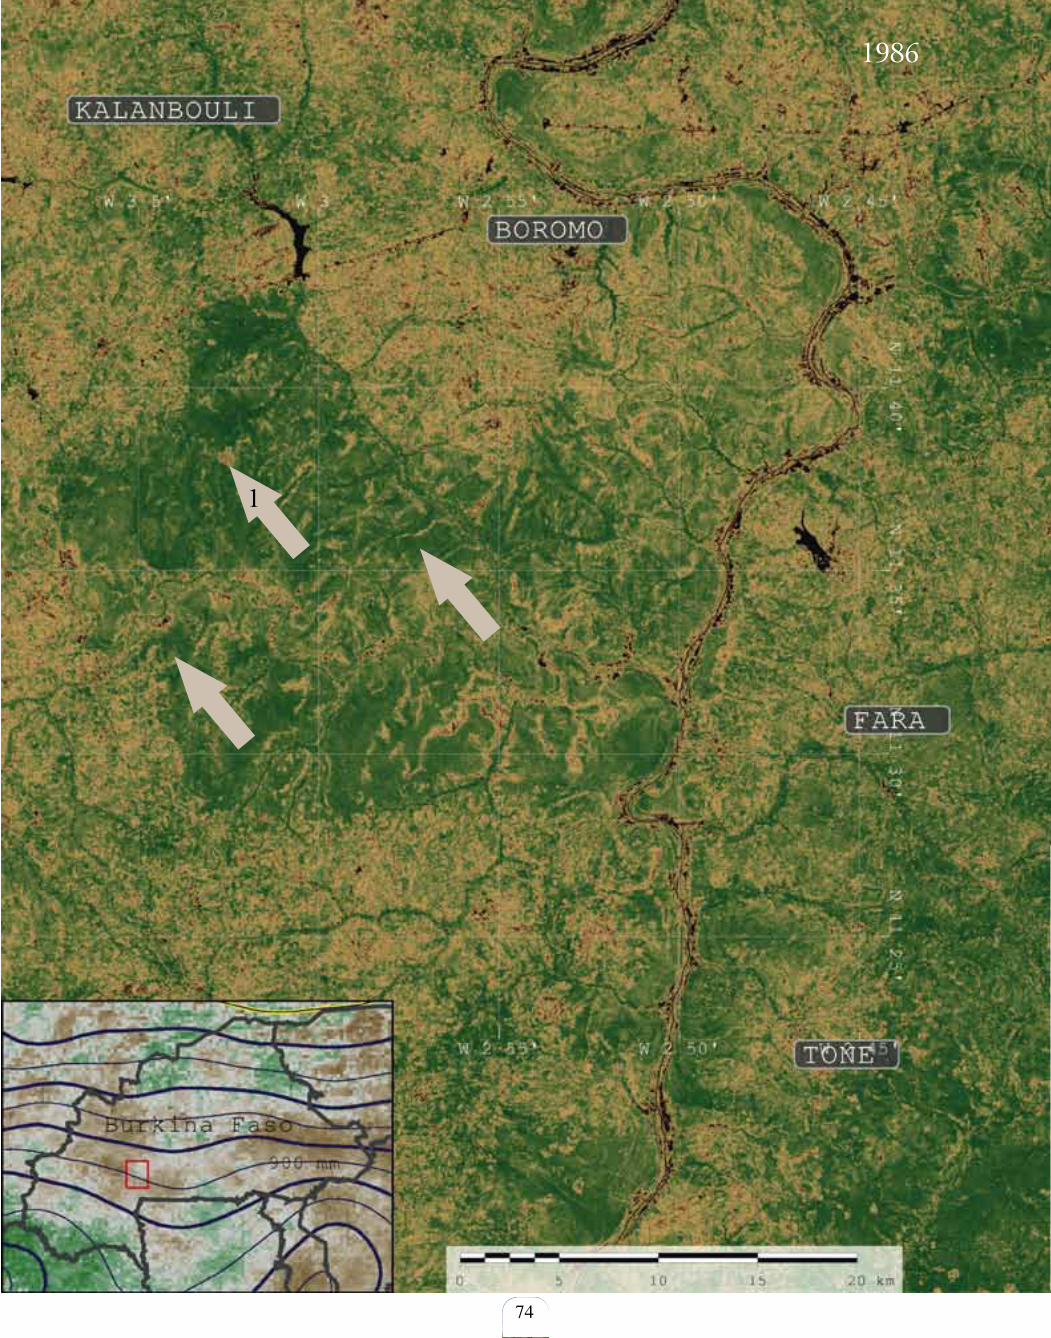
74
1
1986
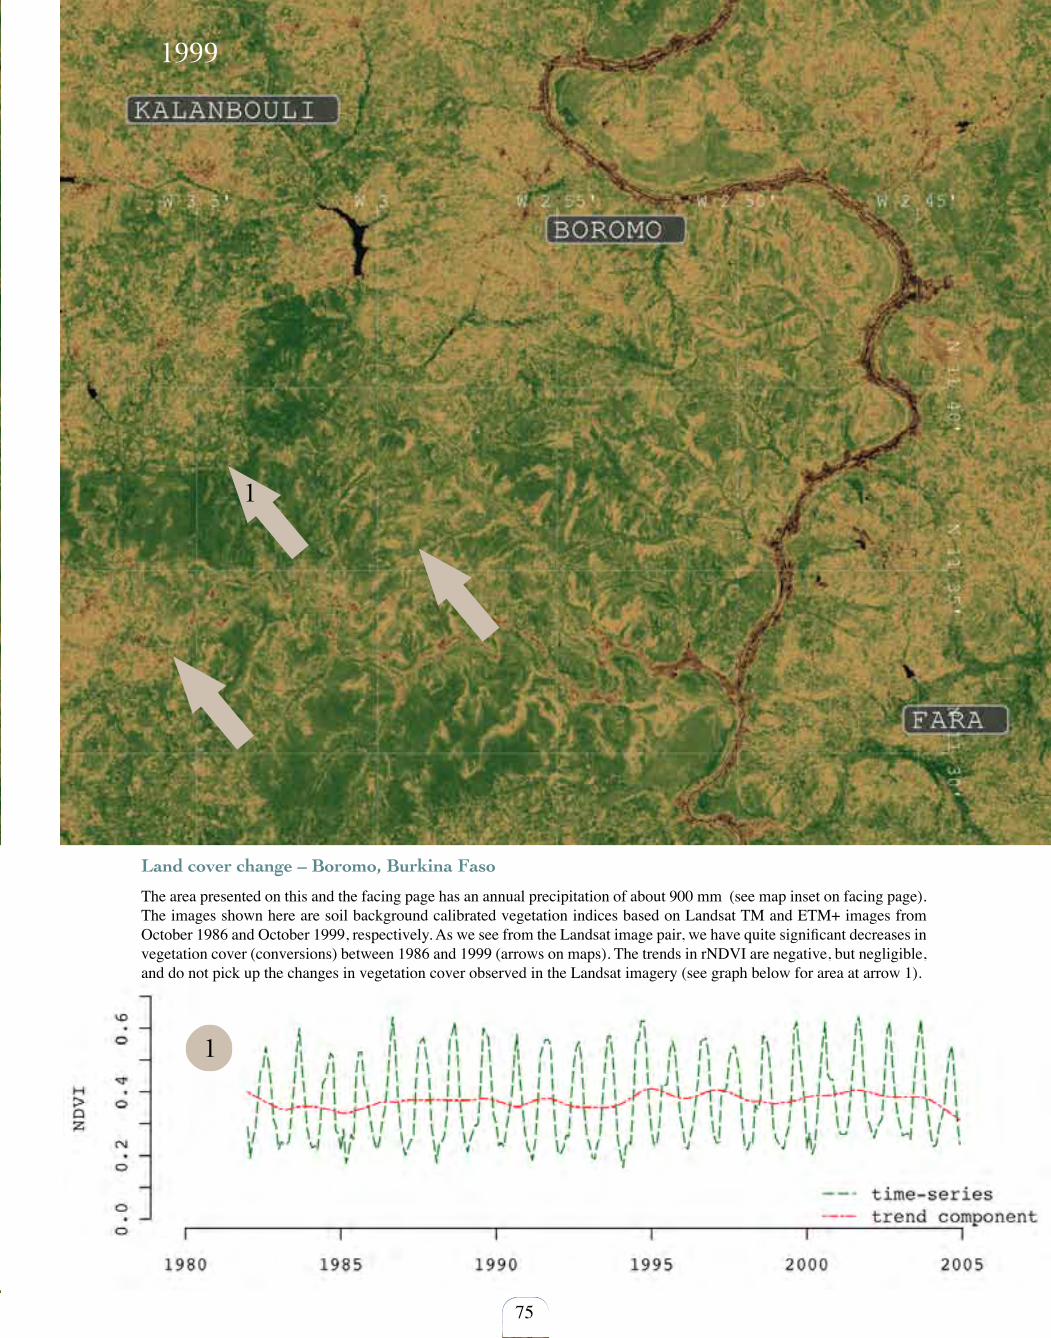
75
1999
1
1
Land cover change – Boromo, Burkina Faso
The area presented on this and the facing page has an annual precipitation of about 900 mm (see map inset on facing page). The images shown here are soil background calibrated vegetation indices based on Landsat TM and ETM+ images from October 1986 and October 1999, respectively. As we see from the Landsat image pair, we have quite significant decreases in vegetation cover (conversions) between 1986 and 1999 (arrows on maps). The trends in rNDVI are negative, but negligible, and do not pick up the changes in vegetation cover observed in the Landsat imagery (see graph below for area at arrow 1).
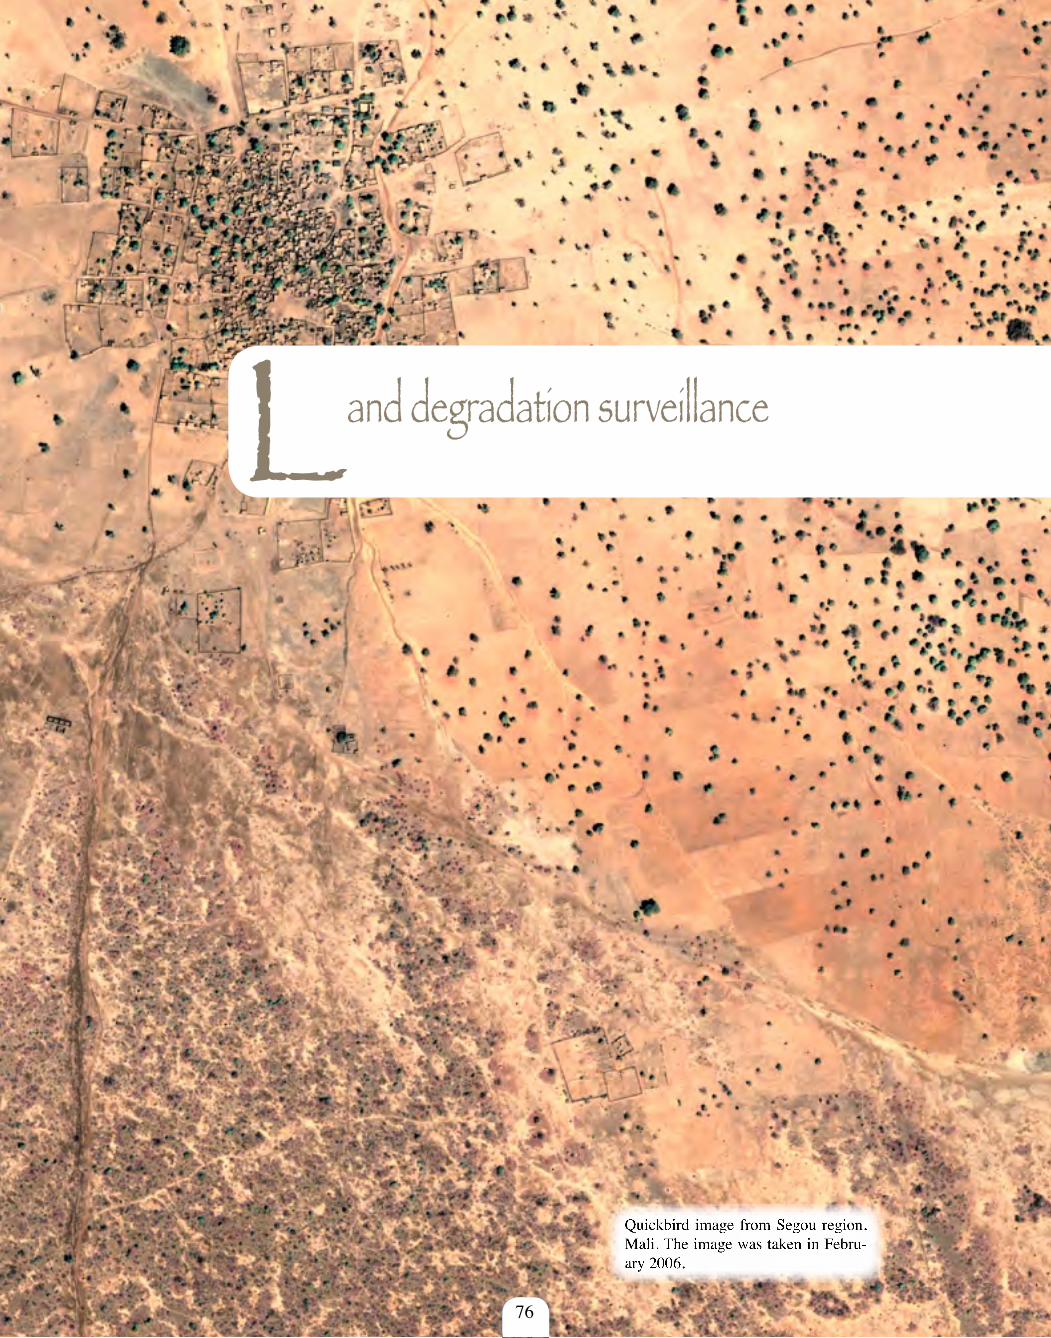
Land degradation surveillance
76
Quickbird image from Segou region, Mali. The image was taken in Febru-ary 2006.
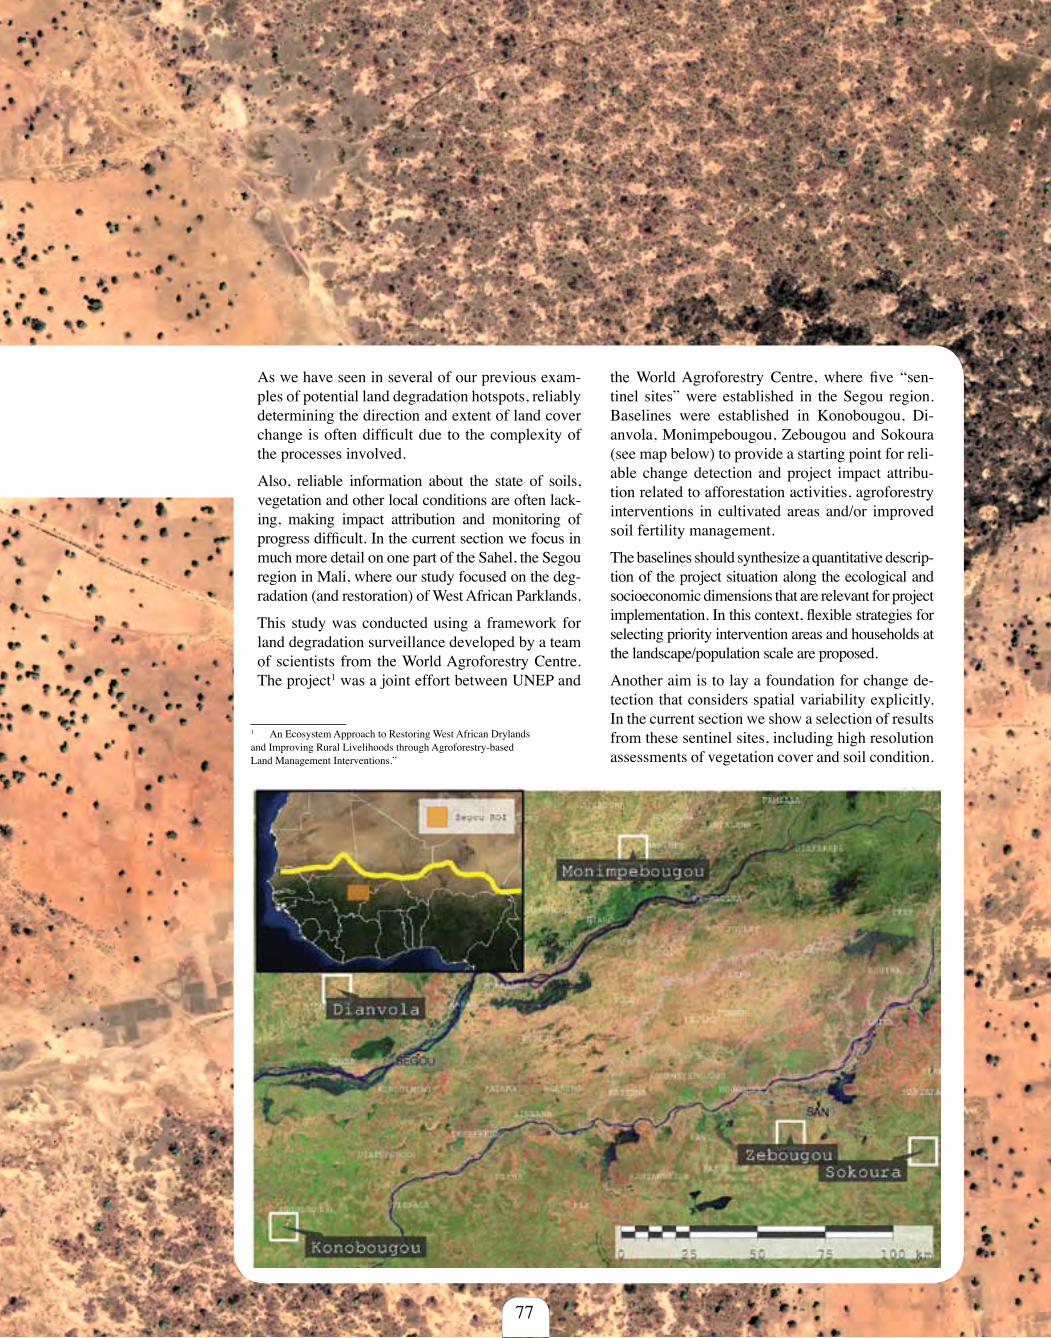
77
As we have seen in several of our previous exam-ples of potential land degradation hotspots, reliably determining the direction and extent of land cover change is often difficult due to the complexity of the processes involved.
Also, reliable information about the state of soils, vegetation and other local conditions are often lack-ing, making impact attribution and monitoring of progress difficult. In the current section we focus in much more detail on one part of the Sahel, the Segou region in Mali, where our study focused on the deg-radation (and restoration) of West African Parklands.
This study was conducted using a framework for land degradation surveillance developed by a team of scientists from the World Agroforestry Centre. The project1 was a joint effort between UNEP and
1 An Ecosystem Approach to Restoring West African Drylands and Improving Rural Livelihoods through Agroforestry-based Land Management Interventions.”
the World Agroforestry Centre, where five “sen-tinel sites” were established in the Segou region. Baselines were established in Konobougou, Di-anvola, Monimpebougou, Zebougou and Sokoura (see map below) to provide a starting point for reli-able change detection and project impact attribu-tion related to afforestation activities, agroforestry interventions in cultivated areas and/or improved soil fertility management.
The baselines should synthesize a quantitative descrip-tion of the project situation along the ecological and socioeconomic dimensions that are relevant for project implementation. In this context, flexible strategies for selecting priority intervention areas and households at the landscape/population scale are proposed.
Another aim is to lay a foundation for change de-tection that considers spatial variability explicitly. In the current section we show a selection of results from these sentinel sites, including high resolution assessments of vegetation cover and soil condition.
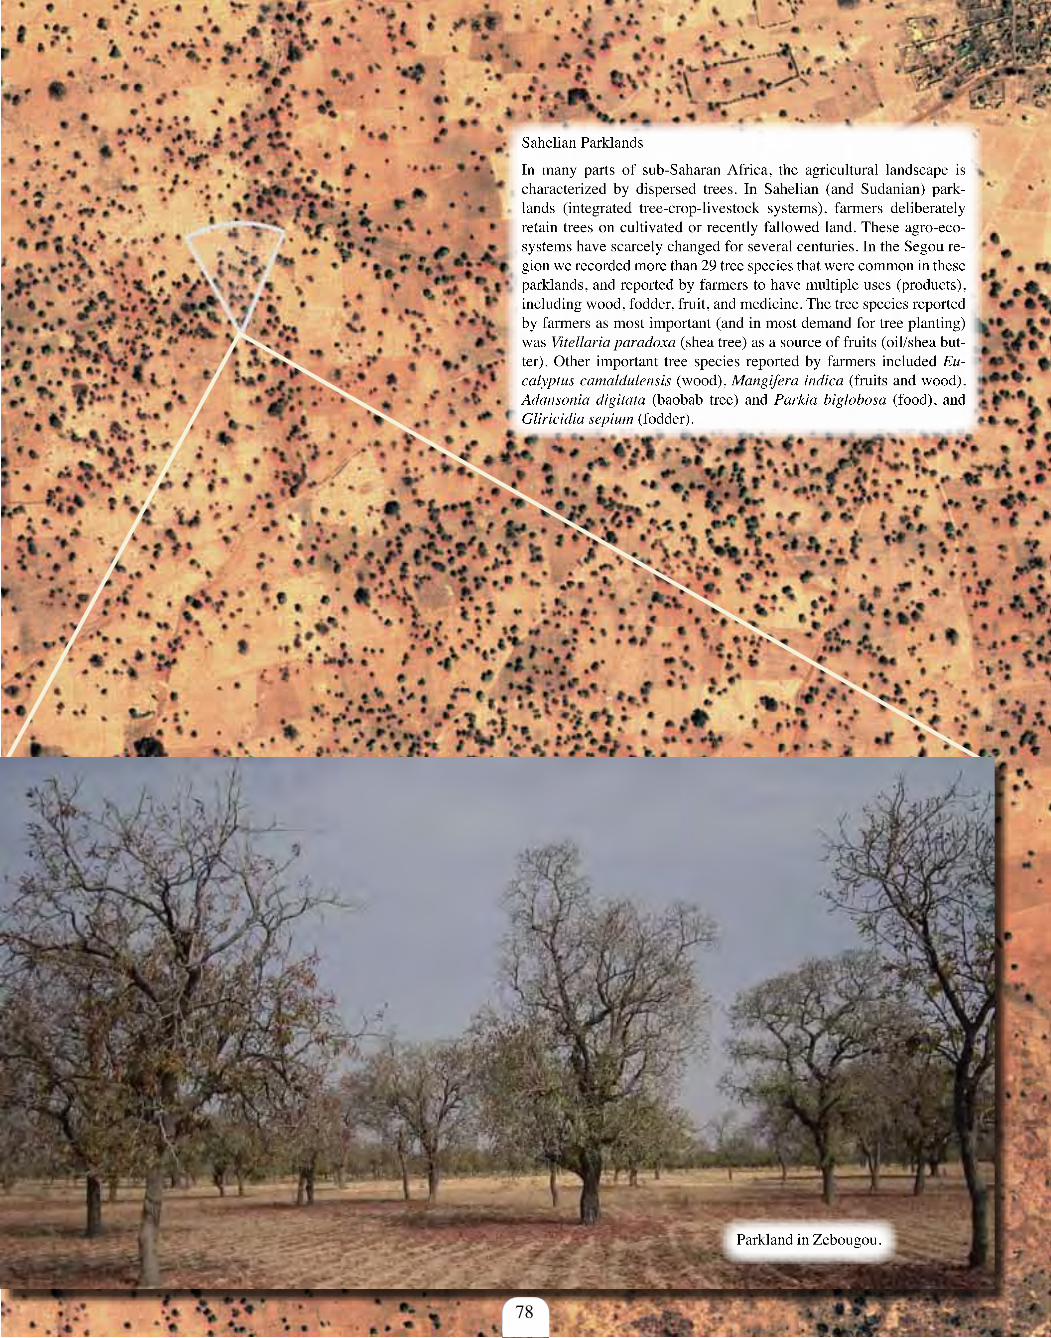
78
Parkland in Zebougou.
Sahelian Parklands
In many parts of sub-Saharan Africa, the agricultural landscape is characterized by dispersed trees. In Sahelian (and Sudanian) park-lands (integrated tree-crop-livestock systems), farmers deliberately retain trees on cultivated or recently fallowed land. These agro-eco-systems have scarcely changed for several centuries. In the Segou re-gion we recorded more than 29 tree species that were common in these parklands, and reported by farmers to have multiple uses (products), including wood, fodder, fruit, and medicine. The tree species reported by farmers as most important (and in most demand for tree planting) was Vitellaria paradoxa (shea tree) as a source of fruits (oil/shea but-ter). Other important tree species reported by farmers included Eu-calyptus camaldulensis (wood), Mangifera indica (fruits and wood), Adansonia digitata (baobab tree) and Parkia biglobosa (food), and Gliricidia sepium (fodder).
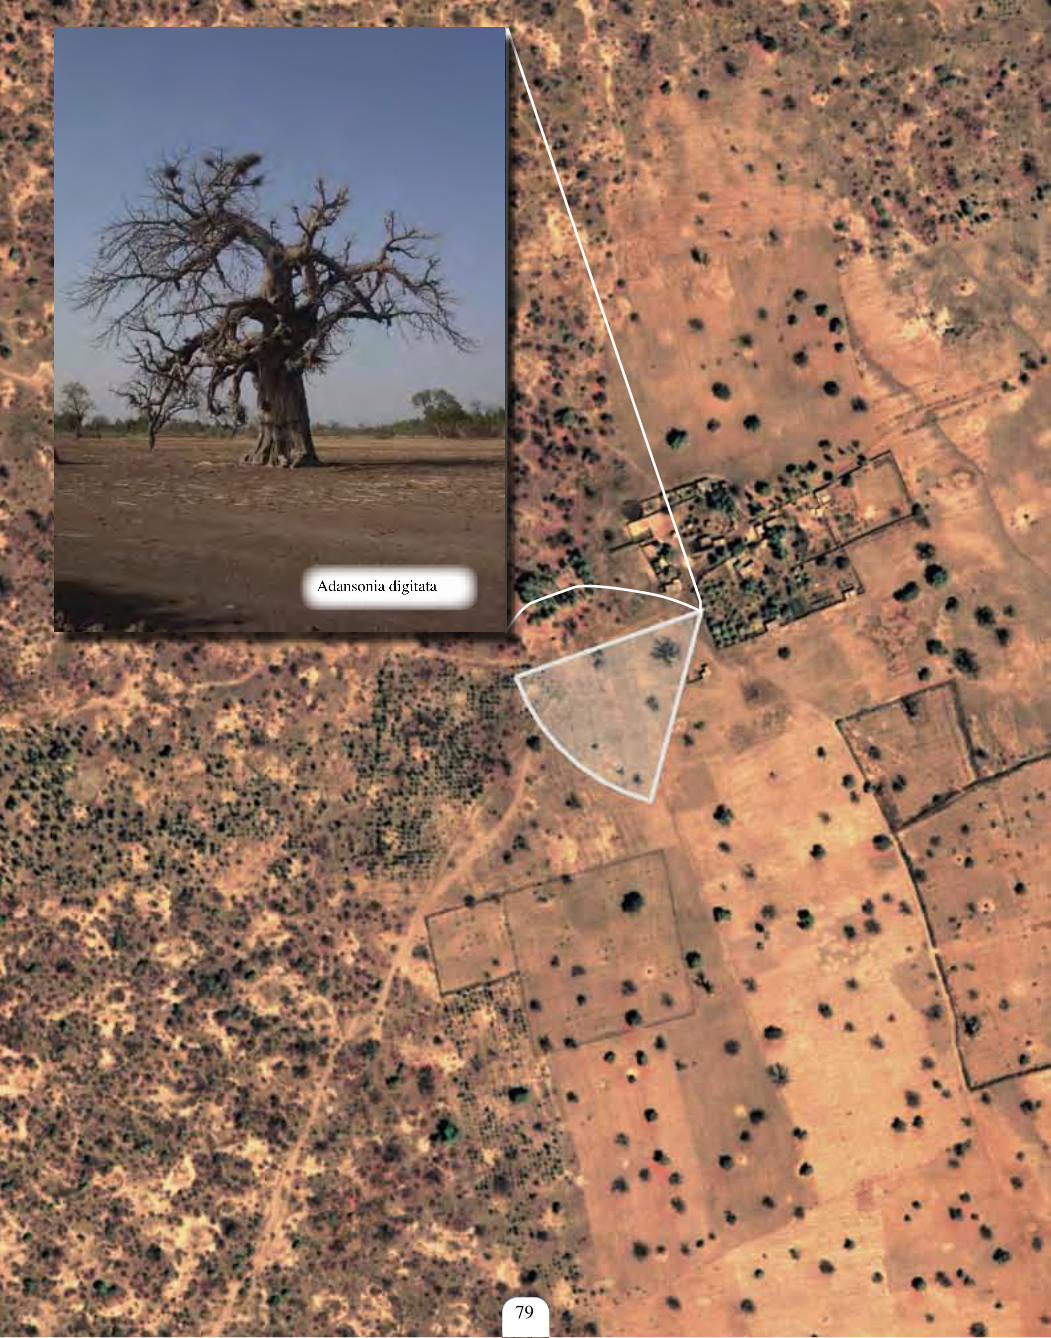
79
Adansonia digitata
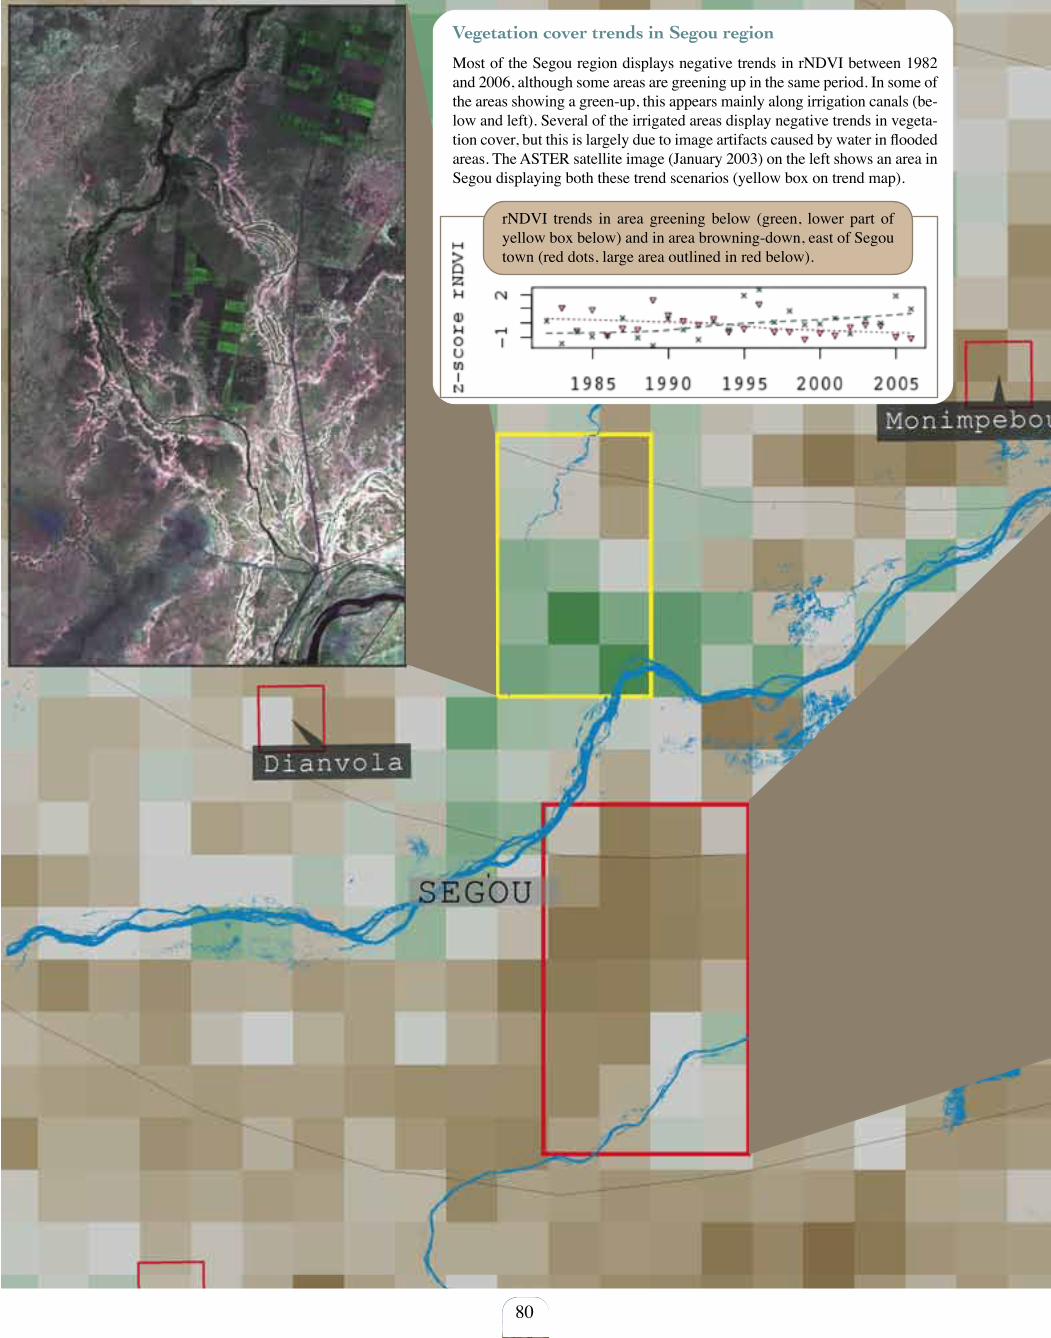
80
Vegetation cover trends in Segou region
Most of the Segou region displays negative trends in rNDVI between 1982 and 2006, although some areas are greening up in the same period. In some of the areas showing a green-up, this appears mainly along irrigation canals (be-low and left). Several of the irrigated areas display negative trends in vegeta-tion cover, but this is largely due to image artifacts caused by water in flooded areas. The ASTER satellite image (January 2003) on the left shows an area in Segou displaying both these trend scenarios (yellow box on trend map).
rNDVI trends in area greening below (green, lower part of yellow box below) and in area browning-down, east of Segou town (red dots, large area outlined in red below).

81
The area east of Segou town generally shows a browning-down trend. Significant parts of this area consist of laterite plateaus, which appear as red to purple in the ASTER colour composite on the right. These trends seem to be mainly the result of a lack of response in woody vegetation cover to in-creasing rainfall in the region as the trends in NDVI are mostly neutral.
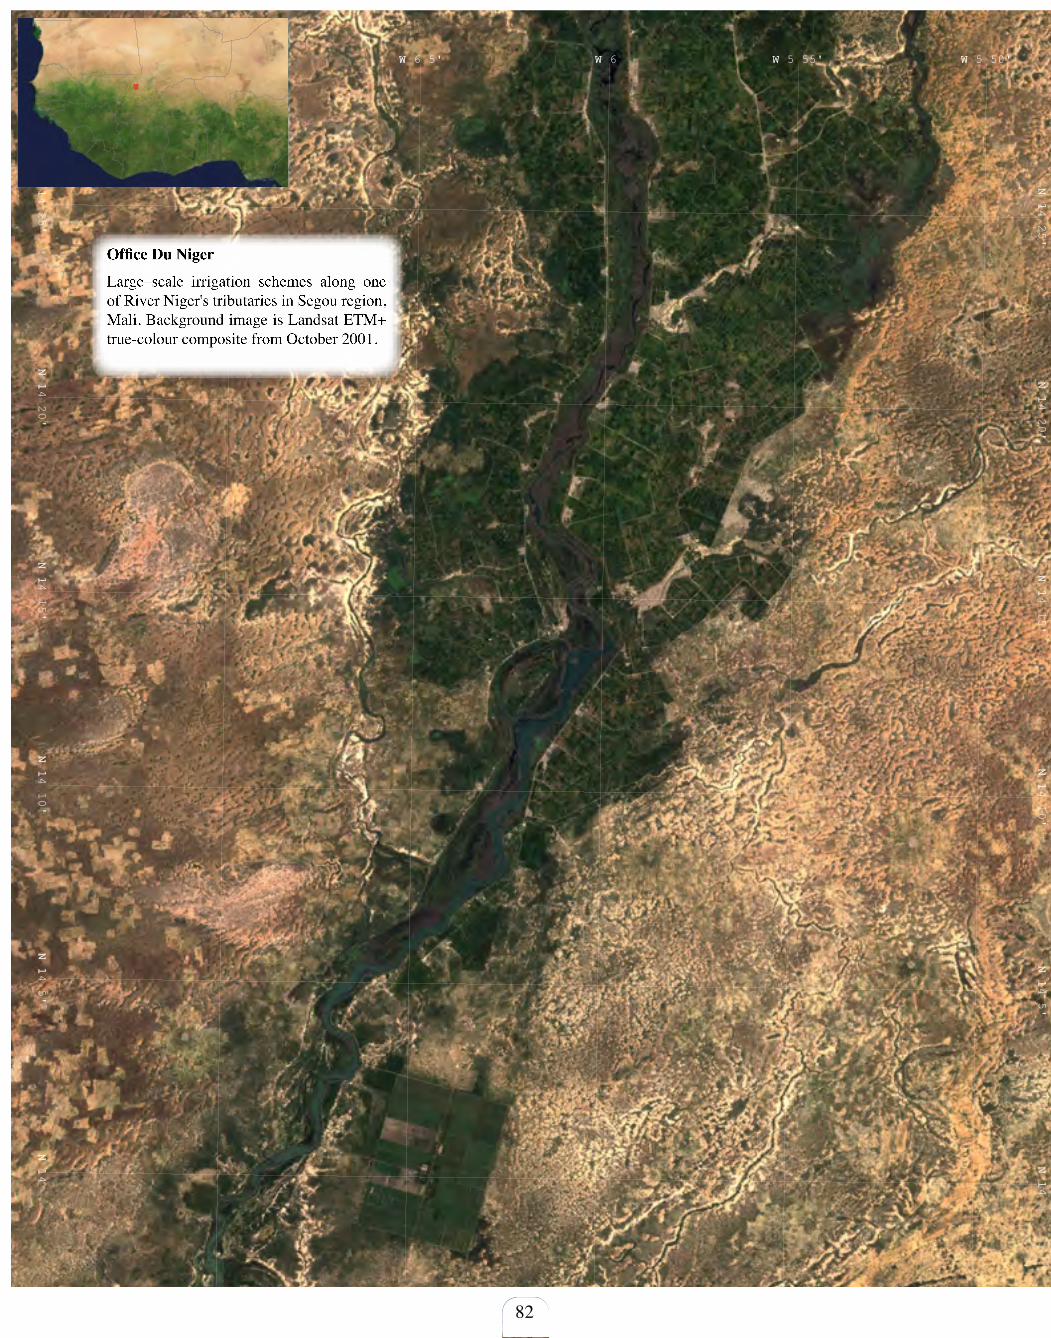
N1
N14
N1
N14 5'
N1
N14 10'
N1
N14 15'
N1
N14 20'
N1
N14 25'
WW 6 10' WW 6 5' WW 6 WW 5 55' WW 5 50'
N1
N14
N1
N14 5'
N1
N14 10'
N1
N14 15'
N1
N14 20'
N1
N14 25'
WW 6 10' WW 6 5' WW 6 WW 5 55' WW 5 50'
82
Office Du Niger
Large–scale irrigation schemes along one of River Niger's tributaries in Segou region, Mali. Background image is Landsat ETM+ true-colour composite from October 2001.
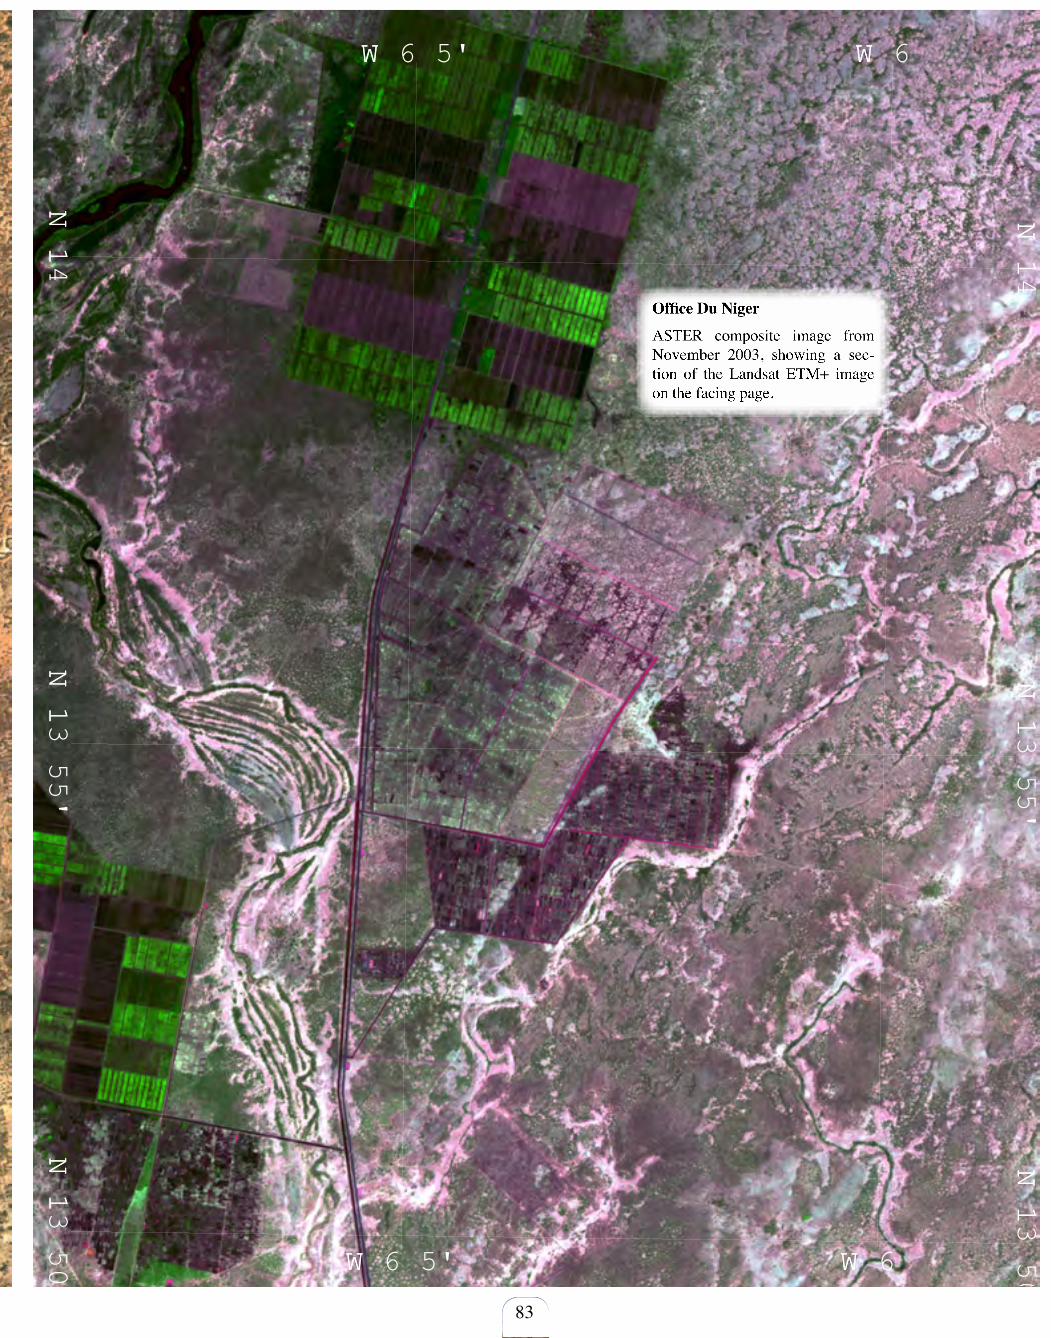
N1
N14
N1
N14 5'
N1
N14 10'
N1
N14 15'
N1
N14 20'
N1
N14 25'
WW 6 10' WW 6 5' WW 6 WW 5 55' WW 5 50'
N1
N14
N1
N14 5'
N1
N14 10'
N1
N14 15'
N1
N14 20'
N1
N14 25'
WW 6 10' WW 6 5' WW 6 WW 5 55' WW 5 50'
N1
N13 50'
N1
N13 55'
N1
N14
WW 6 5' WW 6
N1
N13 50'
N1
N13 55'
N1
N14
WW 6 5' WW 6
83
Office Du Niger
ASTER composite image from November 2003, showing a sec-tion of the Landsat ETM+ image on the facing page.
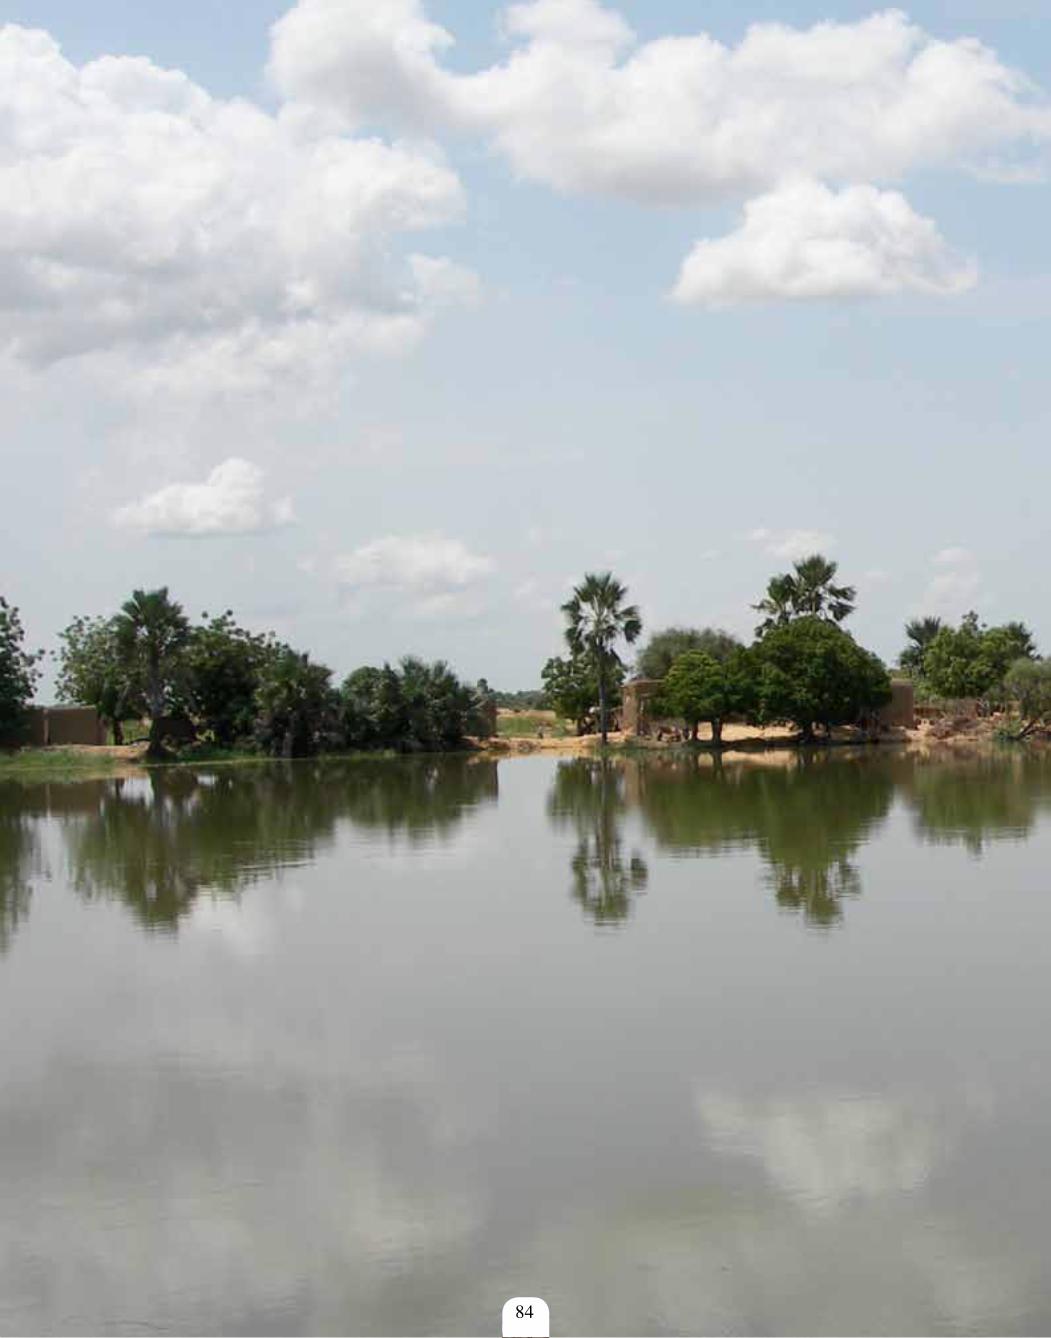
84
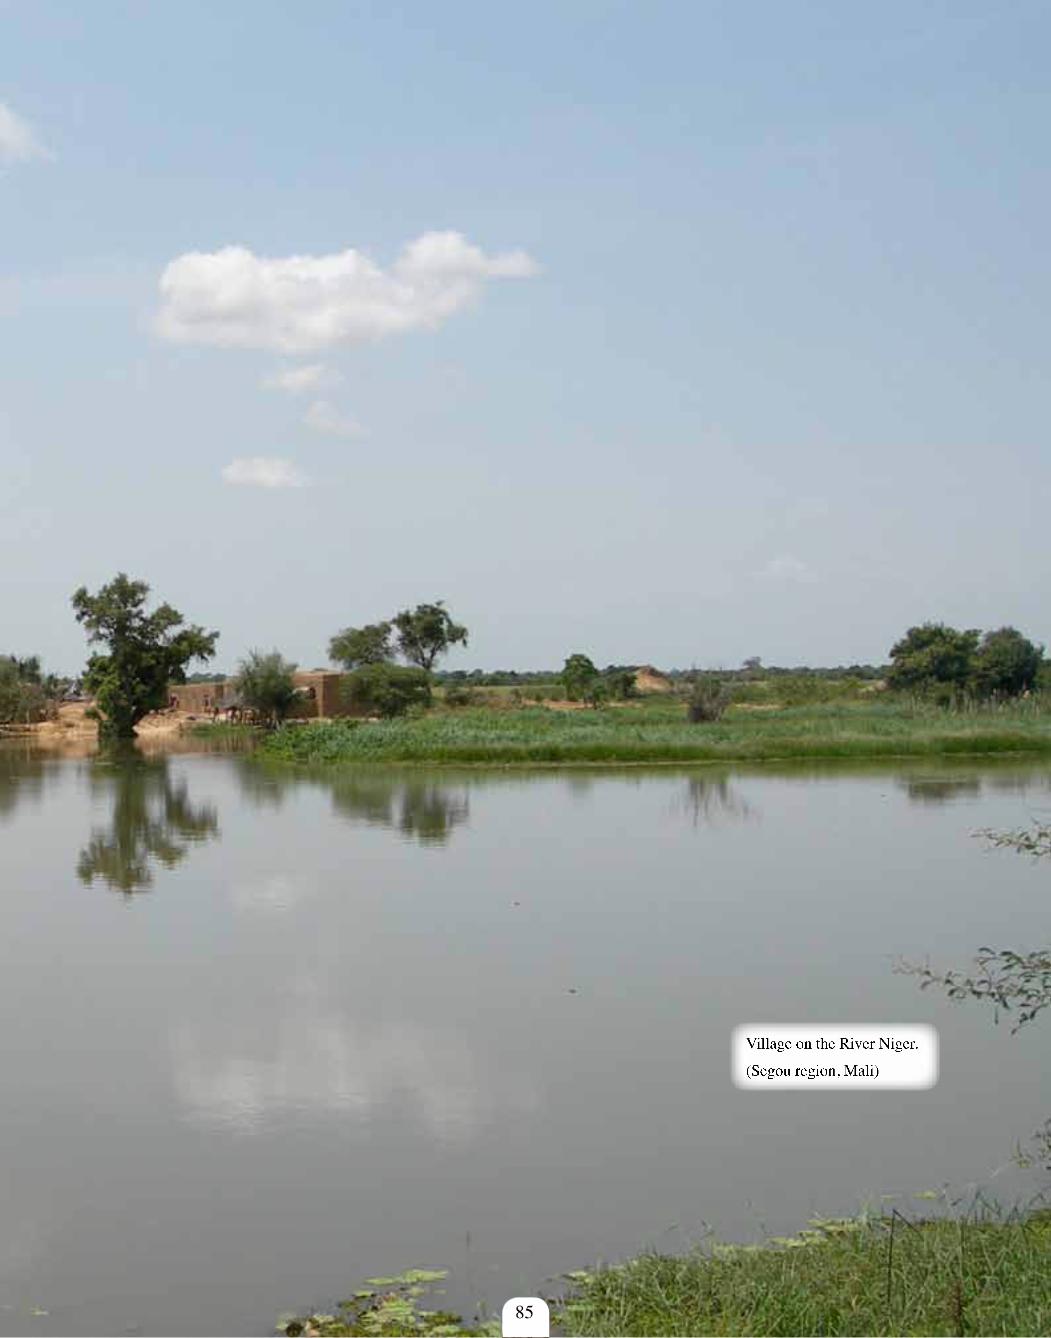
Village on the River Niger.
(Segou region, Mali)
85
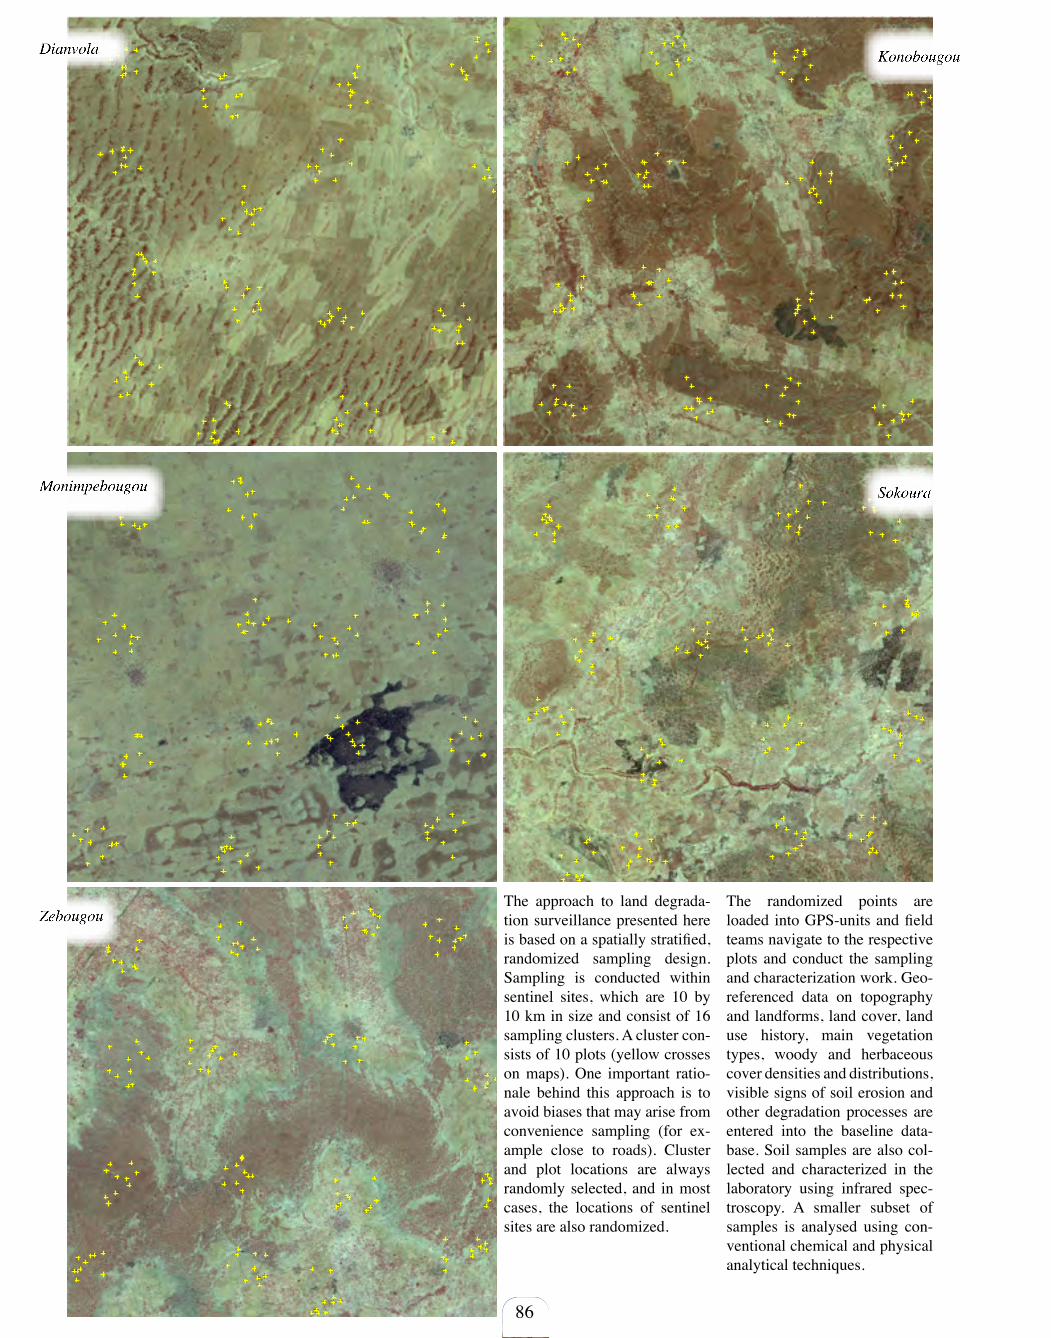
Dianvola Konobougou
Monimpebougou Sokoura
Zebougou
86
The approach to land degrada-tion surveillance presented here is based on a spatially stratified, randomized sampling design. Sampling is conducted within sentinel sites, which are 10 by 10 km in size and consist of 16 sampling clusters. A cluster con-sists of 10 plots (yellow crosses on maps). One important ratio-nale behind this approach is to avoid biases that may arise from convenience sampling (for ex-ample close to roads). Cluster and plot locations are always randomly selected, and in most cases, the locations of sentinel sites are also randomized.
The randomized points are loaded into GPS-units and field teams navigate to the respective plots and conduct the sampling and characterization work. Geo-referenced data on topography and landforms, land cover, land use history, main vegetation types, woody and herbaceous cover densities and distributions, visible signs of soil erosion and other degradation processes are entered into the baseline data-base. Soil samples are also col-lected and characterized in the laboratory using infrared spec-troscopy. A smaller subset of samples is analysed using con-ventional chemical and physical analytical techniques.
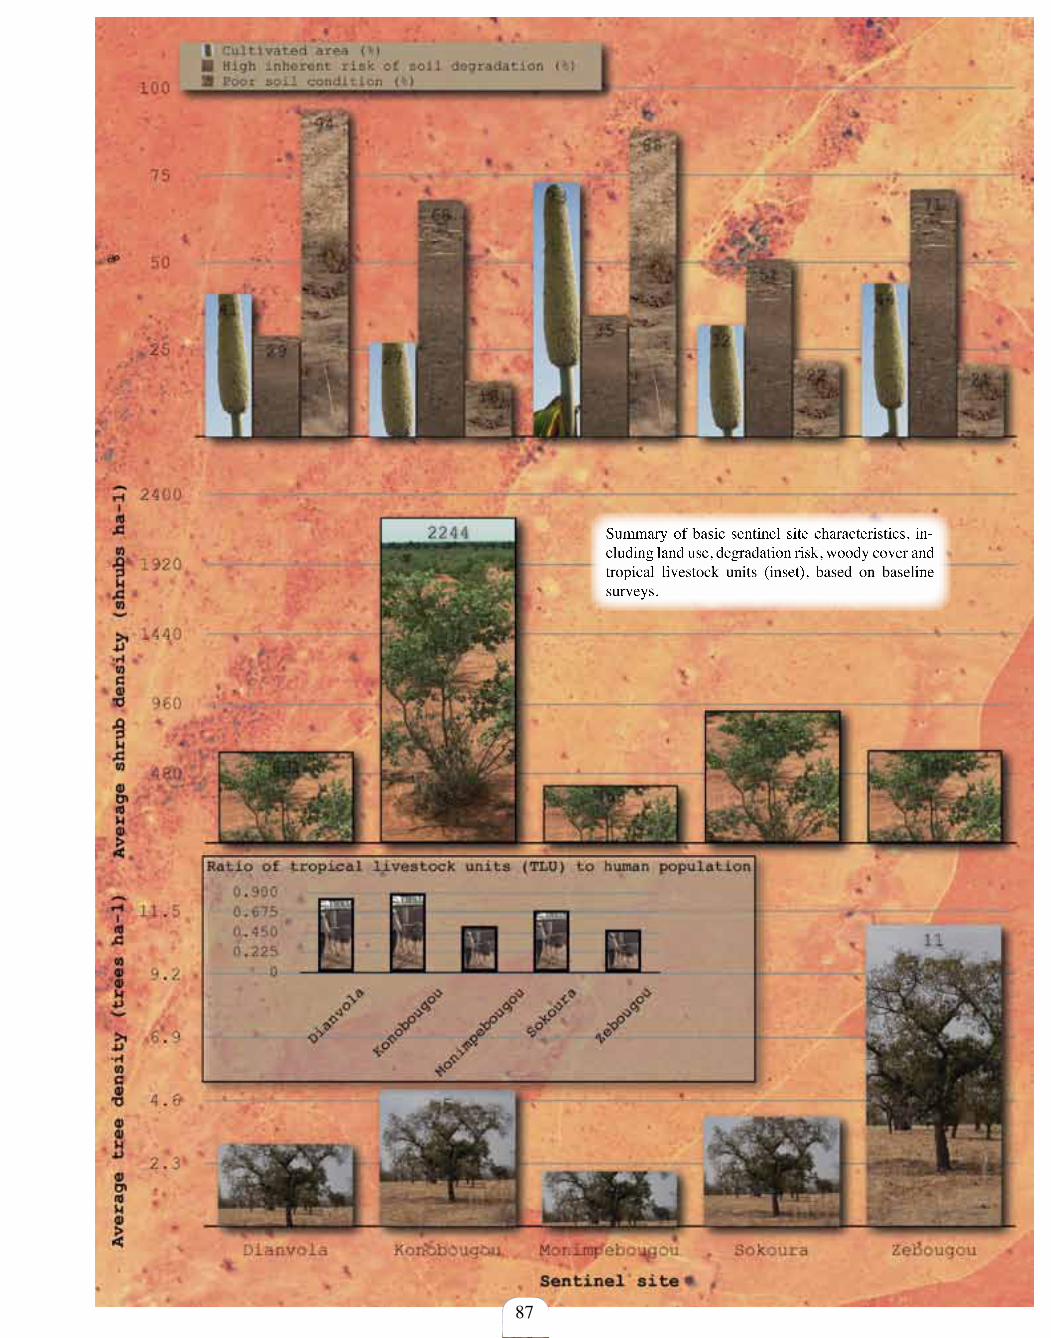
87
Summary of basic sentinel site characteristics, in-cluding land use, degradation risk, woody cover and tropical livestock units (inset), based on baseline surveys.
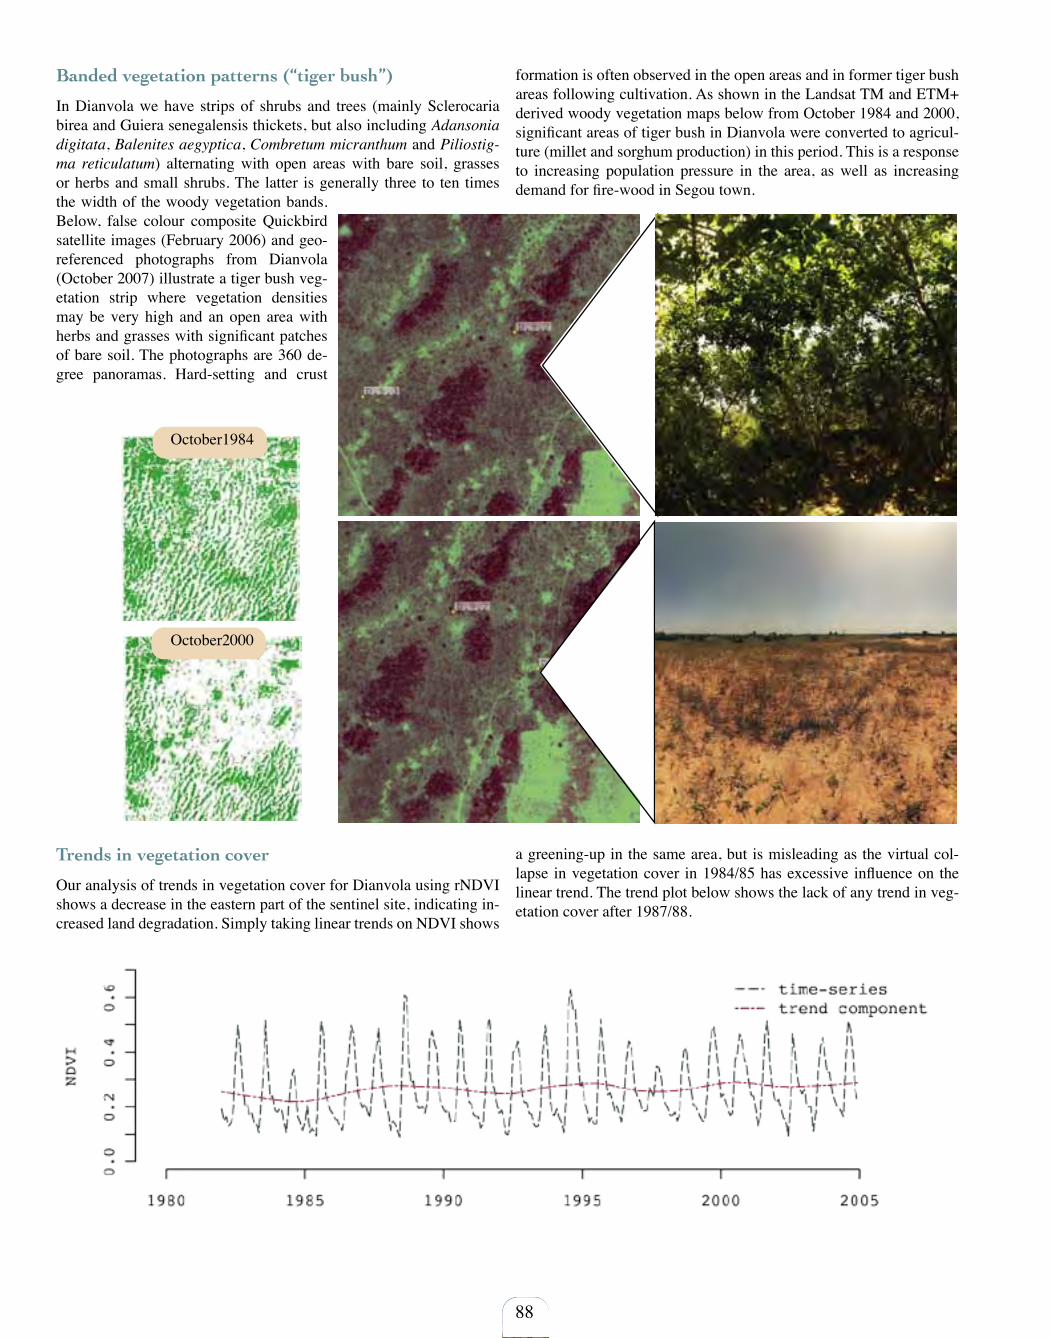
88
October1984
October2000
Banded vegetation patterns (“tiger bush”)
In Dianvola we have strips of shrubs and trees (mainly Sclerocaria birea and Guiera senegalensis thickets, but also including Adansonia digitata, Balenites aegyptica, Combretum micranthum and Piliostig-ma reticulatum) alternating with open areas with bare soil, grasses or herbs and small shrubs. The latter is generally three to ten times the width of the woody vegetation bands. Below, false colour composite Quickbird satellite images (February 2006) and geo-referenced photographs from Dianvola (October 2007) illustrate a tiger bush veg-etation strip where vegetation densities may be very high and an open area with herbs and grasses with significant patches of bare soil. The photographs are 360 de-gree panoramas. Hard-setting and crust
formation is often observed in the open areas and in former tiger bush areas following cultivation. As shown in the Landsat TM and ETM+ derived woody vegetation maps below from October 1984 and 2000, significant areas of tiger bush in Dianvola were converted to agricul-ture (millet and sorghum production) in this period. This is a response to increasing population pressure in the area, as well as increasing demand for fire-wood in Segou town.
Trends in vegetation cover
Our analysis of trends in vegetation cover for Dianvola using rNDVI shows a decrease in the eastern part of the sentinel site, indicating in-creased land degradation. Simply taking linear trends on NDVI shows
a greening-up in the same area, but is misleading as the virtual col-lapse in vegetation cover in 1984/85 has excessive influence on the linear trend. The trend plot below shows the lack of any trend in veg-etation cover after 1987/88.
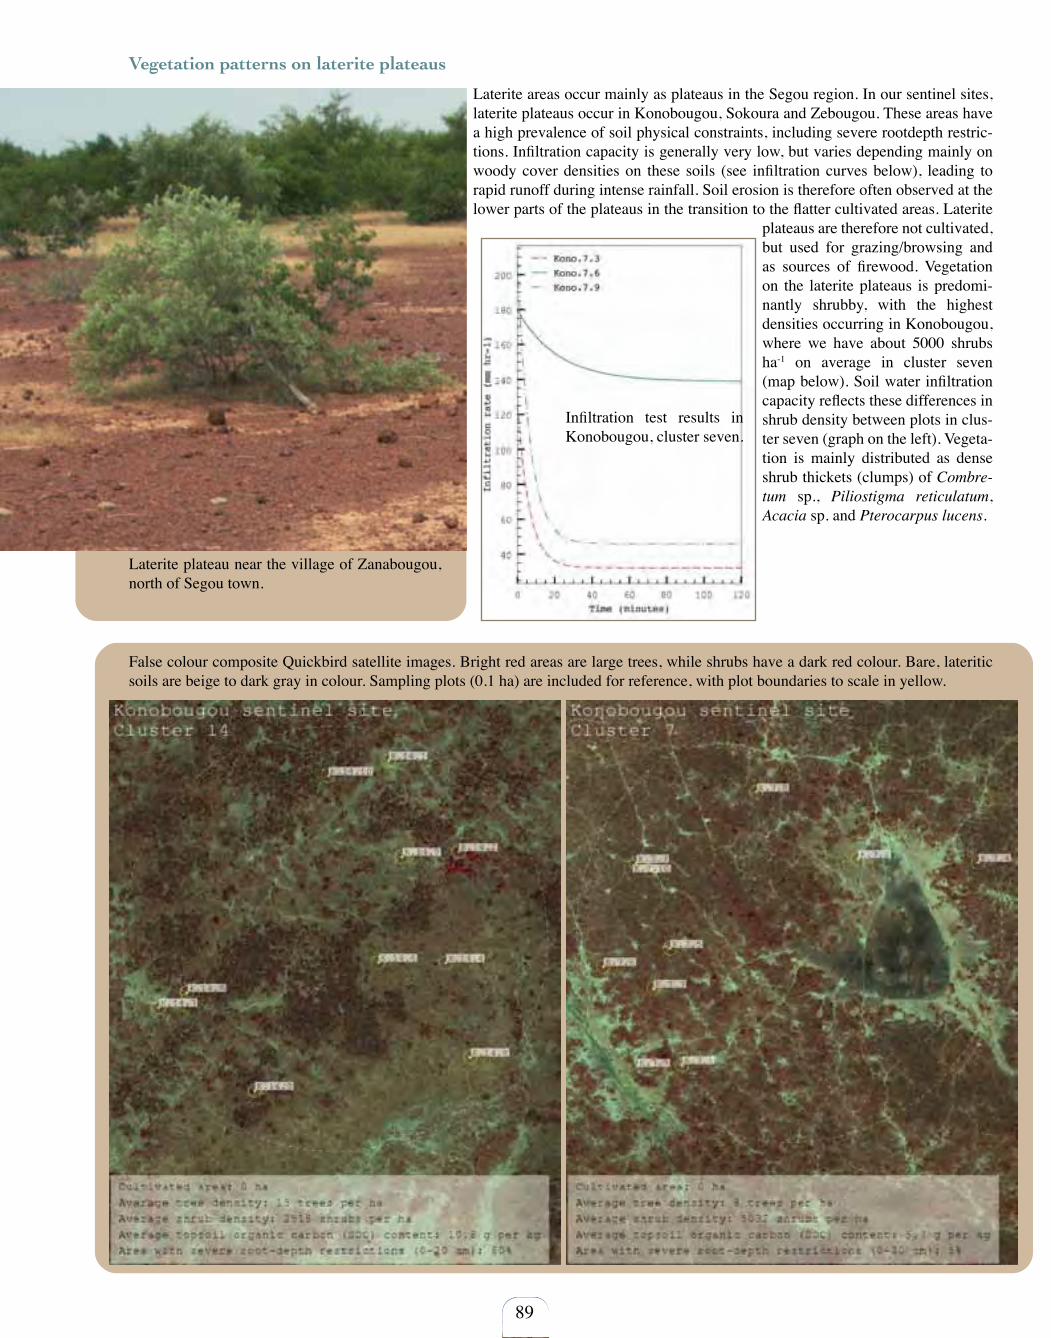
89
Vegetation patterns on laterite plateaus
Laterite areas occur mainly as plateaus in the Segou region. In our sentinel sites, laterite plateaus occur in Konobougou, Sokoura and Zebougou. These areas have a high prevalence of soil physical constraints, including severe rootdepth restric-tions. Infiltration capacity is generally very low, but varies depending mainly on woody cover densities on these soils (see infiltration curves below), leading to rapid runoff during intense rainfall. Soil erosion is therefore often observed at the lower parts of the plateaus in the transition to the flatter cultivated areas. Laterite
plateaus are therefore not cultivated, but used for grazing/browsing and as sources of firewood. Vegetation on the laterite plateaus is predomi-nantly shrubby, with the highest densities occurring in Konobougou, where we have about 5000 shrubs ha-1 on average in cluster seven (map below). Soil water infiltration capacity reflects these differences in shrub density between plots in clus-ter seven (graph on the left). Vegeta-tion is mainly distributed as dense shrub thickets (clumps) of Combre-tum sp., Piliostigma reticulatum, Acacia sp. and Pterocarpus lucens.
Infiltration test results in Konobougou, cluster seven.
Laterite plateau near the village of Zanabougou, north of Segou town.
False colour composite Quickbird satellite images. Bright red areas are large trees, while shrubs have a dark red colour. Bare, lateritic soils are beige to dark gray in colour. Sampling plots (0.1 ha) are included for reference, with plot boundaries to scale in yellow.
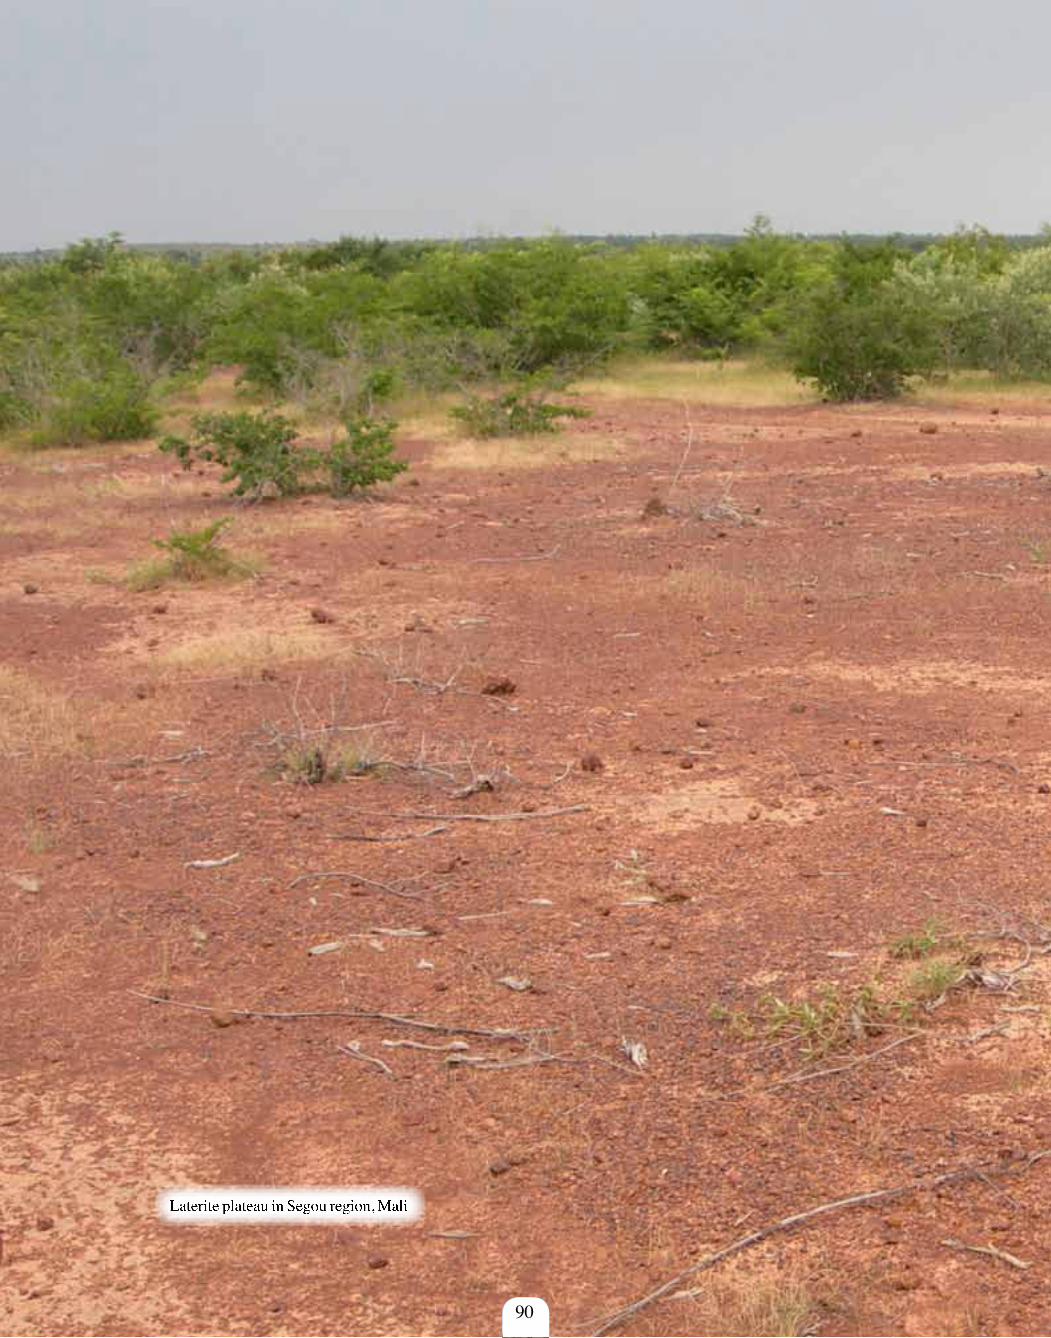
90
Laterite plateau in Segou region, Mali
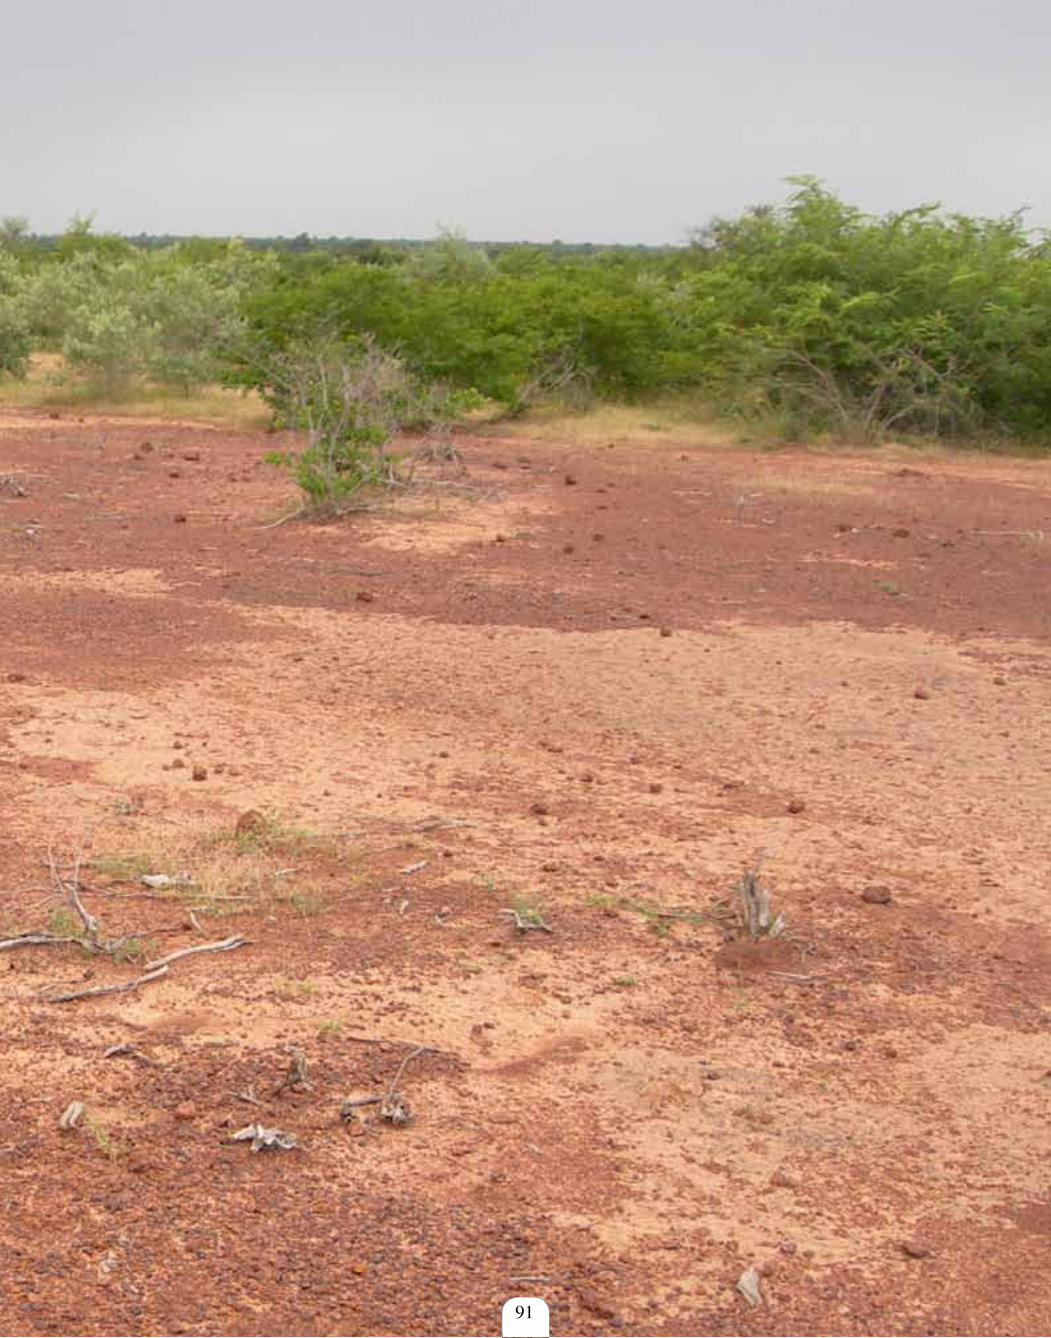
91
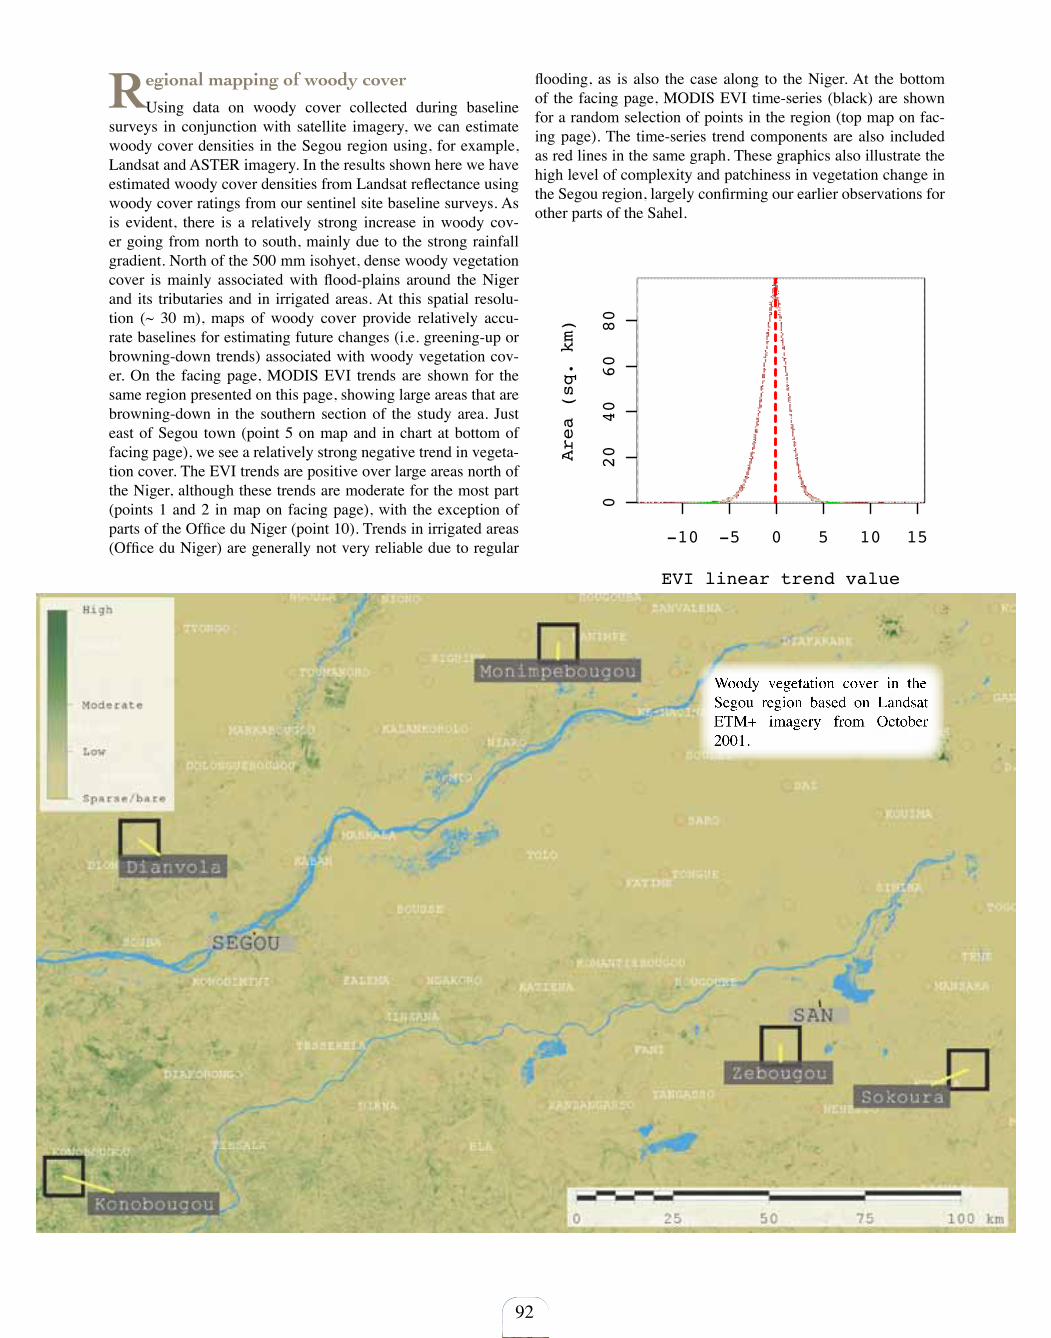
-10 -5 0 5 10 15
020
4060
80EVI linear trend value
Area (sq. km)
92
Regional mapping of woody cover
Using data on woody cover collected during baseline surveys in conjunction with satellite imagery, we can estimate woody cover densities in the Segou region using, for example, Landsat and ASTER imagery. In the results shown here we have estimated woody cover densities from Landsat reflectance using woody cover ratings from our sentinel site baseline surveys. As is evident, there is a relatively strong increase in woody cov-er going from north to south, mainly due to the strong rainfall gradient. North of the 500 mm isohyet, dense woody vegetation cover is mainly associated with flood-plains around the Niger and its tributaries and in irrigated areas. At this spatial resolu-tion (~ 30 m), maps of woody cover provide relatively accu-rate baselines for estimating future changes (i.e. greening-up or browning-down trends) associated with woody vegetation cov-er. On the facing page, MODIS EVI trends are shown for the same region presented on this page, showing large areas that are browning-down in the southern section of the study area. Just east of Segou town (point 5 on map and in chart at bottom of facing page), we see a relatively strong negative trend in vegeta-tion cover. The EVI trends are positive over large areas north of the Niger, although these trends are moderate for the most part (points 1 and 2 in map on facing page), with the exception of parts of the Office du Niger (point 10). Trends in irrigated areas (Office du Niger) are generally not very reliable due to regular
flooding, as is also the case along to the Niger. At the bottom of the facing page, MODIS EVI time-series (black) are shown for a random selection of points in the region (top map on fac-ing page). The time-series trend components are also included as red lines in the same graph. These graphics also illustrate the high level of complexity and patchiness in vegetation change in the Segou region, largely confirming our earlier observations for other parts of the Sahel.
Woody vegetation cover in the Segou region based on Landsat ETM+ imagery from October 2001.
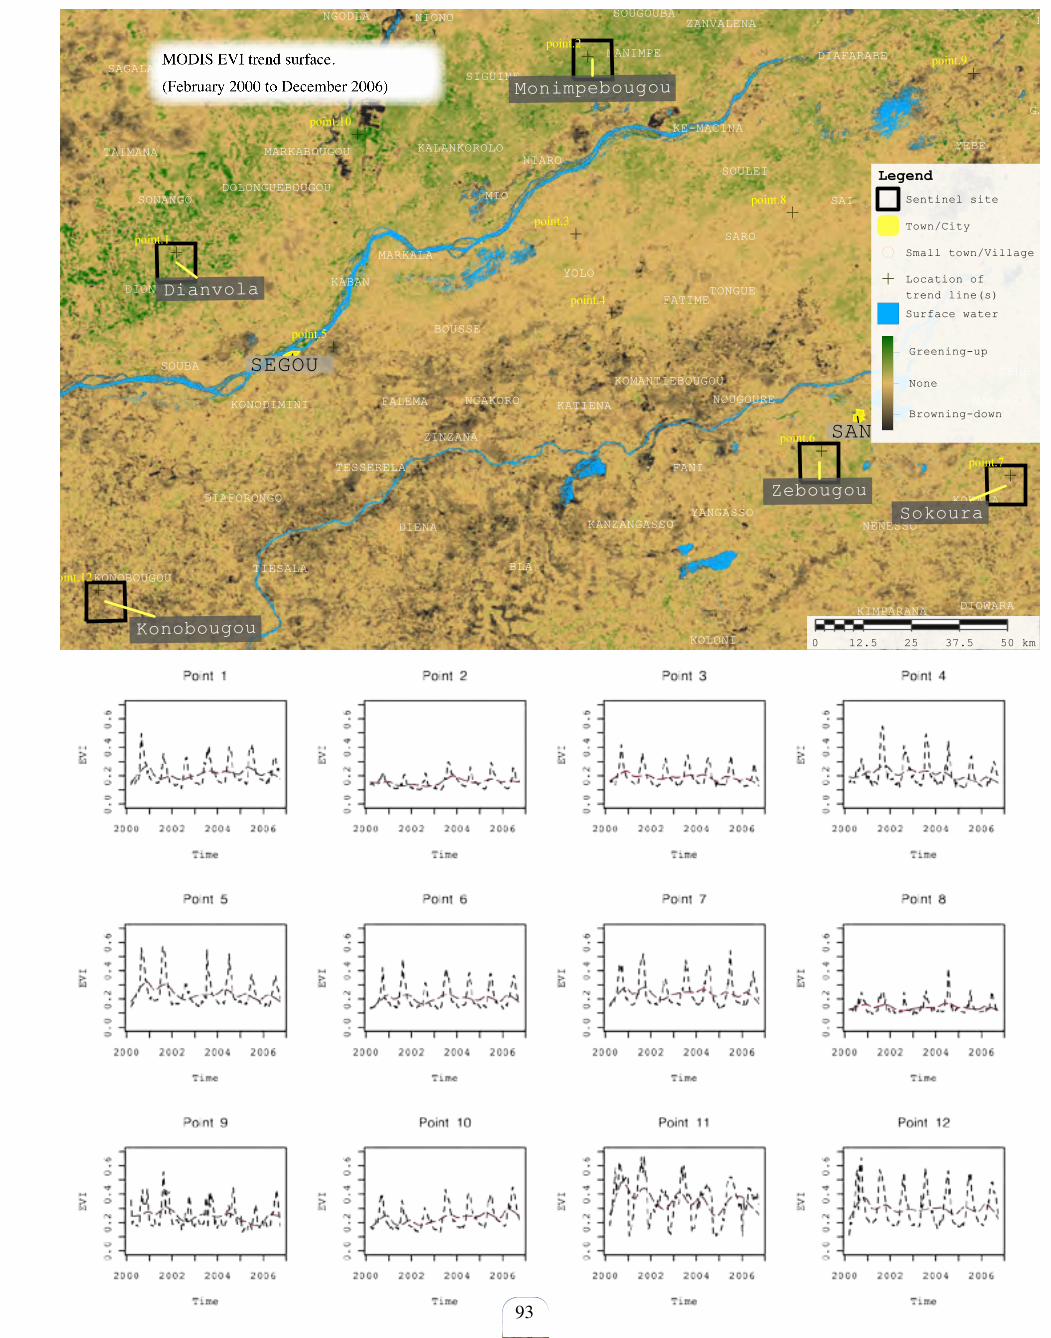
DIOWARA
MANSARAFALEMA KATIENA
TESSERELA
KOLONI
NGAKOROKONODIMINI
ZINZANA
NOUGOURE
FANI
KOUARA
KANZANGASSO
DIAFORONGOYANGASSO
NENESSODIENA
TIESALAKONOBOUGOU
BLA
KIMPARANA
SIGUINE
NIONO
YEBEMARKABOUGOU KALANKOROLOTAIMANANIARO
SOULEI
DIAFARABE
MIO
TENE
SAGALA
BOKI-WERETOUMAKORO
KOUIMASARO
KOMANTIEBOUGOU
MARKALA
KABAN
ZANVALENASOUGOUBA
KE-MACINA
NGODLA
TYONGO
SOUBA
KOUAKOUROU
YOLO
DOLONGUEBOUGOUSONANGO
DIONVOLA TONGUE
MANIMPE
SAI
SIMINAFATIME
GANIA
BOUSSETOGO
SEGOU
SAN
SokouraZebougou
Monimpebougou
Dianvola
Konobougou0 12.5 25 37.5 50 km
Legend
Sentinel site
Town/City
Small town/Village
Location of trend line(s)
Surface water
Greening-up
None
Browning-down
93
MODIS EVI trend surface.
(February 2000 to December 2006)
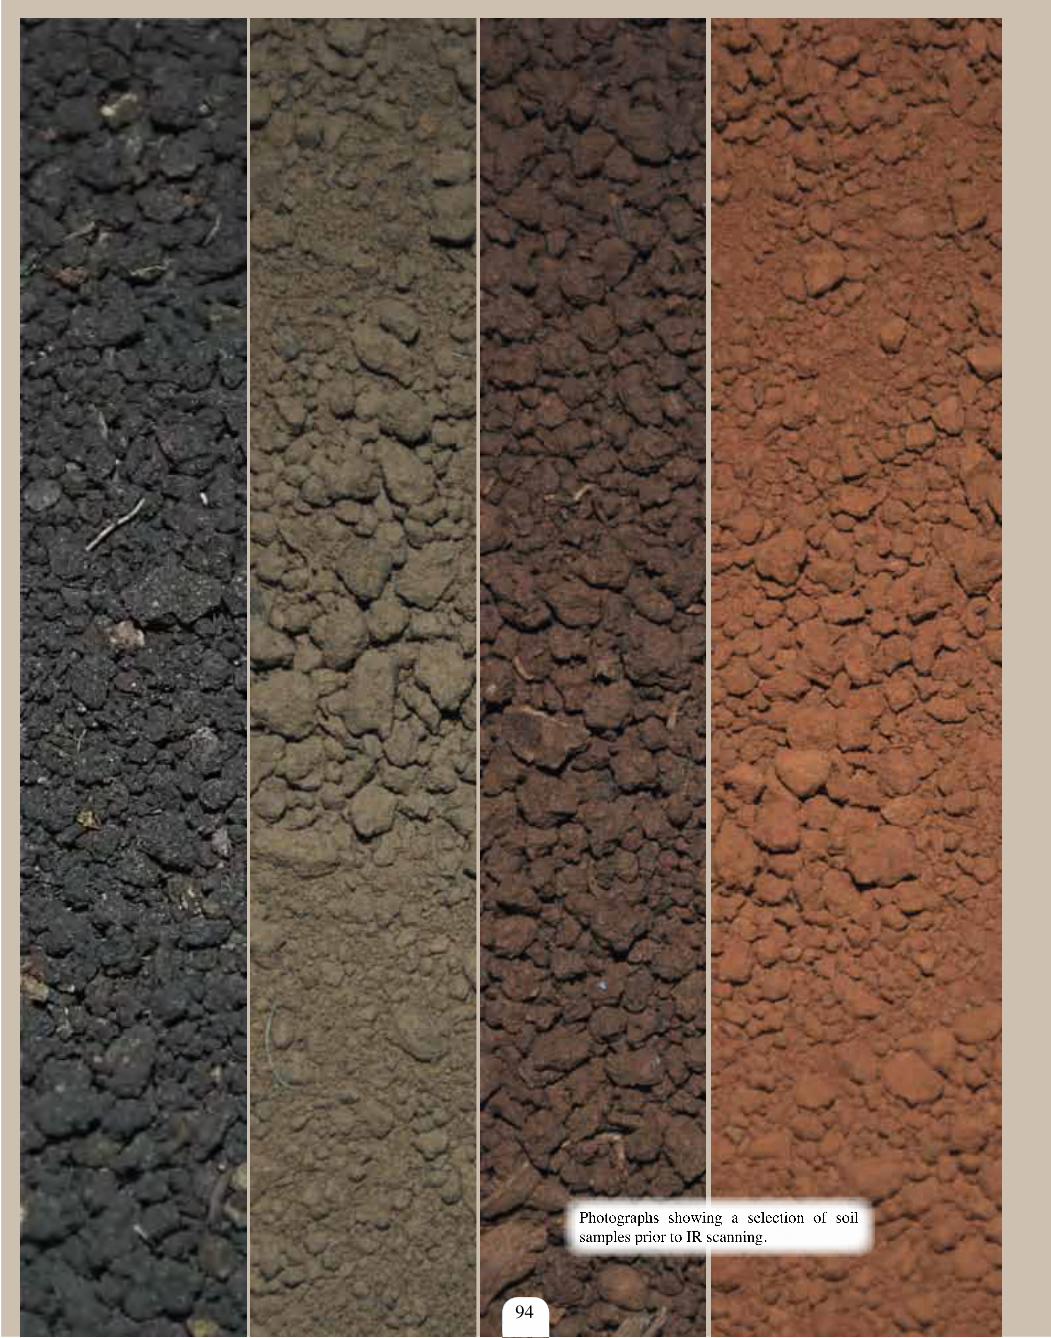
94
Photographs showing a selection of soil samples prior to IR scanning.

Soil NIR spectral library for Segou sentinel sites (n=1389)
95
Rapid assessment of soil health
Understanding the relationships between changes in veg-etation cover discussed earlier and soil health is important for proper assessments of historical and current trends, present use, as well as future management of Sahelian Parklands. Developing the empirical basis for such assessments is, however, a challenge due to the size of the area involved, which makes costs prohibi-tive, at least when using conventional methods. In the Segou region, novel approaches developed at the World Agroforestry Centre, together with other partner institutions, were applied for rapid and less costly analysis of soil health in these landscapes, also including estimates of soil organic carbon, a soil condition index and other soil physical and chemical properties.
The keystone in the framework used to make such assessments possible is the statistical sampling framework based on random-ized sampling applied in our sentinel sites in Segou region. An-other linchpin in the land degradation surveillance framework (LDSF) is the use of infrared (IR) spectroscopy, which when combined with field baseline data on soils and vegetation, field infiltration tests and remote sensing data at various scales pro-vides a powerful tool for assessing soil condition over large ar-eas. In the current section, we present IR spectroscopy in more detail using results of our studies in the Segou region to illustrate some of the potential uses of these techniques.
In infrared spectroscopy, we shine light on a soil sample and re-cord how much of this light is absorbed at different wavelengths. This can be compared to taking a photograph, but using light that the human eye cannot detect. This analytical method is cheap and rapid, and can also be used directly in the field using hand-held devices.
Infrared (IR) spectroscopy
The use of IR spec-troscopy is an ap-proach where the vibration of specif-ic sets of chemical bonds is correlated to the absorption of electromagnetic radiation at specif-ic frequencies and forms the IR spectrum, as is given as the sum of the contrib-uting energy terms;
Etotal = Eelectronic + Evibrational + Erotational + Etranslational
The most important part of the spectrum for our purposes is the 690 to 3,000 nm region (near-infrared (NIR)), where the harmonic vibrations of the CH stretch fundamental and their corresponding combination bands occur. The molecule's vi-brational properties is considered to be a unique physical property of that molecule, and the IR spectrum can there-fore be used as a fingerprint which allows us to compare “unknown” spectra to previously recorded reference spec-tra. Quantitative NIR methods typically require the appli-cation of multivariate calibration algorithms and statistical methods to model the NIR response to chemical or physical properties of the previously recorded sample. These meth-ods are possible where changes in the response of the NIR are proportional to changes in the concentration of chemical components, or in the physical characteristics (scattering/ab-sorptive properties), of samples being analysed.
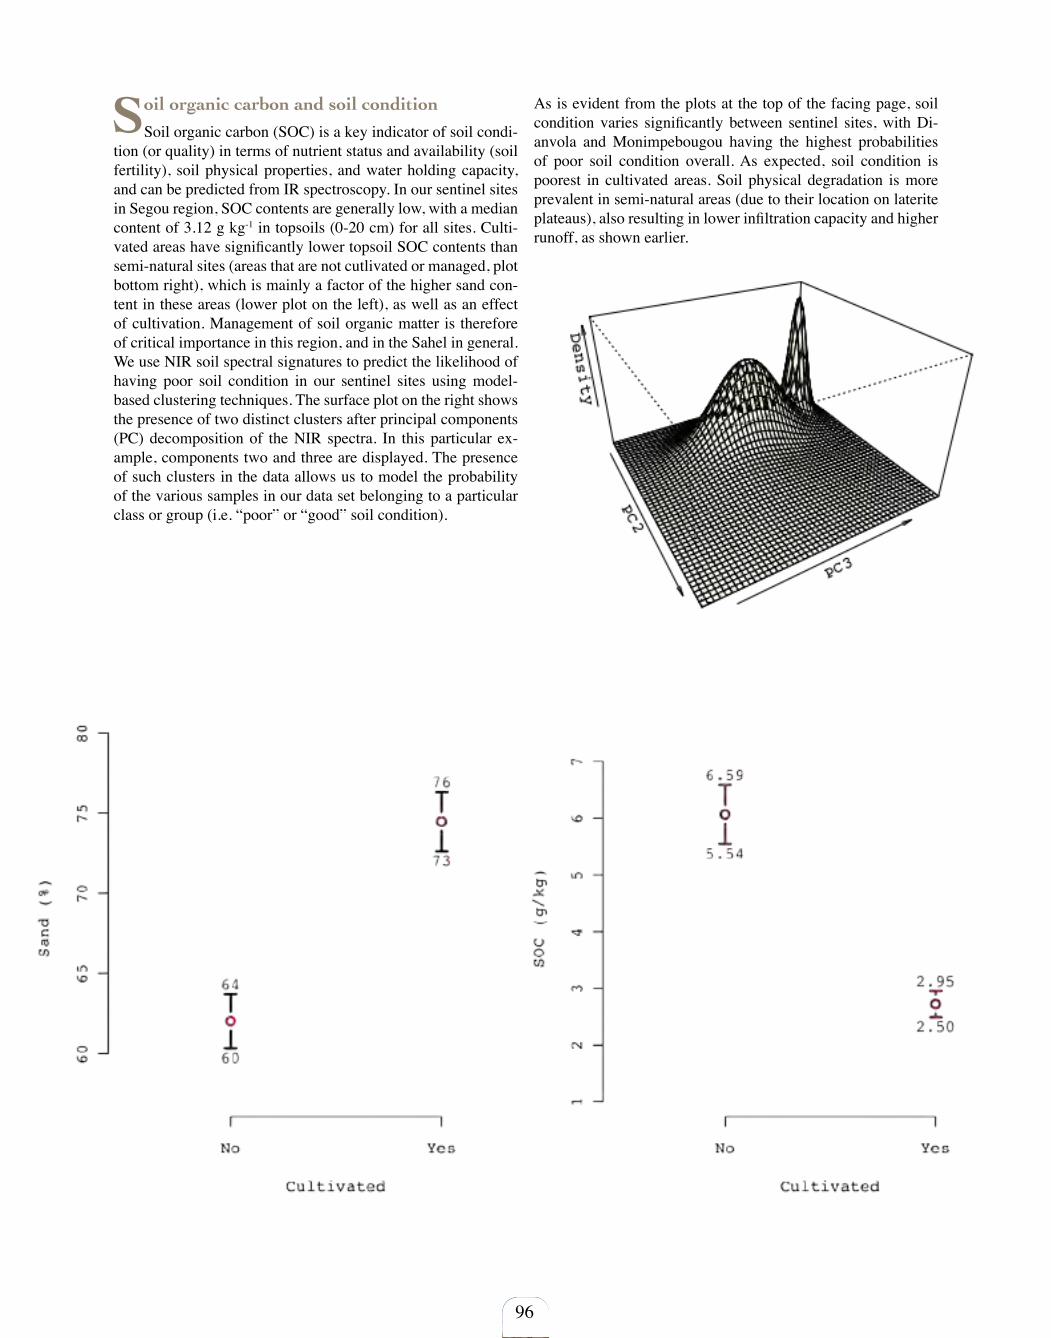
96
Soil organic carbon and soil condition
Soil organic carbon (SOC) is a key indicator of soil condi-tion (or quality) in terms of nutrient status and availability (soil fertility), soil physical properties, and water holding capacity, and can be predicted from IR spectroscopy. In our sentinel sites in Segou region, SOC contents are generally low, with a median content of 3.12 g kg-1 in topsoils (0-20 cm) for all sites. Culti-vated areas have significantly lower topsoil SOC contents than semi-natural sites (areas that are not cutlivated or managed, plot bottom right), which is mainly a factor of the higher sand con-tent in these areas (lower plot on the left), as well as an effect of cultivation. Management of soil organic matter is therefore of critical importance in this region, and in the Sahel in general. We use NIR soil spectral signatures to predict the likelihood of having poor soil condition in our sentinel sites using model-based clustering techniques. The surface plot on the right shows the presence of two distinct clusters after principal components (PC) decomposition of the NIR spectra. In this particular ex-ample, components two and three are displayed. The presence of such clusters in the data allows us to model the probability of the various samples in our data set belonging to a particular class or group (i.e. “poor” or “good” soil condition).
As is evident from the plots at the top of the facing page, soil condition varies significantly between sentinel sites, with Di-anvola and Monimpebougou having the highest probabilities of poor soil condition overall. As expected, soil condition is poorest in cultivated areas. Soil physical degradation is more prevalent in semi-natural areas (due to their location on laterite plateaus), also resulting in lower infiltration capacity and higher runoff, as shown earlier.
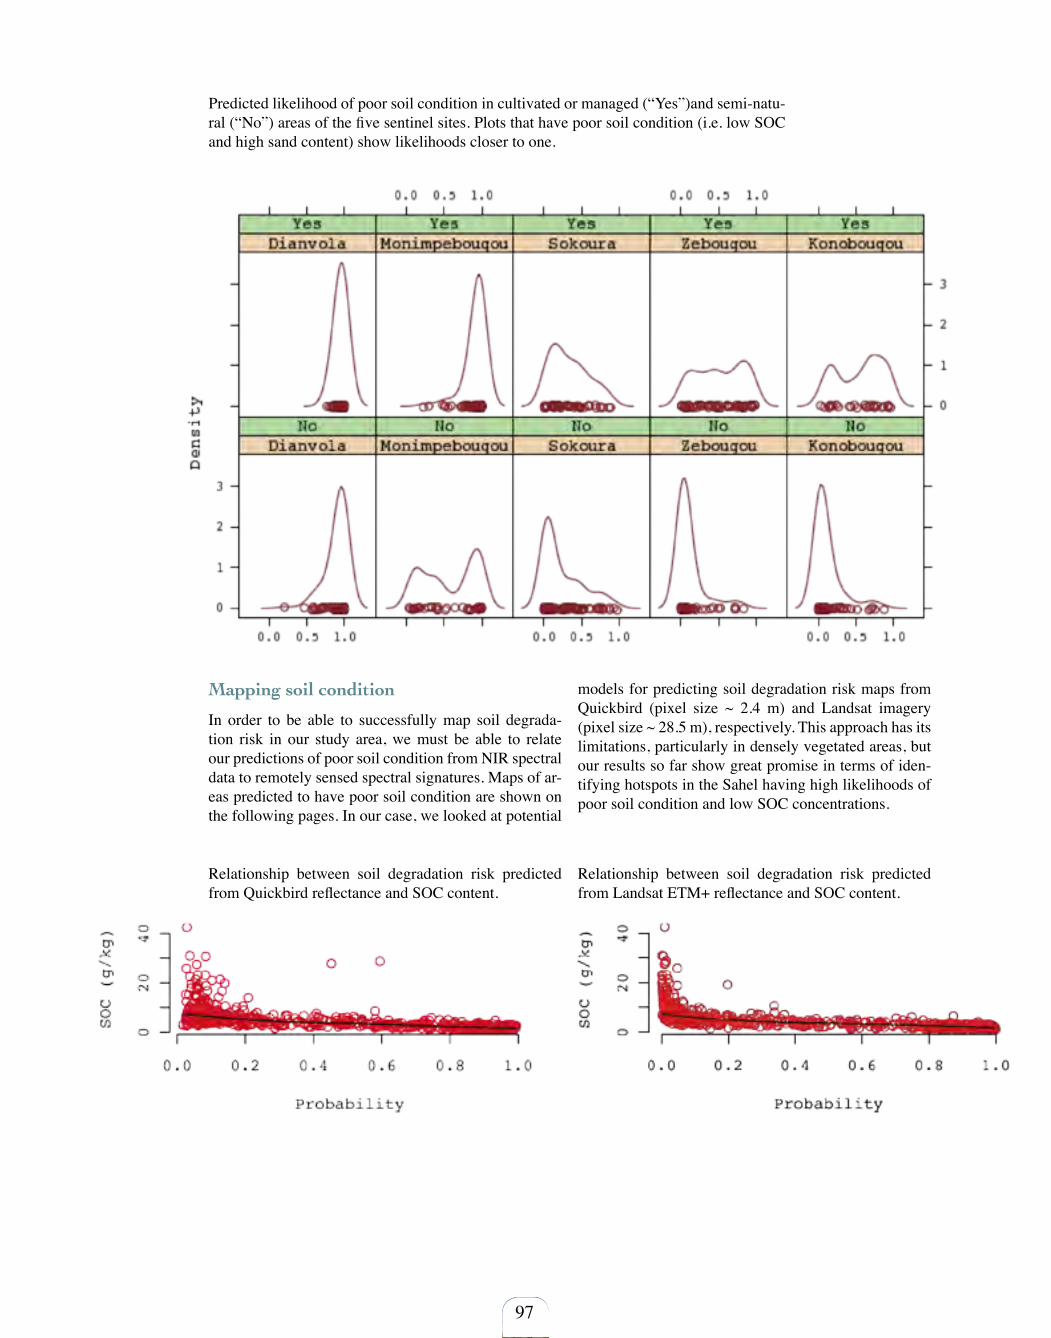
97
Predicted likelihood of poor soil condition in cultivated or managed (“Yes”)and semi-natu-ral (“No”) areas of the five sentinel sites. Plots that have poor soil condition (i.e. low SOC and high sand content) show likelihoods closer to one.
Mapping soil condition
In order to be able to successfully map soil degrada-tion risk in our study area, we must be able to relate our predictions of poor soil condition from NIR spectral data to remotely sensed spectral signatures. Maps of ar-eas predicted to have poor soil condition are shown on the following pages. In our case, we looked at potential
models for predicting soil degradation risk maps from Quickbird (pixel size ~ 2.4 m) and Landsat imagery (pixel size ~ 28.5 m), respectively. This approach has its limitations, particularly in densely vegetated areas, but our results so far show great promise in terms of iden-tifying hotspots in the Sahel having high likelihoods of poor soil condition and low SOC concentrations.
Relationship between soil degradation risk predicted from Quickbird reflectance and SOC content.
Relationship between soil degradation risk predicted from Landsat ETM+ reflectance and SOC content.

98
Above we show two examples of high resolution soil degradation risk maps based on Quickbird imagery from Zebougou and Konobougou, respectively. Yellow areas are soils with high risk of soil organic matter depletion and low soil fertility status. At this spatial scale (resolution ~ 2.4 m), farmers and advisory services can identify risk areas with a relatively high level of precision on the ground.
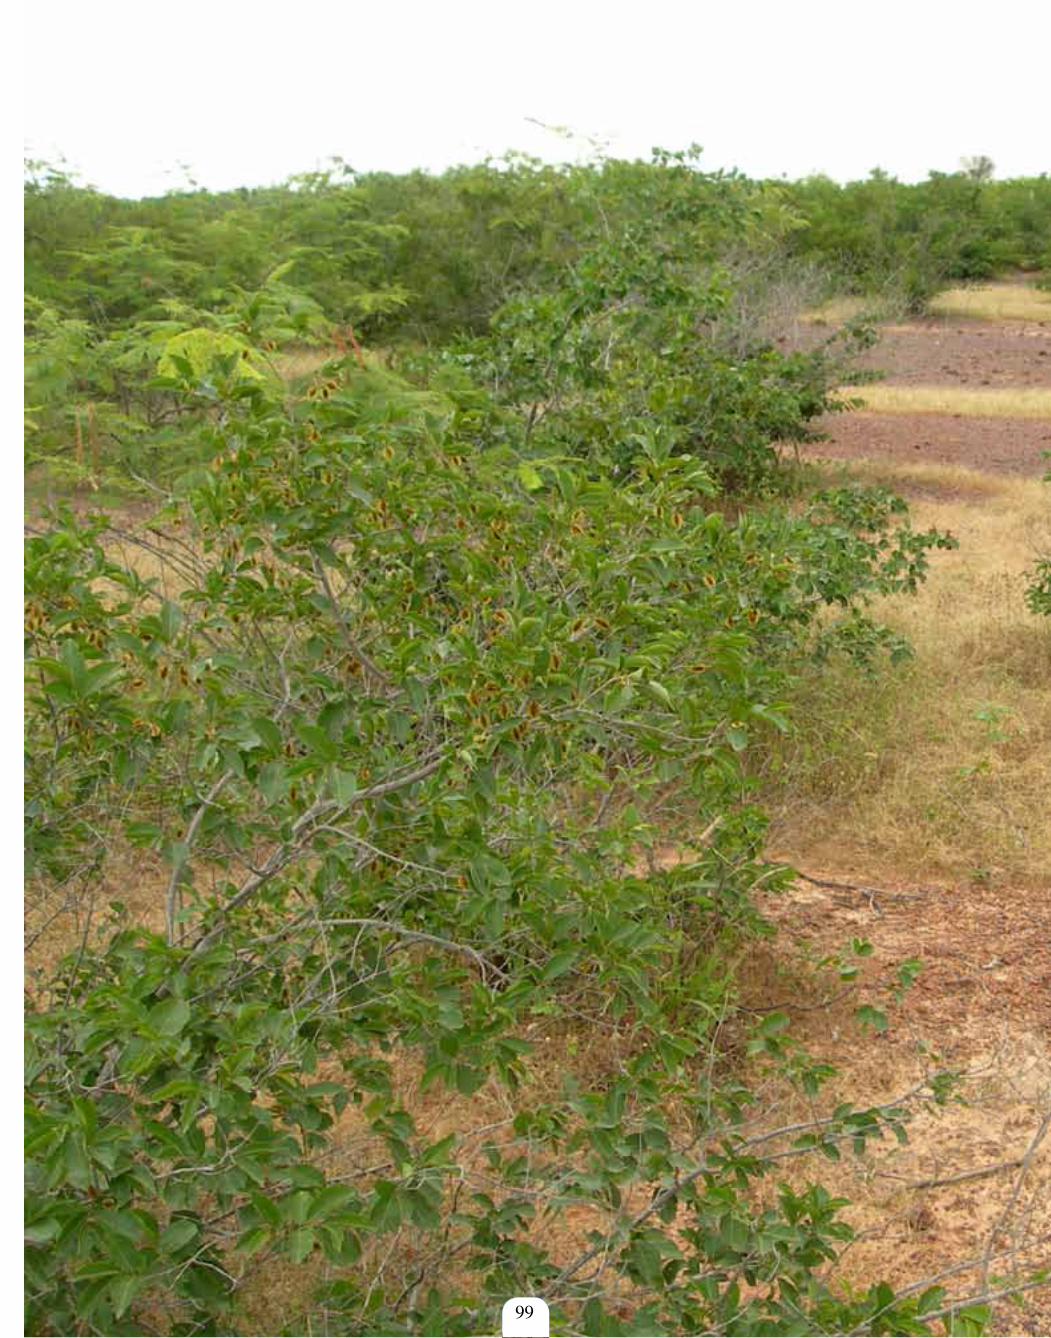
99
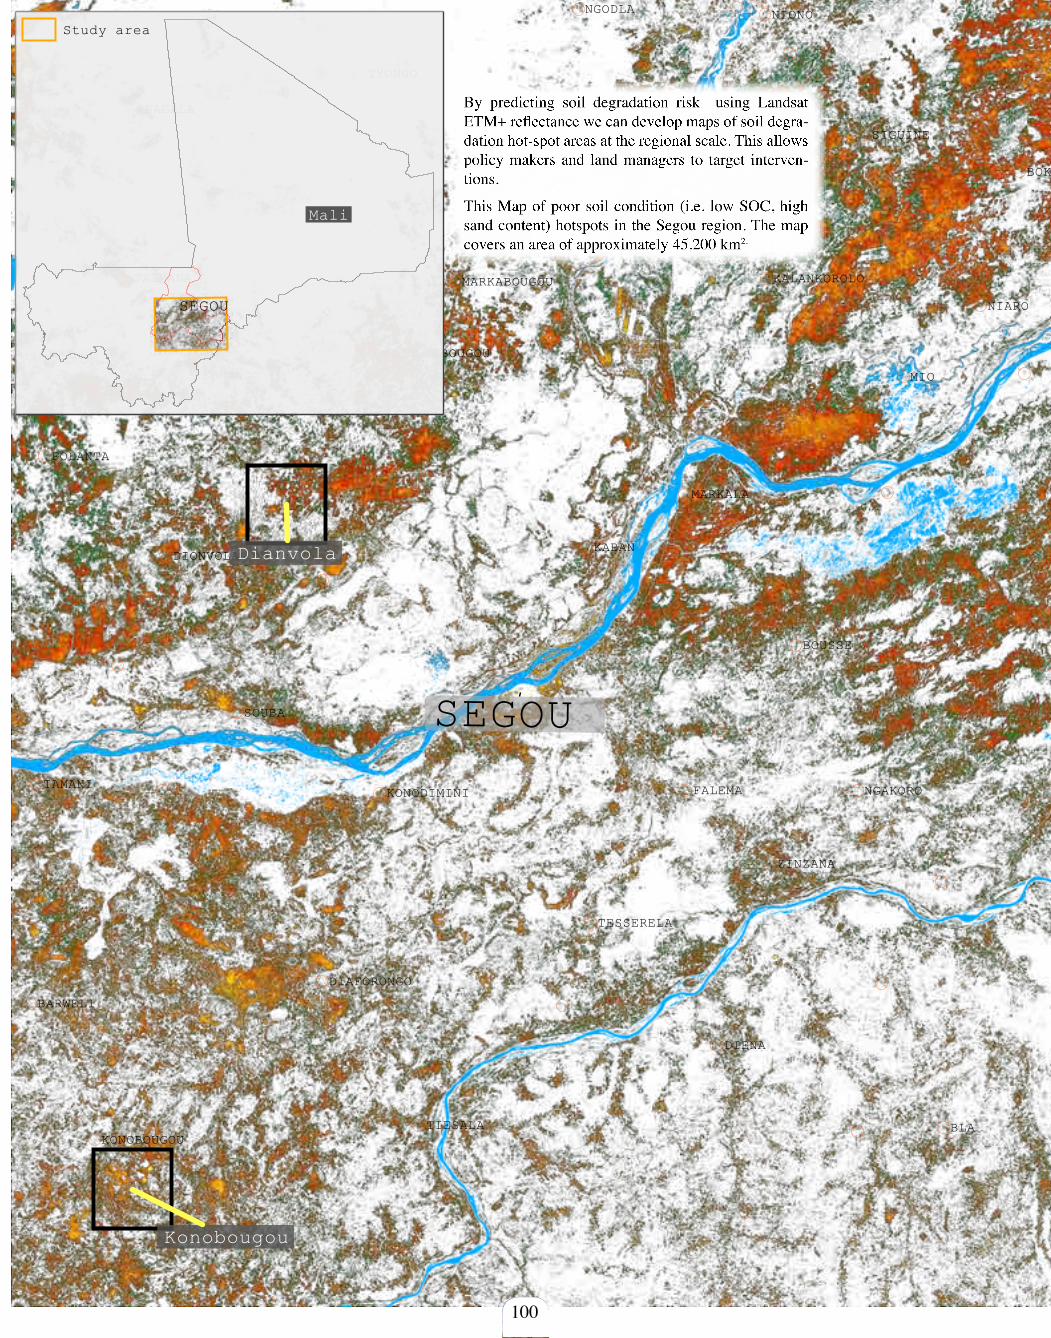
DIOWARA
MANSARAFALEMATAMANI
KATIENA
TESSERELA
KOLONI
NGAKOROKONODIMINI
ZINZANA
NOUGOURE
FANI
KOUARA
KANZANGASSO
DIAFORONGO
MANDJAKUI
YANGASSOBARWELI
NENESSODIENA
TIESALAKONOBOUGOU
BLA
KIMPARANA
SIGUINE
NIONO
YEBEMARKABOUGOU KALANKOROLOTAIMANA
NIARO
SOULEI
DIAFARABE
MIO
TENE
SAGALA
BOKI-WERETOUMAKORO
KOUIMASARO
KOMANTIEBOUGOU
MARKALA
KABAN
FOLANTA
ZANVALENA
SOUGOUBA
KE-MACINA
NGODLA
TYONGO
SOUBA
DJENNE
KOUAKOUROU
YOLO
DOLONGUEBOUGOU
SONANGO
DIONVOLATONGUE
MANIMPE
SAI
SIMINAFATIME
GANIA
BOUSSE TOGO
SEGOU
SAN
Sokoura
Zebougou
Monimpebougou
Dianvola
Konobougou
0 25 50 75 100 km
Mali
SEGOU
Study area
By predicting soil degradation risk using Landsat ETM+ reflectance we can develop maps of soil degra-dation hot-spot areas at the regional scale. This allows policy makers and land managers to target interven-tions.
This Map of poor soil condition (i.e. low SOC, high sand content) hotspots in the Segou region. The map covers an area of approximately 45,200 km2.
100
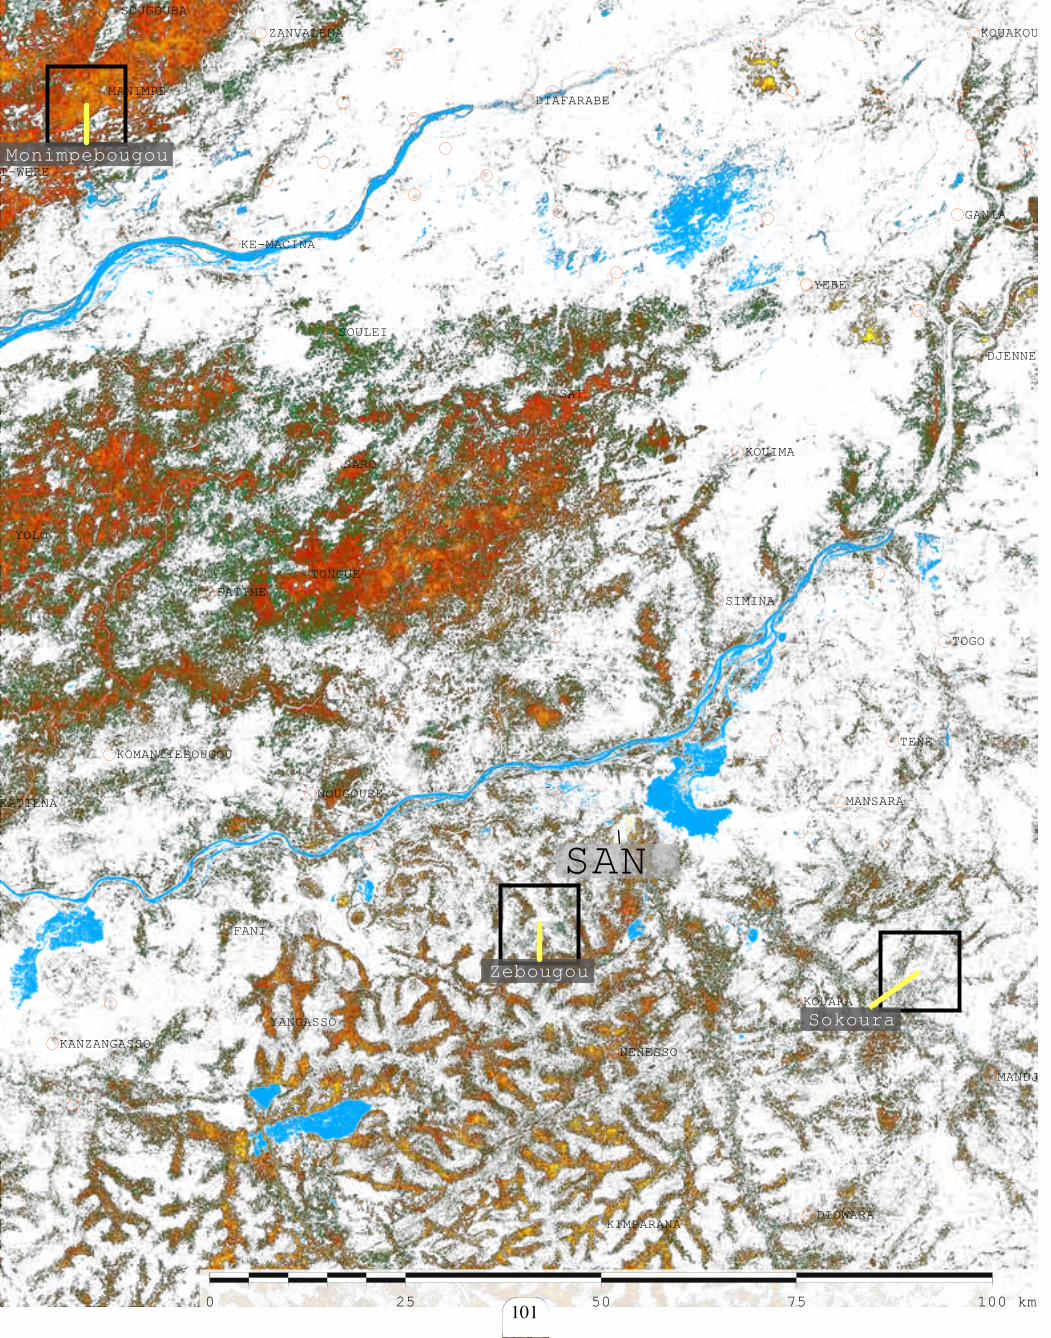
DIOWARA
MANSARAFALEMATAMANI
KATIENA
TESSERELA
KOLONI
NGAKOROKONODIMINI
ZINZANA
NOUGOURE
FANI
KOUARA
KANZANGASSO
DIAFORONGO
MANDJAKUI
YANGASSOBARWELI
NENESSODIENA
TIESALAKONOBOUGOU
BLA
KIMPARANA
SIGUINE
NIONO
YEBEMARKABOUGOU KALANKOROLOTAIMANA
NIARO
SOULEI
DIAFARABE
MIO
TENE
SAGALA
BOKI-WERETOUMAKORO
KOUIMASARO
KOMANTIEBOUGOU
MARKALA
KABAN
FOLANTA
ZANVALENA
SOUGOUBA
KE-MACINA
NGODLA
TYONGO
SOUBA
DJENNE
KOUAKOUROU
YOLO
DOLONGUEBOUGOU
SONANGO
DIONVOLATONGUE
MANIMPE
SAI
SIMINAFATIME
GANIA
BOUSSE TOGO
SEGOU
SAN
Sokoura
Zebougou
Monimpebougou
Dianvola
Konobougou
0 25 50 75 100 km
Mali
SEGOU
Study area
101
Using a combination of historical records, ground data and satellite imagery at various scales, this atlas has traced trends and variations in climate and veg-etation, relating these to soil condition and processes of land degradation in the Sahel. People in the Sahel have learnt to adapt their livelihood strategies to the extreme variations in climate and prevalent droughts in the region. However, there has been an unprec-edented increase in population density as well as demographic changes over the last half century that make it more difficult for people to adapt to changes in climate. A pertinent question is – how can liveli-hoods be sustained during the next drought cycle in the Sahel?
The last quarter century has seen increases in rain-fall over large parts of the Sahel, with subsequent regreening. This atlas suggests that farmers in the Sahel have not been able to utilize the increases in rainfall fully. This could be attributed to a lag in the response of farmers to more favorable rainfall condi-tions, or underlying land degradation that is trapping these ecosystems in a less favorable state for food production. There is still debate on whether the dry-land ecosystems of the Sahel have returned to their pre-drought functionality.
Future droughts are extremely likely to occur as the analysis of historical rainfall patterns indicate recur-ring droughts, the consequences of which can be catastrophic given less resilient societies and land degradation. Climate patterns are difficult to predict accurately, but if the 80-year rainfall cycle identified in this study continues, the next severe drought will hit the Sahel in only a decade or two.
A key question is how much influence man has had on climate through appropriation of vegetation. Is it possible that human caused changes in land cover, such as overgrazing and conversion of woodland to agriculture, have exacerbated the drought cycles by adversely reinforcing internal feedback processes?
The Great Green Wall initiative for re-greening of the Sahel in a corridor going from the Atlantic Ocean to the Red Sea is a potentially promising approach to increasing the resilience of these ecosystems to drought. Such initiatives also provide an opportu-
nity for further studies to better understand the rela-tionships between rainfall and vegetation on the one hand, and climate, land management and land degra-dation on the other.
Therefore, the imperative now is for close and con-sistent monitoring of climate, vegetation and land degradation to develop systems for better early warn-ing of droughts and for targeting land management interventions that can improve preparedness for fu-ture drought situations.
The atlas has demonstrated technology and tools for synoptic screening of vegetation changes at regional scale using rainfall normalized vegetation indices.
Continued monitoring using MODIS data offers good prospects for keeping a regional watch on greening and browning trends, to identify areas developing land degradation or its reversal, but this needs to be complimented with improved weather monitoring networks.
As demonstrated in this atlas, regional greening and browning trends are complex when investigated in more spatial and temporal detail. At coarse scales, several landscape elements compose one picture ele-ment (pixel), and a positive trend in in one ecosys-tem can be canceled out by changes in adjacent eco-systems. For instance a greening up of a floodplain might be out-shadowed by tree felling further ashore.
The only way to really understand what is going on is to build the picture bottom up through systematic sta-tistical ground sampling, such as demonstrated here through use of scientific concepts of land health sur-veillance, implemented through the Land Degrada-tion Surveillance Framework. Systematic sampling and observation of ground conditions can be com-bined with new technology for rapid soil character-ization and with fine to moderate resolution satellite imagery to provide powerful inference about soil, vegetation and socioeconomic conditions at local to regional scales. Investments in regional application of this approach will provide a sound scientific basis for understanding and managing climate-vegetation-management processes and feedbacks in the Sahel and elsewhere.
Epilogue
102
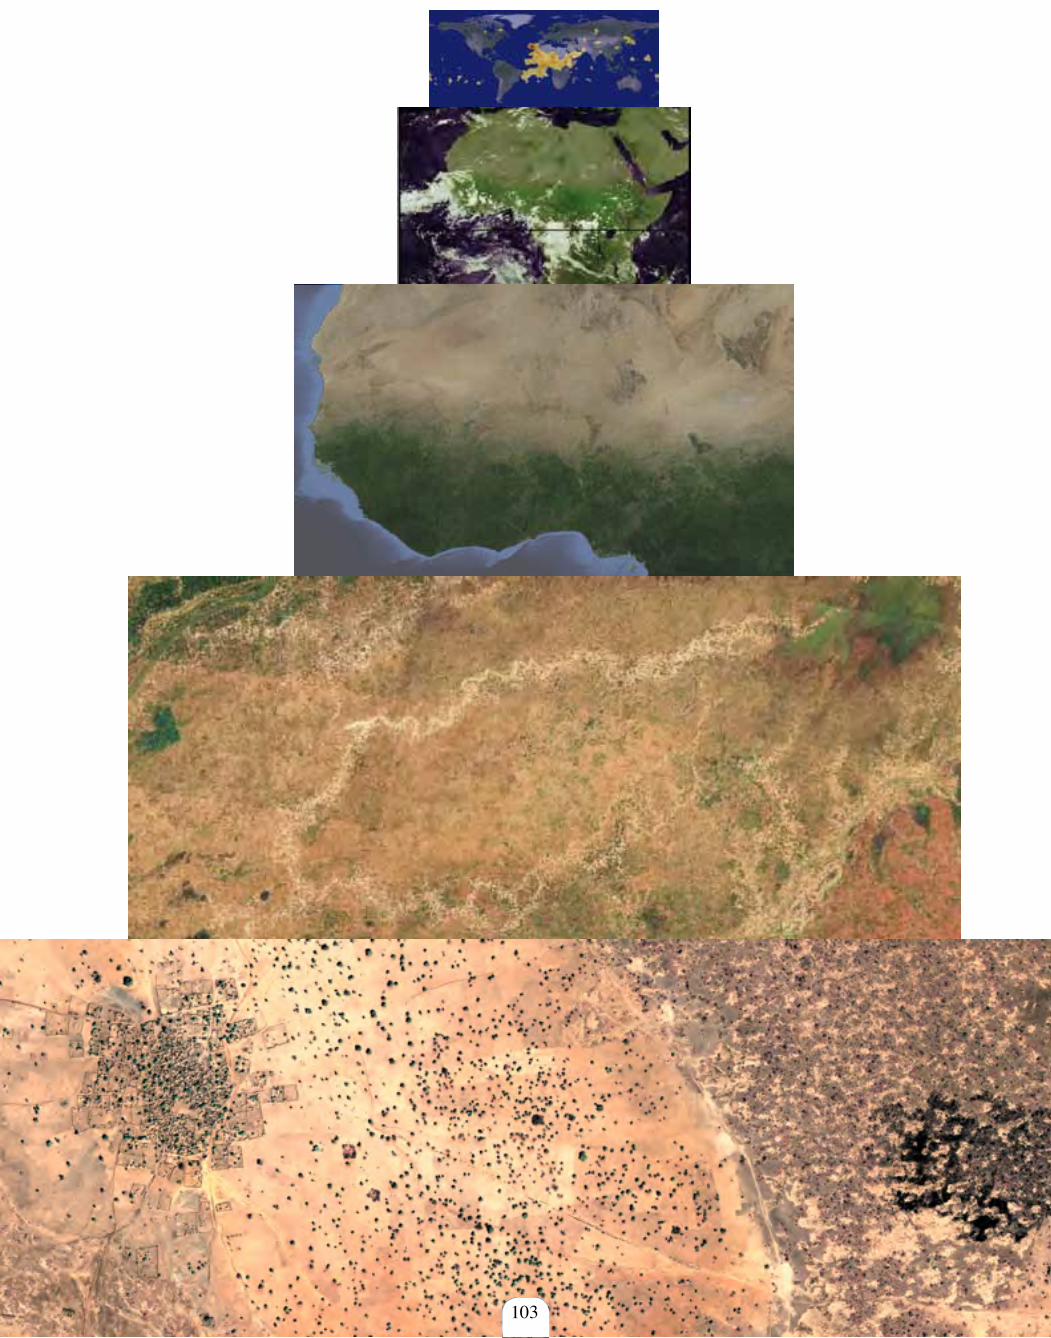
103

Sahel atlas of changing landscapes
tracing trends and variations in vegetation cover and soil condition
SAHEL ATLAS OF CHANGING LANDSCAPES
This atlas aims to illustrate a rigorous scientific basis for understanding processes of landscape change in the Sahel and describes landscapes, climate, vegetation, and trends in vegetation and soil health.
The atlas provides a pictorial overview of the application of land degradation surveillance – a science-based approach to land health monitoring and assessment. Systematic sampling and observation of ground conditions are combined with new technology for rapid soil characterization and with fine to moderate resolution satellite imagery to provide powerful inference about soil, vegetation and socioeconomic conditions at local to regional scales.
Investments in regional application of this approach will provide a sound scientific basis for understanding and managing climate-vegetation-management processes and feedbacks in the Sahel and elsewhere.


![Desertification in the Sahel - Vanderbilt University€¦ · Desertification in the Sahel 9/4/2015 1:33:22 PM] Map of the sahel in north Africa](https://img.pdfslide.us/doc/110x75/602cf1f134913e1a72530cc6/desertification-in-the-sahel-vanderbilt-university-desertification-in-the-sahel.jpg)