Embed Size (px)
Citation preview
LAND COVER CLASSIFICATION 2010
Ministry of Water & Environment,
National Forestry Authority,by
Edward SsenyonjoRemote Sensing Specialist
Joseph MutyabaCartography Specialist
25 February 2014
FAO-Rome, Italy
Where we have come from
Land cover 2005 (Before FRA trianing,02/13)•Heads up digitising
•Time consuming 2004 – 2009, •Very manual•Elements of human bias
Where we are
Land cover 2010 (After FRA trianing,02/13)•Computer aided digitizing
•Time saving: April 2013 – June 2014•Automated digitizing & classification•Assumed objectivity
Segmentation graphic
Where we want to go
• Land cover 2015 (in collaboration FRA)• Computer aided digitizing
• Saving more time: < 3 months• Sharable on-line and interactively eg CartoDB,
MapBox etc
Working with FRA•There are 17 global FRA samples (10x10km) in Uganda•Uganda is covered by 520 national tiles generated prior to the Feb 2013 training (20x20km).•The 520 were adjusted to 312 historical tiles by Dept of Lands & Surveys (27x27)•During FRA Training:
•The Ugandan team was introduced to Open Foris Geo-spatial Toolkit (OFGT)•OFGT is command line and script based (R, perl etc)•Semi-automated (both segmentation & classification) and •Very fast (on Ubuntu OS)
•The resultant land cover map & statistics concentrated on FAO FRA classes forests F, OWL, OL, H20•Uganda would like to include other classes(=13)
•So far OFGT is being used for data preparation i.e Image stacking and sub setting
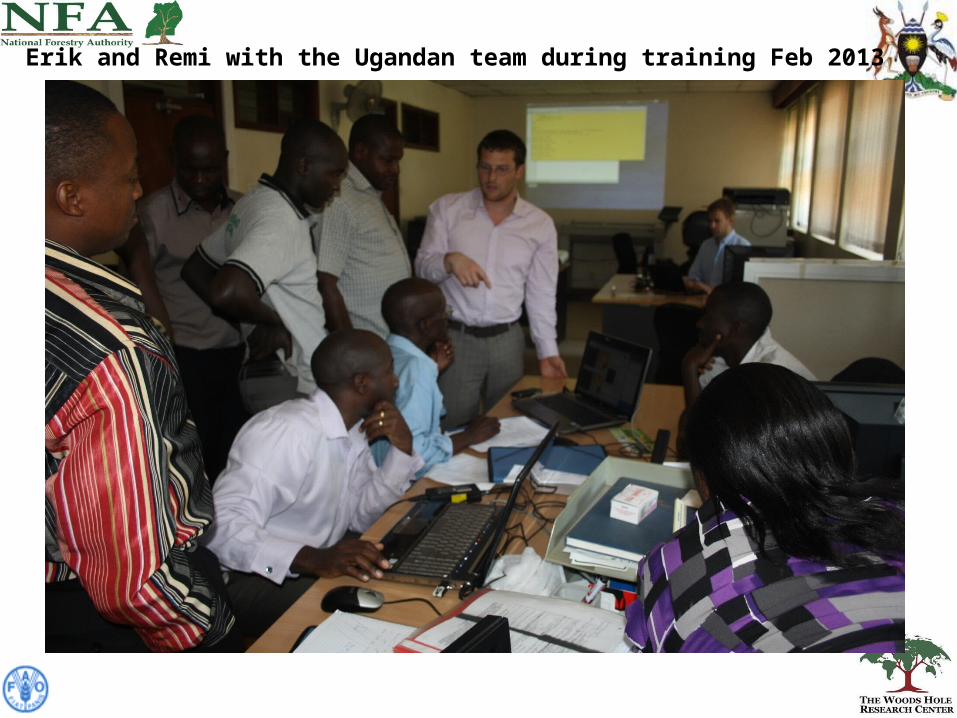
Erik and Remi with the Ugandan team during training Feb 2013
The team with trainers
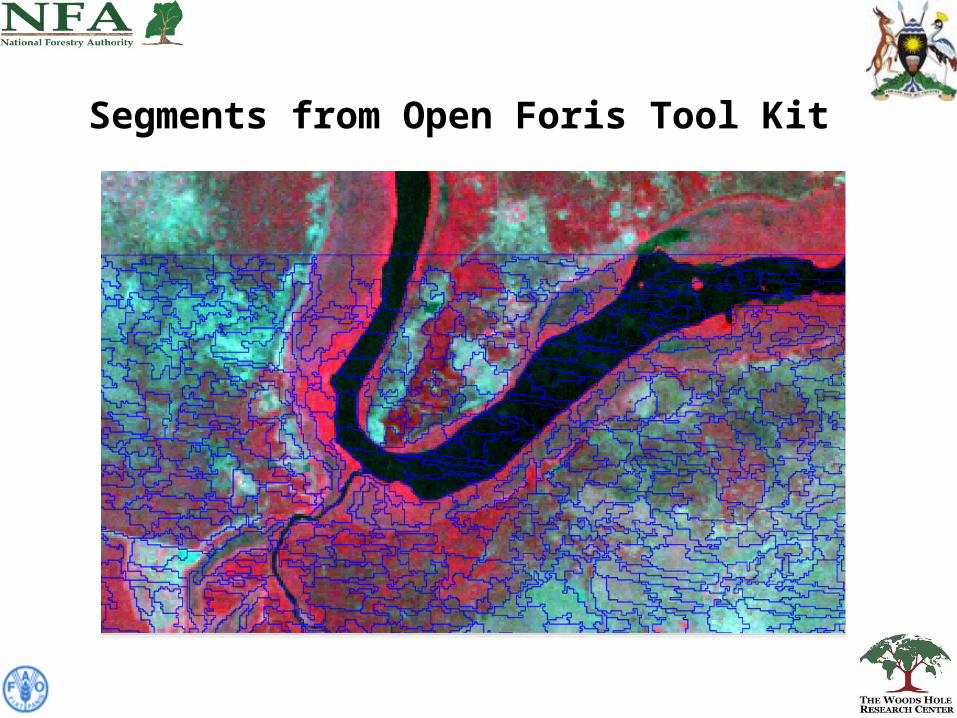
Segments from Open Foris Tool Kit
IMAGE SEGMENTATION WITH ORFEO TOOLBOX (OTB)
•OTB interface work on Windows, MacOS and Linux operating systems.•It too, is free Open Source software supported by the OSGeo4W•Has many modules –the segmentation module was used with the mean shift algorithms.•It has an advantage of producing very neat and interactive vector segments based on spatial radius, range radius and region size.
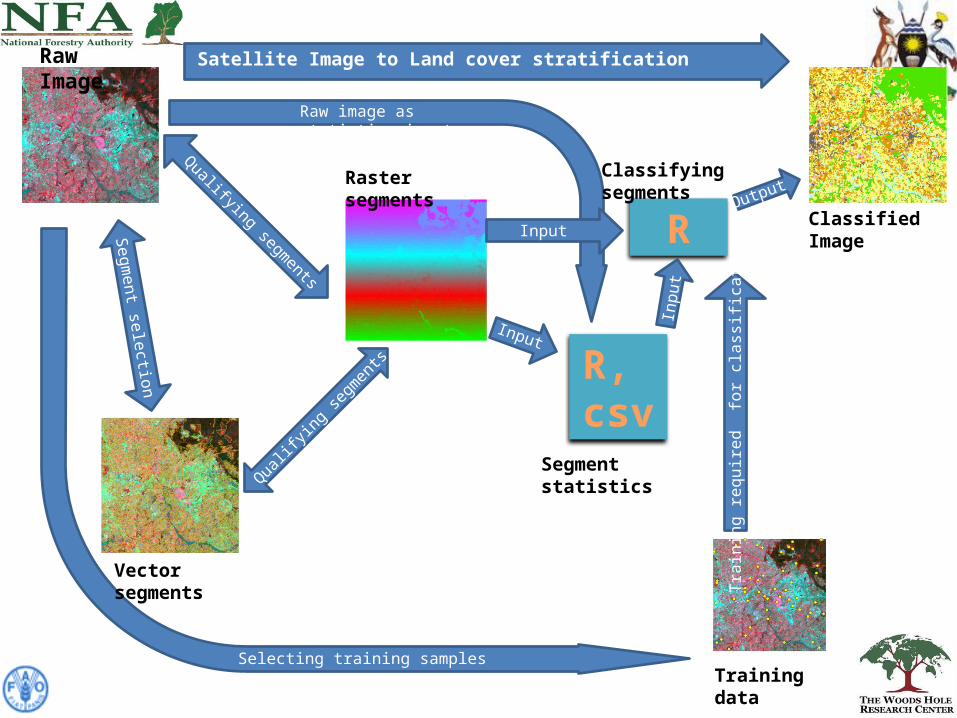
IMAGE CLASSIFICATION WITH R®
•After segmenting the raster with OTB, an R script is used to calculate
segment statistics using the raw image stack.
•a set of training points chosen from the image in form of a shapefile or x,
y data (in a csv or dbf table).
•These statistics and training data are then used in another R script to
classify the segments using the Random forest module so far up to 10
classes.
Note: The scripts were written by Ned Horning and Wynne Walker from Woods Hole
Research Centre, MA.
R, csv
R
Raw Image
Vector segments
Raster segments
Segment statistics
Classifying segments
Training data
Segment selection
Qualifying segments
Qualifying s
egments
Selecting training samples
Raw image as statistics input
Satellite Image to Land cover stratification
Trai
ning
requ
ired
for c
lass
ifica
tion
Input
Input
Inpu
t
Output
Classified Image
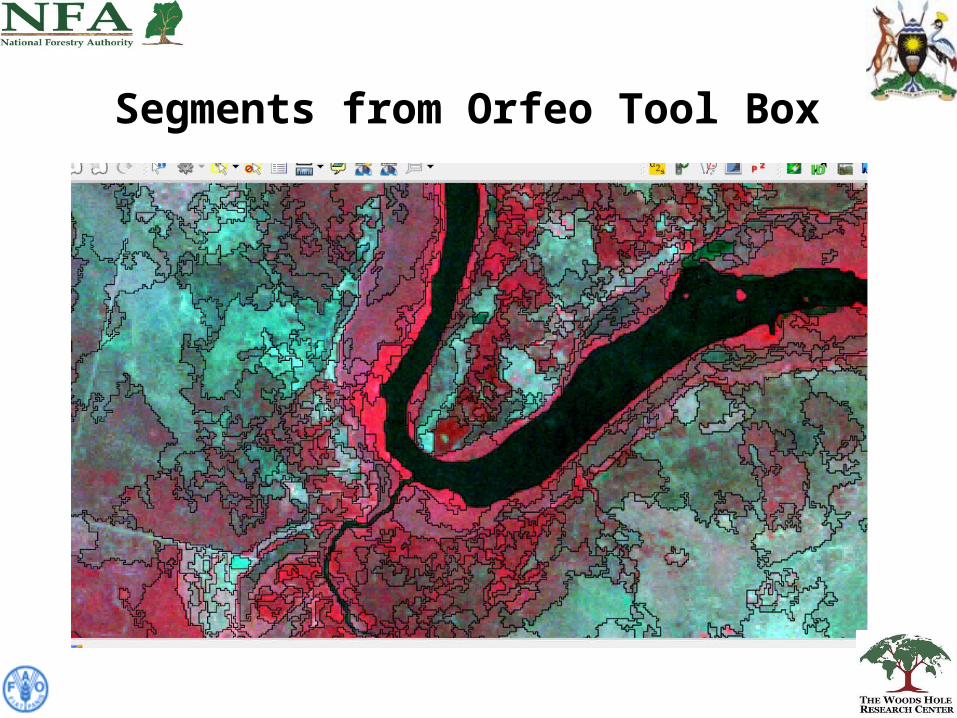
Segments from Orfeo Tool Box
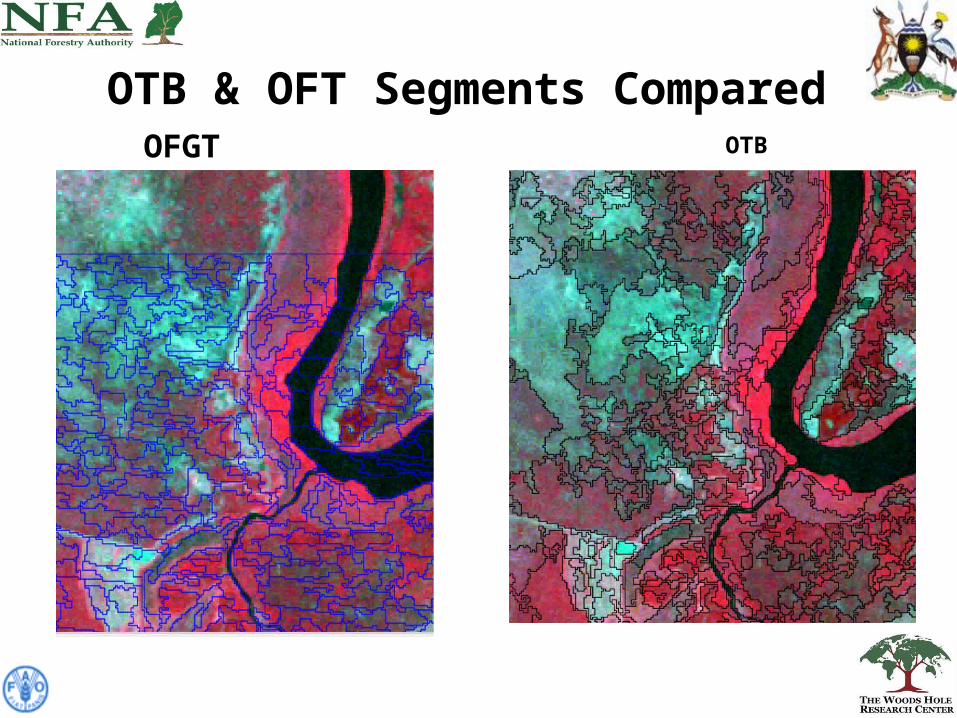
OTB & OFT Segments ComparedOFGT OTB
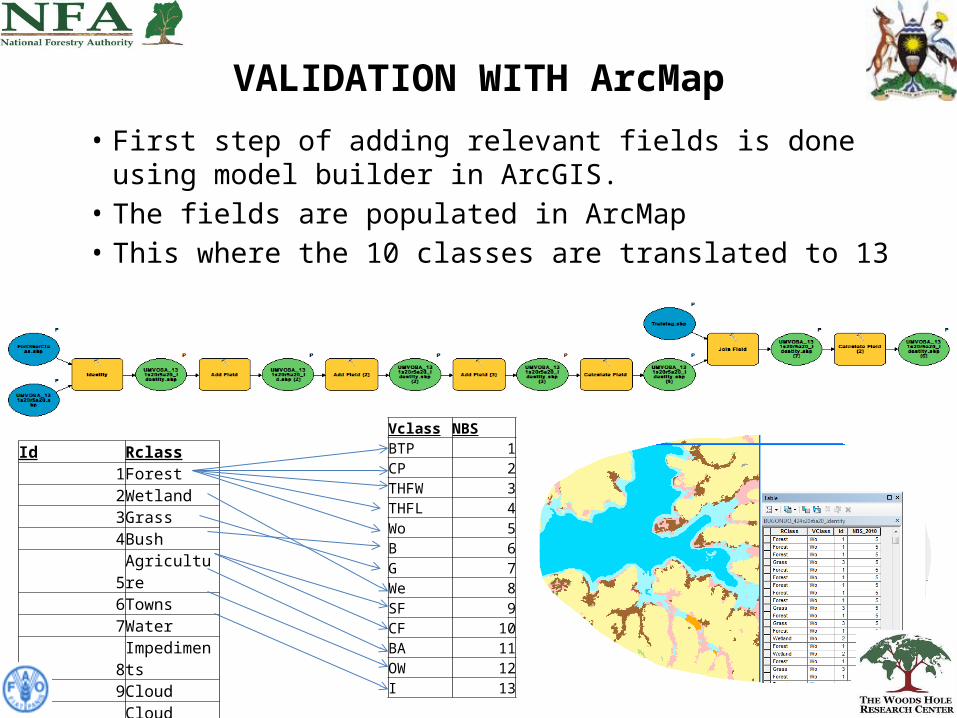
VALIDATION WITH ArcMap
• First step of adding relevant fields is done using model builder in ArcGIS.
• The fields are populated in ArcMap• This where the 10 classes are translated to 13
Id Rclass1Forest2Wetland3Grass4Bush5Agriculture6Towns7Water8Impediments9Cloud
10Cloud shadow
Vclass NBSBTP 1CP 2THFW 3THFL 4Wo 5B 6G 7We 8SF 9CF 10BA 11OW 12I 13
RESULTS &STATISTICS (Achievements)
• So far classified 94.55% of the country
• Generated statistics for 81% of the 312 tiles
• Validated 14% of the tiles
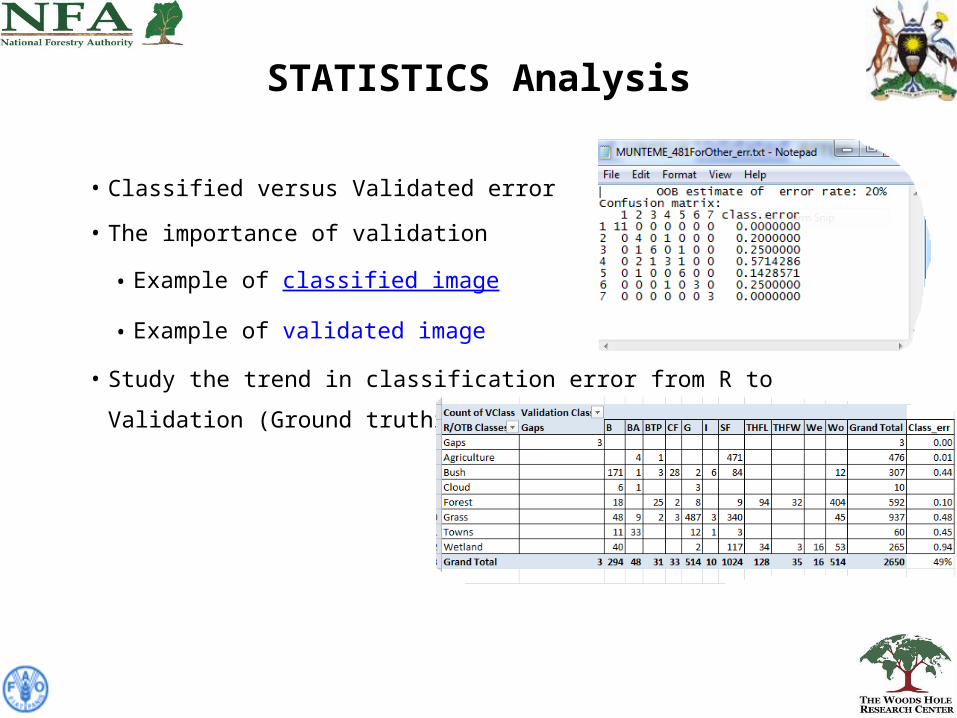
STATISTICS Analysis
• Classified versus Validated error
• The importance of validation
• Example of classified image
• Example of validated image
• Study the trend in classification error from R to Validation (Ground truthing)
CHALLENGES
• Steep Learning curve
• Cloud cover
• Topological (overlapping polygons & gaps)
• Difficulty in comparison of 2010 LC with previous LC datasets due to
the generalization of earlier datasets.
• Ability to edit rasters attributes to minimize usage of vectors and
there topological issues
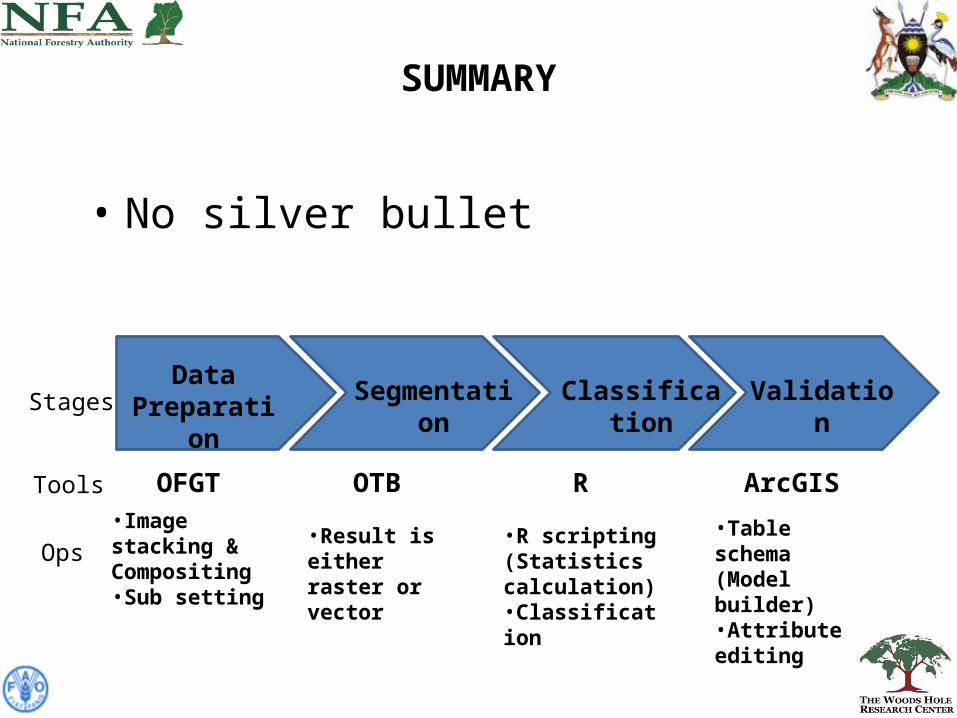
SUMMARY
• No silver bullet
Data Preparation Segmentation Classification Validation
•Image stacking & Compositing•Sub setting
•Result is either raster or vector
•R scripting (Statistics calculation)•Classification
•Table schema (Model builder)•Attribute editing
OFGT OTB R ArcGIS
Stages
Tools
Ops

Grazie !!