Embed Size (px)
Citation preview
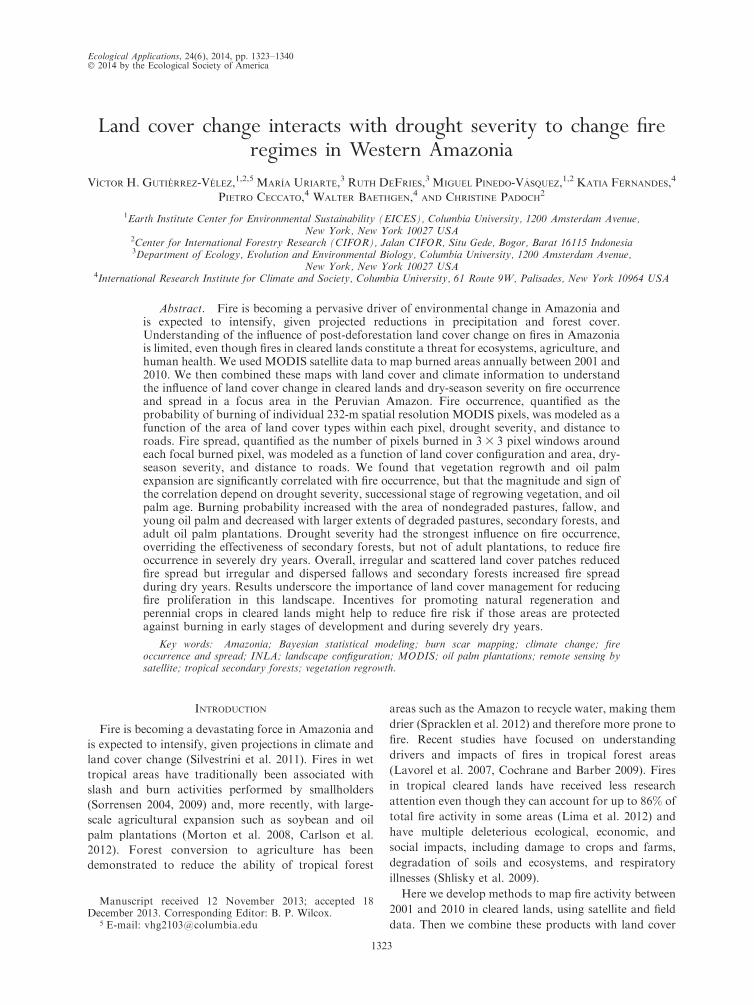
Ecological Applications, 24(6), 2014, pp. 1323–1340� 2014 by the Ecological Society of America
Land cover change interacts with drought severity to change fireregimes in Western Amazonia
VICTOR H. GUTIERREZ-VELEZ,1,2,5 MARIA URIARTE,3 RUTH DEFRIES,3 MIGUEL PINEDO-VASQUEZ,1,2 KATIA FERNANDES,4
PIETRO CECCATO,4 WALTER BAETHGEN,4 AND CHRISTINE PADOCH2
1Earth Institute Center for Environmental Sustainability (EICES), Columbia University, 1200 Amsterdam Avenue,New York, New York 10027 USA
2Center for International Forestry Research (CIFOR), Jalan CIFOR, Situ Gede, Bogor, Barat 16115 Indonesia3Department of Ecology, Evolution and Environmental Biology, Columbia University, 1200 Amsterdam Avenue,
New York, New York 10027 USA4International Research Institute for Climate and Society, Columbia University, 61 Route 9W, Palisades, New York 10964 USA
Abstract. Fire is becoming a pervasive driver of environmental change in Amazonia andis expected to intensify, given projected reductions in precipitation and forest cover.Understanding of the influence of post-deforestation land cover change on fires in Amazoniais limited, even though fires in cleared lands constitute a threat for ecosystems, agriculture, andhuman health. We used MODIS satellite data to map burned areas annually between 2001 and2010. We then combined these maps with land cover and climate information to understandthe influence of land cover change in cleared lands and dry-season severity on fire occurrenceand spread in a focus area in the Peruvian Amazon. Fire occurrence, quantified as theprobability of burning of individual 232-m spatial resolution MODIS pixels, was modeled as afunction of the area of land cover types within each pixel, drought severity, and distance toroads. Fire spread, quantified as the number of pixels burned in 3 3 3 pixel windows aroundeach focal burned pixel, was modeled as a function of land cover configuration and area, dry-season severity, and distance to roads. We found that vegetation regrowth and oil palmexpansion are significantly correlated with fire occurrence, but that the magnitude and sign ofthe correlation depend on drought severity, successional stage of regrowing vegetation, and oilpalm age. Burning probability increased with the area of nondegraded pastures, fallow, andyoung oil palm and decreased with larger extents of degraded pastures, secondary forests, andadult oil palm plantations. Drought severity had the strongest influence on fire occurrence,overriding the effectiveness of secondary forests, but not of adult plantations, to reduce fireoccurrence in severely dry years. Overall, irregular and scattered land cover patches reducedfire spread but irregular and dispersed fallows and secondary forests increased fire spreadduring dry years. Results underscore the importance of land cover management for reducingfire proliferation in this landscape. Incentives for promoting natural regeneration andperennial crops in cleared lands might help to reduce fire risk if those areas are protectedagainst burning in early stages of development and during severely dry years.
Key words: Amazonia; Bayesian statistical modeling; burn scar mapping; climate change; fireoccurrence and spread; INLA; landscape configuration; MODIS; oil palm plantations; remote sensing bysatellite; tropical secondary forests; vegetation regrowth.
INTRODUCTION
Fire is becoming a devastating force in Amazonia and
is expected to intensify, given projections in climate and
land cover change (Silvestrini et al. 2011). Fires in wet
tropical areas have traditionally been associated with
slash and burn activities performed by smallholders
(Sorrensen 2004, 2009) and, more recently, with large-
scale agricultural expansion such as soybean and oil
palm plantations (Morton et al. 2008, Carlson et al.
2012). Forest conversion to agriculture has been
demonstrated to reduce the ability of tropical forest
areas such as the Amazon to recycle water, making them
drier (Spracklen et al. 2012) and therefore more prone to
fire. Recent studies have focused on understanding
drivers and impacts of fires in tropical forest areas
(Lavorel et al. 2007, Cochrane and Barber 2009). Fires
in tropical cleared lands have received less research
attention even though they can account for up to 86% of
total fire activity in some areas (Lima et al. 2012) and
have multiple deleterious ecological, economic, and
social impacts, including damage to crops and farms,
degradation of soils and ecosystems, and respiratory
illnesses (Shlisky et al. 2009).
Here we develop methods to map fire activity between
2001 and 2010 in cleared lands, using satellite and field
data. Then we combine these products with land cover
Manuscript received 12 November 2013; accepted 18December 2013. Corresponding Editor: B. P. Wilcox.
5 E-mail: [email protected]
1323

and drought severity data to understand the influence of
changes in land cover composition and configuration as
well as drought severity on fire occurrence and spread.
The study takes place in a landscape undergoing rapid
land cover and demographic changes, located near the
city of Pucallpa in the Peruvian Amazon, where escaped
fires from agricultural management have been identified
as a growing problem for local communities and
ecosystems (Brown et al. 2006, Gobierno Regional de
Ucayali 2006).
Fire activity in Amazonia has been almost consistent-
ly found to occur predominantly in deforested areas
(Aragao et al. 2008, Aragao and Shimabukuro 2010,
Lima et al. 2012, Uriarte et al. 2012, Vasconcelos et al.
2013). However, little is known about how land cover
changes in deforested lands influence fire activity in the
region. Analyzing correlations between temporal chang-
es in forest cover and fire frequency in 0.258-grid cells in
the Brazilian Amazon, Aragao and Shimabukuro (2010)
found that fire frequency increased in pixels with
slowing deforestation rates. They speculated that this
pattern was the result of slash and burn activities in
secondary forests and landscape fragmentation. In the
Peruvian Amazon, fire occurrence correlated positively
with the area of croplands and pastures at the regional
scale, whereas at the local scale, in the area of Pucallpa,
shrub-dominated land covers were the most fire-prone
vegetation types (Uriarte et al. 2012). Negative correla-
tion between the area in fallows and rural population
density suggested that higher fire activity is related to a
depopulation trend in rural landscapes that reduces the
ability of remaining households to control fires.
At the plot level, Uhl and Kauffman (1990) combined
field measurements and fire simulations to evaluate fire
susceptibility in plots representing a human-induced
vegetation sequence in Paragominas (Brazil), from
forest to logged forests to pastures and then to
secondary forests. Simulations considered differences
in fuel availability, microclimate, and rates of fuel
moisture loss. They found that flammability was low in
old-growth forests, even during prolonged drought, but
that logging made forests flammable after 5–6 rainless
days within the dry season. Secondary forests were less
fire prone than logged forests, becoming flammable after
8–10 days of no rain. Pastures were the most flammable
land cover and were susceptible to fire throughout most
of the dry season. The work of Uhl and Kauffman
(1990) provided important background on the relation-
ship between land cover changes and fire. Yet, empirical
evidence of the extent to which land covers representing
different stages of development in deforested areas
inhibit or promote fire is limited.
The establishment of permanent agriculture can
reduce flammability, given the lower fire use in this
system compared to slash and burn agriculture and the
higher economic value ascribed to these cultivations
(Nepstad et al. 2001, Sorrensen 2004, Lavorel et al.
2007, Barlow et al. 2012). Yet, empirical evidence of the
relative influence of perennial agriculture on fire
occurrence and spread compared to regrowing vegeta-
tion is scarce. In the Brazilian Amazon, Aragao and
Shimabukuro (2010) found that areas with lower
proportions of intensive agriculture had a higher fire
incidence than those covered by a similar proportion of
total agriculture (both intensive and extensive). Howev-
er, as the area covered by intensive agriculture increased,
fire incidence declined compared to areas with similar
proportions of total agriculture, which maintained
higher fire incidence. The authors attributed these
differences to a lower fire use and a reduction in fuel
loads in areas dominated by intensive agriculture.
Drought has been identified as one of the most
relevant drivers of fire activity in the Amazon (Aragao et
al. 2008, Fernandes et al. 2011, Uriarte et al. 2012,
Vasconcelos et al. 2013) and might explain spatial and
temporal differences in the contribution of different land
covers to fires. For instance, drought severity can double
fire risk in areas predominantly covered by agricultural
fields in western Amazonia (Uriarte et al. 2012). Yet
knowledge is scarce about the extent to which variations
in drought modulate the relative influence of land covers
representing different stages of vegetation regrowth and
perennial agriculture on fire activity.
The specific questions that we address here are as
follows. (1) How do land covers representing different
stages of regrowth and oil palm development and their
configuration in the landscape influence fire occurrence
and spread? (2) How does interannual drought variabil-
ity modify the influence of the different land covers on
fire? (3) Can an understanding of the combined effect of
land cover change and drought severity on fire help to
devise strategies for reducing landscape flammability in
the study region?
METHODS
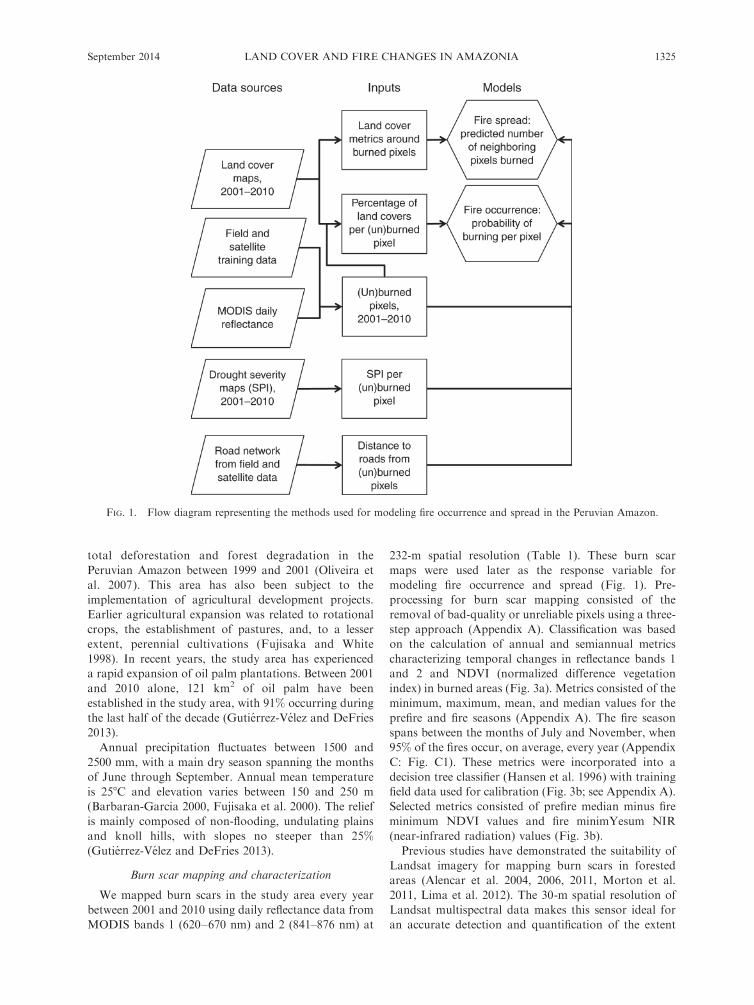
We mapped burned areas annually and combined the
maps with annual data from previous studies about land
cover (Gutierrez-Velez and DeFries 2013) and drought
severity (Fernandes et al. 2011) to model fire occurrence
and spread in a focus area near the city of Pucallpa (Fig.
1). We now describe the study area, methods developed
for burn scar mapping, the other data sets used in the
analysis, and the approaches for modeling fire occur-
rence and spread.
Study area
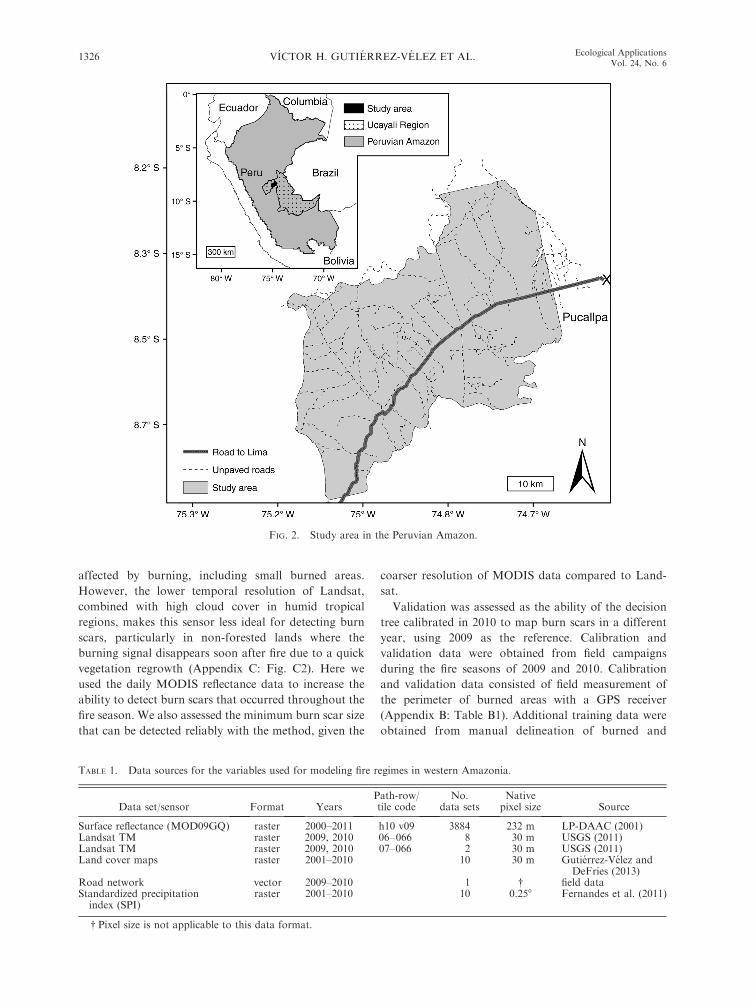
The study comprises an area of 2158 km2 around the
city of Pucallpa, Peru (Fig. 2). This area has experienced
one of the fastest socioeconomic and environmental
changes in the Peruvian Amazon. The opening in the
1960s of the highway connecting Pucallpa with Lima,
the capital of the country, and the dense road network
that emanates from there, triggered a fast process of
immigration, agricultural development, and landscape
transformation that persists to this day (Uriarte et al.
2012). The area around Pucallpa accounted for 64% of
VICTOR H. GUTIERREZ-VELEZ ET AL.1324 Ecological ApplicationsVol. 24, No. 6
total deforestation and forest degradation in the
Peruvian Amazon between 1999 and 2001 (Oliveira et
al. 2007). This area has also been subject to the
implementation of agricultural development projects.
Earlier agricultural expansion was related to rotational
crops, the establishment of pastures, and, to a lesser
extent, perennial cultivations (Fujisaka and White
1998). In recent years, the study area has experienced
a rapid expansion of oil palm plantations. Between 2001
and 2010 alone, 121 km2 of oil palm have been
established in the study area, with 91% occurring during
the last half of the decade (Gutierrez-Velez and DeFries
2013).
Annual precipitation fluctuates between 1500 and
2500 mm, with a main dry season spanning the months
of June through September. Annual mean temperature
is 258C and elevation varies between 150 and 250 m
(Barbaran-Garcia 2000, Fujisaka et al. 2000). The relief
is mainly composed of non-flooding, undulating plains
and knoll hills, with slopes no steeper than 25%(Gutierrez-Velez and DeFries 2013).
Burn scar mapping and characterization
We mapped burn scars in the study area every year
between 2001 and 2010 using daily reflectance data from
MODIS bands 1 (620–670 nm) and 2 (841–876 nm) at
232-m spatial resolution (Table 1). These burn scar
maps were used later as the response variable for
modeling fire occurrence and spread (Fig. 1). Pre-
processing for burn scar mapping consisted of the
removal of bad-quality or unreliable pixels using a three-
step approach (Appendix A). Classification was based
on the calculation of annual and semiannual metrics
characterizing temporal changes in reflectance bands 1
and 2 and NDVI (normalized difference vegetation
index) in burned areas (Fig. 3a). Metrics consisted of the
minimum, maximum, mean, and median values for the
prefire and fire seasons (Appendix A). The fire season
spans between the months of July and November, when
95% of the fires occur, on average, every year (Appendix
C: Fig. C1). These metrics were incorporated into a
decision tree classifier (Hansen et al. 1996) with training
field data used for calibration (Fig. 3b; see Appendix A).
Selected metrics consisted of prefire median minus fire
minimum NDVI values and fire minimYesum NIR
(near-infrared radiation) values (Fig. 3b).
Previous studies have demonstrated the suitability of
Landsat imagery for mapping burn scars in forested
areas (Alencar et al. 2004, 2006, 2011, Morton et al.
2011, Lima et al. 2012). The 30-m spatial resolution of
Landsat multispectral data makes this sensor ideal for
an accurate detection and quantification of the extent
FIG. 1. Flow diagram representing the methods used for modeling fire occurrence and spread in the Peruvian Amazon.
September 2014 1325LAND COVER AND FIRE CHANGES IN AMAZONIA
affected by burning, including small burned areas.
However, the lower temporal resolution of Landsat,
combined with high cloud cover in humid tropical
regions, makes this sensor less ideal for detecting burn
scars, particularly in non-forested lands where the
burning signal disappears soon after fire due to a quick
vegetation regrowth (Appendix C: Fig. C2). Here we
used the daily MODIS reflectance data to increase the
ability to detect burn scars that occurred throughout the
fire season. We also assessed the minimum burn scar size
that can be detected reliably with the method, given the
coarser resolution of MODIS data compared to Land-
sat.
Validation was assessed as the ability of the decision
tree calibrated in 2010 to map burn scars in a different
year, using 2009 as the reference. Calibration and
validation data were obtained from field campaigns
during the fire seasons of 2009 and 2010. Calibration
and validation data consisted of field measurement of
the perimeter of burned areas with a GPS receiver
(Appendix B: Table B1). Additional training data were
obtained from manual delineation of burned and
FIG. 2. Study area in the Peruvian Amazon.
TABLE 1. Data sources for the variables used for modeling fire regimes in western Amazonia.
Data set/sensor Format YearsPath-row/tile code
No.data sets
Nativepixel size Source
Surface reflectance (MOD09GQ) raster 2000–2011 h10 v09 3884 232 m LP-DAAC (2001)Landsat TM raster 2009, 2010 06–066 8 30 m USGS (2011)Landsat TM raster 2009, 2010 07–066 2 30 m USGS (2011)Land cover maps raster 2001–2010 10 30 m Gutierrez-Velez and
DeFries (2013)Road network vector 2009–2010 1 � field dataStandardized precipitation
index (SPI)raster 2001–2010 10 0.258 Fernandes et al. (2011)
� Pixel size is not applicable to this data format.
VICTOR H. GUTIERREZ-VELEZ ET AL.1326 Ecological ApplicationsVol. 24, No. 6

unburned areas in Landsat scenes acquired from three
dates spread along the fire seasons of 2009 and 2010
(Table 1; see Appendices A and B: Table B1). Burned
areas that were measured in the field but also delineated
visually were counted once and the data from the visual
delineation were preferred. We prioritized the visual
delineation to assure the inclusion of the whole area
burned, considering that some burnings were still active
during the field measurements.
We also used data from the MODIS active fire
product (MOD14A1) as a benchmark against which
improvements in fire mapping were compared. The
purpose of the comparison was to select the most
suitable product for implementing the fire models based
on accuracy. Comparison was performed in terms of the
overall error and the number of events and area detected
per size classes by our method vs. the active fire product,
using our training data as the reference. An event was
deemed as detected if the mapped burned area or the
active fire product covered the majority of the validation
events collected for 2009.
We compared our results with the active fire product
because it was the most reliable alternative data source
for our analysis. Other standard fire products such as the
MODIS burned area (Roy et al. 2008), the Direct
Broadcast Monthly Burned Area Product (Giglio et al.
2009), or the global VGT burnt area product (European
Commission 2012) were less suitable because they
registered no areas burned in the study area during the
period of analysis. The active fire product has been also
widely used in previous applications for fire modeling
and analysis (Siljander 2009, Dlamini 2010, Le Page et
al. 2010, Hawbaker et al. 2013, Vasconcelos et al. 2013).
Additional field data were collected and analyzed in
order to discuss some of the modeling results in light of
the fire typologies that were likely to be captured in the
burn scar maps. Data consisted of field measurements of
13 areas burned for agricultural management and 26
escaped fires in 2009. This information was used to
calculate the area of both types of burnings per size
classes. We also used data from 732 semi-structured
interviews performed in 37 communities between 2010
and 2011 in the study area (Uriarte et al. 2012) to assess
the frequency with which rural residents reported
different land covers to be affected by escaped fires in
their properties.
Other input data
Land cover.—Land cover classification maps for every
year between 2001 and 2010 were obtained from a
previous study using remote sensing data from Landsat
and ALOS-PALSAR (Gutierrez-Velez and DeFries
2013). Land cover maps were used to calculate one of
the covariates for the fire occurrence and spread models
consisting of the proportion of land covers in burned
and unburned pixels every year (Fig. 1). Land cover/use
categories consist of water bodies, non-vegetated lands,
degraded pastures, pastures, fallow, secondary forests,
primary forests, and oil palm plantations. Water bodies
comprise lakes and rivers. Non-vegetated lands consist
mostly of sand deposits along rivers, built and barren
areas, and some recently cleared or burned lands.
Degraded pastures are mostly composed of short,
scattered grasses intermixed with patches of exposed
soil, mainly as the result of overgrazing. This land cover
can also include some areas of resprouting herbaceous
vegetation after recent burnings. Pastures comprise
areas with tall herbaceous vegetation, dominated mostly
by brachiaria (Brachiaria sp.), Imperata brasiliensis, and
mixed native weed species. Pastures also include some
areas of grasses intermixed with small shrubs. Areas of
fallow are dominated by bushes and represent early
stages of tree succession, with ages of 2–3 years. In
contrast, secondary forests typify more advanced stages
FIG. 3. (a) Typical pattern of temporal changes in NDVI(normalized difference vegetation index) in burned andunburned areas in the study area using daily MODISreflectance data. This pattern was used as the rationale fordeveloping burn scar classification methods and does notrepresent average values. Dots indicate the data used afterremoving unreliable pixels. A moving-average interpolation wasadded to each time series for visualization purposes. (b)Decision tree used to classify burned and unburned pixels inthe study area using fire NIR (near-infrared radiation) andNDVI. Variables are scaled for a range between 0 and 1000.
September 2014 1327LAND COVER AND FIRE CHANGES IN AMAZONIA

of regrowth, with ages of 3–20 years, approximately.
Secondary forests are defined as tree-dominated fields,
established in previous cleared lands but with signifi-
cantly lower stocking than old-growth forests (Gutier-
rez-Velez et al. 2011). Old-growth forests are either areas
where the original tree vegetation has never been clear-
cut but might have been selectively logged, or previously
cleared lands that have reached a forest structure
resembling unconverted forests.
Land cover maps representing non-oil-palm catego-
ries were developed annually using data from the
satellite sensors Landsat TM/ETMþ with an overall
accuracy of 93% (Gutierrez-Velez and DeFries 2013).
Annual oil palm expansion was mapped based on the
classification of oil palm plantations by ages and other
land covers in 2010, using data from the satellite sensors
Landsat TM and ALOS-PALSAR. Overall accuracy in
the classification of oil palm plantations in 2010 was
94% and the age of oil palm plantations was predicted
with an r2 of 89% and a root mean square error of 61.3
(Gutierrez-Velez and DeFries 2013). The final resolution
of land cover maps was 30 m (Table 1).
Oil palm plantations every year were further reclas-
sified here in three age categories as young (1–5 years),
adolescent (6–10 years), and adult (.10 years). These
categories typify different stages of development in
terms of canopy closure, ground cover, and fruit
production that could be related to fire activity
(Gerritsma and Soebagyo 1999, Bruinsma 2009, Gu-
tierrez-Velez et al. 2013). Young plantations are
characterized by an open canopy and are commonly
associated with herbaceous ground cover including
kudzu (Pueraria phaseoloides) and the grass Imperata
brasiliensis. Harvesting is absent or marginal in young
plantations. Adolescent plantations constitute interme-
diate stages of canopy closure and weed suppression, as
well as the beginning of fruit production. Adult
plantations represent a full canopy closure that sup-
presses most ground cover, and include the peak of fruit
production. The land cover maps do not include
degraded adult oil palm plantations because their
spectral signature was not distinguishable from other
land cover classes (Gutierrez-Velez and DeFries 2013).
Distance to roads.—The road layer used for the
analysis was developed from a detailed tracking of the
road network during the field campaigns of 2009 and
2010 with a handheld GPS, and complemented with
visual interpretation of Landsat images for 2010 (Table
1). Distance to roads from every burned and unburned
pixel was used as a covariate for the fire occurrence and
spread models (Fig. 1). Data include the main road
connecting the city of Pucallpa to Lima and unpaved
secondary roads (Fig. 2).
Dry-season severity.—Dry-season severity was quan-
tified using the standardized precipitation index (SPI)
(McKee et al. 1993). The SPI is the number of standard
deviations that the observed cumulative precipitation
during any given period of interest deviates from the
climatological average. SPI values were assigned to each
burned and unburned pixel every year and then were
used as a covariate for the fire occurrence and spread
models (Fig. 1). We used the SPI during the months of
July, August, and September (JAS) because it is closely
correlated with fire activity in the study area (Fernandes
et al. 2011, Uriarte et al. 2012). Accurate calculation of
SPI requires a long-term time series of precipitation
data. SPI was therefore calculated by interpolating
precipitation data from rain gauge stations in Peru
(made available by the Servicio Nacional de Meteo-
rologia y Hidrologia [SENAMHI]) for the period 1970–
2010 at 0.258 resolution using the Cressman (1959)
method (Table 1).
Statistical modeling
Description of the models.—We developed conditional
autoregressive (CAR) models to evaluate two processes
associated with fire activity in the study area, namely fire
occurrence and spread (Fig. 1, Table 2). Fire occurrence
was defined as the probability of burning for each 232-m
spatial resolution MODIS pixel included in the burn
scar maps as a function of the proportion of different
land covers within the pixel, their distance to roads, and
the corresponding SPI each year (Fig. 1). Fire spread
was defined as the prediction of the number of pixels
burned in the vicinity of each burned pixel as a function
of the area of each land cover and their configuration
(McGarigal and Marks 1995), distance to roads from
the central pixel, and SPI of the central pixel.
We built two separate models to predict fire spread in
a 3 3 3 pixel window around each burned pixel as a
function of (a) the configuration or (b) the area of each
land cover within the 33 3 window. We selected a 33 3
pixel window because larger windows would include
some land cover patches that influence burnings other
than the one fire associated with the central pixel,
introducing noise to the models.
We selected the landscape shape index (LSI) to
measure configuration of each land cover inside the 3
3 3 pixel window out of 37 standard class metrics widely
used in the landscape ecology literature (McGarigal and
Marks 1995). LSI is defined as the ratio between the
total edge of all patches in each class and the edge of a
hypothetical square with the same area of all patches.
Low LSI values indicate more aggregated and regularly
shaped patches in a class, whereas large values indicate
more irregular and disaggregated patches (Appendix C:
Fig. C3). The LSI was selected among the other
landscape metrics following the rationale described by
Ruiz-Mirazo et al. (2012). First, we calculated all metrics
for each land cover (266 variables in total) in the 3 3 3
window. Then we ranked the 10 most important metrics
per land cover predicting fire occurrence based on a
variable importance analysis obtained from a random
forest classification (Breiman 2001, Liaw and Wiener
2002). Finally, we extracted the six most important
metrics that were common among all land covers
VICTOR H. GUTIERREZ-VELEZ ET AL.1328 Ecological ApplicationsVol. 24, No. 6
(Appendix B: Table B2). We selected the LSI because a
pairwise correlation comparison showed that it was
highly correlated with most other preselected metrics
except for the perimeter to area (PA) ratio (Appendix C:
Fig. C4). We chose the LSI over the PA ratio because, in
contrast to the latter, it does not change with the extent
of the landscape or the size of the patches (McGarigal
and Marks 1995). LSI is also advantageous over other
metrics because it constitutes an intuitive measure of the
level of aggregation or compactness of different patches
(Appendix C: Fig. C3).
Fire occurrence and spread were modeled under a
Bayesian hierarchical framework using the integrated
nested Laplace approximation, INLA (Rue et al. 2009).
INLA is a novel statistical inference method for latent
Gaussian Markov random field models, GMRF (Mar-
tino and Rue 2010). INLA constitutes a fast and robust
alternative to standard methods for GMRF models such
as Markov chain Monte Carlo, making it more suitable
for fitting spatiotemporal models involving large data
sets such as the one used in this analysis. Fire occurrence
was modeled assuming a binomial distribution of the
response, whereas fire spread was modeled assuming a
Poisson distribution (Table 2).
Covariates were standardized by centering the data
around zero and dividing by twice the standard
deviation in order to facilitate comparison between
estimated parameters (Gelman and Hill 2007). To avoid
collinearity between predictors, we identified variables
with jrj � 0.40. Area in forests was highly correlated
with area of fallow and pastures. Although area of
forests had the highest absolute correlation with fire
occurrence among all land covers (Appendix B: Table
B3), we discarded this land cover because our main
purpose was to understand the influence of post-
deforestation land covers on fire occurrence and spread.
In the fire spread model, we also found high collinearity
between the area of pastures and secondary forests
(Appendix B: Table B4). Therefore, we fitted two
models excluding either pastures or secondary forests
and selected the one that performed the best, based on
the predictive measures that we will describe in detail.
We also used predictive measures to evaluate whether
the inclusion of roads as a covariate, both alone and
interacting with SPI, improved the performance of each
model.
The models included interactions between SPI and
other covariates because our exploratory analyses
indicated that the response of fire to some variables
was different in wet and dry years (Appendix C: Fig.
C5). Interactions between climate and young and
adolescent oil palm plantations were excluded because
of the low extent of these land covers in early years of
the analysis. Most of the oil palm expansion has
occurred since 2006, when 91% of the new plantations
were established (Gutierrez-Velez and DeFries 2013).
Because most data on area of young and adolescent
plantations do not cover the full range of SPI values,
including the wettest and driest years (2002 and 2005,
respectively), these land covers were considered not
suitable to assess reliably the effect of their interactions
with drought severity. Pixel identity was included as a
random effect in the model. To account for spatial
autocorrelation, we conditioned the predictions to
neighboring pixels, assuming a Besag model (Besag et
al. 1991). For temporal autocorrelation, we assumed an
independent random noise model (Table 2). We selected
weak or uninformative priors for the random effects.
Model evaluation.—Predictive measures for model
evaluation consisted of the deviance information crite-
rion, DIC (Spiegelhalter et al. 2002), and the logarithmic
score (Gneiting and Raftery 2007). DIC is a measure of
the overall fit and complexity of a model, whereas the
logarithmic score measures their predictive value. Lower
DIC values and logarithmic scores indicate a better
model. We also calculated the P value of the model
parameters to assess the level of significance of the
covariates in their correlation with the response vari-
ables.
INLA does not contain a prediction function because
predictions are part of the model- fitting process.
Therefore, for validation, we reran the selected models
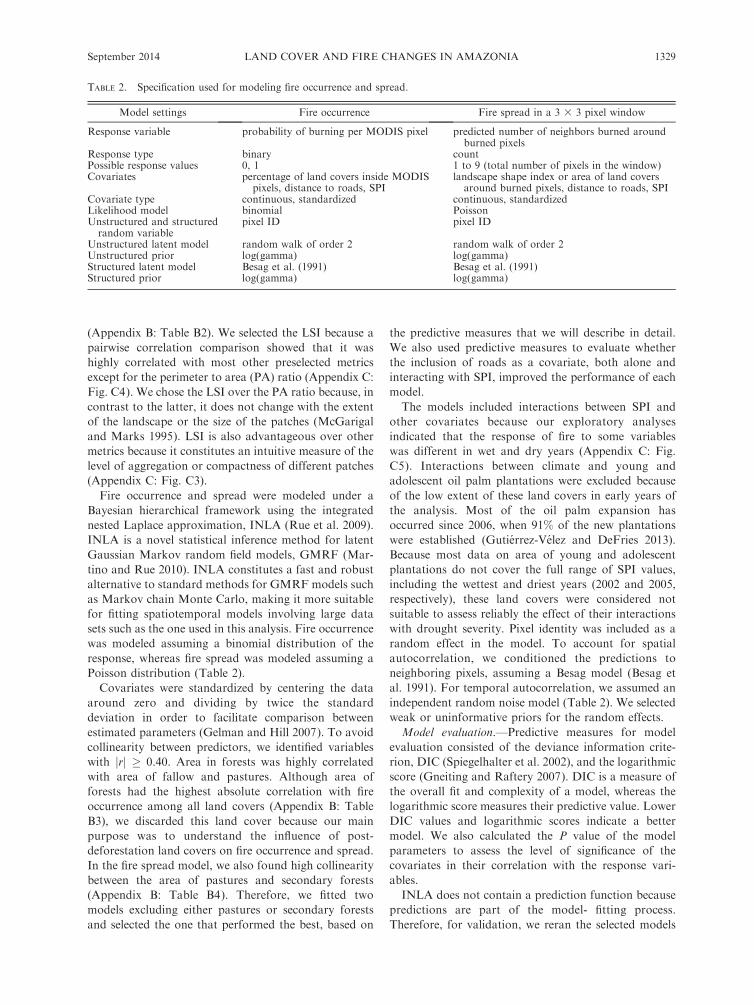
TABLE 2. Specification used for modeling fire occurrence and spread.
Model settings Fire occurrence Fire spread in a 3 3 3 pixel window
Response variable probability of burning per MODIS pixel predicted number of neighbors burned aroundburned pixels
Response type binary countPossible response values 0, 1 1 to 9 (total number of pixels in the window)Covariates percentage of land covers inside MODIS
pixels, distance to roads, SPIlandscape shape index or area of land covers
around burned pixels, distance to roads, SPICovariate type continuous, standardized continuous, standardizedLikelihood model binomial PoissonUnstructured and structuredrandom variable
pixel ID pixel ID
Unstructured latent model random walk of order 2 random walk of order 2Unstructured prior log(gamma) log(gamma)Structured latent model Besag et al. (1991) Besag et al. (1991)Structured prior log(gamma) log(gamma)
September 2014 1329LAND COVER AND FIRE CHANGES IN AMAZONIA
leaving out a randomly selected sample representing
10% of the data. Then we used the predicted values to
calculate a coefficient of determination for the cross-
validation data. Cross-validation has been used in other
INLA applications (Blangiardo et al. 2013, Cameletti et
al. 2013).
Given that SPI values for 2005 deviate considerably
from those in other years (Appendix C: Fig. C6), we
included an assessment of the extent to which the
atypical SPI values in 2005 were influential in the
parameter estimates for the fire occurrence and spread
models. The evaluation was performed by analyzing the
extent to which the exclusion of 2005 from the models
changed the significance and sign of the parameters
estimated for each covariate. All of the analyses were
performed in the R statistical program, version 2.15.2 (R
Development Core Team 2013).
Fuel load and types
Field data also included the measurement of the
amount of fuels per fuel types in land covers represent-
ing different stages of regrowth (Appendix B: Table B6)
Fuel types considered were standing trees, dead fuels,
and live fuels in nonwoody vegetation. This information
was used to discuss the potential influence of fuel
characteristics on some of the modeling results. The
amount of fuels in standing trees was quantified in three
concentric circular plots (Appendix C: Fig. C7). We
used 400- or 500-m2 plots to measure trees with a
diameter at breast height (dbh) larger than 10 cm; 100-
m2 plots for trees between 2.5 and 10 cm dbh; and 30-m2
plots for trees between 1.5 and 2 cm dbh. Values for dbh
were converted to tree biomass using the equation from
Sierra et al. (2007). Dead fuels and live fuels in
nonwoody vegetation from degraded pastures, pastures,
and fallows were collected separately in three square
plots of 0.25 m2 located at the edge of the largest plotwith an angle of 08, 1208, and 2408 from the plot center
with respect to the North (Appendix C: Fig. C7). Drymass was calculated based on oven-dried samples until
constant temperature at 608C for nonwoody materialsand 1028C for woody materials. Dead fuels and live fuelsin nonwoody vegetation for secondary forests were
estimated as 16% and 2% of aboveground tree biomass,respectively, based on Sierra et al. (2007).
RESULTS
Burn scar mapping and characterization
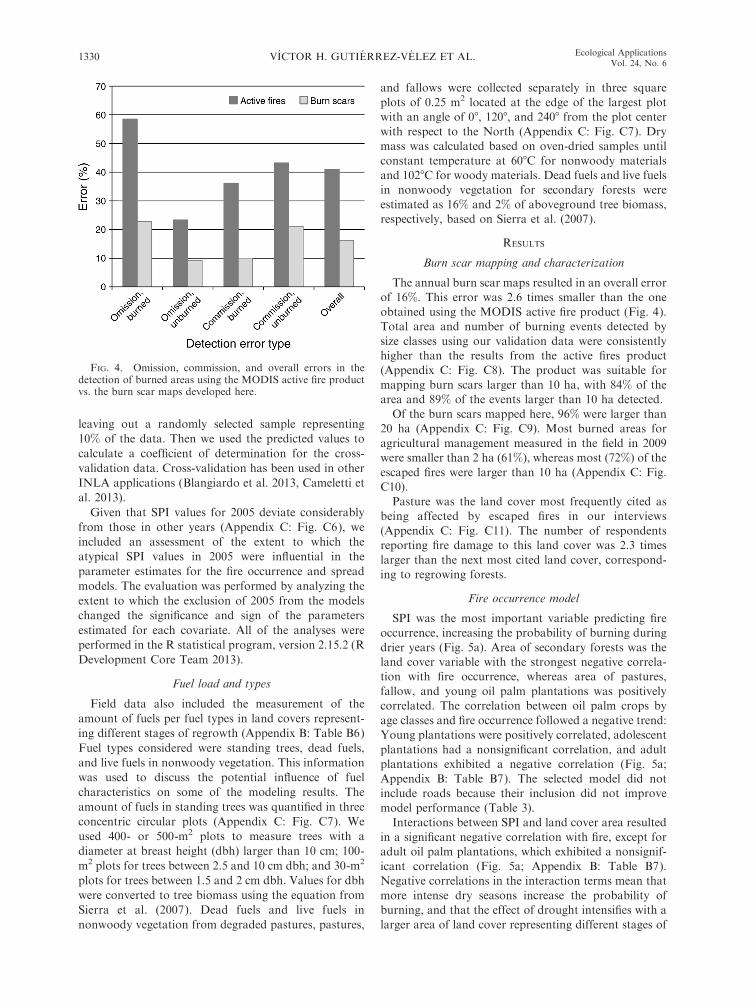
The annual burn scar maps resulted in an overall errorof 16%. This error was 2.6 times smaller than the one
obtained using the MODIS active fire product (Fig. 4).Total area and number of burning events detected by
size classes using our validation data were consistentlyhigher than the results from the active fires product(Appendix C: Fig. C8). The product was suitable for
mapping burn scars larger than 10 ha, with 84% of thearea and 89% of the events larger than 10 ha detected.
Of the burn scars mapped here, 96% were larger than20 ha (Appendix C: Fig. C9). Most burned areas for
agricultural management measured in the field in 2009were smaller than 2 ha (61%), whereas most (72%) of the
escaped fires were larger than 10 ha (Appendix C: Fig.C10).
Pasture was the land cover most frequently cited asbeing affected by escaped fires in our interviews
(Appendix C: Fig. C11). The number of respondentsreporting fire damage to this land cover was 2.3 times
larger than the next most cited land cover, correspond-ing to regrowing forests.
Fire occurrence model
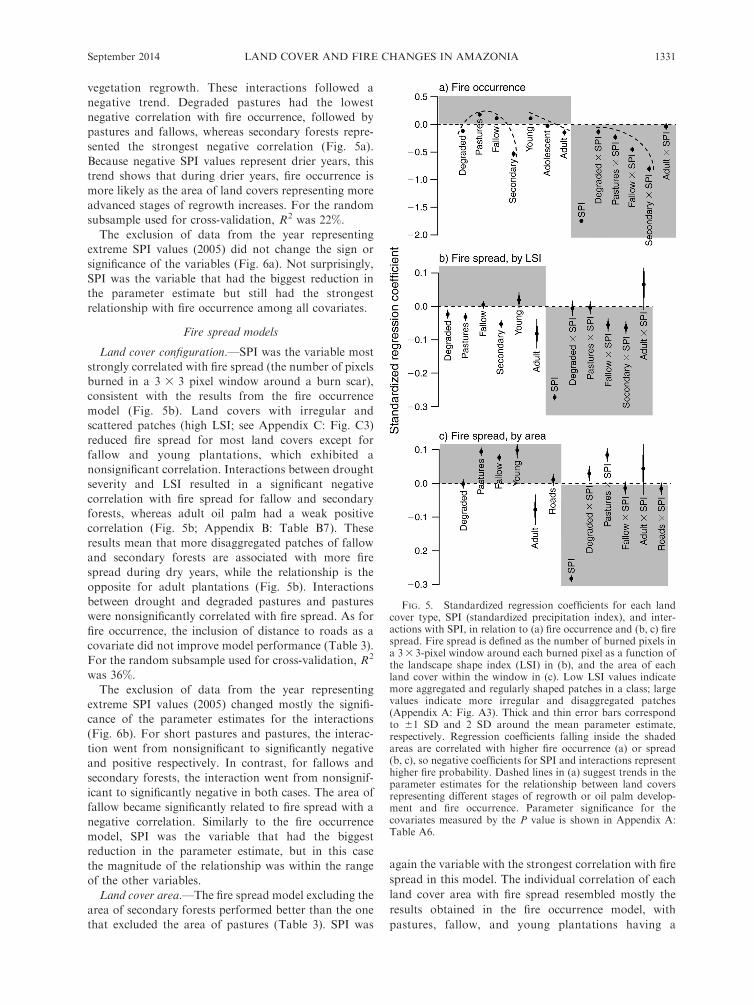
SPI was the most important variable predicting fireoccurrence, increasing the probability of burning during
drier years (Fig. 5a). Area of secondary forests was theland cover variable with the strongest negative correla-tion with fire occurrence, whereas area of pastures,
fallow, and young oil palm plantations was positivelycorrelated. The correlation between oil palm crops by
age classes and fire occurrence followed a negative trend:Young plantations were positively correlated, adolescent
plantations had a nonsignificant correlation, and adultplantations exhibited a negative correlation (Fig. 5a;
Appendix B: Table B7). The selected model did notinclude roads because their inclusion did not improve
model performance (Table 3).Interactions between SPI and land cover area resulted
in a significant negative correlation with fire, except foradult oil palm plantations, which exhibited a nonsignif-
icant correlation (Fig. 5a; Appendix B: Table B7).Negative correlations in the interaction terms mean that
more intense dry seasons increase the probability ofburning, and that the effect of drought intensifies with a
larger area of land cover representing different stages of
FIG. 4. Omission, commission, and overall errors in thedetection of burned areas using the MODIS active fire productvs. the burn scar maps developed here.
VICTOR H. GUTIERREZ-VELEZ ET AL.1330 Ecological ApplicationsVol. 24, No. 6
vegetation regrowth. These interactions followed a
negative trend. Degraded pastures had the lowest
negative correlation with fire occurrence, followed by
pastures and fallows, whereas secondary forests repre-
sented the strongest negative correlation (Fig. 5a).
Because negative SPI values represent drier years, this
trend shows that during drier years, fire occurrence is
more likely as the area of land covers representing more
advanced stages of regrowth increases. For the random
subsample used for cross-validation, R2 was 22%.
The exclusion of data from the year representing
extreme SPI values (2005) did not change the sign or
significance of the variables (Fig. 6a). Not surprisingly,
SPI was the variable that had the biggest reduction in
the parameter estimate but still had the strongest
relationship with fire occurrence among all covariates.
Fire spread models
Land cover configuration.—SPI was the variable most
strongly correlated with fire spread (the number of pixels
burned in a 3 3 3 pixel window around a burn scar),
consistent with the results from the fire occurrence
model (Fig. 5b). Land covers with irregular and
scattered patches (high LSI; see Appendix C: Fig. C3)
reduced fire spread for most land covers except for
fallow and young plantations, which exhibited a
nonsignificant correlation. Interactions between drought
severity and LSI resulted in a significant negative
correlation with fire spread for fallow and secondary
forests, whereas adult oil palm had a weak positive
correlation (Fig. 5b; Appendix B: Table B7). These
results mean that more disaggregated patches of fallow
and secondary forests are associated with more fire
spread during dry years, while the relationship is the
opposite for adult plantations (Fig. 5b). Interactions
between drought and degraded pastures and pastures
were nonsignificantly correlated with fire spread. As for
fire occurrence, the inclusion of distance to roads as a
covariate did not improve model performance (Table 3).
For the random subsample used for cross-validation, R2
was 36%.
The exclusion of data from the year representing
extreme SPI values (2005) changed mostly the signifi-
cance of the parameter estimates for the interactions
(Fig. 6b). For short pastures and pastures, the interac-
tion went from nonsignificant to significantly negative
and positive respectively. In contrast, for fallows and
secondary forests, the interaction went from nonsignif-
icant to significantly negative in both cases. The area of
fallow became significantly related to fire spread with a
negative correlation. Similarly to the fire occurrence
model, SPI was the variable that had the biggest
reduction in the parameter estimate, but in this case
the magnitude of the relationship was within the range
of the other variables.
Land cover area.—The fire spread model excluding the
area of secondary forests performed better than the one
that excluded the area of pastures (Table 3). SPI was
again the variable with the strongest correlation with fire
spread in this model. The individual correlation of each
land cover area with fire spread resembled mostly the
results obtained in the fire occurrence model, with
pastures, fallow, and young plantations having a
FIG. 5. Standardized regression coefficients for each landcover type, SPI (standardized precipitation index), and inter-actions with SPI, in relation to (a) fire occurrence and (b, c) firespread. Fire spread is defined as the number of burned pixels ina 33 3-pixel window around each burned pixel as a function ofthe landscape shape index (LSI) in (b), and the area of eachland cover within the window in (c). Low LSI values indicatemore aggregated and regularly shaped patches in a class; largevalues indicate more irregular and disaggregated patches(Appendix A: Fig. A3). Thick and thin error bars correspondto 61 SD and 2 SD around the mean parameter estimate,respectively. Regression coefficients falling inside the shadedareas are correlated with higher fire occurrence (a) or spread(b, c), so negative coefficients for SPI and interactions representhigher fire probability. Dashed lines in (a) suggest trends in theparameter estimates for the relationship between land coversrepresenting different stages of regrowth or oil palm develop-ment and fire occurrence. Parameter significance for thecovariates measured by the P value is shown in Appendix A:Table A6.
September 2014 1331LAND COVER AND FIRE CHANGES IN AMAZONIA

significant positive correlation and adult plantations a
negative correlation (Fig. 5c; Appendix B: Table B7).
Degraded pasture was the exception, with a nonsignif-
icant correlation with fire spread. SPI interactions with
degraded pastures and pastures were the only land
cover–drought synergisms that exhibited a significant
correlation with fire spread. The positive sign of both
correlations shows that a higher proportion of degraded
pastures and pasture within the 3 3 3 pixel window was
associated with lower fire spread during dry years. For
the random subsample used for cross-validation, R2 was
37%. Distance to roads had a weak positive correlation
with fire spread, but the interaction with SPI resulted in
a weak negative correlation.
The exclusion of data from the year representing
extreme SPI values (2005) changed the sign of the
relationship between the interactive term associated with
area of pastures and fire spread, becoming negative (Fig.
6c). For distance to roads, the interaction went from a
nonsignificant to a significantly positive correlation with
fire spread. Consistent with the other two models, the
parameter associated with SPI had the biggest reduction
in the parameter estimate, but as in the case of the fire
spread vs. landscape configuration model, the magni-
tude of the relationship was within the range of the other
variables.
Fuel characterization
The total amount of fuels was the lowest in degraded
pastures (Fig. 7a). The total amount of fuels was very
similar in pastures and fallows with intermediate values.
Secondary forests represented the highest amount of
total fuels among land covers representing different
stages of regrowth. The amount of biomass in standing
trees was highest in secondary forests, negligible in
degraded pastures and pastures, and slightly higher in
areas of fallows (Fig. 7b). The amount of dead fuels
increased monotonically with land covers representing
more advanced stages of regrowth (Fig. 7c). The amount
of live fuels in nonwoody vegetation was highest in
pastures, followed by fallows, while it was lowest in
secondary forests, followed by degraded pastures (Fig.
7d).
DISCUSSION
Burn scar mapping
Our results demonstrate the advantages of mapping
burned area over using standard fire products for local
applications. Differences in accuracy between our
method and the active fire data set are probably
influenced by the different features registered by each
data set. The active fire product records only areas that
are being burned by the time the satellite passes, whereas
our method captures areas that have already burned,
independently of the satellite passing time. This differ-
ence gives an advantage to our approach that might
explain, in part, the higher accuracy. In addition, the
resolution of the active fire product is 1 km. A detection
with that product means that one or more fires can be
occurring in any place within the 1-km pixel; therefore, it
has limitations to providing information about the
extent or exact location of the burnings. In contrast,
the finer spatial resolution (250 m) of the data used in
our method makes it more suitable to assess the location
and area of the burnings. The lower performance of the
active fire product is supported by evidence from
different studies showing that the data set can signif-
icantly underestimate the number of fires in Amazonia
(Vasconcelos et al. 2013). However, the active fire
product is still the most suitable standard product
available to use as a benchmark for our study area,
given the fact that other standard products described in
the Methods section detected no fires during the period
of analysis.
Our method proved to be suitable for burn scars
larger than 10 ha (Appendix C: Fig. C7). This result
constitutes an improvement over previous analogous
studies mapping burn scars with MODIS data (Table 4).
The performance of our method in the study area,
characterized by high cloud cover and persistence,
suggests that it has the potential to be implemented
elsewhere. In fact, the method proved useful even after
retaining only 8% of the original data after filtering. The
application to other areas should consider regional
variations in fire seasonality, because our approach
relies on radiometric changes during the five month
duration of the fire season every year. Burn scar
TABLE 3. Comparison for all models fitted to predict fire occurrence and spread.
Model DIC Logarithmic score
Fire occurrence with roads 213 604 0.24688Fire occurrence without roads� 213 600 0.24688Fire spread vs. configuration with roads 187 787 2.05801Fire spread vs. configuration without roads� 187 786 2.05800Fire spread vs. area no secondary forest with roads� 187 525 2.05592Fire spread vs. area no secondary forest without roads 187 526 2.05591Fire spread vs. area no pasture with roads 187 613 2.05645Fire spread vs. area no pasture without roads 187 733 2.05773
Note: Predictive measures for model evaluation consisted of the Deviance Information Criterion, DIC (a measure of the overallfit and complexity of a model), and the logarithmic score (a measure of the model’s predictive value).
� Selected models.
VICTOR H. GUTIERREZ-VELEZ ET AL.1332 Ecological ApplicationsVol. 24, No. 6

FIG. 6. Changes in parameter estimates (mean 6 1 SD) when excluding data from the driest year (2005) from the analysis for(a) the fire occurrence model, and fire spread models in a 333 pixel window around burned pixels as a function of (b) the landscapeshape index, and (c) the area of each land cover. The effect of excluding data from 2005 on the parameter estimates is lower asvalues are closer to the dashed line.
September 2014 1333LAND COVER AND FIRE CHANGES IN AMAZONIA

mapping in areas without a marked fire season might
require modification to our method.
Fire occurrence
Our results show that land covers representing
different stages of vegetation regrowth have a significant
correlation with fire occurrence, but that the sign of the
correlation changes with vegetation types (Fig. 5a;
Appendix B: Table B7). Potential explanations for these
results include (1) burning preferences among residents
for different land covers; (2) variations in biophysical
conditions of vegetation, including fuel accumulation
and types as well as microclimatic conditions; and (3)
differences in land management practices or actions in
different land covers by rural residents to prevent or
control fires.
We will discuss these three potential explanations in
light of our empirical evidence and previous literature
reports. Assessing the extent to which these or other
factors explain the observed patterns requires further
data and analysis, as it is likely that no single factor will
be sufficient to explain the complex relationship between
FIG. 7. Amount of aboveground fuels in the land covers representing different stages of regrowth represented as (a) total fuels,(b) fuels in standing trees, (c) dead fuels, and (d) live fuels in nonwoody vegetation. Boxes contain values between the 25th and 75thpercentiles and thick lines inside them represent the medians. Points outside the boxes represent outliers and whiskers represent themaximum and minimum values excluding outliers. Please note the different y-axis scales.
TABLE 4. Minimum burn scar area detectable reported by different studies.
Source
Minimumdetectablearea (ha)
Dominantland cover Location Method
This work 10 none Pucallpa, Ucayali, Peru decision tree classifier based on temporalmetrics
Giglio et al. (2007) 120 all World active fire based algorithmQuintano et al. (2010) 300 forest Galicia image miningMorton et al. (2011) 50 forest Mato Grosso burn damage and recovery algorithmMohler and Goodin (2012) 200 tall grass Flinthills, Kansas, USA supervised minimum distance
classification
Note: Minimum detectable area was defined here as the burn scar size class after which the majority of the events and areaburned are detected. Results are shown in Appendix A: Table A6.
VICTOR H. GUTIERREZ-VELEZ ET AL.1334 Ecological ApplicationsVol. 24, No. 6
land covers and fire, and their influence might vary with
different land covers. Generalization of the possible
relationships between land covers and fire should be
taken with caution because they can be influenced
largely by the socioeconomic and biophysical context in
which fire occurs.
Burning preferences by rural residents.—Attributing
the results to burning preferences by rural residents for
different land covers would imply that the observed
burn scars are the result of conversion or management
fires instead of fires that escaped to areas where burning
was not intended. Although we cannot discard the
former completely, our field surveys and measurements
suggest that most of the burn scars mapped here
correspond to escaped fires. First, the size of the burn
scars mapped here is considerably bigger than the
typical area burned for land cover conversion and
management in the region, which is usually 2 ha or less
(Fujisaka and White 1998). This is confirmed by field
measurements of the area of both management and
escaped fires in 2009 as part of our burn scar mapping.
The data showed that from 13 management fires only
one (8%) was bigger than the minimum size at which our
method identifies burn scars reliably (10 ha), whereas 19
out of the 26 escaped fires measured (76%) were bigger
than 10 ha (Appendix C: Fig. C10). In contrast, 98% of
the burn scars mapped here during the time period were
bigger than 10 ha, and 96% were bigger than 20 ha
(Appendix C: Fig. C9). Some burn scars mapped here
that correspond to the establishment of large-scale oil
palm plantations can be larger than the typical area of
smallholder activities. However, most of those planta-
tions were established in forested areas (Gutierrez-Velez
and DeFries 2013), which were not included in the
statistical analysis because of collinearity, as explained
previously.
In addition, the significance of each land cover type in
the fire occurrence model is in agreement with the
frequency with which rural residents report damage of
escaped fires to different land covers. Pasture was the
land cover with the most significant positive correlation
with fire occurrence in our fire occurrence model (Fig.
5a); at the same time, it was by far the land cover most
frequently reported by rural residents as being affected
by escaped fires in the study area (Appendix C: Fig.
C11).
Finally if our results were explained mostly by
burning preference, then we would expect that the
relationship between land covers and the probability of
burning would be less closely associated with drought
severity than we observe. The fact that the area in
secondary forests reduces the probability of fire occur-
rence, but that the relationship becomes the opposite
when secondary forest interacts with SPI, implies that
human preferences for burning, at least in this particular
land cover, are not sufficient to explain the relationship
between the area of secondary forests and fire.
Differences in biophysical characteristics of vegeta-
tion.—Among the land covers representing different
stages of vegetation development, degraded pastures
and secondary forests had a negative relationship with
fire occurrence (Fig. 5a). Our empirical data show that
degraded pasture is the land cover with the lowest fuel
accumulation of all the categories representing different
stages of regrowth (Fig. 7a). Therefore, it is possible that
this negative correlation will be influenced to some
extent by fuel scarcity.
The area of secondary forests was also negatively
correlated with fire occurrence even though our empir-
ical data show that this land cover represents the highest
fuel load among all land covers (Fig. 7a). In contrast,
pastures and fallows had the highest positive correlation
with fire occurrence, with intermediate fuel loads. We
rely on our empirical data and previous results by Uhl
and Kauffman (1990) to hypothesize that this apparent
discrepancy can be explained to some extent by
differences in the amount of live fuels in nonwoody
vegetation of different land covers. Uhl and Kauffmann
found in Paragominas (Brazilian Amazon) that second-
ary forests became flammable after 8–10 days of no rain
during the dry season. In contrast, pastures were
flammable throughout most of the dry season. These
differences were attributed to a higher availability of
rapidly drying fine fuels in pastures. These results are in
line with our empirical data showing that the amount of
live fuels in nonwoody vegetation is highest in pasture,
followed by fallows, and secondary forest represents the
lowest values (Fig. 7d). This pattern resembles approx-
imately the relative magnitude of the parameter
estimates in our fire occurrence model (Fig. 5a).
In their study, Uhl and Kauffman (1990) found that
secondary forests had a higher relative humidity than
pastures, particularly during the dry season. Our study
did not include site-specific information to validate
whether the differences in relative humidity found in
Paragominas can be extrapolated to our study area.
Future studies could evaluate whether differences in
relative humidity explain to some extent the relation-
ships between land covers and fire, particularly consid-
ering differences in precipitation regimes (Appendix C:
Fig. C12). Future work should also assess the extent to
which differences in fuel loads and changes in relative
humidity in different land covers as a consequence of
drought severity could explain the negative trend in the
relationship between fire occurrence and land covers
representing different stages of regrowth when they
interact with SPI (Fig. 5a). If relative humidity reduces
the probability of burning in secondary forests, then it is
expected that a combination of a higher fuel load (Fig.
7) and drought would reduce relative humidity in this
land cover enough to increase fire probability.
Young oil palm cultivations are commonly associated
in the study area with highly flammable herbaceous
vegetation such as kudzu (Pueraria phaseoloides),
brachiaria (Brachiaria sp.), and Imperata brasiliensis
September 2014 1335LAND COVER AND FIRE CHANGES IN AMAZONIA
(Friday et al. 1999, Nepstad et al. 2001, Lojka et al.
2011, Gutierrez-Velez and DeFries 2013). Also, herba-
ceous vegetation is significantly suppressed by shading
as the canopy closes in oil palm plantations (Lojka et al.
2011). Canopy closure in plantations with a tree density
typical of the region (143–160 trees/ha) begins at around
the fifth year and usually levels off at around 9–10 years
after establishment (Gerritsma and Soebagyo 1999).
Therefore, canopy closure as oil palm plantations grow
might suppress highly flammable herbaceous vegetation
and therefore contribute to reducing fire risk. Although
no data on fuel characteristics in oil palm plantations
representing different age classes are available, it is
expected that the negative trend in the correlation
between oil palm plantations by age classes and fire
occurrence (Fig. 5a) will be influenced by the suppres-
sion of ground cover over time, as a consequence of
canopy closure.
Differences in land management practices, fire preven-
tion, and control actions.—In the study region, adult
plantations require permanent fruit harvesting, but
management activities in young plantations are more
sporadic, usually consisting of weeding and fertilizing
about every two months (Bruinsma 2009). At the same
time, oil palm plantations involve relatively large
investments and periodic revenue from harvesting.
Previous literature has suggested that frequent human
presence in permanent cultivations allows owners to
detect surrounding fires more quickly, and a higher
perceived value in this land cover constitutes an
incentive to control fires (Nepstad et al. 2001, Sorrensen
2004, Lavorel et al. 2007, Aragao and Shimabukuro
2010, Barlow et al. 2012). Future research could assess
whether higher human presence and perceived value
might help to explain why adult plantations did not
increase fire probability even when interacting with SPI,
in contrast to the interactive term associated with
secondary forests that increased fire probability with
drier SPI values (Fig. 5a).
Fire spread
Landscape configuration.—In general, land cover
complexity, indicated by high LSI values, was negatively
correlated with fire spread, except for fallow cover, with
a nonsignificant correlation and young oil palm
plantations with a weak positive correlation (Fig. 5b;
Appendix B: Table B7). These results are in line with
previous studies showing that local landscape homoge-
neity increases fire spread, whereas discontinuities
between land covers in heterogeneous landscapes can
act as firebreaks (Vega-Garcıa and Chuvieco 2006,
Viedma et al. 2009, Moreira et al. 2011). In our case,
patches of short pastures, secondary forests, and adult
oil palm plantations may inhibit fire spread by acting as
discontinuities between large blocks of nondegraded
pastures and fallow. In contrast, more homogeneous or
aggregated fragments of pastures can propagate fire in
any direction in the absence of less flammable land
covers acting as firebreaks. Configuration of secondary
forests and adult plantations had the most negative
correlation with fire spread among land covers. There-
fore, elongated patches of these land covers seem to be
the most effective at reducing fire proliferation among
all vegetation types.
Interactions between land covers and LSI and fire
spread were significantly negative for fallow and
secondary forests, indicating that more irregular patches
in these land covers increase fire spread during drier
years. In contrast, the weak positive correlation between
fire spread and the interaction between adult oil palm
and SPI shows that irregular adult plantations reduce
fire spread even during dry years. Correlation between
fire spread and the interactions between SPI and
degraded pastures and pastures was nonsignificant,
indicating that the influence of the shape of these land
cover types on fire spread is not mediated by drought
(Fig. 5b; Appendix B: Table B7).
Land cover area.—Fire spread was positively corre-
lated with the area of fallow, pastures, and young
plantations, but the correlation was negative with area
of adult plantations (Fig. 5c). These results are
consistent with our findings in the fire occurrence model
(Fig. 5a). The exception was the positive interaction
between pastures and drought severity, meaning that a
greater area in pastures was associated with lower fire
spread during dry years (Fig. 5c). Furthermore, the
interacting term associated with area of pastures became
negatively associated with fire when the driest year was
eliminated from the analysis (Fig. 6c). This result
suggests that the interaction between pastures and
drought severity promotes fire when non-extreme
droughts are included. An explanation for these results
seems elusive. Drier condition would be expected to
increase fire spread by pastures, given the high
flammability of this land cover. Future research could
assess whether the observed patterns are related to the
timing at which land covers burn during extreme
droughts. If pastures become susceptible to fire early
during severe dry seasons, then the reduction in fuels
due to early burning could make them work as
firebreaks later, when other land covers with higher fuel
loads could become flammable. An understanding of
this result requires a comprehensive analysis of fire
behavior in tropical mosaic landscapes, in particular in
the interface between different land covers, as well as
changes in fuel and microclimate properties in vegeta-
tion types representing different stages of regrowth
under different drought conditions.
Distance to roads
Distance to roads had a nonsignificant correlation
with fire occurrence (Fig. 5a). This result contrasts with
previous studies identifying distance to roads as one of
the main drivers of fire, especially in tropical areas where
the main sources of ignition are humans (Silvestrini et al.
2011, Uriarte et al. 2012). Previous studies cited here
VICTOR H. GUTIERREZ-VELEZ ET AL.1336 Ecological ApplicationsVol. 24, No. 6

were performed at considerably larger scales, including
only distance to main roads. In contrast, the input road
data used for this analysis included a highly dense road
network composed mostly of unpaved roads (Fig. 2).
High road density means that most cleared lands are
relatively accessible and therefore there are no important
differences in their exposure to ignition sources. Similar
results were reported in Portugal by Moreira et al.
(2010), who found that distance to roads was less
important for explaining fire ignitions than were
population density and land cover types.
Implications for land cover management to reduce
landscape flammability
Our results suggest that the promotion of forest
regrowth and the establishment of oil palm plantations
in deforested areas can be effective at reducing fire
occurrence and spread when they develop beyond initial
stages of growth (Fig. 5). Drought severity can
undermine the ability of secondary forests to reduce
fire, but the influence of adult plantations on fire
occurrence and spread seems not to be affected
significantly by drought conditions. The implementation
of early warning systems, along with mechanisms to
reduce and control fire, especially in regrowing forests
and young oil palm plantations, is essential for settling
in place land cover strategies to reduce landscape
flammability. Fire prevention programs in other areas
have reduced the number of fires, but have increased the
percentage of large burnings (Dıaz-Delgado et al. 2004).
Therefore, secondary forests would need to be moni-
tored during drier years to avoid the incidence of
widespread fires.
Future work could assess whether differences in the
response of fire to area of secondary forests vs. adult
plantations are related to a higher perceived value of oil
palm cultivations among owners as well as a higher
human presence after plantations reach a productive
age. Secondary forests are usually perceived as areas
with low economic value, and therefore farmers could be
less effective at preventing them from burning when
nearby fires are threatening, as has been demonstrated in
other areas of the Amazon (Sorrensen 2000). Therefore,
strategies to increase the perceived value of secondary
forests could enhance the effectiveness of these land
covers at reducing landscape flammability, especially
during dry years. Such strategies could include the
enrichment with fruit or timber trees. This practice is
common among native Amazonians (Pinedo-Vasquez et
al. 2002, Padoch et al. 2008), but might not be as
widespread among the migrant population increasingly
arriving to the region. Other incentives could come from
the payment for ecosystem services such as carbon
sequestration, water regulation, or habitat restoration.
Our results suggest also that in order to reduce
landscape flammability, irregular and disaggregated
patches should be implemented for most land covers
(Fig. 5b). However, intense drought could increase the
susceptibility to fire in areas with disaggregated patches
of secondary forests and fallows; therefore they should
be especially monitored during drier years to reduce fire
spread.
Adult plantations seem to be particularly effective at
reducing landscape flammability, especially if they are
implemented in irregular fragments in already cleared
lands. The viability of doing so in the study area seems
to be high, given that the cultivation of oil palm
following elongated shapes along access roads is a
common practice among smallholders in the region
(Gutierrez-Velez et al. 2011, Gutierrez-Velez and De-
Fries 2013). However, oil palm plantations also tend to
become clustered in the landscape over time due to the
necessity of locating them near processing facilities. This
aggregation can undermine the effectiveness of planta-
tions in reducing fire spread. Promoting exclusion zones
between oil palm crops could reduce landscape flamma-
bility, but their implementation should consider eco-
nomic feasibility among other factors.
In contrast to smallholders, most large-scale oil palm
plantations are expanding into forests in the study area
following more regular patterns (Gutierrez-Velez et al.
2011). Therefore, they are probably not as useful to
reduce fire in the study area. In order for oil palm
plantations to be effective at reducing fire occurrence
and spread, they should be established in already cleared
lands, especially if they replace highly flammable land
covers such as pastures, as opposed to fire-resistant land
covers such as old-growth forests. The success of oil
palm plantations in reducing fire would depend on the
implementation of measures to protect cultivations
during the initial stages of development, because young
plantations were positively correlated with fire occur-
rence and spread. Weed control in young oil palm
plantations might also reduce fire risk, but its economic
feasibility and the potential impacts on soil erosion
should be evaluated. Finally, our study excluded
degraded adult oil palm plantations. Thus, future
research and landscape planning should consider the
extent to which the presence of degraded adult
plantations in a postproduction phase could increase
fire risk.
CONCLUSIONS
This work contributes to the understanding of the
extent to which land covers representing different stages
of vegetation development and their interaction with
drought severity influence fire occurrence and spread.
We found that the area and configuration of different
land covers can have a significant influence on fire
occurrence and spread, but that the relationship is
highly mediated by land cover type, the stage of
development of vegetation, and drought severity.
Specifically, our work contributes to the understand-
ing of the relationship between land cover changes and
fire in tropical landscapes by showing that (1) there is a
threshold after which the relationship between land
September 2014 1337LAND COVER AND FIRE CHANGES IN AMAZONIA
covers representing different stages of development and
fire changes from promoting to inhibiting burnings; (2)
this threshold is strongly mediated by drought severitybecause drought severity increased the likelihood of fire
as the area of land covers representing more developed
stages of regrowth increased; (3) the establishment of
perennial cultivations is not a precondition for reducing
fire activity, but these cultivations have to developenough to inhibit fire; and (4) after certain age, the
relationship between perennial cultivations and fire
occurrence is not significantly affected by drought
conditions, in contrast to the area of secondary forests,which increases fire risk during dry years.
We also found that overall, irregular and scattered
land cover patches correlated negatively with fire spread,
but irregular patches of fallow and secondary forests
increased fire spread during dry years. Adult oil palmwas the only land cover for which irregularity consis-
tently reduced fire spread, even during severely dry
years.
In general, the promotion of large areas of secondary
forests and adult oil palm plantations in cleared landsseems to be effective in reducing fire occurrence and
spread, but adult oil palm plantations seem to be more
effective at reducing fire occurrence and spread than is
secondary vegetation, especially during dry years. These
land covers can be effective in reducing fire only if theyare expanded outside of forests. Interspersed and
elongated shapes would further increase the effectiveness
of adult plantations in reducing fire spread. Because
young plantations are susceptible to fire, protectionduring the initial stages of development would be needed
to develop an effective firebreak from adult plantations.
Secondary forests would require special monitoring
during severe droughts because they are susceptible tofire during those years. Ultimately, the feasibility of
these strategies should consider and adapt to the variety
of land tenure systems that exist across cleared lands in
the Amazon, because some areas might require theirown sets of fire management rules.
Cleared lands cover vast areas in the Amazon. These
areas constitute a challenge, but also an opportunity to
overcome the increasing incidence of fires and other
environmental threats. The results of this work show
that land cover management in cleared lands couldpotentially serve to reduce fire risk. Simultaneously,
these land cover management strategies could provide
food and ecosystem services such as water regulation,
habitat improvement, and carbon sequestration. Thesuccess of such strategies will depend on developing
incentives to promote and manage forest regrowth,
expanding perennial crops such as oil palm plantations
in cleared lands, and implementing early warning andother fire prevention and monitoring systems.
ACKNOWLEDGMENTS
This work was financed by the U.S. National ScienceFoundation (NSF) grant number 0909475 and the UnitedStates Agency for International Development (USAID) grant
number EEM-G-00-04-00010-00. We thank Louis Verchot andTien Ming Lee for their valuable feedback. We are also gratefulto Walter Rios Perez, Isaac Perez, Medardo Miranda Ruiz, andother field assistants for their dedication in collecting the fielddata. Finally, we thank the two anonymous referees for theirhelpful reviews.
LITERATURE CITED
Alencar, A., G. P. Asner, D. Knapp, and D. Zarin. 2011.Temporal variability of forest fires in eastern Amazonia.Ecological Applications 21:2397–2412.
Alencar, A., D. Nepstad, and M. C. V. Diaz. 2006. Forestunderstory fire in the Brazilian Amazon in ENSO and non-ENSO years: area burned and committed carbon emissions.Earth Interactions 10:1–17.
Alencar, A. A. C., L. A. Solorzano, and D. C. Nepstad. 2004.Modeling forest understory fires in an Eastern AmazonianLandscape. Ecological Applications 14(Supplement):139–149.
Aragao, L. E. O. C., Y. Malhi, N. Barbier, A. Lima, Y.Shimabukuro, L. Anderson, and S. Saatchi. 2008. Interac-tions between rainfall, deforestation and fires during recentyears in the Brazilian Amazonia. Philosophical Transactionsof the Royal Society B 363:1779–1785.
Aragao, L. E. O. C., and Y. E. Shimabukuro. 2010. Theincidence of fire in Amazonian forests with implications forREDD. Science 328:1275–1278.
Barbaran-Garcia, J. 2000. Cuantificacion de biomasa y carbonoen los principales sistemas de uso de suelo en Campo Verde.Universidad Nacional de Ucayali, Pucallpa, Peru.
Barlow, J., et al. 2012. The critical importance of consideringfire in REDDþ programs. Biological Conservation 154:1–8.
Besag, J., J. York, and A. Mollie. 1991. Bayesian imagerestoration with two applications in spatial statistics. Annalsof the Institute of Statistical Mathematics 43:1–59.
Blangiardo, M., M. Cameletti, G. Baio, and H. v. Rue. 2013.Spatial and spatio-temporal models with R-INLA. Spatialand Spatio-temporal Epidemiology 4:33–49.
Breiman, L. 2001. Random forests. Machine Learning 45:5–32.Brown, F., W. Schroeder, A. Setzer, M. de los RiosMaldonado, N. Pantoja, A. Duarte, and J. Marengo. 2006.Monitoring fires in southwestern Amazonia rain forests.GEOS, Transactions, American Geophysical Union 87:253–264.
Bruinsma, B. 2009. Produccion de biodiesel de palma aceitera yjatropha en la Amazona del Peru y el impacto para lasostenibilidad: Un Analisis Sostenible del Ciclo de Vida.Thesis. Open Universiteit Nederland, Heerland, The Nether-lands.
Cameletti, M., F. Lindgren, D. Simpson, and H. v. Rue. 2013.Spatio-temporal modeling of particulate matter concentra-tion through the SPDE approach. AStA Advances inStatistical Analysis 97:109–131.
Carlson, K. M., L. M. Curran, D. Ratnasari, A. M. Pittman,B. S. Soares-Filho, G. P. Asner, S. N. Trigg, D. A. Gaveau,D. Lawrence, and H. O. Rodrigues. 2012. Committed carbonemissions, deforestation, and community land conversionfrom oil palm plantation expansion in West Kalimantan,Indonesia. Proceedings of the National Academy of SciencesUSA 109:7559–7564.
Cochrane, M. A., and C. P. Barber. 2009. Climate change,human land use and future fires in the Amazon. GlobalChange Biology 15:601–612.
Cressman, G. P. 1959. An operational objective analysissystem. Monthly Weather Review 87:367–374.
Dıaz-Delgado, R., F. Lloret, and X. Pons. 2004. Spatialpatterns of fire occurrence in Catalonia, NE, Spain.Landscape Ecology 19:731–745.
Dlamini, W. M. 2010. A Bayesian belief network analysis offactors influencing wildfire occurrence in Swaziland. Envi-ronmental Modelling and Software 25:199–208.
VICTOR H. GUTIERREZ-VELEZ ET AL.1338 Ecological ApplicationsVol. 24, No. 6
European Commission. 2012. Global VGT burnt area product2000�2007 (L3JRC). http://bioval.jrc.ec.europa.eu/products/burnt_areas_L3JRC/download_l3jrc.php
Fernandes, K., et al. 2011. North Tropical Atlantic influence onwestern Amazon fire season variability. Geophysical Re-search Letters 38:L12701.
Friday, K. S., M. E. Drilling, and D. P. Garrity. 1999. Imperatagrassland rehabilitation using agroforestry and assistednatural regeneration. International Centre for Research inAgroforestry (ICRAF), Southeast Asian Regional ResearchProgramme, Bogor, Indonesia.
Fujisaka, S., G. Escobar, and E. J. Veneklaas. 2000. Weedyfields and forests: interactions between land use and thecomposition of plant communities in the Peruvian Amazon.Agriculture, Ecosystems and Environment 78:175–186.
Fujisaka, S., and D. White. 1998. Pasture or permanent cropsafter slash-and-burn cultivation? Land-use choice in threeAmazon colonies. Agroforestry Systems 42:45–59.
Gelman, A., and J. Hill. 2007. Data analysis using regressionand multilevel/hierarchical models. Cambridge UniversityPress, New York, New York, USA.
Gerritsma, W., and F. X. Soebagyo. 1999. An analysis of thegrowth of leaf area of oil palms in Indonesia. ExperimentalAgriculture 35:293–308.
Giglio, L., T. Loboda, D. P. Roy, B. Quayle, and C. O. Justice.2009. An active-fire based burned area mapping algorithmfor the MODIS sensor. Remote Sensing of Environment113:408–420.
Gneiting, T., and A. E. Raftery. 2007. Strictly proper scoringrules, prediction, and estimation. Journal of the AmericanStatistical Association 102:359–378.
Gobierno Regional de Ucayali. 2006. Evaluacion de impactosambientales de quema e incendios forestales en la provinciade Coronel Portillo. Gobierno Regional de Ucayali, Pucall-pa, Peru.
Gutierrez-Velez, V. H., and R. DeFries. 2013. Annual multi-resolution detection of land cover conversion to oil palm inthe Peruvian Amazon. Remote Sensing of Environment129:154–167.
Gutierrez-Velez, V. H., R. DeFries, M. Pinedo-Vasquez, M.Uriarte, C. Padoch, W. Baethgen, K. Fernandes, and Y. Lim.2011. High-yield oil palm expansion spares land at theexpense of forests in the Peruvian Amazon. EnvironmentalResearch Letters 6:044029.
Hansen, M., R. Dubayah, and R. DeFries. 1996. Classificationtrees: an alternative to traditional land cover classifiers.International Journal of Remote Sensing 17:1075–1081.
Hawbaker, T. J., V. C. Radeloff, S. I. Stewart, R. B. Hammer,N. S. Keuler, and M. K. Clayton. 2013. Human andbiophysical influences on fire occurrence in the United States.Ecological Applications 23:565–582.
Lavorel, S., M. Flannigan, E. Lambin, and M. Scholes. 2007.Vulnerability of land systems to fire: Interactions amonghumans, climate, the atmosphere, and ecosystems. Mitigationand Adaptation Strategies for Global Change 12:33–53.
Le Page, Y., G. R. van der Werf, D. C. Morton, and J. M. C.Pereira. 2010. Modeling fire-driven deforestation potential inAmazonia under current and projected climate conditions.Journal of Geophysical Research 115:G03012.
Liaw, A., and M. Wiener. 2002. Classification and Regressionby randomForest. R News 2:18–22.
Lima, A., T. S. F. Silva, L. E. O. C. de Aragao, R. M. de Feitas,M. Adami, A. R. Formaggio, and Y. E. Shimabukuro. 2012.Land use and land cover changes determine the spatialrelationship between fire and deforestation in the BrazilianAmazon. Applied Geography 34:239–246.
Lojka, B., P. H. Cepkova, L. Navratilova, P. Van Damme, J.Banout, Z. Polesny, and D. Preininger. 2011. Methods forshort-term control of Imperata grass in Peruvian Amazon.Journal of Agriculture and Rural Development in theTropics and Subtropics (JARTS) 112:37–43.
LP-DAAC (NASA Land Processes Distributed Active ArchiveCenter). 2001. MODIS vegetation indices MOD13Q1. SiouxFalls, South Dakota, USA. USGS/Earth Resources Obser-vation and Science Center (EROS). http://reverb.echo.nasa.gov
Martino, S., and H. Rue. 2010. Implementing approximateBayesian inference using integrated nested Laplace approx-imation: A manual for the inla program. Department ofMathematical Sciences, NTNU (Norwegian University ofScience and Technology), Trondheim, Norway.
McGarigal, K., and B. Marks. 1995. FRAGSTATS: spatialpattern analysis program for quantifying landscape structure.General Technical Report PNW-GTR-351, U.S. Departmentof Agriculture, Forest Service, Pacific Northwest ResearchStation, Portland, Oregon, USA.
McKee, T. B., N. J. Doesken, and J. Kleist. 1993. Therelationship of drought frequency and duration to timescales. Pages 179–183 in 84th Conference on AppliedClimatology. American Meteorological Society, Boston,Massachusetts, USA.
Mohler, R. L., and D. G. Goodin. 2012. Identifying a suitablecombination of classification technique and bandwidth(s) forburned area mapping in tallgrass prairie with MODISimagery. International Journal of Applied Earth Observationand Geoinformation 14:103–111.
Moreira, F., F. Catry, F. Rego, and F. Bacao. 2010. Size-dependent pattern of wildfire ignitions in Portugal: when doignitions turn into big fires? Landscape Ecology 25:1405–1417.
Moreira, F., et al. 2011. Landscape–wildfire interactions insouthern Europe: implications for landscape management.Journal of Environmental Management 92:2389–2402.
Morton, D. C., R. S. DeFries, J. Nagol, C. M. Souza, Jr., E. S.Kasischke, G. C. Hurtt, and R. Dubayah. 2011. Mappingcanopy damage from understory fires in Amazon forestsusing annual time series of Landsat and MODIS data.Remote Sensing of Environment 115:1706–1720.
Morton, D. C., R. S. DeFries, J. T. Randerson, L. Giglio, W.Schroeder, and G. R. Van Der Werf. 2008. Agriculturalintensification increases deforestation fire activity in Ama-zonia. Global Change Biology 14:2262–2275.
Nepstad, D., G. Carvalho, A. Cristina Barros, A. Alencar, J. P.Capobianco, J. Bishop, P. Moutinho, P. Lefebvre, U. LopesSilva, and E. Prins. 2001. Road paving, fire regime feedbacks,and the future of Amazon forests. Forest Ecology andManagement 154:395–407.
Oliveira, P. J. C., G. P. Asner, D. E. Knapp, A. Almeyda, R.Galvan-Gildemeister, S. Keene, R. F. Raybin, and R. C.Smith. 2007. Land-use allocation protects the PeruvianAmazon. Science 317:1233–1236.
Padoch, C., E. Brondizio, S. Costa, M. Pinedo-Vasquez, R. R.Sears, and A. Siqueira. 2008. Urban forest and rural cities:multi-sited households, consumption patterns, and forestresources in Amazonia. Ecology and Society 13(2):2.
Pinedo-Vasquez, M., J. Barletti Pasqualle, D. del CastilloTorres, and K. Coffey. 2002. A tradition of change: thedynamic relationship between biodiversity and society insector Muyuy, Peru. Environmental Science and Policy 5:43–53.
R Development Core Team. 2013. R version 2.15.2. R: Alanguage and environment for statistical computing. RFoundation for Statistical Computing, Vienna, Austria.http://www.r-project.org/
Roy, D. P., L. Boschetti, C. O. Justice, and J. Ju. 2008. Thecollection 5 MODIS burned area product—Global evalua-tion by comparison with the MODIS active fire product.Remote Sensing of Environment 112:3690–3707.
Rue, H., S. Martino, and N. Chopin. 2009. ApproximateBayesian inference for latent Gaussian models by usingintegrated nested Laplace approximations. Journal of theRoyal Statistical Society B 71:319–392.
September 2014 1339LAND COVER AND FIRE CHANGES IN AMAZONIA

Ruiz-Mirazo, J., J. Martınez-Fernandez, and C. Vega-Garcıa.2012. Pastoral wildfires in the Mediterranean: understandingtheir linkages to land cover patterns in managed landscapes.Journal of Environmental Management 98:43–50.
Shlisky, A., A. A. C. Alencar, M. M. Nolasco, and L. M.Curran. 2009. Overview: Global fire regime conditions,threats, and opportunities for fire management in the tropics.Pages 65–83 in M. Cochrane, editor. Tropical fire ecology:climate change, land use, and ecosystem dynamics. Springer,New York, New York, USA.
Sierra, C. A., et al. 2007. Total carbon stocks in a tropical forestlandscape of the Porce region, Colombia. Forest Ecology andManagement 243:299–309.
Siljander, M. 2009. Predictive fire occurrence modelling toimprove burned area estimation at a regional scale: a casestudy in East Caprivi, Namibia. International Journal ofApplied Earth Observation and Geoinformation 11:380–393.
Silvestrini, R. A., B. S. Soares-Filho, D. Nepstad, M. Coe, H.Rodrigues, and R. Assuncao. 2011. Simulating fire regimes inthe Amazon in response to climate change and deforestation.Ecological Applications 21:1573–1590.
Sorrensen, C. 2004. Contributions of fire use study to land use/cover change frameworks: understanding landscape changein agricultural frontiers. Human Ecology 32:395–420.
Sorrensen, C. 2009. Potential hazards of land policy: Conser-vation, rural development and fire use in the BrazilianAmazon. Land Use Policy 26:782–791.
Sorrensen, C. L. 2000. Linking smallholder land use and fireactivity: examining biomass burning in the Brazilian LowerAmazon. Forest Ecology and Management 128:11–25.
Spiegelhalter, D. J., N. G. Best, B. P. Carlin, and A. van derLinde. 2002. Bayesian measures of model complexity and fit.Journal of the Royal Statistical Society B 64:583–639.
Spracklen, D. V., S. R. Arnold, and C. M. Taylor. 2012.Observations of increased tropical rainfall preceded by airpassage over forests. Nature 489:282–285.
Uhl, C., and J. B. Kauffman. 1990. Deforestation, firesusceptibility, and potential tree responses to fire in theeastern Amazon. Ecology 71:437–449.
Uriarte, M., M. Pinedo-Vasquez, R. S. DeFries, K. Fernandes,V. Gutierrez-Velez, W. E. Baethgen, and C. Padoch. 2012.Depopulation of rural landscapes exacerbates fire activity inthe western Amazon. Proceedings of the National Academyof Sciences USA 109:21546–21550.
USGS (U.S. Geological Survey Department of the Interior).2011. Global visualization viewer. USGS/Earth Resourcesand Science Center (EROS), Sioux Falls, South Dakota,USA. http://glovis.usgs.gov/
Vasconcelos, S. S. d., P. M. Fearnside, P. M. L. d. A. Graca,E. M. Nogueira, L. C. d. Oliveira, and E. O. Figueiredo.2013. Forest fires in southwestern Brazilian Amazonia:Estimates of area and potential carbon emissions. ForestEcology and Management 291:199–208.
Vega-Garcıa, C., and E. Chuvieco. 2006. Applying localmeasures of spatial heterogeneity to Landsat-TM imagesfor predicting wildfire occurrence in Mediterranean land-scapes. Landscape Ecology 21:595–605.
Viedma, O., D. Angeler, and J. Moreno. 2009. Landscapestructural features control fire size in a Mediterraneanforested area of central Spain. International Journal ofWildland Fire 18:575–583.
SUPPLEMENTAL MATERIAL
Appendix A
Remote sensing methods for burn scar mapping (Ecological Archives A024-079-A1).
Appendix B
Tables with burn scar and fuel sampling intensity and additional modeling results (Ecological Archives A024-079-A2).
Appendix C
Figures illustrating methods and results for burn scar mapping, fuel sampling and statistical analysis (Ecological ArchivesA024-079-A3).
VICTOR H. GUTIERREZ-VELEZ ET AL.1340 Ecological ApplicationsVol. 24, No. 6