Embed Size (px)
Citation preview

Land Accounting
Michael Bordt
ESCAP
Southeast Asia Workshop on Environment Statistics
Nov. 2-4, 2016
Bangkok, Thailand

Overview: Land Accounting
Learning objectives
Review of Level 0 (5m)
Level 1 (Compilers)
Concepts (15m)
Group exercise & Discussion (30m)
Level 2 (Data providers)
Data options, examples & issues (15m)
Group exercise & Discussion (15m)
Closing Discussion (10m)

SEEA-CF Training Levels 1 and 2
Learning objectives Level 1:
Understand the basic concepts of the Land Account
Learn the steps of compiling an Land Account
Level 2:
Be familiar with some important conceptual issues
Understand the data options and sources
Be aware of how other countries have approached measuring land
3

Environment accounts and statistics SEEA-CF (Central Framework)
• Assets
• Physical flows
• Monetary flows
• Minerals & Energy, Land, Timber, Soil, Water, Aquatic
• Materials, Energy, Water, Emissions, Effluents, Wastes
• Protection expenditures, taxes & subsidies
SEEA Water; SEEA Energy; SEEA Agriculture, Forestry and Fisheries
Add sector detail
As above for Agricultural, Forestry and Fisheries sectors
SEEA-EEA (Experimental Ecosystem Accounting)
Adds spatial detail and ecosystem perspective
Extent, Condition, Ecosystem Services, Carbon, Water, Biodiversity
FDES (Framework for the Development of Environment Statistics)
Basic statistics for above plus…
• Extreme events and disasters • Human settlements and health • Protection, management & engagement

Review: Land Accounting
• What? • Land is a unique environmental asset that delineates the space in which
economic activities and environmental processes take place and within which environmental assets and economic assets are located. (SEEA-CF Sections 5.62, p. 174)
• National coverage of land cover, land use, ownership (terrestrial, freshwater, coastal and marine areas)
• Inter-institutional agreement on what exists on national land and water
• Why? • Spatial foundation for all national administrative data and policies • Land & resource management, conservation policies, land tenure • Links to SEEA-CF (Forest, Soil); SEEA-Agriculture, Fisheries & Forests • Foundation for SEEA-EEA (Ecosystem Accounting) • Indicators:
• Land cover change where are changes occurring? • Land cover by land use who manages it?
5

Review: Land Accounting
6
Table Use land accounts to To address SDG Indicators
Goal 1: No poverty 1.1.1 Poverty (by urban rural)
Goal 4: Quality education (11 indicators by location)
Goal 6: Clean water and sanitation (11 indicators by location)
Goal 9: Industry, innovation and
infrastructure9.1.1 Rural population with access to all-season road
11.1.1 Urban population living in slums
11.3.1 Land consumption rate
11.7.1 Urban open space for public use
Distinguish catchment
areasGoal 14: Life below water 14.1.1 Costal eutrophication and floating plastic
Distinguish marine and
coastal areasGoal 14: Life below water
14.2.1 Ecosystem-based management of exclusive
economic zones
15.1.1 Forest area share of total land area
15.2.1 Sustainable forest management
15.2.2 Net permanent forest loss
Distinguish degraded land Goal 15: Life on land 15.3.1 Proportion of land that is degraded
15.4.1 Sites for mountain biodiversity
15.4.2 Mountain Green Cover Index
—Distinguish urban/rural
Land cover
& change
Distinguish freshwater
areas
Provide detail within
urbanGoal 11: Sustainable cities and communities
Distinguish forest area Goal 15: Life on land
Distinguish mountain
areasGoal 15: Life on land
• Land accounts support many SDGs

Review: Land Accounting
7
• Land accounts support many SDGs
Table Use land accounts to To address SDG Indicators
2.3.2 Income of small-scale farmers
2.4.1 Productive and sustainable agriculture
Distinguish marine and
coastal protected areasGoal 14: Life below water 14.5.1 Protected marine areas
Distinguish forestry area Goal 15: Life on land 15.2.1 Sustainable forest management
Goal 1: No poverty 1.4.2 Land tenure rights
Goal 5: Gender equality 5.a.1 Rights over agricultural land
—Distinguish agricultural
areasGoal 2: Zero hunger
Land use
Land
ownership
Agree on land tenure
(who owns?)

Review: Land Accounting
What does a Land Account look like?
8
Cover
Ownership
Use
Maps Tables
Classifications
Review: Land Accounting
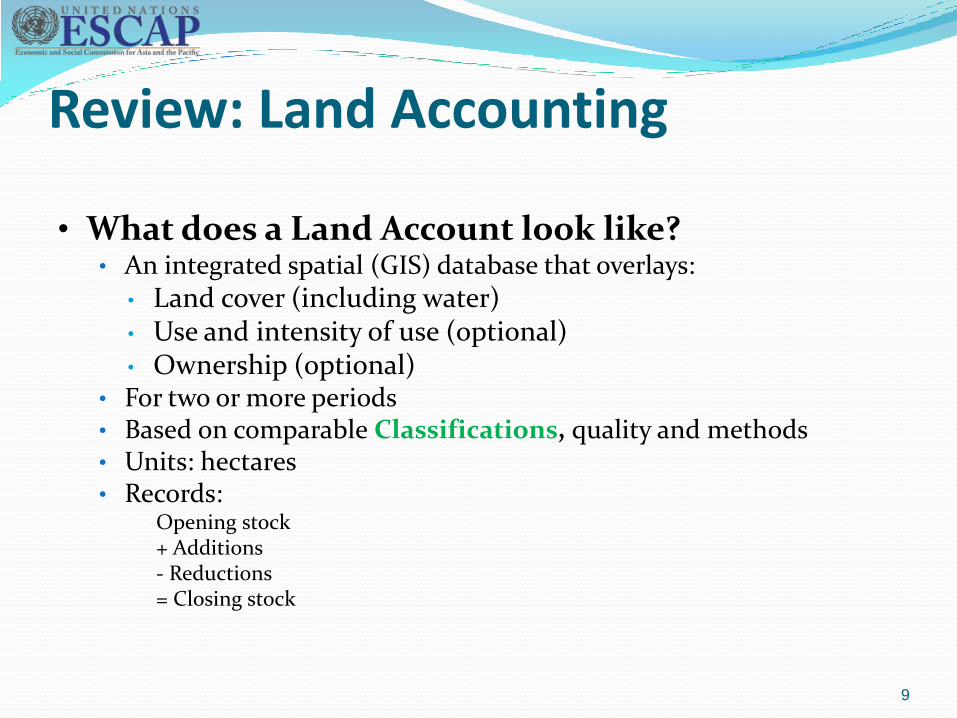
• What does a Land Account look like? • An integrated spatial (GIS) database that overlays:
• Land cover (including water) • Use and intensity of use (optional) • Ownership (optional)
• For two or more periods • Based on comparable Classifications, quality and methods • Units: hectares • Records:
Opening stock + Additions - Reductions = Closing stock
9

Review: Land Accounting
• What do you need to compile a Land Account? • GIS platform: Software, protocols (e.g., standard projection) • Classifications: Land cover, land use, ownership • Land cover
• Satellite, aerial photography, field research • Hydrological, topographic (rivers, drainage areas, elevation,
coastlines)
• Land use (optional) • Agriculture, population census, administrative, forest inventories
• Ownership (optional) • Cadastral (ownership, tenure, zoning, tax, price)
• Expertise • Land managers (forestry, agriculture, lands…), • Geographers (GIS, satellite imagery, integration) • Statisticians (classifications, accounts)
10

Welcome to
Level 1: Land Accounting
11

Level 1: Land Accounting
• Basic spatial analysis
• Classifications
• Thinking spatially: maps to data to accounts
• Boundaries
• Land cover change
12

Level 1: Land Accounting
• Classifications = map legend
13
Land cover classification (SEEA-CF, Table 5.12, p.178; and Annex p. 299)
1 Artificial surfaces (including urban and associated areas)
2 Herbaceous crops
3 Woody crops
4 Multiple or layered crops
5 Grassland
6 Tree-covered areas
7 Mangroves
8 Shrub-covered areas
9 Shrubs and/or herbaceous vegetation, aquatic or regularly flooded
10 Sparsely natural vegetated areas
11 Terrestrial barren land
12 Permanent snow and glaciers
13 Inland water bodies
14 Coastal water bodies and intertidal areas
15. Marine
Crops
Sparsely vegetated/barren
Swamps
Bogs…

Level 1: Land Accounting
• Classifications
14
Land use classification (SEEA-CF, Table 5.11, p. 176; and Annex 1 p. 289)
1. Land
1.1 Agriculture
1.2 Forestry
1.3 Land used for aquaculture
1.4 Use of built-up and related areas
1.5 Land used for maintenance and restoration of environmental functions
1.6 Other uses of land n.e.c.
1.7 Land not in use
2. Inland waters
2.1 Inland waters used for aquaculture or holding facilities
2.2 Inland waters used for maintenance and restoration of environmental functions
2.3 Other uses of inland waters n.e.c.
2.4 Inland waters not in use
3. Coastal waters…
4. Exclusive economic Zone (EEZ)…
1.1.1 Land under temporary crops 1.1.1.1 Cereals …

Level 1: Land Accounting
• Classifications
15
Land ownership: (SEEA-CF p. 178)
By institutional sector (e.g. corporations, general government, households, NPISH)
OR
By industry/activity (e.g. mining, forestry, agriculture, manufacturing, services…)

Level 1: Land Accounting
Thinking spatially: Maps to data to accounts
16
What you see…
- Many kinds of “Tree
covered areas”
- Many kinds of
“Artificial Surfaces”
Is simplified into
classes… (vector)

Level 1: Land Accounting
• Thinking spatially: Maps to data to accounts
17
What you see…
and generalized to a
grid (raster)

Level 1: Land Accounting
• Thinking spatially: Maps to data to accounts
18
What you see…
…where cell value is
“dominant” land
cover type

Level 1: Land Accounting
• Boundaries…
19
…don’t always
match because of
different:
• projections
• scales
• sources
• methods
and need some
adjustment before
overlaying

Level 1: Land Accounting
• Land cover change
20
Now we can
compare the two!
What has changed?
2ha Crops to artificial
3ha Tree covered to crops
2ha Grassland to crops

Level 1: Land Accounting
• Land cover change matrix
21
Opening balance
Closing balance
Land cover change matrix
Opening
land cover
Artificial
surfaces Crops Grass-land
Tree
covered
Regularly
flooded
Inland
waters
Barren
land Opening
Artificial
surfaces 22 22
Crops 2 4 6
Grassland 2 8 10
Tree
covered 3 40 43
Regularly
flooded 8 8
Inland
waters 8 8
Barren
land 4 4
Closing 24 9 8 40 8 8 4 101
Closing land cover
Level 1: Land Accounting
• Land cover change matrix
22
No change
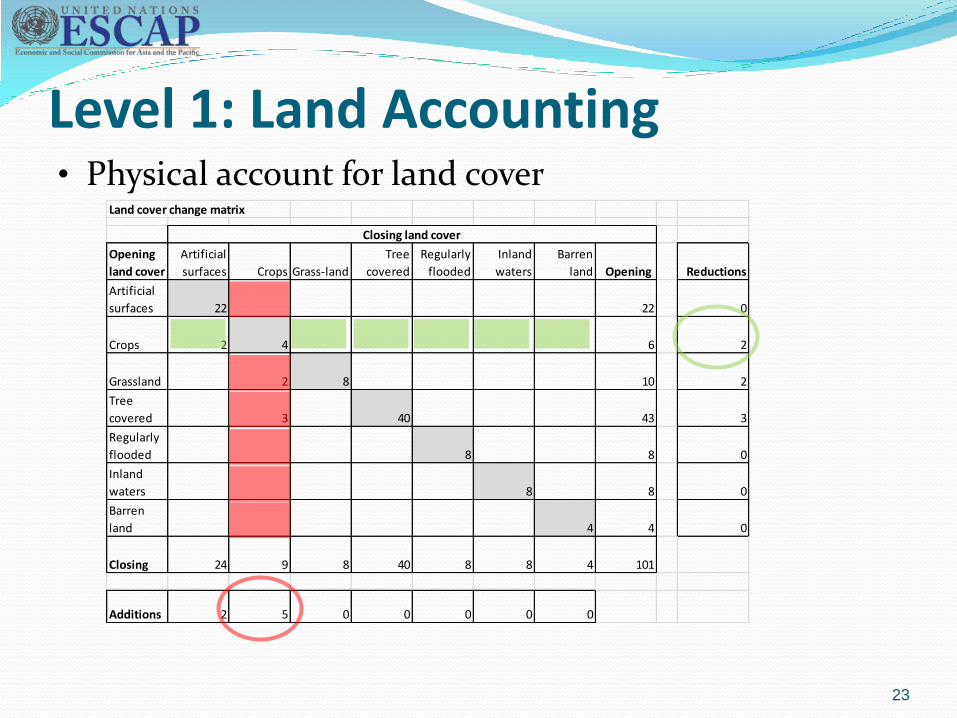
Land cover change matrix
Opening
land cover
Artificial
surfaces Crops Grass-land
Tree
covered
Regularly
flooded
Inland
waters
Barren
land Opening Reductions
Artificial
surfaces 22 22 0
Crops 2 4 6 2
Grassland 2 8 10 2
Tree
covered 3 40 43 3
Regularly
flooded 8 8 0
Inland
waters 8 8 0
Barren
land 4 4 0
Closing 24 9 8 40 8 8 4 101
Additions 2 5 0 0 0 0 0
Closing land cover
Level 1: Land Accounting • Physical account for land cover
23

Physical account for land cover
Artificial
surfaces Crops
Grass-
land
Tree
covered
Regularly
flooded
Inland
waters
Barren
land Total
Opening 22 6 10 43 8 8 4 101
Additions 2 5 7
Reductions 2 2 3 7
Closing 24 9 8 40 8 8 4 101
• Physical account for land cover
2 +
Level 1: Land Accounting
24
Artificial surfaces +2
Crops -2
Tree covered -3
Crops +3
Grassland -2
Crops +2
2 + 3 = 5

Level 1: Land Accounting
• Compilation Group Exercise (30m)
• Situation:
• Land cover units defined for two periods (Opening and Closing)
• Need to calculate:
• Land Cover Opening and Closing stocks,
• Land Cover Change matrix
• Physical Account for Land Cover
• Objective (Groups of 3-5):
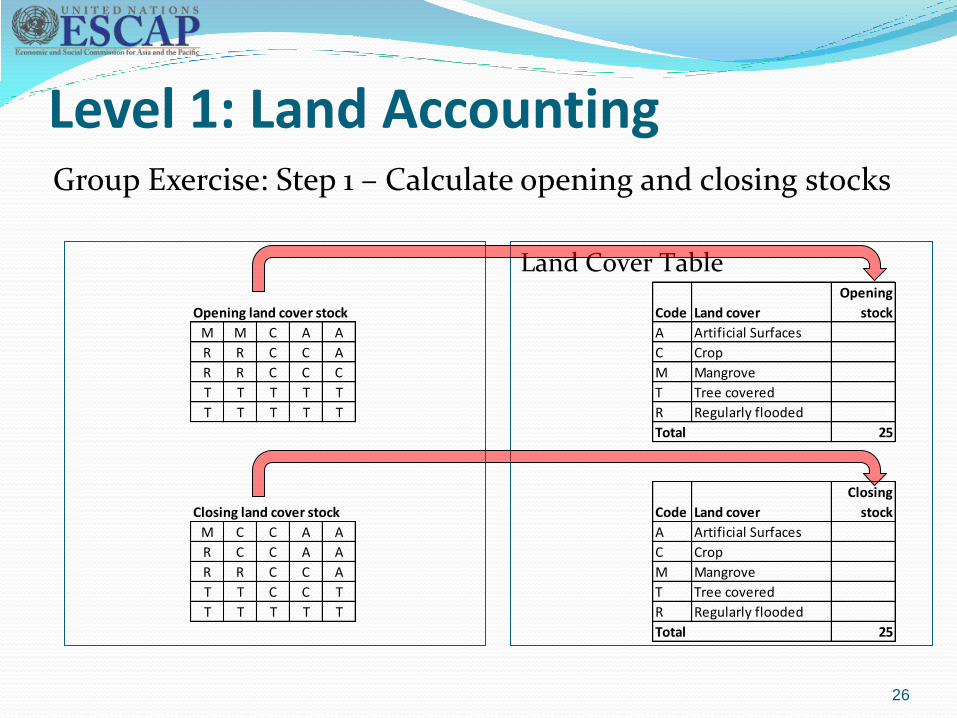
1. Transfer Land Cover from map to Land Cover Table
2. Calculate Land Cover Change Matrix
3. Calculate Physical Account for Land Cover
4. Report and discuss results
25
Land Cover Table
Level 1: Land Accounting Group Exercise: Step 1 – Calculate opening and closing stocks
26
Opening land cover stock
M M C A A
R R C C A
R R C C C
T T T T T
T T T T T
Closing land cover stock
M C C A A
R C C A A
R R C C A
T T C C T
T T T T T
Code Land cover
Opening
stock
A Artificial Surfaces 3
C Crop 6
M Mangrove 2
T Tree covered 10
R Regularly flooded 4
25
Code Land cover
Closing
stock
A Artificial Surfaces 5
C Crop 8
M Mangrove 1
T Tree covered 8
R Regularly flooded 3
25
Total
Total

Level 1: Land accounting Group Exercise: Step 2a – Record opening and closing stock
27
Land Cover Table Land Cover Change Matrix
A C M T R
A 3 0 0 0 0 3
C 2 4 0 0 0 6
M 0 1 1 0 0 2
T 0 2 0 8 0 10
R 0 1 0 0 3 4
Closing Stock 5 8 1 8 3 25
Closing land coverOpening
land cover
Opening
StockCode Land cover
Opening
stock
A Artificial Surfaces 3
C Crop 6
M Mangrove 2
T Tree covered 10
R Regularly flooded 4
25
Code Land cover
Closing
stock
A Artificial Surfaces 5
C Crop 8
M Mangrove 1
T Tree covered 8
R Regularly flooded 3
25
Total
Total

Level 1: Land Accounting Group Exercise: Step 2b – Calculate Land Cover Change
28
Land Cover Change Matrix
Record “No change” in diagonal
Rows = No change + Reductions
Columns = No change + Additions
Compare each
corresponding
cell.
Count cells that
didn’t change.
Count cells that
changed (to
what).
Artificial:
3 = no change
2 = new from C
Opening land cover stock
M M C A A
R R C C A
R R C C C
T T T T T
T T T T T
Closing land cover stock
M C C A A
R C C A A
R R C C A
T T C C T
T T T T T
A C M T R
A 3 0 0 0 0 3
C 2 4 0 0 0 6
M 0 1 1 0 0 2
T 0 2 0 8 0 10
R 0 1 0 0 3 4
Closing Stock 5 8 1 8 3 25
Closing land coverOpening
land cover
Opening
Stock
3 2
3
5

Physical land cover account (ha)
A C M T R Total
Opening stock 3 6 2 10 4 25
Additions 2 4 - - - 6
Reductions - 2 1 2 1 6
Closing stock 5 8 1 8 3 25
A C M T R
A 3 0 0 0 0 3
C 2 4 0 0 0 6
M 0 1 1 0 0 2
T 0 2 0 8 0 10
R 0 1 0 0 3 4
Closing Stock 5 8 1 8 3 25
Closing land coverOpening
land cover
Opening
Stock
Land Cover Change Matrix
Level 1: Land Accounting Group Exercise: Step 3 – Calculate Physical Land Cover
29
Physical Land Cover Account
Additions = Sum of additions
Reductions = Sum of reductions
Additions to (C) Crops
Reductions from (C) Crops
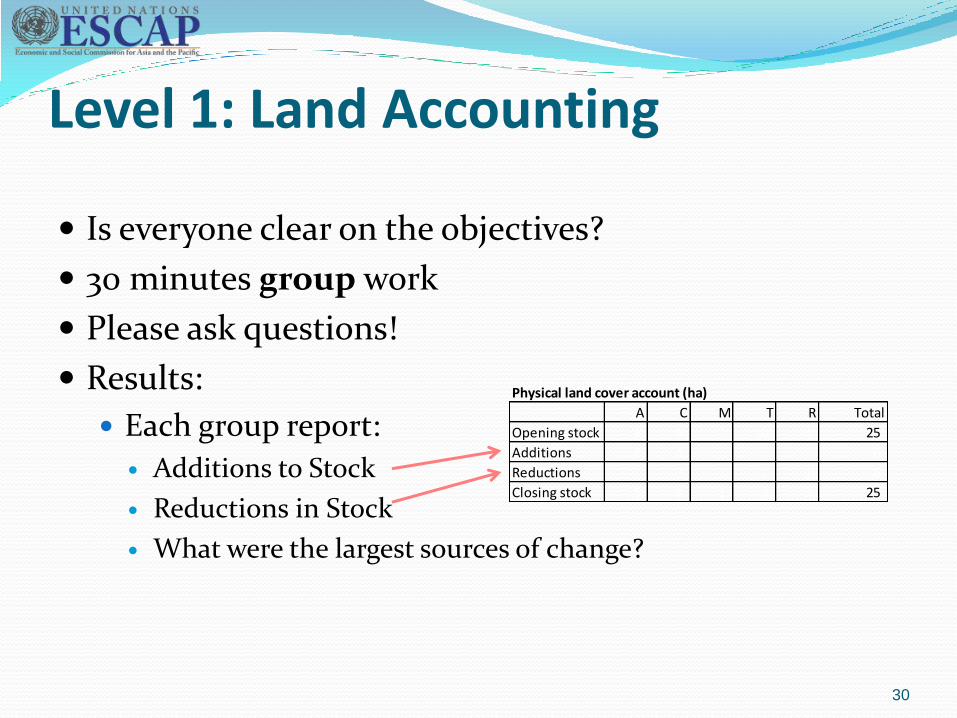
Level 1: Land Accounting
Is everyone clear on the objectives?
30 minutes group work
Please ask questions!
Results:
Each group report:
Additions to Stock
Reductions in Stock
What were the largest sources of change?
30
Physical land cover account (ha)
A C M T R Total
Opening stock 3 6 2 10 4 25
Additions 2 4 - - - 6
Reductions - 2 1 2 1 6
Closing stock 5 8 1 8 3 25

Level 1: Land Accounting
The answers:
Land Cover Change Matrix
Rows add to Opening
Columns add to Closing
Physical Account for Land Cover
Additions
Reductions
Major source of change
4 ha crops added
31
Physical land cover account (ha)
A C M T R Total
Opening stock 3 6 2 10 4 25
Additions 2 4 - - - 6
Reductions - 2 1 2 1 6
Closing stock 5 8 1 8 3 25
Land cover change matrix (ha)
A C M T R
A 3 - - - - 3
C 2 4 - - - 6
M - 1 1 - - 2
T - 2 - 8 - 10
R - 1 - - 3 4
Closing Stock 5 8 1 8 3 25
Closing land coverOpening land
cover
Opening
Stock

Welcome to
Level 2: Land Accounting
32

Level 2: Land Accounting
Learning objectives (Level 2)
Review how Land Accounts are represented in the SEEA-CF
Understand some important conceptual issues
Understand the data options and sources
Be aware of how other countries have approached Land Accounting
33
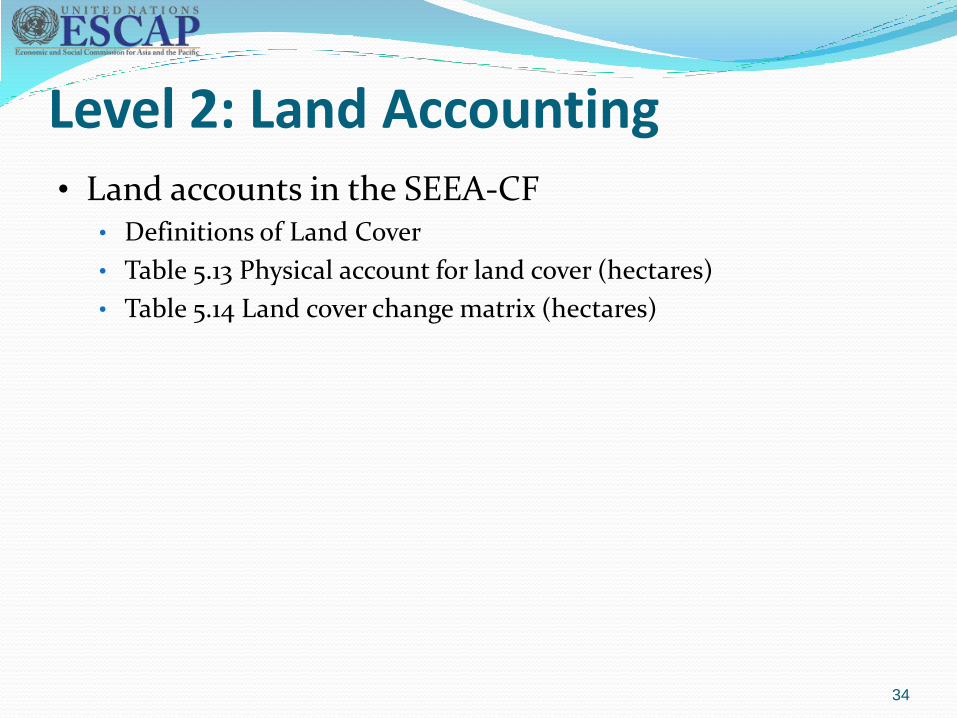
Level 2: Land Accounting • Land accounts in the SEEA-CF
• Definitions of Land Cover
• Table 5.13 Physical account for land cover (hectares)
• Table 5.14 Land cover change matrix (hectares)
34
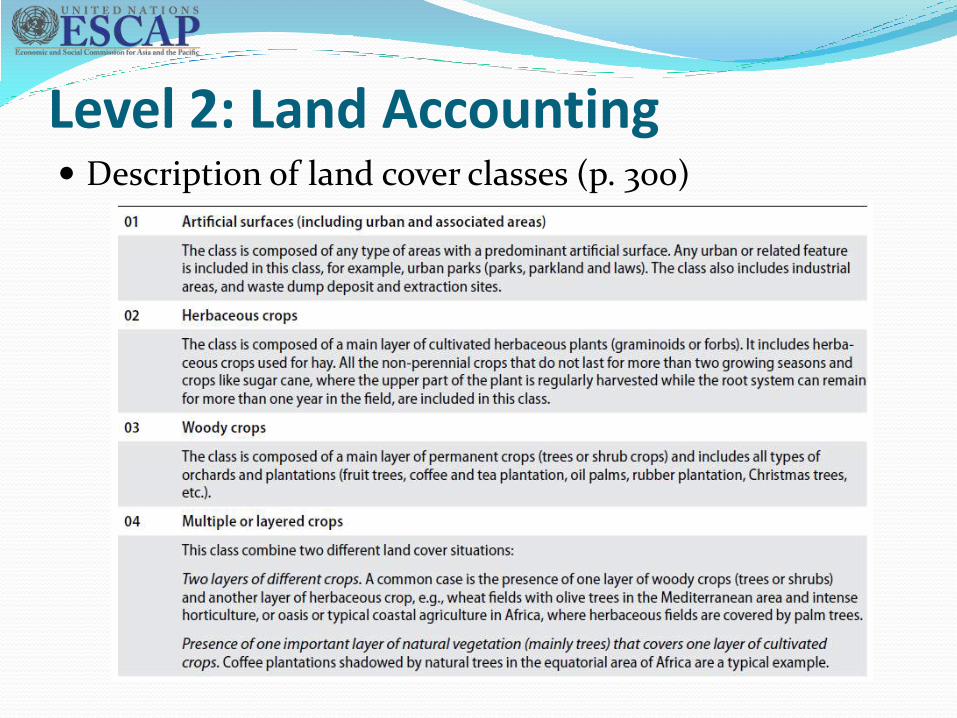
Description of land cover classes (p. 300)
Level 2: Land Accounting

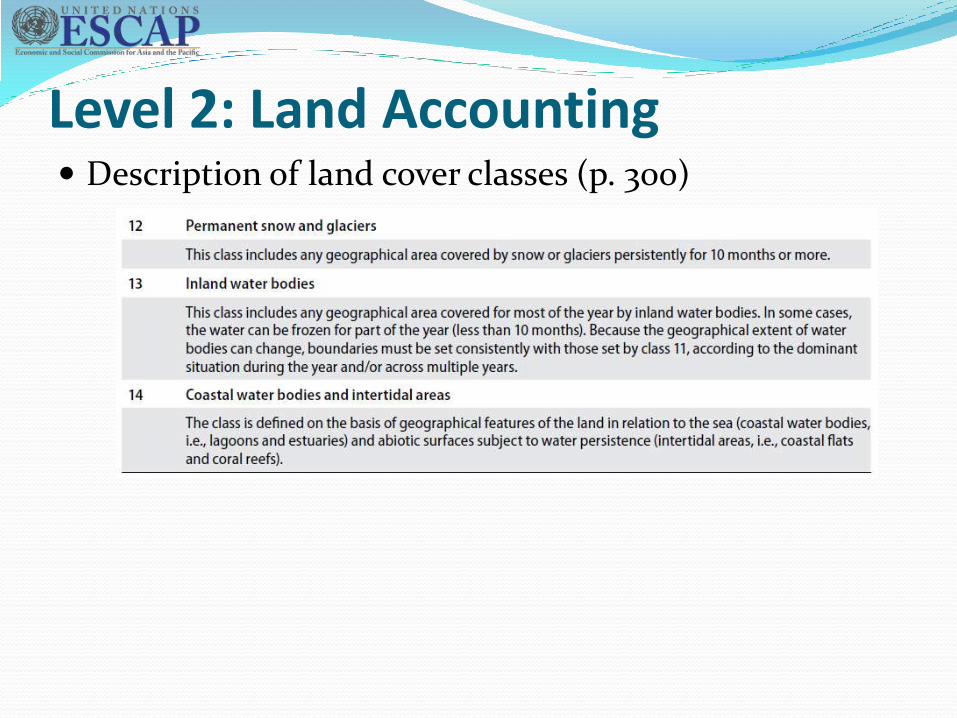
Description of land cover classes (p. 300)
Level 2: Land Accounting

Description of land cover classes (p. 300)
Level 2: Land Accounting
Description of land cover classes (p. 300)
Level 2: Land Accounting

Level 2: Land Accounting

• The land area of a country defines the scope of the land cover account. For most purposes this will be the area of land and associated inland waters.
• The account could be extended to coastal water bodies and intertidal areas.
• Managed expansion/regression: an increase/decrease in the area of a land cover type due to human activity. [matching entry]
• Natural expansion/regression: an increase/decrease in area resulting from natural processes. [matching entry]
• A matching entry is not recorded if there is a change in the total land area.
• Reappraisals (upward or downward): reflect changes due to the use of updated information that permits a reassessment of the size of the area of different land covers.
Scope and definitions (Table 5.13)
Level 2: Land Accounting

Level 2: Land Accounting

Level 2: Land Accounting What are “comparable” classes?
Land cover change analysis requires “comparable” land cover maps for two or more periods
Comparing different sources (scales, projections, classifications, methods…) can be done with:
Re-scaling, re-projecting
Re-classification (e.g., collapse classes)
Need to understand differences and assumptions
Detailed metadata are critical
42

Level 2: Land Accounting
43
What are “comparable” classes? From Uddin et. al (2014)
Compared “global” sources (columns) with detailed local corrections for Nepal (rows)
30-60% differences (e.g., grassland/agricultural)
“Reality check” with local information is essential!

Level 2: Land Accounting
44
What are “comparable” classes? From Statistics Canada (2016)
Collapsed 1971-2011 land cover to 3 classes Built-up, arable and natural & semi-natural
Less detail may make better comparisons

Level 2: Land Accounting
45
What are “comparable” classes? From INEGI (Mexico) Five historical series: difficult to compare Classification, scale, methods (corrections)
SERIES I 1985
Aerial photos Printed maps LANDSAT TM (30m)
Digital Maps
SPOT 5 (10 m)
SERIES II 1993
SERIES III 2002
SERIES IV 2007
LANDSAT (30 m)
SERIES V 2011
Integrated GIS Digital Maps Integrated GIS Integrated GIS
Source
Product

Level 2: Land Accounting
46
Land cover or land use? Land cover is physical and biological surface features
Often mis-interpreted or combined with land use e.g., forestry, agriculture, urban
Land use is social or economic function Forestry lands may have no trees Agricultural lands may have no crops Urban areas may have large parks or grasslands
Resource departments (forestry, agriculture, environment) often record “designated use” May not agree with land cover assessments
Agree on land cover first! Compare with resource departments on “use” Will also help resolve “ownership” issues

Level 2: Land Accounting
47
More detail than land cover may be required
Remote sensing data not always good at identifying: Small features (e.g., streams) Features underlying canopy (e.g., wetlands) Difference between crops and grasslands (see Nepal) Infrastructure (e.g., roads and transmission lines) Elevations (e.g., mountain vs. valley) & slopes
Establish basic spatial database & incrementally improve it
Level 2: Land Accounting
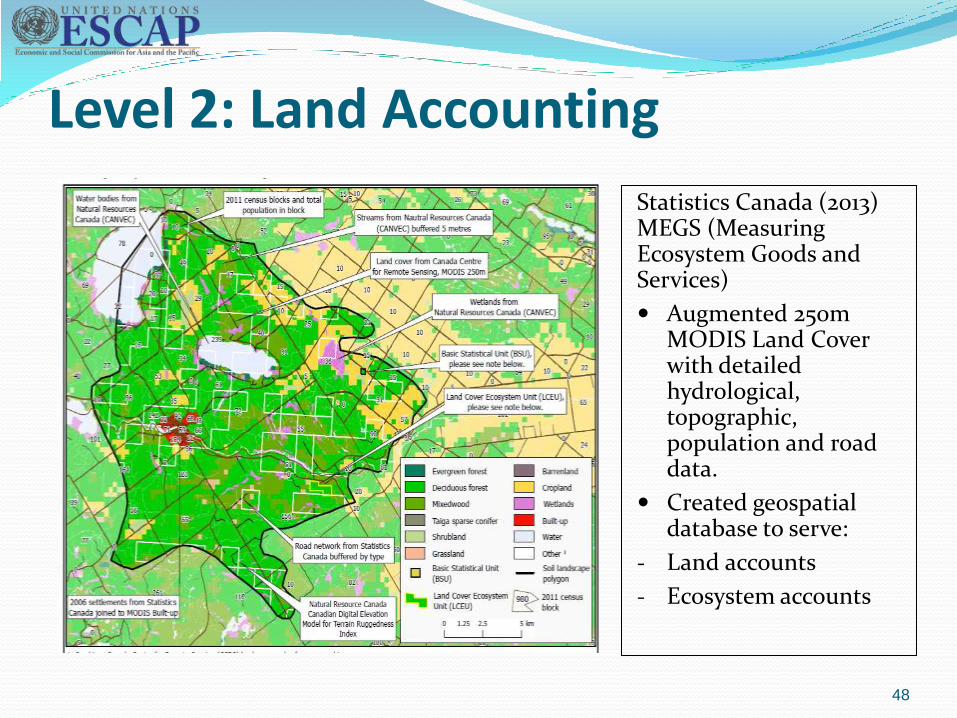
48
Statistics Canada (2013) MEGS (Measuring Ecosystem Goods and Services)
Augmented 250m MODIS Land Cover with detailed hydrological, topographic, population and road data.
Created geospatial database to serve:
- Land accounts
- Ecosystem accounts

Level 2: Land Accounting
Global land cover datasets
49
• FAO Global Land Cover-SHARE
http://www.glcn.org/databases/lc_glcshare_en.jsp
The FAO product Global
Land Cover-SHARE (year
2014 Beta-Release 1.0) is
constructed using the best
quality national and
international data sources.
11 land cover classes were
harmonized and reclassified
according to the SEEA-CF
land cover classification

Level 2: Land Accounting
Global land cover datasets
MODIS Land Cover
‘Land Cover Type Yearly L3’ (version 51 is the latest)
Annual products based on NASA’s MODIS imagery
Available at 500m x 500m spatial resolution. Land Cover Type 1: IGBP global vegetation classification scheme
Land Cover Type 2: University of Maryland (UMD) scheme
Land Cover Type 3: MODIS-derived LAI/fPAR scheme
Land Cover Type 4: MODIS-derived Net Primary Production (NPP) scheme
Land Cover Type 5: Plant Functional Type (PFT) scheme
Downloadable from http://reverb.echo.nasa.gov/
50

Level 2: Land Accounting
Global land cover datasets
51
GlobeLand30
http://www.globallandcover.com/GLC30Download/index.aspx
• High resolution (30m)
• Produced by China
• Years 2000 and 2010
• 10 land cover classes
• based on NASA
Landsat satellite
(freely available)

Level 2: Land Accounting Australia’s Land Accounts
Based on MODIS 250m Land Cover, aggregating 25 classes to seven categories
52

Level 2: Land Accounting • Related accounts
• Table 5.15 Physical asset account for forest and other wooded land
• Table 5.16 Monetary asset account for land (currency units)
• Table 5.17 Physical asset account for area of soil resources (hectares)
• Table 5.18 Physical asset account for volume of soil resources (cubic meters)
• Table 5.19 Physical asset account for timber resources (thousands of cubic metres over bark)
• Table 5.20 Monetary asset account for timber resources (currency units)
53

Level 2: Land Accounting
Concepts: Group Exercise (15m) (Groups of 3-5)
1. What national data and classifications for Land Accounts are already available for your country?
2. If there are no national sources, what data could you use to create a Land Account?
3. What would be the priorities (Cover, Use, Ownership; Agreement on “One Map”)
4. Discuss and report your results
54
Level 2: Land Accounting
Concepts group Exercise
Group reports: National data and classifications for Land Accounts
already available for your country
Alternative sources of data for Land Accounts?
Priorities for Land Accounting?
Discussion Who would need to participate in creating a pilot Land
Account?
55

Level 2: Land Accounting
Take home points
Land Cover maps, classified by the SEEA-CF classification are a useful starting point for creating a Land Account
Data need to be national and comparable
Global data for Land Cover may be used if there is no national alternative
An interdepartmental team should agree on “One Map”
56

Level 2: Land Accounting
Discussion and questions
57

Level 2: Land Accounting
References STATISTICS CANADA, 2016. Human Activity and the Environment: The changing landscape of
Canadian metropolitan areas 2016. 16-201-XWE. Ottawa: Government of Canada
STATISTICS CANADA, 2013. Human Activity and the Environment: Measuring Ecosystem Goods and Services 2013. 16-201-XWE. Ottawa: Government of Canada
AUSTRALIAN BUREAU OF STATISTICS, 2013. Land Account: Queensland, Experimental Estimates, 2013
Uddin, K., et al., Development of 2010 national land cover database for the Nepal, Journal of Environmental Management (2014), http://dx.doi.org/10.1016/j.jenvman.2014.07.047
Further Information SEEA Experimental Ecosystem Accounting (2012)
SEEA-EEA Technical Guidance (forthcoming)
Detailed supporting document on “Land Accounts and Ecosystem Extent” by UNSD
58

Acknowledgements
Parts of this presentation were originally developed for UNSD/UNEP/SCBD project “Advancing Natural Capital Accounting” supported by the Government of Norway.
Contact: [email protected]

Thank you for your kind attention
Michael Bordt
Regional Adviser on Environment Statistics
ESCAP Statistics Division
60