Embed Size (px)
Citation preview

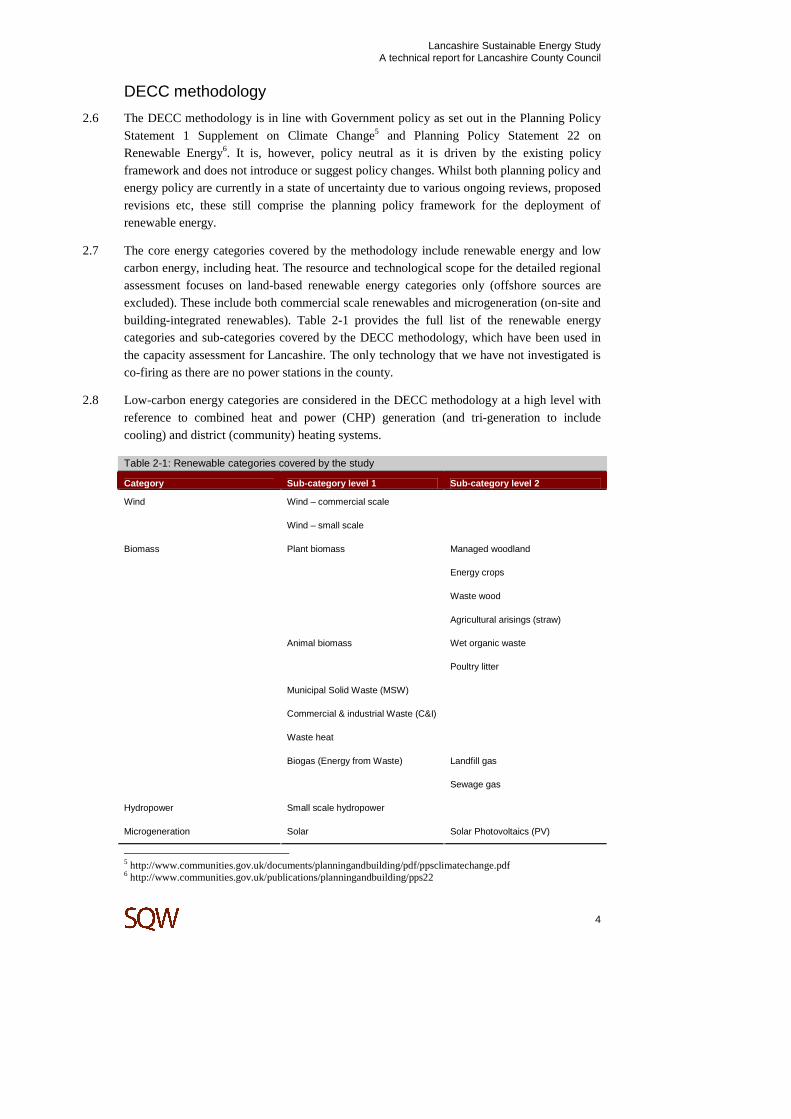
Lancashire Sustainable Energy Study
A technical report for Lancashire County Council
March 2011

Lancashire Sustainable Energy Study A technical report for Lancashire County Council
www.sqw.co.uk
Contents
1: Introduction .................................... ......................................................................................1
2: Methodology..................................... ....................................................................................3
3: Assumptions ..................................... ...................................................................................8
4: Variances from the North West and the South Penn ines report ..................................42
5: Interpretation of results and use of supporting resources .......................................... .46
Annex A: Map Index................................. ............................................................................ A-1
Annex B: ArcReader Tool Guide ...................... .................................................................. B-1
Contact: Rachel Brisley Tel: 0161 475 2115 email: [email protected]
Chris Fry Date: 31/03/11 Approved by:
Associate Director
Lancashire Sustainable Energy Study A technical report for Lancashire County Council
1
1: Introduction
1.1 SQW Ltd (SQW), supported by Maslen Environmental and CO2Sense, was commissioned by Lancashire County Council in February 2011 to undertake a study to facilitate the development of sustainable energy resources and provide follow up guidance and support to local planning authorities.
1.2 The purpose of the study is two fold:
• To bring the information contained in the North West Renewable and Low Carbon Energy Capacity and Deployment Study (2010) to a local footprint level by using the evidence base provided by the study to produce an individual bespoke reports for each of the fourteen Lancashire local authorities (LAs).
• To provide further technical advice to each LA to enable greater understanding of the potential for renewable energy development.
1.3 This technical report supports 14 individual reports, one for each of the Lancashire LAs, which provide an overview of potential technical capacity for renewable energy generation within each of the districts. This report is intended for those who require a greater understanding of the technical basis upon which these resource assessments have been undertaken. To a large degree it ‘shows the working’ behind these assessments.
1.4 The study methodology, investigated in more depth in Section 2, builds on the Northwest Renewable and Low Carbon Energy Capacity and Deployment Study1 which SQW and Land Use Consultants completed in 2010. This was undertaken using the national Renewable and Low-Carbon Energy Capacity Methodology developed by SQW for the Department for Energy and Climate Change (DECC) and Communities and Local Government (CLG) in 20102 (hereafter referred to as the DECC methodology). The focus of the North West study was to develop the evidence base for the potential for renewable energy across the region. The study provided a comprehensive assessment of the potential accessible energy resources at 2020, for the North West and each of its sub-regions. It identified that the Lancashire sub region has the potential to generate 25% of the total North West region’s renewable energy capacity (9,929MW). More specifically, the report concluded that:
The sub region has an extensive commercial scale wind resource (6,497MW or 28% of the Northwest’s total) and a corresponding 30% of the Northwest’s total small scale wind resource. It has a relatively balanced accessible resource potential across most biomass categories, with medium to high resources relative to other parts of the Northwest. It has significant microgeneration potential including 2,554MW for ground source and air source heat pumps (21% of the Northwest’s total resource).
1 http://www.nwriu.co.uk/research_and_intelligence/environment/environment_publications/renewable_capacity.aspx 2 http://www.decc.gov.uk/en/content/cms/what_we_do/uk_supply/energy_mix/renewable/ored/ored.aspx

Lancashire Sustainable Energy Study A technical report for Lancashire County Council
2
1.5 The purpose of this study is largely to disaggregate the results of the North West study down to the LA level. In some cases this has been straightforward due to the regional study being based on data provided at the LA level. In other cases some further work has been undertaken and new assumptions introduced to disaggregate the results and to improve the local evidence base with the latest data and approaches. Section 3 provides detailed descriptions of the assumptions used for the assessment of each renewable energy resource explaining where these deviate from the North West approach.
1.6 In addition to the 14 LA level resource assessment reports, this technical report is accompanied by the full dataset showing the data and calculations plus detailed assumptions for each resource assessment. In addition, it is accompanied by a package of GIS maps for each LA (accessible via an ArcReader tool). The maps provide further detail on the spatial variation of the results. All outputs can be accessed from www.lancashire.gov.uk.
1.7 The remainder of the report is set out in the following sections:
• Section 2 explains our approach and the methodology employed
• Section 3 details the assumptions used for each of the resource assessments, explaining where these deviate from the North West Study and DECC methodology assumptions
• Section 4 comprises advice concerning the interpretation of the results and the use of supporting resources.
1.8 In addition, there are two supporting annexes:
• Annex A lists the map resources that have been produced for each LA – these can be accessed from www.lancashire.gov.uk.
• Annex B contains the Guide for the use of the Arc Reader Tool.

Lancashire Sustainable Energy Study A technical report for Lancashire County Council
3
2: Methodology
2.1 This section sets out the approach used to undertake the individual renewable energy resource assessments for each of the Lancashire LAs.
2.2 The starting point in determining the potential for renewable energy in Lancashire was the methodology used in the 2010 North West study which in turn is in line with the original DECC methodology.
Context
2.3 The DECC methodology was produced following research commissioned in 2008 by CLG which found that there were considerable inconsistencies in the way renewable energy capacity had been defined, assessed and fed through to the setting of targets in Regional Spatial Strategies3. In order to ensure that work in the regions was sufficient to deliver a step change in renewable energy deployment across the country, and to reduce inconsistencies between regional assessments, the then in power Labour Government set out a commitment in the UK Renewable Energy Strategy (2009)4 to support the regions in reviewing their assessments and targets for renewable energy. This provided the basis for commissioning the methodology which was intended to help regions assess the potential for renewable energy in their area on a consistent basis, provide the evidence base for setting targets within Regional Strategies, and to help regions plan for new developments and support Government policy and targets.
2.4 Clearly the world has changed considerably over the last 12 months with the election of the Coalition Government, revocation of Regional Spatial Strategies and introduction of the Localism Bill with a much greater focus on devolving power and decision-making to local levels. The Coalition Government has taken forward the commitment to maximise renewable energy deployment across the country and whilst not requiring regional targets, continues to support local authorities and other policy and decision makers in maximising the potential for renewable energy via programmes such as the Climate Change Local Area Support Programme (CLASP) through which this study has been funded. Therefore, it remains very important for local authorities to have in place a robust evidence base concerning the potential capacity for renewable energy and it makes sense for this to be developed on a consistent basis across counties.
2.5 The remainder of this section provides an overview of the DECC methodology, followed by a brief explanation of how this was used to undertake the North West study. Finally, detail is provided on how the results of the North West study were disaggregated to the levels of individual LAs across Lancashire.
3 Renewable Energy Capacity in Regional Spatial Strategies: Final Report (2008) Arup 4 The UK Renewable Energy Strategy (July 2009) DECC
Lancashire Sustainable Energy Study A technical report for Lancashire County Council
4
DECC methodology
2.6 The DECC methodology is in line with Government policy as set out in the Planning Policy Statement 1 Supplement on Climate Change5 and Planning Policy Statement 22 on Renewable Energy6. It is, however, policy neutral as it is driven by the existing policy framework and does not introduce or suggest policy changes. Whilst both planning policy and energy policy are currently in a state of uncertainty due to various ongoing reviews, proposed revisions etc, these still comprise the planning policy framework for the deployment of renewable energy.
2.7 The core energy categories covered by the methodology include renewable energy and low carbon energy, including heat. The resource and technological scope for the detailed regional assessment focuses on land-based renewable energy categories only (offshore sources are excluded). These include both commercial scale renewables and microgeneration (on-site and building-integrated renewables). Table 2-1 provides the full list of the renewable energy categories and sub-categories covered by the DECC methodology, which have been used in the capacity assessment for Lancashire. The only technology that we have not investigated is co-firing as there are no power stations in the county.
2.8 Low-carbon energy categories are considered in the DECC methodology at a high level with reference to combined heat and power (CHP) generation (and tri-generation to include cooling) and district (community) heating systems.
Table 2-1: Renewable categories covered by the study
Category Sub-category level 1 Sub-category level 2
Wind – commercial scale Wind
Wind – small scale
Plant biomass Managed woodland
Energy crops
Waste wood
Agricultural arisings (straw)
Animal biomass Wet organic waste
Poultry litter
Municipal Solid Waste (MSW)
Commercial & industrial Waste (C&I)
Waste heat
Biogas (Energy from Waste) Landfill gas
Biomass
Sewage gas
Hydropower Small scale hydropower
Microgeneration Solar Solar Photovoltaics (PV)
5 http://www.communities.gov.uk/documents/planningandbuilding/pdf/ppsclimatechange.pdf 6 http://www.communities.gov.uk/publications/planningandbuilding/pps22
Lancashire Sustainable Energy Study A technical report for Lancashire County Council
5
Category Sub-category level 1 Sub-category level 2
Solar Water Heating (SWH)
Heat pumps Ground Source Heat Pump (GSHP)7
Air Source Heat Pump (ASHP)8
Low carbon CHP and tri-generation
Source: SQW
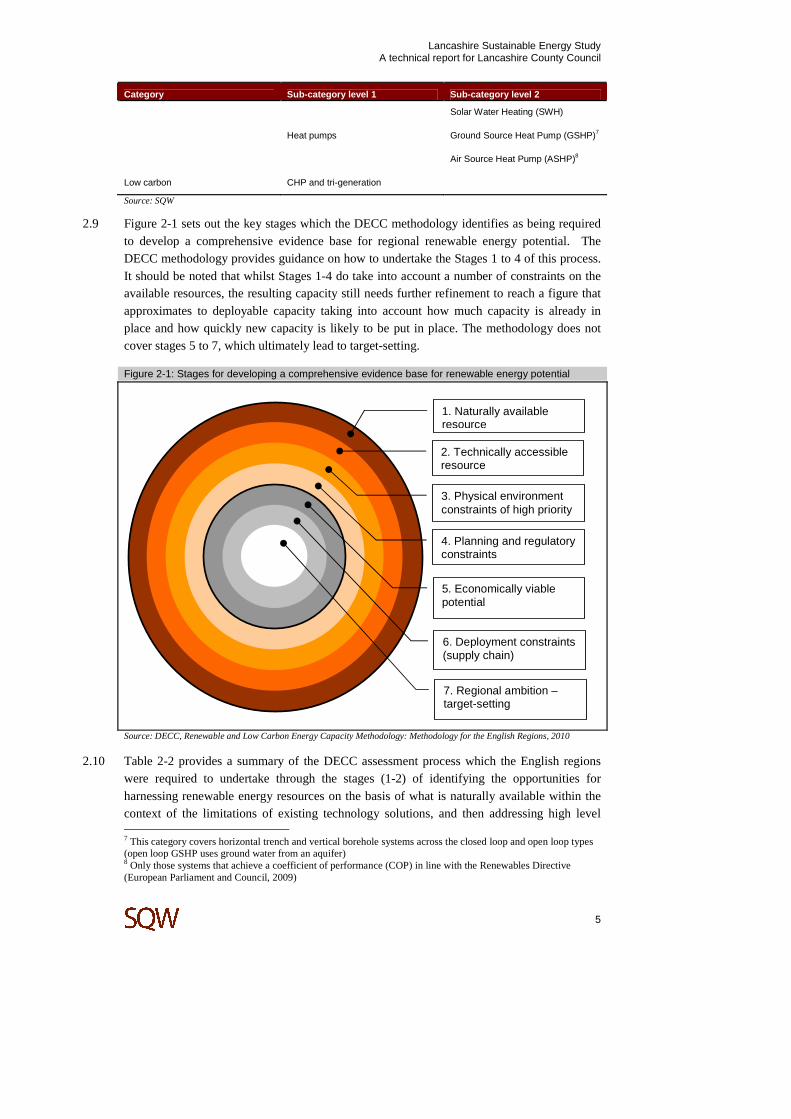
2.9 Figure 2-1 sets out the key stages which the DECC methodology identifies as being required to develop a comprehensive evidence base for regional renewable energy potential. The DECC methodology provides guidance on how to undertake the Stages 1 to 4 of this process. It should be noted that whilst Stages 1-4 do take into account a number of constraints on the available resources, the resulting capacity still needs further refinement to reach a figure that approximates to deployable capacity taking into account how much capacity is already in place and how quickly new capacity is likely to be put in place. The methodology does not cover stages 5 to 7, which ultimately lead to target-setting.
Figure 2-1: Stages for developing a comprehensive evidence base for renewable energy potential
Source: DECC, Renewable and Low Carbon Energy Capacity Methodology: Methodology for the English Regions, 2010
2.10 Table 2-2 provides a summary of the DECC assessment process which the English regions were required to undertake through the stages (1-2) of identifying the opportunities for harnessing renewable energy resources on the basis of what is naturally available within the context of the limitations of existing technology solutions, and then addressing high level 7 This category covers horizontal trench and vertical borehole systems across the closed loop and open loop types (open loop GSHP uses ground water from an aquifer) 8 Only those systems that achieve a coefficient of performance (COP) in line with the Renewables Directive (European Parliament and Council, 2009)
1. Naturally available resource
2. Technically accessible resource
3. Physical environment constraints of high priority
4. Planning and regulatory constraints
5. Economically viable potential
6. Deployment constraints (supply chain)
7. Regional ambition – target-setting

Lancashire Sustainable Energy Study A technical report for Lancashire County Council
6
resource constraints (stages 3-4) to the deployment of technologies in relation to the physical environment and planning regulatory limitations to identify a more realistic measure of capacity and potential. It is appropriate to adopt the same approach to undertake sub-regional and local assessments whilst allowing for some of the assumptions behind the calculations to be more tailored to the local situation.
Table 2-2: DECC methodology
Main element Stage and description
Opportunity analysis
Stage 1: Naturally available resource Regions need to explore and quantify the naturally available renewable energy resource within their geographical boundary. This will be based on data and information analysis including resource maps and inventories.
Stage 2: Technically accessible resource Regions need to estimate how much of the natural resource can be harnessed using commercialised technology (currently available or expected to reach the market by 2020).
Constraints analysis
Stage 3: Physical environment constraints Regions need to explore the physical barriers to deployment such as areas where renewables schemes cannot practically be built e.g. large scale wind turbines on roads and rivers etc. This layer of constraints will reduce the overall deployment opportunity. The analysis will be based on GIS maps and various relevant regional inventories.
Stage 4: Planning and regulatory constraints Regions need to apply a set of constraints relevant to each renewable technology that reflects the current planning and regulatory framework, such as excluding from the assessment areas and resources which cannot be developed due to e.g. health and safety, air/water quality, environmental protection etc.
Source: SQW
2.11 For both the opportunity and constraints analyses, the methodology sets out a list of parameters and key data sources which should be used. Clearly, the parameters vary between the different renewables categories and require different levels of data input and assessment. Some of the information and assessments required are available at national level (e.g. for small scale hydro) and therefore detailed assessments do not need to be undertaken at the regional or lower spatial levels. However, for most on-shore renewables categories, regional (and sub-regional or local) assessments are necessary. The assumptions to be employed and datasets utilised are set out in Section 2.
North West Study
2.12 The North West Study utilised the DECC methodology to produce an assessment of the technically available renewable energy capacity for the region for the renewables categories identified in Table 2-1. It then went beyond this to determine deployment rates in light of identified deployment constraints and economic viability. The project also developed a mechanism for setting regional targets for renewable deployment and a framework for monitoring progress against these targets into the future. The Lancashire study does not proceed beyond the assessment of potential technical capacity.

Lancashire Sustainable Energy Study A technical report for Lancashire County Council
7
2.13 The first stage within this study was to undertake a review of existing studies and data (including GIS data) across the North West relating to renewable and low carbon technologies. The most relevant were systematically assessed in terms of degree of consistency with the approach of the DECC methodology for each relevant technology and scale. In parallel with a review of previous studies, and in preparation for the GIS based analysis (required for certain technologies), a ‘bottom up’ review was undertaken of the GIS data sources. None of these studies (other than those concerning regional estimates of sewage) were completely consistent with the DECC methodology, which is unsurprising as it was only published in 2010. These, along with the experience of undertaking the North West study resulted in some of the underlying assumptions and datasets within the DECC methodology being refined to fit the local circumstances of the region (these are all detailed in Section 2). It does however remain consistent with the DECC methodology.
2.14 The North West Study identified the overall renewable energy capacity for Lancashire to be 9,929 MW – just under 25% of the region’s total capacity. The key components of this capacity are displayed in Table 2-3:
Table 2-3: Renewable energy resource potential for Lancashire
Renewable energy resource Capacity (MW electricity and heat)
Wind (commercial and small scale) 6,698
Plant Biomass 43
Animal Biomass 51
Waste 87
Hydropower 10
Microgeneration 3,030
Total 9,929
Source: Northwest renewable and low carbon energy capacity and deployment project report, 2010, SQW and LUC
Lancashire study
2.15 The focus within this study for Lancashire has been to provide a consistent evidence base at the LA level to help the individual LAs better facilitate, plan and encourage increased deployment of renewable energy generation. It has been largely focused on taking the results for the North West study down to a local footprint. This has been done on a fairly straightforward basis for those technologies where datasets were originally provided at the LA level. However, others have required additional work to disaggregate the results to LA level – this is fully explained in the next Section 2.
2.16 This study has also considered the potential from low carbon sources and also undertaken an overview grid constraint analysis to provide initial thoughts on taking forward the renewable energy capacity identified with regards to access to the grid.

Lancashire Sustainable Energy Study A technical report for Lancashire County Council
8
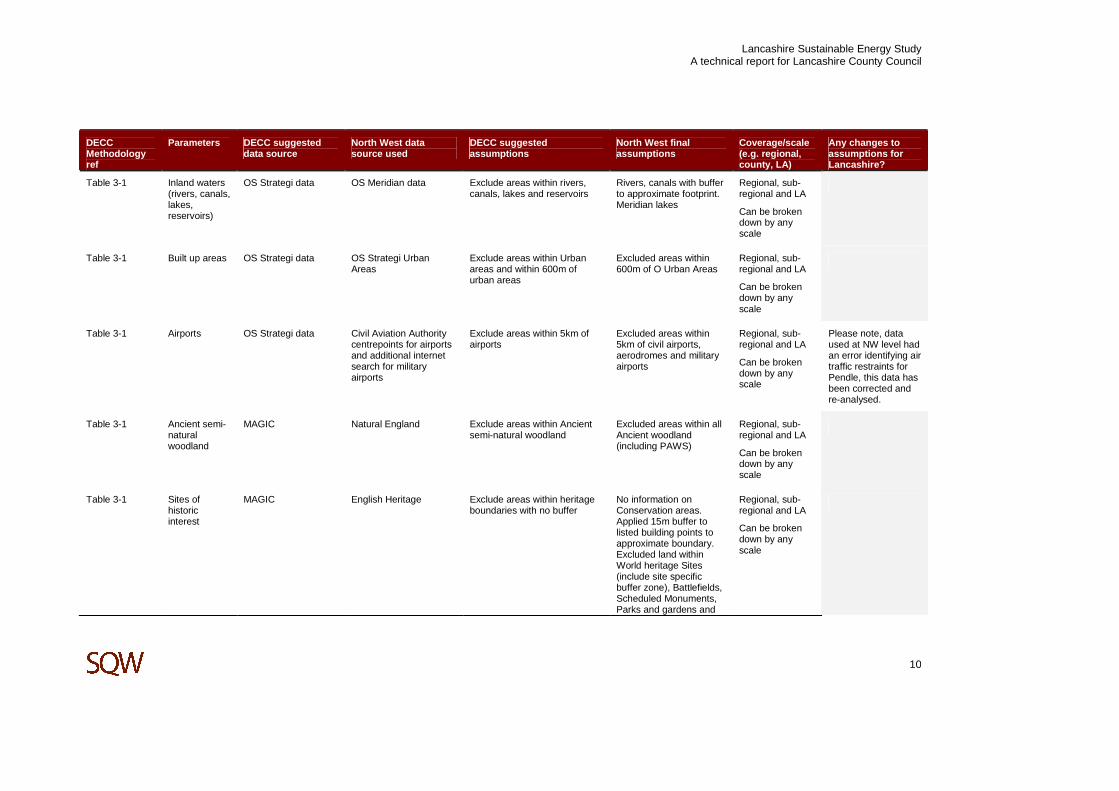
3: Assumptions
3.1 This section provides further detail of the assumptions that underpin the assessments undertaken for each of the different resource technologies. The following tables summarise the DECC methodology suggested datasets and assumptions, those that were adopted within the North West Study (including an explanation of how they differ from the national methodology) and then details where any assumptions or datasets have been changed for the Lancashire study. Following the review of assumptions, a brief summary is provided highlighting where resource assessments differ in approach and subsequently results from the North West study. In addition, Maslen Environmental undertook a detailed study for Burnley Borough Council, Pendle Borough Council, Rossendale Borough Council, Calderdale Metropolitan Borough Council and Kirklees Metropolitan Council, entitled the South Pennines Renewable and Low Carbon Energy Study, in 2009. Again we explain, in broad terms, why results may differ from this study.
3.2 The tables cover the following renewable energy technologies:
• Commercial and small scale wind
• Plant biomass - managed woodland, energy crops, waste wood and agricultural arisings
• Animal biomass – wet organic waste and poultry litter
• Municipal Solid Waste
• Commercial and Industrial waste
• Landfill gas
• Sewage gas
• Small scale hydropower
• Microgeneration – solar and heat pumps
• Low Carbon.
3.3 Following the tables is a more detailed explanation of the methodologies for the low carbon, waste heat and grid constraints assessment; the latter two were not included within the DECC methodology or the North West study.

Lancashire Sustainable Energy Study A technical report for Lancashire County Council
9
Table 3-1: Assumptions for commercial wind
DECC Methodology ref
Parameters DECC suggested data source
North West data source used
DECC suggested assumptions
North West final assumptions
Coverage/scale (e.g. regional, county, LA)
Any changes to assumptions for Lancashire?
Commercial scale wind
Table 3-1 Wind Speed NOABL
NOABL Include area with wind speed 5 m/s at 45m above ground level (agl)
Include area with wind speed 5 m/s at 45m above ground level (agl)
Regional, sub-regional and LA
Can be broken down by any scale
Table 3-1 Turbine size Use 2.5MW turbine (tip height 135m, rotor diameter 100m, hub height 85m)
Turbine 2.5MW Use 2.5MW turbine (tip height 135m, rotor diameter 100m, hub height 85m)
Use 2.5MW turbine (tip height 135m, rotor diameter 100m, hub height 85m)
Regional, sub-regional and LA
Can be broken down by any scale
Table 3-1 Turbine density
Use greater of 9MW/km square or distance of 5 rotor diameters between turbines (500m), whichever is larger
Use 500m theoretical spacing between turbines
Use greater of 9MW/km square or distance of 5 rotor diameters between turbines (500m), whichever is larger
Use 500m theoretical spacing between turbines
Regional, sub-regional and LA
Can be broken down by any scale
Table 3-1 Roads (A Roads, B Roads, Motorways)
OS Strategi data OS Strategi data Exclude areas within roads and within 150m of roads
Applied buffers to approximate footprint of road and additional topple distance buffer
Regional, sub-regional and LA
Can be broken down by any scale
Table 3-1 Railways OS Strategi data OS Meridian data Exclude areas within railways and within 150m of railways
Applied buffers to approximate footprint of Railways and additional topple distance buffer
Regional, sub-regional and LA
Can be broken down by any scale
Lancashire Sustainable Energy Study A technical report for Lancashire County Council
10
DECC Methodology ref
Parameters DECC suggested data source
North West data source used
DECC suggested assumptions
North West final assumptions
Coverage/scale (e.g. regional, county, LA)
Any changes to assumptions for Lancashire?
Table 3-1 Inland waters (rivers, canals, lakes, reservoirs)
OS Strategi data OS Meridian data Exclude areas within rivers, canals, lakes and reservoirs
Rivers, canals with buffer to approximate footprint. Meridian lakes
Regional, sub-regional and LA
Can be broken down by any scale
Table 3-1 Built up areas OS Strategi data OS Strategi Urban Areas
Exclude areas within Urban areas and within 600m of urban areas
Excluded areas within 600m of O Urban Areas
Regional, sub-regional and LA
Can be broken down by any scale
Table 3-1 Airports OS Strategi data Civil Aviation Authority centrepoints for airports and additional internet search for military airports
Exclude areas within 5km of airports
Excluded areas within 5km of civil airports, aerodromes and military airports
Regional, sub-regional and LA
Can be broken down by any scale
Please note, data used at NW level had an error identifying air traffic restraints for Pendle, this data has been corrected and re-analysed.
Table 3-1 Ancient semi-natural woodland
MAGIC Natural England Exclude areas within Ancient semi-natural woodland
Excluded areas within all Ancient woodland (including PAWS)
Regional, sub-regional and LA
Can be broken down by any scale
Table 3-1 Sites of historic interest
MAGIC English Heritage Exclude areas within heritage boundaries with no buffer
No information on Conservation areas. Applied 15m buffer to listed building points to approximate boundary. Excluded land within World heritage Sites (include site specific buffer zone), Battlefields, Scheduled Monuments, Parks and gardens and
Regional, sub-regional and LA
Can be broken down by any scale

Lancashire Sustainable Energy Study A technical report for Lancashire County Council
11
DECC Methodology ref
Parameters DECC suggested data source
North West data source used
DECC suggested assumptions
North West final assumptions
Coverage/scale (e.g. regional, county, LA)
Any changes to assumptions for Lancashire?
listed buildings
Table 3-1 Civil air traffic control constraints
None Met office Zones and MOD Low fly zones
None Exclude high priority low fly zones and two inner rings of Met Office Zones
Regional, sub-regional and LA
Can be broken down by any scale
Table 3-1 MOD constraints
MOD N/A Exclude training sites, explosive safeguarded areas, danger areas near ranges, MOD sites (other operational and unused land), air defence and air traffic control radar, other safeguarded areas, MOD byelaws
None
Regional, sub-regional and LA
Can be broken down by any scale
Table 3-1 International and national nature conservation designations
MAGIC Natural England Do separate assessment Excluded all these designations (SPA, SAC, Ramsar, NNR, SSSI)
Regional, sub-regional and LA. Can be broken down by any scale
Table 3-1 Landscape designations (National Parks and AONB's) and Heritage Coast
MAGIC Natural England Do separate assessment Assume zero deployment Landscape designation
Table 3-1 Within 2km of landscape designations
N/A Natural England N/A Assume zero deployment Landscape designation

Lancashire Sustainable Energy Study A technical report for Lancashire County Council
12
DECC Methodology ref
Parameters DECC suggested data source
North West data source used
DECC suggested assumptions
North West final assumptions
Coverage/scale (e.g. regional, county, LA)
Any changes to assumptions for Lancashire?
Table 3-1 Within potential national park extensions
N/A Natural England N/A Test a scenario with zero deployment
Landscape designation
Table 3-1 Bird sensitive areas
N/A Natural England/RSPB England sensitivity map
N/A Assume 50% deployment in high and medium sensitivity areas
1km grid covering whole of England
Table 3-1 Peat designations
N/A Natural England/BGS N/A Assume 50% deployment No data supplied
Summary of methodology
The analysis was undertaken using GIS data. All opportunities (wind speed above the threshold of 5m/s at 45m agl) were mapped and then constraints (non-accessible and exclusion areas) collated in GIS and removed from the opportunities layer. This left a layer of ‘unconstrained’ land which was examined in terms of the density of turbines it could potentially accommodate. Consultation with Natural England and others determined the approach to protected landscapes and other sensitive areas.
Wind speeds are not assumed to change significantly over time and therefore current results are assumed to be the same at 2020.
Source: Maslen Environmental

Lancashire Sustainable Energy Study A technical report for Lancashire County Council
13
Table 3-2: Assumptions for small scale wind
DECC Methodology ref
Parameters DECC suggested data source
North West data source used
DECC suggested assumptions
North West final assumptions
Coverage/scale (e.g. regional, county, LA)
Any changes to assumptions for Lancashire?
Small scale wind
Table 3-2 Wind Speed NOABL NOABL Include area with wind speed 4.5 m/s at 10m above ground level (agl)
Include area with wind speed 4.5 m/s at 10m above ground level (agl)
Regional, sub-regional and LA
Can be broken down by any scale
Table 3-2 Scaled wind speed
NOABL/Address data/wards
NOABL/Address data/wards
Include address points where scaled wind speed 4.5m/s at 10m above ground level (agl). Assume scaling factor of 56% for urban, 67% for suburban, 100% for rural
Include address points where scaled wind speed 4.5 m/s at 10m above ground level (agl). Assume scaling factor of 56% for urban, 67% for suburban, 100% for rural
Regional, sub-regional and LA
Can be broken down by any scale
Table 3-2 Address points
OS Address Point OS Mastermap Address Layer 2
Estimate total number of residential and non-residential buildings
Use NLUD classification within address data to classify as residential, commercial and industrial. Others excluded. Unless categorised in NLUD as dwelling, address point must be postal/multi-occupancy and permanent building
Regional, sub-regional and LA
Can be broken down by any scale
Table 3-2 Turbine size 6kW per address point
6kW per address point 6kW per address point 6kW per address point Regional, sub-regional and LA. Can be broken down by any scale

Lancashire Sustainable Energy Study A technical report for Lancashire County Council
14
DECC Methodology ref
Parameters DECC suggested data source
North West data source used
DECC suggested assumptions
North West final assumptions
Coverage/scale (e.g. regional, county, LA)
Any changes to assumptions for Lancashire?
Table 3-2 Ward classification
DEFRA Rural Definition dataset
DEFRA Rural Definition dataset
Classify wards as urban, suburban or rural
Classified as Urban, semi-urban or rural
Regional, sub-regional and LA
Can be broken down by any scale
DEFRA classifies wards as Urban >10k (urban), Town and Fringe (semi-urban) and Village, hamlet and isolated dwellings (rural)
Summary of methodology
This assessment was GIS based and involved identifying the number of residential and non-residential properties within an area and assuming that a 6kW machine would be installed on all sites with a wind speed above 4.5m/s. A wind speed scaling factor was applied to take account of the potential for obstructions in built up areas to reduce the average wind speeds and therefore the number of suitable properties. Consultation was undertaken with Natural England concerning the deployment of small scale wind in protected landscapes.
Wind speeds are not assumed to change significantly over time and therefore current results assumed to the same at 2020.
Source: Maslen Environmental

Lancashire Sustainable Energy Study A technical report for Lancashire County Council
15
Table 3-3: Assumptions for managed woodland
DECC Methodology ref
Parameters DECC suggested data source
North West data source used
DECC suggested assumptions
North West final assumptions
Coverage/scale (e.g. regional, county, LA)
Any changes to assumptions for Lancashire?
Managed Woodland
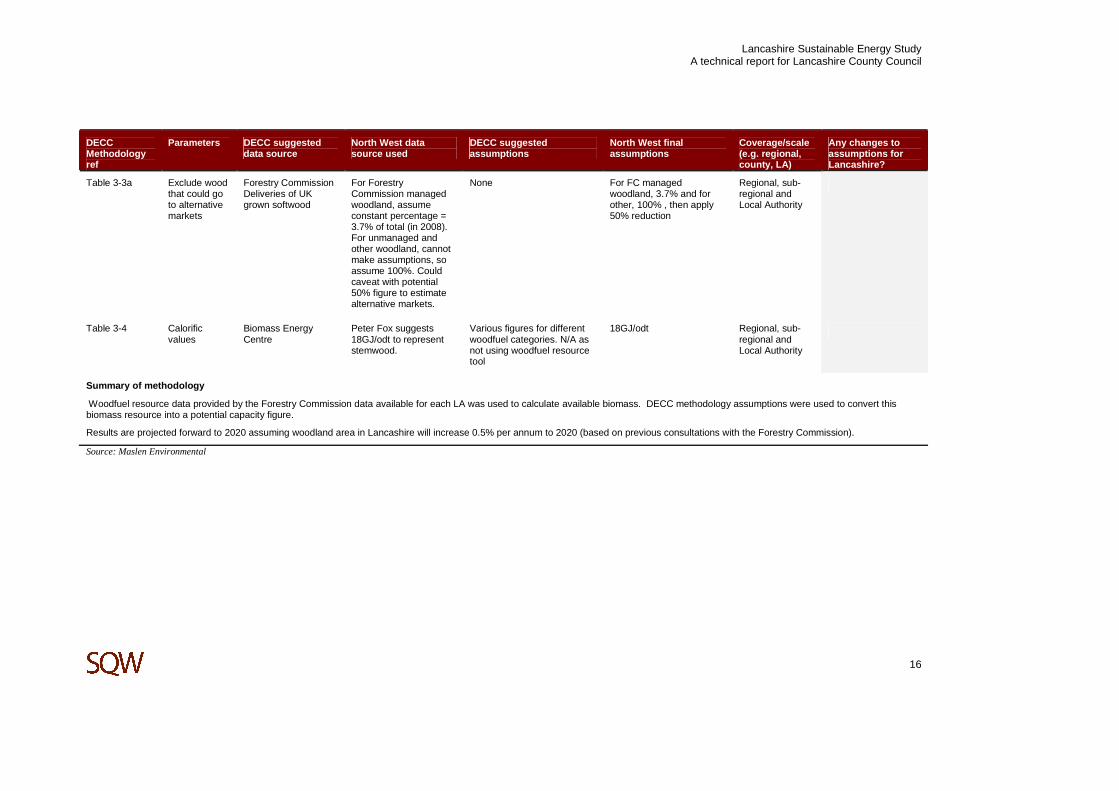
Table 3-3a Amount of biomass available in the region in odt
Option 1) Woodfuel Resource Tool or
Option 2) National Inventory of Woodlands and Trees
Peter Fox (FC) provided woodland data for North West region split by broad type and management. Peter recommended not using Resource tool data, and starting with raw data to build up sub-regional picture. Resource Tool data not available at sub-regional level
N/A Use Forestry Commission managed woodland, Non-FC managed and undermanaged woodland as well as Grants and Licensing Activity woodland. Yield classes of 4 (Broadleaved), 12 (conifers) and 6 (mixed woodland). Do not use non-productive woodland. 1 cubic metre = 1 green tonne. Loss of 50% when converting from green tonnes to oven dried tonnes
Regional, sub-regional and Local Authority
Parameters agreed with Forestry Commission as per North West Study
Table 3-3a Exclude woodfuel uneconomic to harvest
None given No actual data to calculate this. Peter Fox would prefer to see total theoretical figure of all woodland and follow this up with a caveat that states an estimate of 50% may be unavailable due to constraints such as access, owner objectives and economics. Woodfuel Strategy's 2 million tonnes figure by 2020 represents an aspirational target of 50% of what is available.
None Followed Peter Fox suggestions, but will need to present this very carefully in the reporting. Table shows 50% reduction
Regional, sub-regional and Local Authority
Parameters agreed with Forestry Commission as per North West Study
Lancashire Sustainable Energy Study A technical report for Lancashire County Council
16
DECC Methodology ref
Parameters DECC suggested data source
North West data source used
DECC suggested assumptions
North West final assumptions
Coverage/scale (e.g. regional, county, LA)
Any changes to assumptions for Lancashire?
Table 3-3a Exclude wood that could go to alternative markets
Forestry Commission Deliveries of UK grown softwood
For Forestry Commission managed woodland, assume constant percentage = 3.7% of total (in 2008). For unmanaged and other woodland, cannot make assumptions, so assume 100%. Could caveat with potential 50% figure to estimate alternative markets.
None For FC managed woodland, 3.7% and for other, 100% , then apply 50% reduction
Regional, sub-regional and Local Authority
Table 3-4 Calorific values
Biomass Energy Centre
Peter Fox suggests 18GJ/odt to represent stemwood.
Various figures for different woodfuel categories. N/A as not using woodfuel resource tool
18GJ/odt Regional, sub-regional and Local Authority
Summary of methodology
Woodfuel resource data provided by the Forestry Commission data available for each LA was used to calculate available biomass. DECC methodology assumptions were used to convert this biomass resource into a potential capacity figure.
Results are projected forward to 2020 assuming woodland area in Lancashire will increase 0.5% per annum to 2020 (based on previous consultations with the Forestry Commission).
Source: Maslen Environmental

Lancashire Sustainable Energy Study A technical report for Lancashire County Council
17
Table 3-4: Assumptions for energy crops
DECC Methodology ref
Parameters DECC suggested data source
North West data source used
DECC suggested assumptions
North West final assumptions
Coverage/scale (e.g. regional, county, LA)
Any changes to assumptions for Lancashire?
Energy crops
Table 3-3b Existing areas of established SRC and Miscanthus Existing areas of established SRC and Miscanthus
Woodland Grant Scheme, Natural England, National Non-food crops centre
Natural England Use all schemes Used all Energy Crop Schemes data Natural England provided
Sub-regional and LA.
Table 3-3b Amount of land available for growing energy crops (ha) - HIGH scenario
Assume all available arable land and pasture will be planted with energy crops
Rural Payments Agency with DEFRA agricultural land classification
DEFRA agricultural land classification
Use Grades 3 and 4 Use Grades 3 and 4 Sub-regional
Table 3-3b Amount of land available for growing energy crops (ha) - HIGH scenario. Assume all available arable land and pasture will be planted with energy
Rural Payments Agency with DEFRA agricultural land classification
DEFRA energy crop opportunity maps
Use highest yield where SRC and Miscanthus overlap
Combined SRC and Miscanthus and took highest yield for each square. Where equal, assume miscanthus because DECC method assumes miscanthus 15GJ/odt and SRC 10GJ/odt
Sub-regional
Lancashire Sustainable Energy Study A technical report for Lancashire County Council
18
DECC Methodology ref
Parameters DECC suggested data source
North West data source used
DECC suggested assumptions
North West final assumptions
Coverage/scale (e.g. regional, county, LA)
Any changes to assumptions for Lancashire?
crops
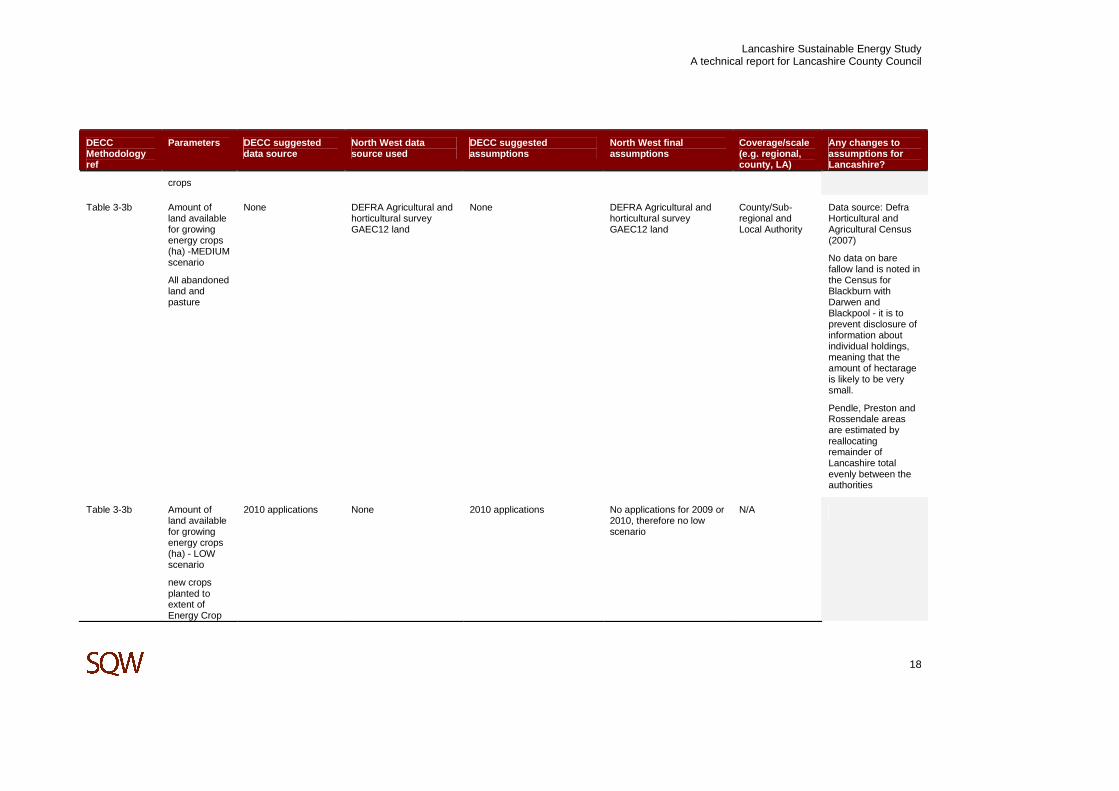
Table 3-3b Amount of land available for growing energy crops (ha) -MEDIUM scenario
All abandoned land and pasture
None DEFRA Agricultural and horticultural survey GAEC12 land
None DEFRA Agricultural and horticultural survey GAEC12 land
County/Sub-regional and Local Authority
Data source: Defra Horticultural and Agricultural Census (2007)
No data on bare fallow land is noted in the Census for Blackburn with Darwen and Blackpool - it is to prevent disclosure of information about individual holdings, meaning that the amount of hectarage is likely to be very small.
Pendle, Preston and Rossendale areas are estimated by reallocating remainder of Lancashire total evenly between the authorities
Table 3-3b Amount of land available for growing energy crops (ha) - LOW scenario
new crops planted to extent of Energy Crop
2010 applications None 2010 applications No applications for 2009 or 2010, therefore no low scenario
N/A

Lancashire Sustainable Energy Study A technical report for Lancashire County Council
19
DECC Methodology ref
Parameters DECC suggested data source
North West data source used
DECC suggested assumptions
North West final assumptions
Coverage/scale (e.g. regional, county, LA)
Any changes to assumptions for Lancashire?
Scheme for 2010
Table 3-3b Required amount of biomass per MW capacity
Electricity: 6000odt/MW
Electricity: 6000odt/MW Electricity: 6000odt/MW Electricity: 6000odt/MW N/A
Table 3-3b Required amount of biomass per MW capacity
Heat: varied assumptions based on diameter
Heat: 18GJ/odt Heat: varied assumptions based on diameter
Heat: 18GJ/odt N/A
Table 3-3b Exclusion areas: Permanent grassland/pasture
MAGIC IACS database Exclude Select all permanent grassland IACS points within remaining opportunity areas and subtract total area
County/sub-regional
Table 3-3b Exclusion areas: Public rights of way and buffers
MAGIC None exclude PROW and buffers (3m RC, 5m Miscanthus)
None - no data available N/A
Table 3-3b Common land MAGIC Natural England Exclude Exclude County/sub-regional
Table 3-3b Exclusion areas: SPS Cross-compliance buffers
MAGIC Percentage reduction on total land area
None 15% reduction to account for buffers and other non cropped areas. Based on average field size from IACS database
County/sub-regional
Table 3-3b Exclusion areas: Nature conservation
MAGIC Natural England Exclude Exclude County/sub-regional
Table 3-3b Exclusion MAGIC English Heritage Exclude Exclude County/sub-

Lancashire Sustainable Energy Study A technical report for Lancashire County Council
20
DECC Methodology ref
Parameters DECC suggested data source
North West data source used
DECC suggested assumptions
North West final assumptions
Coverage/scale (e.g. regional, county, LA)
Any changes to assumptions for Lancashire?
areas: Heritage
regional
Table 3-3b Environmental impacts: water stressed areas
Consult EA None Consult EA None County/sub-regional
Not excluded
Table 3-3b Environmental impacts: biodiversity impacts
Consult NE Consult NE Consult NE Consult NE: response too late to be included in assessment
Consult NE: response too late to be included in assessment
Not excluded
Table 3-3b Environmental impacts: protected landscapes
Consult NE Consult NE Consult NE Consult NE: response too late to be included in assessment
Consult NE: response too late to be included in assessment
Not excluded
Summary of methodology
The DECC methodology requires the generation of estimates for heat and electricity from biomass energy crops under three scenarios - high, medium and low as follows:
• High – Assumes that all available arable land and pasture will be planted with energy crops
• Medium – Assumes that all abandoned land and pasture will be planted with energy crops
• Low – Assumes that new crops will only be planted to the extent of submitted applications to the Energy Crop Scheme.
The high scenario, as defined in the DECC methodology, is acknowledged to be neither possible nor desirable due to other uses of the land that are not considered within the assessment (such as food production). This scenario is entirely theoretical. The medium scenario was used, but the assessment was also undertaken for the low scenario.
GIS data was used to make the analysis as spatially relevant as possible. The approach to protected landscapes was discussed with Natural England.
Both electricity and heat capacity were assessed as alternative options.
The DECC methodology states that yields from energy crops could increase by 10% to 2020, this assumption has also been used to project forward capacity.
Source: Maslen Environmental
Lancashire Sustainable Energy Study A technical report for Lancashire County Council
21
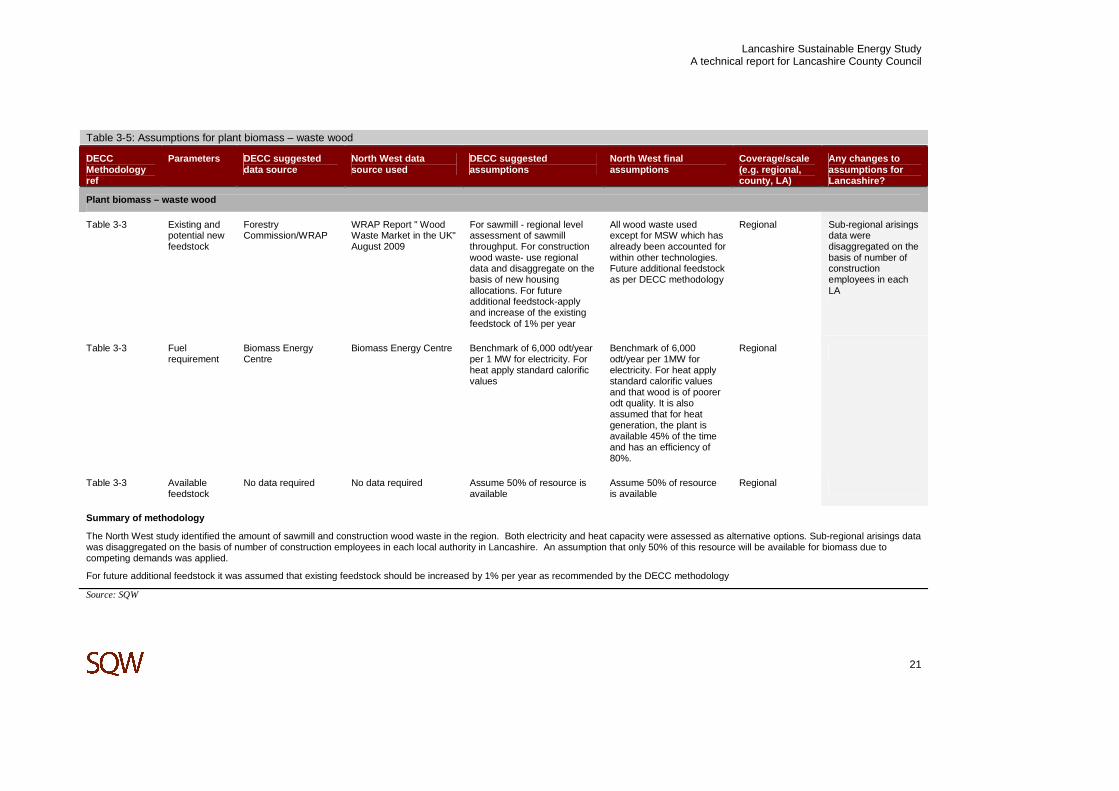
Table 3-5: Assumptions for plant biomass – waste wood
DECC Methodology ref
Parameters DECC suggested data source
North West data source used
DECC suggested assumptions
North West final assumptions
Coverage/scale (e.g. regional, county, LA)
Any changes to assumptions for Lancashire?
Plant biomass – waste wood
Table 3-3 Existing and potential new feedstock
Forestry Commission/WRAP
WRAP Report " Wood Waste Market in the UK" August 2009
For sawmill - regional level assessment of sawmill throughput. For construction wood waste- use regional data and disaggregate on the basis of new housing allocations. For future additional feedstock-apply and increase of the existing feedstock of 1% per year
All wood waste used except for MSW which has already been accounted for within other technologies. Future additional feedstock as per DECC methodology
Regional Sub-regional arisings data were disaggregated on the basis of number of construction employees in each LA
Table 3-3 Fuel requirement
Biomass Energy Centre
Biomass Energy Centre Benchmark of 6,000 odt/year per 1 MW for electricity. For heat apply standard calorific values
Benchmark of 6,000 odt/year per 1MW for electricity. For heat apply standard calorific values and that wood is of poorer odt quality. It is also assumed that for heat generation, the plant is available 45% of the time and has an efficiency of 80%.
Regional
Table 3-3 Available feedstock
No data required No data required Assume 50% of resource is available
Assume 50% of resource is available
Regional
Summary of methodology
The North West study identified the amount of sawmill and construction wood waste in the region. Both electricity and heat capacity were assessed as alternative options. Sub-regional arisings data was disaggregated on the basis of number of construction employees in each local authority in Lancashire. An assumption that only 50% of this resource will be available for biomass due to competing demands was applied.
For future additional feedstock it was assumed that existing feedstock should be increased by 1% per year as recommended by the DECC methodology
Source: SQW
Lancashire Sustainable Energy Study A technical report for Lancashire County Council
22
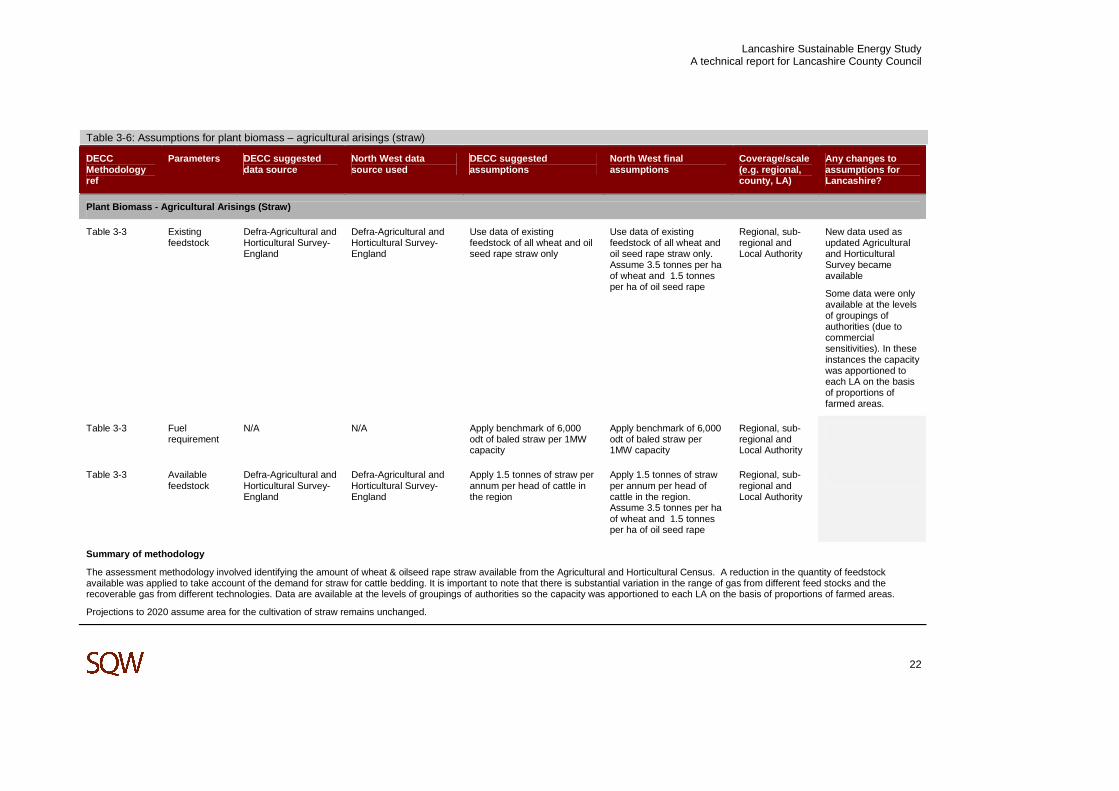
Table 3-6: Assumptions for plant biomass – agricultural arisings (straw)
DECC Methodology ref
Parameters DECC suggested data source
North West data source used
DECC suggested assumptions
North West final assumptions
Coverage/scale (e.g. regional, county, LA)
Any changes to assumptions for Lancashire?
Plant Biomass - Agricultural Arisings (Straw)
Table 3-3 Existing feedstock
Defra-Agricultural and Horticultural Survey-England
Defra-Agricultural and Horticultural Survey-England
Use data of existing feedstock of all wheat and oil seed rape straw only
Use data of existing feedstock of all wheat and oil seed rape straw only. Assume 3.5 tonnes per ha of wheat and 1.5 tonnes per ha of oil seed rape
Regional, sub-regional and Local Authority
New data used as updated Agricultural and Horticultural Survey became available
Some data were only available at the levels of groupings of authorities (due to commercial sensitivities). In these instances the capacity was apportioned to each LA on the basis of proportions of farmed areas.
Table 3-3 Fuel requirement
N/A N/A Apply benchmark of 6,000 odt of baled straw per 1MW capacity
Apply benchmark of 6,000 odt of baled straw per 1MW capacity
Regional, sub-regional and Local Authority
Table 3-3 Available feedstock
Defra-Agricultural and Horticultural Survey-England
Defra-Agricultural and Horticultural Survey-England
Apply 1.5 tonnes of straw per annum per head of cattle in the region
Apply 1.5 tonnes of straw per annum per head of cattle in the region. Assume 3.5 tonnes per ha of wheat and 1.5 tonnes per ha of oil seed rape
Regional, sub-regional and Local Authority
Summary of methodology
The assessment methodology involved identifying the amount of wheat & oilseed rape straw available from the Agricultural and Horticultural Census. A reduction in the quantity of feedstock available was applied to take account of the demand for straw for cattle bedding. It is important to note that there is substantial variation in the range of gas from different feed stocks and the recoverable gas from different technologies. Data are available at the levels of groupings of authorities so the capacity was apportioned to each LA on the basis of proportions of farmed areas.
Projections to 2020 assume area for the cultivation of straw remains unchanged.
Lancashire Sustainable Energy Study A technical report for Lancashire County Council
23
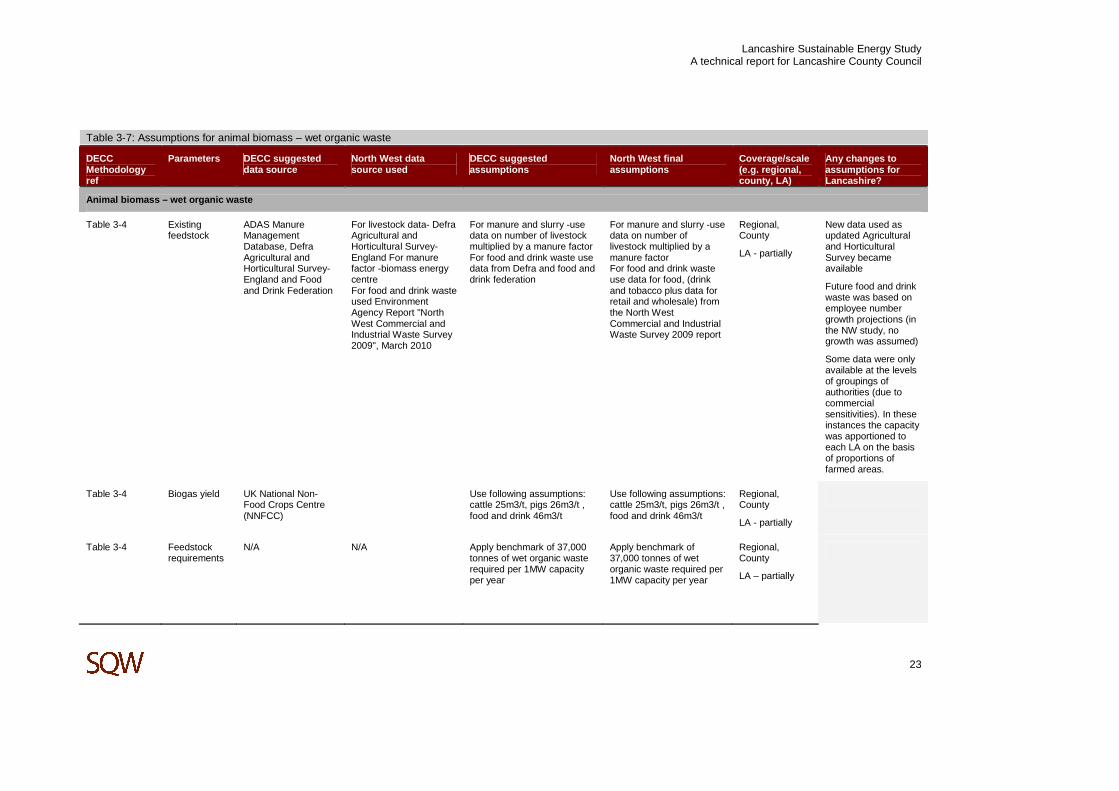
Table 3-7: Assumptions for animal biomass – wet organic waste
DECC Methodology ref
Parameters DECC suggested data source
North West data source used
DECC suggested assumptions
North West final assumptions
Coverage/scale (e.g. regional, county, LA)
Any changes to assumptions for Lancashire?
Animal biomass – wet organic waste
Table 3-4 Existing feedstock
ADAS Manure Management Database, Defra Agricultural and Horticultural Survey-England and Food and Drink Federation
For livestock data- Defra Agricultural and Horticultural Survey-England For manure factor -biomass energy centre For food and drink waste used Environment Agency Report "North West Commercial and Industrial Waste Survey 2009", March 2010
For manure and slurry -use data on number of livestock multiplied by a manure factor For food and drink waste use data from Defra and food and drink federation
For manure and slurry -use data on number of livestock multiplied by a manure factor For food and drink waste use data for food, (drink and tobacco plus data for retail and wholesale) from the North West Commercial and Industrial Waste Survey 2009 report
Regional, County
LA - partially
New data used as updated Agricultural and Horticultural Survey became available
Future food and drink waste was based on employee number growth projections (in the NW study, no growth was assumed)
Some data were only available at the levels of groupings of authorities (due to commercial sensitivities). In these instances the capacity was apportioned to each LA on the basis of proportions of farmed areas.
Table 3-4 Biogas yield UK National Non-Food Crops Centre (NNFCC)
Use following assumptions: cattle 25m3/t, pigs 26m3/t , food and drink 46m3/t
Use following assumptions: cattle 25m3/t, pigs 26m3/t , food and drink 46m3/t
Regional, County
LA - partially
Table 3-4 Feedstock requirements
N/A N/A Apply benchmark of 37,000 tonnes of wet organic waste required per 1MW capacity per year
Apply benchmark of 37,000 tonnes of wet organic waste required per 1MW capacity per year
Regional, County
LA – partially
Lancashire Sustainable Energy Study A technical report for Lancashire County Council
24
DECC Methodology ref
Parameters DECC suggested data source
North West data source used
DECC suggested assumptions
North West final assumptions
Coverage/scale (e.g. regional, county, LA)
Any changes to assumptions for Lancashire?
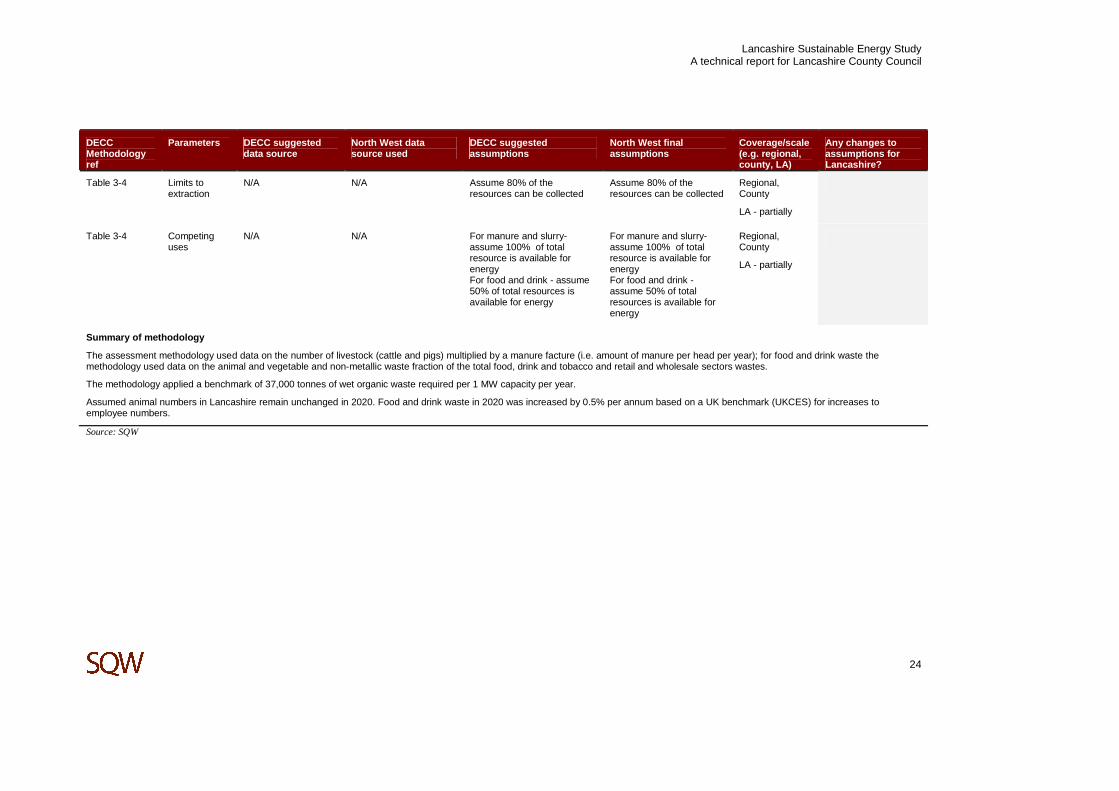
Table 3-4 Limits to extraction
N/A N/A Assume 80% of the resources can be collected
Assume 80% of the resources can be collected
Regional, County
LA - partially
Table 3-4 Competing uses
N/A N/A For manure and slurry- assume 100% of total resource is available for energy For food and drink - assume 50% of total resources is available for energy
For manure and slurry- assume 100% of total resource is available for energy For food and drink - assume 50% of total resources is available for energy
Regional, County
LA - partially
Summary of methodology
The assessment methodology used data on the number of livestock (cattle and pigs) multiplied by a manure facture (i.e. amount of manure per head per year); for food and drink waste the methodology used data on the animal and vegetable and non-metallic waste fraction of the total food, drink and tobacco and retail and wholesale sectors wastes.
The methodology applied a benchmark of 37,000 tonnes of wet organic waste required per 1 MW capacity per year.
Assumed animal numbers in Lancashire remain unchanged in 2020. Food and drink waste in 2020 was increased by 0.5% per annum based on a UK benchmark (UKCES) for increases to employee numbers.
Source: SQW

Lancashire Sustainable Energy Study A technical report for Lancashire County Council
25
Table 3-8: Assumptions for animal biomass – poultry litter
DECC Methodology ref
Parameters DECC suggested data source
North West data source used
DECC suggested assumptions
North West final assumptions
Coverage/scale (e.g. regional, county, LA)
Any changes to assumptions for Lancashire?
Animal biomass – poultry litter
Table 3-4 Existing and potential new feedstock
Defra-Agricultural and Horticultural Survey-England
Defra-Agricultural and Horticultural Survey-England
Use data on poultry numbers and excreta factor per head of poultry
Use data on poultry numbers and excreta factor per head of poultry. Use assumption that broilers typically produce 16.5 tonnes per annum per 1000 hens
Regional, County
LA - partially
New data used as updated Agricultural and Horticultural Survey became available.
All poultry used, no just broilers.
Some data were only available at the levels of groupings of authorities (due to commercial sensitivities). In these instances the capacity was apportioned to each LA on the basis of proportions of farmed areas.
Table 3-4 Feedstock requirements
N/A N/A Apply benchmark of 11,000 tonnes of poultry litter required for 1MW capacity per annum
Apply benchmark of 11,000 tonnes of poultry litter required for 1MW capacity per annum
Regional, county
LA - partially
Table 3-4
Available feedstock
N/A N/A Assume 100% of the resource is available for energy
Assume 100% of the resource is available for energy
Lancashire Sustainable Energy Study A technical report for Lancashire County Council
26
DECC Methodology ref
Parameters DECC suggested data source
North West data source used
DECC suggested assumptions
North West final assumptions
Coverage/scale (e.g. regional, county, LA)
Any changes to assumptions for Lancashire?
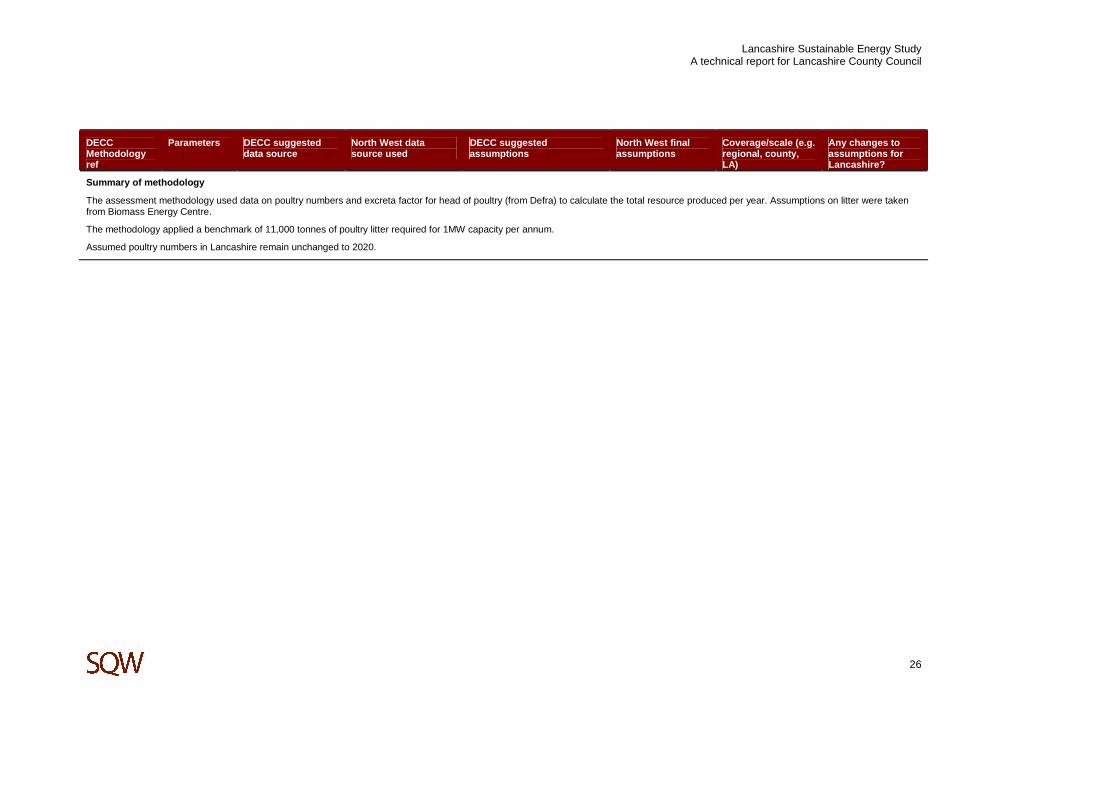
Summary of methodology
The assessment methodology used data on poultry numbers and excreta factor for head of poultry (from Defra) to calculate the total resource produced per year. Assumptions on litter were taken from Biomass Energy Centre.
The methodology applied a benchmark of 11,000 tonnes of poultry litter required for 1MW capacity per annum.
Assumed poultry numbers in Lancashire remain unchanged to 2020.

Lancashire Sustainable Energy Study A technical report for Lancashire County Council
27
Table 3-9: Assumptions for municipal solid waste
DECC Methodology ref
Parameters DECC suggested data source
North West data source used
DECC suggested assumptions
North West final assumptions
Coverage/scale (e.g. regional, county, LA)
Changes to assumptions for Lancashire?
Municipal Solid Waste
Table 3-5 Existing and potential new feedstock
Defra's quarterly MSW Statistics
Defra WasteDataFlow Collate information from all local waste management plans
Use LA municipal and household waste statistics 2008/09 data derived from WasteDataFlow - waste collection only then assume Biodegradable Municipal Waste is 68% of total MSW
Regional, County, LA
Future resource was based on household growth projections (in the NW study, no growth was assumed)
Table 3-5 Feedstock requirement
N/A N/A Apply a benchmark of 10 kilo tonnes of MSW required for 1 MW capacity per annum
Apply a benchmark of 10 kilo tonnes of MSW required for 1 MW capacity per annum
Regional, County, LA
Summary of methodology
The assessment methodology drew on data from Defra waste data flow and used a benchmark of 10 kilo tonnes of MSW required for 1 MW capacity per annum.
The resource assessment in 2020 was based on household growth projections for Lancashire.
Source: SQW

Lancashire Sustainable Energy Study A technical report for Lancashire County Council
28
Table 3-10: Assumptions for commercial and industrial waste:
DECC Methodology ref
Parameters DECC suggested data source
North West data source used
DECC suggested assumptions
North West final assumptions
Coverage/scale (e.g. regional, county, LA)
Any changes to Lancashire assumptions?
Commercial and industrial waste
Table 3-5 Existing and potential new feedstock
No specific source provided.
Collate information from all local waste management plans
Collate information from all local waste management plans
Use data on estimate of North West England C &I Waste Arisings, by sector from North West of England Commercial and Industrial Waste Survey 2009 report produced by the Environment Agency. Includes animal and vegetable waste and non - metallic waste only
Regional, County The non-metallic fraction of the food, drink and tobacco and retail and wholesale sectors’ wastes was added to the assessment
Future resource was based on employee number growth projections (in the NW study, no growth was assumed)
The resource was disaggregated to LAs based on employee numbers
Table 3-5 Feedstock requirement
No specific source provided
North West of England Commercial and Industrial Waste Survey 2009 Report - for the Environment Agency (Urban Mines)
Apply a benchmark of 10 kilo tonnes of MSW required for 1 MW capacity per annum
Apply a benchmark of 10 kilo tonnes required for 1 MW capacity per annum
Regional, County
Summary of methodology
The assessment methodology drew on data from the North West of England Commercial and Industrial Waste Survey 2009 report.
The methodology applied of 10 kilo tonnes required for 1 MW capacity per annum.
The resource assessment in 2020 was based on employee number growth using a UK-wide benchmark of 0.5% per annum.
Source: SQW

Lancashire Sustainable Energy Study A technical report for Lancashire County Council
29
Table 3-11: Assumptions for Biogas - landfill gas
DECC Methodology ref
Parameters DECC suggested data source
North West data source used
DECC suggested assumptions
North West final assumptions
Coverage/scale (e.g. regional, county, LA)
Any changes to Lancashire assumptions?
Biogas - landfill gas
Table 3-6 Available resource
Environment Agency's Waste Management Licence Data and OFGEM RO Register
OFGEM RO Register Use inventory of landfill sites and sizes and capacity
All 'live' landfill sites in the NW from the OFGEM RO register
Regional
County
Table 3-6 Lifetime of resource
Environment Agency's Waste Management Licence Data and OFGEM RO Register
OFGEM RO Register Refer to inventory of landfill sites and their age
Assume that the present day capacity will continue flat for 5 years to 2015, then straight line reduction until the capacity in 2030 is 20% of today's capacity
Regional
County
Summary of methodology
The assessment methodology referred to the inventory of landfill sites and their size and capacity to calculate total available biogas resource.
Relevant data was also sourced from the BERR landfill gas production forecast study to forecast landfill gas potential.
Assumed that the present day capacity will continue flat for five years to 2015, then straight line reduction until the capacity in 2020 is 20% of today's capacity.
Source: SQW
Lancashire Sustainable Energy Study A technical report for Lancashire County Council
30
Table 3-12: Assumptions for Biogas – sewage gas
DECC Methodology ref
Parameters DECC suggested data source
North West data source used
DECC suggested assumptions
North West final assumptions
Coverage/scale (e.g. regional, county, LA)
Any changes to Lancashire assumptions?
Biogas – sewage gas
Table 3-6 Available resource
Water Utilities OFGEM RO Register Refer to inventory of sewage treatment sites and their size and capacity
Assume a 50% increase in capacity from 2010 to 2020 based on more efficient technology and smaller units becoming more economically viable, hence being able to be deployed at smaller treatment works.
Regional
County
Table 3-6 Potential new resource
Water Utilities OFGEM RO Register Refer to water utility business plans and forecast
As above - assumes growth comes from smaller more efficient treatment works that give greater coverage.
Regional
County
Future resource was based on population growth projections (in the NW study, only growth due to more efficient technology and smaller units was assumed)
Summary of methodology
The assessment methodology drew on data from the inventory of sewage treatment sites, their size and capacity to calculate total available resource.
An increase in capacity based on more efficient technology and smaller units was applied, along with an increase due to population growth.
Assumed a 50% increase in capacity from 2010 to 2020 based on more efficient technology and smaller units becoming more economically viable, hence being able to be deployed at smaller treatment works.
Source: SQW
Lancashire Sustainable Energy Study A technical report for Lancashire County Council
31
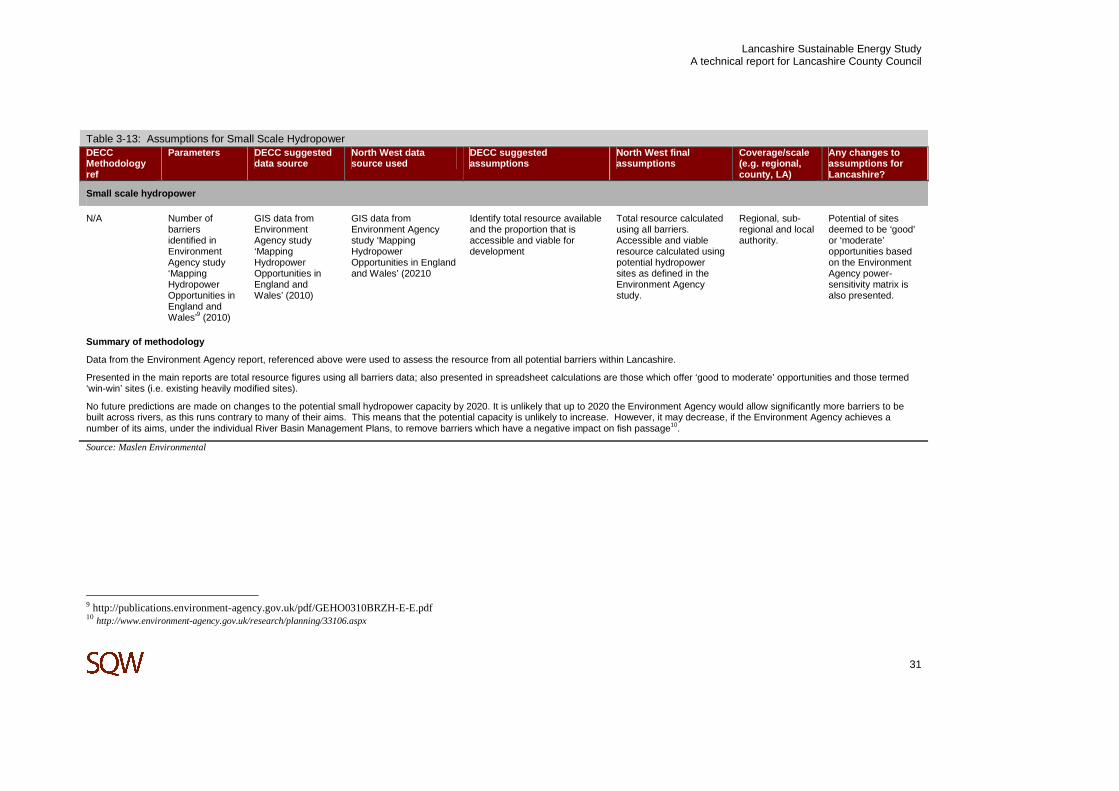
Table 3-13: Assumptions for Small Scale Hydropower DECC Methodology ref
Parameters DECC suggested data source
North West data source used
DECC suggested assumptions
North West final assumptions
Coverage/scale (e.g. regional, county, LA)
Any changes to assumptions for Lancashire?
Small scale hydropower
N/A Number of barriers identified in Environment Agency study ‘Mapping Hydropower Opportunities in England and Wales’9 (2010)
GIS data from Environment Agency study ‘Mapping Hydropower Opportunities in England and Wales’ (2010)
GIS data from Environment Agency study ‘Mapping Hydropower Opportunities in England and Wales’ (20210
Identify total resource available and the proportion that is accessible and viable for development
Total resource calculated using all barriers. Accessible and viable resource calculated using potential hydropower sites as defined in the Environment Agency study.
Regional, sub-regional and local authority.
Potential of sites deemed to be ‘good’ or ‘moderate’ opportunities based on the Environment Agency power-sensitivity matrix is also presented.
Summary of methodology
Data from the Environment Agency report, referenced above were used to assess the resource from all potential barriers within Lancashire.
Presented in the main reports are total resource figures using all barriers data; also presented in spreadsheet calculations are those which offer ‘good to moderate’ opportunities and those termed ‘win-win’ sites (i.e. existing heavily modified sites).
No future predictions are made on changes to the potential small hydropower capacity by 2020. It is unlikely that up to 2020 the Environment Agency would allow significantly more barriers to be built across rivers, as this runs contrary to many of their aims. This means that the potential capacity is unlikely to increase. However, it may decrease, if the Environment Agency achieves a number of its aims, under the individual River Basin Management Plans, to remove barriers which have a negative impact on fish passage10.
Source: Maslen Environmental
9 http://publications.environment-agency.gov.uk/pdf/GEHO0310BRZH-E-E.pdf 10 http://www.environment-agency.gov.uk/research/planning/33106.aspx

Lancashire Sustainable Energy Study A technical report for Lancashire County Council
32
Table 3-14: Assumptions for Microgeneration - solar DECC Methodology ref
Parameters DECC suggested data source
North West data source used
DECC suggested assumptions
North West final assumptions
Coverage/scale (e.g. regional, county, LA)
Any changes to assumptions for Lancashire?
Microgeneration - solar
Table 3-8 Existing building stock
CLG Statistics, English Housing Survey and ONS data
OS Mastermap AL2 – address point data
Apply for domestic properties- 25% of all properties (including flats) For commercial properties - 40% of all hereditaments For industrial buildings - 80% of the stock
Apply for domestic properties- 25% of all properties (including flats) For commercial properties - 40% of all hereditaments For industrial buildings - 80% of the stock
Regional, county, LA
Assumed proportion suitable for Solar PV: 12.5% of all existing and 25% of all future domestic properties including flats, 36% commercial, 80% industrial
Assumed proportion suitable for Solar WH: 12.5% of all existing and 25% of all future domestic properties including flats, 10% of the suitable proportion of commercial, 0% industrial
Table 3-8 New developments
RSS new housing provisions
RSS new housing provisions
Assume 50% of all new domestic roofs will be suitable for solar systems
Assume 50% of all new domestic roofs will be suitable for solar systems
Regional, county, LA
Assumed 0.5% annual compound growth of commercial & industrial buildings in accordance with UKCES report and 0.3% annual compound growth rate for community and public buildings in line with ONS population projections (2008 based)
Lancashire Sustainable Energy Study A technical report for Lancashire County Council
33
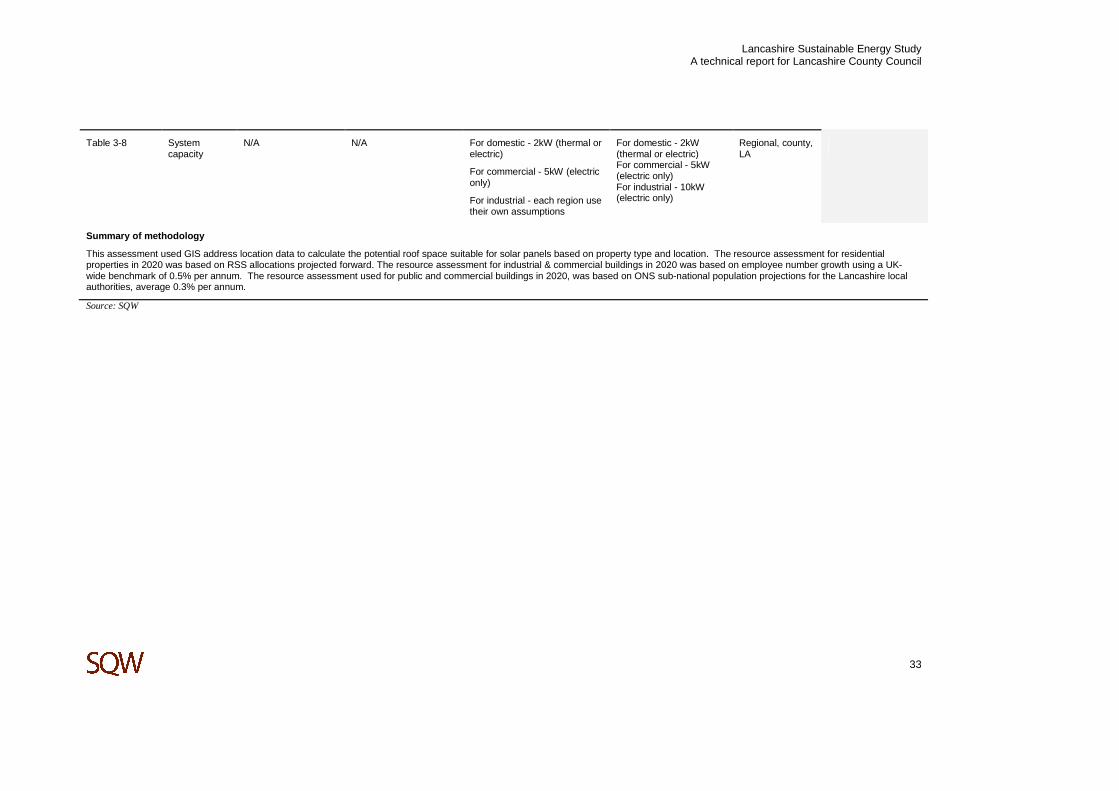
Table 3-8 System capacity
N/A N/A For domestic - 2kW (thermal or electric)
For commercial - 5kW (electric only)
For industrial - each region use their own assumptions
For domestic - 2kW (thermal or electric) For commercial - 5kW (electric only) For industrial - 10kW (electric only)
Regional, county, LA
Summary of methodology
This assessment used GIS address location data to calculate the potential roof space suitable for solar panels based on property type and location. The resource assessment for residential properties in 2020 was based on RSS allocations projected forward. The resource assessment for industrial & commercial buildings in 2020 was based on employee number growth using a UK-wide benchmark of 0.5% per annum. The resource assessment used for public and commercial buildings in 2020, was based on ONS sub-national population projections for the Lancashire local authorities, average 0.3% per annum.
Source: SQW

Lancashire Sustainable Energy Study A technical report for Lancashire County Council
34
Table 3-15: Assumptions for Microgeneration – heat pumps
DECC Methodology ref
Parameters DECC suggested data source
NW data source used DECC suggested assumptions
NW final assumptions Coverage/scale (e.g. regional, county, LA)
Any changes to assumptions for Lancashire?
Microgeneration – heat pumps
Table 3-9 Existing building stock
CLG Statistics, English Housing Survey and ONS data
OS Mastermap AL2 – address point data
For domestic 100% of all off-grid properties, for the remaining stock 75% of detached and semi-detached properties, 50% of terraced properties and 25% of flats
For domestic 100% of all off-grid properties, for the remaining stock 75% of detached and semi-detached properties, 50% of terraced properties and 25% of flat
Regional
County
Table 3-9 New developments
RSS new housing provisions
RSS new housing provisions
50% of all new build domestic properties
50% of all new build domestic properties
Regional
County
Assumed 0.5% annual compound growth of commercial and industrial buildings in accordance with UKCES report and 0.3% annual compound growth rate for community and public buildings in line with ONS population projections (2008 based)
Table 3-9 System capacity
N/A N/A Domestic -5kw and Commercial -100kW
Domestic -5kw and Commercial -100kW
Regional
County
Summary of methodology
The resource assessment for residential properties in 2020 was based on RSS allocations projected forward. The resource assessment for industrial & commercial buildings in 2020 was based on employee number growth using a UK-wide benchmark of 0.5% per annum. The resource assessment used for public and commercial buildings in 2020, was based on ONS sub-national population projections for the Lancashire local authorities, average 0.3% per annum.
Lancashire Sustainable Energy Study A technical report for Lancashire County Council
35
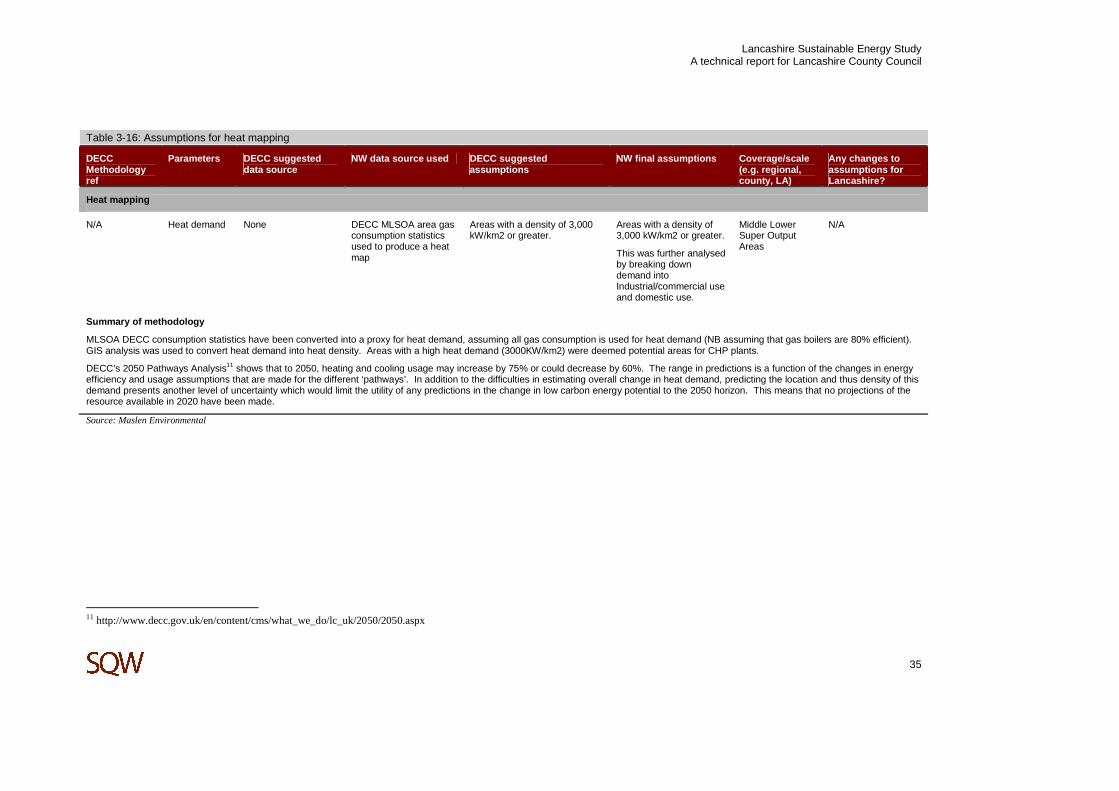
Table 3-16: Assumptions for heat mapping
DECC Methodology ref
Parameters DECC suggested data source
NW data source used DECC suggested assumptions
NW final assumptions Coverage/scale (e.g. regional, county, LA)
Any changes to assumptions for Lancashire?
Heat mapping
N/A Heat demand None DECC MLSOA area gas consumption statistics used to produce a heat map
Areas with a density of 3,000 kW/km2 or greater.
Areas with a density of 3,000 kW/km2 or greater.
This was further analysed by breaking down demand into Industrial/commercial use and domestic use.
Middle Lower Super Output Areas
N/A
Summary of methodology
MLSOA DECC consumption statistics have been converted into a proxy for heat demand, assuming all gas consumption is used for heat demand (NB assuming that gas boilers are 80% efficient). GIS analysis was used to convert heat demand into heat density. Areas with a high heat demand (3000KW/km2) were deemed potential areas for CHP plants.
DECC’s 2050 Pathways Analysis11 shows that to 2050, heating and cooling usage may increase by 75% or could decrease by 60%. The range in predictions is a function of the changes in energy efficiency and usage assumptions that are made for the different ‘pathways’. In addition to the difficulties in estimating overall change in heat demand, predicting the location and thus density of this demand presents another level of uncertainty which would limit the utility of any predictions in the change in low carbon energy potential to the 2050 horizon. This means that no projections of the resource available in 2020 have been made.
Source: Maslen Environmental
11 http://www.decc.gov.uk/en/content/cms/what_we_do/lc_uk/2050/2050.aspx
Lancashire Sustainable Energy Study A technical report for Lancashire County Council
36
Low Carbon, waste heat and grid assessments
3.4 In this section we provide further detail on the low carbon, waste heat assessment and grid assessment as the methodology for low carbon assessment was less detailed than others within the DECC methodology and it provides no guidelines for assessing waste heat and grid constraints. In addition, the North West study did not provide an assessment of waste heat or grid constraints.
Low Carbon
3.5 Low carbon energy is defined for the purposes of the DECC methodology as Combined Heat and Power (CHP) or tri-generation (to include cooling), and district heating schemes. Whilst not directly fulfilling commitments under the UK Renewable Energy Strategy, low carbon sources of energy supply will be an important part of the mix of technologies that the Lancashire sub-region can employ to reduce carbon emissions. Low carbon technologies represent potentially cost effective alternative solutions. Both district heating and CHP plants can be fuelled by a number of sources, including biomass. The choice of fuels can affect the overall carbon savings for a plant.
3.6 At a national level, energy policy is being developed to help meet the significant heat and low-carbon energy requirement of the UK. For example, DECC is currently developing the Renewable Heat Incentive (RHI)12, aimed at encouraging the use of renewable heat sources.
3.7 Unlike most of the renewable energy categories which are assessed on the basis of the supply side (i.e. resource availability), low carbon opportunities referred to in the DECC methodology are a function of available heat demand.
3.8 The identifying of potential sites for CHP, tri-generation and district heating in Lancashire cannot be done solely by assessing the heat demand of its properties, since the viability of CHP or district heating is dependent not only on the total heat demand, but the density of that demand. In order to make evaluations about the viability of an area for CHP or district heating, the DECC methodology introduces the concept of ‘heat density’. This is defined as the annual heat demand, divided by the number of hours in a year, which is then divided by area in km2.
3.9 A new heat map based on Middle Level Super Output Area (MLSOA) gas statistics has been developed for this study. Gas demand has been used as a proxy for heat demand and this has been divided across the settlement areas contained within each MLSOA to give a heat density. The resulting map identifies areas above a heat demand of 3000kW/km2. According to the DECC methodology, above this demand threshold low carbon technologies may become viable. The most viable areas are likely to have a range of end users that create a ‘balanced’ demand through-out the day. In order to help identify these, a commercial and industrial and a domestic heat map have also been produced.
12 DECC Renewable Heat Incentive (RHI) http://www.decc.gov.uk/en/content/cms/what_we_do/uk_supply/energy_mix/renewable/policy/renewable_heat/incentive/incentive.aspx

Lancashire Sustainable Energy Study A technical report for Lancashire County Council
37
3.10 Key assumptions for heat demand (domestic and commercial) for CHP and district heating are as follows:
• The DECC methodology states that if the heat density exceeds 3,000kW/km2, the heat density is considered to be high and, district heating is likely to be economically viable in a high proportion of buildings, such as flats.
• Heat density was calculated by assuming that gas consumed by a Mid Level Super Output area, which is consumed solely within the settlement areas and the areas outside of these had a heat demand of zero.
3.11 We have also undertaken a brief review of existing CHP installations and reported on these within the individual LA resource assessment reports. It should be noted that we have used the DECC CHP register13 and the data published on this site is obtained via the Quality Assurance of Combined Heat and Power programme (CHPQA) from schemes who gave permission for the information to be published. As such, it is possible that some schemes may be omitted.
Projections to 2020
3.12 DECC’s 2050 Pathways Analysis14 shows that to 2050, heating and cooling usage may increase by 75% or could decrease by 60%. The range in predictions is a function of the changes in energy efficiency and usage assumptions that are made for the different ‘pathways’. In addition to the difficulties in estimating overall change in heat demand, predicting the location and thus density of this demand presents another level of uncertainty which would limit the utility of any predictions in the change in low carbon energy potential into the future. This means that no projections of the resource available in 2020 have been made.
Waste heat assessment
3.13 No regional waste heat assessment methodology is outlined in the DECC methodology. However, it was considered important to include within this study as part of the overall assessment of low carbon sources. As such, the study team have developed a methodology specifically for this purpose.
3.14 Waste heat is heat produced within a process which is not in a directly useful form (e.g. heat produced by air conditioning system, heat from an exhaust, or heat radiated from a blast furnace). Though no longer directly useful to the initial process, this heat could be put to use if there is an end-user which requires the heat and a way to recover it. This means that three factors are required for a waste heat recovery system:
• an accessible source of waste heat
• a recovery technology
• a use for the recovered heat energy.
13 http://chp.decc.gov.uk/app/reporting/index/viewtable/token/2 14 http://www.decc.gov.uk/en/content/cms/what_we_do/lc_uk/2050/2050.aspx

Lancashire Sustainable Energy Study A technical report for Lancashire County Council
38
3.15 The uses for recovered heat and depend on the nature of the end uses and the quality of the heat (e.g. high or low temperature) but can include:
• combustion air preheating
• power generation
• steam generation
• space heating
• water preheating.
3.16 These uses for the heat often have to be very close to the source due to the cost of piping and the heat losses accrued in transportation.
3.17 For this study, the Interdepartmental Business Register15 was used to identify the number of enterprises in each authority that could potentially be sources of high, medium and low waste heat. The register breaks down enterprises into categories by Standard Industrial Classifications (SICs) (this classifies businesses based on the type of economic activities in which they are engaged) 16.
3.18 Specific assumptions adopted for the waste heat system are as follows:
• Using Standard Industrial Classification code data means it is impossible to know the exact nature of the processes at each enterprise; however, it does give an indication of the number of opportunities available.
• To develop this initial assessment further to identify the best opportunities for waste heat resource development within each local authority, the following steps could be undertaken:
� Obtain site specific data available for the sites in the SIC categories with the best potential to be a waste heat source. This is available on request for local authorities from the Office for National Statistics.
� Compare the locations of these sites with the heat map developed for this study, to identify sources in areas with high heat densities, and thus potential end-users.
� Approach individual enterprises with the best mixture of heat source and end users to conduct site specific assessments.
Projections to 2020
3.19 The waste heat assessment identifies enterprises with high, medium and low heat operations, this is based upon Standard Industry Classifications data. No quantification has been
15 http://www.neighbourhood.statistics.gov.uk/dissemination/Info.do?page=analysisandguidance/analysisarticles/idbr-analysis-to-support-local-authorities.htm 16 http://www.statistics.gov.uk/methods_quality/sic/contents.asp

Lancashire Sustainable Energy Study A technical report for Lancashire County Council
39
undertaken of the waste heat resource and further work would be required to quantify this resource and understand how it may be projected towards 2020.
Grid assessment
3.20 The assessment of grid capacity is not included within the DECC methodology and therefore this is explained below in greater detail here.
3.21 The UK electricity network is one that has seen many alterations, innovations and expansions since its creation over 120 years ago. These changes have been put in place to accommodate the rise and mixed uses of demand together with the variety of generation methods used.
3.22 There are two tiers to the electricity network. The Transmission network delivers ‘bulk’ electricity at high voltages of 400kV and 275kV, over long distances from the larger power stations to distribution companies. The Distribution Network provides the majority of customers with electricity via localised networks operating at 132kV and below.
3.23 Transmission electricity flows predominately from the north of the UK, where the largest power stations are, to the higher electricity demands in the south. The National Grid operates this network, known as the Transmission Network Operator (TNO) in England and Wales.
3.24 The distribution network combines electricity from both large and small generating units. The transmission network provides the distribution networks with ‘back-up’ supply, if required. The distribution network can provide access for generating units with outputs of up to 20MW, which provides opportunities for a whole range of RLC (Renewable and Low Carbon) technologies identified in this study. In terms of generating output connecting to the necessary network, the general rule is:
• up to 300kW output, usually connect to 415V, 6.6kV or 11kV lines,
• up to 7MW output, usually connect to 11kV, 33kV or 66kV lines,
• up to 20MW output usually connect to 132kV lines.
3.25 11kV, 33kV and 132kV are the most common types of network available. These networks are operated and maintained by the Distributing Network Operators (DNO), the main responsibilities of which are to
• connect new customers
• reinforce the network to accommodate changing demand
• inspect and maintain the existing assets
• fix the networks when they go wrong
• refurbish networks to extend their life where appropriate
• replace the assets when end of their life is reached

Lancashire Sustainable Energy Study A technical report for Lancashire County Council
40
• improve customer service
• prepare for emergencies
• protect the environment, including the impacts of climate change, and enable local generation..
3.26 Within Lancashire there are two electricity DNOs: Electricity North West (ENW) and Scottish Power (SP MANWEB).
3.27 The DNO’s role is central to understanding the feasibility of renewable sources connecting to the local distribution networks. All the DNOs which serve Lancashire area recognise in their Long Term Development Plans (LTDPs) that there will be a variety of generators wishing to export to their grids in the future and that their networks will have to adapt to this.
3.28 The distribution networks often have limited spare connection capacity and may require upgrading or modifying to allow connection of a generating RLC. Therefore, the generators can only connect to the distribution network subject to a DNO connection contract. The tasks involved in obtaining connection vary with the size of the generation plant that is being developed: in general, the larger the plant, the more complex the connection requirements. There are considerations needed for all generators, including current loadings on the local grid, capacity in the system for a new connection, and reinforcements needed. These issues will all be site specific and developers must contact their DNO for advice.
3.29 Access to higher capacity grid connections (33kV to and 132kV) usually impact larger capacity technologies such as commercial wind farms. Smaller scale technologies such hydropower, anaerobic digestion plants can usually connect to 11kV networks or lower which are more readily available particularly around urban areas. Micro-generation plants that can be defined as Small Scale Embedded Generation (SSEG) are not required to enter into a contract with the DNO, which limits grid constraints upon them. It also should be noted that if a plant is below 300kW heat and 50kW electricity installed capacity a smaller connection capacity is required and so it is much easier to connect.
3.30 The methodology used for the electricity network assessment in Lancashire is two phased approach, Phase 1 at Sub-regional scale and Phase 2 at local scale as set out below:
• Phase 1
� Based on published Electricity North West’s Long Term Development Plans a GIS map of 33kV, 132kV has been produced demonstrating the extent of the network and distance to a grid connection.
� Future investment plans (particularly those related to renewable energy) have also been mapped in GIS
• Phase 2
� Through operator liaison explored the feasibility and quality of data available for detailed grid and capacity analysis, i.e. existence of 11kV cables.

Lancashire Sustainable Energy Study A technical report for Lancashire County Council
41
� Detailed electricity grid and capacity analysis at Local Authority level (with GIS maps)
� Identify areas where grid development may be required to access available potential renewable and low carbon resources.
3.31 The methodology used for the gas network assessment in Lancashire involved first consulting with the National Grid to obtain data demonstrating the extent of the Gas Network. Then, through GIS mapping, areas where there is a lack of a gas distribution network were identified to allow renewable heat sources to be more economically viable such as Air Source and Ground Source Heat Pumps, CHP, CCHP and solar thermal (solar water heating).

Lancashire Sustainable Energy Study A technical report for Lancashire County Council
42
4: Variances from the North West and the South Pennines reports
4.1 In this section we provide a brief explanation for any areas where, by refining the data and results through working at a local scale, the resource assessment approach and consequently the results differ materially from the North West Study. In addition, due to its relevance to the LAs in East Lancashire, we have also reviewed the results from this Lancashire study against those produced for the South Pennines Renewable and Low Carbon Energy Study and explained where, and why there are differences.
North West Report
Onshore wind assessment
4.2 Within the onshore wind assessment, it was noted that there was an error in the constraints applied to Pendle as DECC data incorrectly included the location of an airport which substantially reduced the onshore wind (large scale) capacity. Therefore the total onshore (large and small scale wind capacity) is identified for Lancashire within the North West study as 6,698 MW, and in this Lancashire study as 6,889 MW.
Managed woodland
4.3 In the North West study, the woodland resource for Halton was incorrectly attributed to Lancashire in some of the calculations. This has been rectified in this study.
4.4 The North West study’s figure for heat in Lancashire is 19 MW and electricity in Lancashire is 3.1MW, The Lancashire study figure for heat is 18.69MW and electricity is 3.07MW.
Energy crops
4.5 The Defra agricultural census datasets used in the North West and Lancashire study differ. The dataset used for the North West study was newer - however it only gave the area of bare fallow (land defined by Defra as agricultural land which is not in agricultural production) at Unitary Authority or County scale. In order to provide information at a LA scale, a slightly older (though broadly similar) census was used which provided land cover data broken down to a LA scale. The North West study identifies energy crops capacity for Lancashire of 18 MW, which is slightly reduced to 17 MW within this Lancashire specific study.
Waste wood
4.6 The North West Study identified a total waste wood resource capacity of 39 MW electricity or 33 MW heat, but did not identify a specific disaggregated figure for Lancashire. In this Lancashire specific study, the resource assessment results have identified potential capacity of 6 MW electricity or 7 MW heat. This figure is Lancashire’s ‘share’ of the regional figure

Lancashire Sustainable Energy Study A technical report for Lancashire County Council
43
(from the North West study) based on the proportion of regional construction employees based in Lancashire.
Poultry litter
4.7 The North West Study identified lower capacity from poultry litter of 2 MW for Lancashire compared with 5 MW identified in this specific Lancashire study. The difference can be explained by the fact that only broiler birds were included in the NW study, whereas the Lancashire study included all poultry. In addition, where figures were suppressed due to commercial sensitivities, different approaches were undertaken for the two studies. For the North West Study, these local authorities were excluded; for the Lancashire study, these figures were estimated based on figures for groupings of local authorities (as these were available) apportioned according to total farm area. The difference is also explained by the fact that newly released data from Defra were used to calculate the Lancashire figures.
Municipal Solid Waste
4.8 This Lancashire Study identified slightly larger capacity (increase of 1 MW) which is due to basing future MSW quantities on household growth projections for the Lancashire study, but assuming a constant amount for Lancashire in the NW study. The change was introduced to make the future resource assumption more realistic.
Commercial and Industrial Waste
4.9 The North West Study identified overall capacity for Lancashire of 26 MW. However, the 'non-metallic' fraction of food, drink and tobacco; and wholesale and retail was not included in the assessment. This Lancashire study identifies a capacity figure of 52 MW as it includes the full resource potential. The change is also partly due to assuming an increase in C&I waste based on projections of employee number growth (0.05% per annum, according to UKCES). The change was introduced to make the future resource assumption more realistic.
Landfill gas
4.10 The North West study identified overall capacity of 14 MW for Lancashire; the Lancashire study identifies capacity of 18 MW. This is because some of the sub-region’s landfill sites were not identified in the North West study.
Sewage gas
4.11 The North West study identified overall capacity of 4 MW for Lancashire, whilst this Lancashire specific study has identified capacity of 3 MW. This is because on further investigation it was found that one of the sites attributed to Lancashire for the North West study should have been included in another local authority area (Sefton). It should also be noted, that for the Lancashire study, the future capacity in 2020 was calculated based on population growth projections, in addition to the increase due to efficiency and smaller units becoming viable that was applied in the North West study, although this did not significantly increase the capacity.

Lancashire Sustainable Energy Study A technical report for Lancashire County Council
44
Hydropower
4.12 The Lancashire study has a slightly lower estimate of the total barrier capacity for small scale hydropower when compared to the North West study; this is due to the slight difference in appropriating barriers located on rivers that form the county boundary. The North West study result for total barriers is 21.4MW and Lancashire is 21.2MW.
4.13 Recent work with the Environment Agency suggests it prefers to use ‘total barriers’ capacity instead of ‘win-wins’ capacity as it gives a broad indication of potential resource available. Further work at catchment scale would need to be carried out to decide whether this capacity was deployable.
Microgeneration
4.14 The resource assessment results for solar photovoltaics, solar water heating air and heat source ground pumps vary between the studies for a number of reasons:
• The Lancashire study calculates solar photovoltaics and solar water heating independently using revised assumptions from further research following the publication of the North West study. In comparison, the North West study which calculates solar as a singular technology and divides the capacity equally between solar photovolatics and solar water heating.
• In projecting forward the results for the North West study, the increased capacity associated with RSS provisions from residential properties was over-estimated.
• In line with the DECC methodology, the North West study did not build in any specific capacity for microgeneration installations on public and community buildings (e.g. community centres, village halls etc). This has been included in the Lancashire study with the same assumptions applied as for commercial buildings.
• The end result has been higher figures for the solar sources (Lancashire study total of 642 MW compared with North West result of 476 MW) and higher figures for air pumps (Lancashire study total of 2,844 MW compared with North West result of 2,554 MW).
South Pennines Renewable and Low Carbon Study
4.15 In 2009, Maslen Environmental was commissioned to undertake a study on the capacity for renewable and low carbon energy in the South Pennines Partnership councils: Burnley Borough Council, Pendle Borough Council, Rossendale Borough Council, Calderdale Metropolitan Borough Council and Kirklees Metropolitan Council. The purpose of the study was to identify the opportunities for delivering energy from renewable and low carbon sources, including micro and district scale technologies, in order to meet both local and site specific targets.
4.16 The results between the two studies differ because the South Pennines study was commissioned at a point where the DECC methodology had not been finalised and datasets used will differ in some cases, again due it being undertaken earlier (e.g. the hydropower

Lancashire Sustainable Energy Study A technical report for Lancashire County Council
45
study for the Lancashire study is based on a new Environment Agency dataset unavailable at the time of the South Pennine Study).
4.17 The DECC methodology provides a framework for undertaking capacity assessment for renewable energy, but the results can vary depending on the assumptions used (e.g. the addition of bird sensitive areas in the Lancashire commercial wind assessment, which were not used in the South Pennine Study).
4.18 The DECC methodology gives good total resource figures; however, its results can be less useful on a smaller spatial scale. The best example of this is the small scale wind assessment, which effectively rules out wards which are defined as urban or sub-urban by applying a scaling factor (urban: 56%, suburban: 67%). For the South Pennines study a more spatially specific approach was adopted to better reflect the local conditions of the area.
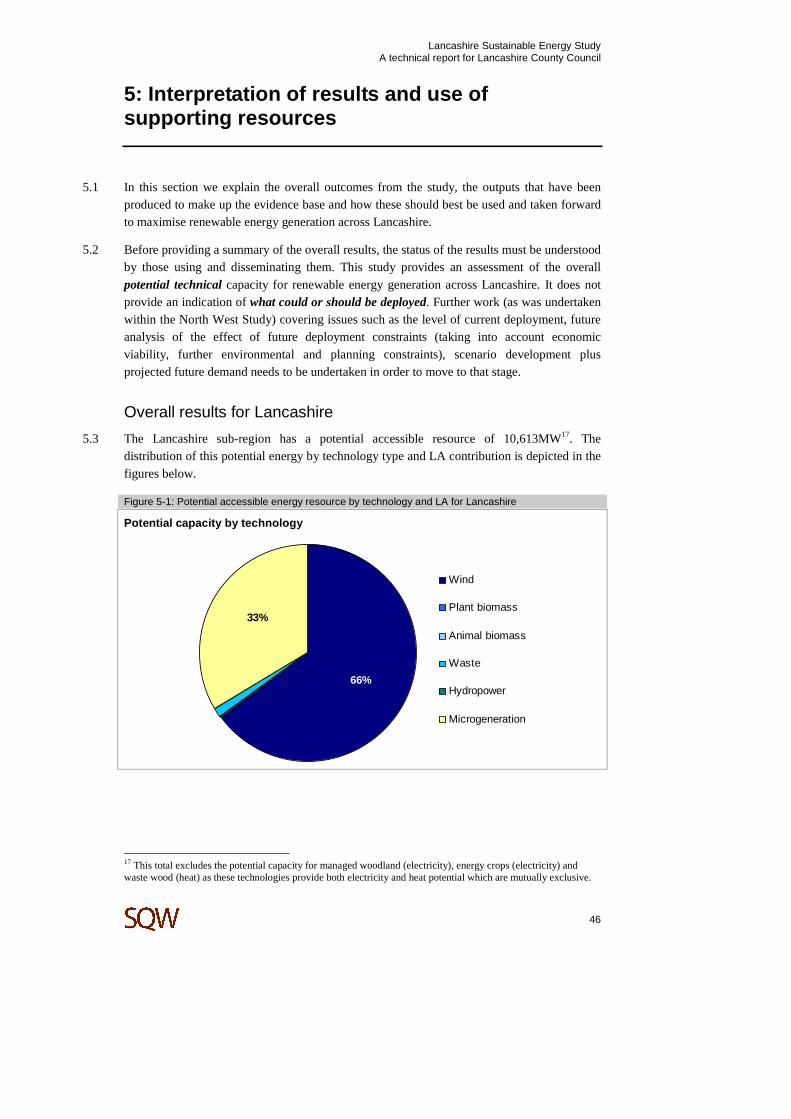
Lancashire Sustainable Energy Study A technical report for Lancashire County Council
46
5: Interpretation of results and use of supporting resources
5.1 In this section we explain the overall outcomes from the study, the outputs that have been produced to make up the evidence base and how these should best be used and taken forward to maximise renewable energy generation across Lancashire.
5.2 Before providing a summary of the overall results, the status of the results must be understood by those using and disseminating them. This study provides an assessment of the overall potential technical capacity for renewable energy generation across Lancashire. It does not provide an indication of what could or should be deployed. Further work (as was undertaken within the North West Study) covering issues such as the level of current deployment, future analysis of the effect of future deployment constraints (taking into account economic viability, further environmental and planning constraints), scenario development plus projected future demand needs to be undertaken in order to move to that stage.
Overall results for Lancashire
5.3 The Lancashire sub-region has a potential accessible resource of 10,613MW17. The distribution of this potential energy by technology type and LA contribution is depicted in the figures below.
Figure 5-1: Potential accessible energy resource by technology and LA for Lancashire
Potential capacity by technology
33%
66%
Wind
Plant biomass
Animal biomass
Waste
Hydropower
Microgeneration
17 This total excludes the potential capacity for managed woodland (electricity), energy crops (electricity) and waste wood (heat) as these technologies provide both electricity and heat potential which are mutually exclusive.

Lancashire Sustainable Energy Study A technical report for Lancashire County Council
47
Potential capacity by LA
9%11%3%
4%
10%
6%
3%
9%
6%6%5%
7%
5%
16%
Blackburn with DarwenBlackpoolBurnleyChorleyFyldeHyndburnLancasterPendlePrestonRibble ValleyRossendaleSouth RibbleWest LancashireWyre
Source: SQW
5.4 The following Table 5-1 presents the detailed results for each technology for each local authority across the Lancashire sub-region:
Table 5-1: Potential accessible renewable energy resource by local authority area
Wind Biomass Hydropower
Micro-generation
Com
mer
cial
sca
le
Sm
all s
cale
Pla
nt b
iom
ass
Ani
mal
bio
mas
s
Was
te
Sm
all s
cale
Sol
ar
Hea
t pum
ps
Tot
al18
Blackburn with Darwen 592 11 2 1 12 2 58 255 933
Blackpool 1 0 1 0.1 9 0 65 286 362
Burnley 200 1 1 1 7 2 35 161 408
Chorley 755 33 3 4 9 1 47 205 1,057
Fylde 371 8 2 5 9 0 39 170 604
Hyndburn 171 0 1 1 7 1 32 149 362
Lancaster 598 36 6 11 12 4 63 275 1,004
Pendle 446 4 1 2 5 1 36 165 661
Preston 285 27 2 5 12 1 61 268 661
Ribble Valley 361 12 6 9 4 5 31 129 557
Rossendale 516 0 1 1 5 3 30 135 691
South Ribble 257 11 3 3 9 1 44 200 529
18 Figures may not total due to rounding
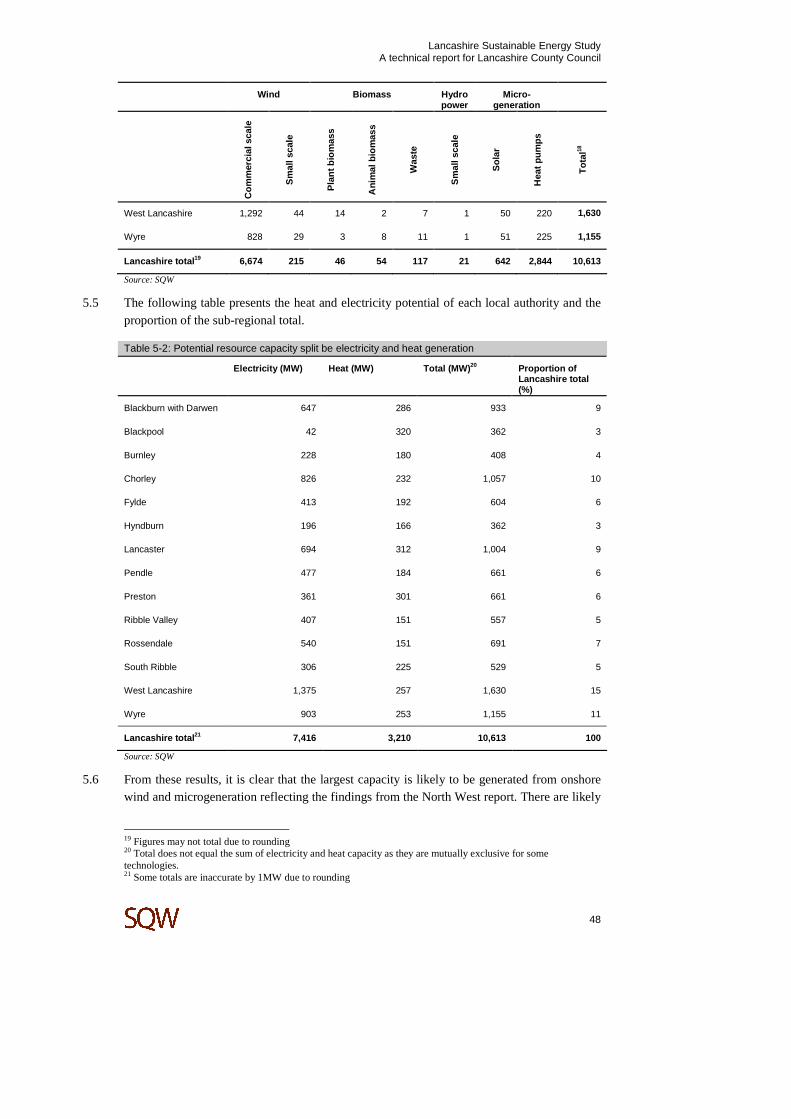
Lancashire Sustainable Energy Study A technical report for Lancashire County Council
48
Wind Biomass Hydropower
Micro-generation
Com
mer
cial
sca
le
Sm
all s
cale
Pla
nt b
iom
ass
Ani
mal
bio
mas
s
Was
te
Sm
all s
cale
Sol
ar
Hea
t pum
ps
Tot
al18
West Lancashire 1,292 44 14 2 7 1 50 220 1,630
Wyre 828 29 3 8 11 1 51 225 1,155
Lancashire total 19 6,674 215 46 54 117 21 642 2,844 10,613
Source: SQW
5.5 The following table presents the heat and electricity potential of each local authority and the proportion of the sub-regional total.
Table 5-2: Potential resource capacity split be electricity and heat generation
Electricity (MW) Heat (MW) Total (MW) 20 Proportion of Lancashire total (%)
Blackburn with Darwen 647 286 933 9
Blackpool 42 320 362 3
Burnley 228 180 408 4
Chorley 826 232 1,057 10
Fylde 413 192 604 6
Hyndburn 196 166 362 3
Lancaster 694 312 1,004 9
Pendle 477 184 661 6
Preston 361 301 661 6
Ribble Valley 407 151 557 5
Rossendale 540 151 691 7
South Ribble 306 225 529 5
West Lancashire 1,375 257 1,630 15
Wyre 903 253 1,155 11
Lancashire total 21 7,416 3,210 10,613 100
Source: SQW
5.6 From these results, it is clear that the largest capacity is likely to be generated from onshore wind and microgeneration reflecting the findings from the North West report. There are likely
19 Figures may not total due to rounding 20 Total does not equal the sum of electricity and heat capacity as they are mutually exclusive for some technologies. 21 Some totals are inaccurate by 1MW due to rounding
Lancashire Sustainable Energy Study A technical report for Lancashire County Council
49
to be several issues in taking forward these technologies which will reduce the capacity considerably: cumulative impact for wind and property condition and age for microgeneration are two immediate observations. These are the types of issues that will need to be considered in more detail by LAs potentially through the call-off support which SQW is providing within the next phase of this study.
Further supporting resources
5.7 The data and findings from this study have been presented in a variety of ways in order to satisfy different audiences (DECC and regional agencies, LAs, developers and local communities) who will be interested in greater or lesser levels of detail and technical complexity. These resources, all of which are available from www.lancashire.gov.uk, are summarised below:
• LA specific resource assessment reports – one for each local authority providing findings by renewable energy resource and assumptions used in summary.
• Full data sheets for each technology – these show all the assumptions and data used, the calculations undertaken and enable the reader to fully understand all the workings in a transparent way.
• This technical report provides further detail on the DECC methodology and North West Study and the full set of assumptions and datasets used.
• GIS maps supported by an ArcReader tool which is explained further below.
GIS mapping and ArcReader Tool
5.8 GIS mapping is a crucial tool for undertaking renewable energy resource assessments and presenting these spatially differentiated information. Annex A includes a full list of the GIS maps that have been produced for the study and can be accessed from www.lancashire.gov.uk.
5.9 In addition, we have developed an ArcReader Tool which can be used to better interpret the results from the mapping. Annex B includes the User guide to enable best use of this tool.
Lancashire Sustainable Energy Study A technical report for Lancashire County Council
A-1
Annex A: Map Index
A.1 The following maps are provided for each of the Lancashire local authorities. These can be accessed from www.lancashire.gov.uk.
Table A-1: Map Index
Figure A1 – Sub-region and authority boundaries
Figure A2 – Wind Speed at 45magl
Figure A3 – Landscape Designations, Nature Conservation and Heritage
Figure A4 – Bird Sensitive Areas
Figure A5 – Other Commercial Wind Development Constraints
Figure A6 – Unconstrained Area Identified through the Commercial Wind
Figure A7 – Small Scale Wind Speed Analysis
Figure A8 – Ward Classification
Figure A9 – Opportunities and constraints on land most suitable for Energy Crops
Figure A10 – Power Classification of Small Scale Hydropower Sites
Figure A11 – Sensitivity Classification of Small Scale Hydropower Sites
Figure A12 – Total Heat Demand Heat Map
Figure A13 – Domestic Heat Demand Heat Map
Figure A14 – Commercial and Industrial Heat Demand Heat Map
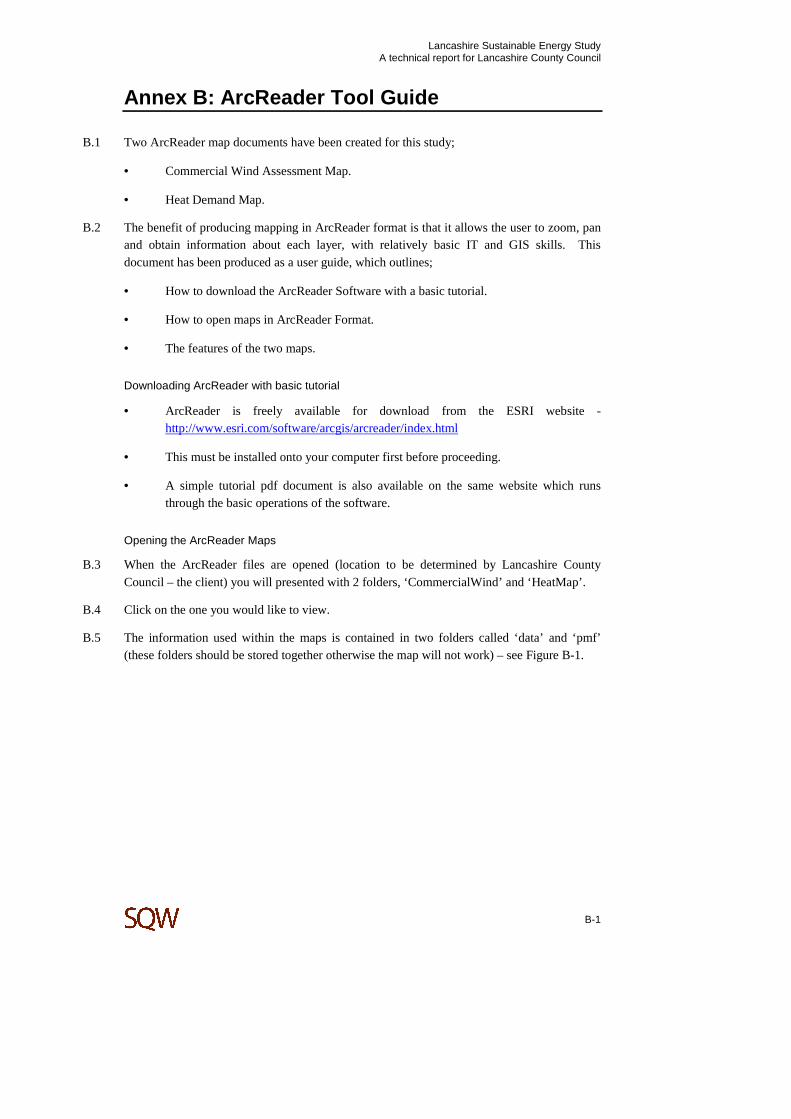
Lancashire Sustainable Energy Study A technical report for Lancashire County Council
B-1
Annex B: ArcReader Tool Guide
B.1 Two ArcReader map documents have been created for this study;
• Commercial Wind Assessment Map.
• Heat Demand Map.
B.2 The benefit of producing mapping in ArcReader format is that it allows the user to zoom, pan and obtain information about each layer, with relatively basic IT and GIS skills. This document has been produced as a user guide, which outlines;
• How to download the ArcReader Software with a basic tutorial.
• How to open maps in ArcReader Format.
• The features of the two maps.
Downloading ArcReader with basic tutorial
• ArcReader is freely available for download from the ESRI website - http://www.esri.com/software/arcgis/arcreader/index.html
• This must be installed onto your computer first before proceeding.
• A simple tutorial pdf document is also available on the same website which runs through the basic operations of the software.
Opening the ArcReader Maps
B.3 When the ArcReader files are opened (location to be determined by Lancashire County Council – the client) you will presented with 2 folders, ‘CommercialWind’ and ‘HeatMap’.
B.4 Click on the one you would like to view.
B.5 The information used within the maps is contained in two folders called ‘data’ and ‘pmf’ (these folders should be stored together otherwise the map will not work) – see Figure B-1.
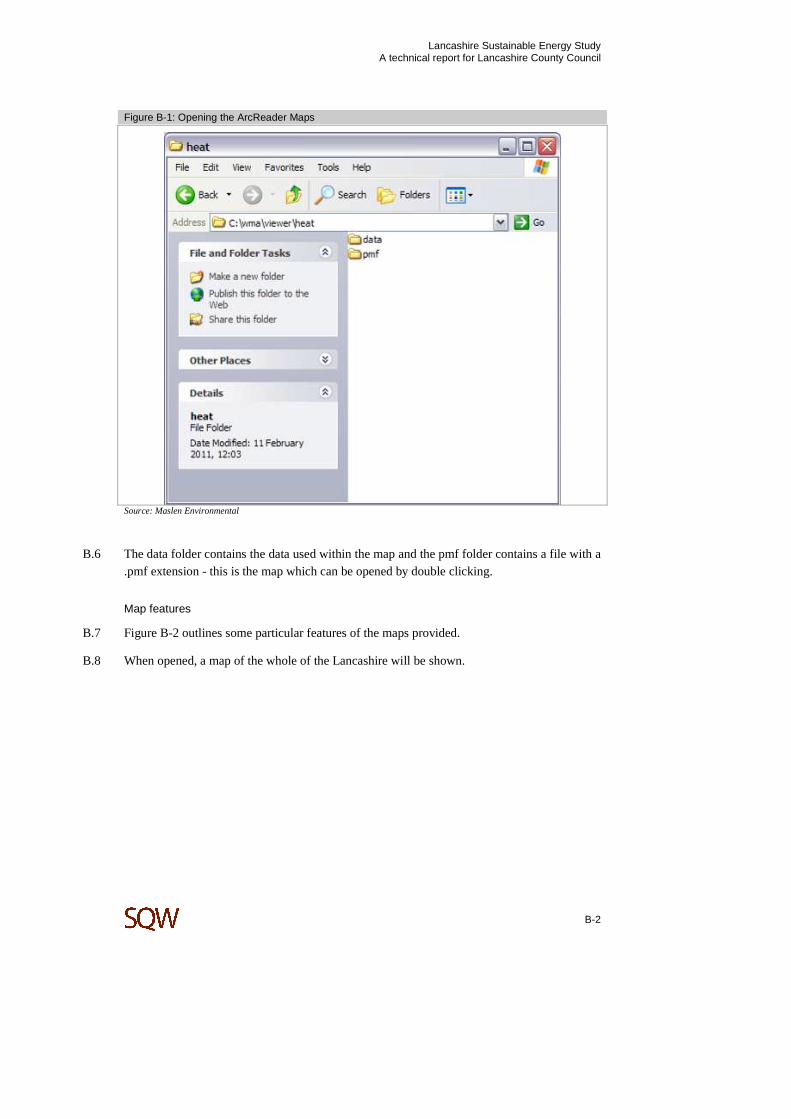
Lancashire Sustainable Energy Study A technical report for Lancashire County Council
B-2
Figure B-1: Opening the ArcReader Maps
Source: Maslen Environmental
B.6 The data folder contains the data used within the map and the pmf folder contains a file with a .pmf extension - this is the map which can be opened by double clicking.
Map features
B.7 Figure B-2 outlines some particular features of the maps provided.
B.8 When opened, a map of the whole of the Lancashire will be shown.
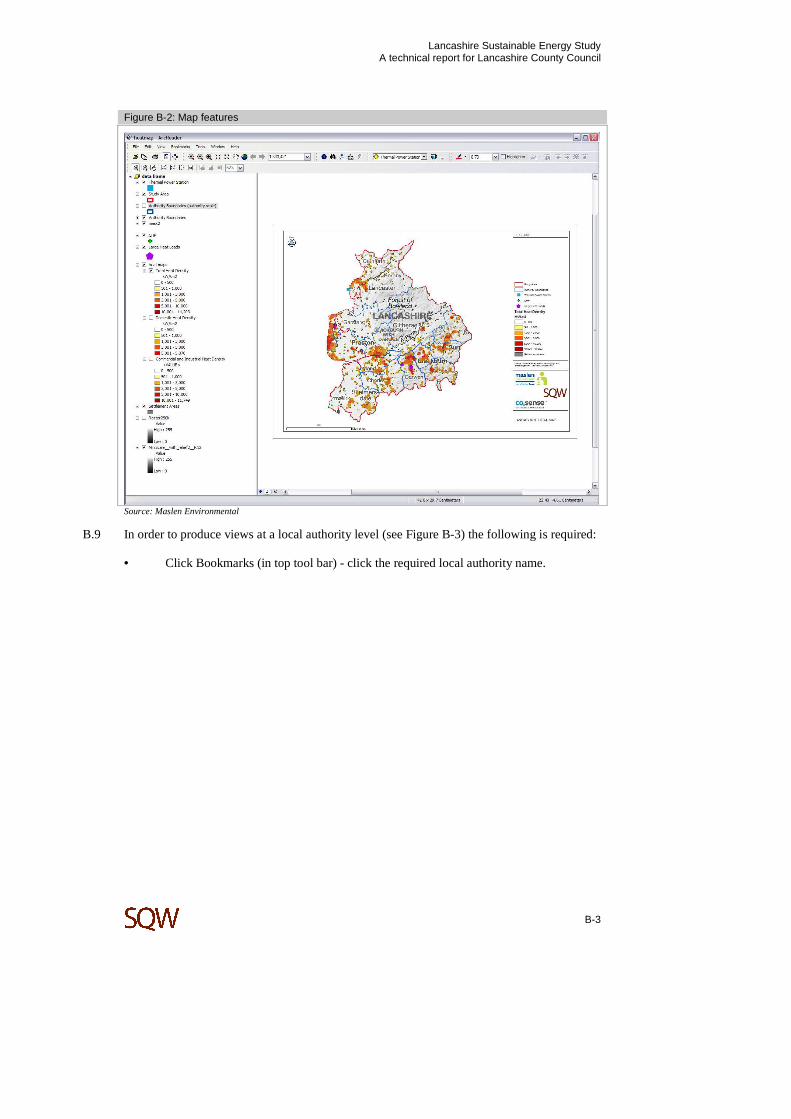
Lancashire Sustainable Energy Study A technical report for Lancashire County Council
B-3
Figure B-2: Map features
Source: Maslen Environmental
B.9 In order to produce views at a local authority level (see Figure B-3) the following is required:
• Click Bookmarks (in top tool bar) - click the required local authority name.
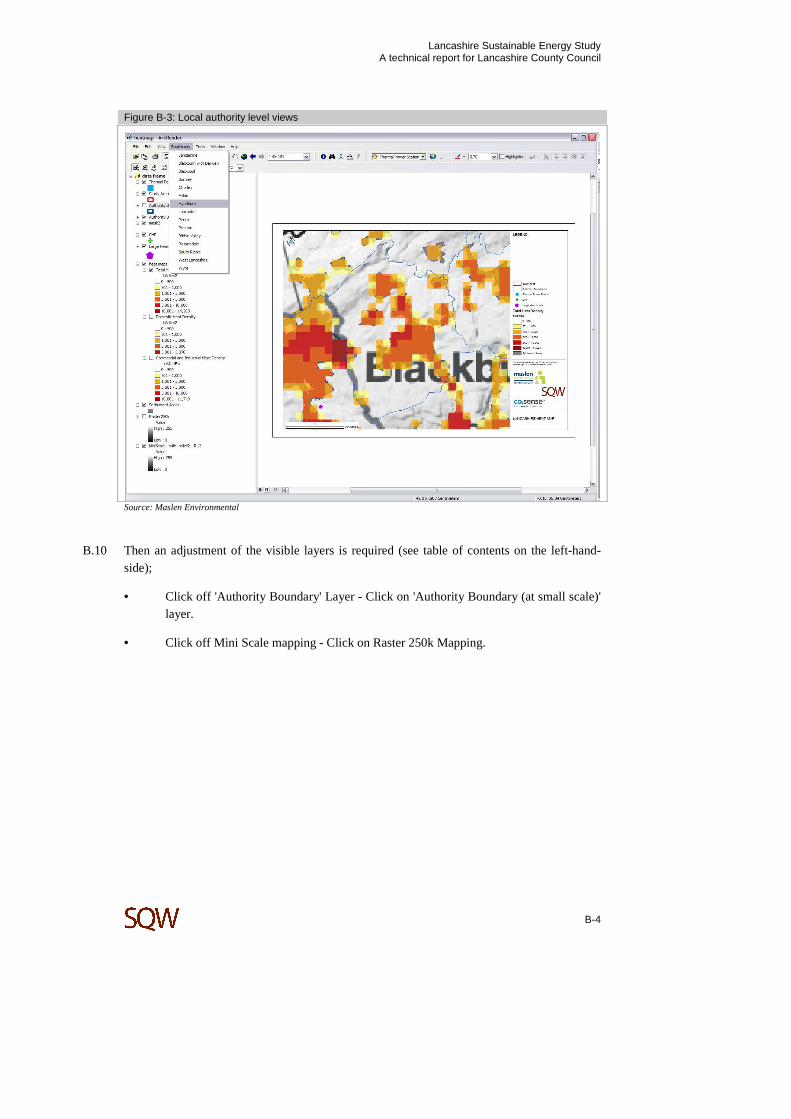
Lancashire Sustainable Energy Study A technical report for Lancashire County Council
B-4
Figure B-3: Local authority level views
Source: Maslen Environmental
B.10 Then an adjustment of the visible layers is required (see table of contents on the left-hand-side);
• Click off 'Authority Boundary' Layer - Click on 'Authority Boundary (at small scale)' layer.
• Click off Mini Scale mapping - Click on Raster 250k Mapping.

Lancashire Sustainable Energy Study A technical report for Lancashire County Council
B-5
5.10 This produces a view which is better suited for an individual authority scale map, see Figure B-4.
Figure B-4: Individual authority scale map
Source: Maslen Environmental
B.11 An additional feature to note is that the layers in the table of contents have been grouped (see Figure B-5). These groupings approximate to the individual maps presented in the appendix to the main study. For example, in the Commercial Wind Assessment (see screenshot below) the layers are grouped into ‘Unconstrained Land’, ‘Other Constraints’, ‘Nature Conservation and Heritage Constraint’ and ‘Wind Speed’.

Lancashire Sustainable Energy Study A technical report for Lancashire County Council
B-6
Figure 5-2: Map showing grouping of layers
Source: Maslen Environmental
Comment [c1]: Figure number.
![Bengali - Burnley by The Graphics Unit, Burnley Borough Council 2005. [t] 01282 425011 [x] 2653. jb_607 Bengali Designed by The Graphics Unit, Burnley Borough Council 2005. [t] 01282](https://img.pdfslide.us/doc/110x75/5aaedb5e7f8b9a6b308c97f0/bengali-burnley-by-the-graphics-unit-burnley-borough-council-2005-t-01282.jpg)
![Welcome [] · Brochure produced by The Friends of Burnley Gardens ... 1997 - Burnley Gardens formally became part of the University of Melbourne. 2003 - The 9.25 hectare Burnley Gardens,](https://img.pdfslide.us/doc/110x75/5fa3f68fb0d4d65a1d6bd8ed/welcome-brochure-produced-by-the-friends-of-burnley-gardens-1997-burnley.jpg)