Embed Size (px)
Citation preview

23 March 2016
LAMPRELL PLC ("Lamprell" and with its subsidiaries the “Group”)
2015 FINANCIAL RESULTS
Financial performance in line with expectations
Margins maintained despite challenging environment
2015 FINANCIAL RESULTS
2015 2014
(USD million, unless stated)
Revenue 871.1 1,084.9
EBITDA 90.0 137.0
EBITDA margin 10.3% 12.6%
Profit from continuing operations after income tax 66.5 93.2
Reported diluted earnings/per share (US cents) 18.9 37.4
Net cash as at 31 December 210.3 272.6
Dividend per share (US Cents) Nil Nil
Financial highlights
Profit of USD 66.5 million ahead of market expectations on the back of strong operational performance
and contribution from efficiency and productivity measures
Revenues of USD 871.1 million, slightly below earlier guidance due to the impact of the market downturn
EBITDA margin down from the exceptional level of 12.6% in 2014 to a more normalised level of 10.3%,
with pricing pressure partly offset by positive impact of higher productivity and cost efficiencies
Robust cash position of USD 210.3 million maintained despite spending on Project Evolution and the
working capital cycle
Operational highlights
High levels of activity with our yards close to full capacity in 2H and into 2016
Strong operational performance with three major projects delivered safely, on time, on budget and to high
quality standards
Option with NDC for a new jackup converted in April; further awards from Petrofac for additional
modules, now totalling 45 units for the landmark Upper Zakum project, Abu Dhabi
Backlog of USD 740 million (31 December 2014: USD 1.2 billion) of which 90% is attributable to 2016,
with bid pipeline slightly higher at approximately USD 5.4 billion (31 December 2014: USD 5.2 billion)
Safety remains a high priority, with an outturn total recordable incident rate of 0.31
Phase 2 of Project Evolution, our programme of productivity improvements and cost efficiencies,
commenced

Strategy in place
Strategy reviewed and refined during the year in light of the prolonged market downturn
Prospects pipeline assessed and composition refocused to maximise overall likelihood of awards
Near-term business development efforts shifted towards more resilient markets such as the Middle East
where we have a competitive position
Strategic alliances targeted to enable involvement in large projects
Memorandum of Understanding relating to potential participation in a Maritime Yard in Saudi Arabia
signed in January 2016
Current trading and outlook
Four major deliveries expected during the course of 2016, with all projects progressing well
Bid pipeline of USD 5.4 billion remains extensive, however delays in awards continue to affect
conversion rate; 90% of backlog attributable to 2016
Challenging market environment expected to affect the industry throughout 2016
Revenues for FY2016 currently expected to be around 5% below 2015 levels
Maintaining business flexibility with overhead cost reductions and further cost and productivity
improvements from additional opportunities identified through Project Evolution
Continuing efforts to leverage Lamprell’s regional expertise and competitive advantage
John Kennedy, Executive Chairman for Lamprell, said:
“2015 was a challenging year for the global energy industry and Lamprell began the year in a position of relative
strength, with a high level of backlog and a strengthened balance sheet, which allowed the Group to deliver a
robust performance. Although we have been affected by the slow-down in new awards worldwide as companies
have delayed project sanctions, Lamprell has shown resilience and has been quick to react and adapt. We have
refined our strategy and structured our operations so as to remain competitive and to be well-prepared for
another challenging year in 2016. At the same time, we have not lost sight of our strategic objectives by building
a foundation for longer-term growth. We continue to diversify our bid pipeline, pursue strategic alliances and
have recently announced early stage discussions regarding our potential participation in the Maritime Yard in
Saudi Arabia. In the meantime, our cost advantages and strong balance sheet will help us to compete in a very
challenging market as the downturn is expected to continue through 2016.”
James Moffat, Chief Executive Officer for Lamprell, said: “Lamprell’s operational performance has been consistently strong over the past few years and I am pleased to see
that continuing throughout 2015, resulting in financial performance in line with expectations in the face of market
headwinds. Having successfully implemented Project Evolution, the benefits from this programme of cost
efficiencies and productivity improvements have proven to be key to both our operational and our financial results
in 2015 and that will continue in 2016. We have been able to maintain our competitiveness in a market with significant downward pressure on pricing. As a result, not only have we maintained healthy margins, but this also helped us win one of only three rigs awarded globally in 2015. It seems unlikely that the markets will return to full recovery in 2016 and so we currently expect our full year revenues for 2016 to be around 5% below 2015 levels. Our business retains a high degree of flexibility leaving us sufficient room to undertake further measures to adapt to the market environment and preserve our long term future.”
The management team will hold a presentation for research analysts at 9.00am at Holborn Bars (138-142 Holborn,
London EC1 2NQ). The live webcast will be accessible on Lamprell’s website and on the following link:
http://webcasting.brrmedia.co.uk/broadcast/56e1a8234f1d147d54d0fc36.
The Company will hold its 2016 annual general meeting on 15 May 2016 in Dubai, United Arab Emirates.
- Ends -
Enquiries:
Lamprell plc
John Kennedy, Executive Chairman +971 (0) 4 803 9308
James Moffat, Chief Executive Officer +971 (0) 4 803 9308
Tony Wright, Chief Financial Officer +971 (0) 4 803 9308
Natalia Erikssen, Investor Relations +44 (0) 7885 522 989
Tulchan Communications, London +44 (0) 207 353 4200
Martin Robinson
Martin Pengelley
Notes to editors Lamprell, based in the United Arab Emirates (“UAE”) and with over 40 years’ experience, is a leading provider of
fabrication, engineering and contracting services to the offshore and onshore oil & gas and renewable energy
industries. The Group has established leading market positions in the fabrication of shallow-water drilling
jackup rigs, liftboats, land rigs, and rig refurbishment projects, and it also has an international reputation for
building complex offshore and onshore process modules and fixed platforms.
Lamprell employs more than 9,000 people across multiple facilities, with its primary facilities located in
Hamriyah, Sharjah and Jebel Ali, all of which are in the UAE. In addition, the Group has facilities in Saudi Arabia
(through a joint venture agreement). Combined, the Group’s facilities cover approximately 1,000,000 m2 with 2
km of quayside.
Lamprell is listed on the London Stock Exchange (symbol “LAM”).

Chairman’s statement
Challenging market backdrop
Contrary to the predictions of many market participants, oil prices continued to slide throughout 2015. Oil and gas
companies around the world reacted by gradual, and in some cases drastic, cuts to their capital expenditure.
Lamprell is not immune to the oil sector headwinds but we are pleased to report on our demonstrated ability to
withstand these challenges. Along with other energy industry contractors, we have seen delays in contract awards
but we have taken steps to adapt by changing our approach to new business development.
Maintaining a competitive position
In difficult times, companies often make the mistake of losing focus on their long term goals. Lamprell’s strong
position allowed us to withstand the storm without compromising our future growth plans. We managed to remain
competitive and continue to implement our strategy.
Similar to most of our peers, our pipeline conversion was affected by project delays and cancellations.
Nevertheless our bid-to-win ratio remained healthy by industry standards and this is an important factor indicating
Lamprell’s strong competitive position. It gives comfort about our ability to recover from the difficult contracting
environment.
We also judge our strength by our ability to compete without undermining Lamprell’s financial performance or
commercial position. In the context of increased pricing pressure, where numerous market players saw gradual
margin erosion, we have been able to remain profitable. The gains delivered through Project Evolution allowed us
to protect our normalised margins whilst enabling us to offer attractive propositions in a tough market. This
business flexibility and our strong client relationships have helped us maintain leadership in the jackup market,
with a win of the ninth rig from National Drilling Company (“NDC”), one of only three jackup rig orders placed
worldwide in 2015.
Focus on the future
Whilst we are taking steps to ensure we successfully weather the current storm in the sector, we anticipate a
recovery in the energy markets, as do most industry experts, and so we are also continuing to focus on our future.
We have reviewed our strategy for robustness, redirecting our marketing efforts from slower international regions
around the world to the Middle East where we can leverage our position of strength.
As a Board, we have also spent considerable time assessing our medium-term positioning in the market and
potential sources of growth for Lamprell. With this in mind, we have identified strategic partnerships as a
potential route to a step-change in the scale of projects to target. In line with this plan, in January 2016 we
announced a Memorandum of Understanding with Saudi Aramco, Bahri and Hyundai Heavy Industries regarding
a potential partnership for collaboration on the Maritime Complex in Saudi Arabia. The discussions are still at an
early stage, but this could become a sizeable business opportunity for Lamprell. I took on the responsibility of
Executive Chairman to identify opportunities for strategic initiatives and other means to grow the business in an
outward facing role. Our work on potential alliances continues, and we will update our shareholders on progress
as appropriate.
Strong Board
In this endeavour, I have benefited from the support of a strong Board. Following the departure of Michael Press
and the passing of Peter Whitbread during 2015, Lamprell has enhanced the Board’s independence and
composition with the addition of two Directors with impressive experience and Ellis Armstrong’s appointment as
Senior Independent Director. Debra Valentine brings significant industry knowledge coupled with expertise in

corporate transactions. Mel Fitzgerald is a seasoned executive with 30 years of industry experience. It was also
pleasing to promote from within, with the appointment of Tony Wright to the Board in the role of Chief Financial
Officer.
Lamprell’s Board will be completed with the recruitment of a new CEO following Jim Moffat’s announced
retirement from the full-time CEO position in 2016. Lamprell will continue to benefit from Jim’s expertise for a
year following his retirement but I would like to take this opportunity to thank him and the wider senior
management team for their dedication and drive to secure a strong future for the Group.
I would also like to thank our shareholders for their support through these challenging times. The Board will
continue to work tirelessly to deliver the strategy firm in our belief in Lamprell’s future.
John Kennedy
Executive Chairman
Chief Executive Officer’s Review
After a year of exceptional financial results in 2014, Lamprell has maintained a strong operational performance
and built on the strong business position towards long-term growth. The focus is now on executing our strategy.
2015 will certainly be remembered as a difficult year for the industry, but for Lamprell it was an important turning
point. After a year of recovery in 2013 and the exceptional performance in 2014, this year has shown the
underlying robustness of Lamprell’s business, with its ability to be flexible and adapt to the changing
environment. In 2015, we demonstrated that Lamprell is resilient enough to return to normalised performance,
even in the context of a challenging market.
Maintaining high activity levels
Overall, our performance across the key metrics was strong. We focused on the elements under our control, which
allowed us to manage the impact of the external environment. Operationally, we have done well, delivering three
major projects on time, on budget and to high safety and quality standards. We have seen an extension in scope of
the project we are fabricating for Petrofac, a testament to our performance. Our yards remained full throughout the
second half of the year.
The strength of our client relationships is a key driver of our performance, and we continued to develop these
through our collaborative approach. Having awarded Lamprell a contract for the ninth in a series of jackup rigs,
NDC subsequently extended its options with Lamprell to a current total of three options. We also offered the
service of stacking client rigs in our facilities in the spirit of current and future cooperation.
New build jackup rigs were the largest contributor to our revenue this year, with offshore/onshore construction
suffering from a slow-down in the market downturn. The challenging environment has also significantly impacted
the contribution from our walk-in business, with rig refurbishment revenue reduced by more than half compared
to 2014, which is the reason behind our total revenue being slightly below our earlier guidance. Our land rigs
business unit performed broadly in line with our expectations, albeit reflecting the slow-down in the industry, and
completed 13 projects in total during 2015.
Maximising operational performance through improvements
During the course of the year we improved significantly our efficiency and productivity in the yards. The
implementation of Project Evolution was almost entirely completed by the end of the year, with a new panel line
fully operational and significant improvements in automation.

We started to see the benefits in terms of productivity almost immediately upon completion of each component of
the project. As you would expect with the introduction of new equipment and training requirements, some of the
initiatives took time to ramp up to their full run-rate but we have benefited from the improvements throughout the
year. For example welding, which constitutes a major component in fabrication with approximately 30% of total
manhours, has seen a dramatic step up as we modernised our processes. The beam-cutting robots cut beams to
exact size many times faster and more accurately than a human can.
We have also optimised painting, crane and scaffolding services, as well as our use of yard space and assets. As a
result, we have been able to accommodate the construction of seven concurrent jackup rigs in our Hamriyah yard,
a record for the Group.
At the time of the start of Project Evolution, we expected full payback within three to four years. While this
remains appropriate guidance, we delivered better savings than first anticipated during 2015, whilst also
implementing the Project within budget and the timeframe specified originally. The savings and efficiencies
generated by Project Evolution allowed us to protect our margins whilst at the same time remaining competitive in
a market with increased pricing pressure. With the recent appointment of Niall O’Connell as COO a strong focus
will be on driving these operational improvements even further. Phase 2 of Project Evolution has commenced
with the approval of a new pipeshop.
Our safety record throughout the year was stable with a total recordable incident rate around 0.3. The Jebel Ali and
Dubai facilities also achieved a major milestone, having now operated for three years without a day away from
work case, a significant achievement given the nature of our business. We have set new improvement goals and
are looking at new ways to strengthen the safety culture further within the workforce and prevent all avoidable
incidents.
Focus on remaining competitive in a challenging market environment
As drilling programmes started to be scaled back in response to weak oil prices, the pace of the contract awards
has slowed down across the whole supply chain. Along with our peers, we suffered from this and this is reflected
in the lack of major awards during the second half of the year. The slow-down in order intake has however had an
impact on our backlog, which stood at USD 740 million at period end and provides reasonable revenue coverage
for the current year with approximately 90% attributable to 2016.
In the first half of the year, we were successful in converting one of the jackup rig options with NDC and we saw
an award of additional modules on the Abu Dhabi project for our client, Petrofac, with the total now standing at 45
preassembled racks, units and modules. We have also seen a number of smaller contract awards across our
businesses, including a contract award for suction caps and buoyancy tanks from a new client. In our drive to
expand our offering, we also built our first land rig of Lamprell’s proprietary design, which we started marketing
towards the end of the year. The initial feedback from potential customers has been positive and we believe it will
be an attractive product for Middle East clients, having been specifically designed for the region.
Despite a healthy bid-to-win rate being maintained, the conversion rate of our pipeline suffered from a slow-down
in awards across the global markets. Whilst bidding activity levels are high and our bidding pipeline is extensive,
we continue to be affected by the industry-wide trend of projects drifting to the right. In response to this
slow-down we have continued to improve our approach to business development and, specifically, we
dynamically adapted the composition of our bid pipeline throughout the year to address the changing
circumstances. We regularly reassess the likelihood of sanction or proactively replace the delayed projects with
new bids more likely to be awarded in the near future. Our bid pipeline currently stands at USD 5.4 billion, which
is at comparable level to last year’s, whilst its composition has changed. In practice, this was driven by a
conscious shift away from the quieter international markets to more buoyant regional markets such as the Middle
East, which maintains higher activity levels in the current environment. The Company, due to its geographic
location, believes it is relatively well placed to capitalise on this comparative market strength.

In our effort to minimise the impact of the downturn on our near and medium term performance, we have
streamlined the organisational structure with efficiencies and overhead reductions and we expect to generate
further efficiencies this year. The high activity levels to date have meant that despite maintaining flexibility,
Lamprell did not have to adjust its operations to a quieter market, unlike many other companies in our sector,
however we continuously review our ability to react to a significant drop in activity should action be required. We
value this additional room for flexibility, particularly this far into the market downturn, as an important
competitive advantage for Lamprell.
Outlook
The strong foundations laid over the last 18 months have created a structure for us to be competitive and deliver a
strong operational performance consistently. With our ongoing bidding efforts, we expect to be able to persevere
through the downturn and then emerge from it in a strong position for growth to deliver our strategy. With this in
mind, we believe our ability to win large projects could be enhanced by forming strategic alliances. In early 2016
we signed a Memorandum of Understanding regarding Lamprell’s potential participation in the Maritime
Complex in eastern Saudi Arabia. We have also agreed to work with Dubai Drydocks to identify opportunities
for cooperation on FPSO/FPU projects in the context of Dubai’s aspiration to become a strategic location for such
projects. We will continue to scrutinise the market for other value-added alliances.
There is a lot of uncertainty in the current markets but Lamprell’s focus for 2016 is on demonstrating resilience
and its ability to progress towards future growth despite the industry challenges. We remain confident in our
ability to deliver on our strategy, which we believe is the right path to long term success. Despite our confidence in
the long term future, this does not leave us immune from the market downturn and we expect the challenges to
continue impacting our performance in 2016.
The Board currently expects the revenues for 2016 to be around 5% below Lamprell’s performance in 2015 as the
overall market downturn continues to have an impact on the Company. In the meantime, the management team
will continue its focus on protecting margins benefiting from cost efficiencies and productivity improvements.
The Group remains firmly focused on influencing the factors under its control by improving performance,
streamlining the business and shifting its focus to the Middle East region.
James Moffat Chief Executive Officer
Lamprell plc
Financial Review
Results from operations
We are pleased to deliver healthy and steady financial performance in 2015 following a year of exceptional
financial results in 2014. The combination of strong operational execution and savings achieved as a result of
Project Evolution allowed us to deliver good margins despite global headwinds in the sector.
The Group’s total revenue for the year was USD 871.1 million, slightly below our earlier guidance due to the
impact of the market downturn on our walk-in business. Our other businesses performed in line with expectations.
The new build jackup segment remained the main source of revenue for Lamprell, with a record number of seven
concurrent rigs under construction in the yard. Our revenues for 2015 were heavily weighted to the second half of
the year due to the phasing of construction, as several of our projects were at the early stages in their build
schedules in the six months to 30 June 2015.
The additional awards by Petrofac have provided a significant contribution to our module business.

Whilst we are seeing repeat business from our clients, the general weakness across the sector has driven a
reduction in revenues from our rig refurbishment business. We delivered 11 refurbishment projects in 2015. We
also took on high quality projects, with a number of wins for important clients albeit of fairly modest value, in our
E&C business unit.
Margin performance
The Group completed the major part of the investment under Project Evolution, with the realised savings partly
utilised to protect Lamprell’s margins whilst retaining our competitive position in an environment of increased
pricing pressure. This investment programme allowed the Group to maintain its normalised margins despite the
industry difficulties which impacted the financial performance of its sector.
The Group’s gross margin decreased to USD 123.5 million from USD 182.1 million in the previous year primarily
due to lower revenues, project phasing and a return to normalised performance. The drop in rig refurbishment
revenue in the current environment had a minor negative impact on margins, whilst our new build jackup business
managed to maintain stable margins at normalised levels. The main reason for this was the savings and
productivity gains delivered by the Project Evolution initiatives.
EBITDA excluding discontinued operations and exceptional items for the period was USD 90.0 million (2014:
USD 137.0 million). The Group’s EBITDA margin decreased from 12.6% in 2014 to 10.3% in 2015, reflecting
the absence of the 2014 exceptional items, partially offset by certain one off events in 2015 such as bad debt
recoveries.
Finance costs and financing activities
Net finance costs in the period decreased to USD 12.0 million (2014: USD 18.4 million). Gross finance costs were
USD 5.9 million lower due to reduced interest margins and lower bonding costs, partially offset by increased
commitment fees on our facilities following the refinancing in 2014. Finance income has increased by USD 0.5
million as a result of higher cash deposits.
Net profit after exceptional items and earnings per share
The Group recorded a profit for 2015 attributable to the equity holders of USD 64.7 million (2014: USD 118.1
million). The fully diluted earnings per share for the year was 18.84 cents (2014: 37.38 cents), based on strong
underlying performance in the absence of the exceptional items reported in 2014.
Capital expenditure
The Group’s capital expenditure in 2015 increased to USD 59.5 million (2014: USD 22.5 million). The main area
of investment was yard improvement under Project Evolution, which included the purchase of new equipment
including the new panel line , beam cutting robots and some yard infrastructure enhancements. The major part
of the investment under Project Evolution is now complete, with the second phase of Project Compass live across
the Group since 1 October 2015.
Cash flow and liquidity
The Group’s net cash flow from operating activities for 2015 reflected a net outflow of USD 0.8 million (2014: net
outflow of USD 39.8 million) arising predominantly from the Group’s EBITDA and offset by increased working
capital requirements due to the natural cycle on major projects.
Cash and bank balances decreased by USD 82.0 million, resulting from a net cash outflow from investing
activities attributable to the major capital investment programme and an outflow from financing activities. The
Group’s net cash position remains strong at USD 210.3 million (2014: USD 272.6 million), a decrease in line with
expectations due to capital spend on Project Evolution and the phasing of the construction cycle on our projects.
Balance sheet
The Group maintained a strong balance sheet, providing flexibility and security in a challenging environment for
the industry.
The Group’s total current assets at the period-end were USD 725.3 million (2014: USD 780.7 million). Trade and
other receivables increased to USD 428.3 million (2014: USD 403.6 million) due to unfavourable timing on
milestone payments as well as advance payments to suppliers to secure favourable terms for equipment procured.
Shareholders’ equity increased from USD 672.2 million to USD 737.6 million at 31 December 2015. The
movement mainly reflects increased retained earnings of USD 410.4 million (2014: USD 344.5 million).
The Group’s debt/equity ratio of 10.8% at 31 December 2015 (2014: 14.7%) emphasises our low levels of
leverage and balance sheet strength.
Borrowings and debt
In 2015, following the major debt refinancing the previous year, the Group’s facilities comprised (a) a USD 100
million term loan amortised over five years, of which USD 20 million was repaid over the course of the year; (b)
USD 50 million for general working capital purposes which remained undrawn; and (c) USD 200 million of
working capital for project financing, which has not been taken up by our clients to date. Lamprell continued to
market this facility as part of a number of bids and the aim remains to leverage it in future projects.
In addition, the related USD 250 million committed bonding facility, which is available for use in connection with
new contract awards funded by the working capital facility detailed in (c) above, remained undrawn in 2015 and
the Group has been able to leverage its bilateral bonding facilities for better commission rates.
The outstanding borrowings were USD 79.3 million as at 31 December 2015 (2014: USD 99.0 million).
Change of auditors
Following a formal tender process in line with market best practice, the Audit & Risk Committee made a
recommendation for the appointment of Deloitte LLP as the external auditor for the Company, which the Board
approved. Deloitte LLP has expressed its willingness to act as external auditor and a resolution to appoint Deloitte
LLP will be proposed at the forthcoming AGM for their services in respect of the 2016 financial year.
Going concern
After reviewing its cash flow forecasts for a period of not less than 12 months from the date of signing these
financial statements, the Directors have a reasonable expectation that the Group will have adequate resources to
continue in operational existence for the foreseeable future. The Directors have concluded therefore that it is
appropriate for the Group to continue to adopt the going concern basis in preparing its financial statements.
Dividends
Given the challenging market environment and the Group’s strategy to retain a strong net cash position and
balance sheet, the Directors do not recommend the payment of a dividend for the current financial year ending 31
December 2015. In the future the Directors will continue to review this position in light of market conditions at
the relevant time.
Antony Wright Chief Financial Officer

Lamprell plc
Consolidated income statement
Year ended 31 December
Note
2015
USD'000
2014
USD'000
Continuing operations
Revenue 5 871,058 1,084,890
Cost of sales 6 (747,538) (902,810)
Gross profit 123,520 182,080
Selling and distribution expenses 7 (1,771) (1,773)
General and administrative expenses 8 (44,318) (72,700)
Other gains/(losses) – net 11 260 1,456
Operating profit 77,691 109,063
Finance costs 10 (14,647) (20,516)
Finance income 10 2,679 2,166
Finance costs – net (11,968) (18,350)
Share of profit of an investment accounted for using the equity method 1,318 2,991
Profit before income tax 67,041 93,704
Income tax expense (541) (484)
Profit for the year from continuing operations 66,500 93,220
Discontinued operations
Loss for the year from discontinued operations 18 (1,866) (6,433)
Gain on disposal of subsidiary 66 31,270
Profit for the year attributable to the equity holders of the Company 64,700 118,057
Earnings per share for profit from continuing operations attributable to
the equity holders of the Company 12
Basic 19.46c 29.54c
Diluted 19.36c 29.52c
Earnings per share attributable to the equity holders of the Company 12
Basic 18.93c 37.41c
Diluted 18.84c 37.38c
Lamprell plc
Consolidated statement of comprehensive income
Note
2015
USD'000
2014
USD'000
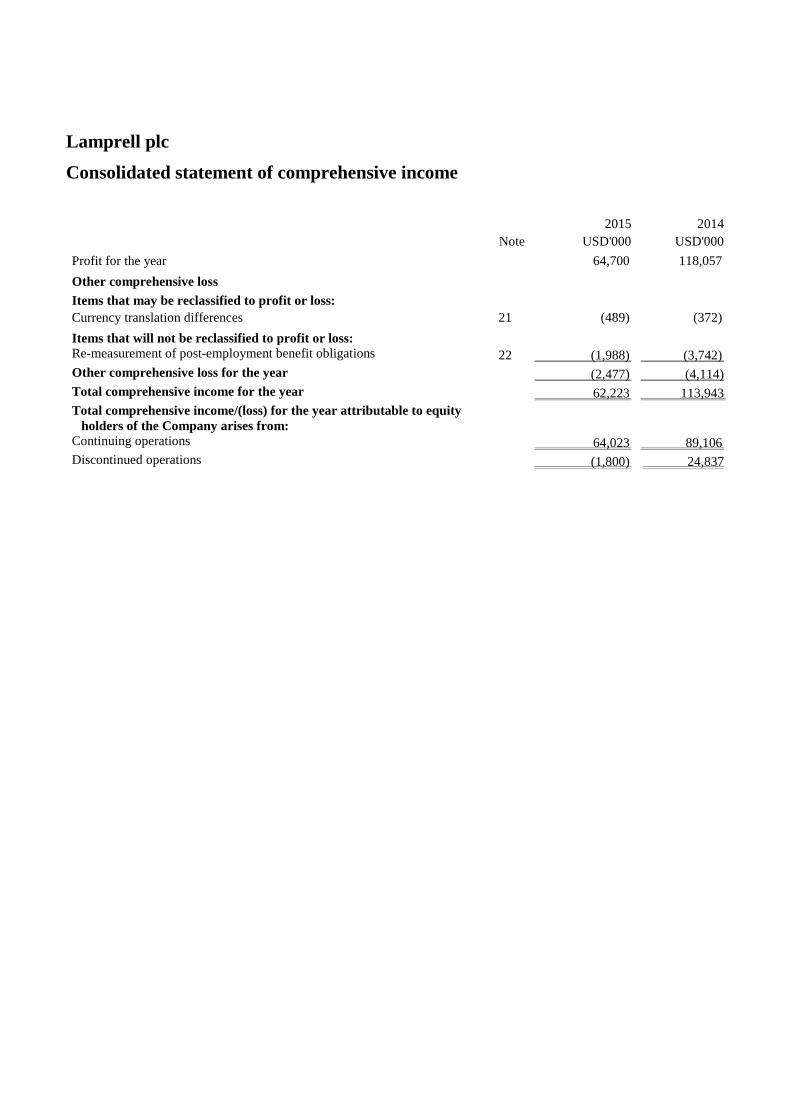
Profit for the year
64,700 118,057
Other comprehensive loss
Items that may be reclassified to profit or loss:
Currency translation differences 21 (489) (372)
Items that will not be reclassified to profit or loss: Re-measurement of post-employment benefit obligations 22 (1,988) (3,742)
Other comprehensive loss for the year (2,477) (4,114)
Total comprehensive income for the year 62,223 113,943
Total comprehensive income/(loss) for the year attributable to equity
holders of the Company arises from:
Continuing operations 64,023 89,106
Discontinued operations (1,800) 24,837

Lamprell plc
Consolidated balance sheet
Note
2015
USD'000
2014
USD'000
ASSETS
Non-current assets
Property, plant and equipment 13 175,286 139,343
Intangible assets 14 205,884 204,726
Investment accounted for using the equity method 5,285 5,118
Trade and other receivables 16 12,712 11,876
Derivative financial instruments 23 - 55
Cash and bank balances 17 8,950 12,517
Total non-current assets 408,117 373,635
Current assets
Inventories 15 29,066 14,560
Trade and other receivables 16 415,614 391,743
Derivative financial instruments 23 - 14
Cash and bank balances 17 280,668 359,108
725,348 765,425
Assets of disposal group classified as held for sale 18 - 15,228
Total current assets 725,348 780,653
Total assets 1,133,465 1,154,288
LIABILITIES
Current liabilities
Borrowings 26 (20,136) (20,136)
Trade and other payables 24 (264,943) (317,603)
Derivative financial instruments 23 (4) (269)
Provision for warranty costs and other liabilities 25 (8,334) (15,812)
Current tax liability (451) (167)
(293,868) (353,987)
Liabilities of disposal group classified as held for sale 18 - (10,546)
Total current liabilities (293,868) (364,533)
Net current assets 431,480 416,120
Non-current liabilities
Borrowings 26 (59,163) (78,843)
Derivative financial instruments 23 (14) -
Provision for employees' end of service benefits 22 (42,863) (38,752)
Total non-current liabilities (102,040) (117,595)
Total liabilities (395,908) (482,128)
Net assets 737,557 672,160
EQUITY
Share capital 20 30,346 30,346
Share premium 20 315,995 315,995
Other reserves 21 (19,144) (18,655)
Retained earnings 410,360 344,474
Total equity attributable to the equity holders of the Company 737,557 672,160

Lamprell plc
Consolidated statement changes of equity
Note
Share
capital
USD'000
Share
premium
USD'000
Other
reserves
USD'000
Retained
earnings
USD'000
Total
USD'000
At 1 January 2014 23,552 211,776 (22,133) 229,561 442,756
Profit for the year - - - 118,057 118,057
Other comprehensive income:
Re-measurement of
post-employment benefit
obligations
22 - - - (3,742) (3,742)
Currency translation differences 21 - - (372) - (372)
Total comprehensive income for
the year
- - (372) 114,315 113,943
Disposal of subsidiary 21 - - 3,850 - 3,850
Transactions with owners:
Proceeds from shares issued (net) 20 6,794 104,219 - - 111,013
Share based payments:
– value of services provided - - - 1,084 1,084
Treasury shares purchased 20 - - - (486) (486)
Total transactions with owners 6,794 104,219 - 598 111,611
At 31 December 2014
30,346 315,995 (18,655) 344,474 672,160
Profit for the year - - - 64,700 64,700
Other comprehensive income:
Re-measurement of
post-employment benefit
obligations
22 - - - (1,988) (1,988)
Currency translation differences 21 - - (489) - (489)
Total comprehensive income for
the year
- - (489) 62,712 62,223
Transactions with owners:
Share based payments:
– value of services provided - - - 3,174 3,174
Total transactions with owners - - - 3,174 3,174
At 31 December 2015
30,346 315,995 (19,144) 410,360 737,557
Lamprell plc
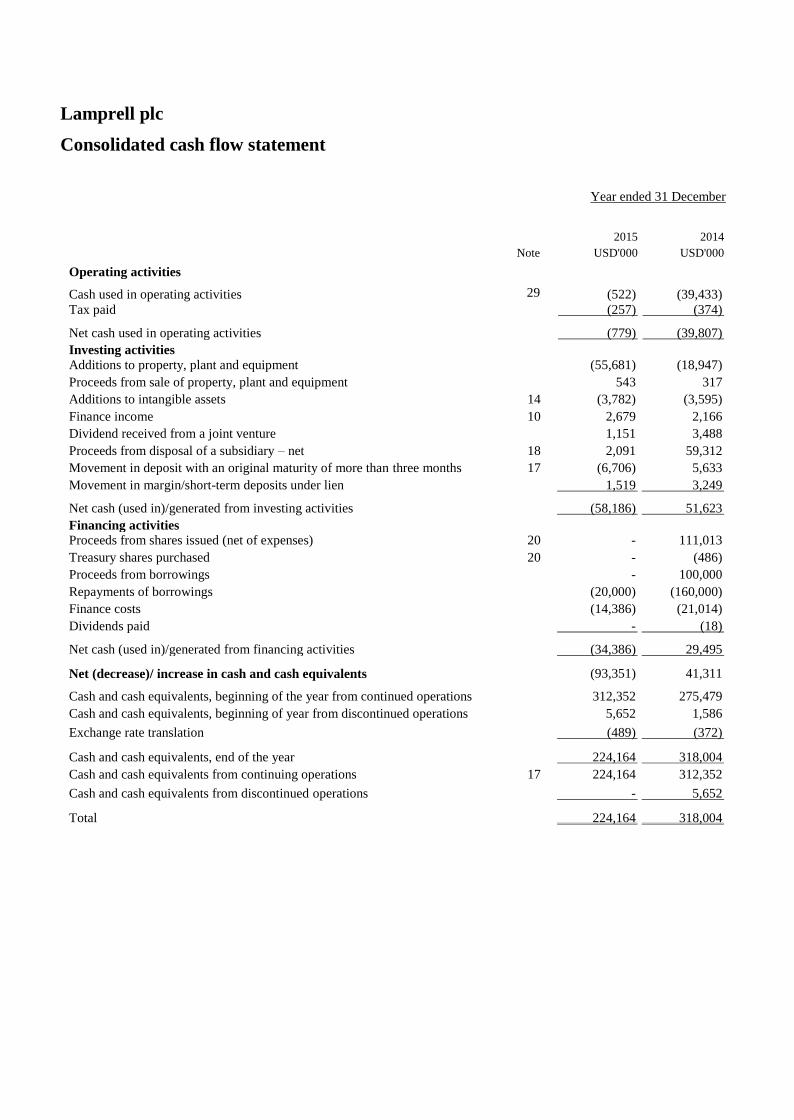
Consolidated cash flow statement
Year ended 31 December
Note
2015
USD'000
2014
USD'000
Operating activities
Cash used in operating activities 29 (522) (39,433)
Tax paid (257) (374)
Net cash used in operating activities (779) (39,807)
Investing activities
Additions to property, plant and equipment (55,681) (18,947)
Proceeds from sale of property, plant and equipment 543 317
Additions to intangible assets 14 (3,782) (3,595)
Finance income 10 2,679 2,166
Dividend received from a joint venture 1,151 3,488
Proceeds from disposal of a subsidiary – net 18 2,091 59,312
Movement in deposit with an original maturity of more than three months 17 (6,706) 5,633
Movement in margin/short-term deposits under lien 1,519 3,249
Net cash (used in)/generated from investing activities (58,186) 51,623
Financing activities
Proceeds from shares issued (net of expenses) 20 - 111,013
Treasury shares purchased 20 - (486)
Proceeds from borrowings - 100,000
Repayments of borrowings (20,000) (160,000)
Finance costs (14,386) (21,014)
Dividends paid - (18)
Net cash (used in)/generated from financing activities (34,386) 29,495
Net (decrease)/ increase in cash and cash equivalents (93,351) 41,311
Cash and cash equivalents, beginning of the year from continued operations 312,352 275,479
Cash and cash equivalents, beginning of year from discontinued operations 5,652 1,586
Exchange rate translation (489) (372)
Cash and cash equivalents, end of the year 224,164 318,004
Cash and cash equivalents from continuing operations 17 224,164 312,352
Cash and cash equivalents from discontinued operations - 5,652
Total 224,164 318,004

Lamprell plc
Notes to the financial statements
1 Legal status and activities
Lamprell plc (“the Company”) and its subsidiaries (together referred to as “the Group”) are engaged in
the assembly and new build construction for the offshore oil and gas and renewable sectors; fabricating
packaged, pre-assembled and modularised units; constructing accommodation and complex process
modules for onshore downstream projects; construction of complex living quarters, wellhead decks,
topsides, jackets and other offshore fixed facilities; rig refurbishment; land rig services; engineering
and construction and operations and maintenance.
2 Basis of preparation
The Group is required to present its annual consolidated financial statements for the year ended 31
December 2015 in accordance with EU adopted International Financial Reporting Standards ("IFRS"),
International Financial Reporting Interpretations Committee ("IFRIC") interpretations and those parts
of the Isle of Man Companies Acts 1931-2004 applicable to companies reporting under IFRS.
This financial information set out in this preliminary announcement does not constitute the Group's
statutory accounts for the year ended 31 December 2015. The financial information has been
extracted from the consolidated financial statements for the year ended 31 December 2015 approved
by the Board of Directors on 22 March 2015 upon which the auditors' opinion is not modified and did
not contain a statement under section 15(4) or 15(6) of the Isle of Man Companies Act 1982.
The financial information comprises the Group balance sheets as of 31 December 2015 and 31
December 2014 and related Group income statement, statement of comprehensive income, cash flows,
statement of changes in equity and related notes for the twelve months then ended, of Lamprell plc.
This financial information has been prepared under the historical cost convention except for the
measurement at fair value of share options, financial assets at fair value through profit or loss and
derivative financial instruments.
The preliminary results for the year ended 31 December 2015 have been prepared in accordance with
the Listing Rules of the London Stock Exchange.
After reviewing its cash flow forecasts for a period of not less than 12 months from the date of signing of
these financial statements, the Directors have a reasonable expectation that the Group will have adequate
resources to continue in operational existence for the foreseeable future. Therefore, the Group continues
to adopt the going concern basis in preparing its financial statements.
The preparation of financial statements in conformity with IFRS requires the use of certain critical
accounting estimates. It also requires management to exercise its judgement in the process of applying
the Group’s accounting policies. The areas involving a higher degree of judgement or complexity, or
areas where assumptions and estimates are significant to the consolidated and parent company
financial statements, are disclosed in Note 4.
3 Accounting policies
The accounting policies used are consistent with those set out in the audited financial statements for
the year ended 31 December 2014 and reviewed interim financial information for the period ended 30
June 2015, which are available on the Company’s website, www.lamprell.com.

4 Critical accounting estimates and judgements
Estimates and judgements are continually evaluated and are based on historical experience and other
factors, including expectations of future events that are believed to be reasonable under the
circumstances. The Group makes estimates and assumptions concerning the future. The resulting
accounting estimates will, by definition, seldom equal the related actual results. The estimates and
assumptions that have a significant risk of causing a material adjustment to the carrying amounts of
assets and liabilities within the next financial year are as follows:
Revenue recognition
The Group uses the percentage-of-completion method in accounting for its contract revenue. Use of
the percentage-of-completion method requires the Group to estimate the stage of completion of the
contract to date as a proportion of the total contract work to be performed in accordance with the
accounting policy. As a result, the Group is required to estimate the total cost to completion of all
outstanding projects at each period end. The application of a 10% sensitivity to management estimates
of the total costs to completion of all outstanding projects at the year-end would result in the revenue
and profit increasing by USD 30.5 million (2014: USD 4.4 million) if the total costs to complete are
decreased by 10% and the revenue and profit decreasing by USD 28.5 million (2014: USD 4.4 million)
if the total costs to complete are increased by 10%.
Estimated impairment of goodwill
The Group tests goodwill for impairment annually or more frequently if events or changes in
circumstances indicate a potential impairment. Goodwill is monitored by management at the “cash
generating unit relating to upgrade and refurbishment of offshore jackup rigs, fabrication, assembly
and new build construction for the offshore oil and gas and renewables sectors, including FPSO and
other offshore and onshore structures, oilfield engineering services, including the upgrade and
refurbishment of land rigs” (“CGU1”). This CGU also represents the operating segment UAE for the
Group (Note 5).
The recoverable amount of CGU1 is determined based on value-in-use calculations. These calculations
require the use of estimates.
The amount of headroom is USD 311.6 million (2014: USD 290.6 million).
If the revenue growth rate used was to differ by 0.5% from management’s estimates, in isolation, there
would be a reduction of USD 3.9 million (2014: USD 5.7 million) in the headroom if the revenue
growth rate was lower or the headroom would be higher by USD 3.9 million (2014: USD 5.7 million)
if the revenue growth rate was higher.
If the discount rate used was to differ by 0.5% from management’s estimates, in isolation, there would
be a reduction in the headroom of USD 48.0 million (2014: USD 55.2 million) if the discount rate was
to increase or an increase in the headroom by USD 54.2 million (2014: USD 63.5 million) if the
discount rate was to decrease.
If the net profit as a percentage of revenue used was to differ by 0.5% from management’s estimates,
in isolation, there would be an increase of USD 66.4 million (2014: USD 62.1 million) in the
headroom if the net profit was to increase or there would be an reduction in the headroom of USD 66.4
million (2014: USD 62.1 million) in the headroom if the net profit was to decrease.
If the terminal value growth rate used was to differ by 0.5% from management’s estimates, in
isolation, there would be a reduction in the headroom of USD 35.5 million (2014: USD 43.4 million) if
the terminal value growth rate was lower or an increase in the headroom of USD 40.8 million (2014:
USD 49.8 million) if the terminal value growth rate was higher.

Employees' end of service benefits
The rate used for discounting the employees’ post-employment defined benefit obligation should be
based on market yields on high quality corporate bonds. In countries where there is no deep market for
such bonds, the market yields on government bonds should be used. In the UAE, there is no deep
market for corporate bonds and no market for government bonds and therefore, the discount rate has
been estimated using the US AA-rated corporate bond market as a proxy. On this basis, the discount
rate applied was 3.5% (2014: 3.5%). If the discount rate used was to differ by 0.5 points from
management’s estimates, the carrying amount of the employees’ end of the service benefits provision
at the balance sheet date would be an estimated USD 1.0 million (2014: USD 1.5 million) lower or
USD 1.4 million (2014: USD 1.6 million) higher. If the salary growth rate used was to differ by 0.5
points from management’s estimates, the carrying amount of the employees’ end of the service
benefits provision at the balance sheet date would be an estimated USD 1.4 million (2014: USD 1.5
million) higher or USD 1.0 million (2014: USD 1.6 million) lower.
5 Segment information
Operating segments are reported in a manner consistent with the internal reporting provided to the
chief operating decision-maker at the reporting date. The chief operating decision-maker has been
identified as the Executive Directors who make strategic decisions. The Executive Directors review the
Group’s internal reporting in order to assess performance and allocate resources. Management has
determined the operating segments based on these reports.
In prior periods, the business reported on the basis of the facility from where the services were
rendered. With effect from 1 January 2015, the business was reorganised into business units on the
basis of services rendered. Segment comparatives are restated to reflect the organisational changes that
have occurred since the prior reporting period to present a like-for-like view.
The Executive Directors manage the business on the basis of the business units from which the
services are rendered. Management considers the performance of the business from New Build Jack up
Rigs (“NBJR”), Modules, (“MOD”), Offshore Platforms (“OP”) and Oil and Gas Contracting Services
(“OGCS”).
NBJR derives its revenue from assembly and new build construction for the offshore oil and gas and
renewables sectors; MOD derives its revenue from fabricating packaged, pre-assembled and
modularised units and constructing accommodation and complex process modules for onshore
downstream projects; OP derives its revenue from construction of complex living quarters, wellhead
decks, topsides, jackets and other offshore fixed facilities; and OGCS derives its revenue from rig
refurbishment, land rig services, engineering and construction and operations and maintenance.
These business units are viewed by the management as three operating segments – United Arab
Emirates “UAE”, Qatar “QTR” and Kazakhstan “KZK” based on common pool of resources and
ability to execute the projects on an interchangeable basis.
UAE is reported as a single segment (Segment A). Services provided from QTR and KZK do not meet
the quantitative thresholds required by IFRS 8 and the results of these operating segments are included
in the “all other segments” column.
Year ended 31 December 2015
Segment A
USD'000
All other
segments
USD'000
Total
USD'000

Revenue from external customers 865,802 5,256 871,058
Gross operating profit 173,179 1,696 174,875
Year ended 31 December 2014
Segment A
USD'000
All other
segments
USD'000
Total
USD'000
Revenue from external customers 1,077,921 6,969 1,084,890
Gross operating profit 233,292 2,511 235,803
Sales between segments are carried out on agreed terms. The revenue from external parties reported to
the Executive Directors is measured in a manner consistent with that in the consolidated income
statement.
The Executive Directors assess the performance of the operating segments based on a measure of gross
profit. The staff, equipment and certain subcontract costs are measured based on standard cost. The
measurement basis excludes the effect of the common expenses for yard rent, repairs and maintenance
and other miscellaneous expenses. The reconciliation of the gross profit is provided as follows:
2015
USD'000
2014
USD'000
Gross operating profit for the reportable segments as reported to the
Executive Directors 173,179 233,292
Gross operating profit for other segments as reported to the Executive
Directors 1,696 2,511
Unallocated:
Employee and equipment costs (14,523) (11,841)
Repairs and maintenance (18,636) (21,776)
Yard rent and depreciation (12,667) (15,249)
Others (5,529) (4,857)
Gross profit 123,520 182,080
Selling and distribution expenses (Note 7) (1,771) (1,773)
General and administrative expenses (Note 8) (44,318) (72,700)
Other gains/(losses) – net (Note 11) 260 1,456
Finance costs (Note 10) (14,647) (20,516)
Finance income (Note 10) 2,679 2,166
Others 777 2,507
Profit for the year from continuing operations 66,500 93,220
Information about segment assets and liabilities is not reported to or used by the Executive Directors
and accordingly no measures of segment assets and liabilities are reported.

The breakdown of revenue from all business units is as follows:
2015
USD'000
2014
USD'000
New build jackup rigs 675,821 748,391
Oil and Gas contracting services 136,216 253,870
Modules 47,121 4,636
Offshore platforms 11,900 77,993
871,058 1,084,890
The Group’s principal place of business is in the UAE. The revenue recognised in the UAE with
respect to services performed to external customers is USD 865.8 million (2014: USD 1,077.9
million), and the revenue recognised from the operations in other countries is USD 5.3 million (2014:
USD 7.0 million).
Certain customers individually accounted for greater than 10% of the Group’s revenue and are shown
in the table below:
2015
USD'000
2014
USD'000
External customer A 275,296 275,026
External customer B 196,462 155,768
External customer C 147,251 144,952
619,009 575,746
The revenue from these customers is attributable to Segment A. The above customers in 2015 are not
necessarily the same customers in 2014.
6 Cost of sales
2015
USD'000
2014
USD'000
Materials and related costs 445,461 420,939
Subcontract costs 77,561 187,357
Staff costs (Note 9) 150,979 163,614
Subcontract labour 20,968 38,394
Equipment hire 5,136 19,252
Depreciation (Note 13) 16,818 23,979
Repairs and maintenance 18,636 21,776
Yard rent 6,754 6,707
Warranty costs and other liabilities – net (4,000) 6,989
Others 9,225 13,803
747,538 902,810

7 Selling and distribution expenses
2015
USD'000
2014
USD'000
Travel 628 1,055
Advertising and marketing 359 480
Entertainment 143 144
Others 641 94
1,771 1,773
8 General and administrative expenses
2015
USD'000
2014
USD'000
Staff costs (Note 9) 34,054 38,519
Legal, professional and consultancy fees 3,346 5,067
Depreciation (Note 13) 2,560 3,627
Amortisation of intangible assets (Note 14) 2,624 11,895
Utilities and communication 932 718
(Release)/provision for impairment of trade receivables - net (6,100) 6,871
Bank charges 184 286
Others 6,718 5,717
44,318 72,700
9 Staff costs
2015
USD'000
2014
USD'000
Wages and salaries 120,611 116,490
Employees’ end of service benefits (Note 22) 6,313 6,229
Share based payments – value of services provided 3,174 1,084
Other benefits 54,935 78,330
185,033 202,133
Staff costs are included in:
Cost of sales (Note 6) 150,979 163,614
General and administrative expenses (Note8) 34,054 38,519
185,033 202,133
Number of employees at 31 December 7,736 6,912

Staff costs capitalised during the year and not included above amount to USD 7.5 million (2014: USD
0.5 million).
10 Finance costs – net
2015
USD'000
2014
USD'000
Finance costs:
Bank guarantee charges 5,300 11,232
Interest on bank borrowings 3,588 6,006
Commitment fees 3,829 1,728
Others 1,930 1,550
14,647 20,516
Finance income
Finance income comprises interest income of USD 2.7 million (2014: USD 2.2 million) from bank
deposits.
11 Other gains/(losses) – net
2015
USD'000
2014
USD'000
Exchange (loss)/gain – net (16) 1,164
Profit on disposal of assets 315 162
Net loss on derivatives (780) (156)
Others 741 286
260 1,456
12 Earnings per share
(a) Basic
Basic earnings per share is calculated by dividing the profit attributable to the equity holders of the
Company by the weighted average number of ordinary shares in issue during the year excluding
ordinary shares purchased by the Company and held as treasury shares (Note 20).
(b) Diluted
Diluted earnings per share is calculated by adjusting the weighted average number of ordinary shares
outstanding to assume conversion of all dilutive potential ordinary shares. For the free share awards,
options under executive share option plan and performance share plan, a calculation is performed to
determine the number of shares that could have been acquired at fair value (determined as the average
annual market share price of the Company’s shares) based on the monetary value of the subscription
rights attached to outstanding share awards/options. The number of shares calculated as above is
compared with the number of shares that would have been issued assuming the exercise of the share
awards/options.
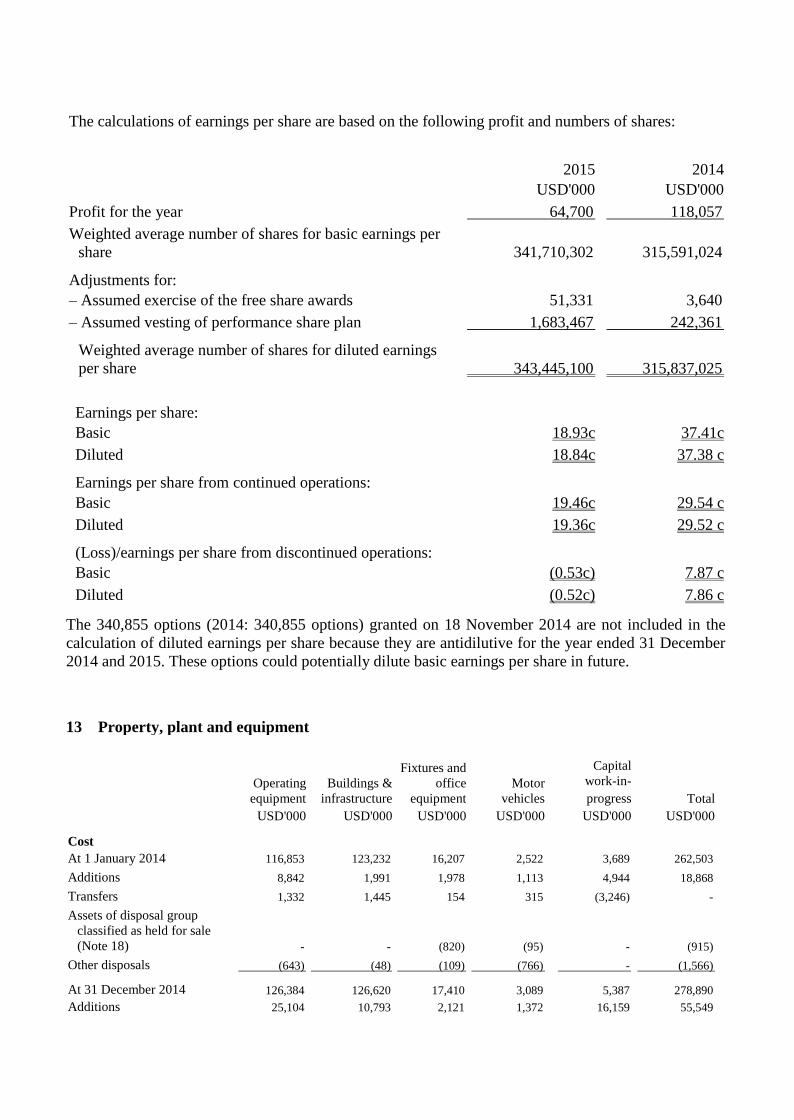
The calculations of earnings per share are based on the following profit and numbers of shares:
2015
USD'000
2014
USD'000
Profit for the year 64,700 118,057
Weighted average number of shares for basic earnings per
share 341,710,302 315,591,024
Adjustments for:
– Assumed exercise of the free share awards 51,331 3,640
– Assumed vesting of performance share plan 1,683,467 242,361
Weighted average number of shares for diluted earnings
per share 343,445,100 315,837,025
Earnings per share:
Basic 18.93c 37.41c
Diluted 18.84c 37.38 c
Earnings per share from continued operations:
Basic 19.46c 29.54 c
Diluted 19.36c 29.52 c
(Loss)/earnings per share from discontinued operations:
Basic (0.53c) 7.87 c
Diluted (0.52c) 7.86 c
The 340,855 options (2014: 340,855 options) granted on 18 November 2014 are not included in the
calculation of diluted earnings per share because they are antidilutive for the year ended 31 December
2014 and 2015. These options could potentially dilute basic earnings per share in future.
13 Property, plant and equipment
Operating
equipment
USD'000
Buildings &
infrastructure
USD'000
Fixtures and
office
equipment
USD'000
Motor
vehicles
USD'000
Capital
work-in-
progress
USD'000
Total
USD'000
Cost
At 1 January 2014 116,853 123,232 16,207 2,522 3,689 262,503
Additions 8,842 1,991 1,978 1,113 4,944 18,868
Transfers 1,332 1,445 154 315 (3,246) -
Assets of disposal group
classified as held for sale
(Note 18) - - (820) (95) - (915)
Other disposals (643) (48) (109) (766) - (1,566)
At 31 December 2014 126,384 126,620 17,410 3,089 5,387 278,890
Additions 25,104 10,793 2,121 1,372 16,159 55,549
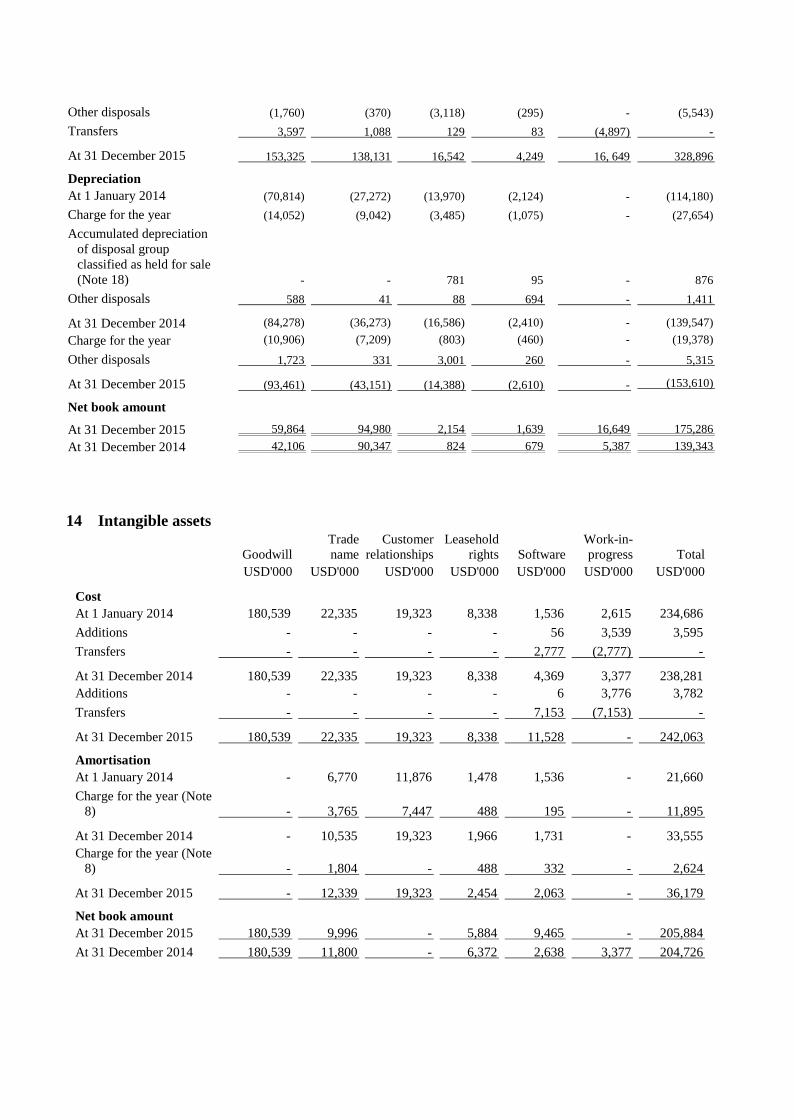
Other disposals (1,760) (370) (3,118) (295) - (5,543)
Transfers 3,597 1,088 129 83 (4,897) -
At 31 December 2015 153,325 138,131 16,542 4,249 16, 649 328,896
Depreciation
At 1 January 2014 (70,814) (27,272) (13,970) (2,124) - (114,180)
Charge for the year (14,052) (9,042) (3,485) (1,075) - (27,654)
Accumulated depreciation
of disposal group
classified as held for sale
(Note 18) - - 781 95 - 876
Other disposals 588 41 88 694 - 1,411
At 31 December 2014 (84,278) (36,273) (16,586) (2,410) - (139,547)
Charge for the year (10,906) (7,209) (803) (460) - (19,378)
Other disposals 1,723 331 3,001 260 - 5,315
At 31 December 2015 (93,461) (43,151) (14,388) (2,610) - (153,610)
Net book amount
At 31 December 2015
59,864 94,980 2,154 1,639 16,649 175,286
At 31 December 2014 42,106 90,347 824 679 5,387 139,343
14 Intangible assets
Goodwill
USD'000
Trade
name
USD'000
Customer
relationships
USD'000
Leasehold
rights
USD'000
Software
USD'000
Work-in-
progress
USD'000
Total
USD'000
Cost
At 1 January 2014 180,539 22,335 19,323 8,338 1,536 2,615 234,686
Additions - - - - 56 3,539 3,595
Transfers - - - - 2,777 (2,777) -
At 31 December 2014 180,539 22,335 19,323 8,338 4,369 3,377 238,281
Additions - - - - 6 3,776 3,782
Transfers - - - - 7,153 (7,153) -
At 31 December 2015 180,539 22,335 19,323 8,338 11,528 - 242,063
Amortisation
At 1 January 2014 - 6,770 11,876 1,478 1,536 - 21,660
Charge for the year (Note
8) - 3,765 7,447 488 195 - 11,895
At 31 December 2014 - 10,535 19,323 1,966 1,731 - 33,555
Charge for the year (Note
8) - 1,804 - 488 332 - 2,624
At 31 December 2015 - 12,339 19,323 2,454 2,063 - 36,179
Net book amount
At 31 December 2015 180,539 9,996 - 5,884 9,465 - 205,884
At 31 December 2014 180,539 11,800 - 6,372 2,638 3,377 204,726

15 Inventories
2015
USD'000
2014
USD'000
Raw materials and consumables 21,917 16,301
Work in progress 9,604 -
Less: Provision for slow moving and obsolete inventories (2,455) (1,741)
29,066 14,560
16 Trade and other receivables
2015
USD'000
2014
USD'000
Trade receivables 94,146 48,622
Other receivables and prepayments 30,206 21,620
Advance to suppliers 19,435 6,533
Receivables from a related party (Note 19) 13 68
143,800 76,843
Less: Provision for impairment of trade receivables (5,220) (11,622)
138,580 65,221
Amounts due from customers on contracts 133,487 185,476
Contract work in progress 156,259 152,922
428,326 403,619
Non-current portion:
Advance to suppliers - 4,932
Prepayments 12,712 6,944
Current portion 415,614 391,743
During 2015, the Group paid an amount of USD 8.5 million to Sharjah Electricity and Water Authority
for construction, installation and maintenance of an electric mainline at its Hamriyah facility. The
Group has decided to amortise this amount over the remaining period of the leasehold rights for the
facility.
Amounts due from customers on contracts comprise:
2015
USD'000
2014
USD'000
Costs incurred to date 1,098,234 1,042,589
Attributable profits 204,586 190,090
1,302,820 1,232,679
Less: Progress billings (1,169,333) (1,047,203)
133,487 185,476
As required under our current contracts with Ensco, we note that all related materials and equipment
and the vessel itself being constructed under these contracts are the exclusive property of Ensco.

17 Cash and bank balances
2015
USD'000
2014
USD'000
Cash at bank and on hand 92,301 82,945
Term deposits and margin deposits – current 188,367 276,163
Cash and bank balances 280,668 359,108
Term deposits and margin deposits – non-current 8,950 12,517
Less: Margin/short-term deposits under lien (11,787) (12,312)
Less: Deposit with original maturity of more than three months (53,667) (46,961)
Cash and cash equivalents (for the purpose of cash flow statement) 224,164 312,352
18 Assets held for sale and discontinued operations
Discontinued operations
Profit/(loss) from discontinued operations comprises:
Inspec
USD'000
2015
Litwin
USD'000
Total
USD'000
Inspec
USD'000
2014
Litwin
USD'000
Total
USD'000
Revenue - 1,640 1,640 3,008 16,385 19,393
Cost of sales - (1,763) (1,763) (2,080) (21,082) (23,162)
General and
administrative
expenses - (1,849) (1,849) (193) (2,550) (2,743)
Other gains/losses –
net - 165 165 2 280 282
Finance costs – net - (59) (59) - (203) (203)
Profit/(loss) from
discontinued
operations - (1,866) (1,866) 737 (7,170) (6,433)
Re-measurement of
post-employment
benefit obligations - - - - 13 13
Total comprehensive
income arising from
discontinued
operations - (1,866) (1,866) 737 (7,157) (6,420)
The main elements of the cash flows are as follows:
Inspec
USD'000
2015
Litwin
USD'000
Total
USD'000
Inspec
USD'000
2014
Litwin
USD'000
Total
USD'000
Operating cash flows - 702 702 2,954 5,315 8,269
Investing cash flows - (123) (123) (74) 30 (44)
Financing cash flows - (59) (59) - (203) (203)
Total cash flows - 520 520 2,880 5,142 8,022
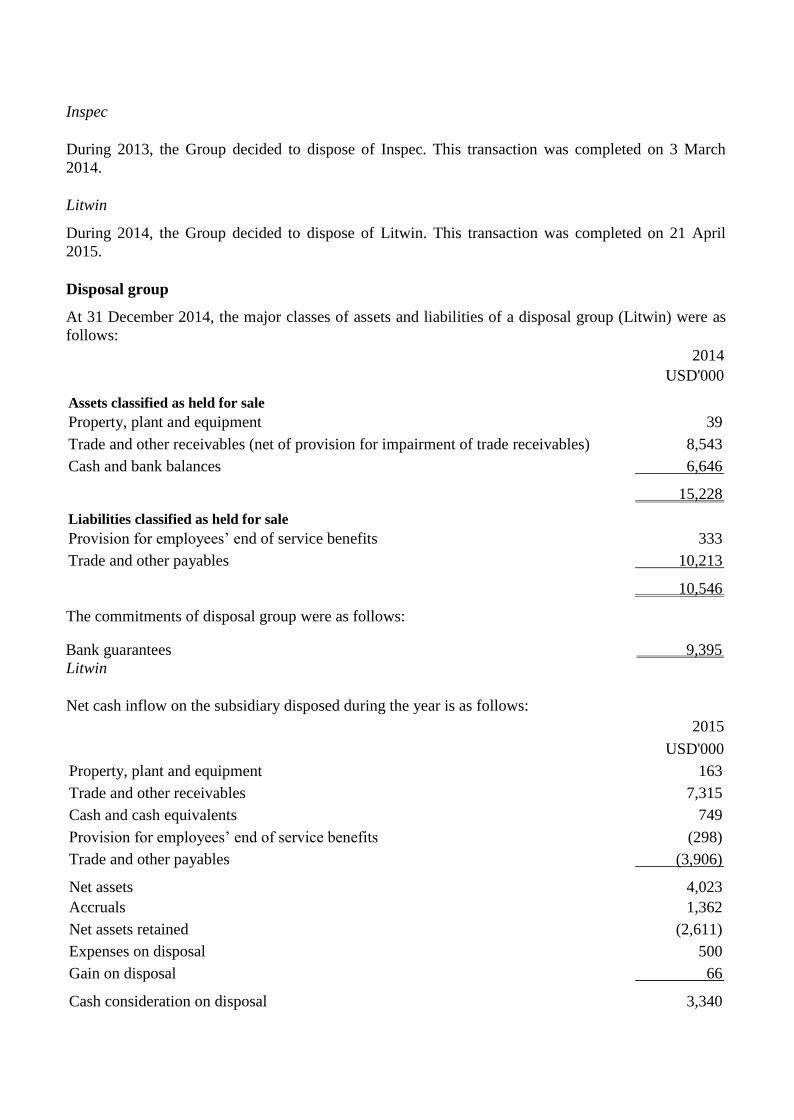
Inspec
During 2013, the Group decided to dispose of Inspec. This transaction was completed on 3 March
2014.
Litwin
During 2014, the Group decided to dispose of Litwin. This transaction was completed on 21 April
2015.
Disposal group
At 31 December 2014, the major classes of assets and liabilities of a disposal group (Litwin) were as
follows:
2014
USD'000
Assets classified as held for sale
Property, plant and equipment 39
Trade and other receivables (net of provision for impairment of trade receivables) 8,543
Cash and bank balances 6,646
15,228
Liabilities classified as held for sale
Provision for employees’ end of service benefits 333
Trade and other payables 10,213
10,546
The commitments of disposal group were as follows:
Bank guarantees 9,395
Litwin
Net cash inflow on the subsidiary disposed during the year is as follows:
2015
USD'000
Property, plant and equipment 163
Trade and other receivables 7,315
Cash and cash equivalents 749
Provision for employees’ end of service benefits (298)
Trade and other payables (3,906)
Net assets 4,023
Accruals 1,362
Net assets retained (2,611)
Expenses on disposal 500
Gain on disposal 66
Cash consideration on disposal 3,340
Less: Expenses on disposal (500)
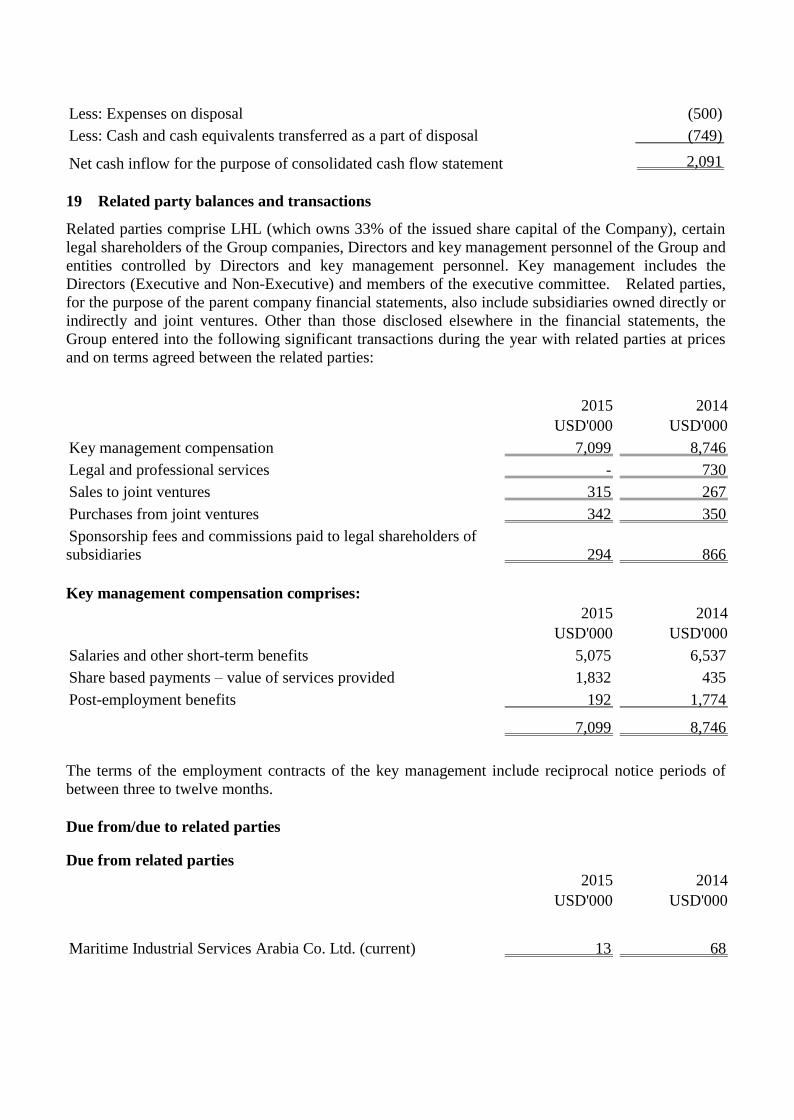
Less: Cash and cash equivalents transferred as a part of disposal (749)
Net cash inflow for the purpose of consolidated cash flow statement 2,091
19 Related party balances and transactions
Related parties comprise LHL (which owns 33% of the issued share capital of the Company), certain
legal shareholders of the Group companies, Directors and key management personnel of the Group and
entities controlled by Directors and key management personnel. Key management includes the
Directors (Executive and Non-Executive) and members of the executive committee. Related parties,
for the purpose of the parent company financial statements, also include subsidiaries owned directly or
indirectly and joint ventures. Other than those disclosed elsewhere in the financial statements, the
Group entered into the following significant transactions during the year with related parties at prices
and on terms agreed between the related parties:
2015
USD'000
2014
USD'000
Key management compensation 7,099 8,746
Legal and professional services - 730
Sales to joint ventures 315 267
Purchases from joint ventures 342 350
Sponsorship fees and commissions paid to legal shareholders of
subsidiaries 294 866
Key management compensation comprises:
2015
USD'000
2014
USD'000
Salaries and other short-term benefits 5,075 6,537
Share based payments – value of services provided 1,832 435
Post-employment benefits 192 1,774
7,099 8,746
The terms of the employment contracts of the key management include reciprocal notice periods of
between three to twelve months.
Due from/due to related parties
Due from related parties
2015
USD'000
2014
USD'000
Maritime Industrial Services Arabia Co. Ltd. (current) 13 68

Due to a related party
2015
USD'000
2014
USD'000
Maritime Industrial Services Arabia Co. Ltd. (current) 122 364
20 Share capital
Issued and fully paid ordinary shares
Equity
Number
Share
capital
USD'000
Share
premium
USD'000
At 1 January 2014 260,363,101 23,552 211,776
Add: New shares issued during the year 81,363,469 6,794 112,785
Less: Transaction costs relating to the rights issue - - (8,566)
At 31 December 2014 341,726,570 30,346 315,995
At 31 December 2015 341,726,570 30,346 315,995
The total authorised number of ordinary shares is 400 million shares (2014: 400 million shares) with a
par value of 5 pence per share (2014: 5 pence per share).
During 2014, the Company successfully carried out a fully underwritten rights issue. The rights issue
offered five new ordinary shares for every 16 ordinary shares held by each shareholder at an issue
price of 88 pence per new ordinary share. The rights issue was fully subscribed and paid up as at 30
June 2014. The Company issued 81,363,469 new ordinary shares through the rights issue and received
proceeds amounting to USD 119.6 million.
The paid-in capital from the rights issue is split between the par value of the shares issued (USD 6.8
million) and the share premium at the date of issue (USD 112.8 million) less any directly attributable
transaction costs (USD 8.6 million). These new ordinary shares rank pari passu in all respects with the
existing ordinary shares, including the right to all future dividends and other distributions declared,
made or paid.
During 2015, Lamprell plc employee benefit trust (“EBT”) acquired 51 shares (2014: 189,111 shares)
of the Company. The total amount paid to acquire the shares was USD Nil (2014: USD 0.5 million)
and has been deducted from the consolidated retained earnings. During 2015, no shares (2014: 187,580
shares amounting to USD 0.5 million) were issued to employees and 16,268 shares (31 December
2014: 16,217 shares) were held as treasury shares at 31 December 2015. The Company has the right to
reissue these shares at a later date. These shares will be issued on vesting of the free
shares/performance shares/share options granted to certain employees of the Group.

21 Other reserves
Legal
reserve
Merger
reserve
Translation
reserve Total
USD'000
USD'000
USD'000
USD'000
At 1 January 2014 98 (22,422) 191 (22,133)
Currency translation differences - - (372) (372)
Disposal of a subsidiary - 3,850 - 3,850
At 31 December 2014 98 (18,572) (181) (18,655)
Currency translation differences - - (489) (489)
At 31 December 2015 98 (18,572) (670) (19,144)
Legal reserve
The Legal reserve relates to subsidiaries (other than the subsidiaries incorporated in free zones) in the
UAE and the State of Qatar. In accordance with the laws of the respective countries, the Group has
established a statutory reserve by appropriating 10% of the profit for the year of such companies. Such
transfers are required to be made until the reserve is equal to, at least, 50% (UAE) and 33.3% (State of
Qatar) of the issued share capital of such companies. The legal reserve is not available for distribution.
Merger reserve
On 11 September 2006, the Group acquired 100% of the legal and beneficial ownership of Inspec from
LHL for a consideration of USD 4 million. This acquisition was accounted for using the uniting of
interest method.
On 25 September 2006, the Company entered into a share for share exchange agreement with LEL and
LHL under which it acquired 100% of the 49,003 shares of LEL from LHL in consideration for the
issue to LHL of 200,000,000 shares of the Company. This acquisition has been accounted for using the
uniting of interest method.
22 Provision for employees’ end of service benefits
In accordance with the provisions of IAS 19, management has carried out an exercise to assess the
present value of its obligations at 31 December 2015 and 2014, using the projected unit credit method,
in respect of employees’ end of service benefits payable under the Labour Laws of the countries in
which the Group operates. Under this method, an assessment has been made of an employee’s
expected service life with the Group and the expected basic salary at the date of leaving the service.
The obligation for end of service benefit is not funded.
The movement in the employees’ end of service benefit liability over the periods is as follows:
2015
USD'000
2014
USD'000
At 1 January 38,752 36,046
Current service cost 4,871 4,739
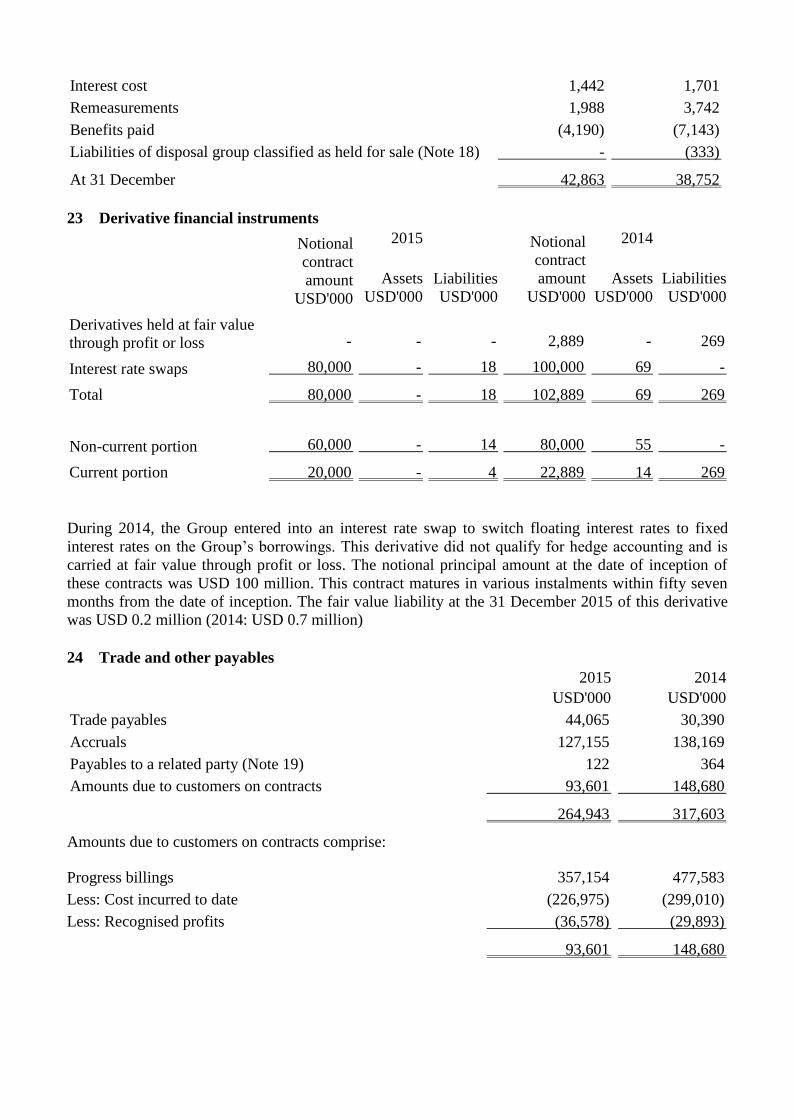
Interest cost 1,442 1,701
Remeasurements 1,988 3,742
Benefits paid (4,190) (7,143)
Liabilities of disposal group classified as held for sale (Note 18) - (333)
At 31 December 42,863 38,752
23 Derivative financial instruments
Notional
contract
amount
USD'000
2015
Assets
USD'000
Liabilities
USD'000
Notional
contract
amount
USD'000
2014
Assets
USD'000
Liabilities
USD'000
Derivatives held at fair value
through profit or loss - - - 2,889 - 269
Interest rate swaps 80,000 - 18 100,000 69 -
Total 80,000 - 18 102,889 69 269
Non-current portion 60,000 - 14 80,000 55 -
Current portion 20,000 - 4 22,889 14 269
During 2014, the Group entered into an interest rate swap to switch floating interest rates to fixed
interest rates on the Group’s borrowings. This derivative did not qualify for hedge accounting and is
carried at fair value through profit or loss. The notional principal amount at the date of inception of
these contracts was USD 100 million. This contract matures in various instalments within fifty seven
months from the date of inception. The fair value liability at the 31 December 2015 of this derivative
was USD 0.2 million (2014: USD 0.7 million)
24 Trade and other payables
2015
USD'000
2014
USD'000
Trade payables 44,065 30,390
Accruals 127,155 138,169
Payables to a related party (Note 19) 122 364
Amounts due to customers on contracts 93,601 148,680
264,943 317,603
Amounts due to customers on contracts comprise:
Progress billings 357,154 477,583
Less: Cost incurred to date (226,975) (299,010)
Less: Recognised profits (36,578) (29,893)
93,601 148,680
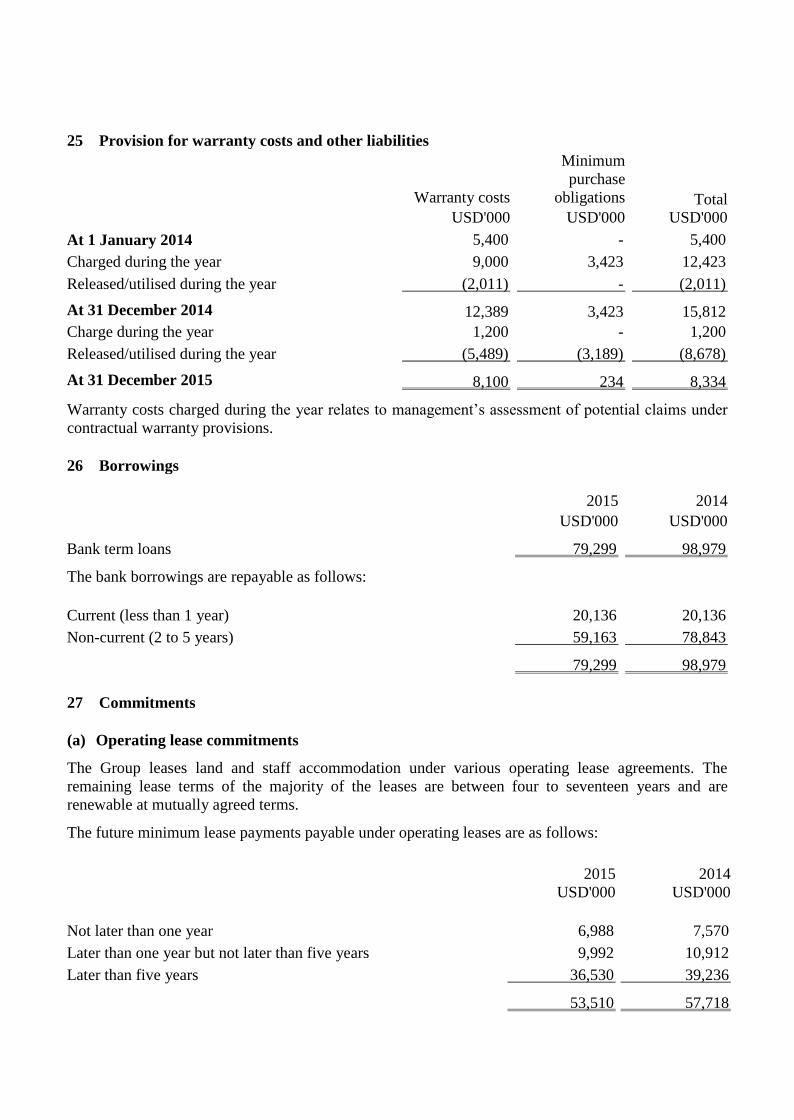
25 Provision for warranty costs and other liabilities
Warranty costs
USD'000
Minimum
purchase
obligations
USD'000
Total
USD'000
At 1 January 2014 5,400 - 5,400
Charged during the year 9,000 3,423 12,423
Released/utilised during the year (2,011) - (2,011)
At 31 December 2014 12,389 3,423 15,812
Charge during the year 1,200 - 1,200
Released/utilised during the year (5,489) (3,189) (8,678)
At 31 December 2015 8,100 234 8,334
Warranty costs charged during the year relates to management’s assessment of potential claims under
contractual warranty provisions.
26 Borrowings
2015
USD'000
2014
USD'000
Bank term loans 79,299 98,979
The bank borrowings are repayable as follows:
Current (less than 1 year) 20,136 20,136
Non-current (2 to 5 years) 59,163 78,843
79,299 98,979
27 Commitments
(a) Operating lease commitments
The Group leases land and staff accommodation under various operating lease agreements. The
remaining lease terms of the majority of the leases are between four to seventeen years and are
renewable at mutually agreed terms.
The future minimum lease payments payable under operating leases are as follows:
2015
USD'000
2014
USD'000
Not later than one year 6,988 7,570
Later than one year but not later than five years 9,992 10,912
Later than five years 36,530 39,236
53,510 57,718

(b) Other commitments
2015
USD'000
2014
USD'000
Capital commitments for construction of facilities 196 4,219
Capital commitments for purchase of operating equipment and
computer software 4,791 14,966
28 Bank guarantees
2015
USD'000
2014
USD'000
Performance/bid bonds 126,375 90,063
Advance payment, labour visa and payment guarantees 315,200 276,757
441,575 366,820
The various bank guarantees, as above, were issued by the Group’s bankers in the ordinary course of
business. Certain guarantees are secured by 100% cash margins, assignments of receivables from some
customers and in respect of guarantees provided by banks to the Group companies, they have been
secured by parent company guarantees. In the opinion of the management, the above bank guarantees
are unlikely to result in any liability to the Group.
29 Cash generated from operating activities
Year ended 31 December
Note
2015
USD'000
2014
USD'000
Operating activities
Profit before income tax including discontinued operations
65,241 118,541
Adjustments for:
Share based payments – value of services provided 8 3,174 1,084
Depreciation 19,386 27,935
Amortisation of intangible assets 17 2,624 11,895
Share of profit from investment in joint venture 19 (1,318) (2,991)
Profit on disposal of property, plant and equipment (315) (162)
(Release)/provisions for warranty costs and other liabilities 30 (7,478) 5,989
Provision for slow moving and obsolete inventories 20 714 24
(Release)/provision for impairment of trade receivables – net 21 (6,100) 5,278
Provision for employees’ end of service benefits 27 6,313 6,560
Gain on disposal of a subsidiary 23 (66) (31,270)
Loss on derivative financial instruments 12 780 156
Finance costs 14,706 20,719
Finance income 11 (2,679) (2,166)

Operating cash flows before payment of employees’
end of service benefits and changes in working capital 94,982 161,592
Payment of employees’ end of service benefits (4,225) (7,182)
Changes in working capital:
Inventories before movement in provision (15,220) (2,898)
Derivative financial instruments 28 (962) 205
Trade and other receivables before movement in provision
for impairment of trade receivables (14,768) (94,857)
Trade and other payables, excluding movement in dividend
payable (60,329) (96,293)
Cash used in operating activities (522) (39,433)
30 Events after the balance sheet date
On 26 January 2016, the Group has signed a Memorandum of Understanding (“MOU”) with Saudi
Aramco (the National Oil Company of the Kingdom of Saudi Arabia), the National Shipping Company
of Saudi Arabia (“Bahri”) and Hyundai Heavy Industries in connection with a potential partnership
collaboration on establishing a Maritime Complex in Saudi Arabia. The intended Maritime Complex
will provide engineering, manufacturing and repair services for offshore rigs, commercial vessels and
offshore service vessels. The MOU covers joint participation and due diligence on all activities and
work streams required to make a final investment decision by all participating parties. The outcome of
the agreement to engage in the potential joint venture partnership will be determined upon finalisation
of all activities and required due diligence.
31 Statutory Accounts
This financial information is not the statutory accounts of the Company and the Group, a copy of
which is required to be annexed to the Company's annual return to the Companies Registration Office
in Isle of Man. A copy of the statutory accounts in respect of the year ended 31 December 2015 will be
annexed to the Company's annual return for 2015. Consistent with prior years, the full financial
statements for the year ended 31 December 2015 and the audit report thereon will be circulated to
shareholders at least 20 working days before the AGM. A copy of the statutory accounts required to be
annexed to the Company's annual return to the Companies Registration Office in respect of the year
ended 31 December 2014 has been annexed to the Company’s annual return for 2014.
32 Directors’ responsibilities statement
We confirm that to the best of our knowledge
The financial statements, have been prepared in accordance with the applicable set of accounting
standards, give a true and fair view of the assets, liabilities and financial position and profit or loss of
the company and the undertakings included in the consolidation taken as a whole; and, This
announcement includes a fair review of the development and performance of the business and the
position of the company and the undertakings included in the consolidation taken as a whole, together
with a description of the principal risks and uncertainties that they face.
Further information is available on the Company’s website, www.lamprell.com.