Embed Size (px)
Citation preview
Biogeochemical and ecological coupling between Biogeochemical and ecological coupling between the epipelagic and the deep sea: regional to global implicationsg g p
Richard LampittNOCNOC
UKOCB Hawaii September 22nd 2010
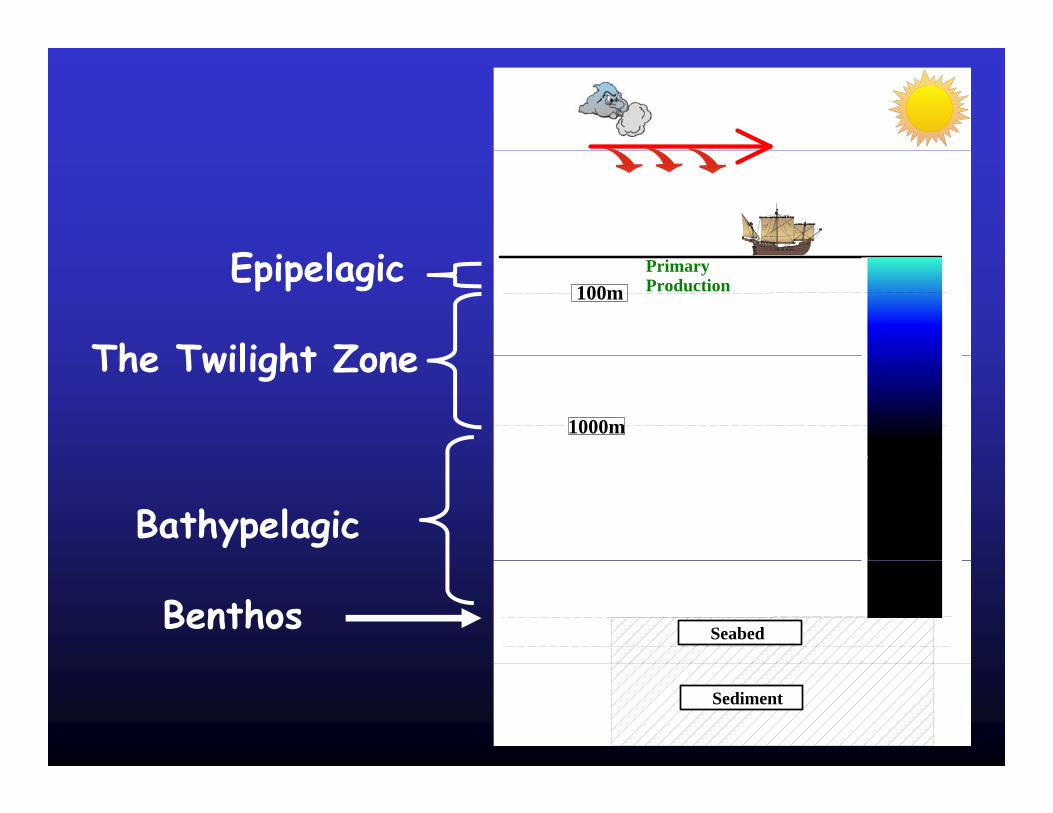
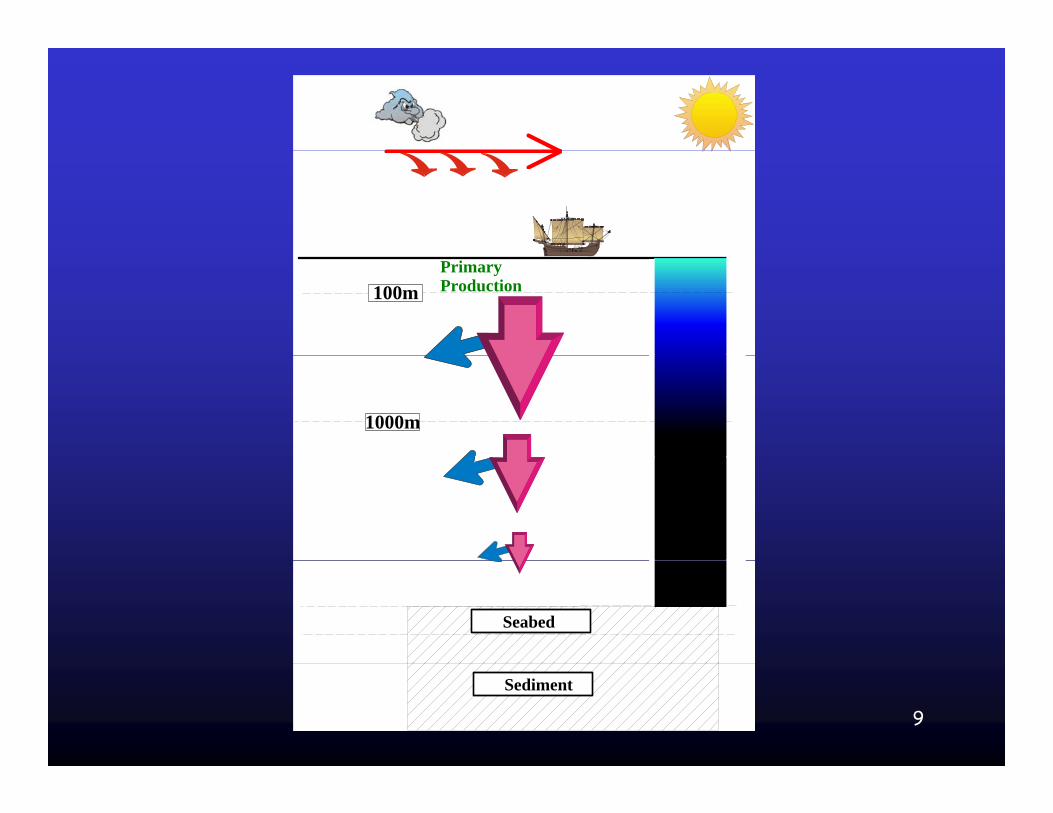
E l PrimaryProduction100m
The Twilight Zone
Epipelagic
1000m
The Twilight Zone
Bathypelagic
SeabedBenthos
2Sediment
In order to monitor and understand the marine system
d k d we need to make sustained multidisciplinary observations
l at appropriate temporal resolution.
3

HMS Porcupine
N E Atlantic and Mediterranean 1869 and 1870 4
N.E. Atlantic and Mediterranean 1869 and 1870.
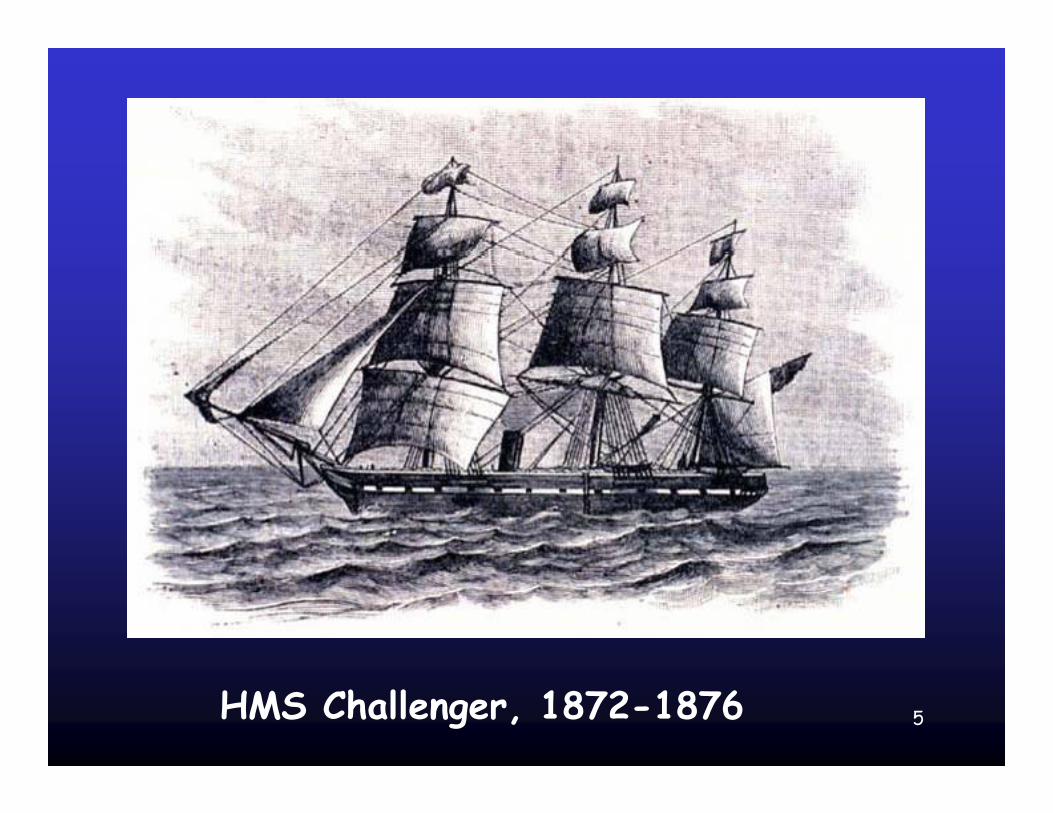
5HMS Challenger, 1872-1876

6William Beebe and Otis Barton in 1932

1. The twilight zone (Mesopelagic). g ( p g )
2. Bathypelagic
3. Benthos
All in the context of time series
7
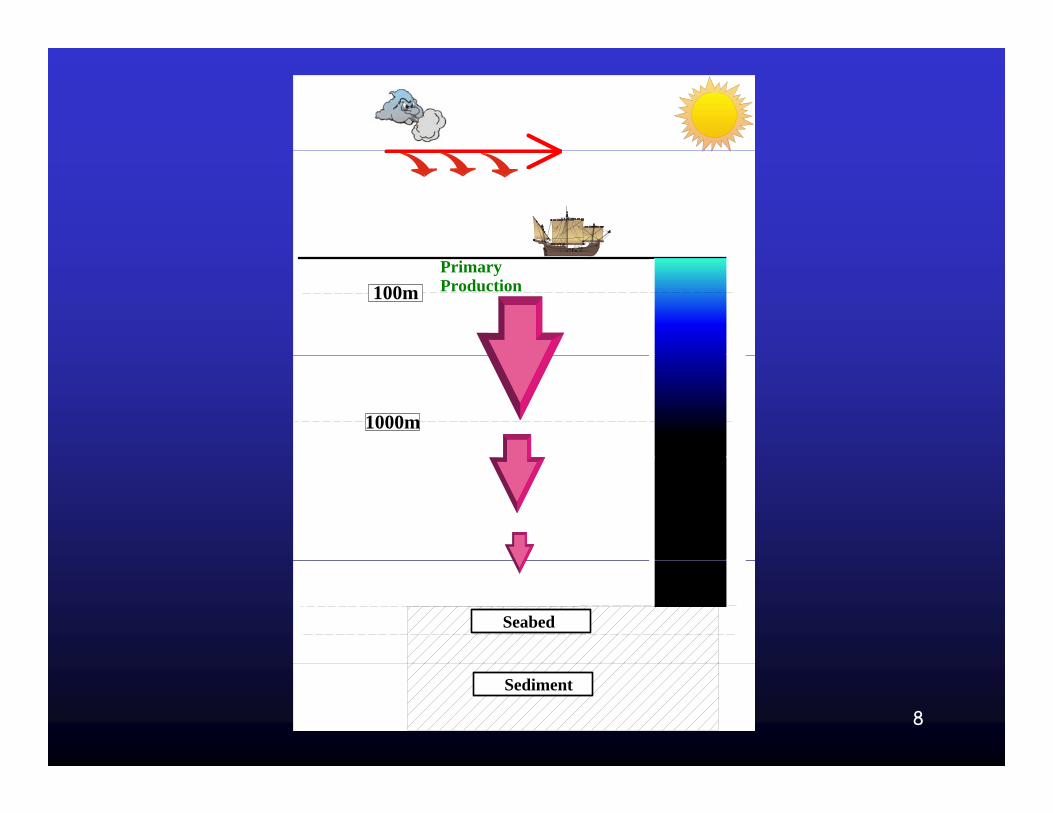
PrimaryProduction100m
1000m
Seabed
8
Sediment
PrimaryProduction100m
1000m
Seabed
9
Sediment
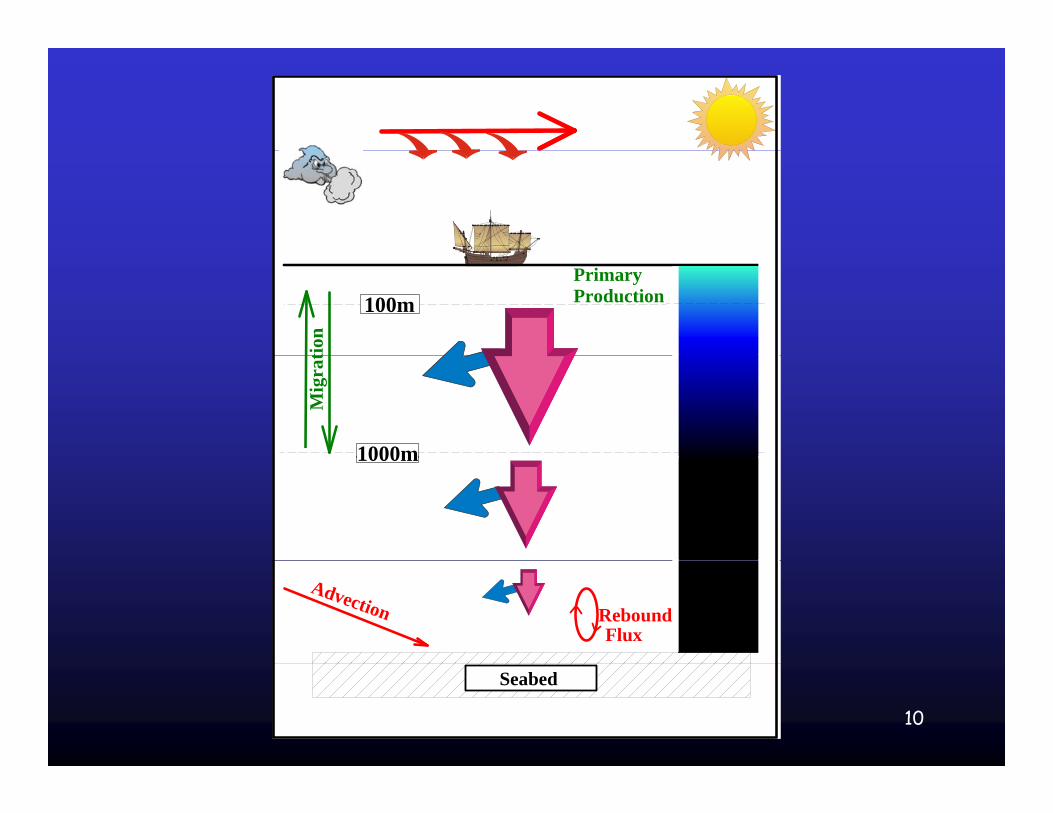
PrimaryProduction100m
tion
1000m
Mig
rat
1000m
FluxRebound
Advection
10
Seabed
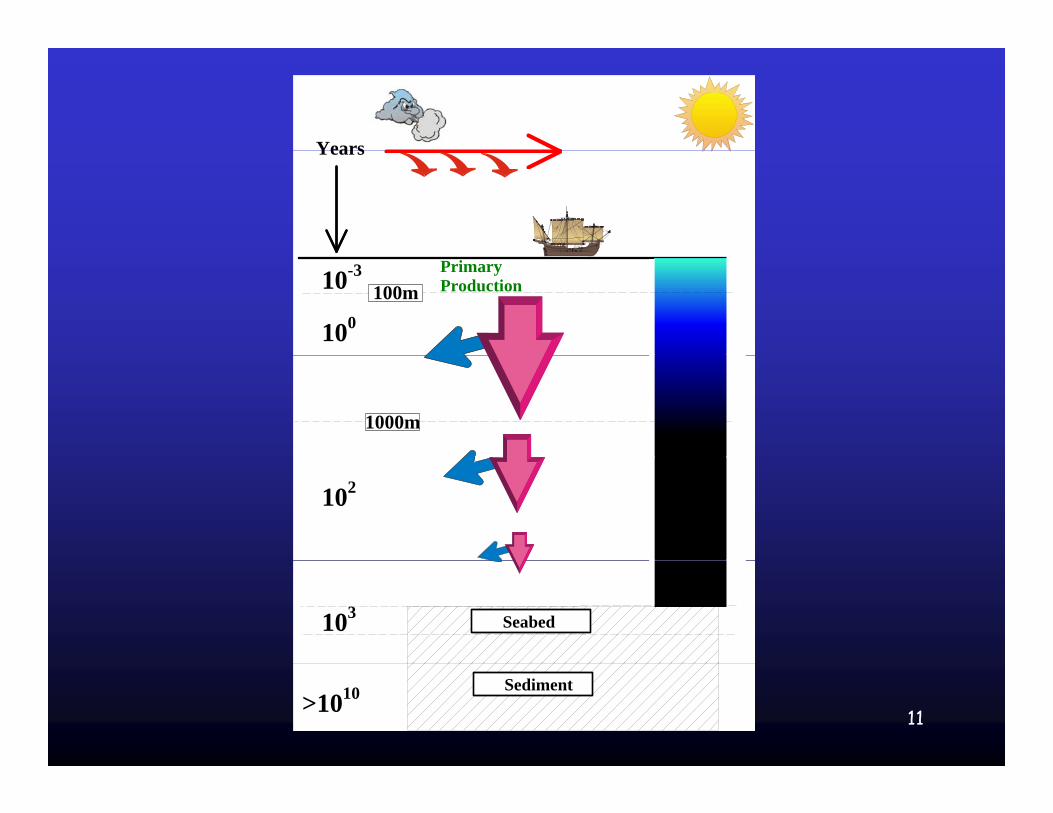
YearsYears
PrimaryProduction100m10-3
100
1000m
102
Seabed103
11
Sediment>1010
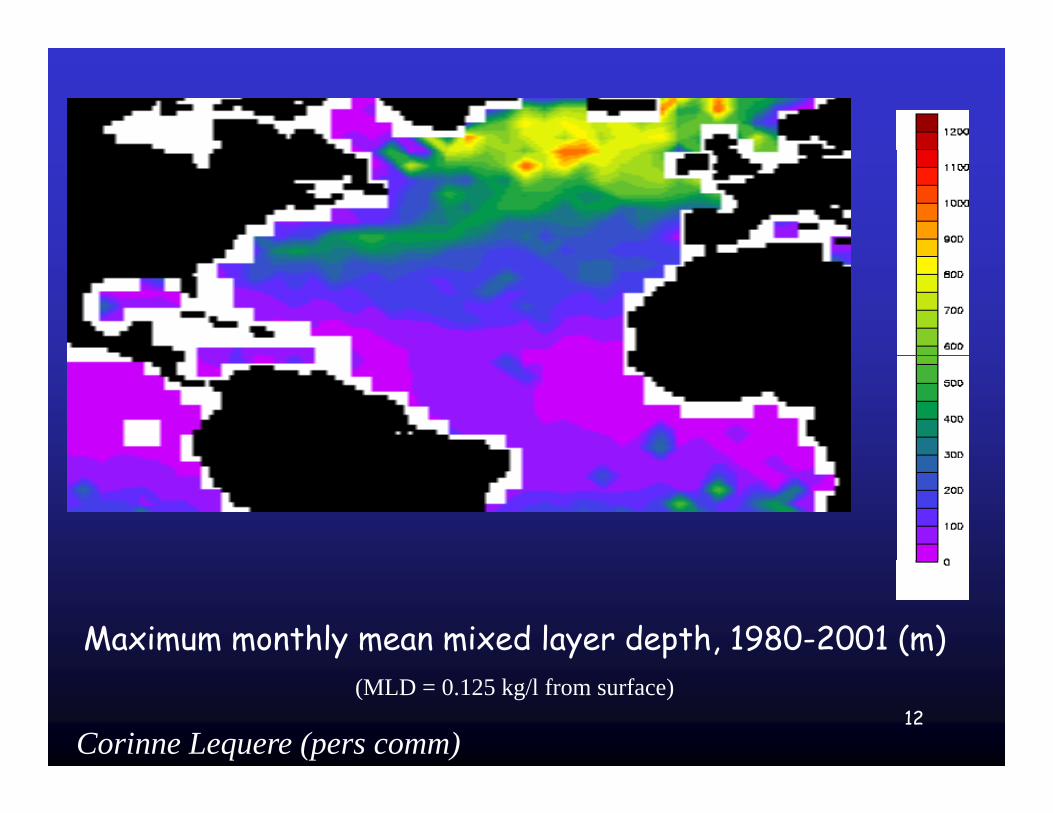
Maximum monthly mean mixed layer depth, 1980-2001 (m)
12(MLD = 0.125 kg/l from surface)
Corinne Lequere (pers comm)

Who cares about the Mesopelagic?
13
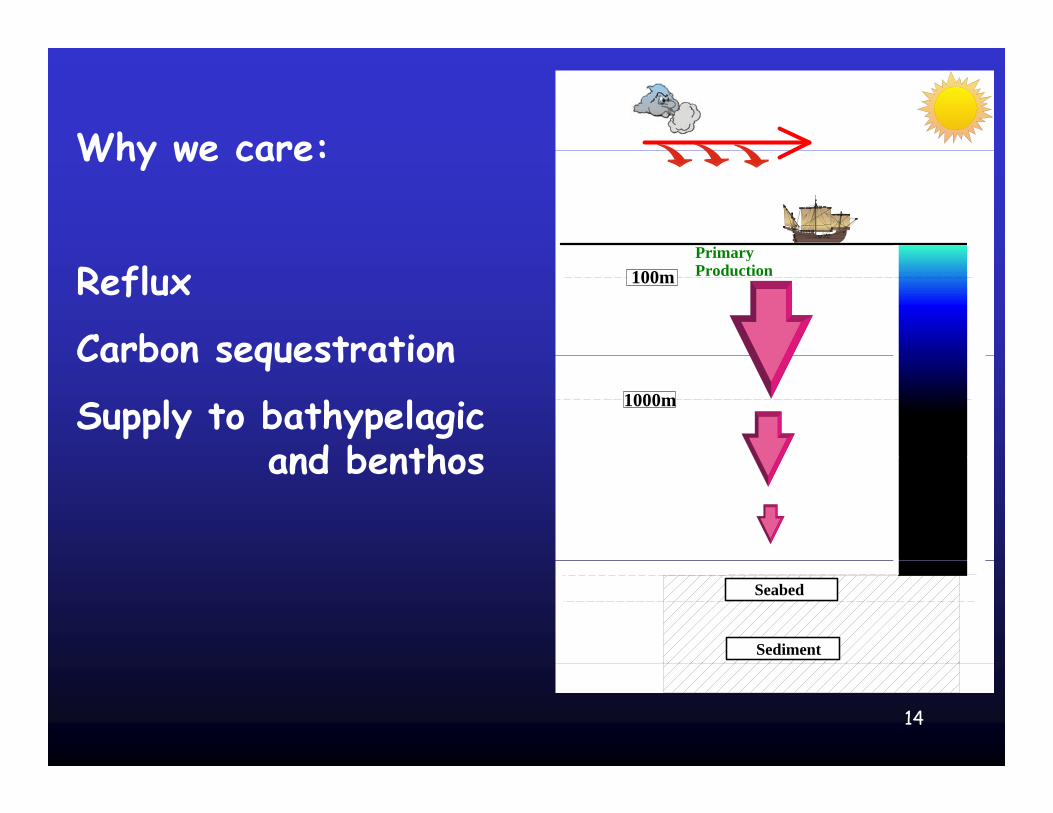
Why we care:Why we care:
Primary
Reflux
Carbon sequestration
PrimaryProduction100m
Carbon sequestration
Supply to bathypelagic and benthos
1000m
and benthos
Seabed
Sediment
14
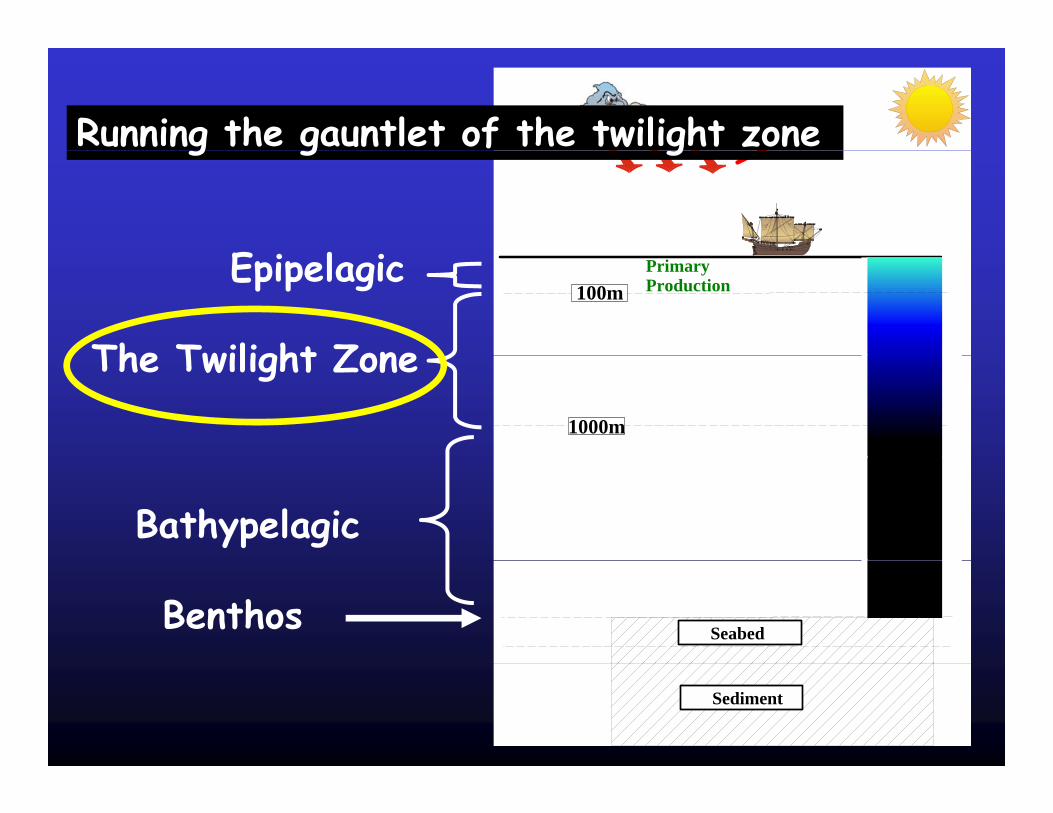
Running the gauntlet of the twilight zone
E l
g g g
PrimaryProduction100m
The Twilight Zone
Epipelagic
1000m
The Twilight Zone
Bathypelagic
SeabedBenthos
15Sediment
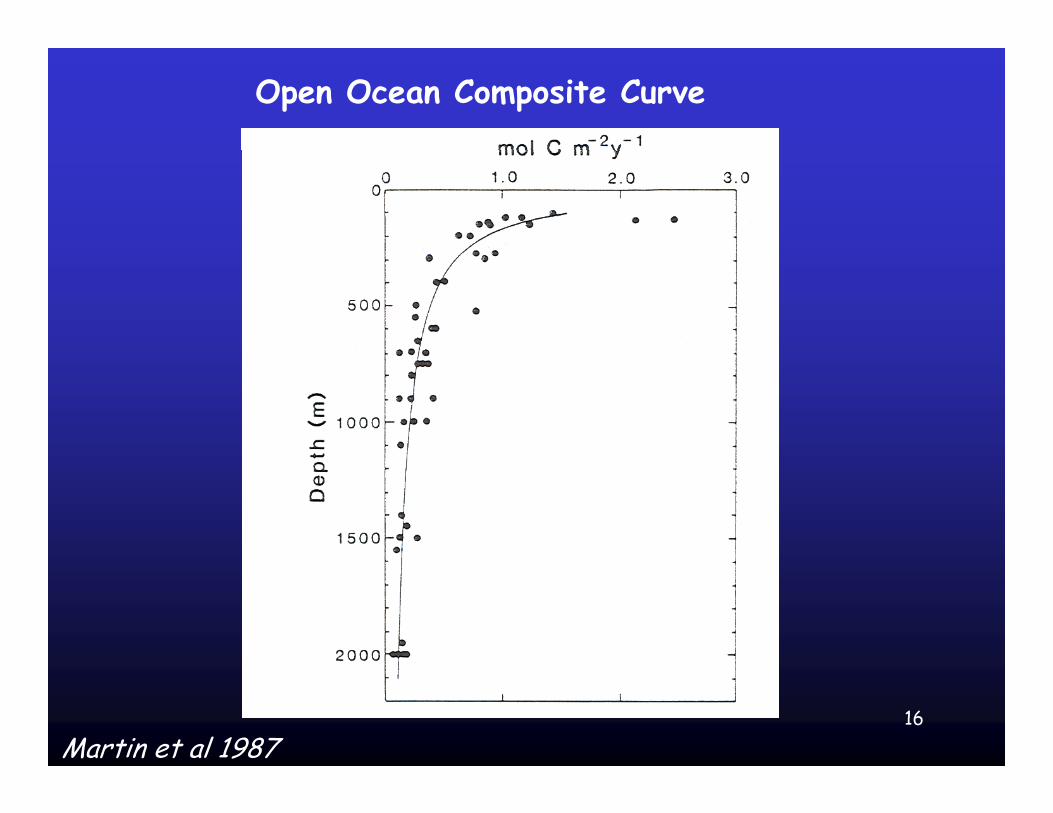
Open Ocean Composite Curve
16Martin et al 1987
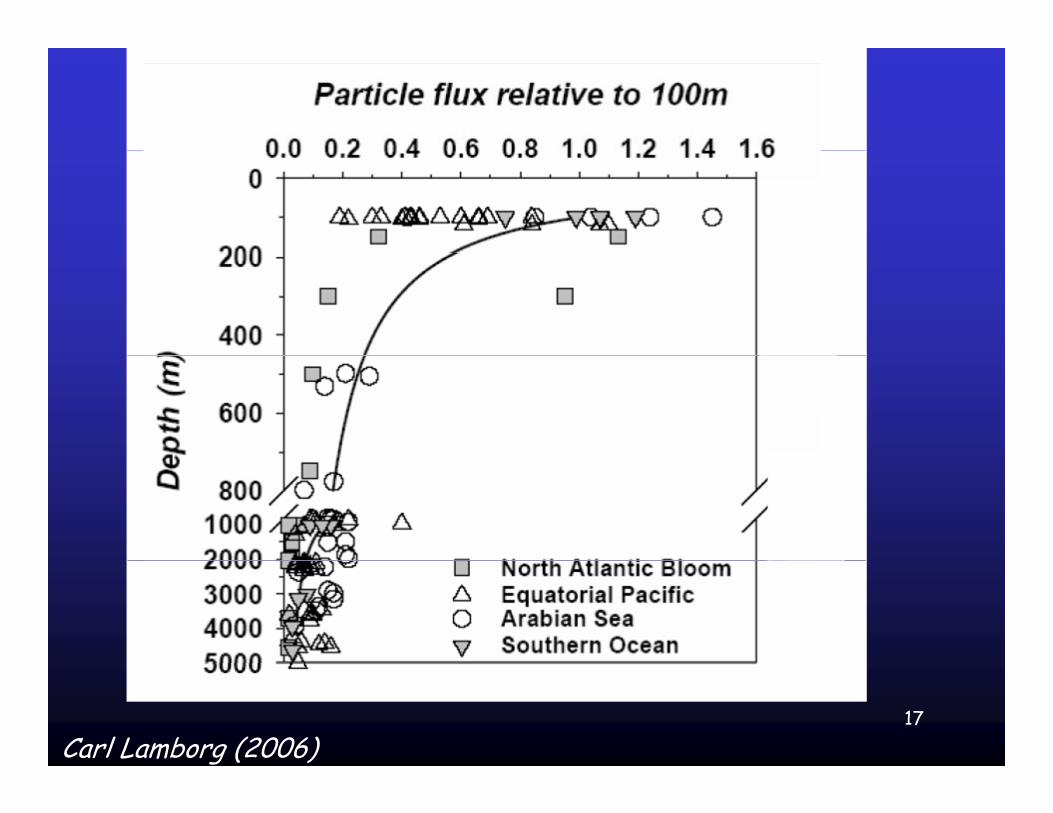
17Carl Lamborg (2006)
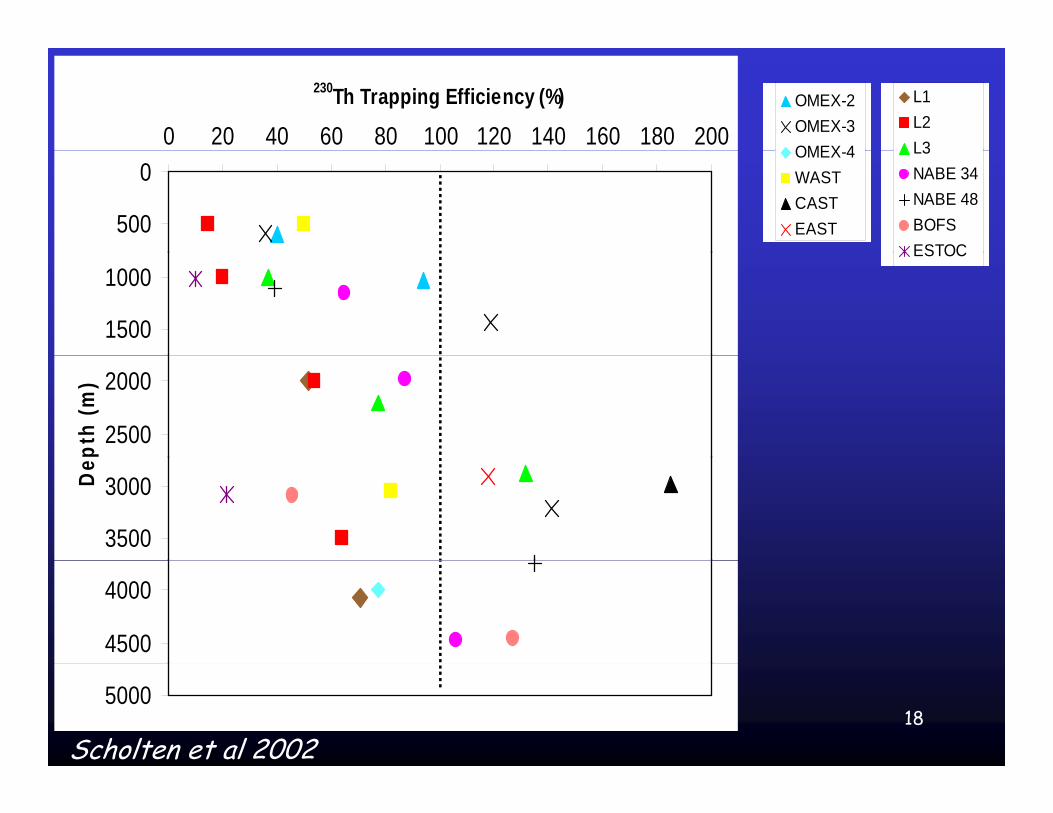
0 20 40 60 80 100 120 140 160 180 200
230Th Trapping Efficiency (%) L1L2L3
OMEX-2OMEX-3OMEX 4
0
500
L3NABE 34NABE 48BOFSESTOC
OMEX-4WASTCASTEAST
1000
1500
ESTOC
2000
2500pth
(m)
3000
3500
De
4000
4500
185000
Scholten et al 2002
From data and models we know that From data and models we know that there is considerable variability in the distribution of flux with depth.p
This will be affected by:This will be affected by:
1: Characteristics of the source material
2: The nature of midwater processing
19
Can we measure this downward flux?
20

21
A frequent method of measuring downward flux in upper ocean
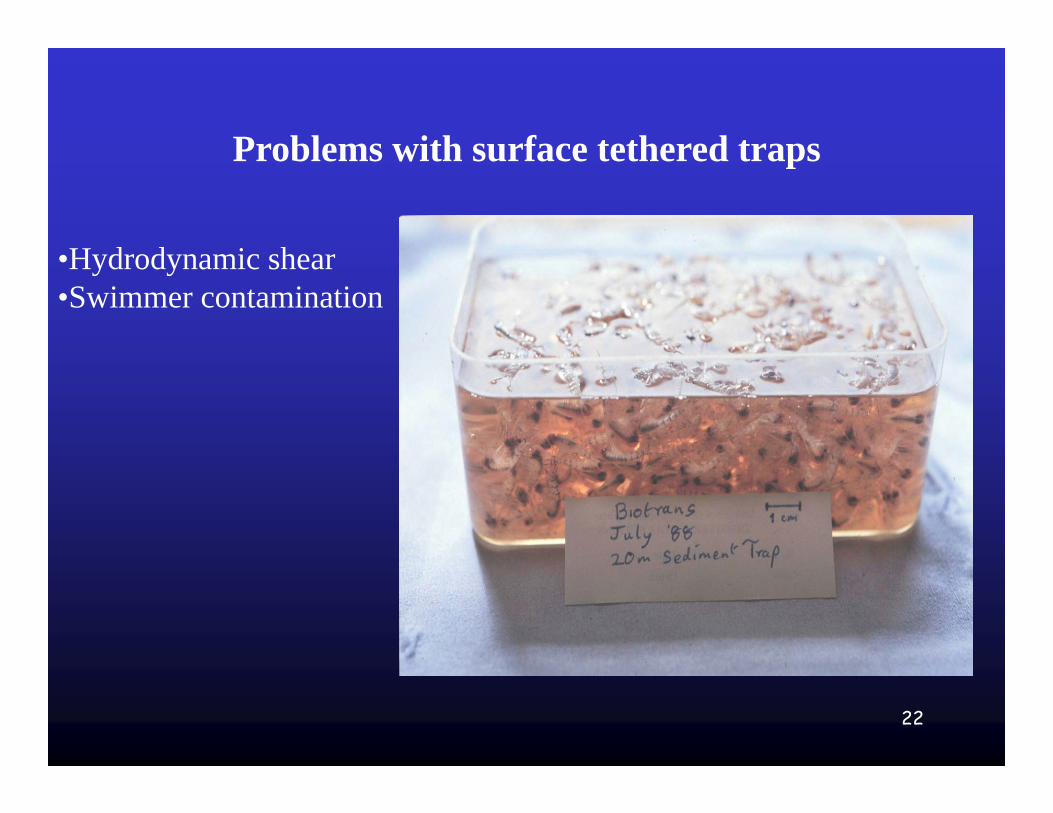
Problems with surface tethered trapsProblems with surface tethered traps
H d d i h•Hydrodynamic shear•Swimmer contamination
22
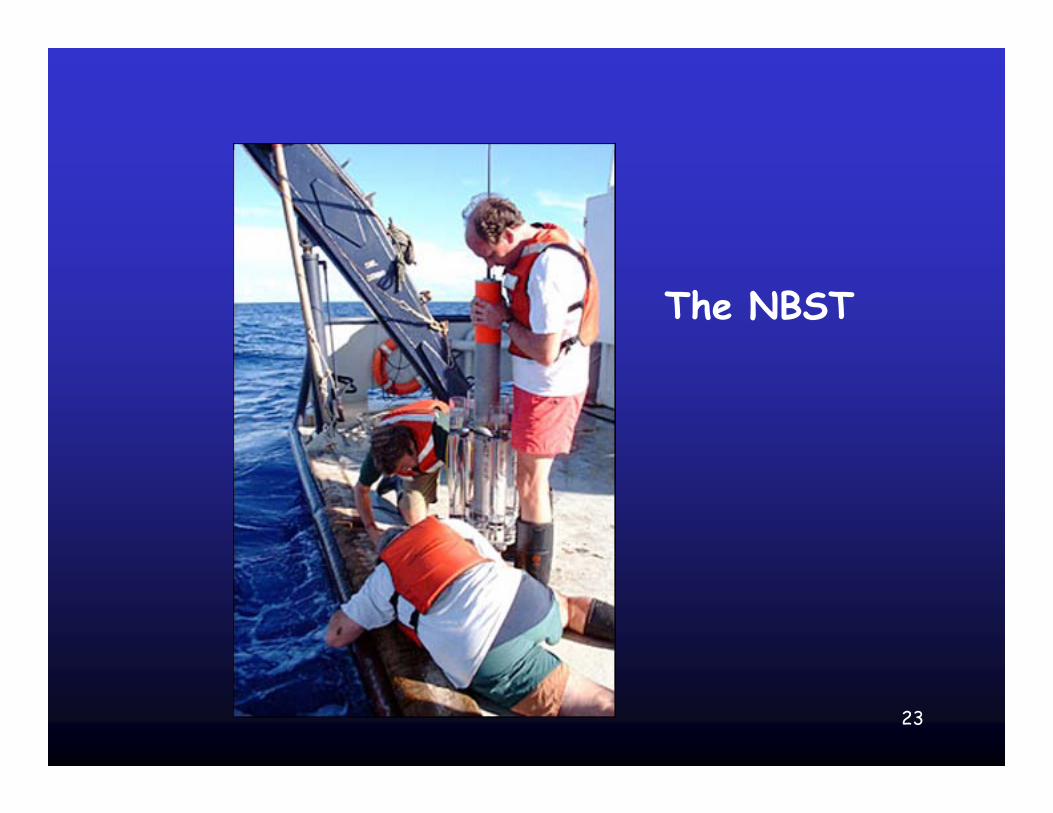
The NBST
23
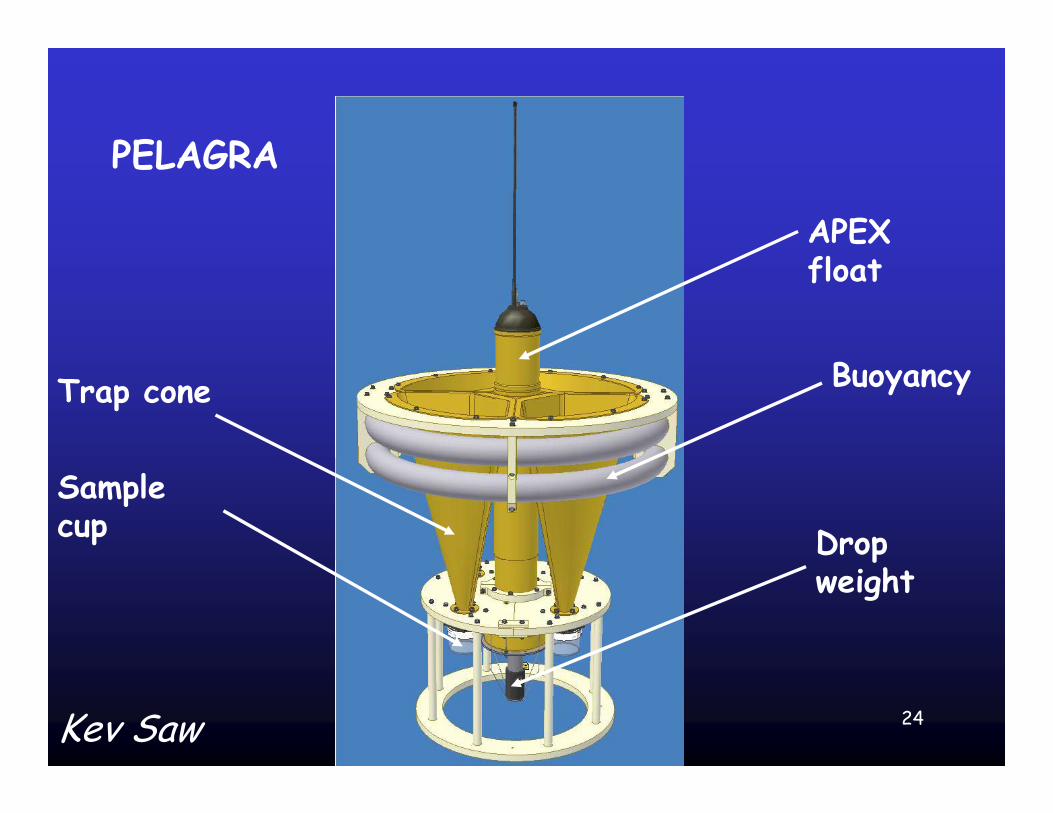
PELAGRA
APEX
PELAGRA
float
BuoyancyTrap cone
Drop
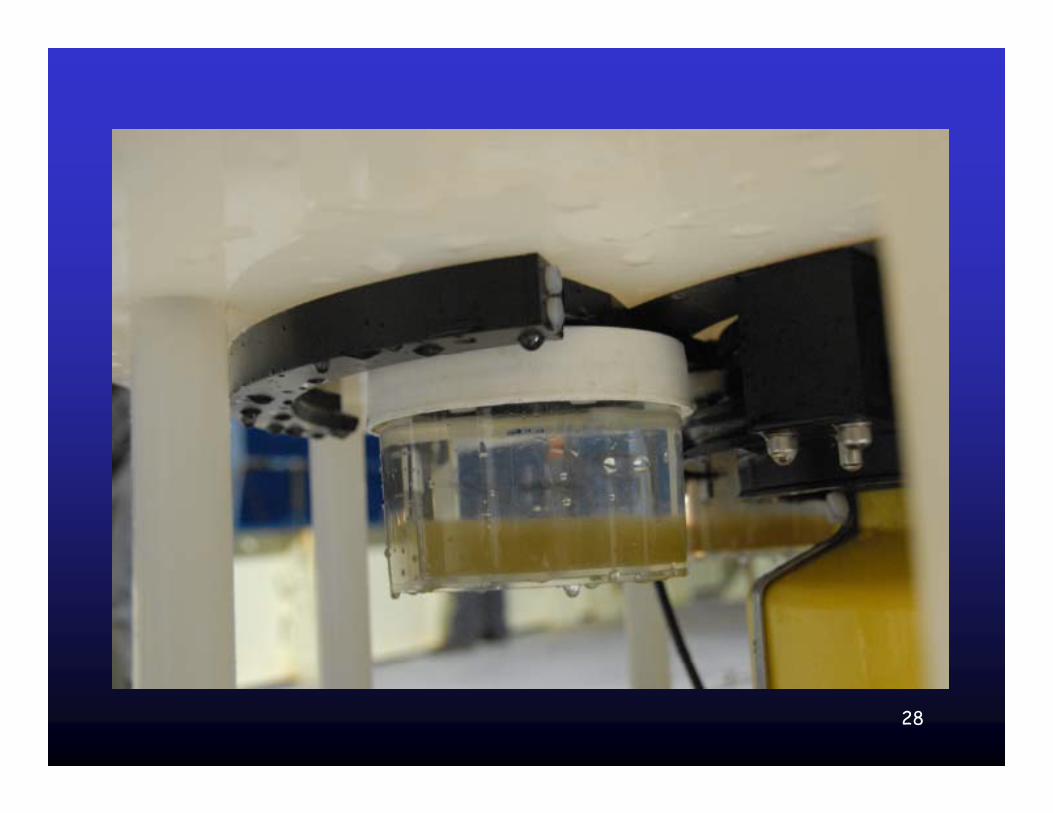
Sample cup p
weight
24Kev Saw
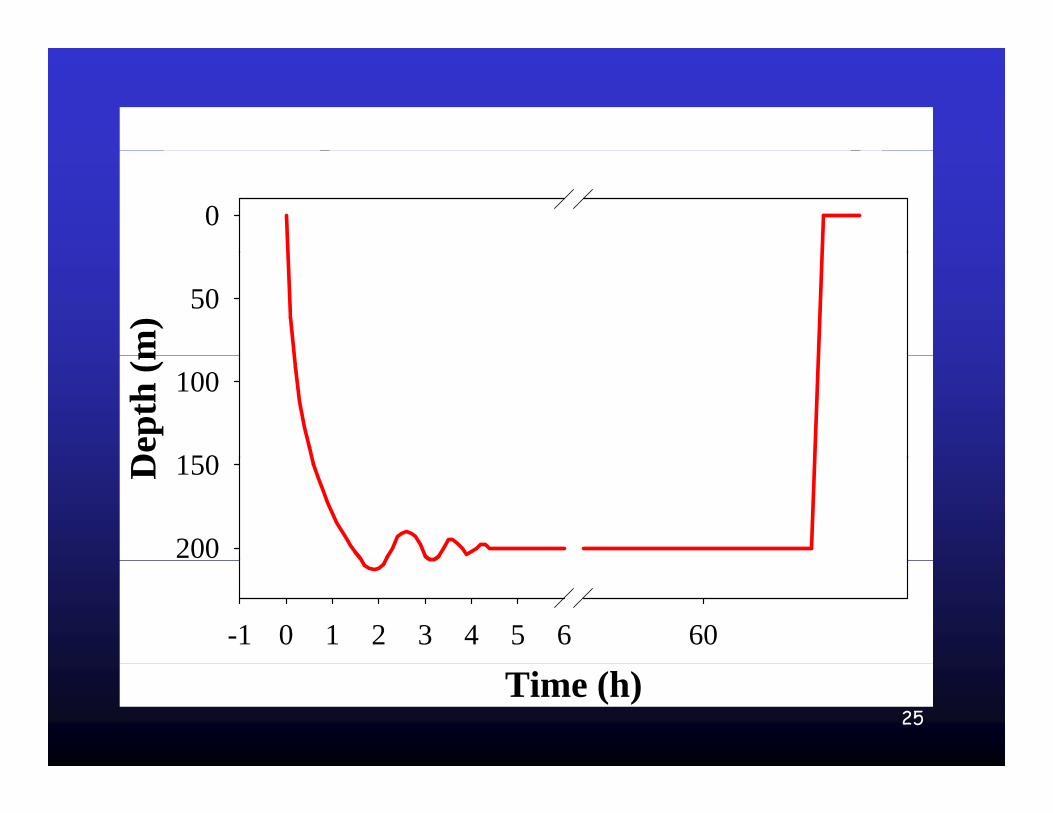
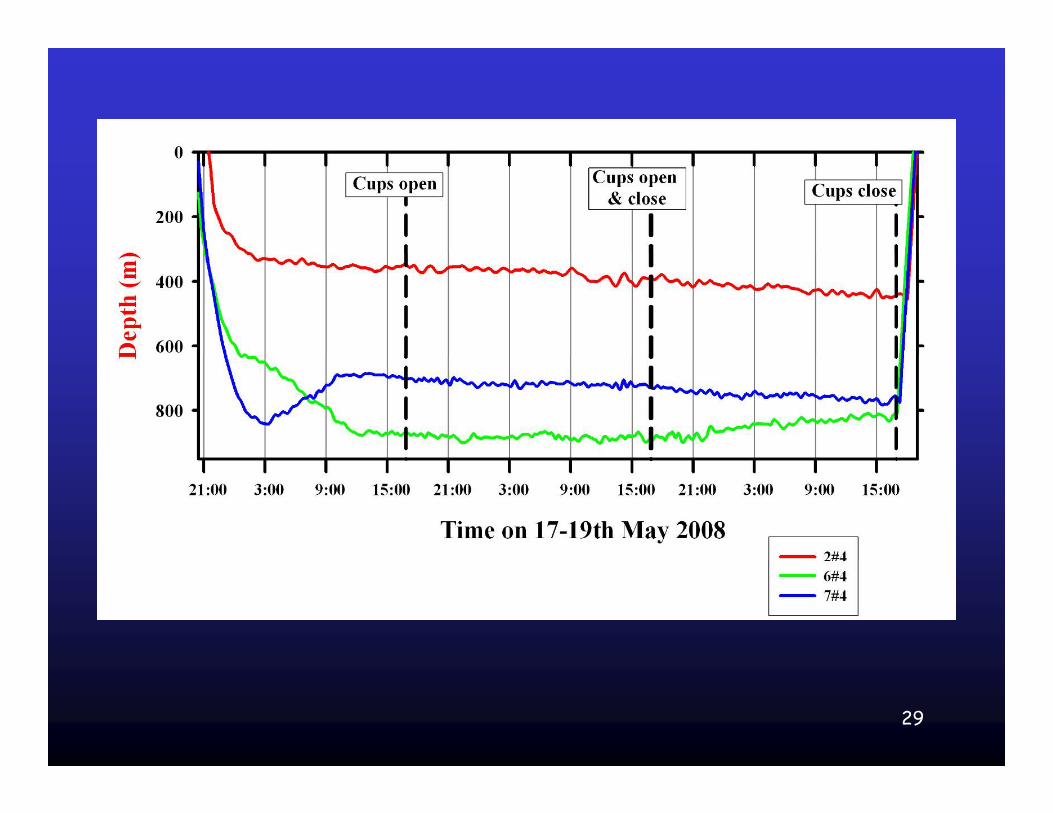
Depth-Time chart of PELAGRA trapp p
0
m) 50
Dep
th (m 100
150D 150
200
-1 0 1 2 3 4 5 6 60
25Time (h)
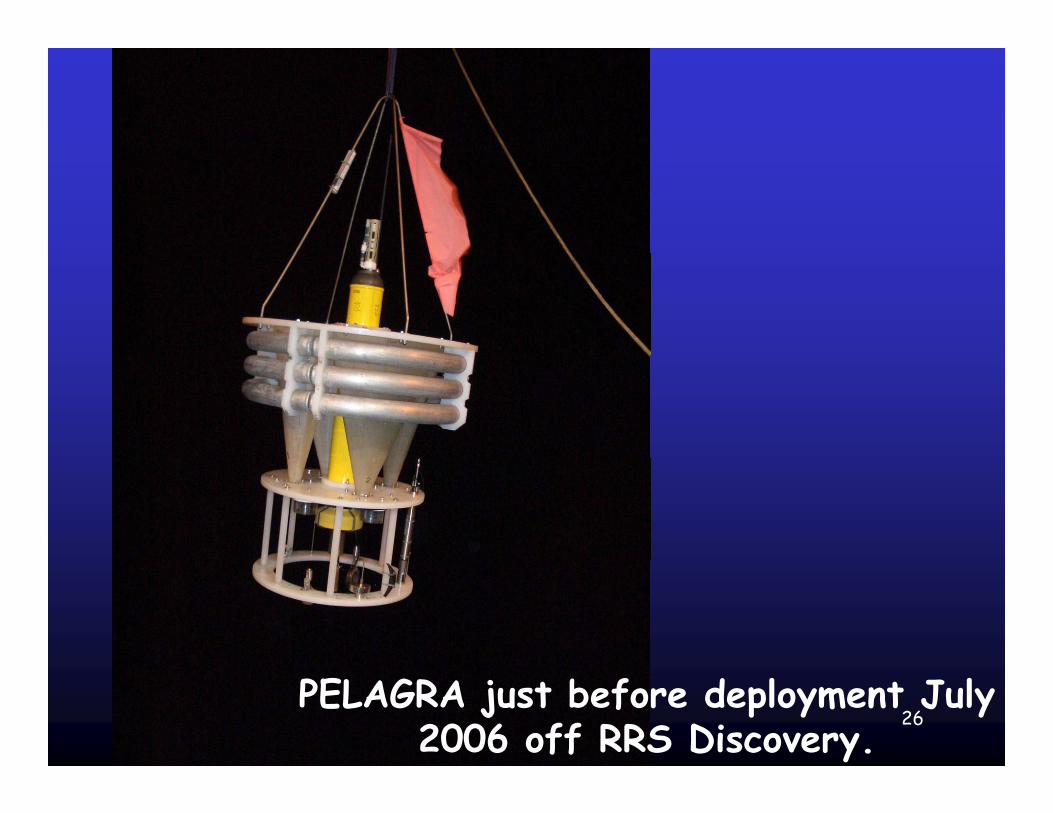
26PELAGRA just before deployment July
2006 off RRS Discovery.
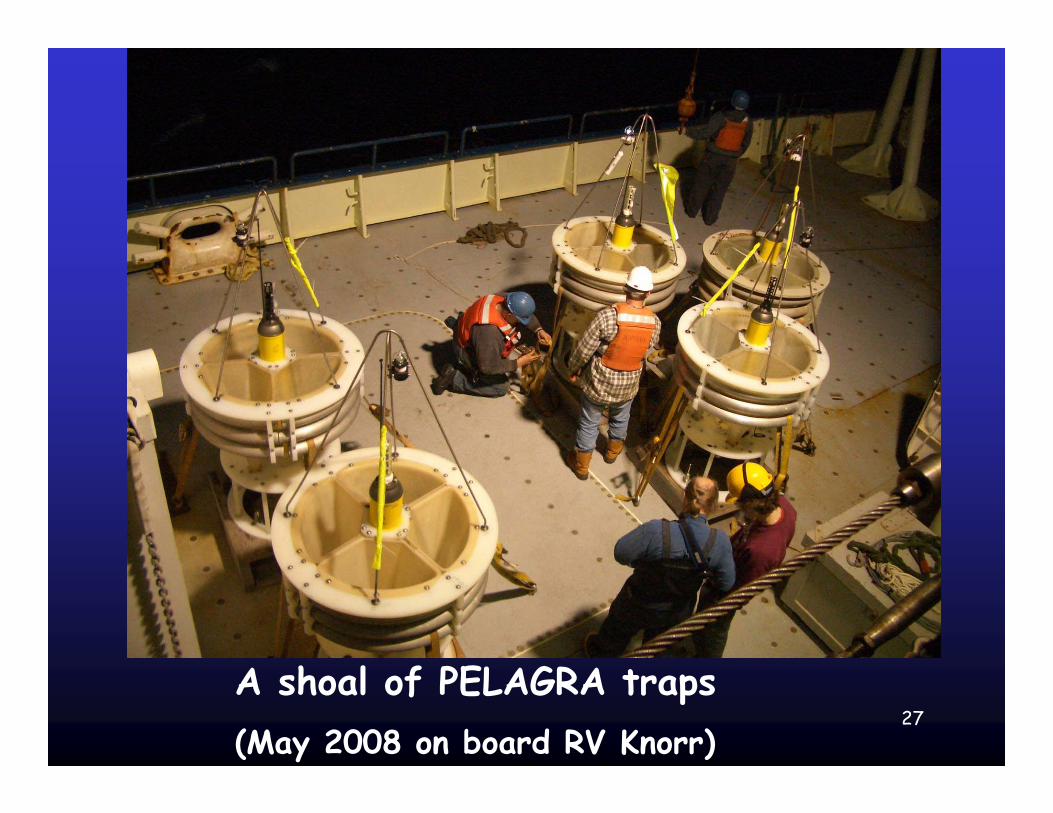
27A shoal of PELAGRA traps(May 2008 on board RV Knorr)
28
29
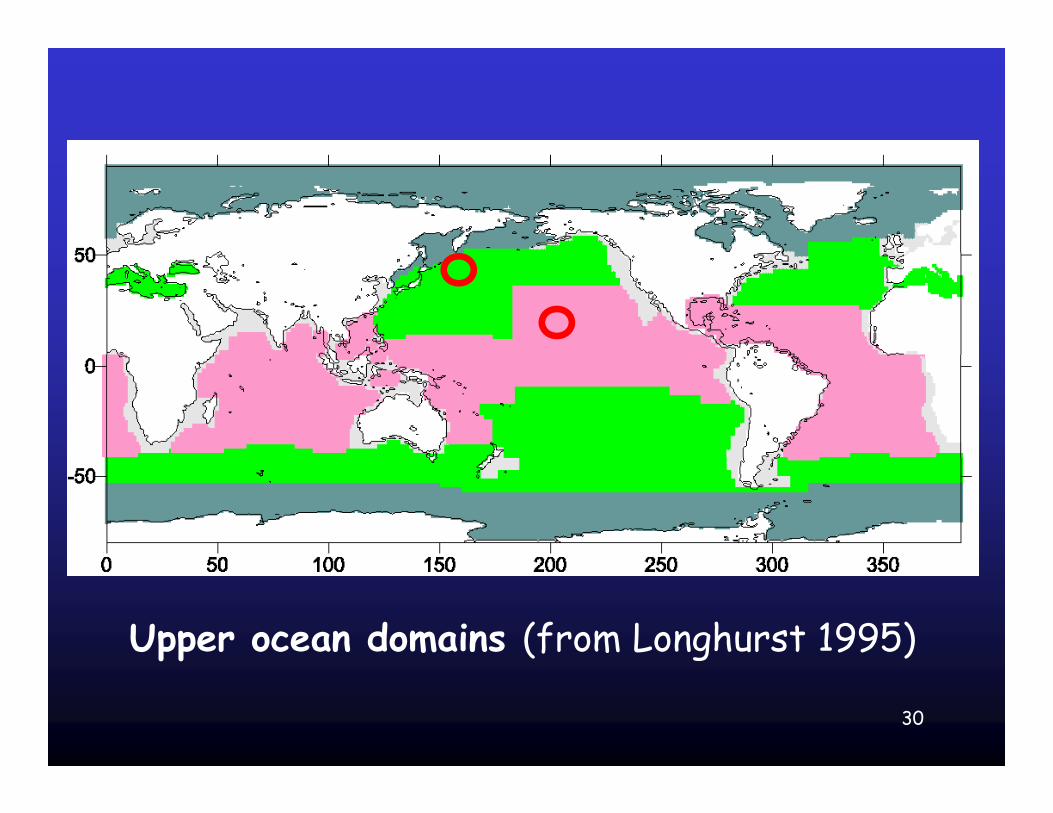
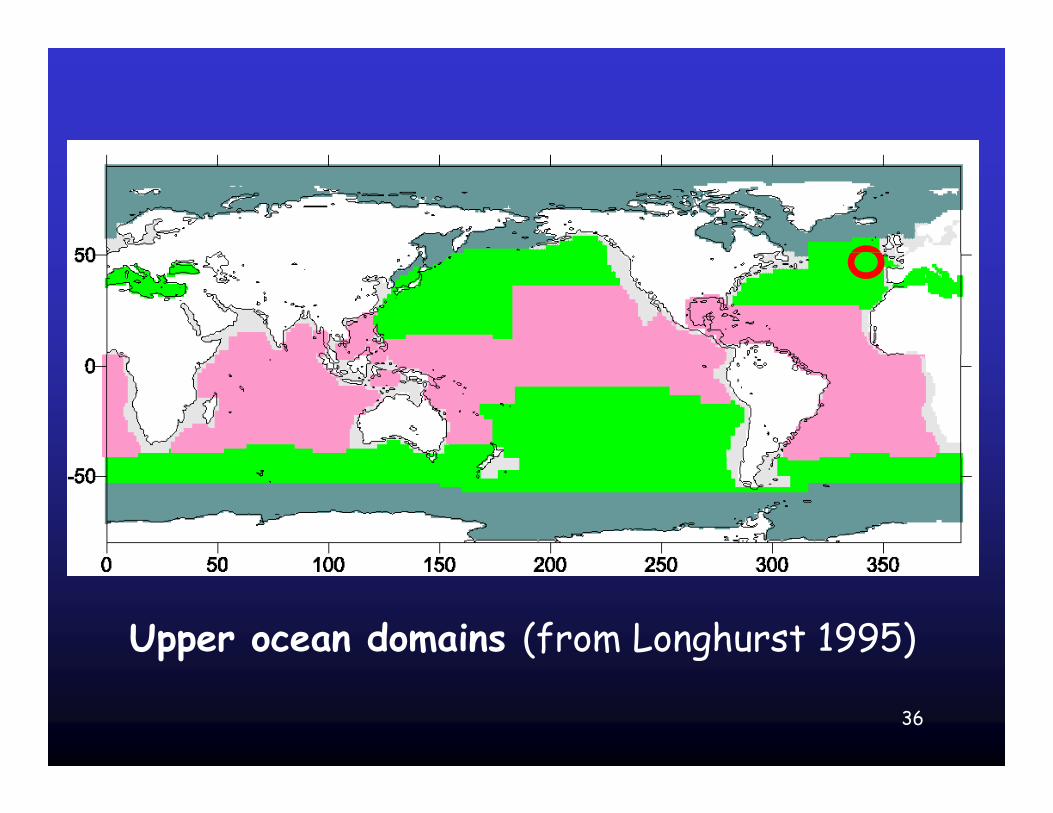
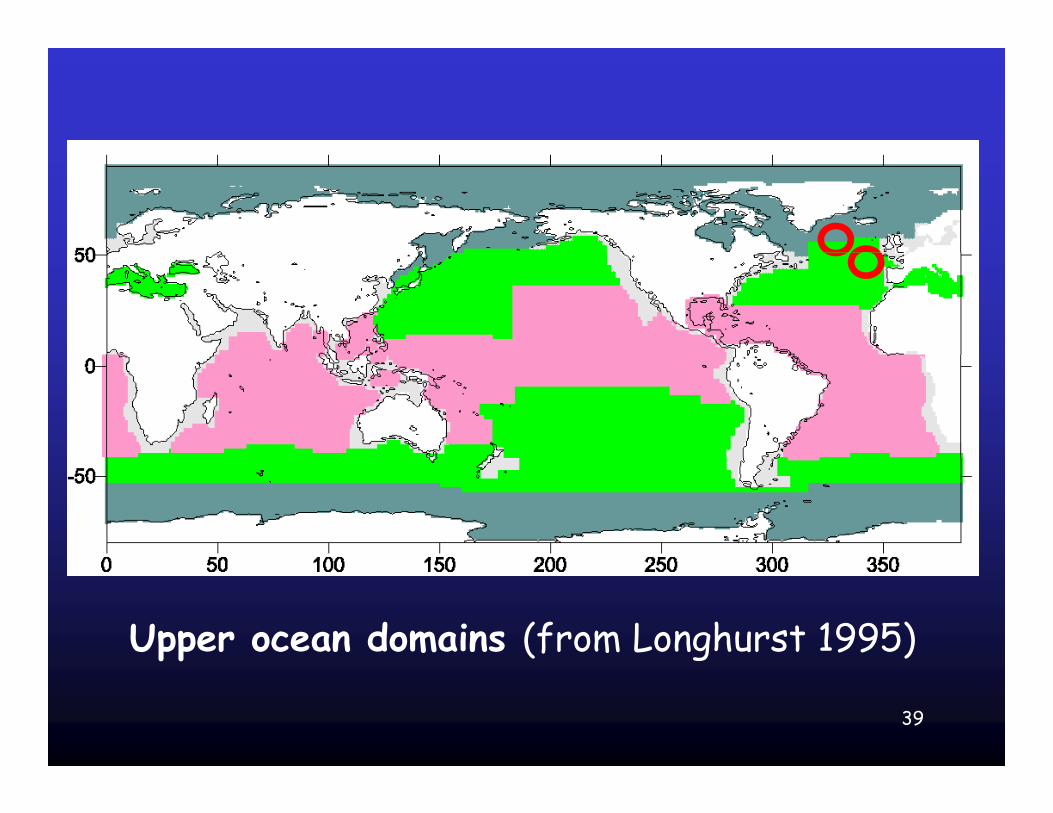
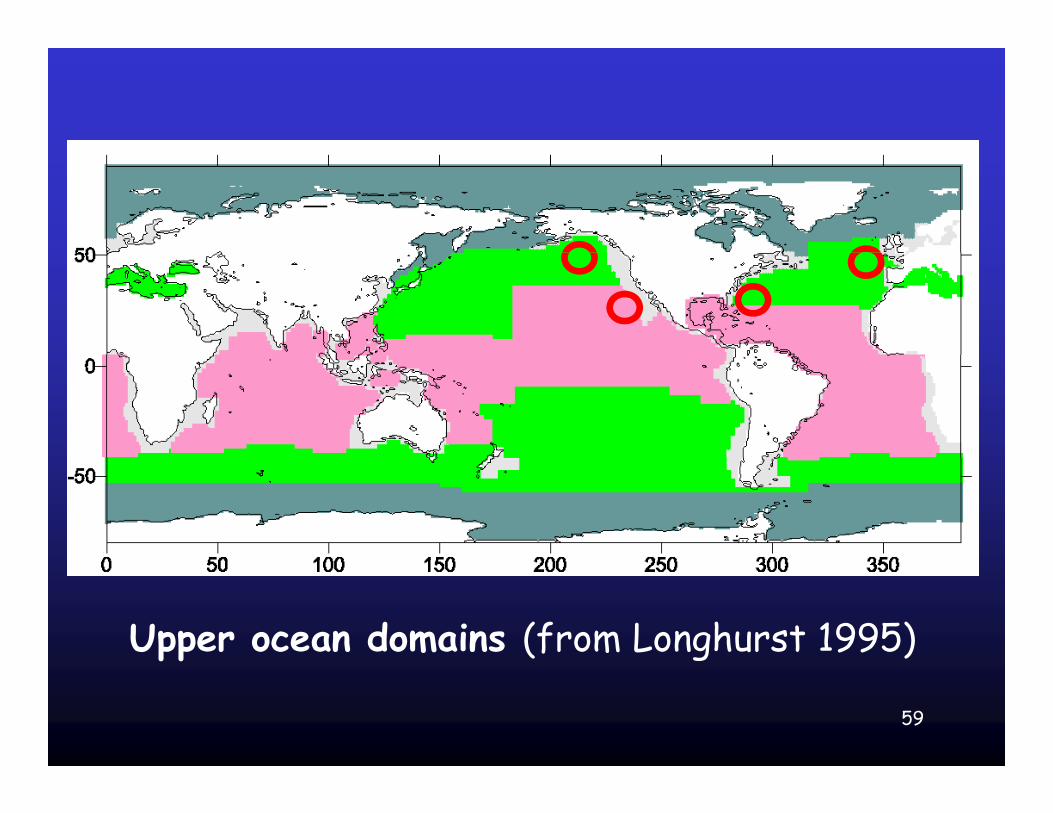
Upper ocean domains (from Longhurst 1995)
30
VERTIGO
1. ALOHA and K2 during 3-week in 2004 and 2005
31
32
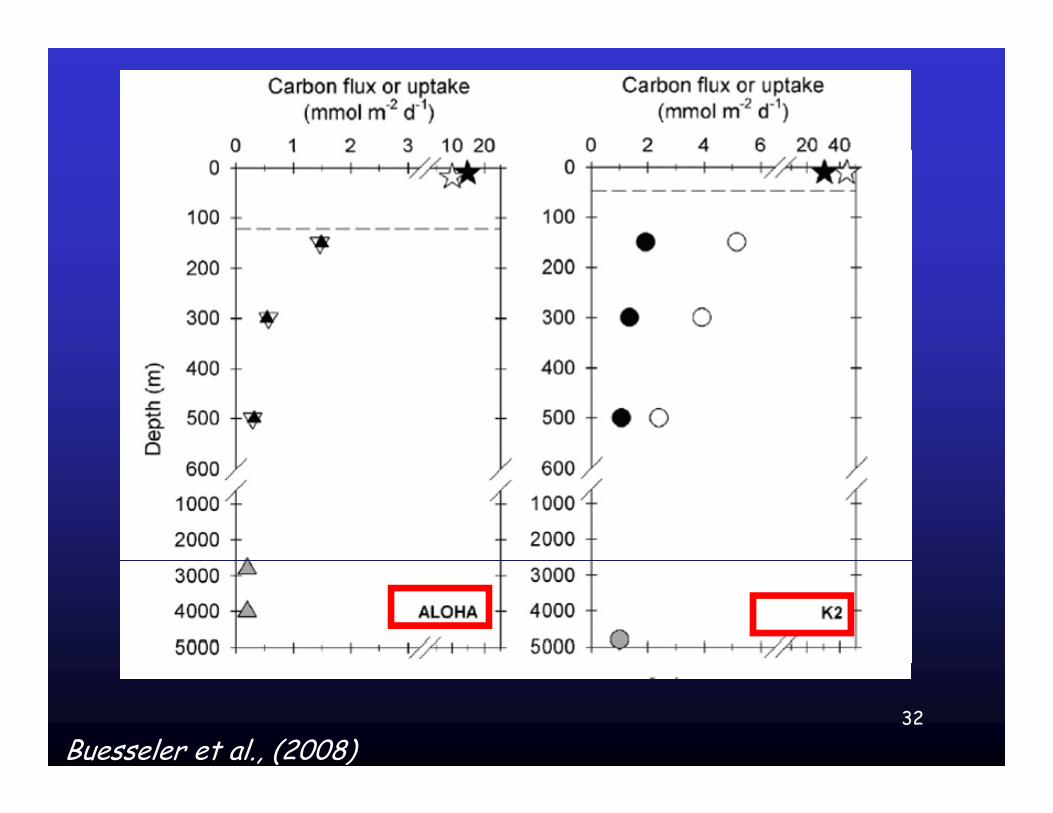
Buesseler et al., (2008)
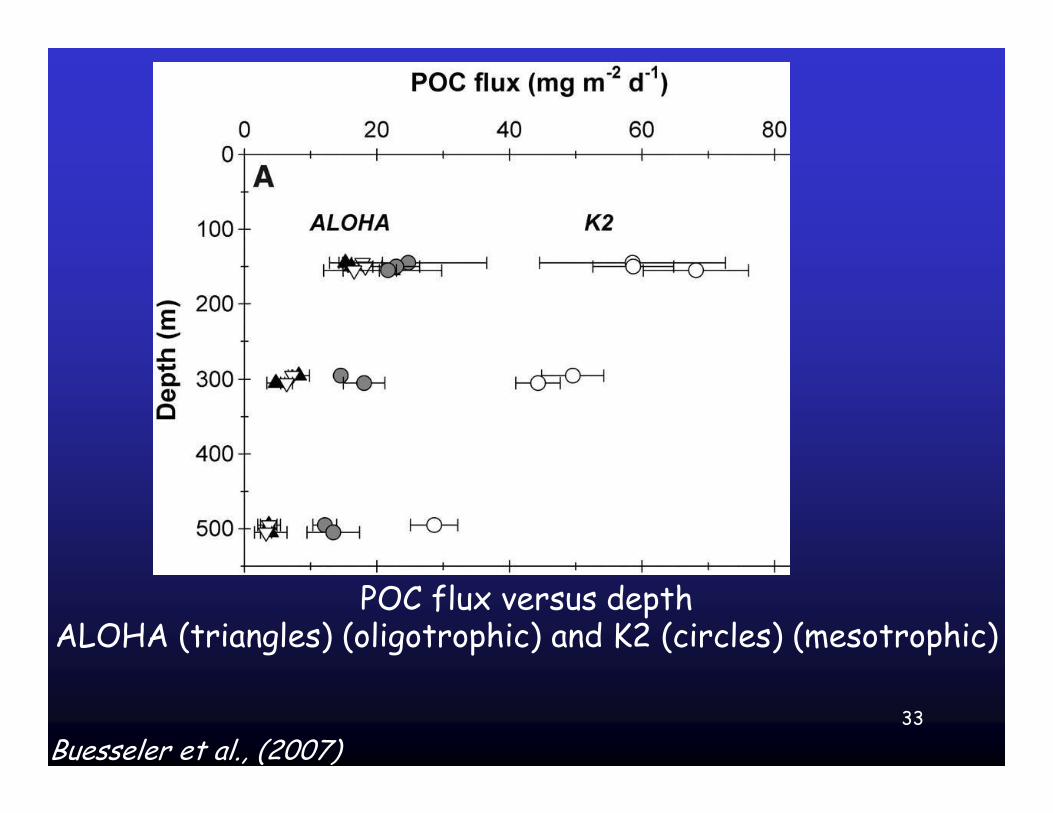
POC flux versus depth ALOHA (triangles) (oligotrophic) and K2 (circles) (mesotrophic)
33
Buesseler et al., (2007)
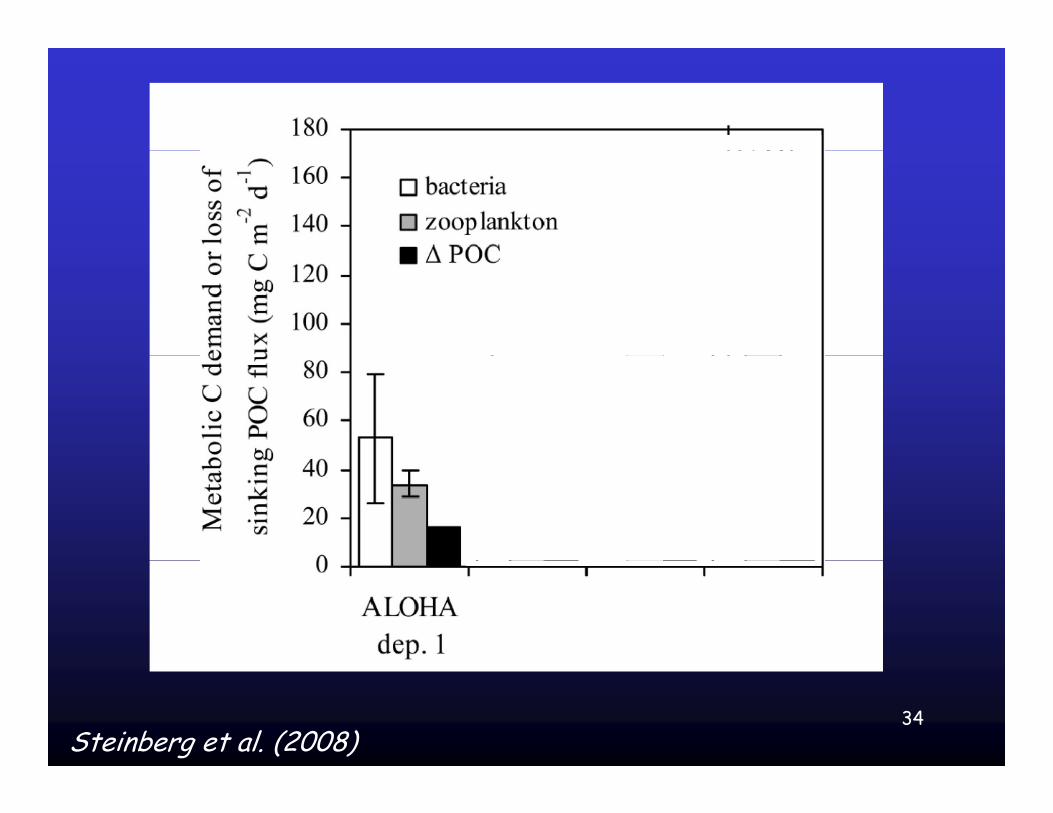
34Steinberg et al. (2008)
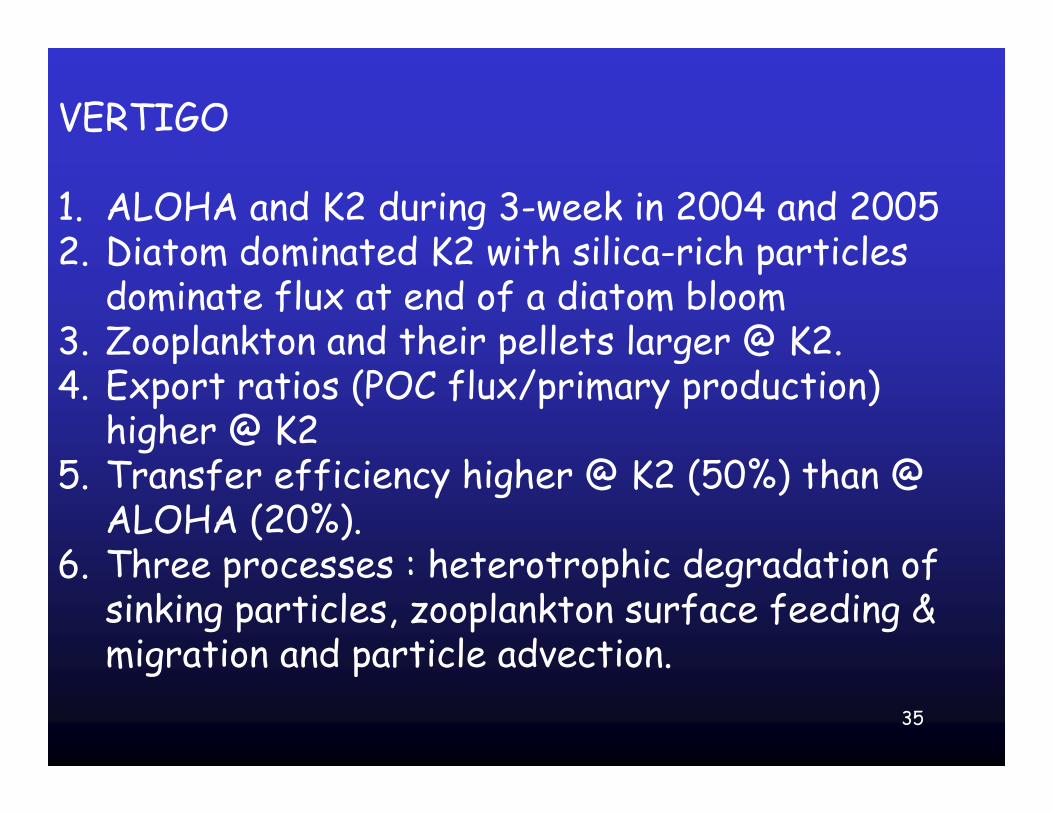
VERTIGO
1. ALOHA and K2 during 3-week in 2004 and 20052 Diatom dominated K2 with silica rich particles 2. Diatom dominated K2 with silica-rich particles
dominate flux at end of a diatom bloom3. Zooplankton and their pellets larger @ K2.. p p g @ K .4. Export ratios (POC flux/primary production)
higher @ K2%5. Transfer efficiency higher @ K2 (50%) than @
ALOHA (20%).6 Three processes : heterotrophic degradation of 6. Three processes : heterotrophic degradation of
sinking particles, zooplankton surface feeding & migration and particle advection
35
migration and particle advection.
Upper ocean domains (from Longhurst 1995)
36
0
100
h (m
)
100
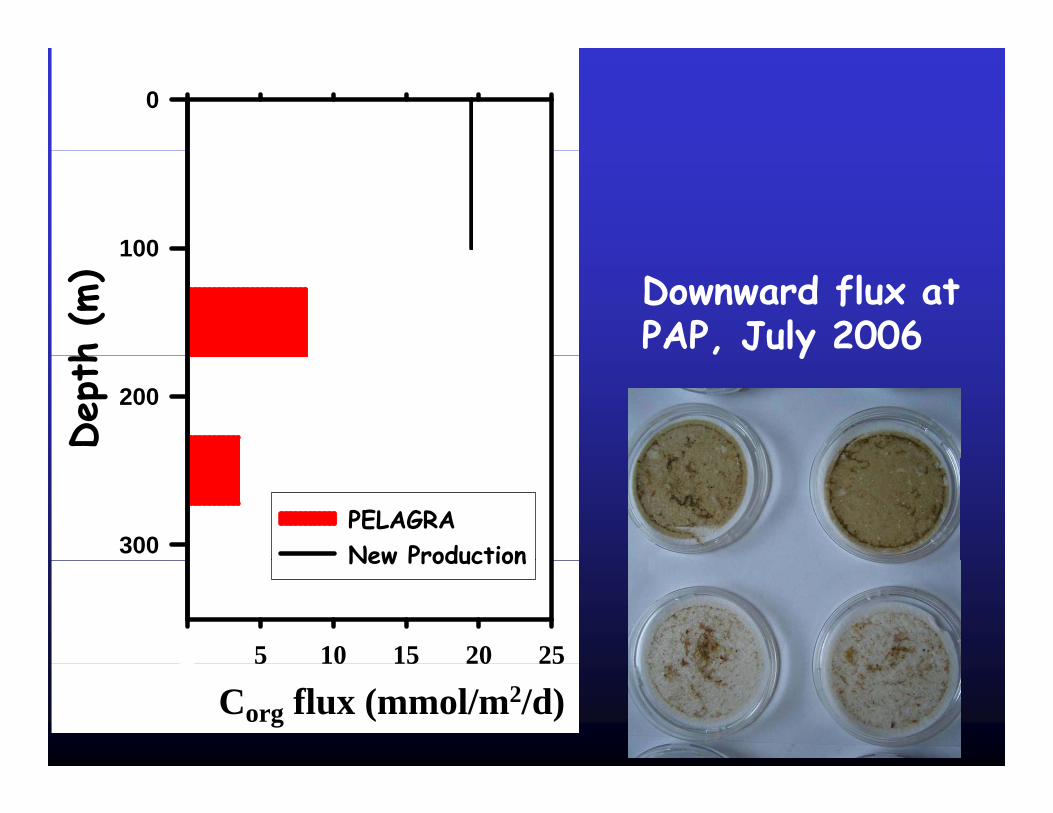
Downward flux at PAP, July 2006
Dep
th
200
y
300PELAGRANew Production
0 5 10 15 20 25
New Production
37Corg flux (mmol/m2/d)0 5 10 15 20 25
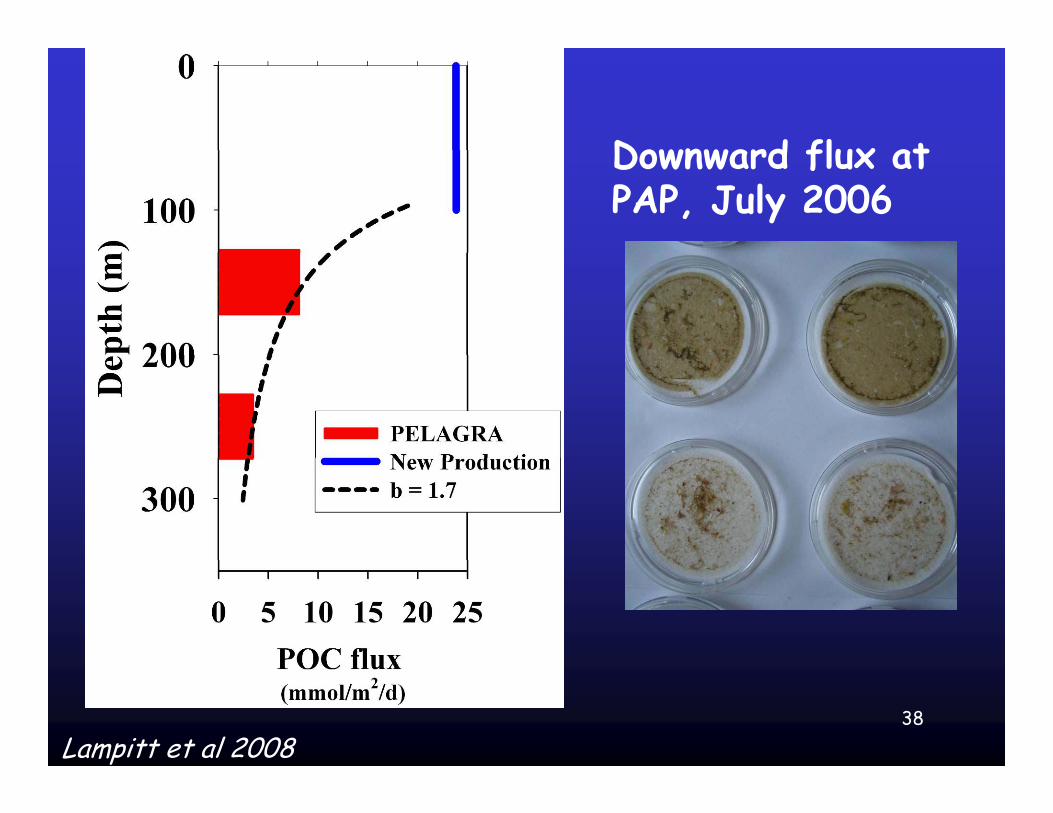
Downward flux at Downward flux at PAP, July 2006
38Lampitt et al 2008
Upper ocean domains (from Longhurst 1995)
39
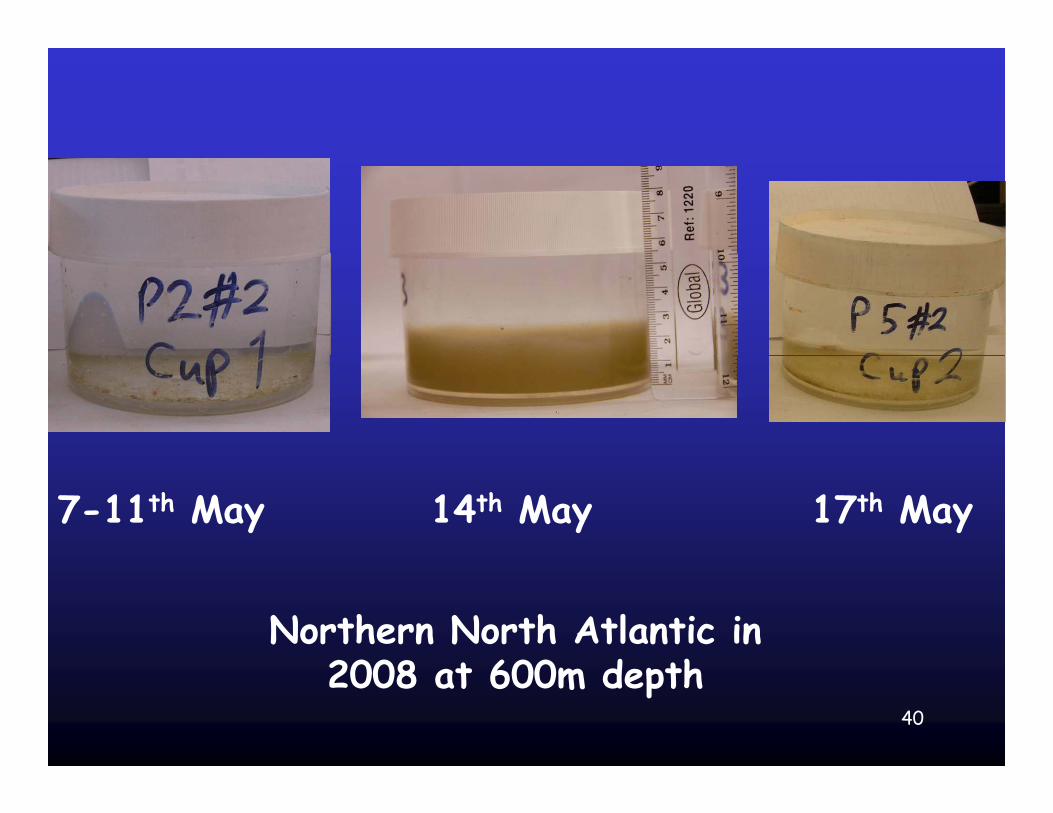
7-11th May 14th May 17th May
Northern North Atlantic in 2008 t 600 d th
40
2008 at 600m depth

1 2
NABE 2008
4 ti 4 consecutive deployments, MayMay3 4
41
Martin et al (submitted)

42
43
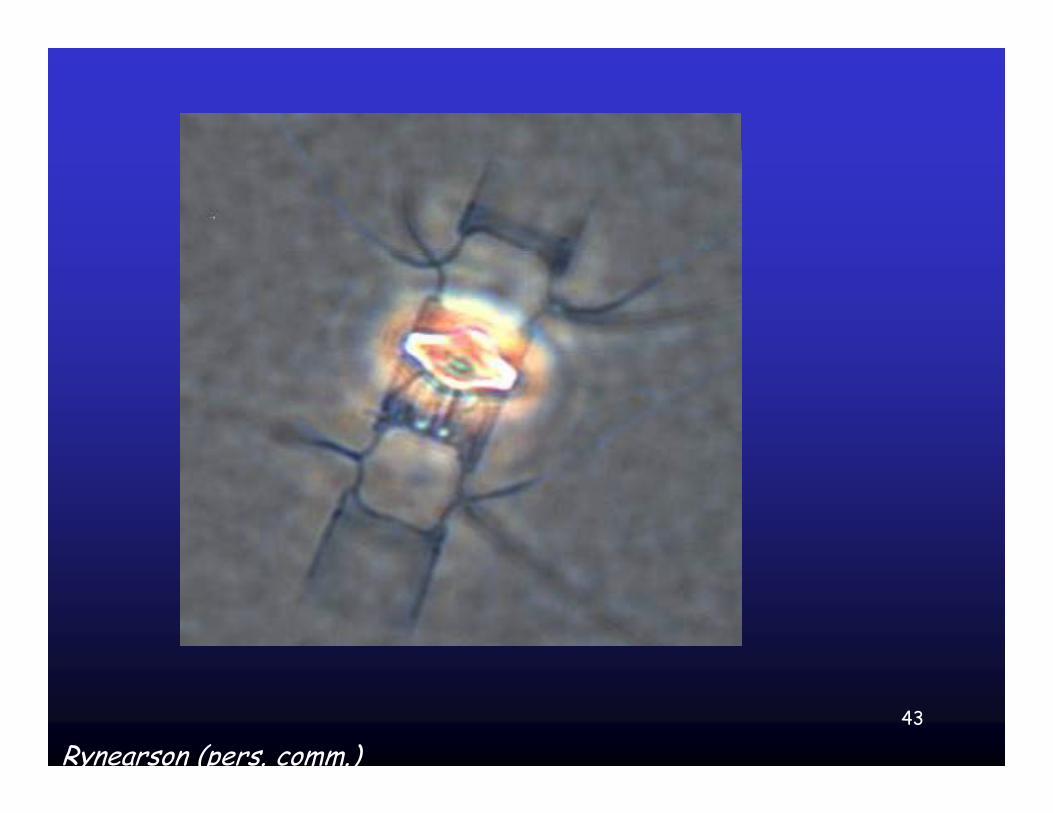
Rynearson (pers. comm.)
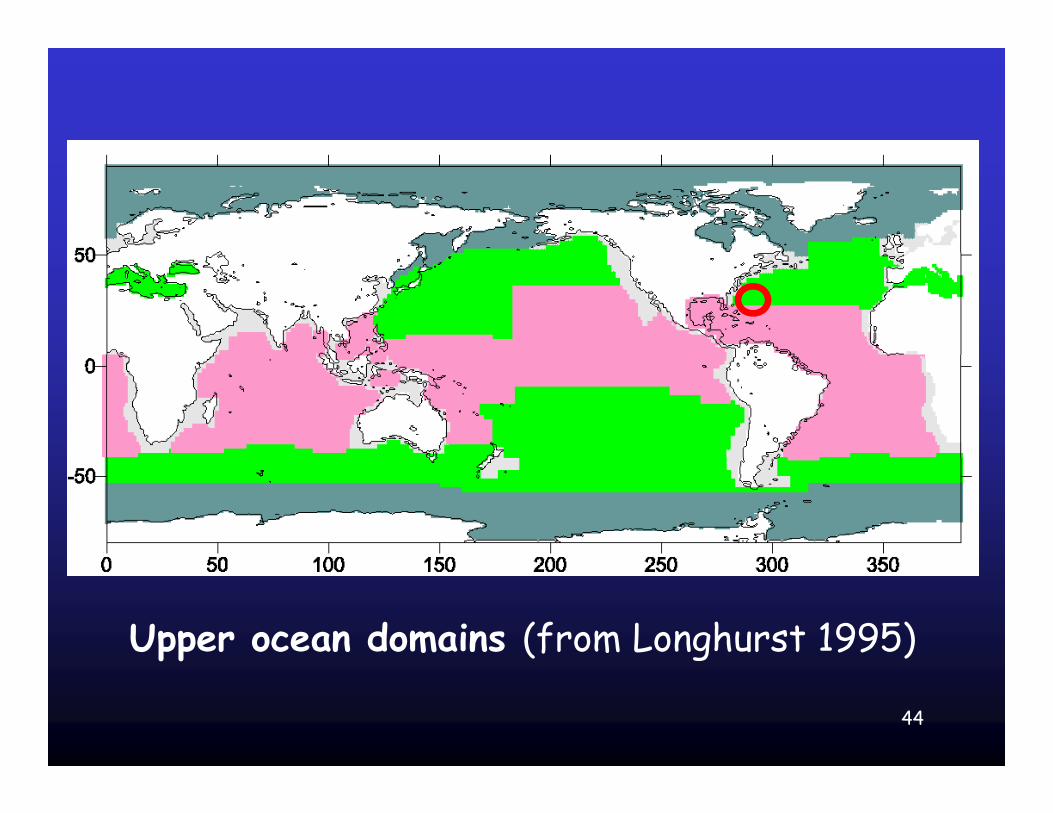
Upper ocean domains (from Longhurst 1995)
44
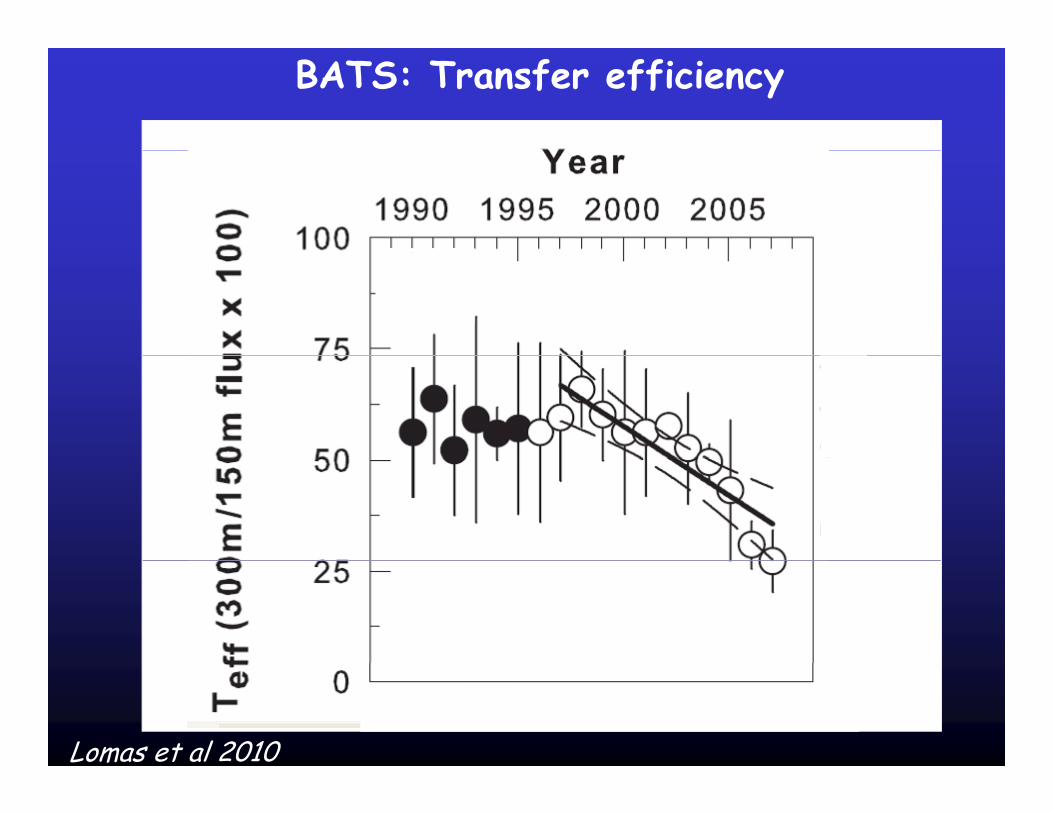
BATS: Transfer efficiency
45
Lomas et al 2010
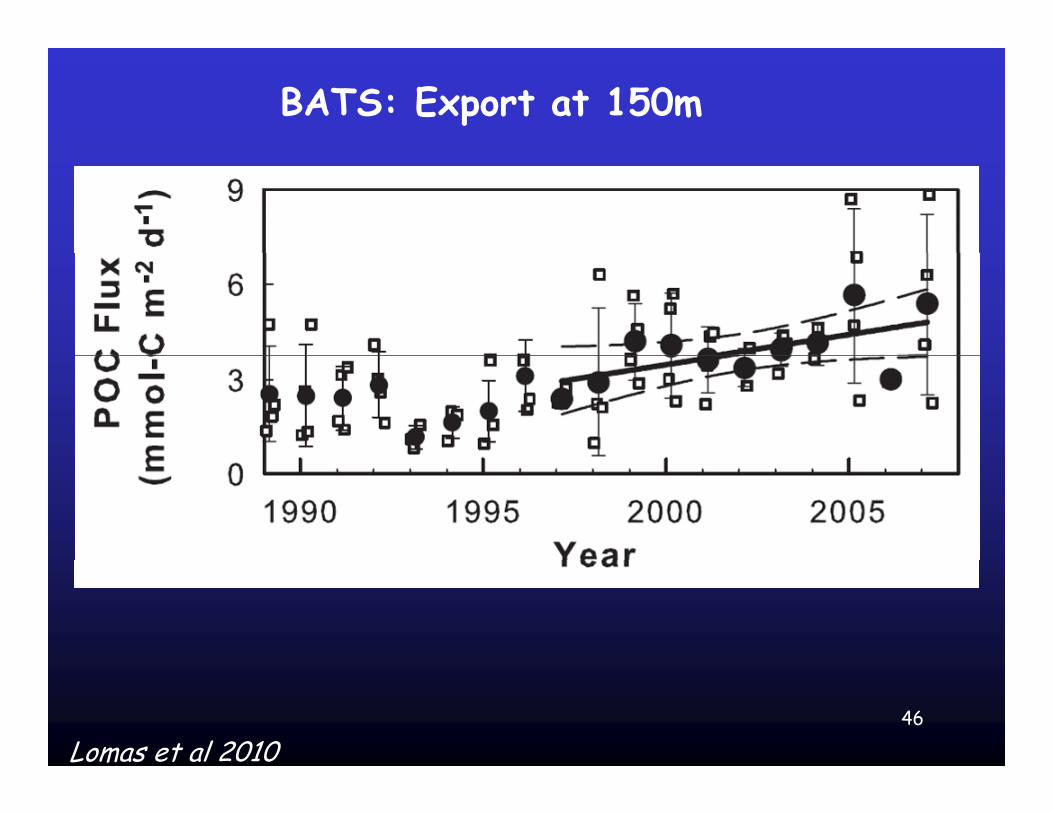
BATS: Export at 150m
46
Lomas et al 2010
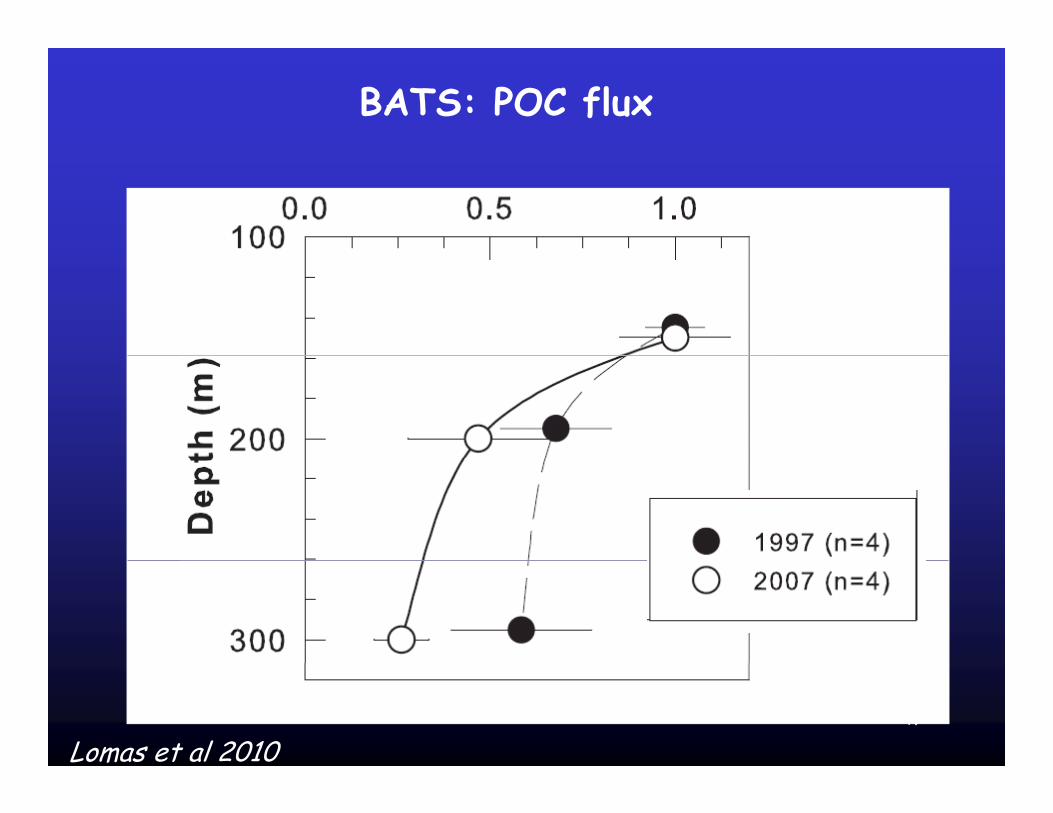
BATS: POC flux
47
Lomas et al 2010
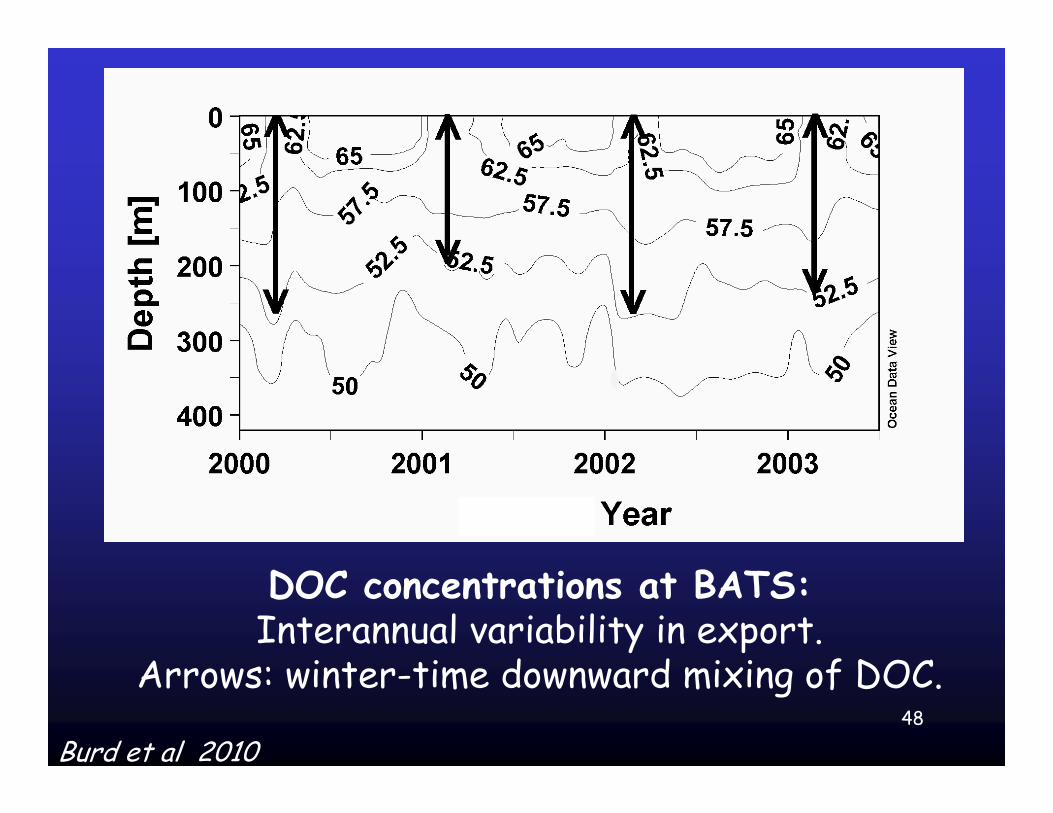
DOC concentrations at BATS: Interannual variability in export.
A i t ti d d i i f DOC48
Arrows: winter-time downward mixing of DOC.
Burd et al 2010

Who is degrading the supply of organic carbon?
49
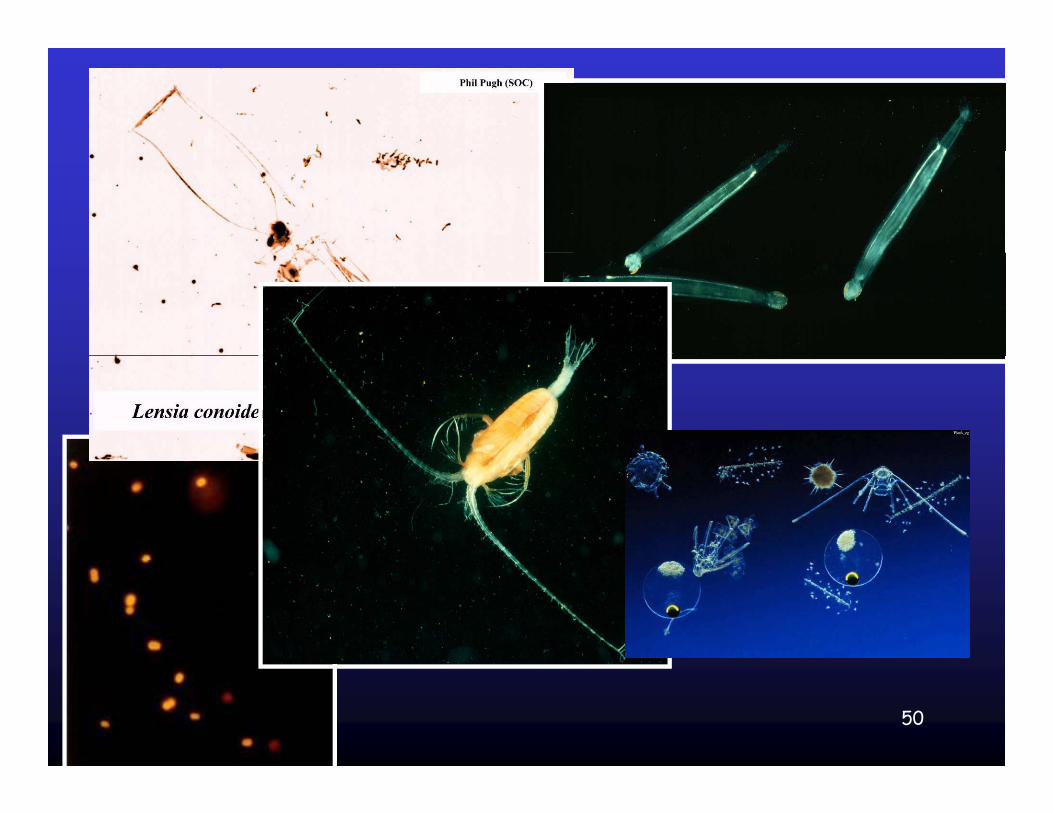
50
51Twilight zone fauna
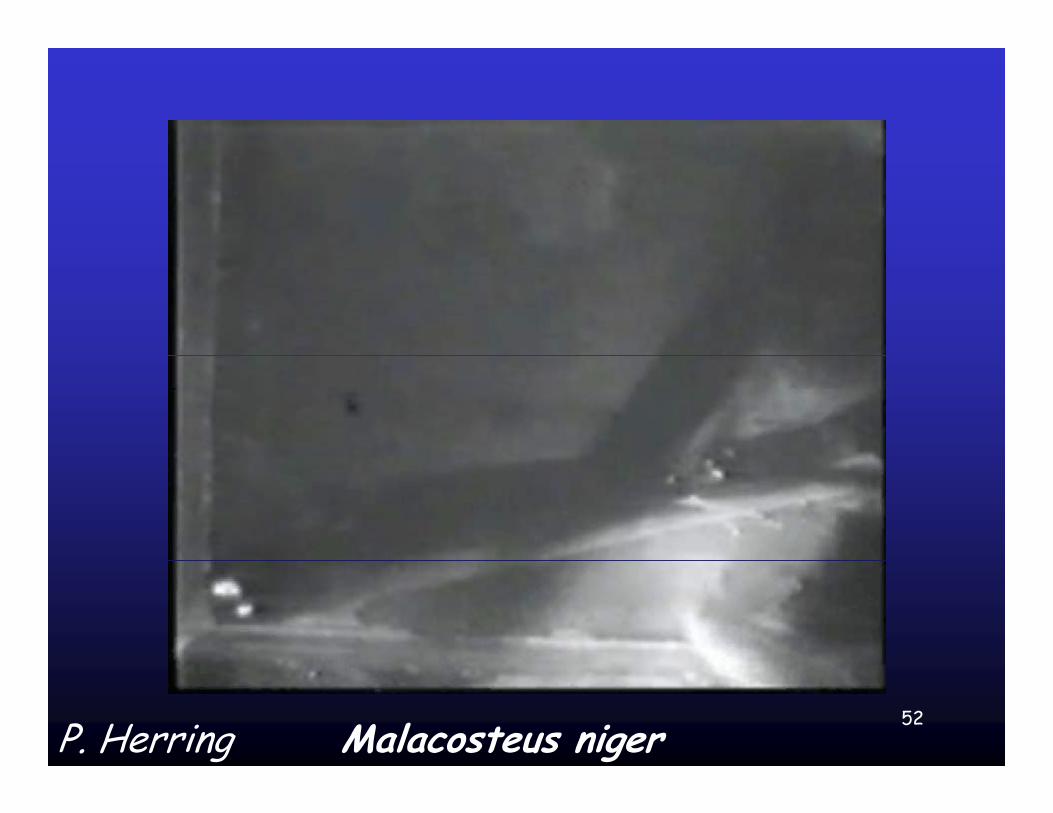
52Malacosteus nigerP. Herring
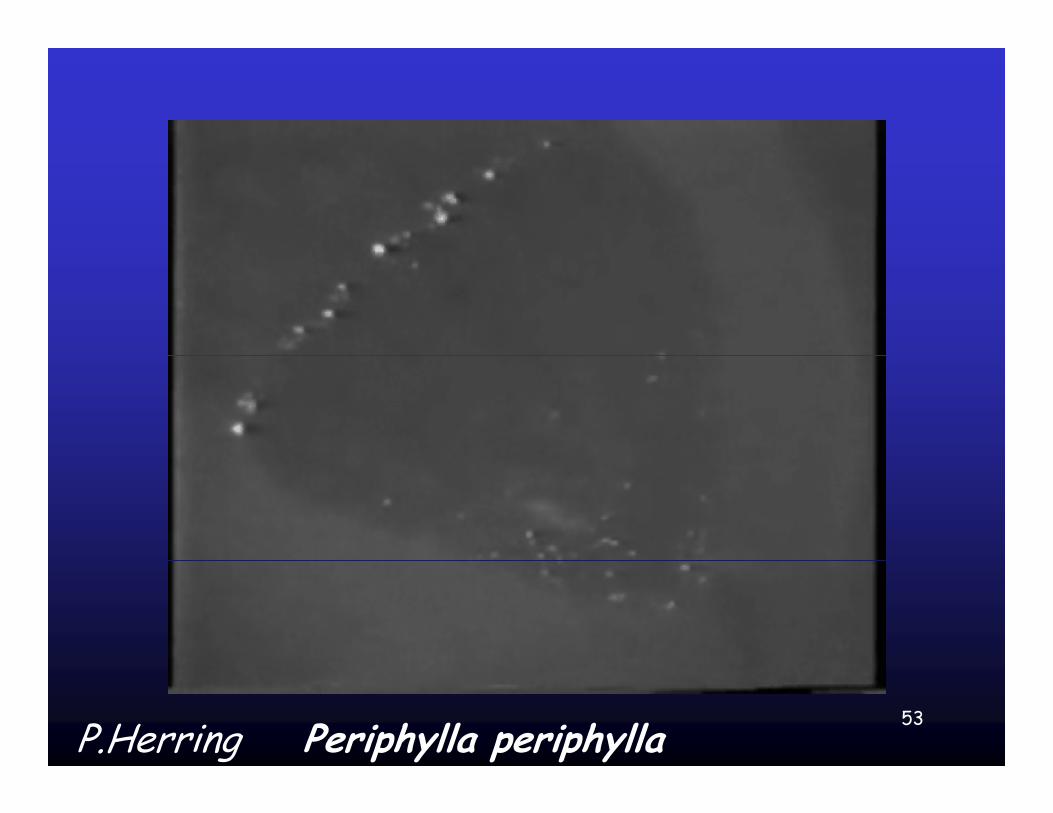
53P.Herring Periphylla periphylla
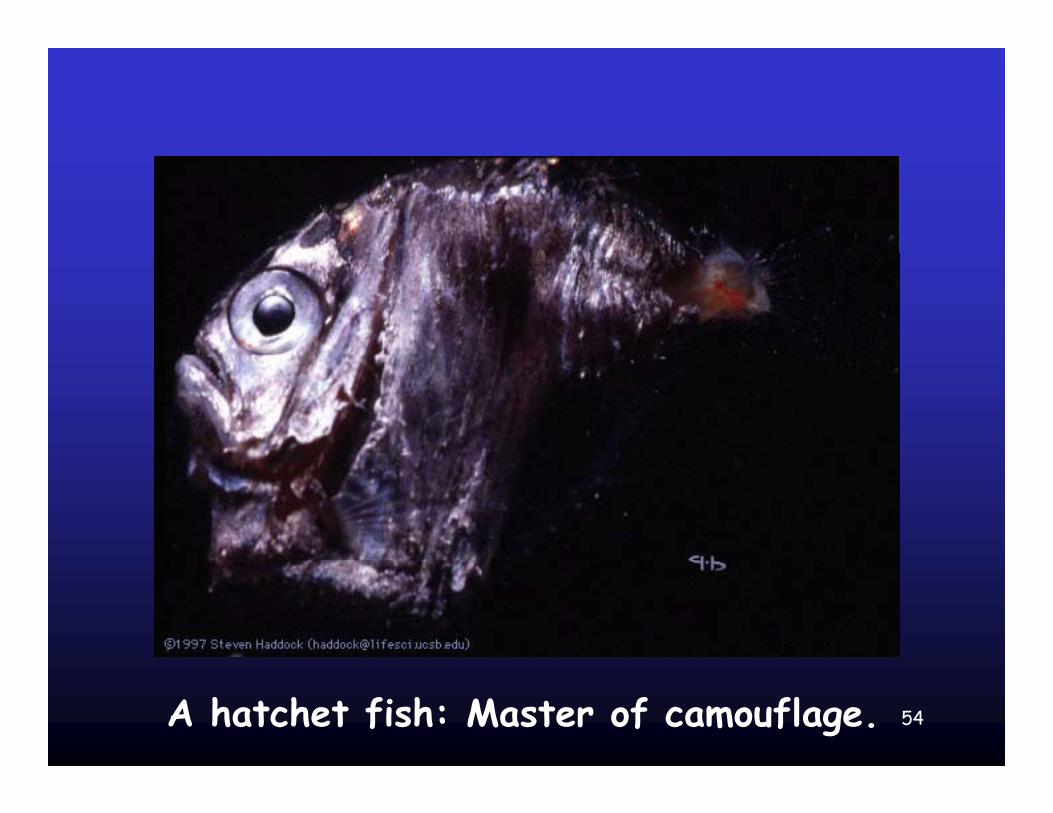
54A hatchet fish: Master of camouflage.
Can we collect them effectively?
55
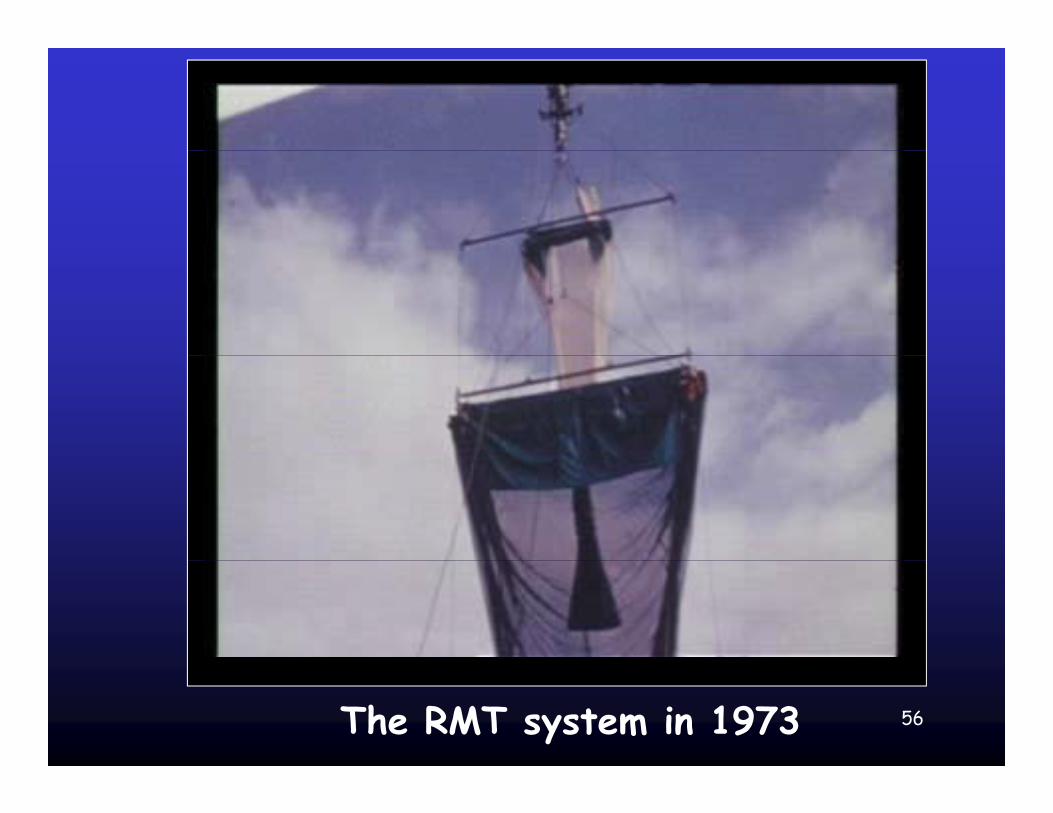
56The RMT system in 1973
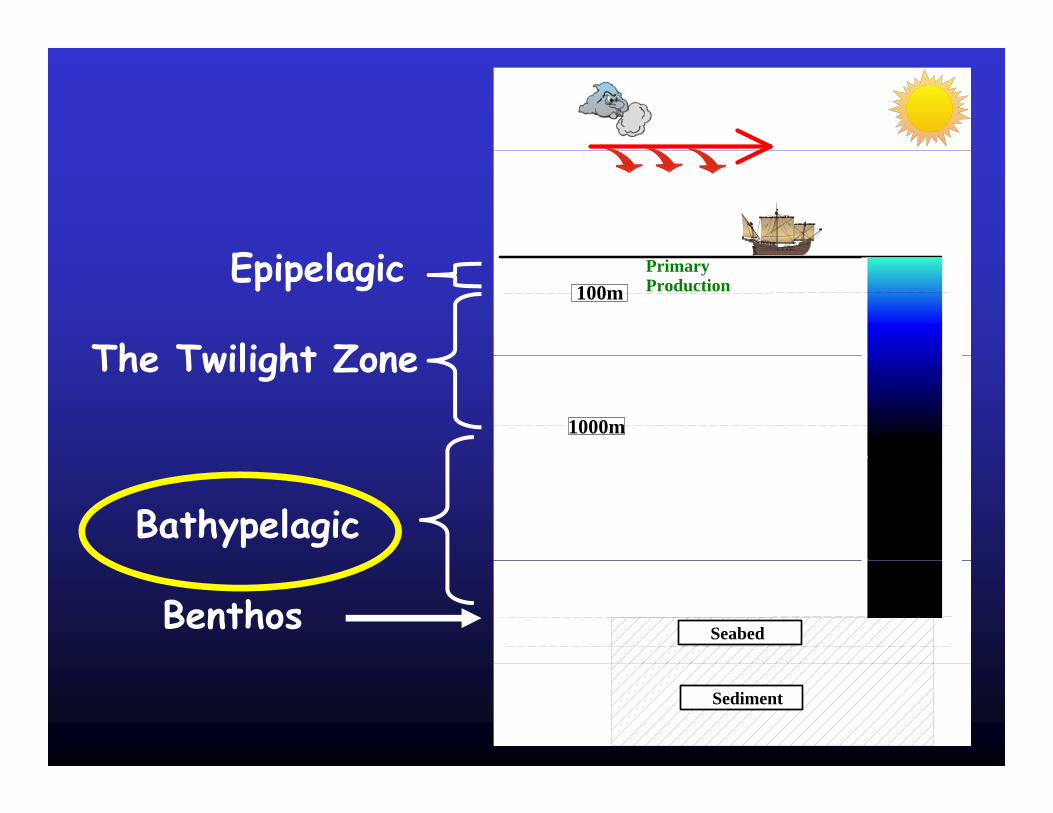
E l PrimaryProduction100m
The Twilight Zone
Epipelagic
1000m
The Twilight Zone
Bathypelagic
SeabedBenthos
57Sediment

Downward flux: From ocean interior to seafloorSediment Trap mooringp g
58
Upper ocean domains (from Longhurst 1995)
59
DW406080
100120
46810
020
02
POC10
15
20
6810
(mg/
m2 /d
)
6
8
of d
ata
810
0
5
024
PIC
Ave
rage
flux
0
2
4
# Ye
ars
o
0246
2010
3 0
A
BSi
0
5
10
15
02468
TPN
0.51.01.52.02.53.0
246810
60Jan Feb Mar Apr May Jun Jul Aug Sep Oct Nov Dec
0.0 0
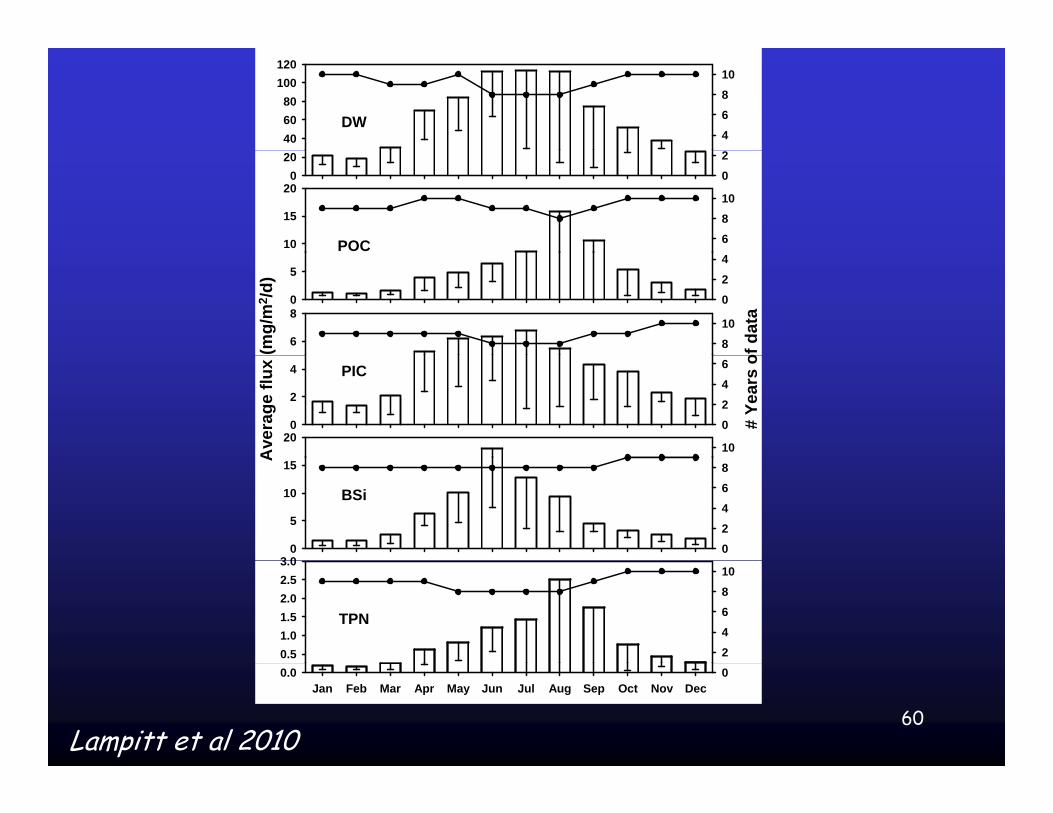
Lampitt et al 2010
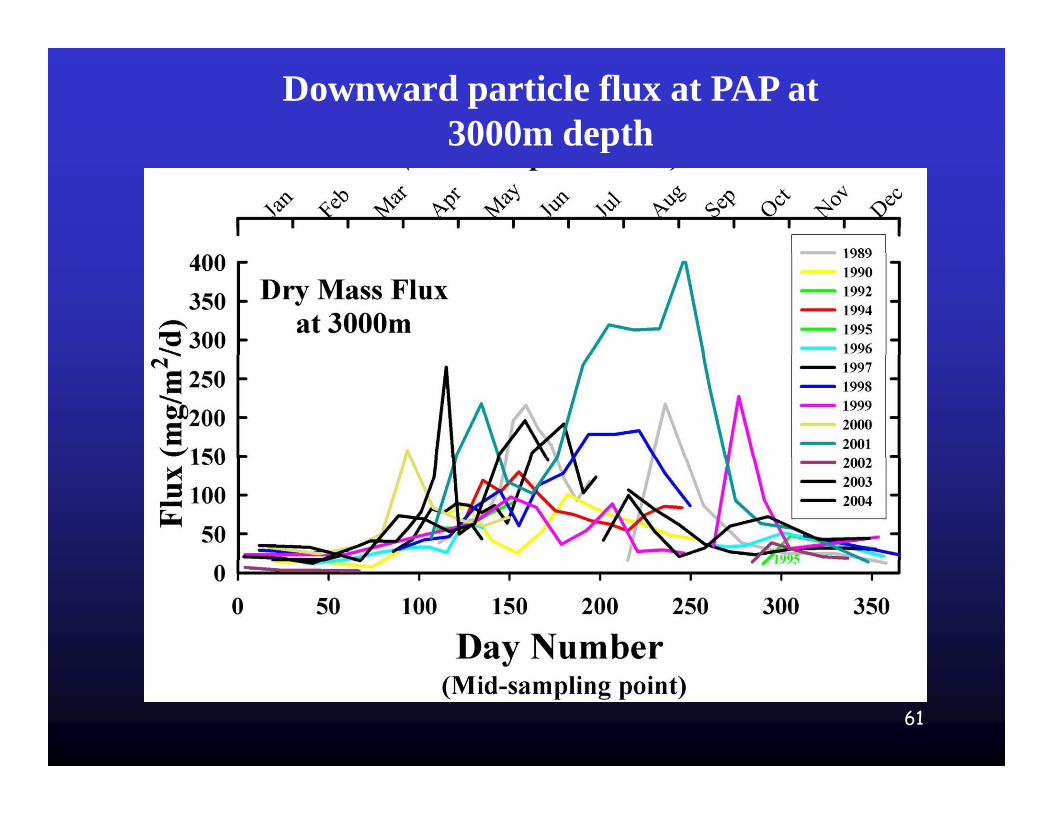
Downward particle flux at PAP at 3000m depthp
61
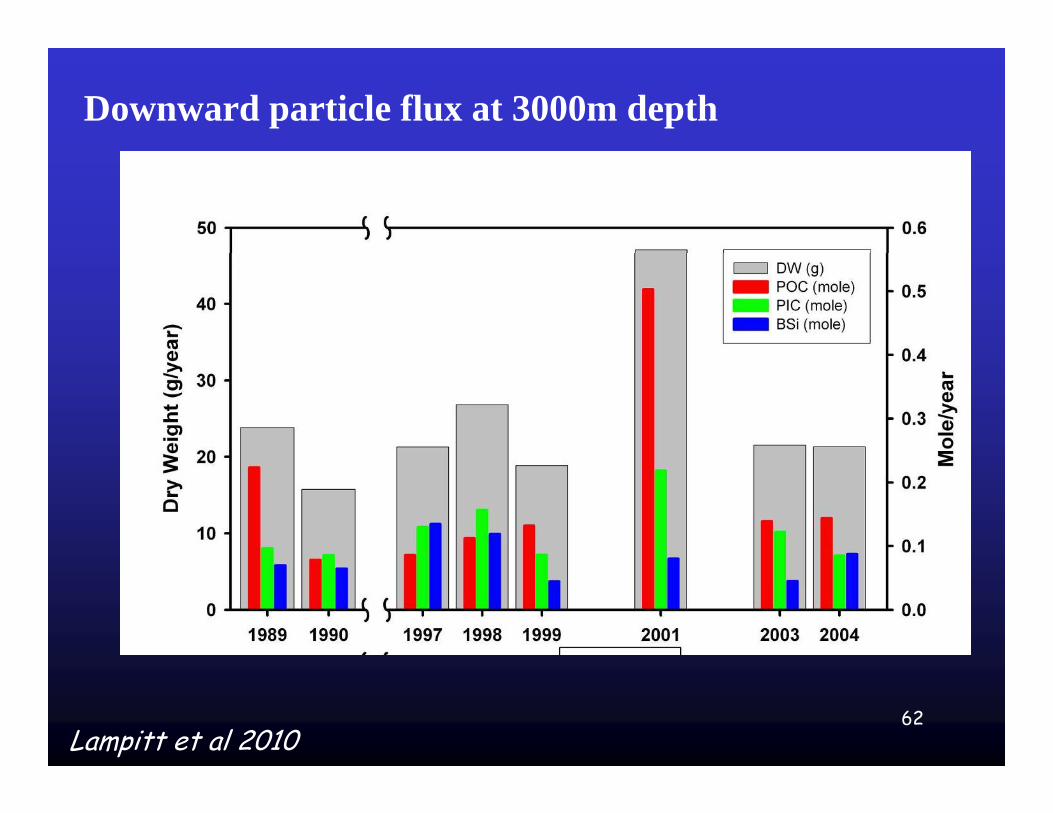
Downward particle flux at 3000m depth
62Lampitt et al 2010
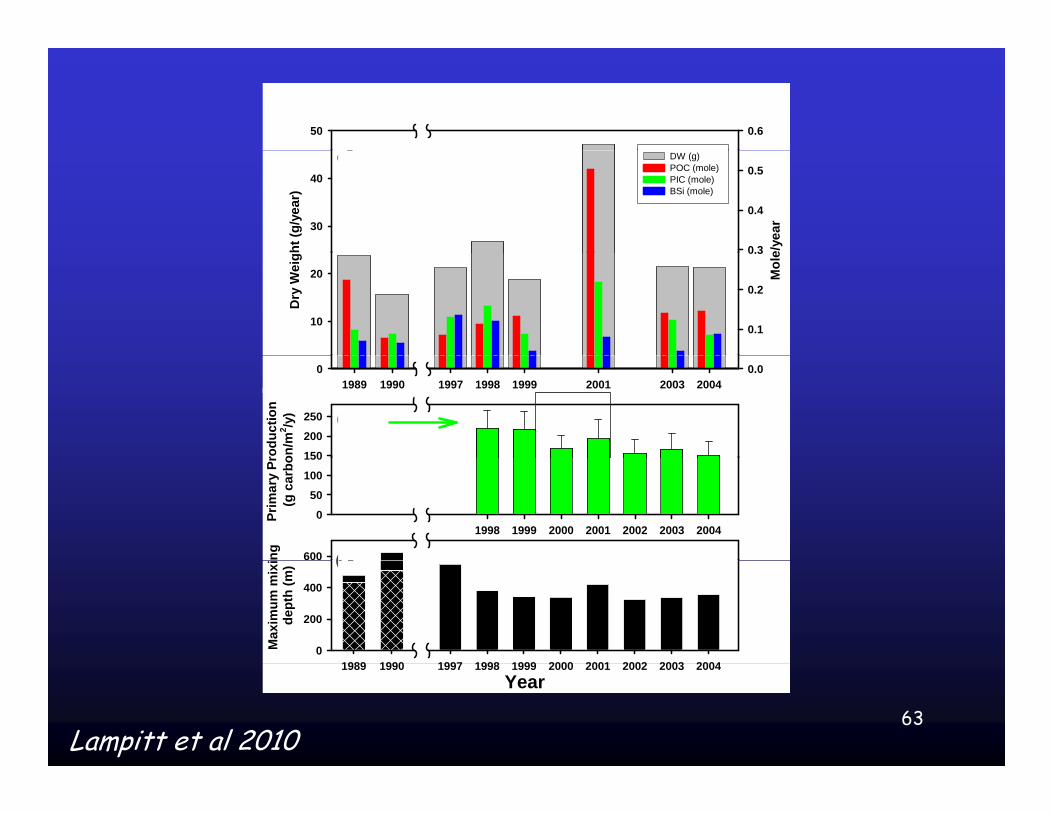
50 0.6
a
ht (g
/yea
r)
30
40
e/ye
ar
0.3
0.4
0.5DW (g) POC (mole) PIC (mole) BSi (mole)
a
Dry
Wei
g
10
20 Mol
e
0.1
0.2
0.3
1989 1990 1997 1998 1999 2001 2004
rodu
ctio
n on
/m2 /y
)
150
200
250 c1989 1990 1997 1998 1999 2001 2003 2004
0 0.0
1998 1999 2000 2001 2002 2003 2004
Prim
ary
Pr(g
car
bo
0
50
100
150
ng
600 d
1989 1990 1997 1998 1999 2000 2001 2002 2003 2004
Max
imum
mix
ide
pth
(m)
0
200
400
d
63
Year1989 1990 1997 1998 1999 2000 2001 2002 2003 2004
Lampitt et al 2010

5
io (%
)
3
4
port
rat
2
3
Exp
0
1
Year1998 1999 2000 2001 2002 2003 2004
0
64Lampitt et al 2010

Upper ocean domains (from Longhurst 1995)
65
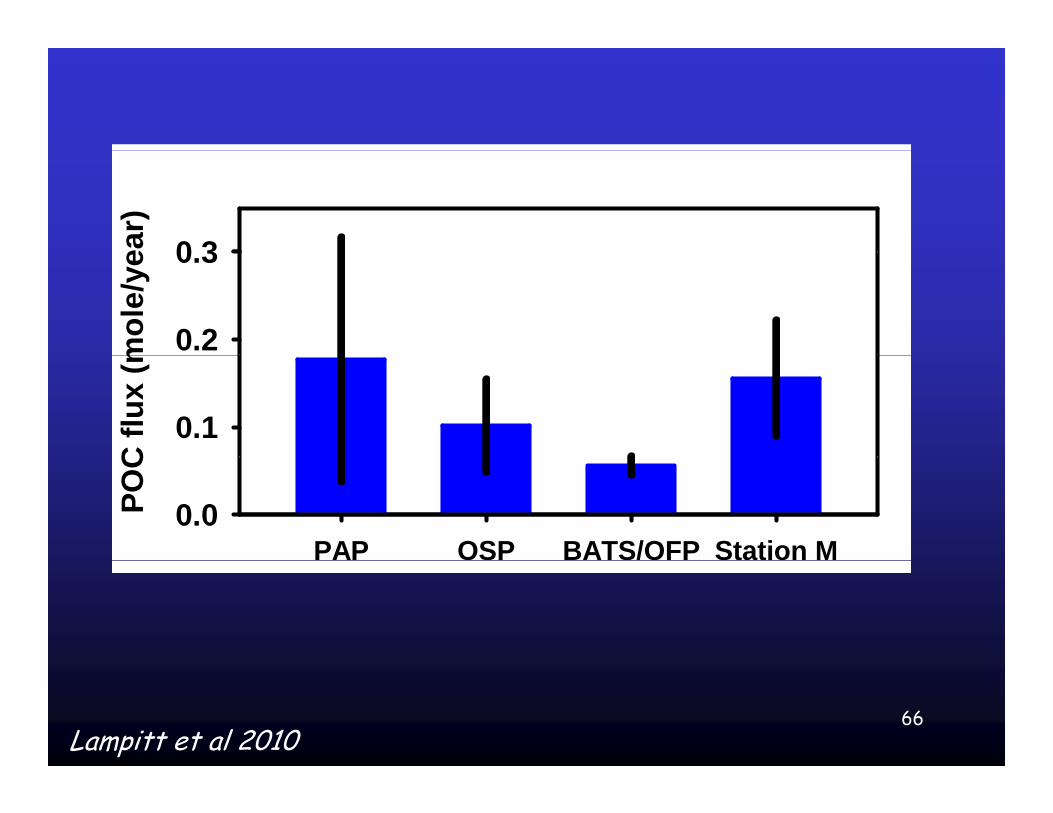
ear)
0 3
mol
e/ye
0.2
0.3
C fl
ux (m
0.1
PAP OSP BATS/OFP Station M
POC
0.0
66Lampitt et al 2010
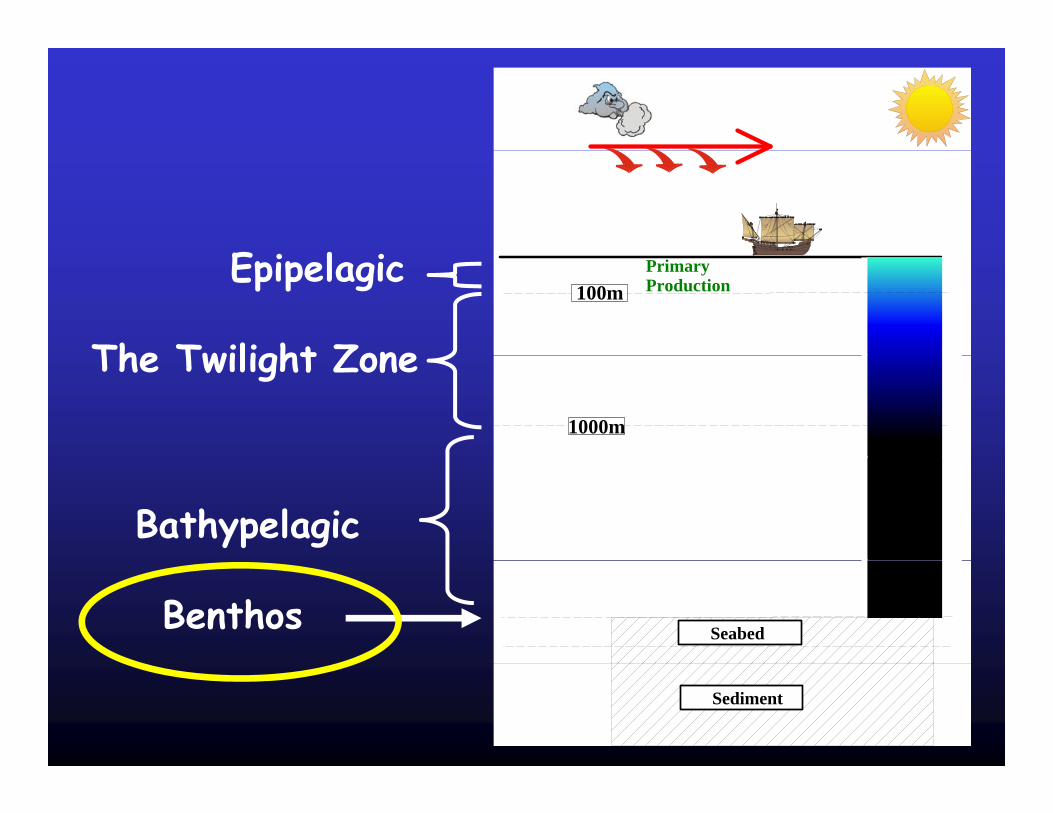
E l PrimaryProduction100m
The Twilight Zone
Epipelagic
1000m
The Twilight Zone
Bathypelagic
SeabedBenthos
67Sediment
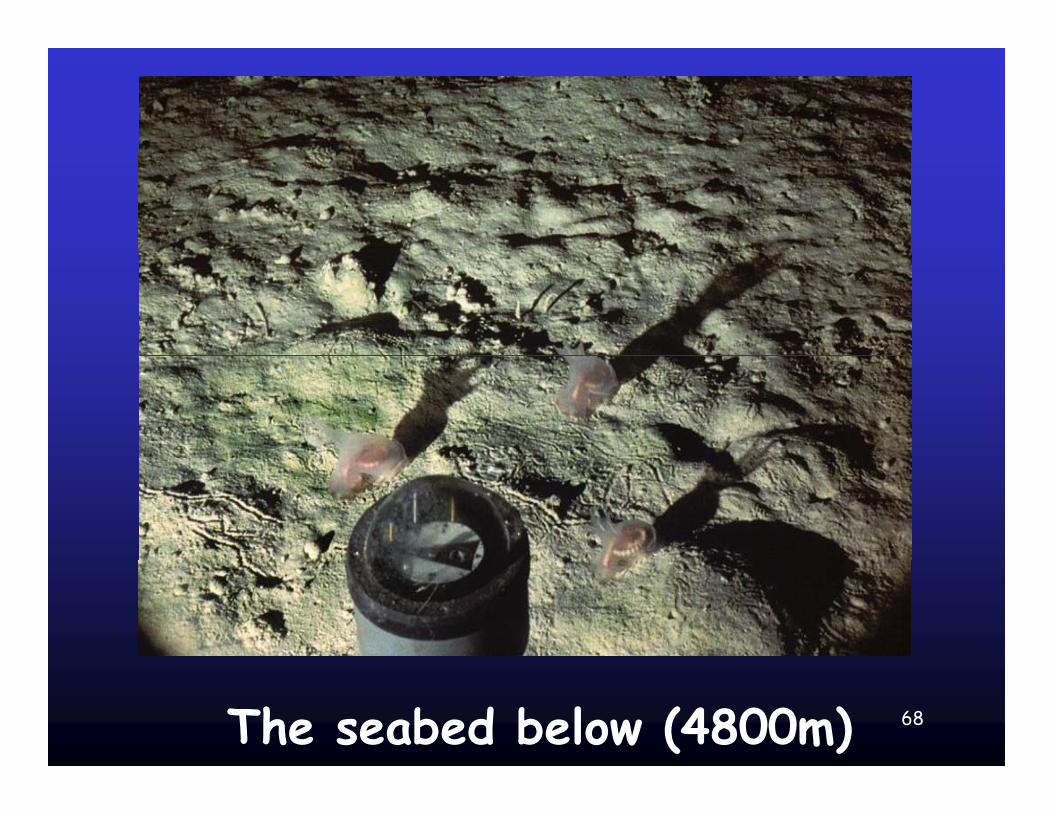
68The seabed below (4800m)
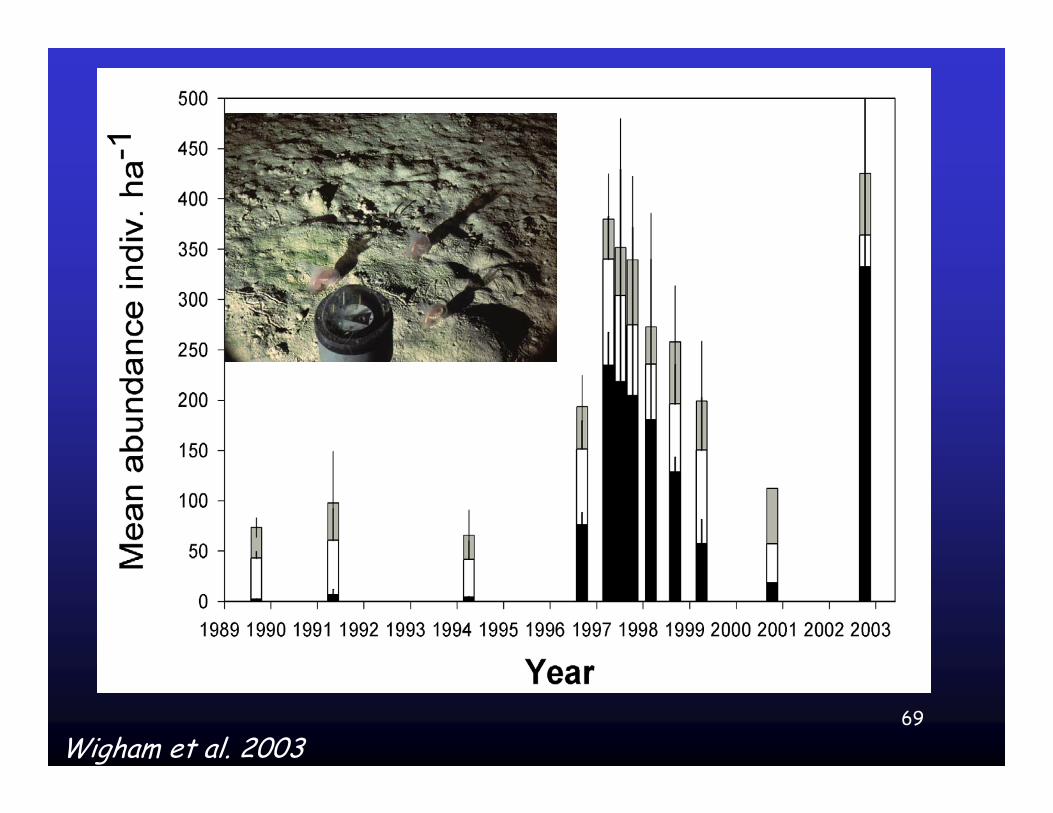
69Wigham et al. 2003
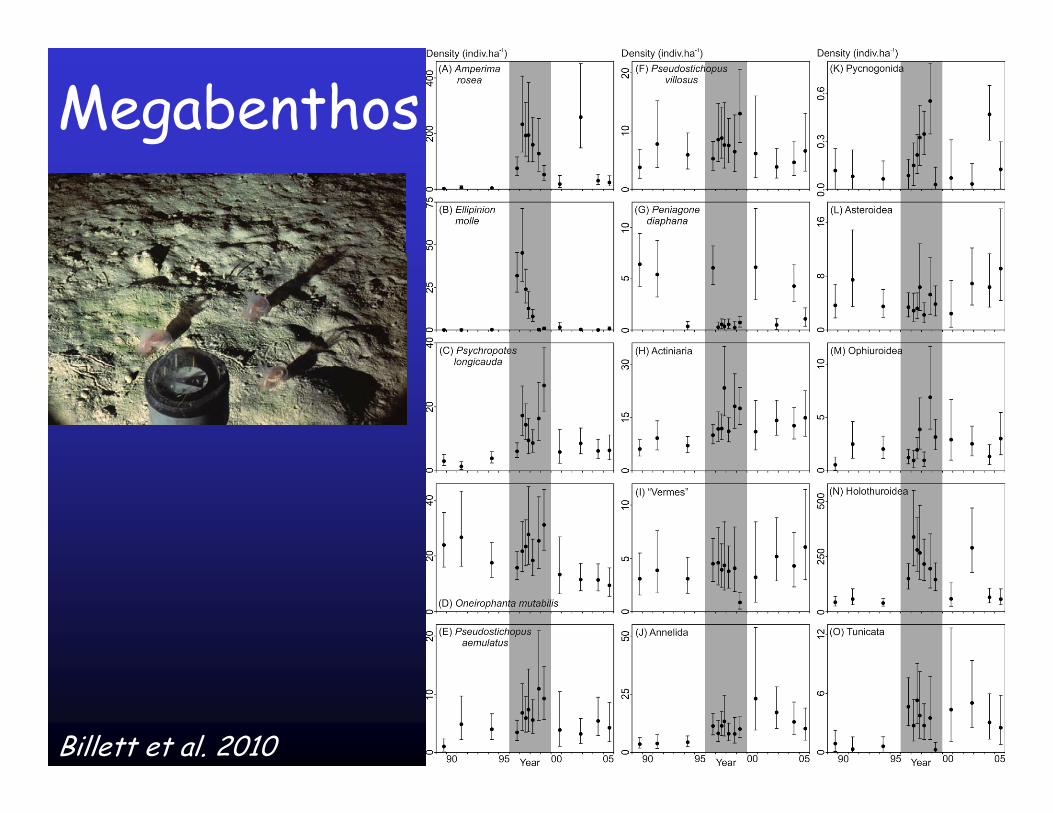
Megabenthos
70Billett et al. 2010

Macrobenthos
71Kalogeropoulou et al. 2010
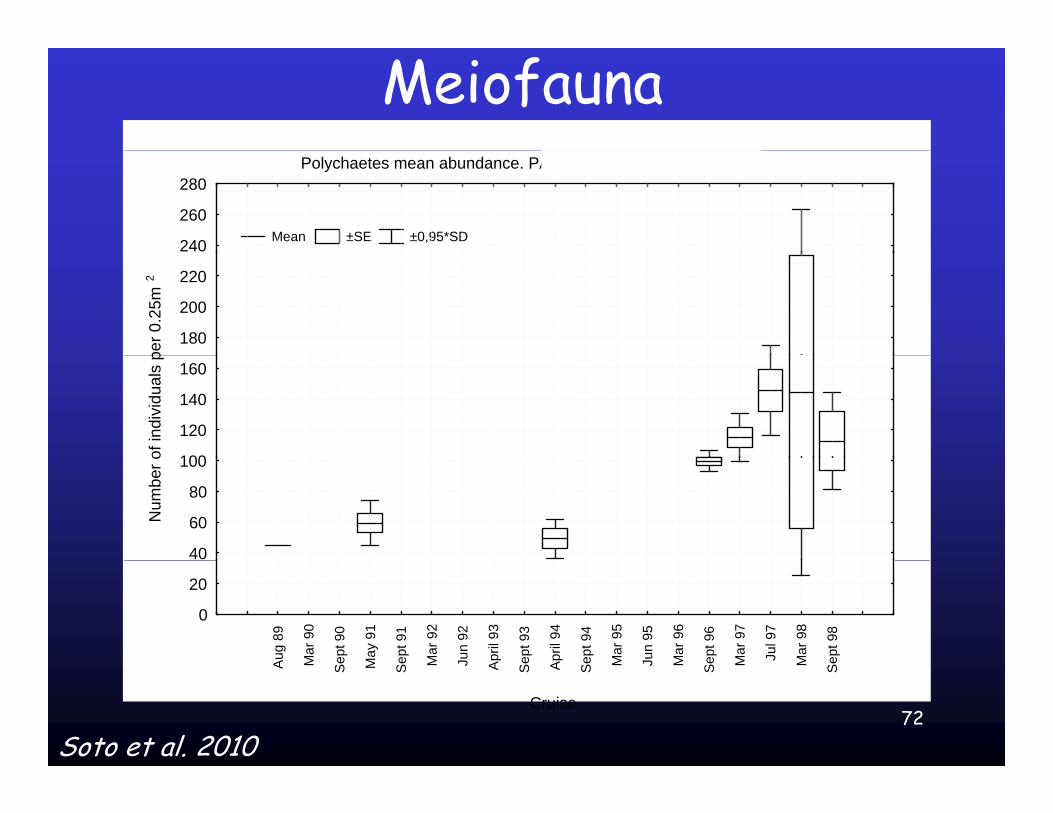
MeiofaunaPolychaetes mean abundance. PAP time series 1989-1998
240
260
280
Mean ±SE ±0,95*SD
180
200
220
per 0
.25m
2
100
120
140
160
of in
divi
dual
s p
40
60
80
100
Num
ber o
Aug
89
Mar
90
ept 9
0
May
91
ept 9
1
Mar
92
Jun
92
Apr
il 93
ept 9
3
Apr
il 94
ept 9
4
Mar
95
Jun
95
Mar
96
ept 9
6
Mar
97
Jul 9
7
Mar
98
ept 9
8
0
20
72
A M Se M Se M J A Se A Se M J M Se M M Se
Cruise
Soto et al. 2010

Foraminifera
73Gooday et al. 2010
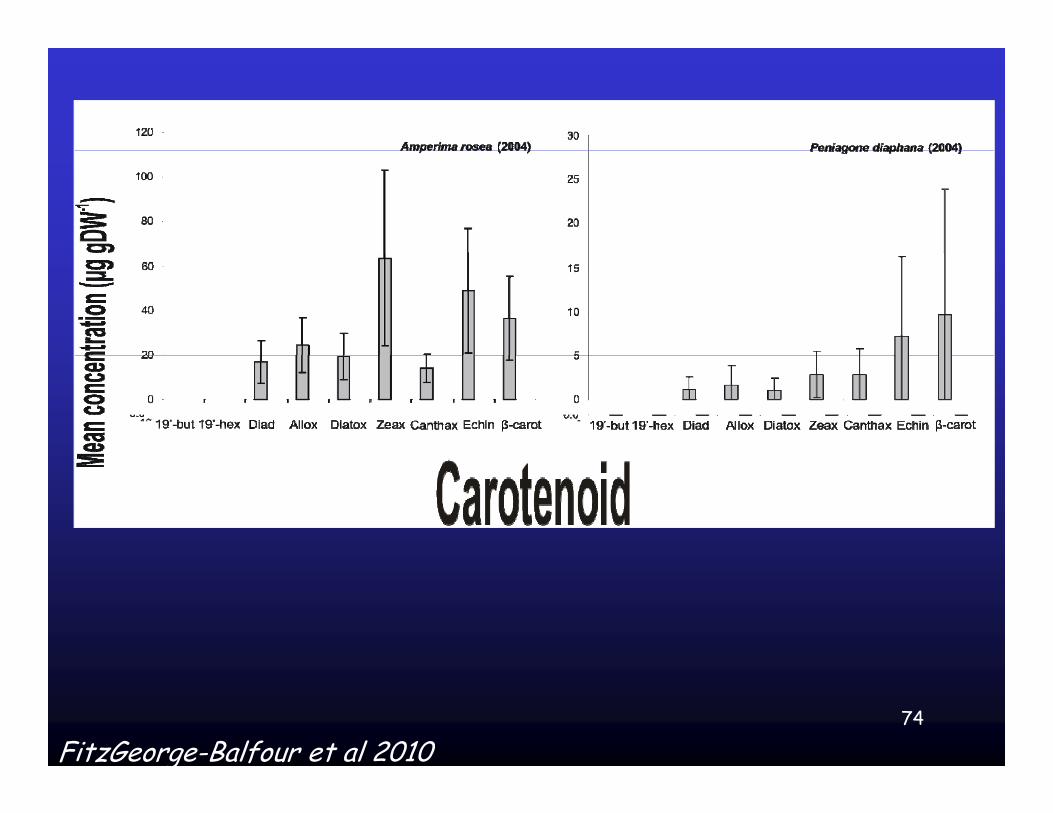
74
FitzGeorge-Balfour et al 2010
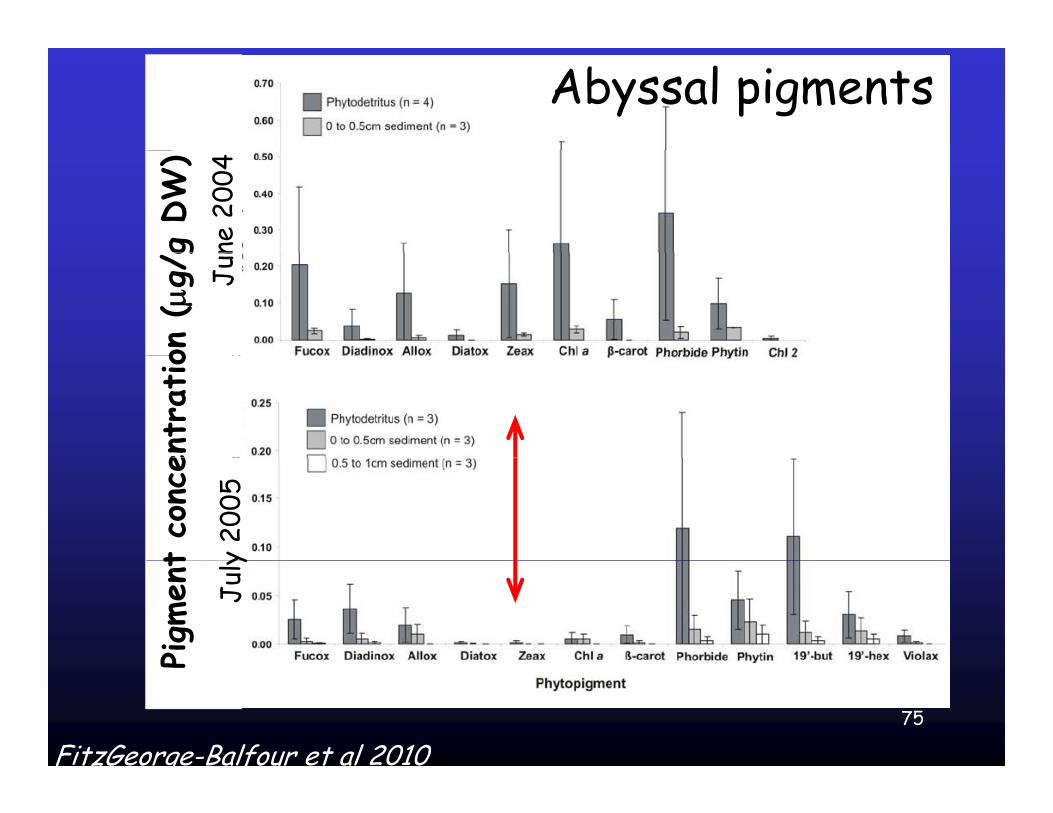
Abyssal pigments
4g DW
)ne
200
4Ju
ne 2
004
on (g
/g Jun
Jen
trat
io20
05t
conc
ey
2005
July
2Pigm
ent
July
75
P
FitzGeorge-Balfour et al 2010
76
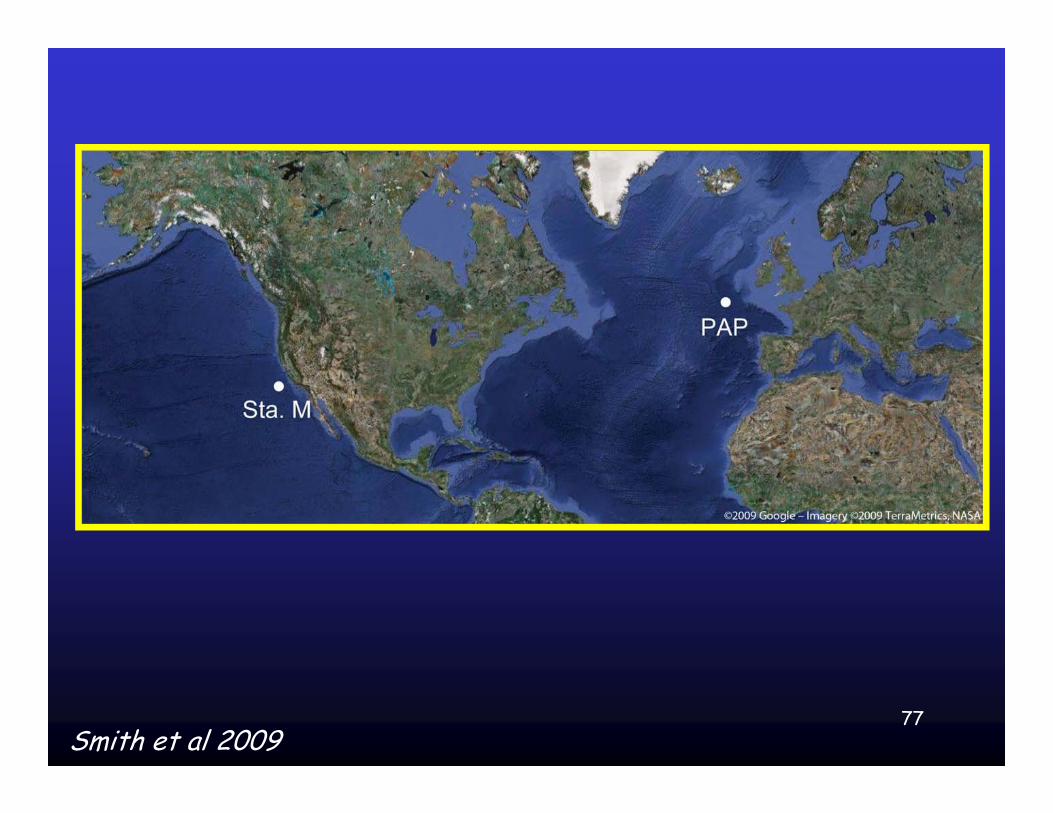
77Smith et al 2009
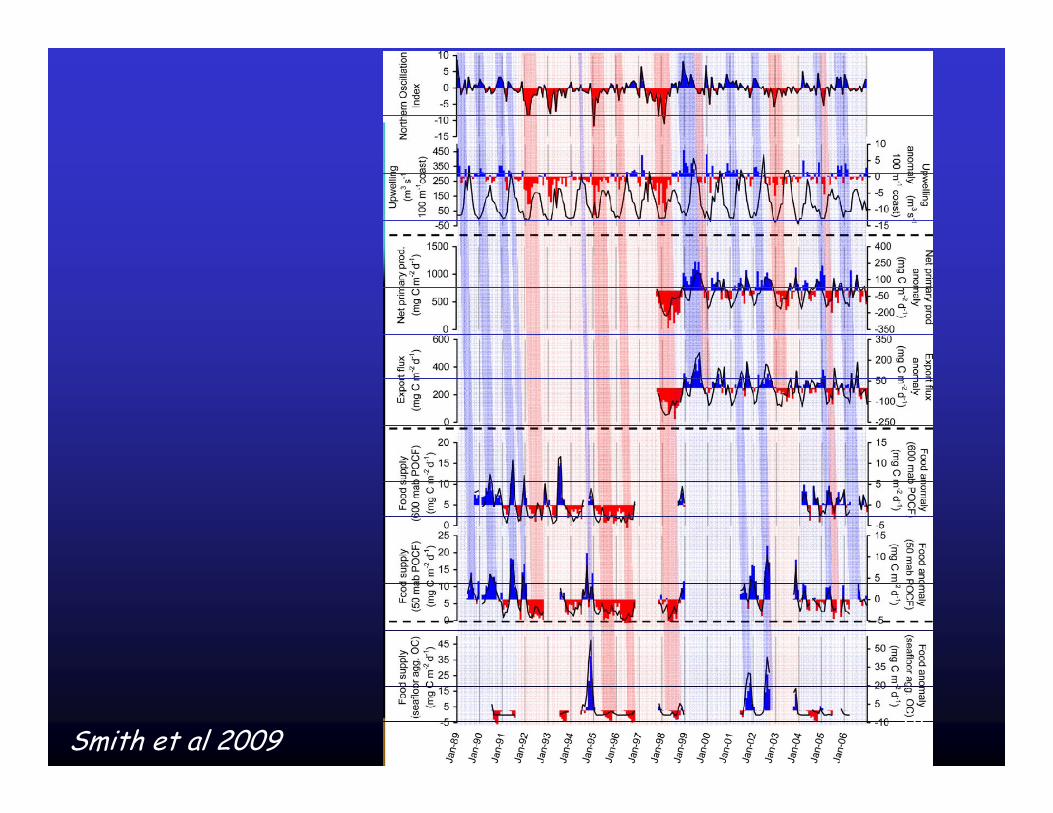
78Smith et al 2009
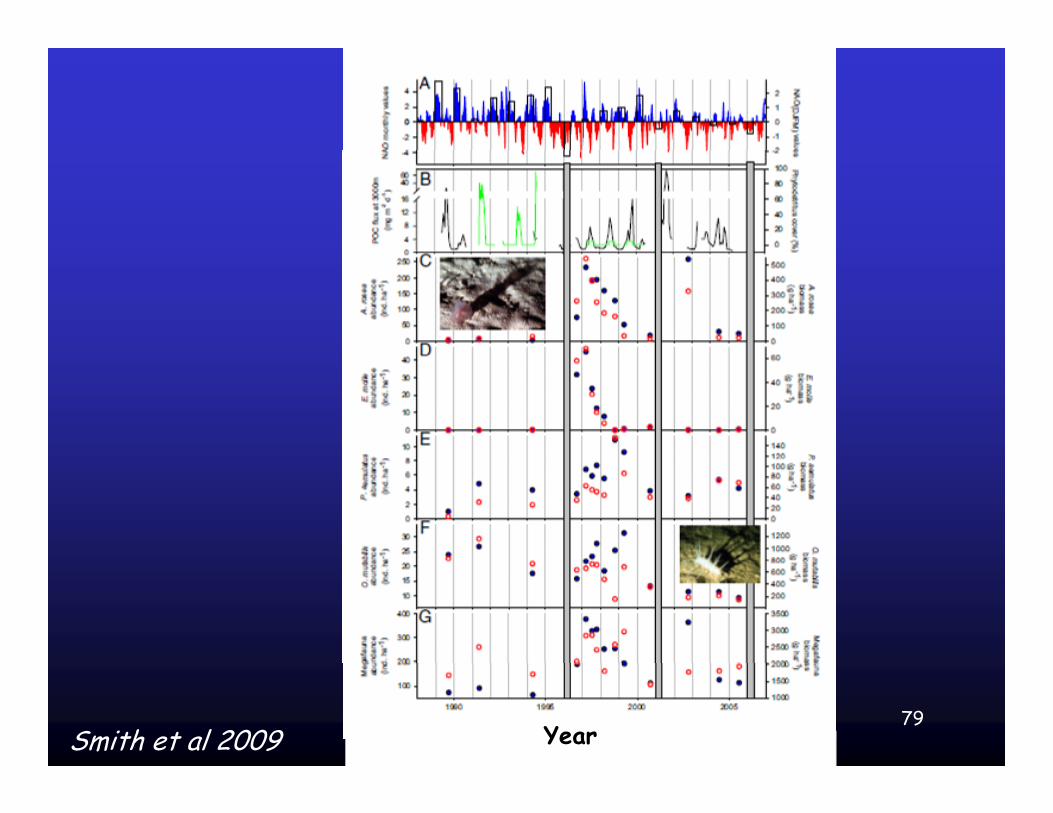
79Smith et al 2009 Year
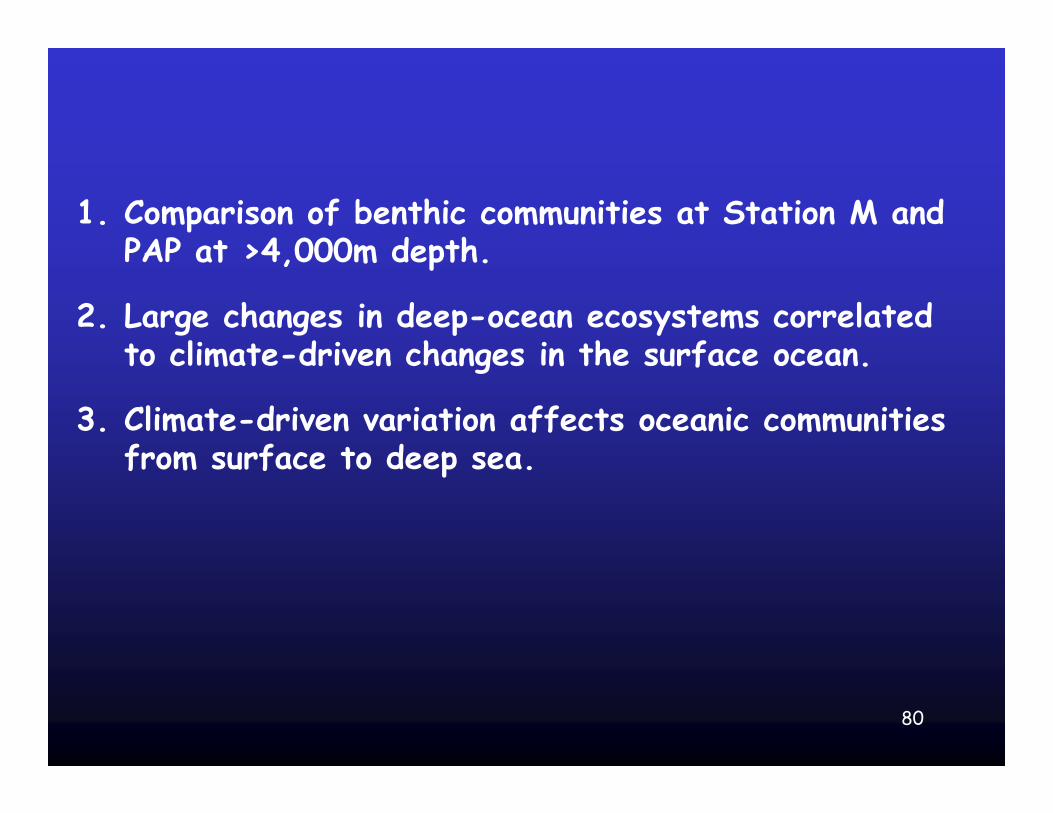
1. Comparison of benthic communities at Station M and PAP at >4 000m depthPAP at >4,000m depth.
2. Large changes in deep-ocean ecosystems correlated to climate-driven changes in the surface oceanto climate-driven changes in the surface ocean.
3. Climate-driven variation affects oceanic communities from surface to deep seafrom surface to deep sea.
80

Is the community ready for the challenge?
81
82
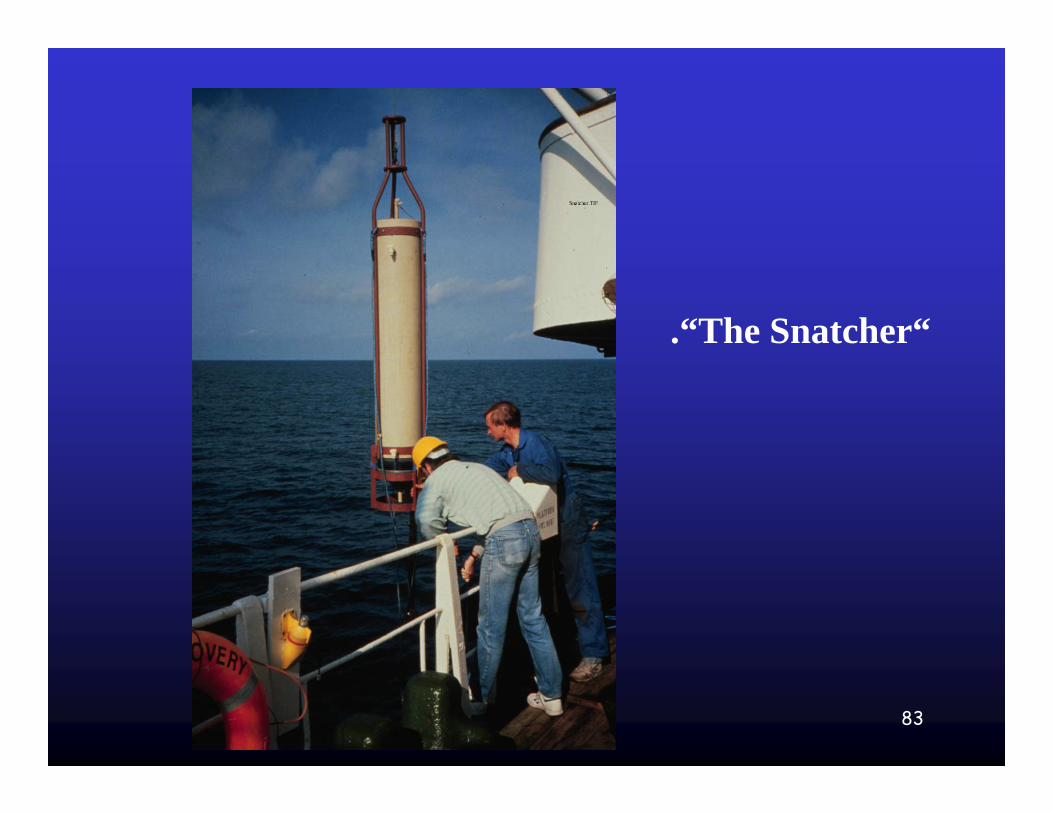
.“The Snatcher“
83
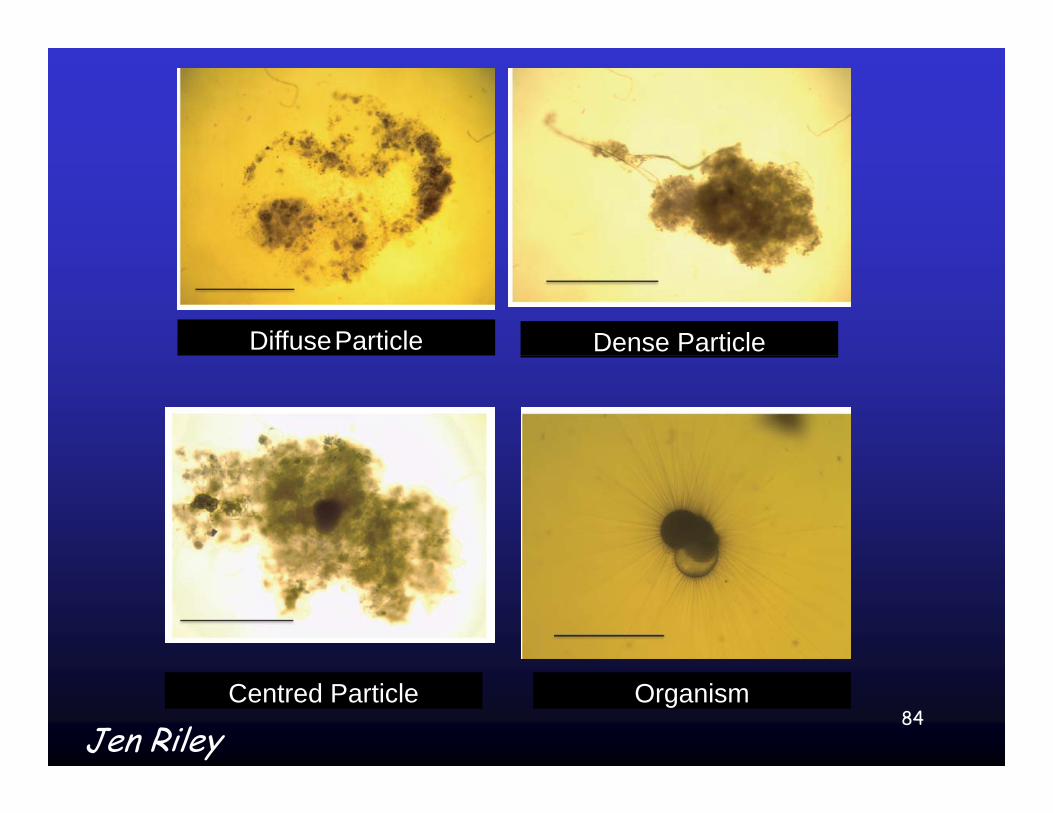
DiffuseParticle Dense Particle
84Centred Particle Organism
Jen Riley
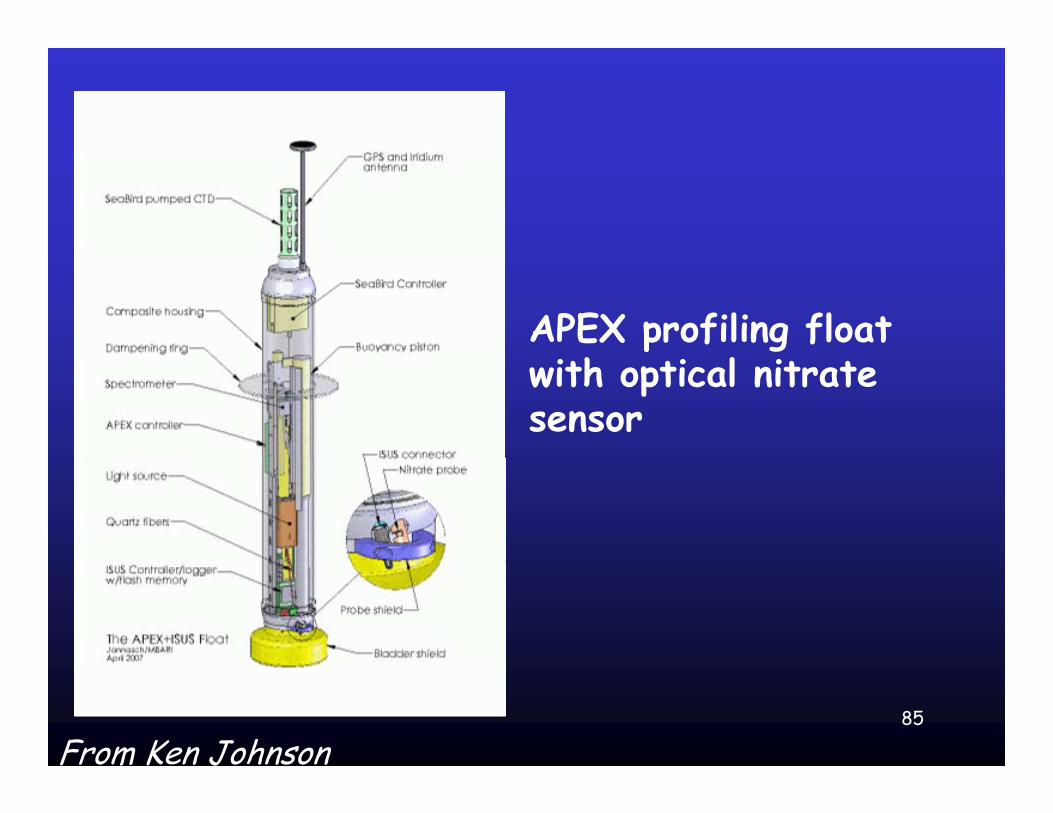
APEX profiling float with optical nitrate sensor
85
From Ken Johnson
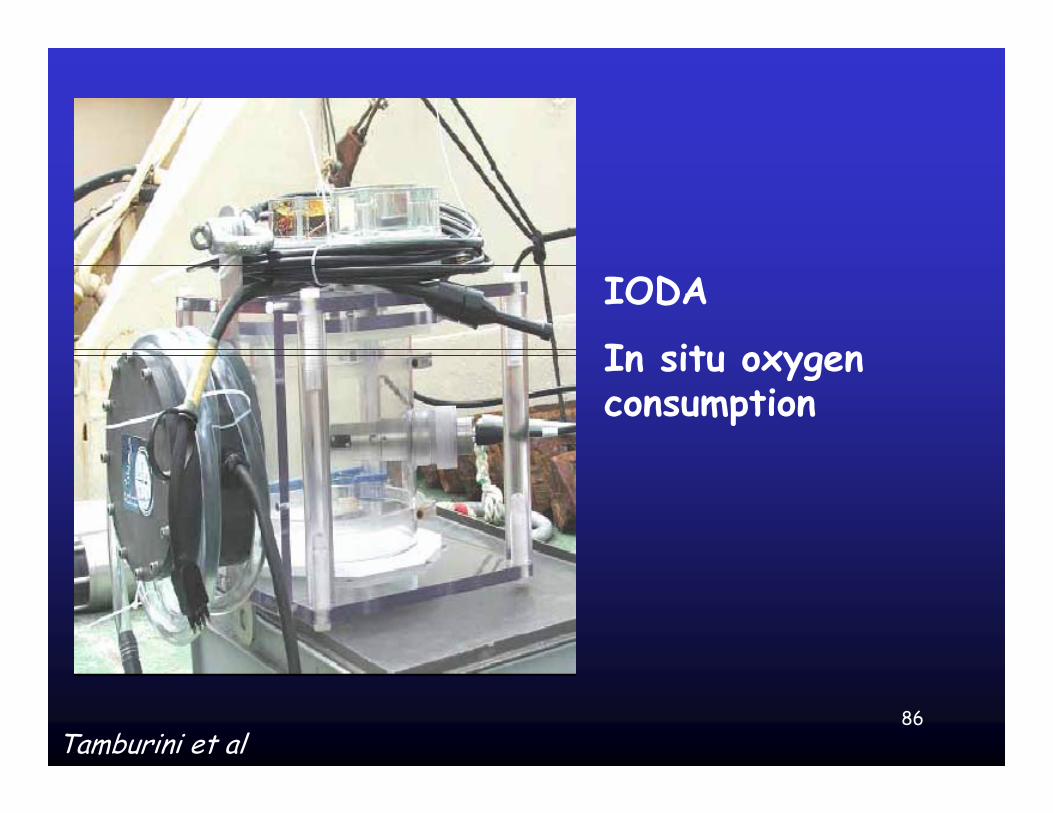
IODA
In situ oxygen In situ oxygen consumption
86Tamburini et al
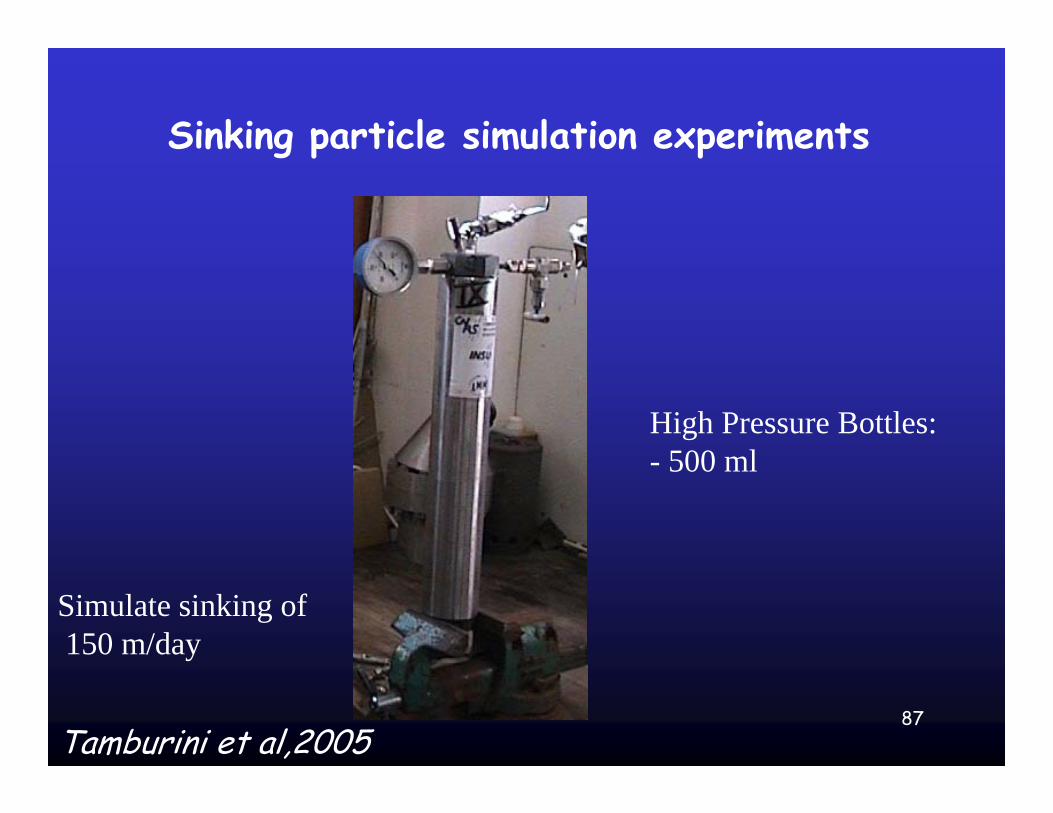
Sinking particle simulation experimentsg p p
High Pressure Bottles:500 ml- 500 ml
Simulate sinking of150 m/day
87Tamburini et al,2005
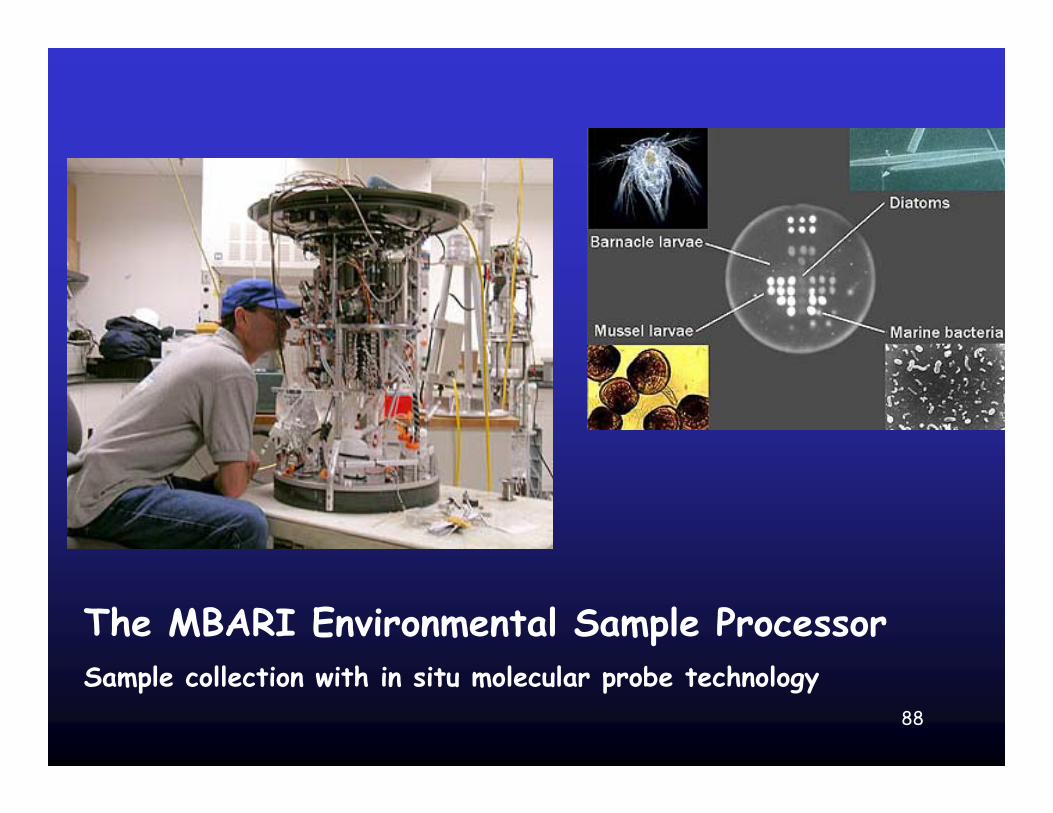
The MBARI Environmental Sample Processor
88
Sample collection with in situ molecular probe technology
th (m
)
0
100
200
238U234Th oo
ooo
o
o
Sink
ing
ScavengingDecay
Def
icit
Surp
lus
89234Th concentration
(dpm/l)
1 2 3 4 5 6
Dep
t
300
400
500
90