Embed Size (px)
Citation preview
Data Mining cs-8003 Page 1
Name of Faculty: Prof.Puneet Nema
Designation: Assistant Professor
Department: CSE
Subject: Data Mining
Unit: I
Topic: Introduction to Data Warehousing,Needs for developing data
warehousing .Data Warehouse systems and its Components,Design of Data
Warehousing ,Dimension and Measure,Data Mart ,Conceptual Modelling of
Data Warehousing: Star Schema,Snowflake schema Fact
Constellations.Multidimensional Data Model and Aggregates.
LAKSHMI NARAIN COLLEGE OF TECHNOLOGY,
BHOPAL Department of Computer Science & Engineering
Data Mining cs-8003 Page 2
RAJIV GANDHI PROUDYOGIKI VISHWAVIDYALAYA, BHOPAL
New Scheme Based On AICTE Flexible Curricula
Computer Science and Engineering, VIII-
Semester
CS-8003 Data Mining
UNIT-I
Topic Covered: Data Mining
Introduction to Data Warehousing,Needs for developing data warehousing .Data
Warehouse systems and its Components,Design of Data Warehousing
,Dimension and Measure,Data Mart ,Conceptual Modelling of Data
Warehousing: Star Schema,Snowflake schema Fact
Constellations.Multidimensional Data Model and Aggregates.
What Is a Data Warehouse
A data warehouse is a database designed to enable business intelligence activities: it exists to help users
understand and enhance their organization's performance. It is designed for query and analysis rather than for
transaction processing, and usually contains historical data derived from transaction data, but can include
data from other sources. Data warehouses separate analysis workload from transaction workload and enable
an organization to consolidate data from several sources. This helps in:
Maintaining historical records
Analyzing the data to gain a better understanding of the business and to improve the business
In addition to a relational database, a data warehouse environment can include an extraction, transportation,
transformation, and loading (ETL) solution, statistical analysis, reporting, data mining capabilities, client
analysis tools, and other applications that manage the process of gathering data, transforming it into useful,
actionable information, and delivering it to business users.
To achieve the goal of enhanced business intelligence, the data warehouse works with data collected from
multiple sources. The source data may come from internally developed systems, purchased applications,
third-party data syndicators and other sources. It may involve transactions, production, marketing, human
resources and more. In today's world of big data, the data may be many billions of individual clicks on web
sites or the massive data streams from sensors built into complex machinery.
LAKSHMI NARAIN COLLEGE OF TECHNOLOGY,
BHOPAL Department of Computer Science & Engineering
Data Mining cs-8003 Page 3
Data warehouses are distinct from online transaction processing (OLTP) systems. With a data warehouse you
separate analysis workload from transaction workload. Thus data warehouses are very much read-oriented
systems. They have a far higher amount of data reading versus writing and updating. This enables far better
analytical performance and avoids impacting your transaction systems. A data warehouse system can be
optimized to consolidate data from many sources to achieve a key goal: it becomes your organization's
"single source of truth". There is great value in having a consistent source of data that all users can look to; it
prevents many disputes and enhances decision-making efficiency.
A data warehouse usually stores many months or years of data to support historical analysis. The data in a
data warehouse is typically loaded through an extraction, transformation, and loading (ETL) process from
multiple data sources. Modern data warehouses are moving toward an extract, load, transformation (ELT)
architecture in which all or most data transformation is performed on the database that hosts the data
warehouse. It is important to note that defining the ETL process is a very large part of the design effort of a
data warehouse. Similarly, the speed and reliability of ETL operations are the foundation of the data
warehouse once it is up and running.
Users of the data warehouse perform data analyses that are often time-related. Examples include
consolidation of last year's sales figures, inventory analysis, and profit by product and by customer. But time-
focused or not, users want to "slice and dice" their data however they see fit and a well-designed data
warehouse will be flexible enough to meet those demands. Users will sometimes need highly aggregated
data, and other times they will need to drill down to details. More sophisticated analyses include trend
analyses and data mining, which use existing data to forecast trends or predict futures. The data warehouse
acts as the underlying engine used by middleware business intelligence environments that serve reports,
dashboards and other interfaces to end users.
Although the discussion above has focused on the term "data warehouse", there are two other important terms
that need to be mentioned. These are the data mart and the operation data store (ODS).
A data mart serves the same role as a data warehouse, but it is intentionally limited in scope. It may serve one
particular department or line of business. The advantage of a data mart versus a data warehouse is that it can
be created much faster due to its limited coverage. However, data marts also create problems with
inconsistency. It takes tight discipline to keep data and calculation definitions consistent across data marts.
This problem has been widely recognized, so data marts exist in two styles. Independent data marts are those
which are fed directly from source data. They can turn into islands of inconsistent information. Dependent
data marts are fed from an existing data warehouse. Dependent data marts can avoid the problems of
inconsistency, but they require that an enterprise-level data warehouse already exist.
Operational data stores exist to support daily operations. The ODS data is cleaned and validated, but it is not
historically deep: it may be just the data for the current day. Rather than support the historically rich queries
that a data warehouse can handle, the ODS gives data warehouses a place to get access to the most current
data, which has not yet been loaded into the data warehouse. The ODS may also be used as a source to load
the data warehouse. As data warehousing loading techniques have become more advanced, data warehouses
may have less need for ODS as a source for loading data. Instead, constant trickle-feed systems can load the
data warehouse in near real time.
Who needs Data warehouse?
Data warehouse is needed for all types of users like:
Decision makers who rely on mass amount of data
Users who use customized, complex processes to obtain information from multiple data
sources.
It is also used by the people who want simple technology to access the data
Data Mining cs-8003 Page 4
It also essential for those people who want a systematic approach for making decisions.
If the user wants fast performance on a huge amount of data which is a necessity for reports,
grids or charts, then Data warehouse proves useful.
Data warehouse is a first step If you want to discover 'hidden patterns' of data-flows and
groupings.
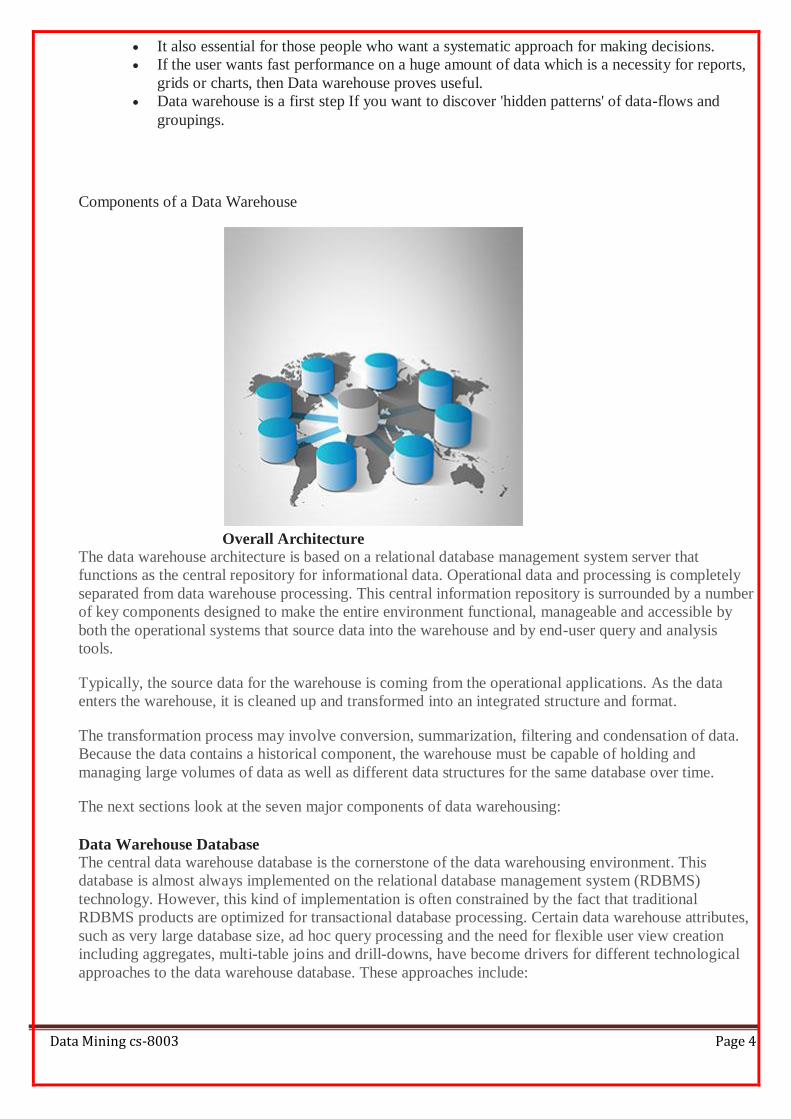
Components of a Data Warehouse
Overall Architecture The data warehouse architecture is based on a relational database management system server that
functions as the central repository for informational data. Operational data and processing is completely
separated from data warehouse processing. This central information repository is surrounded by a number
of key components designed to make the entire environment functional, manageable and accessible by
both the operational systems that source data into the warehouse and by end-user query and analysis
tools.
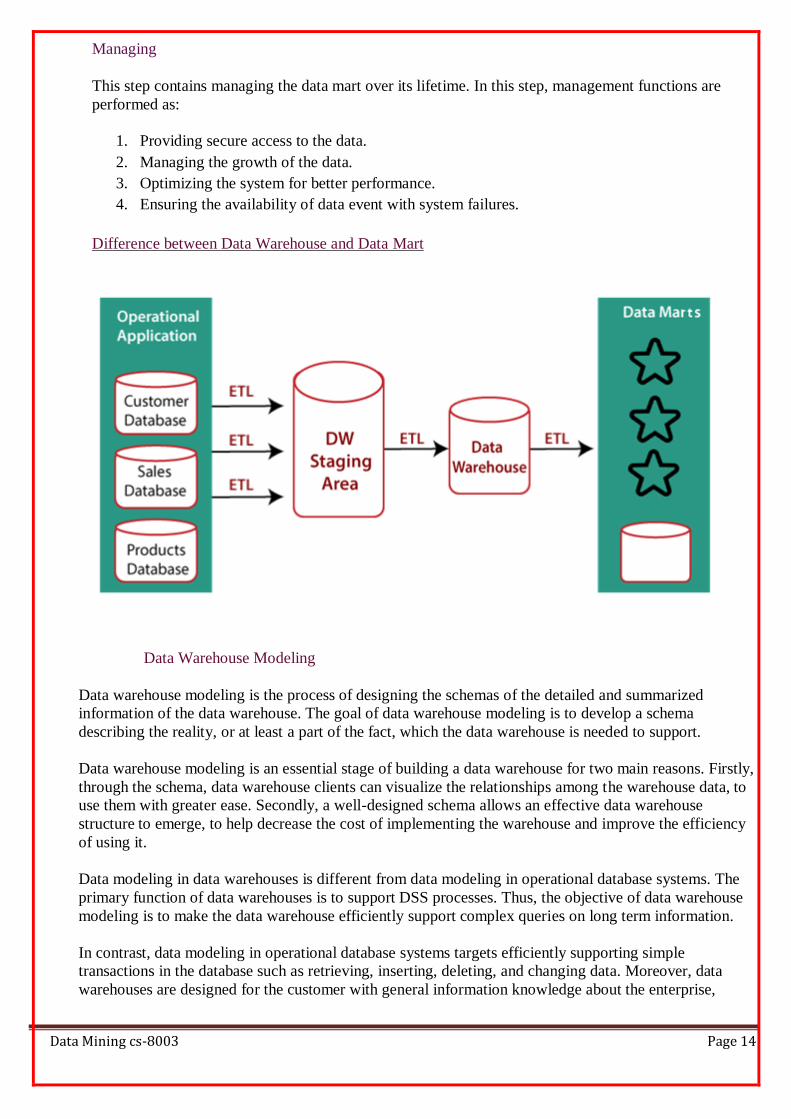
Typically, the source data for the warehouse is coming from the operational applications. As the data
enters the warehouse, it is cleaned up and transformed into an integrated structure and format.
The transformation process may involve conversion, summarization, filtering and condensation of data.
Because the data contains a historical component, the warehouse must be capable of holding and
managing large volumes of data as well as different data structures for the same database over time.
The next sections look at the seven major components of data warehousing:
Data Warehouse Database The central data warehouse database is the cornerstone of the data warehousing environment. This
database is almost always implemented on the relational database management system (RDBMS)
technology. However, this kind of implementation is often constrained by the fact that traditional
RDBMS products are optimized for transactional database processing. Certain data warehouse attributes,
such as very large database size, ad hoc query processing and the need for flexible user view creation
including aggregates, multi-table joins and drill-downs, have become drivers for different technological
approaches to the data warehouse database. These approaches include:
Data Mining cs-8003 Page 5
Parallel relational database designs for scalability that include shared-memory, shared disk, or shared-
nothing models implemented on various multiprocessor configurations (symmetric
multiprocessors or SMP, massively parallel processors or MPP, and/or clusters of uni- or
multiprocessors).
An innovative approach to speed up a traditional RDBMS by using new index structures to bypass
relational table scans.
Multidimensional databases (MDDBs) that are based on proprietary database technology; conversely, a
dimensional data model can be implemented using a familiar RDBMS. Multi-dimensional databases
are designed to overcome any limitations placed on the warehouse by the nature of the relational data
model. MDDBs enable on-line analytical processing (OLAP) tools that architecturally belong to a
group of data warehousing components jointly categorized as the data query, reporting, analysis and
mining tools.
Sourcing, Acquisition, Cleanup and Transformation Tools A significant portion of the implementation effort is spent extracting data from operational systems and
putting it in a format suitable for informational applications that run off the data warehouse.
The data sourcing, cleanup, transformation and migration tools perform all of the conversions,
summarizations, key changes, structural changes and condensations needed to transform disparate data
into information that can be used by the decision support tool. They produce the programs and control
statements, including the COBOL programs, MVS job-control language (JCL), UNIX scripts, and SQL
data definition language (DDL) needed to move data into the data warehouse for multiple operational
systems. These tools also maintain the meta data. The functionality includes:
Removing unwanted data from operational databases
Converting to common data names and definitions
Establishing defaults for missing data
Accommodating source data definition changes
The data sourcing, cleanup, extract, transformation and migration tools have to deal with some significant
issues including:
Database heterogeneity. DBMSs are very different in data models, data access language, data
navigation, operations, concurrency, integrity, recovery etc.
Data heterogeneity. This is the difference in the way data is defined and used in different models –
homonyms, synonyms, unit compatibility (U.S. vs metric), different attributes for the same entity and
different ways of modeling the same fact.
These tools can save a considerable amount of time and effort. However, significant shortcomings do
exist. For example, many available tools are generally useful for simpler data extracts.
Frequently, customized extract routines need to be developed for the more complicated data extraction
procedures.
Meta data Meta data is data about data that describes the data warehouse. It is used for building, maintaining,
managing and using the data warehouse. Meta data can be classified into:
Technical meta data, which contains information about warehouse data for use by warehouse designers
and administrators when carrying out warehouse development and management tasks.
Business meta data, which contains information that gives users an easy-to-understand perspective of
the information stored in the data warehouse.
Equally important, meta data provides interactive access to users to help understand content and find
data. One of the issues dealing with meta data relates to the fact that many data extraction tool capabilities
to gather meta data remain fairly immature. Therefore, there is often the need to create a meta data
interface for users, which may involve some duplication of effort.
Data Mining cs-8003 Page 6
Meta data management is provided via a meta data repository and accompanying software. Meta data
repository management software, which typically runs on a workstation, can be used to map the source
data to the target database; generate code for data transformations; integrate and transform the data; and
control moving data to the warehouse.
As user’s interactions with the data warehouse increase, their approaches to reviewing the results of their
requests for information can be expected to evolve from relatively simple manual analysis for trends and
exceptions to agent-driven initiation of the analysis based on user-defined thresholds. The definition of
these thresholds, configuration parameters for the software agents using them, and the information
directory indicating where the appropriate sources for the information can be found are all stored in the
meta data repository as well.
Access Tools The principal purpose of data warehousing is to provide information to business users for strategic
decision-making. These users interact with the data warehouse using front-end tools. Many of these tools
require an information specialist, although many end users develop expertise in the tools. Tools fall into
four main categories: query and reporting tools, application development tools, online analytical
processing tools, and data mining tools.
Query and Reporting tools can be divided into two groups: reporting tools and managed query tools.
Reporting tools can be further divided into production reporting tools and report writers.
Production reporting tools let companies generate regular operational reports or support high-volume
batch jobs such as calculating and printing paychecks. Report writers, on the other hand, are inexpensive
desktop tools designed for end-users.
Managed query tools shield end users from the complexities of SQL and database structures by inserting
a metalayer between users and the database. These tools are designed for easy-to-use, point-and-click
operations that either accept SQL or generate SQL database queries.
Often, the analytical needs of the data warehouse user community exceed the built-in capabilities of
query and reporting tools. In these cases, organizations will often rely on the tried-and-true approach of
in-house application development using graphical development environments such as PowerBuilder,
Visual Basic and Forte. These application development platforms integrate well with popular OLAP tools
and access all major database systems including Oracle, Sybase, and Informix.
OLAP tools are based on the concepts of dimensional data models and corresponding databases, and
allow users to analyze the data using elaborate, multidimensional views. Typical business applications
include product performance and profitability, effectiveness of a sales program or marketing campaign,
sales forecasting and capacity planning. These tools assume that the data is organized in a
multidimensional model.
A critical success factor for any business today is the ability to use information effectively. Data mining
is the process of discovering meaningful new correlations, patterns and trends by digging into large
amounts of data stored in the warehouse using artificial intelligence, statistical and mathematical
techniques.
Data Marts The concept of a data mart is causing a lot of excitement and attracts much attention in the data
warehouse industry. Mostly, data marts are presented as an alternative to a data warehouse that takes
significantly less time and money to build. However, the term data mart means different things to
different people. A rigorous definition of this term is a data store that is subsidiary to a data warehouse of
integrated data. The data mart is directed at a partition of data (often called a subject area) that is created
for the use of a dedicated group of users. A data mart might, in fact, be a set of denormalized,
Data Mining cs-8003 Page 7
summarized, or aggregated data. Sometimes, such a set could be placed on the data warehouse rather than
a physically separate store of data. In most instances, however, the data mart is a physically separate store
of data and is resident on separate database server, often a local area network serving a dedicated user
group. Sometimes the data mart simply comprises relational OLAP technology which creates highly
denormalized dimensional model (e.g., star schema) implemented on a relational database. The resulting
hypercubes of data are used for analysis by groups of users with a common interest in a limited portion of
the database.
These types of data marts, called dependent data marts because their data is sourced from the data
warehouse, have a high value because no matter how they are deployed and how many different enabling
technologies are used, different users are all accessing the information views derived from the single
integrated version of the data.
Unfortunately, the misleading statements about the simplicity and low cost of data marts sometimes result
in organizations or vendors incorrectly positioning them as an alternative to the data warehouse. This
viewpoint defines independent data marts that in fact, represent fragmented point solutions to a range of
business problems in the enterprise. This type of implementation should be rarely deployed in the context
of an overall technology or applications architecture. Indeed, it is missing the ingredient that is at the
heart of the data warehousing concept — that of data integration. Each independent data mart makes its
own assumptions about how to consolidate the data, and the data across several data marts may not be
consistent.
Moreover, the concept of an independent data mart is dangerous — as soon as the first data mart is
created, other organizations, groups, and subject areas within the enterprise embark on the task of
building their own data marts. As a result, you create an environment where multiple operational systems
feed multiple non-integrated data marts that are often overlapping in data content, job scheduling,
connectivity and management. In other words, you have transformed a complex many-to-one problem of
building a data warehouse from operational and external data sources to a many-to-many sourcing and
management nightmare.
Data Warehouse Administration and Management Data warehouses tend to be as much as 4 times as large as related operational databases, reaching
terabytes in size depending on how much history needs to be saved. They are not synchronized in real
time to the associated operational data but are updated as often as once a day if the application requires it.
In addition, almost all data warehouse products include gateways to transparently access multiple
enterprise data sources without having to rewrite applications to interpret and utilize the data.
Furthermore, in a heterogeneous data warehouse environment, the various databases reside on disparate
systems, thus requiring inter-networking tools. The need to manage this environment is obvious.
Managing data warehouses includes security and priority management; monitoring updates from the
multiple sources; data quality checks; managing and updating meta data; auditing and reporting data
warehouse usage and status; purging data; replicating, subsetting and distributing data; backup and
recovery and data warehouse storage management.
Information Delivery System The information delivery component is used to enable the process of subscribing for data warehouse
information and having it delivered to one or more destinations according to some user-specified
scheduling algorithm. In other words, the information delivery system distributes warehouse-stored data
and other information objects to other data warehouses and end-user products such as spreadsheets and
local databases. Delivery of information may be based on time of day or on the completion of an external
event. The rationale for the delivery systems component is based on the fact that once the data warehouse
is installed and operational, its users don’t have to be aware of its location and maintenance. All they
Data Mining cs-8003 Page 8
need is the report or an analytical view of data at a specific point in time. With the proliferation of the
Internet and the World Wide Web such a delivery system may leverage the convenience of the Internet by
delivering warehouse-enabled information to thousands of end-users via the ubiquitous world wide
network.
In fact, the Web is changing the data warehousing landscape since at the very high level the goals of both
the Web and data warehousing are the same: easy access to information. The value of data warehousing is
maximized when the right information gets into the hands of those individuals who need it, where they
need it and they need it most. However, many corporations have struggled with complex client/server
systems to give end users the access they need. The issues become even more difficult to resolve when
the users are physically remote from the data warehouse location. The Web removes a lot of these issues
by giving users universal and relatively inexpensive access to data. Couple this access with the ability to
deliver required information on demand and the result is a web-enabled information delivery system that
allows users dispersed across continents to perform a sophisticated business-critical analysis and to
engage in collective decision-making.
Data Warehouse Design
A data warehouse is a single data repository where a record from multiple data sources is integrated for
online business analytical processing (OLAP). This implies a data warehouse needs to meet the
requirements from all the business stages within the entire organization. Thus, data warehouse design is
a hugely complex, lengthy, and hence error-prone process. Furthermore, business analytical functions
change over time, which results in changes in the requirements for the systems. Therefore, data
warehouse and OLAP systems are dynamic, and the design process is continuous.
Data warehouse design takes a method different from view materialization in the industries. It sees data
warehouses as database systems with particular needs such as answering management related queries.
The target of the design becomes how the record from multiple data sources should be extracted,
transformed, and loaded (ETL) to be organized in a database as the data warehouse.
There are two approaches
1. "top-down" approach
2. "bottom-up" approach
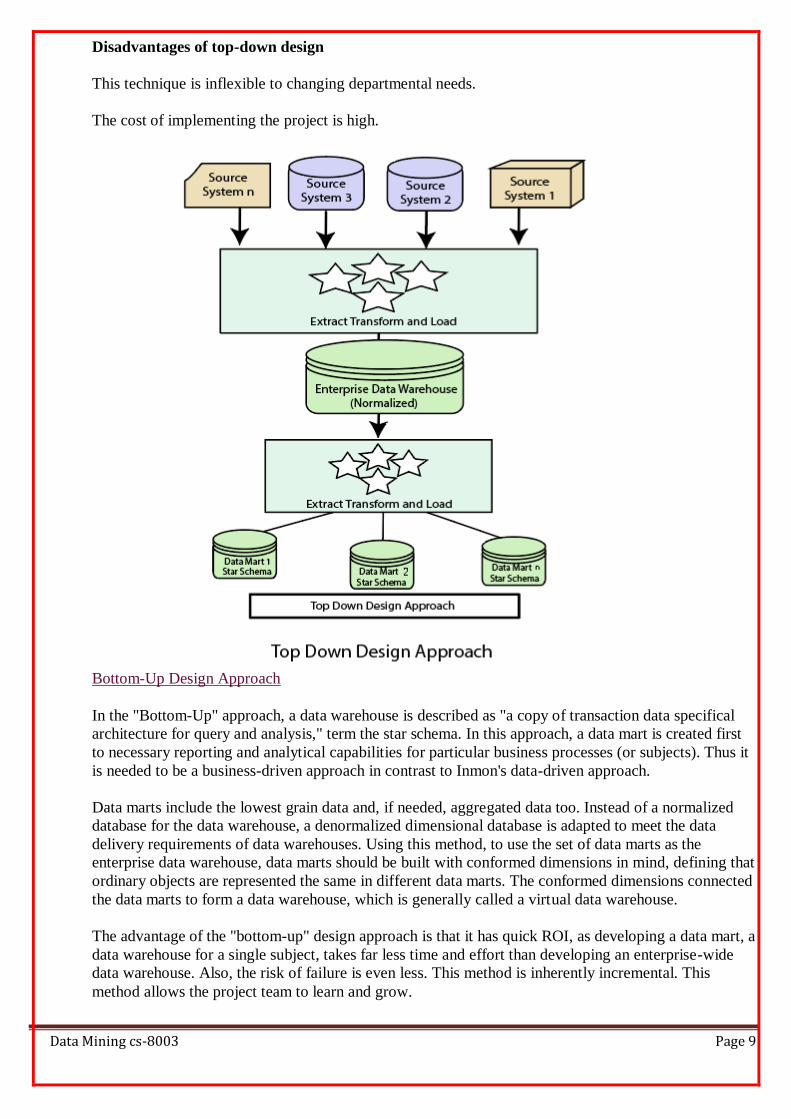
Top-down Design Approach
In the "Top-Down" design approach, a data warehouse is described as a subject-oriented, time-variant,
non-volatile and integrated data repository for the entire enterprise data from different sources are
validated, reformatted and saved in a normalized (up to 3NF) database as the data warehouse. The data
warehouse stores "atomic" information, the data at the lowest level of granularity, from where
dimensional data marts can be built by selecting the data required for specific business subjects or
particular departments. An approach is a data-driven approach as the information is gathered and
integrated first and then business requirements by subjects for building data marts are formulated. The
advantage of this method is which it supports a single integrated data source. Thus data marts built
from it will have consistency when they overlap.
Advantages of top-down design
Data Marts are loaded from the data warehouses.
Developing new data mart from the data warehouse is very easy.
Data Mining cs-8003 Page 9
Disadvantages of top-down design
This technique is inflexible to changing departmental needs.
The cost of implementing the project is high.
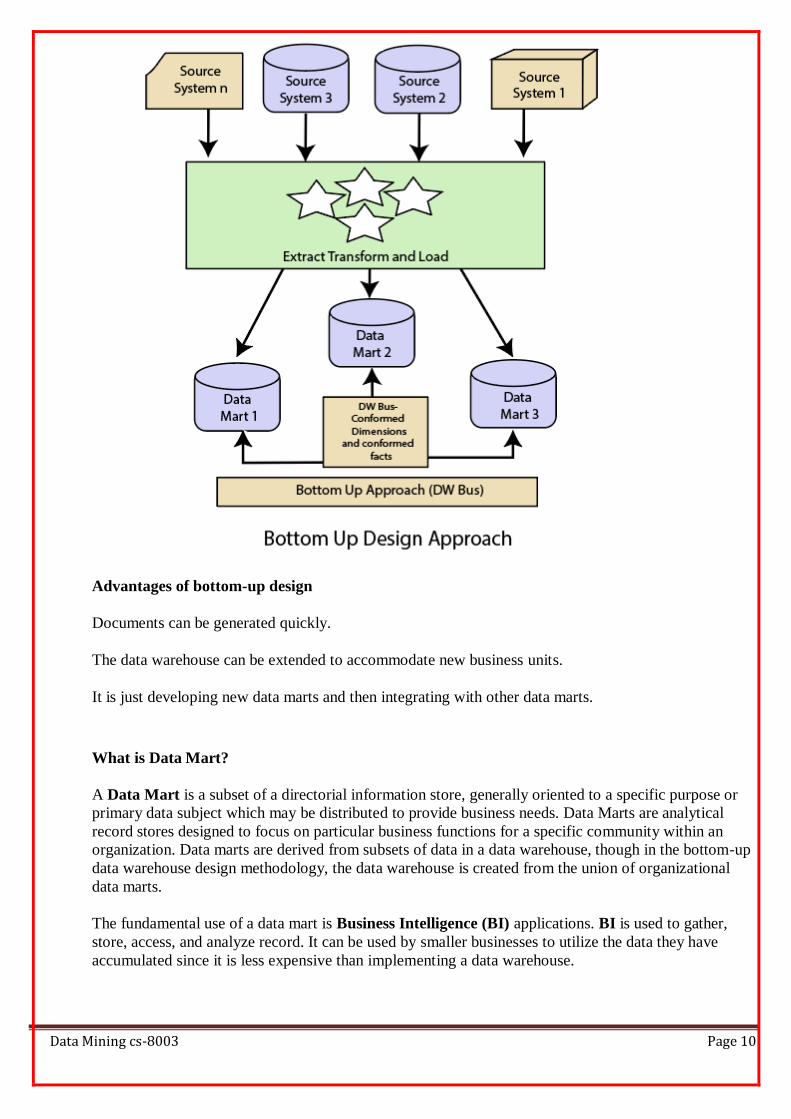
Bottom-Up Design Approach
In the "Bottom-Up" approach, a data warehouse is described as "a copy of transaction data specifical
architecture for query and analysis," term the star schema. In this approach, a data mart is created first
to necessary reporting and analytical capabilities for particular business processes (or subjects). Thus it
is needed to be a business-driven approach in contrast to Inmon's data-driven approach.
Data marts include the lowest grain data and, if needed, aggregated data too. Instead of a normalized
database for the data warehouse, a denormalized dimensional database is adapted to meet the data
delivery requirements of data warehouses. Using this method, to use the set of data marts as the
enterprise data warehouse, data marts should be built with conformed dimensions in mind, defining that
ordinary objects are represented the same in different data marts. The conformed dimensions connected
the data marts to form a data warehouse, which is generally called a virtual data warehouse.
The advantage of the "bottom-up" design approach is that it has quick ROI, as developing a data mart, a
data warehouse for a single subject, takes far less time and effort than developing an enterprise-wide
data warehouse. Also, the risk of failure is even less. This method is inherently incremental. This
method allows the project team to learn and grow.
Data Mining cs-8003 Page 10
Advantages of bottom-up design
Documents can be generated quickly.
The data warehouse can be extended to accommodate new business units.
It is just developing new data marts and then integrating with other data marts.
What is Data Mart?
A Data Mart is a subset of a directorial information store, generally oriented to a specific purpose or
primary data subject which may be distributed to provide business needs. Data Marts are analytical
record stores designed to focus on particular business functions for a specific community within an
organization. Data marts are derived from subsets of data in a data warehouse, though in the bottom-up
data warehouse design methodology, the data warehouse is created from the union of organizational
data marts.
The fundamental use of a data mart is Business Intelligence (BI) applications. BI is used to gather,
store, access, and analyze record. It can be used by smaller businesses to utilize the data they have
accumulated since it is less expensive than implementing a data warehouse.

Data Mining cs-8003 Page 11
Reasons for creating a data mart
o Creates collective data by a group of users
o Easy access to frequently needed data
o Ease of creation
o Improves end-user response time
o Lower cost than implementing a complete data warehouses
o Potential clients are more clearly defined than in a comprehensive data warehouse
o It contains only essential business data and is less cluttered.
Types of Data Marts
There are mainly two approaches to designing data marts. These approaches are
o Dependent Data Marts
o Independent Data Marts
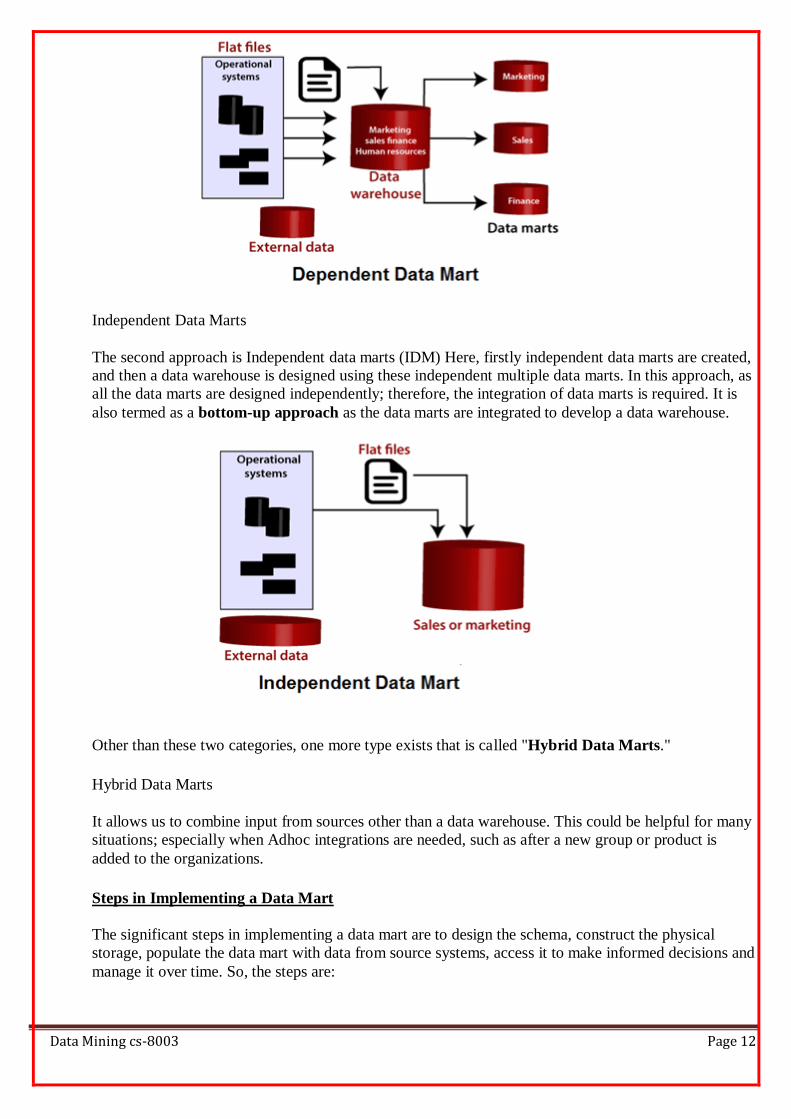
Dependent Data Marts
A dependent data marts is a logical subset of a physical subset of a higher data warehouse. According
to this technique, the data marts are treated as the subsets of a data warehouse. In this technique, firstly
a data warehouse is created from which further various data marts can be created. These data mart are
dependent on the data warehouse and extract the essential record from it. In this technique, as the data
warehouse creates the data mart; therefore, there is no need for data mart integration. It is also known
as a top-down approach.
Data Mining cs-8003 Page 12
Independent Data Marts
The second approach is Independent data marts (IDM) Here, firstly independent data marts are created,
and then a data warehouse is designed using these independent multiple data marts. In this approach, as
all the data marts are designed independently; therefore, the integration of data marts is required. It is
also termed as a bottom-up approach as the data marts are integrated to develop a data warehouse.
Other than these two categories, one more type exists that is called "Hybrid Data Marts."
Hybrid Data Marts
It allows us to combine input from sources other than a data warehouse. This could be helpful for many
situations; especially when Adhoc integrations are needed, such as after a new group or product is
added to the organizations.
Steps in Implementing a Data Mart
The significant steps in implementing a data mart are to design the schema, construct the physical
storage, populate the data mart with data from source systems, access it to make informed decisions and
manage it over time. So, the steps are:
Data Mining cs-8003 Page 13
Designing
The design step is the first in the data mart process. This phase covers all of the functions from
initiating the request for a data mart through gathering data about the requirements and developing the
logical and physical design of the data mart.
It involves the following tasks:
1. Gathering the business and technical requirements
2. Identifying data sources
3. Selecting the appropriate subset of data
4. Designing the logical and physical architecture of the data mart.
Constructing
This step contains creating the physical database and logical structures associated with the data mart to
provide fast and efficient access to the data.
It involves the following tasks:
1. Creating the physical database and logical structures such as tablespaces associated with the
data mart.
2. creating the schema objects such as tables and indexes describe in the design step.
3. Determining how best to set up the tables and access structures.
Populating
This step includes all of the tasks related to the getting data from the source, cleaning it up, modifying
it to the right format and level of detail, and moving it into the data mart.
It involves the following tasks:
1. Mapping data sources to target data sources
2. Extracting data
3. Cleansing and transforming the information.
4. Loading data into the data mart
5. Creating and storing metadata
Accessing
This step involves putting the data to use: querying the data, analyzing it, creating reports, charts and
graphs and publishing them.
It involves the following tasks:
1. Set up and intermediate layer (Meta Layer) for the front-end tool to use. This layer translates
database operations and objects names into business conditions so that the end-clients can
interact with the data mart using words which relates to the business functions.
2. Set up and manage database architectures like summarized tables which help queries agree
through the front-end tools execute rapidly and efficiently.
Data Mining cs-8003 Page 14
Managing
This step contains managing the data mart over its lifetime. In this step, management functions are
performed as:
1. Providing secure access to the data.
2. Managing the growth of the data.
3. Optimizing the system for better performance.
4. Ensuring the availability of data event with system failures.
Difference between Data Warehouse and Data Mart
Data Warehouse Modeling
Data warehouse modeling is the process of designing the schemas of the detailed and summarized
information of the data warehouse. The goal of data warehouse modeling is to develop a schema
describing the reality, or at least a part of the fact, which the data warehouse is needed to support.
Data warehouse modeling is an essential stage of building a data warehouse for two main reasons. Firstly,
through the schema, data warehouse clients can visualize the relationships among the warehouse data, to
use them with greater ease. Secondly, a well-designed schema allows an effective data warehouse
structure to emerge, to help decrease the cost of implementing the warehouse and improve the efficiency
of using it.
Data modeling in data warehouses is different from data modeling in operational database systems. The
primary function of data warehouses is to support DSS processes. Thus, the objective of data warehouse
modeling is to make the data warehouse efficiently support complex queries on long term information.
In contrast, data modeling in operational database systems targets efficiently supporting simple
transactions in the database such as retrieving, inserting, deleting, and changing data. Moreover, data
warehouses are designed for the customer with general information knowledge about the enterprise,
Data Mining cs-8003 Page 15
whereas operational database systems are more oriented toward use by software specialists for creating
distinct applications.
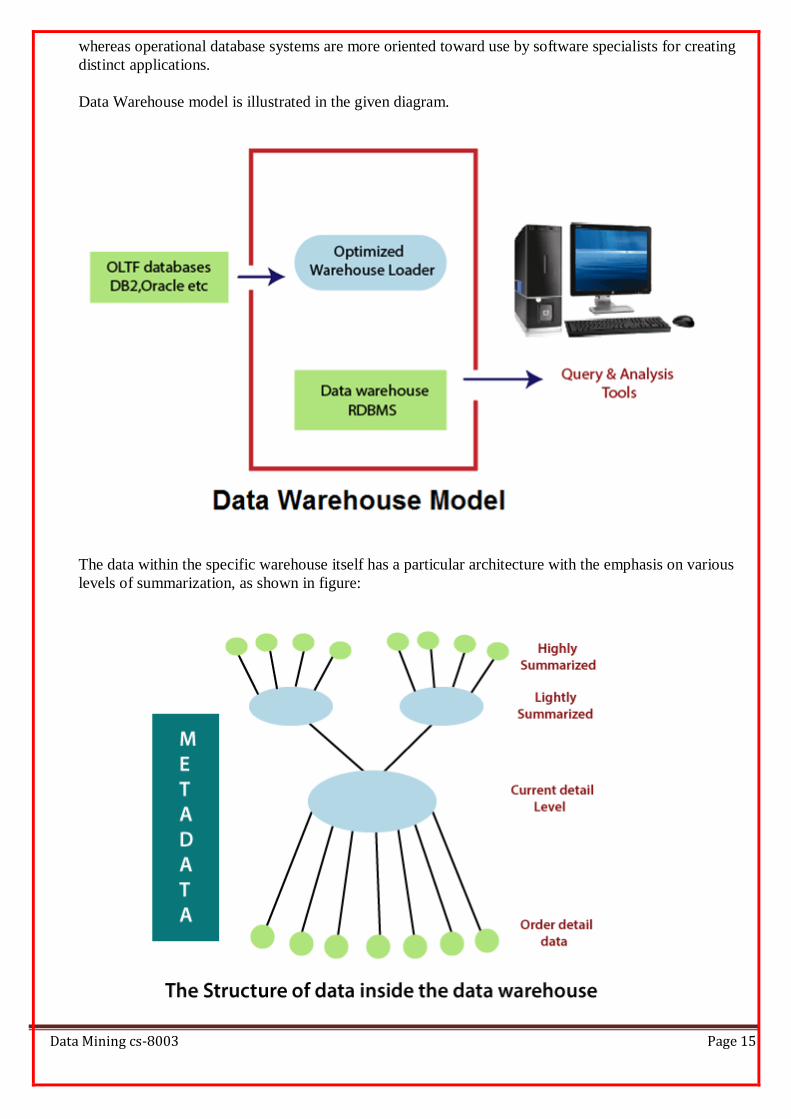
Data Warehouse model is illustrated in the given diagram.
The data within the specific warehouse itself has a particular architecture with the emphasis on various
levels of summarization, as shown in figure:
Data Mining cs-8003 Page 16
The current detail record is central in importance as it:
o Reflects the most current happenings, which are commonly the most stimulating.
o It is numerous as it is saved at the lowest method of the Granularity.
o It is always (almost) saved on disk storage, which is fast to access but expensive and difficult to
manage.
Older detail data is stored in some form of mass storage, and it is infrequently accessed and kept at a
level detail consistent with current detailed data.
Lightly summarized data is data extract from the low level of detail found at the current, detailed level
and usually is stored on disk storage. When building the data warehouse have to remember what unit of
time is summarization done over and also the components or what attributes the summarized data will
contain.
Highly summarized data is compact and directly available and can even be found outside the
warehouse.
Metadata is the final element of the data warehouses and is really of various dimensions in which it is
not the same as file drawn from the operational data, but it is used as:-
o A directory to help the DSS investigator locate the items of the data warehouse.
o A guide to the mapping of record as the data is changed from the operational data to the data
warehouse environment.
o A guide to the method used for summarization between the current, accurate data and the lightly
summarized information and the highly summarized data, etc.
Data Modeling Life Cycle
In this section, we define a data modeling life cycle. It is a straight forward process of transforming the
business requirements to fulfill the goals for storing, maintaining, and accessing the data within IT
systems. The result is a logical and physical data model for an enterprise data warehouse.
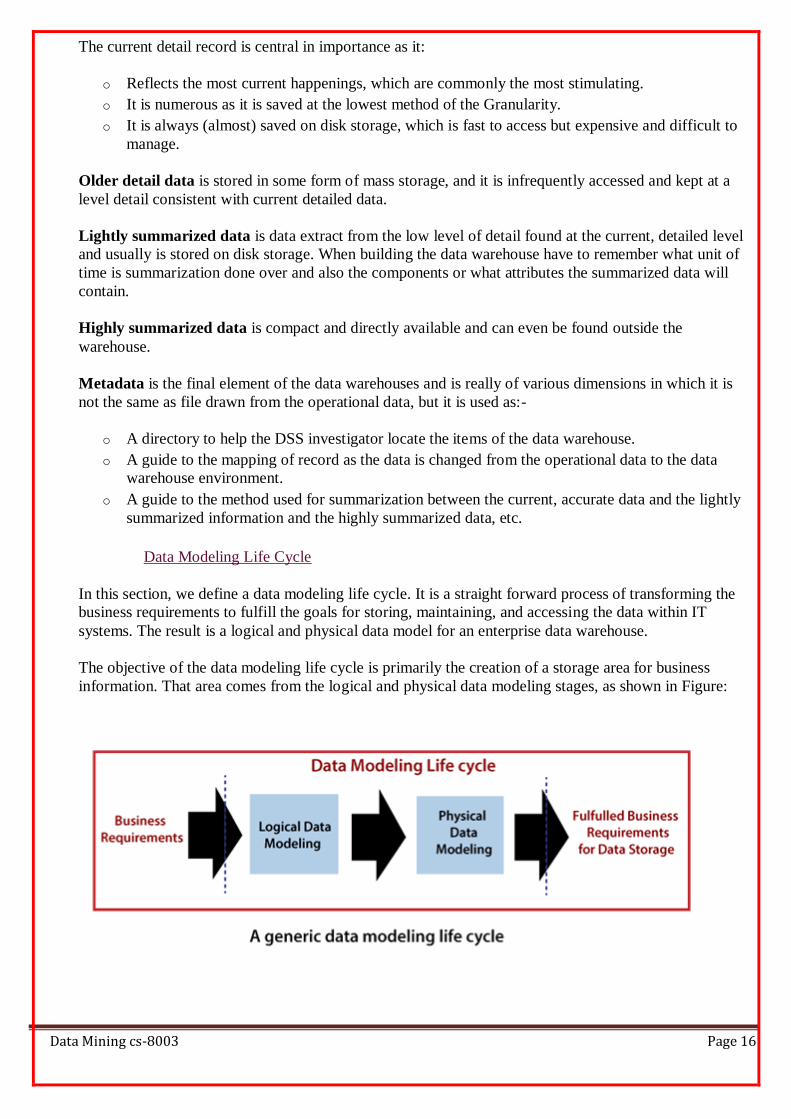
The objective of the data modeling life cycle is primarily the creation of a storage area for business
information. That area comes from the logical and physical data modeling stages, as shown in Figure:
Data Mining cs-8003 Page 17
Conceptual Data Model
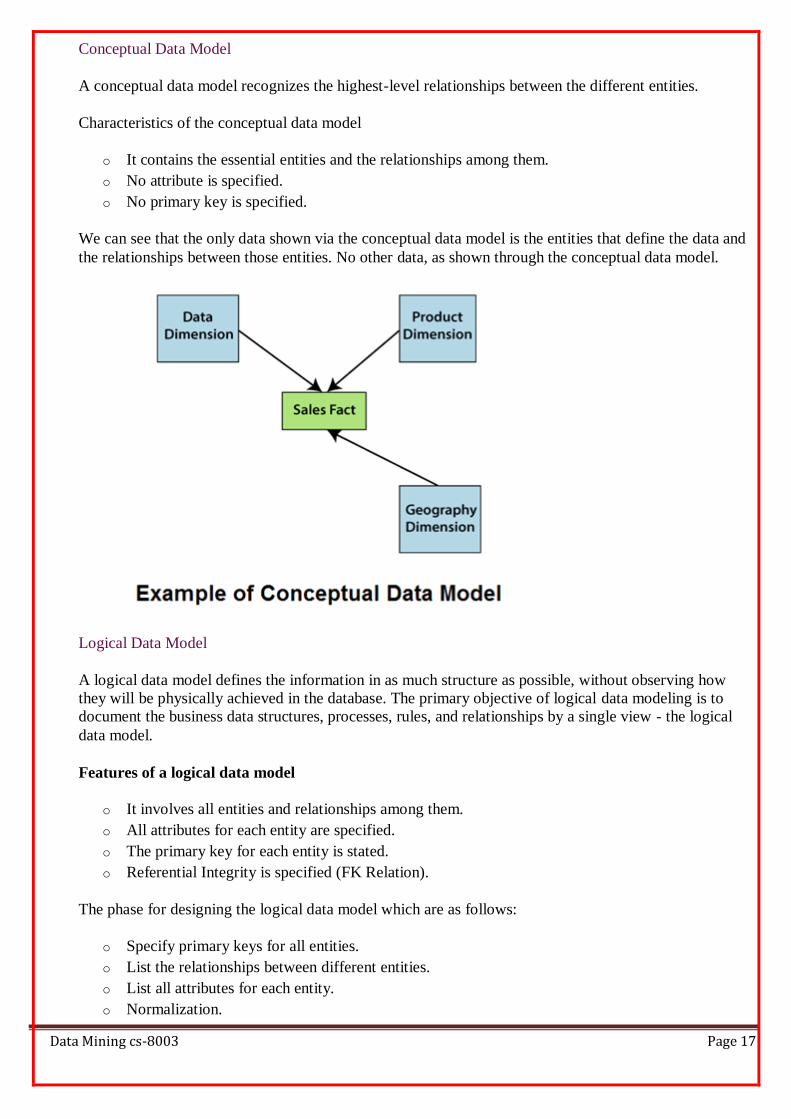
A conceptual data model recognizes the highest-level relationships between the different entities.
Characteristics of the conceptual data model
o It contains the essential entities and the relationships among them.
o No attribute is specified.
o No primary key is specified.
We can see that the only data shown via the conceptual data model is the entities that define the data and
the relationships between those entities. No other data, as shown through the conceptual data model.
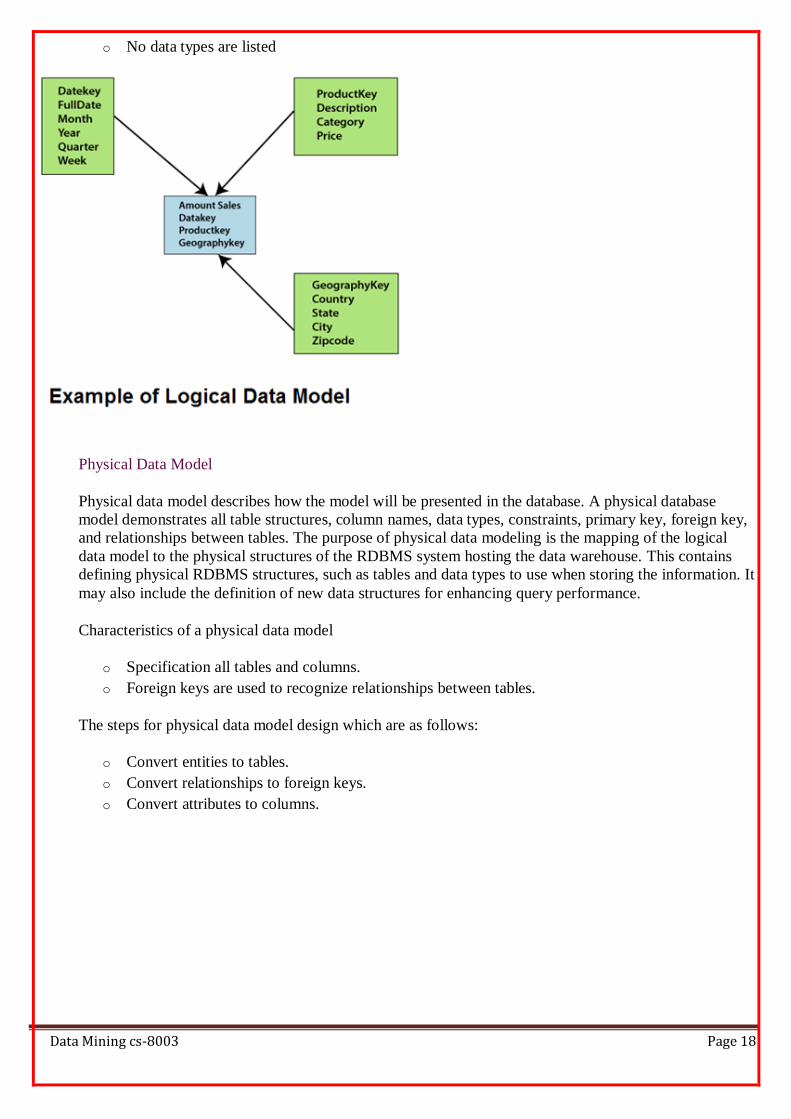
Logical Data Model
A logical data model defines the information in as much structure as possible, without observing how
they will be physically achieved in the database. The primary objective of logical data modeling is to
document the business data structures, processes, rules, and relationships by a single view - the logical
data model.
Features of a logical data model
o It involves all entities and relationships among them.
o All attributes for each entity are specified.
o The primary key for each entity is stated.
o Referential Integrity is specified (FK Relation).
The phase for designing the logical data model which are as follows:
o Specify primary keys for all entities.
o List the relationships between different entities.
o List all attributes for each entity.
o Normalization.
Data Mining cs-8003 Page 18
o No data types are listed
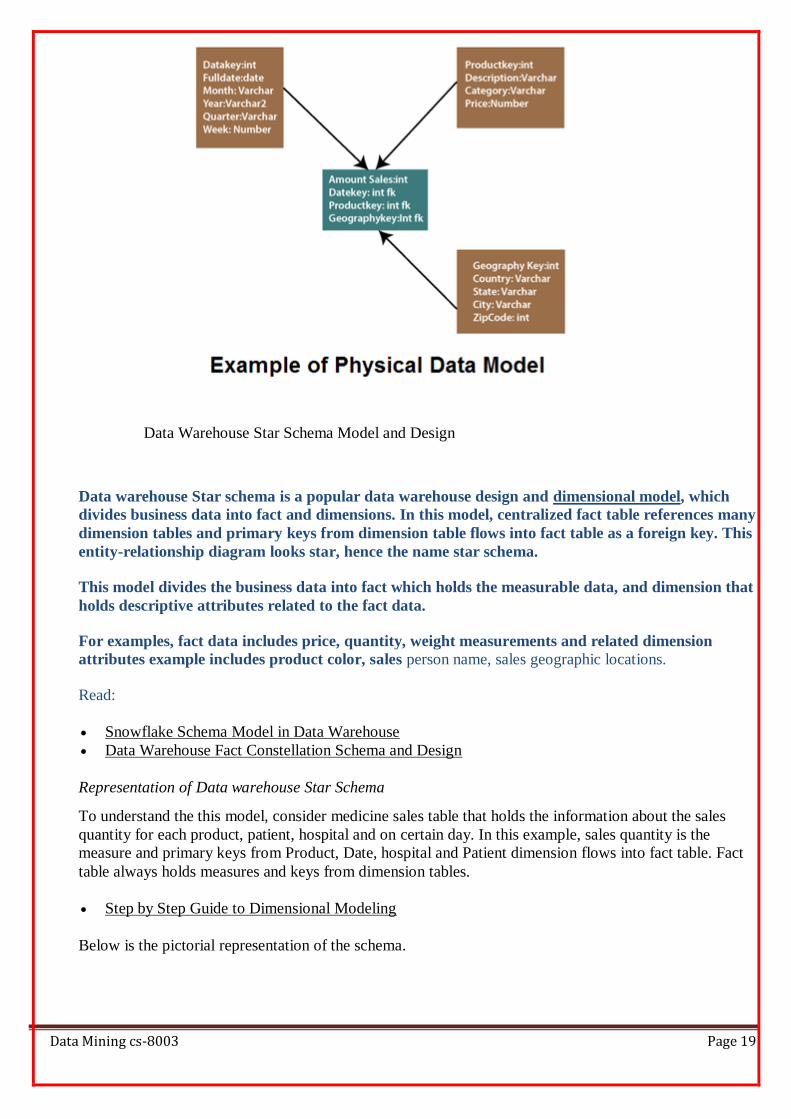
Physical Data Model
Physical data model describes how the model will be presented in the database. A physical database
model demonstrates all table structures, column names, data types, constraints, primary key, foreign key,
and relationships between tables. The purpose of physical data modeling is the mapping of the logical
data model to the physical structures of the RDBMS system hosting the data warehouse. This contains
defining physical RDBMS structures, such as tables and data types to use when storing the information. It
may also include the definition of new data structures for enhancing query performance.
Characteristics of a physical data model
o Specification all tables and columns.
o Foreign keys are used to recognize relationships between tables.
The steps for physical data model design which are as follows:
o Convert entities to tables.
o Convert relationships to foreign keys.
o Convert attributes to columns.
Data Mining cs-8003 Page 19
Data Warehouse Star Schema Model and Design
Data warehouse Star schema is a popular data warehouse design and dimensional model, which
divides business data into fact and dimensions. In this model, centralized fact table references many
dimension tables and primary keys from dimension table flows into fact table as a foreign key. This
entity-relationship diagram looks star, hence the name star schema.
This model divides the business data into fact which holds the measurable data, and dimension that
holds descriptive attributes related to the fact data.
For examples, fact data includes price, quantity, weight measurements and related dimension
attributes example includes product color, sales person name, sales geographic locations.
Read:
Snowflake Schema Model in Data Warehouse
Data Warehouse Fact Constellation Schema and Design
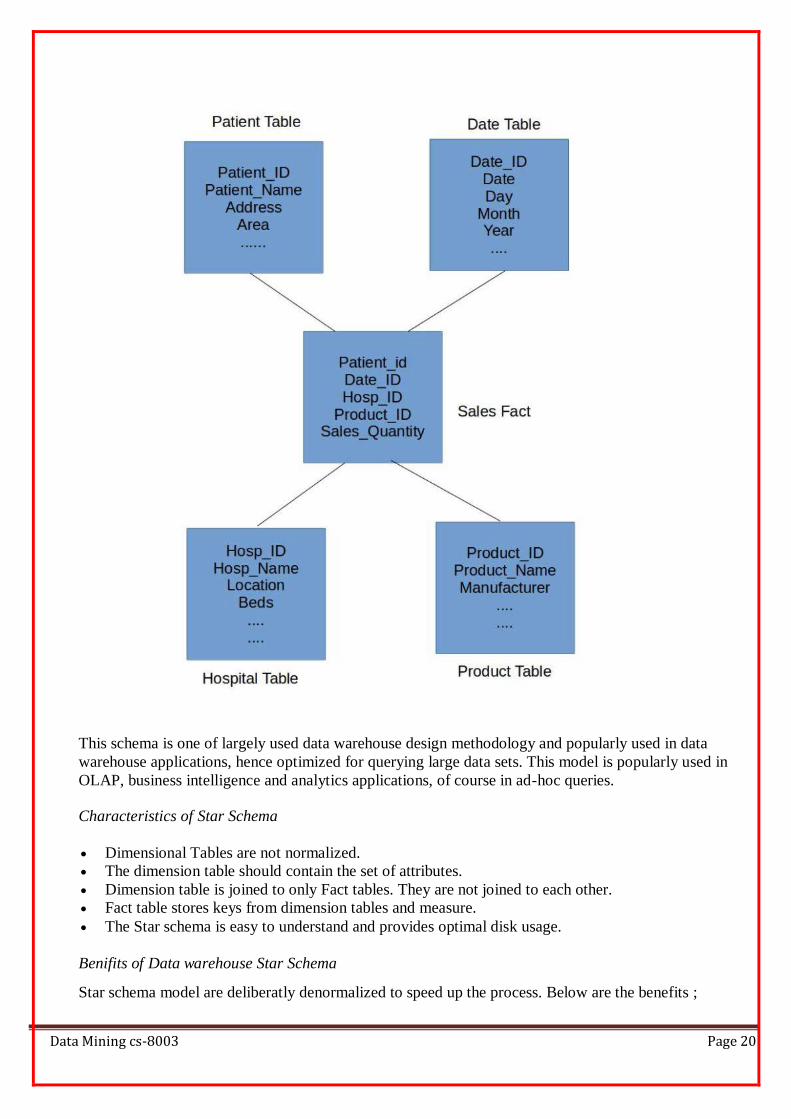
Representation of Data warehouse Star Schema
To understand the this model, consider medicine sales table that holds the information about the sales
quantity for each product, patient, hospital and on certain day. In this example, sales quantity is the
measure and primary keys from Product, Date, hospital and Patient dimension flows into fact table. Fact
table always holds measures and keys from dimension tables.
Step by Step Guide to Dimensional Modeling
Below is the pictorial representation of the schema.
Data Mining cs-8003 Page 20
This schema is one of largely used data warehouse design methodology and popularly used in data
warehouse applications, hence optimized for querying large data sets. This model is popularly used in
OLAP, business intelligence and analytics applications, of course in ad-hoc queries.
Characteristics of Star Schema
Dimensional Tables are not normalized.
The dimension table should contain the set of attributes.
Dimension table is joined to only Fact tables. They are not joined to each other.
Fact table stores keys from dimension tables and measure.
The Star schema is easy to understand and provides optimal disk usage.
Benifits of Data warehouse Star Schema
Star schema model are deliberatly denormalized to speed up the process. Below are the benefits ;
Data Mining cs-8003 Page 21
Simple queries: Join conditions are simple joins in this schema
Simplified business logics: This model simplifies common reporting business logics
Performance: This model provides performance enhancements for reporting applications
Fast aggregation
Feeding cubes: This model is generally used by OLAP systems to build cubes. Building cube is very
fast process
Disadvantages of Data warehouse Star Schema
Below are some of disadvantages;
The main disadvantages is, that data integrity is not enforced as in OLTP databases
This is not flexible inters of analytical application as normalized databases.
This model don’t support many to many relationship between business entities. These types of
relationships are simplified in star schema
Data Warehouse Snowflake Schema Model and Design
Data warehouse Snowflake schema is extension of star schema data warehouse design methodology, a
centralized fact table references to number of dimension tables, however, one or more dimension tables
are normalized i.e. dimension tables are connected with other dimension tables. Primary Keys from the
dimensions flows into fact table as foreign key.
Star Schema model in Data Warehouse
Data Warehouse Fact Constellation Schema and Design
Snowflake schema increases the level of normalization in data, the dimension table is normalized into
multiple tables. This schema has a disadvantage in terms of data retrieval, we need to travel through
multiple tables to get same information. SQL queries would have more joins in order to fetch the records.
Step by Step Guide to Dimensional Modeling
Data Vault Modeling Methodology Architecture
How Data Warehouse snowflake schema is different than star schema?
In snowflake schema, dimension table are normalized, where as in star schema these are denormalized.
Let us understand this model by using the same example that we discussed in star schema designing.
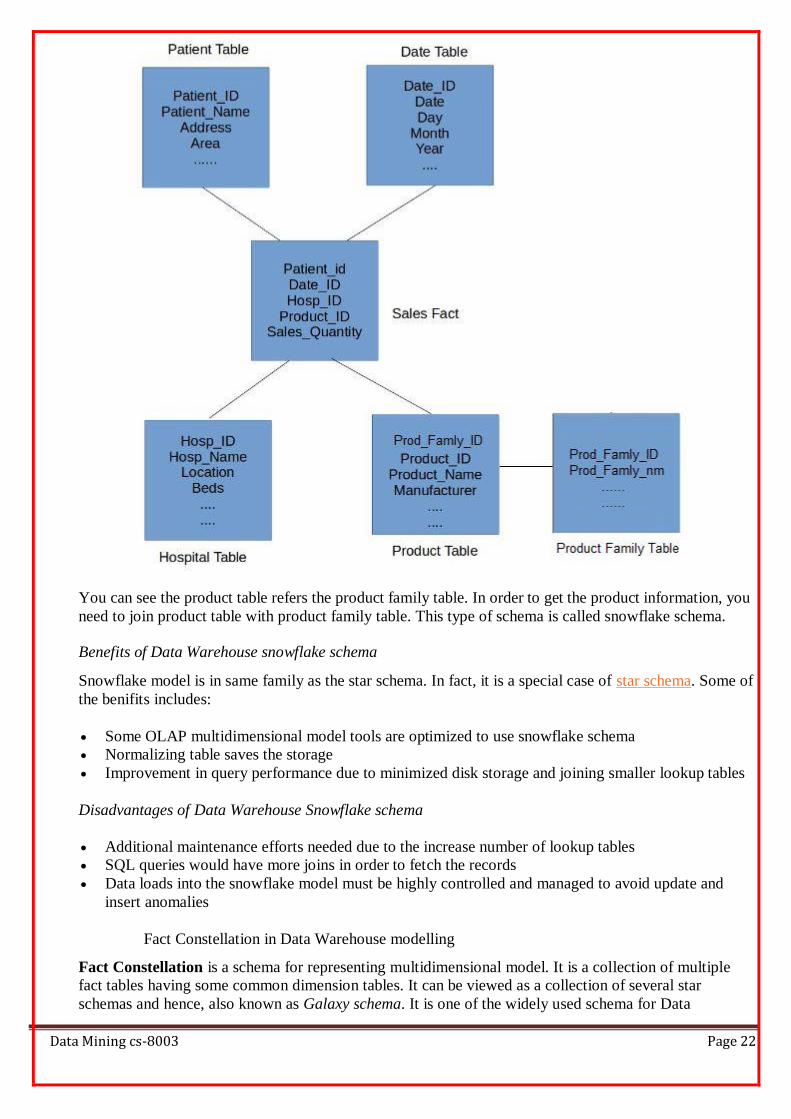
Consider medicine sales table that holds the information about the sales quantity for each product,
patient, hospital and on certain day. To implement snowflake schema, let’s create once more dimension
table called product family. Primary key from product family table flow into product table as foreign key
(product table is normalized). In this example, sales quantity is the measure and primary keys from
Product, Date, hospital and Patient dimension flows into fact table. Fact table always holds measures and
keys from dimension tables.
Data Mining cs-8003 Page 22
You can see the product table refers the product family table. In order to get the product information, you
need to join product table with product family table. This type of schema is called snowflake schema.
Benefits of Data Warehouse snowflake schema
Snowflake model is in same family as the star schema. In fact, it is a special case of star schema. Some of
the benifits includes:
Some OLAP multidimensional model tools are optimized to use snowflake schema
Normalizing table saves the storage
Improvement in query performance due to minimized disk storage and joining smaller lookup tables
Disadvantages of Data Warehouse Snowflake schema
Additional maintenance efforts needed due to the increase number of lookup tables
SQL queries would have more joins in order to fetch the records
Data loads into the snowflake model must be highly controlled and managed to avoid update and
insert anomalies
Fact Constellation in Data Warehouse modelling
Fact Constellation is a schema for representing multidimensional model. It is a collection of multiple
fact tables having some common dimension tables. It can be viewed as a collection of several star
schemas and hence, also known as Galaxy schema. It is one of the widely used schema for Data
Data Mining cs-8003 Page 23
warehouse designing and it is much more complex than star and snowflake schema. For complex
systems, we require fact constellations.
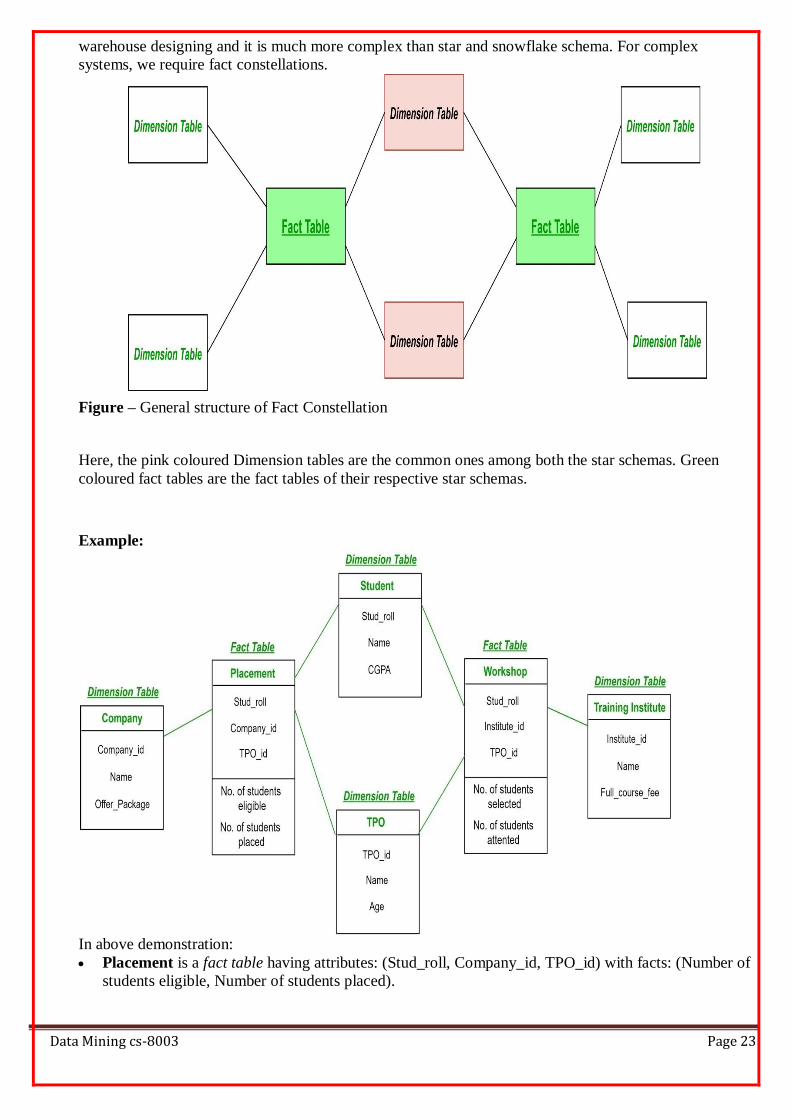
Figure – General structure of Fact Constellation
Here, the pink coloured Dimension tables are the common ones among both the star schemas. Green
coloured fact tables are the fact tables of their respective star schemas.
Example:
In above demonstration:
Placement is a fact table having attributes: (Stud_roll, Company_id, TPO_id) with facts: (Number of
students eligible, Number of students placed).
Data Mining cs-8003 Page 24
Workshop is a fact table having attributes: (Stud_roll, Institute_id, TPO_id) with facts: (Number of
students selected, Number of students attended the workshop).
Company is a dimension table having attributes: (Company_id, Name, Offer_package).
Student is a dimension table having attributes: (Student_roll, Name, CGPA).
TPO is a dimension table having attributes: (TPO_id, Name, Age).
Training Institute is a dimension table having attributes: (Institute_id, Name, Full_course_fee).
So, there are two fact tables namely, Placement and Workshop which are part of two different star
schemas having dimension tables – Company, Student and TPO in Star schema with fact
table Placement and dimension tables – Training Institute, Student and TPO in Star schema with fact
table Workshop. Both the star schema have two dimension tables common and hence, forming a fact
constellation or galaxy schema.
Advantage: Provides a flexible schema.
Disadvantage: It is much more complex and hence, hard to implement and maintain.
What is Multi-Dimensional Data Model?
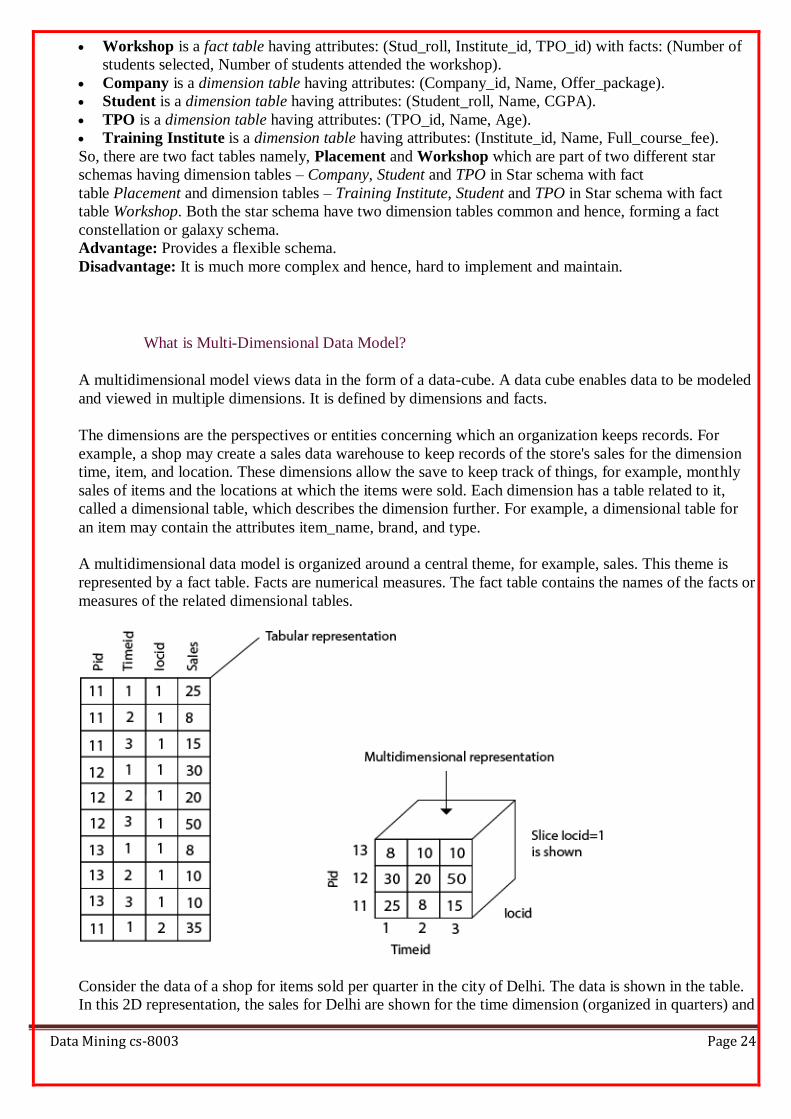
A multidimensional model views data in the form of a data-cube. A data cube enables data to be modeled
and viewed in multiple dimensions. It is defined by dimensions and facts.
The dimensions are the perspectives or entities concerning which an organization keeps records. For
example, a shop may create a sales data warehouse to keep records of the store's sales for the dimension
time, item, and location. These dimensions allow the save to keep track of things, for example, monthly
sales of items and the locations at which the items were sold. Each dimension has a table related to it,
called a dimensional table, which describes the dimension further. For example, a dimensional table for
an item may contain the attributes item_name, brand, and type.
A multidimensional data model is organized around a central theme, for example, sales. This theme is
represented by a fact table. Facts are numerical measures. The fact table contains the names of the facts or
measures of the related dimensional tables.
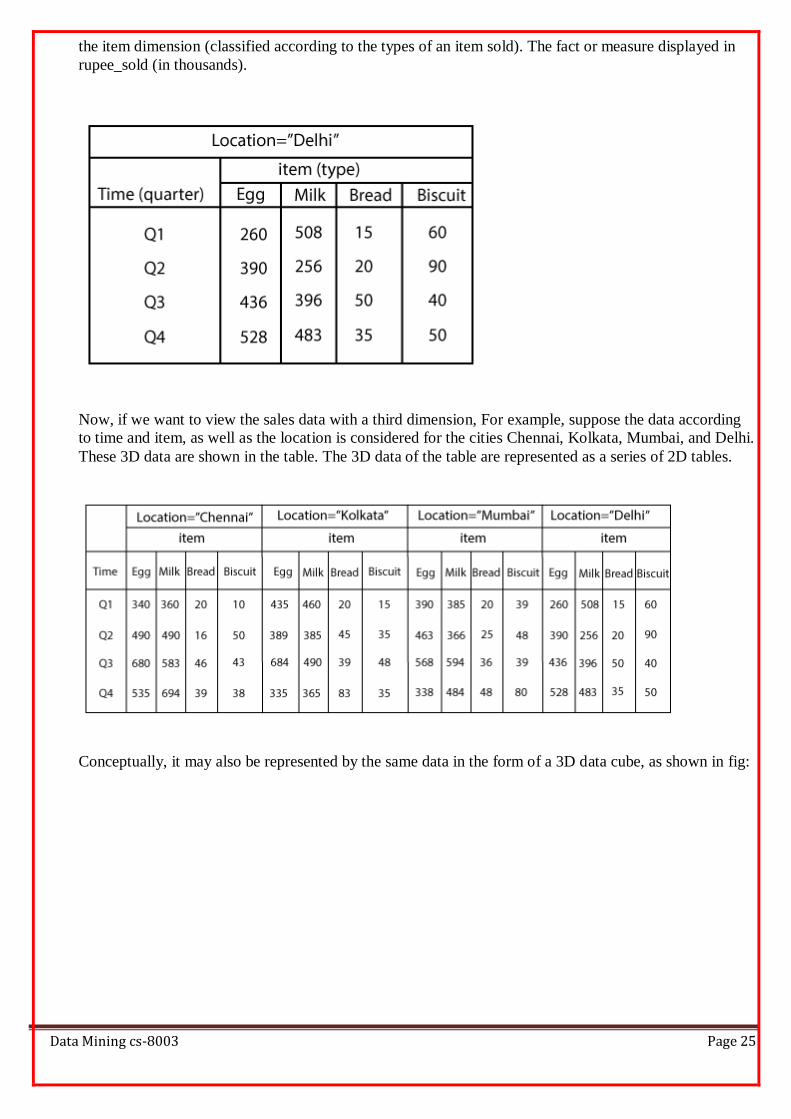
Consider the data of a shop for items sold per quarter in the city of Delhi. The data is shown in the table.
In this 2D representation, the sales for Delhi are shown for the time dimension (organized in quarters) and
Data Mining cs-8003 Page 25
the item dimension (classified according to the types of an item sold). The fact or measure displayed in
rupee_sold (in thousands).
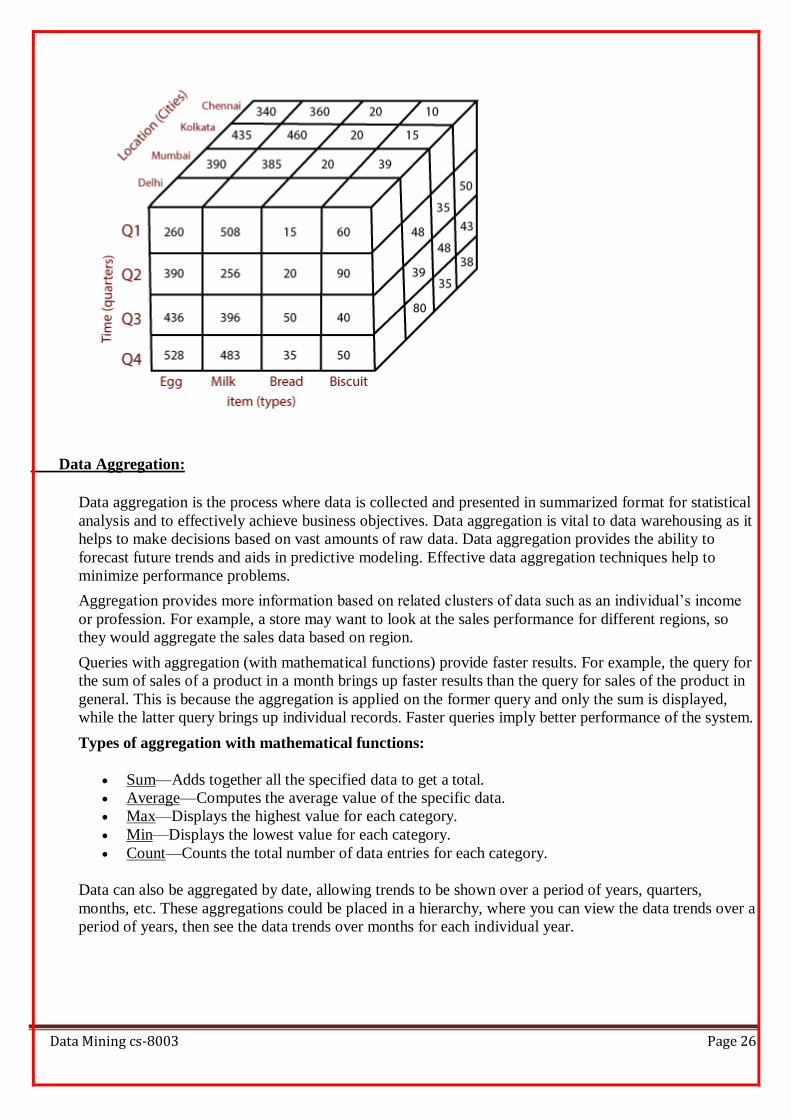
Now, if we want to view the sales data with a third dimension, For example, suppose the data according
to time and item, as well as the location is considered for the cities Chennai, Kolkata, Mumbai, and Delhi.
These 3D data are shown in the table. The 3D data of the table are represented as a series of 2D tables.
Conceptually, it may also be represented by the same data in the form of a 3D data cube, as shown in fig:
Data Mining cs-8003 Page 26
Data Aggregation:
Data aggregation is the process where data is collected and presented in summarized format for statistical
analysis and to effectively achieve business objectives. Data aggregation is vital to data warehousing as it
helps to make decisions based on vast amounts of raw data. Data aggregation provides the ability to
forecast future trends and aids in predictive modeling. Effective data aggregation techniques help to
minimize performance problems.
Aggregation provides more information based on related clusters of data such as an individual’s income
or profession. For example, a store may want to look at the sales performance for different regions, so
they would aggregate the sales data based on region.
Queries with aggregation (with mathematical functions) provide faster results. For example, the query for
the sum of sales of a product in a month brings up faster results than the query for sales of the product in
general. This is because the aggregation is applied on the former query and only the sum is displayed,
while the latter query brings up individual records. Faster queries imply better performance of the system.
Types of aggregation with mathematical functions:
Sum—Adds together all the specified data to get a total.
Average—Computes the average value of the specific data.
Max—Displays the highest value for each category.
Min—Displays the lowest value for each category.
Count—Counts the total number of data entries for each category.
Data can also be aggregated by date, allowing trends to be shown over a period of years, quarters,
months, etc. These aggregations could be placed in a hierarchy, where you can view the data trends over a
period of years, then see the data trends over months for each individual year.