Embed Size (px)
Citation preview

TRIGGMINING.COM.AU
05 October 2021
ASX: TMG
Positive Scoping Study for Lake Throssell Sulphate of Potash Project following Mineral Resource Upgrade Trigg Mining Limited (ASX:TMG) (Trigg or the Company) is pleased to announce the completion of a Scoping Study on its flagship 100%-owned Lake Throssell Sulphate of Potash (SOP) Project (Project) underpinned by the upgrade of a portion of the total drainable Mineral Resource to the Indicated category. The Project, located in the Eastern Goldfields of Western Australia, will comprise the harvesting of brine water from subterranean aquifers, evaporation ponds, processing plant and supporting infrastructure to produce a naturally forming potassium-rich salt, potassium sulphate (or sulphate of potash) used globally as a fertiliser and in other industrial purposes.
The Company sees this positive Scoping Study as an important milestone in the evaluation of the Lake Throssell SOP Project and has approved the immediate commencement of a Pre-Feasibility Study.
Scoping Study – Cautionary Statement The Company advises the Scoping Study referred to in this announcement has been undertaken to determine the potential viability of the Lake Throssell Sulphate of Potash Project (the Project) in Western Australia. The Scoping Study is a preliminary assessment based on low accuracy technical and economic assessments (±25-35% Class 5). It is insufficient to support the estimation of Ore Reserves or to provide assurance of an economic development case at this stage, or to provide certainty that the conclusions of the Scoping Study will be realised. Further exploration and evaluation work and appropriate studies are required before the Company will be able to estimate any Ore Reserves or to provide any assurance of an economic development case. The Study is based on the material assumptions outlined in this release. These include assumptions about the availability of funding. While the Company considers all the material assumptions to be based on reasonable grounds, there is no certainty that they will prove to be correct or that the range of outcomes indicated by the Scoping Study will be achieved. The Inferred and Indicated Mineral Resource estimate underpinning the production target was prepared by a competent person in accordance the JORC Code (2012). Over the payback period 82% of the production target is sourced from Indicated and 18% from Inferred Drainable Mineral Resources. Over the life of mine 70% of the production target is derived from Indicated Drainable Resources and 41% of the Total Drainable Mineral Resource estimate is scheduled over the life of mine. The inclusion of the Inferred Drainable Mineral Resource in the production target does not impact technical or financial viability. There is a low level of geological confidence associated with Inferred Mineral Resources and there is no certainty that further exploration work will result in the determination of Measured or Indicated Mineral Resources or that the Production Target or preliminary economic assessment will be realised. To achieve the range of outcomes indicated in the Study, funding for capital and working capital requirements in the order of $412 million will likely be required. Investors should note that there is no

2
TRIGGMINING.COM.AU
certainty that the Company will be able to raise that amount of funding when needed. It is also possible that such funding may only be available on terms that may be dilutive to or otherwise affect the value of Trigg’s existing shares. It is also possible that Trigg could pursue other ‘value realisation’ strategies such as a sale, partial sale or joint venture of the Project. If it does, this could materially reduce Trigg’s proportionate ownership of the Project. The Project will need environmental approvals and the grant of a mining lease. Although the Company currently sees no impediment to acquiring these, there is no guarantee that the Company will be able to obtain these or obtain them within the timeframe proposed in the Project development schedule. The Study results contained in this announcement relate solely to the Project and do not include Exploration Targets or Mineral Resources defined elsewhere. This announcement contains a series of forward-looking statements. Generally, the words "expect," “potential”, "intend," "estimate," "will" and similar expressions identify forward-looking statements. By their very nature forward-looking statements are subject to known and unknown risks and uncertainties that may cause actual results, performance or achievements, to differ materially from those expressed or implied in any forward-looking statements, which are not guarantees of future performance. Statements in this release regarding Trigg’s business or proposed business, which are not historical facts, are forward-looking statements that involve risks and uncertainties, such as Mineral Resource estimates, market prices of metals, capital and operating costs, changes in project parameters as plans continue to be evaluated, continued availability of capital and financing and general economic, market or business conditions, and statements that describe Trigg’s future plans, objectives or goals, including words to the effect that Trigg or management expects a stated condition or result to occur. Forward-looking statements are necessarily based on estimates and assumptions that, while considered reasonable by Trigg, are inherently subject to significant technical, business, economic, competitive, political and social uncertainties and contingencies. Since forward-looking statements address future events and conditions, by their very nature, they involve inherent risks and uncertainties. Actual results in each case could differ materially from those currently anticipated in such statements. Investors are cautioned not to place undue reliance on forward-looking statements, which speak only as of the date they are made. Trigg has concluded it has a reasonable basis for providing these forward-looking statements and believes it has reasonable basis to expect it will be able to fund development of the project. However, a number of factors could cause actual results or expectations to differ materially from the results expressed or implied in the forward-looking statements. Given the uncertainties involved, investors should not make any investment decisions based solely on the results of this Study. Please refer to Appendix A for further details.
Figure 1: Lake Throssell Sulphate of Potash Project

3
TRIGGMINING.COM.AU
Key Highlights of the Lake Throssell SOP Project Scoping Study:
Indicated Mineral Resource expanded
• Following the positive outcomes of the groundwater model, a review of the drill logs and reinterpretation of the resource block model has led to the reclassification of the highly permeable mineralised domains within the basal aquifer to Indicated status for a total drainable Indicated Mineral Resource estimate of 4.2Mt of SOP at 4,770mg/L potassium (K) (or 10.6kg/m3 K2SO4)
• Total drainable Mineral Resource now stands at 14.4Mt at 4,665mg/L potassium (or 10.4 kg/m3 K2SO4)
Long mine life and scale
• Annual nameplate Production Target of 245ktpa SOP over an initial Life-of-Mine (LOM) of 21 years
• Approximately 82% of the payback period is from Indicated Mineral Resources and 70% over the LOM
Low operating costs, robust financials
• A LOM average cash operating cost of $341/t SOP and an all-in sustaining cost of $372/t SOP
• An initial capital cost of $378M, including a $70M contingency with an accuracy of ±25-35%
• Lake Throssell will generate an average EBITDA of $97 million per annum at a US$550/t SOP price
• Robust financials confirm Lake Throssell as a potential Tier-1 global SOP Project
Low risk and commercially proven flowsheet
• Simple network of trenches and bores, solar evaporation and a process plant uses proven technology
Next Steps
• Work to immediately commence on a Pre-Feasibility Study and
• Continuation of environmental baseline surveys and Project Referral to the EPA planned for 2022
Management Comment
Trigg Mining Managing Director Keren Paterson said: “The completion of a Scoping Study is a huge milestone for the Trigg team, for our shareholders and for those who have supported us since we listed on the two years ago. The Scoping Study outcomes strongly vindicate our long-held belief that Lake Throssell is a potential company-maker – a high-quality, long-life asset which can transform Trigg into a modern, sustainable Australian SOP producer with a Top 10 globally competitive Project.
“The key attributes of the Project are clearly highlighted in this Study – the scale and quality of the Resource, its Tier-1 location, proximity to infrastructure and ability to support a multi-decade operation which can also deliver a number of exceptional ESG outcomes. Apart from the social and economic benefits it will provide, the Project utilises solar evaporation to produce a natural fertiliser essential for global food security.”
“This is a defining moment for Trigg and provides investors with a clear picture of the economic potential of Lake Throssell as a long-life, low-cost Project that can ultimately provide dividends to shareholders.
“Our methodical and focused approach to developing the Project will continue as we leverage the key learnings from the new potash industry currently being developed in Western Australia.
“We are very excited about the opportunities in front of us and we are looking forward to progressing the Project to the next stage with a Pre-Feasibility Study.”

4
TRIGGMINING.COM.AU
Lake Throssell Sulphate of Potash Scoping Study Introduction
The Lake Throssell SOP Project Scoping Study was supervised by an experienced in-house team and carried out by external experts. CPC Project Design Pty Ltd provided capital and operating cost estimates to a ±25-35% Class 5 standard, Hatch Engineering provided the process flowsheet and equipment sizings, Aquifer Resources provided the Mineral Resource estimate and solute transport model to determine the production target. Financial modelling, benchmarking and funding analysis was provided by Euclase Capital.
The Scoping Study results confirm the potential for the Lake Throssell SOP Project to be a low-cost, long-life producer of natural sulphate of potash for food production.
Project Concept The potential development of the Lake Throssell SOP Project comprises the following concepts:
• The establishment of a trenching and bore network to supply up to 29GLpa of potassium-rich brine per annum to the evaporation ponds for 21 years
• 2,150Ha of evaporation ponds and a processing plant to produce 245ktpa of SOP
• Supply of 2.5GLpa of process water
• Construction of supporting infrastructure including:
o 10MW power station consuming trucked LNG plus a 5MW solar farm
o 120-room accommodation village
o Airstrip, offices administration buildings, gate house, warehousing, workshops and general facilities
o Mine access road and site access tracks
• Compaction of the product to a granular form and bagged in 1t bulk bags prior to packing in sea containers for transportation
• Transport 350km via road from Lake Throssell to the Malcom railhead at Leonora prior to loading on to rail and transport 950km to the container port at Fremantle.
Key Project Metrics
A summary of the key physical assumptions for the Lake Throssell SOP Project and the financial model outputs are provided in Table 1.
A flat exchange rate of AUD:USD of 0.73 (spot rate as at 1 September 2021) and all currency is in Australian dollars ($) unless otherwise stated. A flat SOP price of US$550/t (Free-on-board (FOB)) has been assumed across the Project life. The SOP price used represents a consensus view of market analysts’ long-term price and a report undertaken by industry marketing leaders CRU International Limited (CRU). Sensitivity analysis on key variables including SOP price, exchange rate, production target, royalty rate, discount rate, operating and capital cost estimates is provided in the Economic Analysis section of this release.

5
TRIGGMINING.COM.AU
Table 1: Key assumptions, production target and financial model outputs Key Assumptions & Financial Metrics Units Value Key Financial Assumptions
Average LOM exchange rate AUD/USD 0.73 SOP price (US$/t, FOB) 550 (A$/t, FOB) 753 Discount rate % 8
Key Physical Assumptions LOM Production Target Mt 5.9Mt @ 10.4kg/m3 SOP Life of Mine (LOM) Years 21 Brine abstraction
Trench network km 110 Bores number 22-112
Overall recovery % 82 Annual Production Target ktpa SOP 245
Capital Cost Total direct costs $M 269 Total indirect costs $M 40 Contingency and growth $M 70
Total Capital Cost $M 378 Pre-production working capital $M 34
Total Funding Requirement $M 412 Operating Cost
C1 Cash Operating Cost $/t SOP 341 Sustaining Capital, royalties, Native Title compensation and closure costs $/t SOP 31
All-in Sustaining Cost (AISC) $/t SOP 372 Financial Metrics Average Annual LOM Revenue $Mpa 180 Average Annual EBITDA (including royalty and NT compensation) $Mpa 97
NPV8 (pre-tax) $M 364 IRR (pre-tax) % 18 Payback from first SOP production years 4.5
Conclusion and Recommendations
The Lake Throssell Scoping Study confirms that the development of a 245ktpa SOP Project is technically and commercially feasible. Given the results delivered by the Scoping Study the Board of Trigg Mining has approved the Company proceeding to the Pre-feasibility stage.

6
TRIGGMINING.COM.AU
Project Description
The Lake Throssell SOP Project is 100%-owned and operated by Trigg and lies approximately 180km north-east of Laverton, situated on a granted Exploration Licence (E38/3065) and Exploration Licence Applications (E38/3458, E38/3483, E38/3537 and E38/3544) covering an area of 1,084km2. Figure 2 shows the Project location and tenure.
Figure 2: Project location of the Lake Throssell Sulphate of Potash Project
The Project comprises two distinct aquifer zones – surficial and basal – with the surficial aquifer representing the upper 25 metres of the palaeovalley and the basal aquifer located at or near the base of the palaeovalley with a basement depth of approximately 100-150 metres.
In Years 1 to 6 the brine will mostly be sourced from the surficial aquifer using a network of trenches across the lake surface. The cost of brine extraction from for this period is lower than the overall LOM costs. Approximately 80% of SOP production for the first five years of operation is sourced from the surficial aquifer. Bores will be progressively installed to supplement brine feed as the flowrate from the surficial aquifer declines.
An annual Production Target of 245ktpa of granulated SOP product will be placed in sea containers and transported to the Port of Fremantle for export. Wherever possible the Company intends to prioritise sales for domestic use, but for the purpose of estimating the operating cost for this study it is assumed 100% of the product is transported to Fremantle.

7
TRIGGMINING.COM.AU
The Project will generate approximately 125 permanent direct jobs (114 site-based) and up to 250 site construction jobs over an estimated two-year construction phase.
Geology
Lake Throssell is an extensive palaeovalley system up to 5km wide and approximately 70km in length in the Project area. Within the palaeovalley there are two main mineralised domains. The upper surficial aquifer is typically 25 metres in depth, inclusive of the lake surface. The surficial aquifer lies on top of a thick sequence of stiff lacustrine clay, which acts as a confining layer that hydraulically separates the surficial aquifer from the basal aquifer sediments, in a sequence known as the palaeovalley. The basal aquifers consist of Pliocene to Eocene fluvial sediments, Permian glacial fluvial sediments and weathered basement or saprolite of the Paterson Formation. The basal aquifer is considered to be up to 50 metres in thickness in places.
A typical cross-section of the Lake Throssell palaeovalley is shown in Figure 3.
Figure 3: Typical geological cross section of the Lake Throssell palaeovalley

8
TRIGGMINING.COM.AU
Mineral Resource Estimate
The updated Mineral Resource estimate for the Lake Throssell Potash Project is presented in Table 2 and has been reported in accordance with the Australasian Code for Reporting of Exploration Results, Mineral Resources and Ore Reserves, (JORC Code 2012). The report is attached as Appendix C and contain the JORC Table 1.
The basis of the updated Mineral Resource estimate has resulted from a review of the drill logs and reinterpretation of the resource block model of the highly permeable mineralised domains within the basal aquifer following the positive outcomes from the groundwater model as part of this study. The modelling has confirmed the hydrogeological continuity and abstraction potential of the central portion of the basal aquifer and permits the estimation of an Indicated Mineral Resource. Ordinary kriging was used to estimate the grade and volume of the reclassified Indicated Mineral Resource within the basal aquifer. No cut off grade has been applied to the estimate, which is consistent with other brine projects. Figure 5 shows the upgrade Indicated mineralised domain within the basal aquifer. Drill holes spacing is present in Figure 4.
The Indicated Mineral Resource estimate for the basal aquifer is 2.3Mt of drainable SOP at 4,605mg/L potassium (or 10.3kg/m3 K2SO4). Overall the total Mineral Resource has increased since the last estimate (see ASX release 26 July 2021) by 0.1Mt to 14.4Mt of drainable SOP at 4,665mg/L potassium (or 10.4kg/m3 K2SO4).
The Exploration Target, in addition to the Mineral Resource estimate, remains 2.6 – 9.4 Mt of drainable SOP at 4,261 – 4,616mg/L potassium (or 9.5 – 10.3kg/m3 SOP). The potential quantity and grade of the Exploration Target is conceptual in nature. There has been insufficient exploration in these areas to estimate a Mineral Resource. It is uncertain if further exploration will result in the estimation of a Mineral Resource.
Table 2: Lake Throssell Mineral Resource July 20211, 2, 3
Resource Domain
Mineral Resource Category
Drainable Brine
Volume (106 m3)
Potassium (K)
Grade (mg/L)
Potassium (K)
Mass (Mt)
Sulphate (SO4) Mass (Mt)
Equiv. SOP Grade
(K2SO4) (kg/m3)
Drainable Brine SOP
Mass (Mt)
Total Brine SOP
Mass (Mt)
LAKE THROSSELL MINERAL RESOURCE Surficial Aquifer Indicated 170 4,985 0.9 3.8 11.1 1.9 4.5 Basal Aquifer Indicated 225 4,605 1.0 5.5 10.3 2.3 3.4 Total Indicated Resource 395 4,770 1.9 9.3 10.6 4.2 7.9 Surficial Aquifer Inferred 310 4,605 1.4 6.8 10.3 3.2 13.5 Confining Layer Inferred 350 4,595 1.6 8.1 10.2 3.6 40.6 Basal Aquifer Inferred 330 4,675 1.5 7.6 10.4 3.4 14.5 Total Inferred Resource 990 4,625 4.5 22.5 10.3 10.2 68.6 TOTAL MINERAL RESOURCE 1,385 4,665 6.4 31.8 10.4 14.4 76.4 LAKE THROSSELL EXPLORATION TARGET (in addition) Lower Estimate 288 4,261 1.2 9.5 2.6 Upper Estimate 945 4,616 4.2 10.3 9.4
1 The Lake Throssell Mineral Resource estimate was prepared by Aquifer Resources 2 Errors may be present due to rounding. Approximately 2.90Mt of the Inferred Drainable SOP Mass is present in Exploration Licence Applications E38/3544, E38/3483, E38/3458, and E38/3537. 3 The potential quantity and grade of the Exploration Target is conceptual in nature. There has been insufficient exploration in these areas to estimate a Mineral Resource. It is uncertain if further exploration will result in the estimation of a Mineral Resource.
The Mineral Resource estimate is supported by numerous exploration programs during the period December 2019 to July 2021 (see Figure 4), including:
• 200 line-kilometres of gravity surveys with 1,040 stations;
• 16 lake surface hand auger drill holes;
• 26 heli-supported rotary drill holes;
9
TRIGGMINING.COM.AU
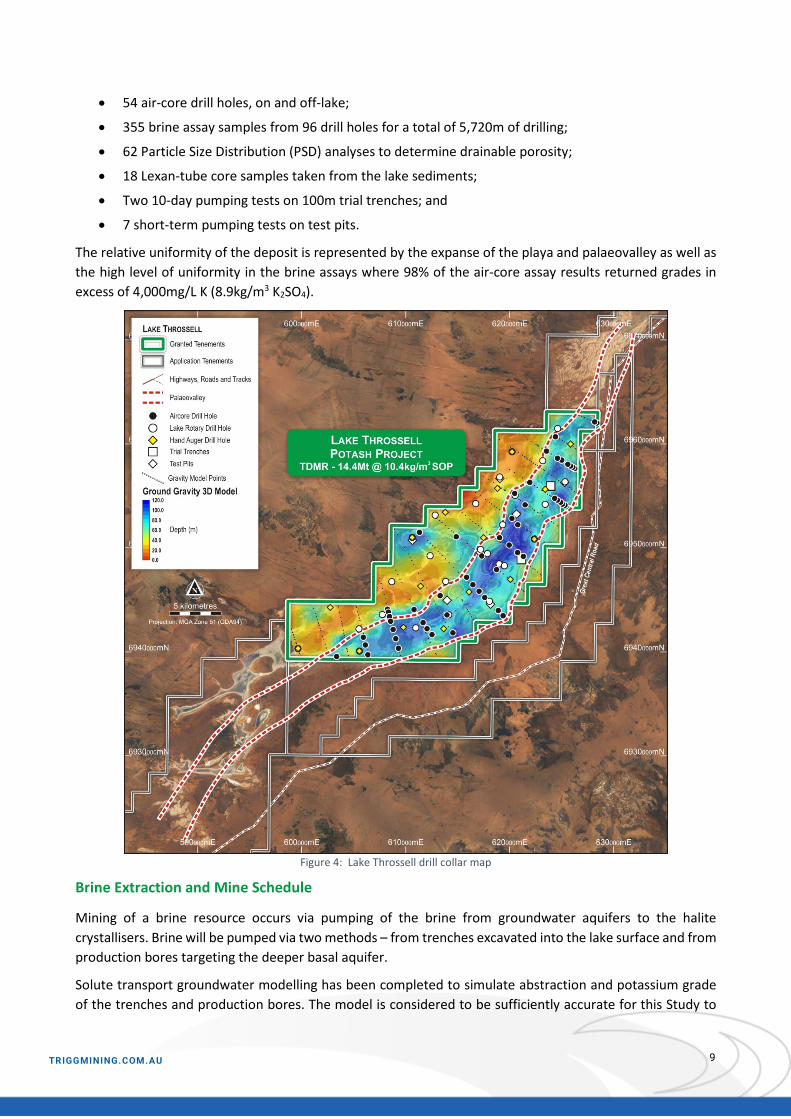
• 54 air-core drill holes, on and off-lake;
• 355 brine assay samples from 96 drill holes for a total of 5,720m of drilling;
• 62 Particle Size Distribution (PSD) analyses to determine drainable porosity;
• 18 Lexan-tube core samples taken from the lake sediments;
• Two 10-day pumping tests on 100m trial trenches; and
• 7 short-term pumping tests on test pits.
The relative uniformity of the deposit is represented by the expanse of the playa and palaeovalley as well as the high level of uniformity in the brine assays where 98% of the air-core assay results returned grades in excess of 4,000mg/L K (8.9kg/m3 K2SO4).
Figure 4: Lake Throssell drill collar map
Brine Extraction and Mine Schedule
Mining of a brine resource occurs via pumping of the brine from groundwater aquifers to the halite crystallisers. Brine will be pumped via two methods – from trenches excavated into the lake surface and from production bores targeting the deeper basal aquifer.
Solute transport groundwater modelling has been completed to simulate abstraction and potassium grade of the trenches and production bores. The model is considered to be sufficiently accurate for this Study to

10
TRIGGMINING.COM.AU
determine the production target and change of abstraction rates over time using reasonable aquifer parameters.
The trench model uses the results from the trench pumping tests as a guide to the average aquifer properties of the surficial aquifer (refer to ASX announcement released on 7 July 2021). The basal aquifer uses the geology from the resource model with aquifer properties based on desktop and publicly available data from locally similar projects within the region. The groundwater model is a solute transport model and simulates brine potassium grade change over time from each abstraction point. The initial brine grades in the model were imported from the resource block model. The model does not include any recharge and the islands have been assigned zero grade, which are outside of the resource model; therefore, abstraction is purely from groundwater storage, reflecting the Mineral Resource.
The results from the groundwater modelling enabled a mine plan to be developed by Aquifer Resources to determine the Production Target of 245ktpa SOP for the Scoping Study and is discussed in detail in Appendix C.
Installation of test production bores and test pumping is required to facilitate conversion to Ore Reserves and validation of the mine plan using more refined groundwater models.
The Project proposes to construct a network of surficial trenches totalling 110km in length across Lake Throssell. Figure 5 shows an indicative layout of the trench network. These trenches will flow by gravity to two collection sumps where brine will be pumped into the halite crystalliser feed channel.
Figure 5: Proposed trench network and bore locations

11
TRIGGMINING.COM.AU
During the initial payback period there will be limited number of bores with the majority of the brine sourced from the trench network. Figure 5 shows the outer boundary of the Inferred and Indicated Mineral Resources within the basal aquifer block model. Production bores are progressively installed as the flowrate from the trench network steadily declines as the water table is lowered.
Brine is continually sourced from the surficial aquifer over the 21 year mine life and still has capacity beyond that period. The number of bores will increase from 22 in Year 1 to 112 bores in Year 18 to support the annual production. The Project has been based on an initial 21-year life-of-mine (LOM) with 5.87Mt of SOP extracted from the aquifer, which is equivalent to 41% of the drainable Mineral Resource of 14.4Mt of SOP over this period. Figure 5 shows the indicative location of proposed bores from Aquifer Resources, which are located on the accessible islands and shorelines above the basal aquifer target.
Figure 5 also shows the basal aquifer is open to the southwest and northeast and forms part of the Exploration Target discussed later in the announcement. With further resource definition this may increase the production rate and/or extend the mine life beyond 21 years. Figure 6 shows the breakdown of brine feed obtained from the trench network and bores with the annual production. There is an initial ramp-up period derived from the McNulty Type 2 ramp-up curve. In Year 1, the pond system will be constructed, and an initial salt floor grown in Year 2. First SOP production occurs in Year 3, coinciding with first salt harvest as shown by the mine schedule in Figure 6. From Year 5 onwards, the plant will operate at full nameplate production target of 245ktpa of SOP.
Figure 6: Indicated and Inferred brine feed (ktpa SOP) with annual production
0
50
100
150
200
250
300
350
0
50
100
150
200
250
300
350
1 2 3 4 5 6 7 8 9 10 11 12 13 14 15 16 17 18 19 20 21
Annu
al P
rodu
ctio
n (k
tpa
SOP)
Drai
nabl
e Br
ine
Feed
(ktp
a SO
P)
Production Year
Indicated
Inferred
Production

12
TRIGGMINING.COM.AU
Crystallisation and SOP Process Plant
Production from hypersaline brine hosted SOP is typically undertaken through the sustainable abstraction of mineralised brine water, concentration using solar evaporation ponds and then purification as illustrated in Figure 7.
The evaporation rate at the Lake Throssell SOP Project is estimated to be approximately 3,200mm per year.
Crystallisation
Hatch developed the process design for the Project utilising a typical solar evaporation production pathway.
Brine will be pumped from the collection sumps and channels on Lake Throssell to the first stage of the solar pond system. The pond system consists of two parallel trains of 10 cells per train of preconcentration (Halite Ponds), followed by 9 parallel trains of three Kainite Type Mixed Salt (KTMS) ponds placed in series. There is a total of 2,150Ha of evaporative area required for the Project.
The brine initially enters the Halite Ponds where the evaporation of water results in the crystallisation of halite (NaCl)1. At a specified brine concentration, the brine is pumped to the next stage of the ponds where additional evaporation occurs and other salts such as epsomite (MgSO4)2 along with halite precipitate. This process is repeated for each pond stage. The make-up of the precipitated salts is different in each stage of the ponds. The height of the embankments for the Halite Ponds are increased every 8-10 years to increase the storage volume of halite. The cost associated with these civil earthworks has been included in the sustaining capital schedule within the operating cost estimate.
At the KTMS crystalliser ponds, consisting of kainite3, leonite4, halite, carnallite5, and hexahydrite6, feed brine is mixed with SOP recycle brine that is returned from the process plant to improve the K:SO4 ratio which will improve the overall potassium recovery. Brine remaining after the final solar production pond is intended to be returned to Lake Throssell.
Precipitated salts are harvested from the final evaporation pond stages and are blended on the run-of-mine (ROM) pad to provide an homogenous feed to the processing plant.
It is planned for the pond system to be commissioned 12-18 months ahead of first production to grow an initial salt floor to support heavy mobile equipment and first KTMS for commissioning.
SOP Process Plant
The purification plant converts harvested KTMS from the solar ponds to an intermediate product (schoenite7) in conversion tanks, and then separates the schoenite from halite using flotation.
After the flotation step, the schoenite concentrate is decomposed using hot water and recrystallised to potassium sulphate (K2SO4 or SOP). The SOP crystals are then dewatered and dried in a fluid bed dryer, compacted, screened and loaded into bags for shipment. The mother liquor from the SOP crystalliser is treated by cooling the liquor to recover additional schoenite, while excess mother liquor is pumped back to the solar ponds to maximise potassium recovery. A schematic of the flowsheet is shown in Figure 7.
This process is typical of other SOP plants and uses commercially proven technology.
1 Otherwise known as table salt 2 Otherwise known as Epsom salt 3 Kainite, a hydrated potassium magnesium sulphate chloride double salt, KMgSO4Cl·3H2O 4 Leonite, a hydrated potassium magnesium sulphate double salt, K2SO4·MgSO4·4H2O 5 Carnallite, a hydrated potassium magnesium chloride salt, KMgCl3·6H2O 6 Hexhydrite, a magnesium sulphate salt, MgSO4.6H2O 7 Schoenite, a hydrated potassium magnesium salt, K2Mg(SO4)2·6(H2O).

13
TRIGGMINING.COM.AU
Figure 7: Flowsheet for the Lake Throssell SOP Project
Infrastructure
The Lake Throssell Project requires infrastructure similar to other remote resource projects throughout Western Australia. The following non-process infrastructure will be constructed to support operations:
• Power station, including a solar farm and power distribution
• Raw water supply and water treatment
• Accommodation village
• Airstrip
• Offices, stores, and workshop
• Communications
• Bulk fuel storage
• Roads
Trigg will obtain power from an Independent Power Provider (IPP) through a 10-megawatt (MW) power station with a 5MW solar farm. Initial analysis has determined the power station will use trucked liquified natural gas (LNG). An all-in levelised electrical price (inclusive of fuel cost) of $0.18/kWh has been estimated for the Project.
A desktop study has been completed on potential raw water sources for the Project. It has been assumed for the purposes of the Scoping Study a raw water borefield will be located 30km from the SOP process plant with sufficient capacity to provide 2.5GL pa of brackish water. A program of work is currently being planned to drill a number of identified water targets from the desktop study.

14
TRIGGMINING.COM.AU
The planned accommodation village has a total capacity of 120 rooms to support operations. The Project will operate on a 24hr, 7-day basis assuming a 2 weeks on / 1 week off roster for shift personnel and an 8 days on / 6 days off roster for day shift roles. A gravel airstrip will be constructed to support a twin prop air service from Perth to Lake Throssell for shift change overs. The airstrip will be suitable for an ATR 42 seat or ATR 72 seat aircraft.
Bulk fuel will be delivered to site and stored in a 550kL bulk fuel farm, which has sufficient diesel for 21 days. A site fuel truck will distribute and refuel generators for the bore field. The next study phase will look at the cost of reticulating power along the lake to reduce diesel consumption. Pricing for bulk fuel delivery to site was obtained and a price of $0.82/L (excl GST, plus rebate) used for the study.
The greenhouse gas (GHG) emissions have been estimated on an annual basis. With a 15-20% renewable energy penetration the GHG emissions are estimated to be approximately 42,500t CO2e per annum or 173kg/t of SOP at nameplate capacity.
Access to the Project is via the Great Central Road to the nearest town of Laverton located 180km from Lake Throssell. The Australian Government has provided funding of $46.5M to seal the first 40km of the Great Central Road from Laverton and this work is currently underway. There is a further $95.6M future funding package to seal beyond Cosmo Newberry, 84km east of Laverton. Under the Outback Way funding program it is anticipated the road will be completely sealed by 2028/298.
Also refer to ‘Legal, Tenure and Environmental Approvals’ and ‘Heritage and Native Title’ sections of this release for the basis of these assumptions.
Figure 8 shows a preliminary layout of the Lake Throssell SOP Project with access to the Project via the Great Central Road.
8 https://investment.infrastructure.gov.au/projects/key-projects/outback-way.aspx

15
TRIGGMINING.COM.AU
Figure 8: Indicative project layout
Project Economics
Financial analysis of the Lake Throssell SOP Project has been undertaken using a discounted cash flow model based on estimated production rates, capital costs, FOB operating costs, SOP prices and currency exchange rates. This financial evaluation is based on pre-tax, ungeared (100% equity) project cash flows, modelled on an annual basis in real 2021 dollars9.
Financial analysis of the project is based on a “100% equity” basis and the cost of capital is ignored. Results are inclusive of a State Royalty and are on a pre-tax basis, unless stated otherwise.
Trigg engaged CRU, a recognised leader in SOP marketing and market research for the SOP sector. Based on information provided by CRU a flat FOB price of US$550/t SOP (NW Europe) has been assumed for the Project.
An exchange rate of AUD:USD of 0.73, being the spot exchange rate on 1 September 202110 has been assumed.
9 All assumptions and results in this announcement are reported on this basis unless otherwise stated. 10 Reserve Bank of Australia
16
TRIGGMINING.COM.AU
Capital Estimate
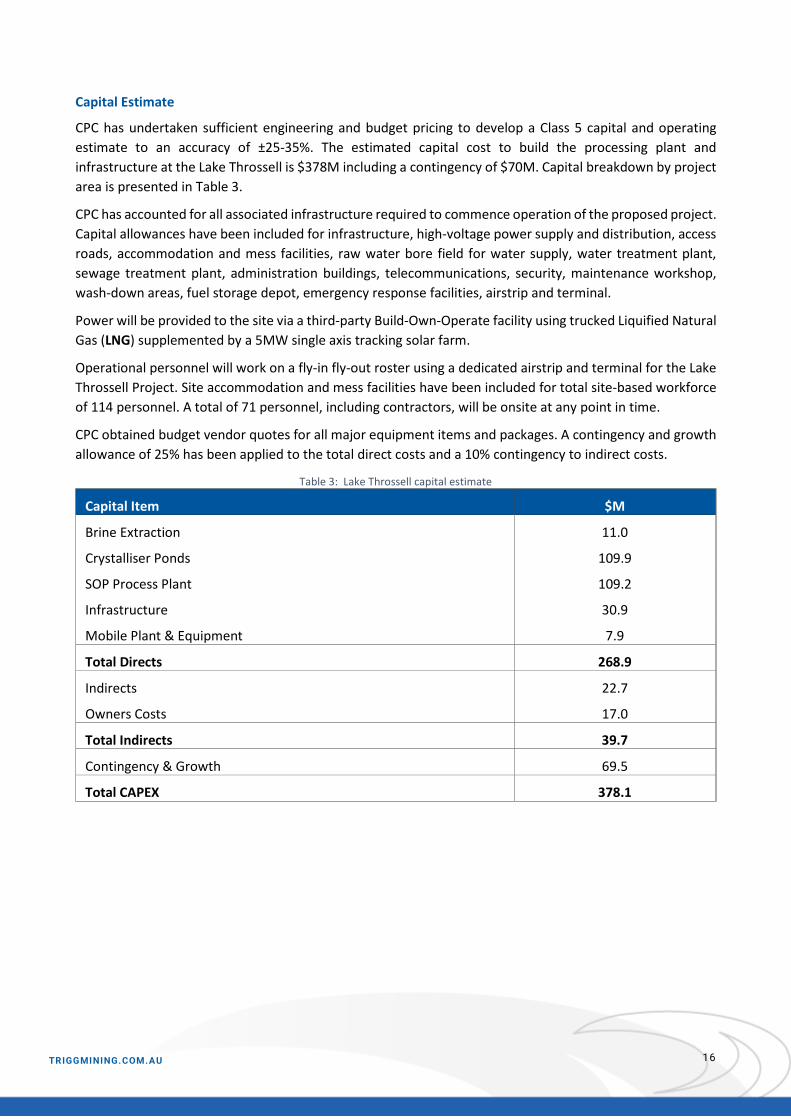
CPC has undertaken sufficient engineering and budget pricing to develop a Class 5 capital and operating estimate to an accuracy of ±25-35%. The estimated capital cost to build the processing plant and infrastructure at the Lake Throssell is $378M including a contingency of $70M. Capital breakdown by project area is presented in Table 3.
CPC has accounted for all associated infrastructure required to commence operation of the proposed project. Capital allowances have been included for infrastructure, high-voltage power supply and distribution, access roads, accommodation and mess facilities, raw water bore field for water supply, water treatment plant, sewage treatment plant, administration buildings, telecommunications, security, maintenance workshop, wash-down areas, fuel storage depot, emergency response facilities, airstrip and terminal.
Power will be provided to the site via a third-party Build-Own-Operate facility using trucked Liquified Natural Gas (LNG) supplemented by a 5MW single axis tracking solar farm.
Operational personnel will work on a fly-in fly-out roster using a dedicated airstrip and terminal for the Lake Throssell Project. Site accommodation and mess facilities have been included for total site-based workforce of 114 personnel. A total of 71 personnel, including contractors, will be onsite at any point in time.
CPC obtained budget vendor quotes for all major equipment items and packages. A contingency and growth allowance of 25% has been applied to the total direct costs and a 10% contingency to indirect costs.
Table 3: Lake Throssell capital estimate
Capital Item $M
Brine Extraction 11.0
Crystalliser Ponds 109.9
SOP Process Plant 109.2
Infrastructure 30.9
Mobile Plant & Equipment 7.9
Total Directs 268.9
Indirects 22.7
Owners Costs 17.0
Total Indirects 39.7
Contingency & Growth 69.5
Total CAPEX 378.1

17
TRIGGMINING.COM.AU
Operating Estimate
CPC has reviewed the operating cost estimate developed for the project and with an expected LOM all-in sustaining cost (AISC) of $372/t SOP (FOB). Table 4 provides a breakdown of the LOM operating cost including production ramp-up phase.
Prior to first production working capital of $34M is required and this has been included in the financial analysis. Sustaining capital allowances have been included for plant and infrastructure ranging between 1.5% to 5.0% of installed equipment cost. Additional sustaining capital is included for the following items:
• Installation of additional production bores as required by the mine schedule
• Increase of the Halite Ponds embankments every 8 years to provide additional halite storage capacity
• Replacement of the mobile fleet every 3-5 years for civil maintenance, KTMS harvesting and haulage, and waste salt haulage
A Tier 1 logistics firm has provided budget prices for SOP product packaging, freight and logistics of Lake Throssell SOP product. The product will be bagged in 1.7t bulk bags and loaded into sea containers. The containers will be transported via sealed road11 (350km) to the railhead at Leonora and loaded on to rail for transport to the container port of Fremantle (900km). The study has assumed that diesel is back hauled by the SOP truck fleet, which is equivalent to one trailer per day, representing a 5% cost saving. Further investigation of back haul options is warranted during the Pre-Feasibility Study.
A Western Australian State Government Royalty of $0.73/t has been included in the operating cost12. A nominal amount has also been included for Native Title compensation.
Table 4: Summary of Lake Throssell operating cost estimate
Operating Item $Mpa $/t SOP
Labour 21.9 91.6
Power 13.1 54.8
Maintenance 7.5 31.5
Reagents & Consumables 9.8 41.2
Harvesting, Haulage & Logistics 25.8 108.1
General & Administration 3.4 14.1
Total Cash Cost 81.5 341.3
Sustaining Capital, royalties, NT compensation and closure costs 7.3 30.8
All in Sustaining Cost (AISC) 88.8 372.1
11 See Infrastructure section for basis of this assumption.
12 The Western Australia Mining Regulations 1981, as amended from time to time, outlines a royalty rate known as Amount A for industrial minerals, salt and gypsum (CaSO4.2H2O) which is also considered a salt. Salt, gypsum and other mixed salts are produced in Western Australia from brines, either from sea water or inland salt-lake/palaeovalley systems through solar evaporation. Trigg Mining intends to produce SOP (K2SO4) which is considered a salt and industrial mineral from brine using solar evaporation.

18
TRIGGMINING.COM.AU
Benchmarking
At the date of this report, SOP is not yet commercially produced in Australia. Currently, there are two ASX listed companies developing brine-hosted SOP projects in Western Australia with both experiencing a level of technical challenges and cost over-runs during the construction and commissioning phases. Given there are no steady-state operating mines producing SOP at nameplate capacity in Australia, the Trigg Mining Board considers it an imperative to benchmark the capital and operating cost assumptions used in this Scoping Study.
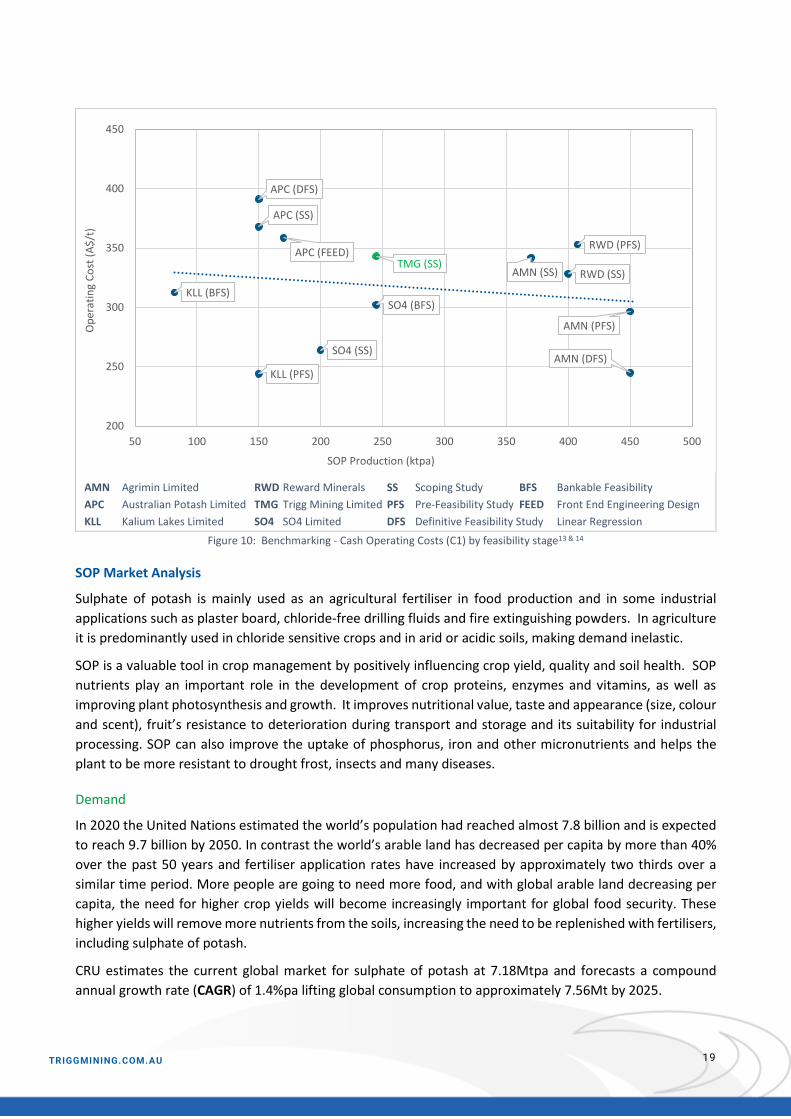
Figure 9 and Figure 10 show the estimated capital and operating costs of Western Australian sulphate of potash projects either in construction or proposed at various stages of economic evaluation. Based on the scale of the Lake Throssell Project, the project is within the range of its peers and is on the more conservative side of the current trend in capital and operating costs.
AMN Agrimin Limited RWD Reward Minerals SS Scoping Study BFS Bankable Feasibility APC Australian Potash Limited TMG Trigg Mining Limited PFS Pre-Feasibility Study FEED Front End Engineering Design KLL Kalium Lakes Limited SO4 SO4 Limited DFS Definitive Feasibility Study Linear Regression
Figure 9: Benchmarking - Capital Costs by feasibility stage13 & 14
13 USD capital costs and operating costs amounts were converted to AUD using the FX rate quoted in the respective study. If no FX rate was provided, a spot rate of 0.76 was used as per June 2021. 14 See Appendix 1 for a list of sources. Kalium Lakes Limited’s FEED, Project Update and Feasibility Study Opex figures have not been quoted in their respective ASX announcements (only AISC) and therefore are not included in the above figure.
APC (SS)APC (DFS)
APC (FEED)AMN (SS)
AMN (PFS)
AMN (DFS)
SO4 (SS)
SO4 (BFS)RWD (SS)
RWD (PFS)
KLL (PFS)
KLL (BFS)
KLL (FEED)
KLL (PU) KLL (FS)
TMG (SS)
0
100
200
300
400
500
600
700
50 100 150 200 250 300 350 400 450 500
Capi
tal C
ost (
$M)
SOP Production (ktpa)
19
TRIGGMINING.COM.AU
AMN Agrimin Limited RWD Reward Minerals SS Scoping Study BFS Bankable Feasibility APC Australian Potash Limited TMG Trigg Mining Limited PFS Pre-Feasibility Study FEED Front End Engineering Design KLL Kalium Lakes Limited SO4 SO4 Limited DFS Definitive Feasibility Study Linear Regression
Figure 10: Benchmarking - Cash Operating Costs (C1) by feasibility stage13 & 14
SOP Market Analysis
Sulphate of potash is mainly used as an agricultural fertiliser in food production and in some industrial applications such as plaster board, chloride-free drilling fluids and fire extinguishing powders. In agriculture it is predominantly used in chloride sensitive crops and in arid or acidic soils, making demand inelastic.
SOP is a valuable tool in crop management by positively influencing crop yield, quality and soil health. SOP nutrients play an important role in the development of crop proteins, enzymes and vitamins, as well as improving plant photosynthesis and growth. It improves nutritional value, taste and appearance (size, colour and scent), fruit’s resistance to deterioration during transport and storage and its suitability for industrial processing. SOP can also improve the uptake of phosphorus, iron and other micronutrients and helps the plant to be more resistant to drought frost, insects and many diseases.
Demand
In 2020 the United Nations estimated the world’s population had reached almost 7.8 billion and is expected to reach 9.7 billion by 2050. In contrast the world’s arable land has decreased per capita by more than 40% over the past 50 years and fertiliser application rates have increased by approximately two thirds over a similar time period. More people are going to need more food, and with global arable land decreasing per capita, the need for higher crop yields will become increasingly important for global food security. These higher yields will remove more nutrients from the soils, increasing the need to be replenished with fertilisers, including sulphate of potash.
CRU estimates the current global market for sulphate of potash at 7.18Mtpa and forecasts a compound annual growth rate (CAGR) of 1.4%pa lifting global consumption to approximately 7.56Mt by 2025.
APC (SS)
APC (DFS)
APC (FEED)
AMN (SS)
AMN (PFS)
AMN (DFS)SO4 (SS)
SO4 (BFS)
RWD (SS)
RWD (PFS)
KLL (PFS)
KLL (BFS)
TMG (SS)
200
250
300
350
400
450
50 100 150 200 250 300 350 400 450 500
Ope
ratin
g Co
st (A
$/t)
SOP Production (ktpa)

20
TRIGGMINING.COM.AU
Supply
There are three main sources of sulphate of potash: Mannheim (50%); natural brines (35%); and sulphate exchange (13%). The Mannheim process and sulphate exchange are considered secondary chemical processes. In the Mannheim process potassium chloride (Muriate of Potash or MOP) is reacted with sulphuric acid at high temperatures, consuming high quantities of energy and producing highly corrosive hydrochloric acid as a waste or by-product. With the high cost of inputs this process has a natural price floor and requires a significant premium over the input costs of MOP and sulphuric acid to remain economic. This process also has a high energy consumption and is also considered to have a high carbon footprint.
When compared to the MOP market, which is largely consolidated with the four largest companies accounting for approximately two-thirds of the global market, the SOP market is considered fragmented. This is largely related to the Mannheim process where furnaces are rarely larger than 25,000tpa. Additionally, they need to source hydrochloric acid consumers which often caps their capacity. In contrast, natural brine operations are significantly larger, but are considered rare. The main global sources of brine SOP are in China (Lop Nur), Chile (Salar de Atacama) and the United States (Great Salt Lakes).
In Australia two companies are currently constructing brine-sourced SOP projects for a combined annual output <5% of the global 2025 market when they are expected to reach nameplate capacity. At 245ktpa the Lake Throssell SOP Project production volume will represent an additional 3% of the forecast 2025 global demand and Lake Throssell may become a Top 10 producer, globally (see Figure 11).
Overall CRU forecasts the SOP market to remain reasonably balanced with demand growth absorbing the new supply.
Primary Production (brines) Secondary Production Trigg Mining - Lake Throssell
Figure 11: Global 2025 forecast production rates, showing Lake Throssell SOP Project (Source: CRU July 2021, Trigg analysis)
0
200
400
600
800
1,000
1,200
1,400
1,600
1,800
2,000
1 2 3 4 5 6 7 8 9 10 11 12 13 14 15 16 17 18 19 20 21
Annu
al S
OP
Prod
uctio
n (t
onne
s)
Global SOP Producers
Lake Throssell

21
TRIGGMINING.COM.AU
Global SOP Cost Curve
CRU has generated a forecast global SOP industry cost curve, FOB, for 2024. Based on a total cash cost of A$341/t SOP (US$249/t SOP), the Lake Throssell SOP Project sits in the first quarter of the global cost curve (see Figure 12).
Primary Production (brines) Secondary Production Trigg Mining - Lake Throssell
Figure 12: Global 2024 SOP Industry FOB cost curve (Source: CRU July 2021, Trigg analysis)
Pricing Assumptions
SOP prices have remained reasonably steady over the past decade. Over the 10-years to June 2021 the Northwest (NW) Europe SOP (FOB standard bulk) benchmark price averaged US$528/t and traded in a band between US$478/t (Q1 2017) and US$576/t (Q2 2014). In recent months the SOP benchmark price has spiked due to strong demand, high crop prices, tight supply and shipping disruptions. Argus Potash quoted a price range on 2 September 2021 of US$650-700/t15 (NW Europe FOB standard).
CRU has forecasted a NW Europe SOP price of US$605/t for 2021 and an average of US$578t/t for the outlook period to 2025 (see Figure 13).
Trigg has assumed a SOP price of US$550/t for this Study which is in line with its Australian SOP peers, CRU’s historical 10-year average of US$528/t, the CRU 5-year forecast average of US$578/t and is considerably lower than the current quoted price of US$650-700/t.
Trigg plans to produce a bagged granular product which attracts a price premium of approximately US$25/t over the NW Europe FOB standard price. This premium has not been taken into account in the price forecast assumption in this Study.
15 Argus Media Potash 2 September 2021, USD:EUR exchange rate of 0.8435
Ope
ratin
g Co
st
Global Annual Production
Lake Throssell

22
TRIGGMINING.COM.AU
Figure 13: Northwest Europe FOB Historical and forecast price
(Sources: CRU July 2021 and Argus Media August 2021 with Trigg Analysis)
Economic Assessment
The Scoping Study delivered robust financial metrics as presented in Table 5.
Table 5: Project Evaluation Summary16,17,18 Item 21-Year LOM
Average LOM Revenue from SOP Sales $180Mpa
Average LOM Operating Costs $341/t
Total Operating Profit (EBITDA, incl. WA Royalty and NT Compensation) $97Mpa
Pre-tax NPV8 $364M
Pre-tax IRR 18%
Payback Period (from first production SOP) 4.5 years
Sensitivity of the pre-tax Net Present Value (NPV8) to changes in key assumptions is set out in Figure 14. The Lake Throssell SOP Project NPV is most sensitive to changes in the SOP price, exchange rate, discount rate and production rate assumptions. The Project NPV is least sensitive to the capital cost and operating costs.
Estimated pre-tax project cash flows for the construction period and the first ten years of production are shown in Figure 15. After a two-year construction period, first SOP sales will commence at the beginning of the third year. Net cash flows will become positive after 2 years from start of construction, ramping up to approximately $97M per annum after 5 years from commencement of production, which will be maintained
16 NPV8 calculated on a pre-tax, ungeared (100% equity) project cash flows, modelled on an annual basis in real 2021 dollars using an 8% discount. 17 Operating costs, project revenues and EBITDA determined over the LOM including project ramp-up period. 18 Average LOM Revenue from SOP Sales includes royalties.
350
400
450
500
550
600
650
700
Q3
2011
Q1
2012
Q3
2012
Q1
2013
Q3
2013
Q1
2014
Q3
2014
Q1
2015
Q3
2015
Q1
2016
Q3
2016
Q1
2017
Q3
2017
Q1
2018
Q3
2018
Q1
2019
Q3
2019
Q1
2020
Q3
2020
Q1
2021
Q3
2021
Q1
2022
Q3
2022
Q1
2023
Q3
2023
Q1
2024
Q3
2024
Q1
2025
Q3
2025
NW
Eur
ope
SOP
Pric
e (U
S$/t
)
Actual Scoping Study Assumption 5yr Forecast Average
ForecastActual

23
TRIGGMINING.COM.AU
throughout the remainder of the 21-year project life. Cumulative LOM pre-tax net cash flow is approximately $1.85 billion.
An allowance of $25M has been included in the financial model for final closure of the project at the end of its mine life.
Figure 14: Pre-Tax NPV8 Sensitivity Analysis19
Figure 15: Pre-Tax Net Project Cash Flow
19 The Scoping Study has assumed a base case royalty rate of A$0.73/t. Figure 12 shows the sensitivity range between A$0.73/t to A$38/t (or 5%)
34
60
66
71
78
131
144
34
68
66
78
160
144
-250 -200 -150 -100 -50 0 50 100 150 200 250
CAPEX: A$378M ± 10%
Discount Rate: 8% ± 1%
OPEX: A$343/t ± 10%
Royalty: $0.73/t ($0.73 - $38/t)
Production: 245kpta ± 10%
FX: US$0.73 ± 10%
SOP Price: US$550/t ± 10%
Change in Project NPV8 ($M)
Base Case ($364M)
(250)
(200)
(150)
(100)
(50)
0
50
100
150
200
250
1 2 3 4 5 6 7 8 9 10 11 12 13 14 15 16 17 18 19 20 21
Cash
flow
($M
pa)
Years
SOP Revenue Opex Sustaining Capital Initial Capex Pre-tax Cashflow

24
TRIGGMINING.COM.AU
Legal, Tenure and Environmental Approvals
A review of governmental department and other key stakeholders, secondary approval requirements and other compliance requirements was considered as part of the Scoping Study. The Project is currently compliant with legal, tenure and environmental permitting requirements.
Environmental baseline monitoring has commenced and is on track for the first full season to be completed in Q4 2021. Trigg intends to commence preparing its Environmental Scoping Document early next calendar year for submission to the Department of Water and Environmental Regulation for assessment. This will outline the scope of the environmental impact studies required to be completed for the Project.
The Company will require additional tenure for the development of the Project for the SOP process plant, access road and other infrastructure required for the operations. The Scoping Study has identified the regulatory approvals and permits required for the development of the Project.
Heritage and Native Title
Trigg recognises the holders and claimants of native title over the project lands: the Ngaanyatjarra Lands People to the northwest of the Great Central Road, the Nangaanya-Ku southeast of the Great Central Road and the Yilka Talintji to the west. Agreements with each of these groups will need to be settled prior to Final Investment Decision to address the impacts of the project on country.
Project Funding
Financing for the Lake Throssell SOP Project has not yet been secured, however based on the positive NPV and on receipt of all requisite approvals, there is reasonable basis to assume that the necessary funding for the Project is achievable.
Trigg will consider a range of funding sources, with the objective of securing the most cost competitive and value maximising option for the Company.
Given the scale of the operation, the Project is expected to generate substantial free cash flow per year to service debt, which will enhance the debt capacity of the Project. As a result, a greater percentage of debt funding may be achievable when compared to smaller scale, lower margin SOP projects.
Trigg plans to pursue a range of debt options, including Export Credit Agency (ECA) covered debt finance and senior-secured project debt finance. The Company’s preference is to secure ECA financing as this option has lower funding costs, is longer-term, and the potential to support larger debt sizing than conventional senior-secured project finance debt.
Trigg will explore all available funding options to for the Project with the preferred debt funding route to likely comprise a blend of ECA funding supplemented by project debt finance from a consortium of banks. Analysis shows that the Project can support sufficient debt funding of approximately 50% of the upfront capital expenditure, subject to the assumed production target.
Trigg has commenced early discussions with potential off-takers with respect to securing offtake for the Project. Trigg will preferentially engage with offtake counterparties that may contribute funding to the Project which may include: conventional equity at the corporate and/or project level; convertible notes or bond; debt financing in the form of either conventional project debt financing, prepayment for product or royalties; or a combination of the above.
Trigg’s current market capitalisation is approximately $13M (as at 1 September 2021). The Company remains confident that its market capitalisation will increase as it continues to de-risk, secure offtake, debt financing and execute the development of the Lake Throssell SOP Project. Sources of equity funding may include

25
TRIGGMINING.COM.AU
private equity funds specialising in resource project investment; institutional funds; strategic investors; and high net worth, sophisticated and retail investors. Depending on market conditions, the equity component may be structured with a combination of ordinary and hybrid equity.
Given the above, the Company has concluded that it has a reasonable basis to expect that the upfront project capital cost could be funded following the completion of a positive bankable feasibility study and obtaining the necessary project approvals.
Forward Work Plan
An investment decision for the Lake Throssell SOP Project is expected to occur in mid to late 2025. The Scoping Study has identified no critical technical flaws, and a Pre-Feasibility Study is expected to be completed by early 2023. Environmental approvals are on the critical path of the project development schedule shown in Figure 16.
Figure 16: Scoping Study Indicative Project Schedule20
20 Subject to availability of funding and resources.

26
TRIGGMINING.COM.AU
Resource definition work will continue in the first half of 2022 with the installation of approximately five test production bores installed along the strike of the palaeovalley. The aim of this work will be to obtain the data needed to determine an Ore Reserve. Once these test bores have been installed and tested this will allow the hydrogeological resource model to be calibrated. Upon completion of this work there will be limited resource development work required through to Bankable Feasibility Study.
Preliminary geotechnical investigation work is planned later this year to confirm the location of the evaporative crystalliser ponds. This work will be followed up next year with a test pit program to finalise project location and identification of suitable borrow material for construction of the pond embankment walls.
Apart from permitting and approvals, the main critical path for engineering and project development, is the construction of a demonstration evaporative crystalliser field to grow sufficient KTMS for ongoing flowsheet development, piloting and vendor testing. Trigg is planning to commence field trials in late calendar year 2022 and the Company will continue to operate the trial pond field through to commencement of construction to fully understand control of the brine and crystalliser fields and environmental factors that influence KTMS salt quality.
The production scheduled in this Study does not include 8.5Mt of drainable Inferred Mineral Resource or the Exploration Target of 2.6 - 9.4Mt of drainable SOP at 4,261 – 4,616gm/L K (or 9.1 - 10.0kg/m3 K2SO4) as released to the ASX on 26 July 2021. Should further exploration increase the confidence in the estimation of this material there is potential to continue operations longer than the Study case of 21 years. Trigg plans to continue exploration on the Lake Throssell Project and the nearby Lake Yeo Project which lies from 35km to the south of Lake Throssell covering an area of 1,915km2 with over 200km2 of playa area and approximately 130km of interpreted palaeovalley along the interpreted strike extension of Lake Throssell, subject to funding and the grant of tenure.
This announcement was authorised to be given to ASX by the Board of Directors of Trigg Mining Limited.
Keren Paterson
Managing Director & CEO Trigg Mining Limited
For more information please contact:
Keren Paterson
Managing Director
Trigg Mining Limited
(08) 6114 5685 [email protected]
Nicholas Read
Investor and Media Relations
Read Corporate
(08) 9388 1474 [email protected]
27
TRIGGMINING.COM.AU
Appendix A: Competent Persons & Cautionary Statements Competent Person Statements
The information in this announcement that relates to the Exploration Results, Mineral Resources and Exploration Target is based upon information compiled by Mr Adam Lloyd, who is employed by Aquifer Resources Pty Ltd, an independent consulting company. Mr Lloyd is a Competent Person who is a Member of the Australian Institute of Geoscientists and has sufficient experience relevant to the style of mineralisation and type of deposit under consideration and the activity to which is being undertaking to qualify as a Competent Person for reporting of Exploration Results, Mineral Resources and Ore Reserves as defined in the 2012 edition of the “Australasian Code for Reporting of Exploration Results, Mineral Resources and Ore Reserves”. Mr Lloyd consents to the inclusion in the announcement of the matters based upon the information in the form and context in which it appears.
The information in this announcement that relates to process design and associated Project infrastructure is based on information compiled by Dr Anthony Chamberlain who is an employee of Trigg Mining Limited and a Member of the Australian Institute of Mining and Metallurgy. The process design criteria were derived from an evaluation of the Lake Throssell concept study completed by Hatch Engineering, and benchmarking against performance of similar potash flowsheets. Dr Chamberlain has sufficient experience, which is relevant to the style of mineralisation and type of deposit under consideration and to the activity, which he is undertaking to qualify as a Competent Person as defined in the JORC code. Dr Chamberlain consents to the inclusion in the report of the matters based on his information in the form and context which it appears.
Cautionary Statement Regarding Forward Looking Statements
Some statements in this announcement regarding estimates or future events are forward-looking statements. They include indications of and guidance on, future earnings, cash flow, costs and financial performance. In addition, statements regarding plans with respect to the Company’s mineral properties may contain forward-looking statements.
Forward-looking statements include, but are not limited to, statements preceded by words such as “planned’, “expected”, “projected”, “estimated”, “may”, “scheduled”, “intends”, “anticipates”, “believes”, “potential”, “could”, “nominal”, “conceptual” and similar expressions. Forward-looking statements, opinions and estimates included in this announcement are based on assumptions and contingencies which are subject to change without notice, as are statements about market and industry trends, which are based on interpretations of current market conditions.
Forward-looking statements are provided as a general guide only and should not be relied on as a guarantee of future performance. Forward-looking statements may be affected by a range of variables that could cause actual results to differ from estimated results and may cause the Company’s actual performance and financial results in future periods to materially differ from any projections of future performance or results expressed or implied by such forward-looking statements. These risks and uncertainties include but are not limited to liabilities inherent in mine development and production, geological, mining and processing technical problems, the inability to obtain mine licences, permits and other regulatory approvals required in connection with mining and processing operations, competition for among other things, capital, acquisitions of reserves, undeveloped lands and skilled personnel; incorrect assessments of the value of acquisitions, changes in commodity prices and exchange rates; currency and interest rate fluctuations; various events which could disrupt operations and/or the transportation of 14 mineral products, including labour stoppages and severe weather conditions; the demand for and availability of transportation services; the ability to secure adequate financing and management’s ability to anticipate and manage the foregoing factors and risks. There can be no assurance that forward-looking statements will prove to be correct.
Statements in relation to future matters can only be made where the Company has a reasonable basis for making those statements.

28
TRIGGMINING.COM.AU
The Company notes that an Inferred Resource has a lower level of confidence than an Indicated Resource and that the JORC Code (2012 Edition) advises that to be an Inferred Resource it is reasonable to expect that the majority of the Inferred Resource would be upgraded to an Indicated Resource with continued exploration. Based on advice from relevant Competent Persons, the Company has a high degree of confidence that the Inferred Resources for the Lake Throssell SOP Project will upgrade to Indicated Resources with further exploration work.
This announcement has been prepared in compliance with the JORC Code 2012 Edition and the current ASX Listing Rules.
The Company believes that it has a reasonable basis for making the forward-looking statements in this announcement, including with respect to any production targets, based on the information contained in this announcement and in particular:
i) Trigg Mining owns 100% of the Lake Throssell SOP Project and has a sufficient Mineral Resources that the Company is confident it can secure product offtake contracts to support the development of the Project. Future development of the Project is dependent on technical and economic hurdles.
ii) The Company plans to undertake further resource definition work to improve the Mineral Resource status of the Basal aquifer. A test production bore and aquifer testing program is planned and the company’s Resource Consultant has a high level of confidence to convert a high proportion of the remaining Inferred Resource to Indicated and Measured status following positive test pumping and geophysical results. The results of the program will allow calibration of the existing solute transport model and may allow an Ore Reserve to be estimated in conjunction with future evaluation studies.
iii) The Scoping Study was completed by CPC Project Design Pty Ltd (CPC) with an estimating accuracy of ±25-35%. CPC is a well-recognised engineering construction and project development firm with an established team and project experience covering Western Australia and multiple mineral types. CPC has compiled the capital and operating cost estimates and provided sign-off for the Scoping Study level cost estimates (excluding Trench Network, Brine Borefield and Owner’s costs) based on the mining schedule and estimated mine operating costs provided by Aquifer Resources. Capital and operating cost estimates was prepared by CPC in accordance with their ISO9001 accredited Project Design Guidelines – Capital and Operating Cost Estimate (CPC-ES-W-001 Revision 3).
iv) An opinion provided to the Company by Euclase Capital in relation to the future potential funding available from global capital markets to finance development of the Lake Throssell Project. This evaluation included, but was not limited to, a consideration of: the estimates of Trigg and leading industry commentators/participants in relation to likely future potash price levels; the size and relative forecast economic parameters of the Lake Throssell Project versus other potash development projects; jurisdictional location of the Lake Throssell Project; potential for the Lake Throssell Project to attract long term off-take contract interest; current Trigg market capitalisation relative to expected future finance requirements for the Lake Throssell SOP Project; and relevant Trigg management experience in developing greenfield mining projects in Western Australia and elsewhere.

29
TRIGGMINING.COM.AU
Appendix B: Peer Analysis Source Data Relating to Figure 9 and Figure 10 of this Report.
Company Feasibility Study Source
APC SS Australian Potash Scoping Study ASX release - 23 March 2017
APC DFS Australian Potash Definitive Feasibility Study ASX release - 28 August 2019
APC FEED Australian Potash Front End Engineering Design ASX release - 20 April 2021
AMN SS Agrimin Limited Scoping Study ASX release - 23 August 2016
AMN PFS Agrimin Limited Pre-Feasibility Study ASX release - 7 May 2018
AMN DFS Agrimin Limited Definitive Feasibility Study ASX release - 21 July 2020
SO4 SS Salt Lake Potash Limited Scoping Study ASX release - 13 June 2019
SO4 BFS Salt Lake Potash Limited Bankable Feasibility Study ASX release - 11 October 2019
RWD SS Reward Minerals Scoping Study ASX release - 2 April 2015
RWD PFS E Reward Minerals Pre-Feasibility Study (Enhanced) ASX release - 13 July 2018
KLL PFS Kalium Lakes Limited Pre-Feasibility Study ASX release - 3 October 2017
KLL BFS Kalium Lakes Limited Bankable Feasibility Study ASX release - 18 September 2018
KLL FEED Kalium Lakes Limited Front End Engineering Design ASX release - 4 March 2019
KLL PU Kalium Lakes Limited Project Update & Presentation ASX release - 21 May 2020
KLL FS Kalium Lakes Limited Feasibility Study ASX release – 18 Aug 2021

1
Appendix C
Lake Throssell Sulphate of Potash Project
Mineral Resource Report
For Trigg Mining Limited
5 October 2021

Lake Throssell Sulphate of Potash Project September 2021 Resource Estimate Reported in Accordance with JORC Code 2012
2
Version Prepared By Date
Rev 1a A Lloyd 5/10/2021
Contents
1. Introduction................................................................................................................................................... 4
1.1. Site Setting ............................................................................................................................................... 4
2. Geology and Hydrogeology ....................................................................................................................... 5
2.1. Regional ................................................................................................................................................... 5
2.1.1. Archaean ............................................................................................................................................. 5
2.1.2. Proterozoic .......................................................................................................................................... 6
2.1.3. Permian ................................................................................................................................................ 6
2.1.4. Cenozoic .............................................................................................................................................. 7
2.1.5. Structure .............................................................................................................................................. 8
2.2. Local Geology ......................................................................................................................................... 8
3. Hydrogeology ............................................................................................................................................. 10
4. Summary of Exploration ........................................................................................................................... 11
4.1. Surficial Aquifer ..................................................................................................................................... 12
4.1.1. Hand Auger Drilling and Sampling ................................................................................................. 12
4.1.2. Rotary Auger Drilling and Sampling .............................................................................................. 12
4.1.3. Lake Surface Test Pumping............................................................................................................ 12
4.2. Basal Aquifer ......................................................................................................................................... 16
4.2.1. Gravity Geophysical Survey ........................................................................................................... 16
4.2.2. Air-core Drilling ................................................................................................................................. 16
5. Geological Summary ................................................................................................................................ 17
6. Hydrogeological Characteristics ............................................................................................................. 19
7. Brine Characteristics ................................................................................................................................. 21
8. Porosity and Specific Yield ...................................................................................................................... 23
9. Numerical Modelling ................................................................................................................................. 25
9.1. Model aims and set up ......................................................................................................................... 25
9.2. Trench Abstraction Simulation ............................................................................................................ 26
9.3. Production Bore Abstraction Simulation ............................................................................................ 29
9.4. Model Summary .................................................................................................................................... 31
10. Mineral Resource Estimation Methodology ...................................................................................... 31
11. Exploration Target ................................................................................................................................ 38
12. Mine Plan ............................................................................................................................................... 39

Lake Throssell Sulphate of Potash Project September 2021 Resource Estimate Reported in Accordance with JORC Code 2012
3
APPENDIX 1 – Drill hole and assay tables
APPENDIX 2 – JORC (2012) Tables

Lake Throssell Sulphate of Potash Project September 2021 Resource Estimate Reported in Accordance with JORC Code 2012
4
1. Introduction
The Lake Throssell Potash Project is 100% owned and operated by Trigg Mining Limited (Trigg) and lies approximately 180 km north-east of Laverton, situated on a granted Exploration Licence (E38/3065). Trigg has a total of 1,084 km2 of exploration tenure granted or pending approval across Lake Throssell.
Trigg Mining engaged Aquifer Resources to complete a Mineral Resource Estimate and Mine Plan for the Lake Throssell Project in support of the Lake Throssell Potash Project Scoping Study. This Mineral Resource Report provides details on the data and methodology used in determining the updated Mineral Resources and a Mine Plan to support the Production Target.
The basis of the updated Mineral Resource and establishment of a Mine Plan are the results from review of logging and mapping of high permeability sediments in the basal aquifer and groundwater flow and solute transport modelling for the Lake Throssell aquifer system. This has allowed conversion of the highest permeability sediments of the basal aquifer system to be converted from Inferred Mineral Resources to Indicated Mineral Resources. The modelling outputs have been used to determine an abstraction regime that supports a Mine Plan and Production Target.
1.1. Site Setting
The project area at Lake Throssell is characterised broadly by three different topographical features.
To the north of the lake, the topography is generally higher where bedrock outcrop is present with sparse vegetation intersected with some breakaways and deeper ephemeral creek lines that may discharge during rainfall events onto the lake surface.
The lake area is flat, the lake surface is divided by lunette islands which intersect the playa. Distances between islands ranges from hundreds of metres to up to 2.5 km in diameter. The islands are elevated up to 8m above the surface of the lake and a mainly formed of gypsonite and sand dunes. The gypsonite zones are representative to be the old playa surface which has been eroded away through the process of geological deflation, developed through wind processes.
The area south of the lake shoreline is generally flat with localised areas of bedrock outcrop, which extends to and beyond the Great Central Road. There are virtually no creek lines developed in this area.
The Lake Throssell location and regional catchment is present in Figure 1. the upstream catchment is approximately 48,000 km2 and extends approximately 450 km to the northeast.

Lake Throssell Sulphate of Potash Project September 2021 Resource Estimate Reported in Accordance with JORC Code 2012
5
Figure 1: Regional Topography and Catchments
2. Geology and Hydrogeology
2.1. Regional
Lake Throssell is located on the margin of the Achaean Yilgarn Craton and the Proterozoic Officer Basin. There has been little in the way of previous mapping of the regional geology in the Lake Throssell area, the only deep drill hole is the BMR (Bureau of Mineral Resources, Geology and Geophysics) Throssell 1 located to the north of Lake Throssell, otherwise the regional geology has been based on outcrop mapping and geophysical interpretation. The regional geology has been described by Bunting et al (1978) in the 1:250,000 Geological Series Explanatory Notes for the Throssell Sheet SG/51-15. A summary is described below. The geology of the region is presented in Figure 2.
2.1.1. Archaean
Archaean rocks are exposed to the west of Lake Throssell on the south-western pending tenements, elsewhere the crystalline basement is covered by flat-lying Proterozoic or Permian bedrock or Cenozoic cover.
Within the granite terrain, greenstone areas form isolated north-northwest-trending metamorphic belts. No greenstones belts have been mapped within the Lake Throssell vicinity, the nearest is in the vicinity of the Gruyere mine site, approximately 40km, southwest of the Lake.
The greenstone belts are intruded and broken up by granitic rocks ranging from granite to tonalite in composition. The granitic rocks account for approximately 90 per cent of the Archaean rocks outcropping in the region as part of the Yilgarn Craton. The granite is typically covered by superficial deposits and can be deeply weathered.

Lake Throssell Sulphate of Potash Project September 2021 Resource Estimate Reported in Accordance with JORC Code 2012
6
2.1.2. Proterozoic
Proterozoic rocks outcrop on either side of the palaeovalley north from Lake Throssell. They have been grouped into the same informal sequence, here called the Older and Younger Proterozoic. The Proterozoic to the east of the Throssell Palaeovalley is thought to form part of a Younger Proterozoic sequence. The paucity of outcrop, lack of structural information and absence of contact relationships means, however, that this subdivision of the Proterozoic within the area is tentative.
Early Proterozoic A flat-lying to very gently north-dipping undeformed sequence of quartz and glauconitic arenite, overlain by multicoloured oolitic and intraclastic sandstone, fine-grained flaggy micaceous sandstone and siltstone, unconformably overlies Archaean granite. The quartz arenite is medium to coarse grained, well sorted, and sub-rounded to well-rounded with a siliceous cement. Glauconite is present in places and forms up to 10 per cent of the rock. The multi-coloured sandstone contains ferruginous ooids with poor concentric zoning.
The outcrops in area represent only the basal 30 to 40 m of a sequence which is several thousands of metres thick and much better exposed in areas to the northwest. A tentative stratigraphy for the whole sequence has been suggested are equivalent to their Yezma Sandstone, and Frere Formation, respectively.
Late Proterozoic A thin sequence of Younger Proterozoic rocks overlies the Older Proterozoic in the east of the Throssell Palaeovalley. The presence of the younger sequence is based largely on extending the interpretation of seismic results into this area and supplementing it with sparse outcrop information.
Based on the seismic interpretation, a thin interval (less than 400 m) of Younger Proterozoic rocks overlays the Older Proterozoic sequence. To the east of the Throssell area this sequence thickens to a maximum of about 7000 m.
The only other information on the Younger Proterozoic sequence in the area is that provided by stratigraphic drill hole BMR Throssell 1. This hole intersected 101 m of palaeovalley fill sediments before penetrating 97 m of indurated claystone, siltstone and sandstone, which correlate with the Proterozoic Babbagoola Beds.
2.1.3. Permian Paterson Formation The Lower Permian Paterson Formation is an extensive, thin, flat-lying terrestrial formation that forms the bedrock in all but the northern areas of the Lake Throssell project. Although the rocks comprising the formation have commonly been affected by duricrusting processes, there are good outcrops in prominent breakaways on the north and southern sides of the Throssell palaeovalley.
Although the formation is probably not much more than about 100 m thick throughout much of the Sheet area, the outcrops contain a wide range of rock types, reflecting the formation’s complex glacial, fluvial, and lacustrine depositional environments. Generally, it consists of laminated claystone and siltstone containing rare erratic pebbles and cobbles, but beds highly disturbed by slumping at a time of formation or slightly after are also present. The lacustrine unit is overlain by 13 m of fluvial, conglomeratic to very coarse-grained, pebbly sandstone, containing well developed decimetre-scale trough cross-stratification. The upper unit has a sharp erosional base with well-developed channels; it rests on a 2-m thick paleosol developed at the top of the lacustrine facies.
The Paterson Formation unconformably overlies Archaean basement in the south-central part of the project area and Proterozoic quartzite towards the northwest. Palynological studies of samples from the formation in adjacent areas date it as Early Permian.

Lake Throssell Sulphate of Potash Project September 2021 Resource Estimate Reported in Accordance with JORC Code 2012
7
2.1.4. Cenozoic Silcrete The silcrete is a grey-green, silicified, poorly to well sorted sandstone, composed of angular to rounded quartz grains (rarely chert, chalcedony or quartzite). The matrix is opaque microcrystalline silica with minor chalcedony and is locally ferruginized.
The silcrete forms a resistant, slightly undulating capping up to 2m thick, preferentially developed over quartz-rich Permian and deeply weathered Precambrian rocks. It is generally massive or cavernous. Weathering of the capping produces a colluvium of spherical boulders.
In places laterite is developed over silcrete, indicating that the silcrete is older than the laterite. However, they may have formed at the same time. The silcrete is thought to be Miocene or older.
Laterite Laterite occurs patchily throughout the area but is best developed in areas of Archaean mafic and ultramafic rock. In these areas it is a ferruginous, pisolitic to massive crust, generally grading directly into bedrock. To the east of the project area the laterite profile grades upwards into a loose, progressively less-densely packed ironstone, and eventually into sand with scattered pisoliths.
Calcrete The term calcrete is used to describe impure carbonate deposits in relict drainage systems. The calcrete is nodular, laminated, massive, or cavernous, and is composed of calcium carbonate with fragments of quartz, laterite and silcrete. BMR Throssell 1 penetrated 27 m of calcrete. Textures indicate that the carbonate has filled voids, and has both replaced and pushed apart pre-existing clasts, chalcedonic silica replacement is common. The major relict drainage systems, including Lake Throssell, and Lake Yeo, and a north-trending palaeovalley, contain extensive deposits of calcrete.
Colluvium and alluvium Rock fragments, sand, silt, and clay at the foot of hills and breakaways, on long gentle slopes, and in depressions and water courses have been mapped as one unit. This unit is formed mainly by sheet-wash down uniform slopes, and channel flow in ephemeral streams. These sediments are still being deposited and older ones reworked. Aeolian sediments may be intermixed with the colluvium, and boundaries with the aeolian sandplain arc often gradational. Thickness of the colluvium and alluvium averages a few metres, but maybe up to 20m in the palaeovalley.
Aeolian sandplain deposits A substantial portion of the area is covered by a veneer of red quartz sand, which forms a gently undulating plain with longitudinal dunes developed on it.
Most dunes are between 5 and 10 m high and up to 10 km long. They are mostly sub-parallel and trend eastwards, although east of Lake Throssell there is a pronounced change in orientation to a north-easterly trend. Angles formed by merging dunes generally open westward, indicating that the dunes were formed by westerly winds.
Lake and associated deposits Lakes Throssell is a portion of an infilled relict trunk drainage system (palaeovalley) and now ponding areas for the present internal drainage. Recent deposits of gypsiferous and saline clay, silt, and sand occur in the salt lakes and claypans. Lake-derived aeolian deposits of mainly silt and sand form lunette dunes and sheets associated with the salt lakes. Gypsum and quartz are the main constituents; halite is minor. Dunes of flour textured gypsum up to 10 m high occur predominantly on the eastern (lee) side of larger salt lakes.
Next to the lakes there are commonly flat areas of loamy colluvium with small claypans. These are largely composed of silt and gypsiferous material derived by wind action from salt lakes. BMR Throssell 1 penetrated Cainozoic lacustrine deposits from about 27 m to 101 m.

Lake Throssell Sulphate of Potash Project September 2021 Resource Estimate Reported in Accordance with JORC Code 2012
8
2.1.5. Structure
The project area is situated near the northeast margin of the Yilgarn Block, a stable craton of Archaean age. To the north and east the Archaean rocks underlie almost undisturbed flat-lying Proterozoic and Phanerozoic sediments of the Nabberu and Officer Basins. Seismic traverses along the southeast side of Lake Throssell suggest that the eastern edge of the Yilgarn Block is a major fault with a downthrow to the northeast of some 7,000 m. Within the basin sediments there appears to be some faulting in a north-west to south-east direction, which underlie Lake Throssell at depth.
2.2. Local Geology
The geology of the lake and palaeovalley sequence is consistent with other comparable sequences in the region. The shallow surficial sediments of the lake surface are dominated by an evaporite surface, comprised of mostly of gypsum, underlain by more silty and clayey sequences with occasional thin granular and calcrete zones.
These surficial lithologies lie on top of a thick sequence of stiff lacustrine clay, which acts as a regionally confining aquitard with very low vertical hydraulic conductivity, meaning it hydraulically separates the shallow sediments of the palaeovalley from the sediments beneath the clay. Below the lacustrine clay sequence is a fine to medium grained basal sand with silty and clayey bands of fluvial origin, estimated to be between Eocene and Pliocene age. At the base of this fluvial system is the contact with the Permian age Paterson Formation, a palaeosurface that represents up to 200 million years of weathering, erosion, and deposition. In the deepest sections of the palaeovalley, the Paterson Formation is an unconsolidated fluvial glacial deposit of gravel, sand, and silt.
On the margins of the palaeovalley, the Paterson Formation is present at outcrop as dark to light grey poorly sorted siltstone, mudstone, sandstone, and quartzite, with conglomerate beds. Thick saprolite zones are present up to 50m in thickness where exposed on the palaeovalley margins, often dominated by silt and fine sand. Unconsolidated glacial fluvial sediments of mixed gravel and minor silt are present within this saprolite zone which are likely to be representative of either in-situ weathering or local colluvial deposits when at the contact with the overlying Cenozoic sediments. A conceptual cross section of the geology is presented in Figure 3.

Lake Throssell Sulphate of Potash Project September 2021 Resource Estimate Reported in Accordance with JORC Code 2012
9
Figure 2: Mapped Geology (Bunting et al (1978))
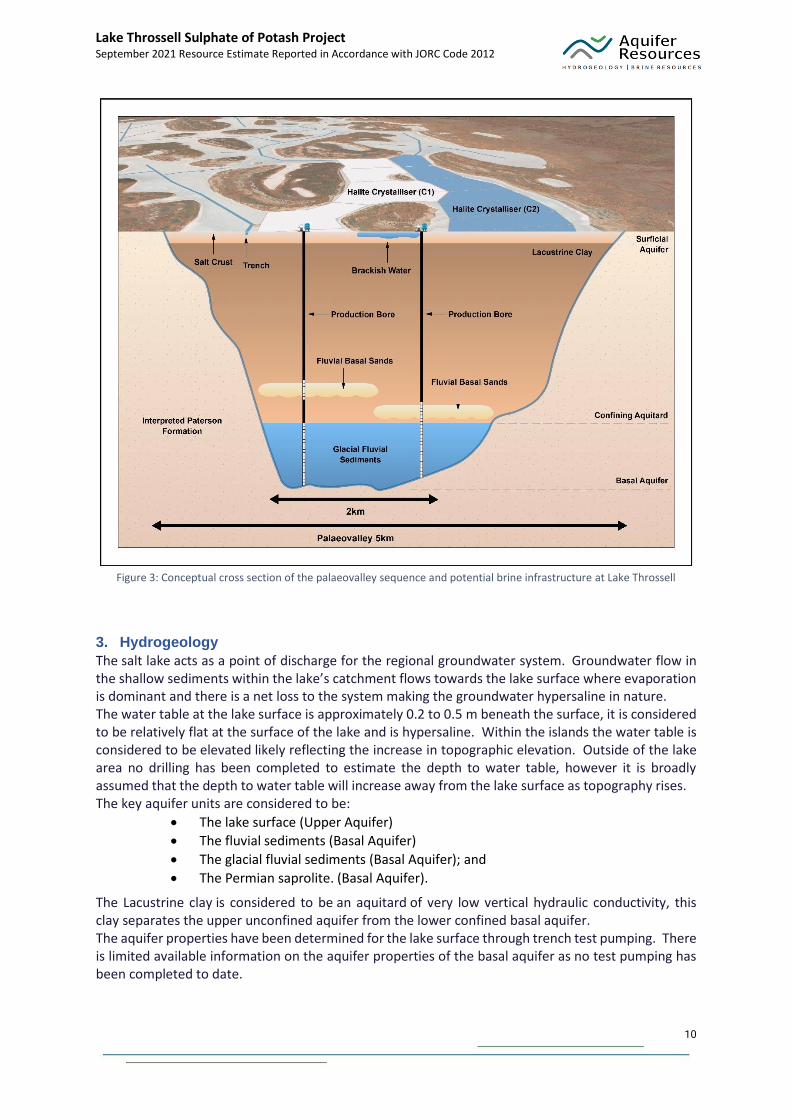
Lake Throssell Sulphate of Potash Project September 2021 Resource Estimate Reported in Accordance with JORC Code 2012
10
Figure 3: Conceptual cross section of the palaeovalley sequence and potential brine infrastructure at Lake Throssell
3. Hydrogeology
The salt lake acts as a point of discharge for the regional groundwater system. Groundwater flow in the shallow sediments within the lake’s catchment flows towards the lake surface where evaporation is dominant and there is a net loss to the system making the groundwater hypersaline in nature. The water table at the lake surface is approximately 0.2 to 0.5 m beneath the surface, it is considered to be relatively flat at the surface of the lake and is hypersaline. Within the islands the water table is considered to be elevated likely reflecting the increase in topographic elevation. Outside of the lake area no drilling has been completed to estimate the depth to water table, however it is broadly assumed that the depth to water table will increase away from the lake surface as topography rises. The key aquifer units are considered to be:
• The lake surface (Upper Aquifer)
• The fluvial sediments (Basal Aquifer)
• The glacial fluvial sediments (Basal Aquifer); and
• The Permian saprolite. (Basal Aquifer).
The Lacustrine clay is considered to be an aquitard of very low vertical hydraulic conductivity, this clay separates the upper unconfined aquifer from the lower confined basal aquifer. The aquifer properties have been determined for the lake surface through trench test pumping. There is limited available information on the aquifer properties of the basal aquifer as no test pumping has been completed to date.

Lake Throssell Sulphate of Potash Project September 2021 Resource Estimate Reported in Accordance with JORC Code 2012
11
4. Summary of Exploration
Exploration to date at the Lake Throssell SOP Project has comprised the following programs:
• Lake surface hand auger – 16 drill holes;
• Gravity Surveys – 200 line-km;
• Heli-supported rotary drilling – 26 drill holes;
• Air-core drilling (both on and off lake) – 54 drill holes;
• 355 brine assay samples from a total of 5,720m of drilling;
• 62 Particle Size Distribution (PSD) analysis to determine drainable porosity;
• 18 Lexan-tube core samples taken from the lake sediments;
• 2 ten day pumping tests on 100m trial trenches; and
• 7 short term pumping tests on test pits. All drill-holes and surface excavations completed to date are presented in Figure 4 and the following sections are a summary of each of the programs.
Figure 4: Lake Throssell investigation locations

Lake Throssell Sulphate of Potash Project September 2021 Resource Estimate Reported in Accordance with JORC Code 2012
12
4.1. Surficial Aquifer
4.1.1. Hand Auger Drilling and Sampling
A preliminary lake surface auger program was completed in December 2019 (ASX announcement
16 December 2019) to give an indication of brine grade in the shallow lake sediments. A total of 16
auger holes up to 1.2 m in depth were completed.
The holes encountered a typical lake surface sequence, dominated by gypsum with silt and clay, with
brine at approximately 0.3 m below ground level (bgl). Brine samples were obtained from each hole
between 0.3 m and the end-of-hole.
The collar locations are presented in Figure 4 and the brine assays and associated geological
descriptions are presented in Appendix 1.
4.1.2. Rotary Auger Drilling and Sampling
The program was completed in July 2020 using a heli-supported rotary auger rig targeting the top
sequence of lake surface sediments to a maximum depth of 10 m (ASX announcement
10 August 2020). The program obtained brine samples and core samples for porosity testing over the
entire playa-lake surface, consisting of 26 drill holes for a total of 86 m of core and 77 brine samples.
Drill-hole locations are presented in Figure 4.
The program encountered gypsum dominated sandy silt and clay in the top 5 m. The gypsum layers
were up to 0.2 m thick and often associated with good to very good brine in-flow rates, inferring that
these zones were more highly permeable.
Minor sand and gravel layers were also identified in three holes, with one hole (LTAG19) containing a
clay/silt supported sand interval of at least 1.3 m with rounded pebbles. A more clay-dominated
sequence is present below 5m, with less gypsum and increasing density.
As part of the program, two holes were designed to test the characteristics of the surficial sequence within the islands (LTAG04 and LTAG05). Drilling and brine analysis confirming a lack of brine flow and more dilute brine, inferring lower permeability and lower grade brine is present within these areas.
Core samples were obtained throughout drilling using Lexan tubes for laboratory sampling and analysis of porosity and permeability.
Brine samples were obtained during the program by bailing the hollow stem of the auger when open to a known interval to provide a representative sample. A summary of collar locations, hole depths, encountered geology and brine analysis is presented in Appendix 1.
4.1.3. Lake Surface Test Pumping
The program was completed with the aim of estimating the aquifer properties, including drainable porosity (specific yield) and hydraulic conductivity (vertical and horizontal), for the upper section of the lake surface aquifer by test pumping the aquifer.
The program consisted of two trial trenches and seven test pits distributed across the lake. The trenches were 100 m long and were surrounded on all sides by a number of monitoring pits. Whilst the test pits consisted of one small trench and one adjacent monitoring pit. All excavations were completed with a 15-tonne amphibious excavator that was able to excavate to depths of between 3m and 4.5 m.
The trial trenches were pumped until water levels in the majority of monitoring pits had stabilized – which was between 10 and 11 days in both cases. Test pits consisted of a small pumping trench between 6 and 9 m long with an adjacent monitoring pit. Test pits were de-watered and the brine

Lake Throssell Sulphate of Potash Project September 2021 Resource Estimate Reported in Accordance with JORC Code 2012
13
level draw-down and recovery rates were monitored. Throughout all testing brine levels, flow rate and brine quality was frequently monitored.
Trench locations and dimensions are presented in Figure 4 and Table 1. An example of the 100 m long trial trench and monitoring pit network is shown in Figure 5. A test pit excavation is shown in Figure 6, with layering evident close to surface and becoming more clayey with depth.
Figure 5: Trial Trench one with surrounding monitoring pits
Figure 6: Test pumping of a test pit excavation

Lake Throssell Sulphate of Potash Project September 2021 Resource Estimate Reported in Accordance with JORC Code 2012
14
The lake surface to 2 m below the ground level is more heavily dominated by gypsum, with clayey horizons dominant to the base of the excavation, intermixed with silty zones. The large excavation provided an opportunity to observe the layered nature of the sequence, how the walls stood up and the brine inflow horizons associated with gypsum dominated layers.
The test pumping data has been analysed using local scale numerical models in groundwater modelling software FEFLOW. The models were calibrated to the brine level draw-down and recovery by changing the hydraulic conductivity (horizontal and vertical) and specific yield of the aquifer to obtain an acceptable fit between the measured data and the simulation. Calibration was achieved by a combination of manual and automated iterations. An example of the trench pumping data and calibration simulation is provided in Figure 7 to Figure 9.
Figure 7: Test pumping measured response and modelling (calculated)
Figure 8: Test pumping measured response and modelling (calculated)
-3.5
-3
-2.5
-2
-1.5
-1
-0.5
0
0 2 4 6 8 10 12 14
Time (days)
LTTT02: Pits A (3m away) & B (37m away)
A-Measured A-Calculated B-Measured B-Calculated
Wat
erLe
vel (
m)
-4
-3.5
-3
-2.5
-2
-1.5
-1
-0.5
0
0 2 4 6 8 10 12 14
Time (days)
LTTT02: Trench
Measured Calculated
Wat
erLe
vel (
m)

Lake Throssell Sulphate of Potash Project September 2021 Resource Estimate Reported in Accordance with JORC Code 2012
15
Figure 9: Test pumping measured response and modelling (calculated)
The final aquifer property results from the modelling are highly variable, confirming the highly heterogenous nature of the layered lake surface aquifer. Specific yield results varied between 0.01 (stiff clay) and 0.4 (the maximum possible related to gypsum evaporite sequences).
Hydraulic conductivity derived from the modelling ranged between 0.2 meters per day (m/d) (stiff clay) and 340 m/d (gypsum dominated flow). Hydraulic conductivity was also estimated using distance drawdown analysis for the two trial trenches, these results indicated values of 4.8 and 7.8m/d, which compare favourably to the weighted average of the test pumping results (13.9 m/d). The trench pumping results are presented in detail in Table 1.
Table 1: Trench Locations and Pumping Results from Modelling
ID Type Easting Northing Length
(m) Depth
(m)
Max Draw-down
(m)
Pumping Duration
Average Pumping Rate (L/s)
Hydraulic Conductivity
(m/d)
Specific Yield
(-)
LTTT01 Trial
Trench 623935 6955953 100 4.5 1.9 10 Days 1.0 1.5 0.40
LTTT02 Trial
Trench 621117 6948873 100 4.5 2.6 11 Days 1.2 0.5 0.40
LTTP01 Test Pit 619044 6956671 6.5 3.7 2.4 2 Hours 1.2 0.2 0.01
LTTP02 Test Pit 625277 6956289 8.3 3 1.9 3 Hours 2.1 0.8 0.02
LTTP03 Test Pit 617157 6949545 6.3 4 2.8 2.5 Hours 1.4 0.6 0.01
LTTP04 Test Pit 620646 6953250 8.6 3 1.9 1.5 Hours 1.7 1.9 0.05
LTTP05 Test Pit 610629 6950730 9 3 0.1 2 Hours 4.2 340 0.40
LTTP06 Test Pit 618148 6944582 6.3 3.8 1.6 4 Hours 2.6 32 0.10
LTTP07 Test Pit 613967 6944956 7.2 3.8 1.8 2.5 Hours 1.9 0.9 0.15
Brine samples were obtained at the start and end of pumping of the test pits, while the trial trenches
were sampled every day for field parameters of salinity, SG and pH, with samples retained for
laboratory analysis on every second day.
-3.5
-3
-2.5
-2
-1.5
-1
-0.5
0
0 2 4 6 8 10 12 14Time (days)
LTTT02: Pits C (2m away) & D (24m away)
C-Measured C-Calculated D-Measured D-Calculated
Wat
erLe
vel (
m)

Lake Throssell Sulphate of Potash Project September 2021 Resource Estimate Reported in Accordance with JORC Code 2012
16
Brine grade variations during pumping show a muted response with most test pits moderately
reducing in grade by less than 3%, while the grade increased by up to 10% at LTTT01. The full brine
analysis results are provided in Appendix 1.
4.2. Basal Aquifer
4.2.1. Gravity Geophysical Survey
An initial ground gravity survey was completed in March 2020 (ASX announcement 7 May 2020) and
followed up with an in-fill survey in July 2020 (ASX announcement 10 August 2020) for a total of
approximately 200 line-kilometres with the aim of identifying drilling targets within the palaeovalley
system as a first step of identifying a palaeochannel basal aquifer to target with future production
bores.
The surveys comprised a total of 1,040 stations at approximate 200 m spacing on traverses
perpendicular to the inferred alignment of the palaeovalley. The gravity data was processed by
gridding the Bouguer anomaly and regional separation from the Bouguer anomaly to produce a
residual gravity anomaly that is considered to represent the broad palaeovalley geometry.
When compared to the known geology, the gravity highs are well correlated with mapped outcropping
Paterson Formation and gravity lows are located within areas of low-lying regolith cover within the
Throssell palaeovalley system, providing confidence in the regional model and general understanding
of comparative palaeovalley in the region. Two gravity low anomalies have been found to be
representative of deeply weathered bedrock instead of palaeovalley sediments. These are located in
the central part of the tenement on the northern and southern side of the palaeovalley.
Following completion of the air-core program the gravity model has been updated by calibrating to
the end-of-hole geology. The updated map of the residual gravity anomaly is presented in Figure 4.
The gravity model was used to generate drill targets for air-core drilling and inform the geological
model away from areas of drilling control.
4.2.2. Air-core Drilling
The air-core drilling program commenced in late November 2020 to test aquifer targets at the base of
the palaeovalley sequence determined from the gravity survey. The deepest sections of the
palaeovalley are considered to be most prospective for sand and gravel aquifer sequences deposited
in a palaeochannel environment.
The drill program was completed by a track-mounted air-core drill rig. The program commenced in
November 2020 but was delayed due to wet weather in December 2020 with 16 holes completed, a
further 38 drill holes were completed in February 2021 for a total of 5,623 m (ASX announcements
21 December 2020 and 9 March 2021). The average hole depth was approximately 104 m with a
maximum depth of 144 m (Figure 4 and Appendix 1).
The drill program confirmed the presence of a broad palaeovalley system approximately 100m deep
with a thick lacustrine clay sequence and a number of deep aquifer targets of variable thickness and
brine yielding. These included the basal sand and a glacial fluvial sand and gravel.
The basal sand is between approximately 5 to 17 m thick and is typically a yellow, brown to green fine
to medium grained sand with silty bands, typically located between 70 and 100 m depth, and below
the lacustrine clay on the eastern side of the palaeovalley associated with deposition in a medium to
low energy palaeo-river system of likely Eocene to Pliocene age.

Lake Throssell Sulphate of Potash Project September 2021 Resource Estimate Reported in Accordance with JORC Code 2012
17
The glacial fluvial sand and gravel is typically a light to dark grey fine to medium sand with rounded to
sub-angular gravel and occasional silt, the gravel is broken by the drilling but can be assumed to
potentially be up to cobble size. The thickness of this sequence may range from 1 to 2 m up to 43 m
in the deepest section, estimated to be approximately 12 m thick on average, and it is located mainly
on the south and western sides of the palaeovalley. It is present as irregular zones either beneath the
lacustrine clay or the fluvial basal sand or within zones of the Permian Saprolite zone, inferring that it
is likely derived from a combination of an in-situ weathering profile of the coarse-grained Permian
bedrock of fluvial glacial origin and a reworked pre-Eocene/Pliocene locally derived colluvial or alluvial
deposit.
Drilling spoil samples were obtained for laboratory analysis of PSD to allow quantification of sand, silt,
and clay portions from the various lithological zones across the system. Empirical equations have been
applied to the PSD analysis which enables estimates of hydraulic conductivity and specific yield for the
Mineral Resource Estimate. 62 samples in total were selected for laboratory analysis, which are
discussed in the porosity and specific yield section below.
A total of 253 brine samples were submitted for assay, with results returning high grades of up to
5,800 mg/L K (12.9 kg/m3 K2SO4), with an average grade of 4,488 mg/L K (10.0 kg/m3 K2SO4). Of the
253 samples taken from the air-core program, 98% returned grades exceeding 4,000 mg/L K and 50%
exceeded 4,500 mg/L potassium (10.0 kg/m3 SOP) confirming the extensive high-grade, low variability
tenor of the brine within the Lake Throssell palaeovalley system.
5. Geological Summary
A summary of the encountered geology of the project is presented in Table 2 which also takes into
account the hydrogeology of the deposit.
The geology is consistent with other lakes and palaeovalley sequences in the region. In the shallow
sediments there is an evaporite surface, dominated by gypsum, underlain by more clayey dominated
sequences with occasional thin granular and calcrete zones.
These surficial lithologies lie on top of a thick sequence of stiff lacustrine clay, which acts as a regionally
confining aquitard with very low vertical hydraulic conductivity, meaning it hydraulically separates the
shallow sediments of the palaeovalley from the basal aquifer sediments.
Beneath the lacustrine clay sequence is a fine to medium grained basal sand with silty and clayey
bands of fluvial origin of between Eocene and Pliocene age. At the base of this fluvial system is the
contact with the Permian age Paterson Formation, a palaeosurface that represents up to 200 million
years of weathering, erosion and deposition. The contact is present in the base of the palaeovalley,
the Paterson Formation in the deepest sections of the palaeovalley is an unconsolidated fluvial glacial
deposit of gravel, sand and silt.
The Paterson Formation is present at outcrop at the margins of the palaeovalley as dark to light grey
poorly sorted siltstone, mudstone, sandstone and quartzite, with conglomerate beds. Thick saprolite
zones are present up to 50 m in thickness where exposed on the palaeovalley margins, often
dominated by silt and fine sand. Unconsolidated glacial fluvial sediments of mixed gravel and minor
silt are present within this saprolite zone which are likely to be representative of either in-situ
weathering or local colluvial deposits when at the contact with the overlying Cenozoic sediments. An
example of the fluvial and glacial sequence is presented in Figure 10, where 43 m of combined fluvial
and glacial fluvial sediments are evident.

Lake Throssell Sulphate of Potash Project September 2021 Resource Estimate Reported in Accordance with JORC Code 2012
18
Permian Paterson Formation is outcropping on the western edge of the lake and between 3 and 5km
to the south east of the lake.
Figure 10: Chip trays showing the basal aquifer sequence (86 to 129m - gravel, fine sand, silt and minor clay)
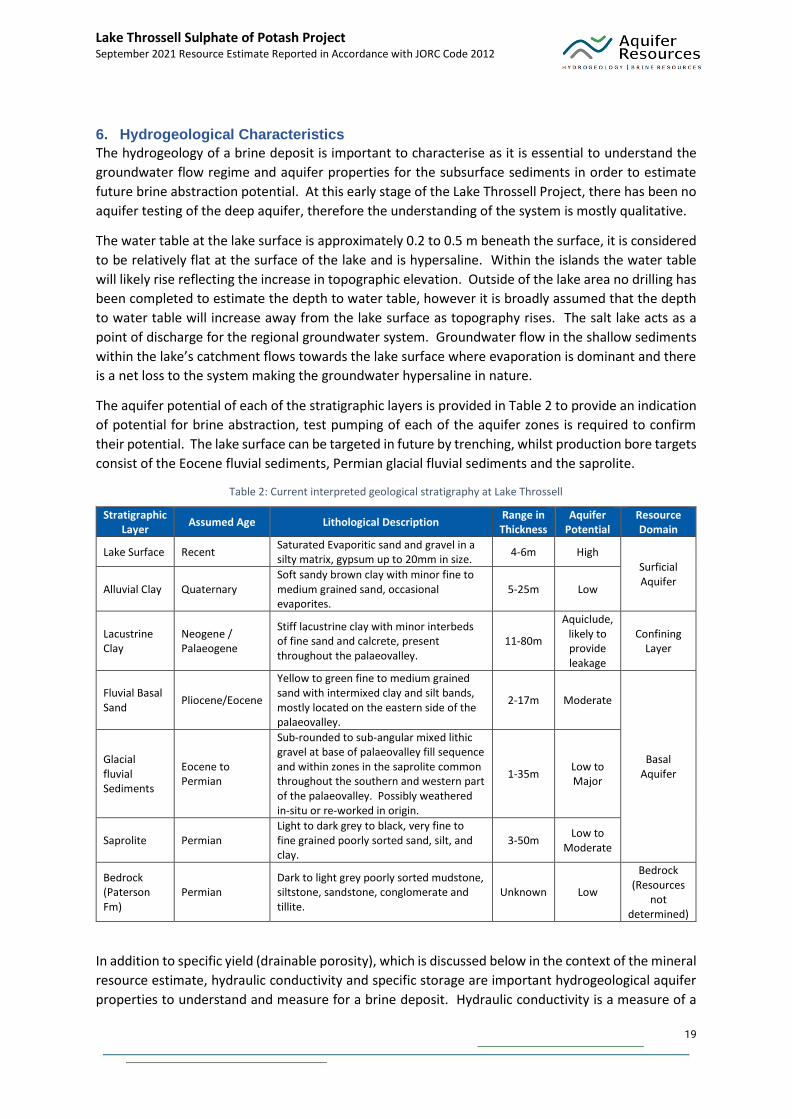
Lake Throssell Sulphate of Potash Project September 2021 Resource Estimate Reported in Accordance with JORC Code 2012
19
6. Hydrogeological Characteristics
The hydrogeology of a brine deposit is important to characterise as it is essential to understand the
groundwater flow regime and aquifer properties for the subsurface sediments in order to estimate
future brine abstraction potential. At this early stage of the Lake Throssell Project, there has been no
aquifer testing of the deep aquifer, therefore the understanding of the system is mostly qualitative.
The water table at the lake surface is approximately 0.2 to 0.5 m beneath the surface, it is considered
to be relatively flat at the surface of the lake and is hypersaline. Within the islands the water table
will likely rise reflecting the increase in topographic elevation. Outside of the lake area no drilling has
been completed to estimate the depth to water table, however it is broadly assumed that the depth
to water table will increase away from the lake surface as topography rises. The salt lake acts as a
point of discharge for the regional groundwater system. Groundwater flow in the shallow sediments
within the lake’s catchment flows towards the lake surface where evaporation is dominant and there
is a net loss to the system making the groundwater hypersaline in nature.
The aquifer potential of each of the stratigraphic layers is provided in Table 2 to provide an indication
of potential for brine abstraction, test pumping of each of the aquifer zones is required to confirm
their potential. The lake surface can be targeted in future by trenching, whilst production bore targets
consist of the Eocene fluvial sediments, Permian glacial fluvial sediments and the saprolite.
Table 2: Current interpreted geological stratigraphy at Lake Throssell
Stratigraphic Layer
Assumed Age Lithological Description Range in Thickness
Aquifer Potential
Resource Domain
Lake Surface Recent Saturated Evaporitic sand and gravel in a silty matrix, gypsum up to 20mm in size.
4-6m High Surficial Aquifer
Alluvial Clay Quaternary Soft sandy brown clay with minor fine to medium grained sand, occasional evaporites.
5-25m Low
Lacustrine Clay
Neogene / Palaeogene
Stiff lacustrine clay with minor interbeds of fine sand and calcrete, present throughout the palaeovalley.
11-80m
Aquiclude, likely to provide leakage
Confining Layer
Fluvial Basal Sand
Pliocene/Eocene
Yellow to green fine to medium grained sand with intermixed clay and silt bands, mostly located on the eastern side of the palaeovalley.
2-17m Moderate
Basal Aquifer
Glacial fluvial Sediments
Eocene to Permian
Sub-rounded to sub-angular mixed lithic gravel at base of palaeovalley fill sequence and within zones in the saprolite common throughout the southern and western part of the palaeovalley. Possibly weathered in-situ or re-worked in origin.
1-35m Low to Major
Saprolite Permian Light to dark grey to black, very fine to fine grained poorly sorted sand, silt, and clay.
3-50m Low to
Moderate
Bedrock (Paterson Fm)
Permian Dark to light grey poorly sorted mudstone, siltstone, sandstone, conglomerate and tillite.
Unknown Low
Bedrock (Resources
not determined)
In addition to specific yield (drainable porosity), which is discussed below in the context of the mineral
resource estimate, hydraulic conductivity and specific storage are important hydrogeological aquifer
properties to understand and measure for a brine deposit. Hydraulic conductivity is a measure of a

Lake Throssell Sulphate of Potash Project September 2021 Resource Estimate Reported in Accordance with JORC Code 2012
20
material’s capacity to transmit water, the higher the value the more water can pass through. Aquifer’s
generally have higher values of hydraulic conductivity than non-aquifers (otherwise known as
aquitards and aquicludes). Values of hydraulic conductivity have been derived for the surficial aquifer
from laboratory tests and test pumping analysis. These are presented in Table 3 and Table 4.
Specific storage is a confined aquifer property and is applicable to the basal aquifer which is likely to
be confined. It is an aquifer property related to the pressure that the aquifer and brine are subject to
at depth. Specific storage is not considered in this report and will be addressed when test production
bores are installed and test pumped in the basal aquifer.
Table 3: Estimates of hydraulic conductivity for the surficial aquifer from test pumping
Location Method Hydraulic Conductivity (m/d)
LTTT01 Distance Drawdown analysis 7.8
LTTT01 Numerical Model Calibration 1.5
LTTT02 Distance Drawdown analysis 4.8
LTTT02 Numerical Model Calibration 0.5
LTTP01 Numerical Model Calibration 0.2
LTTP02 Numerical Model Calibration 0.8
LTTP03 Numerical Model Calibration 0.6
LTTP04 Numerical Model Calibration 1.9
LTTP05 Numerical Model Calibration 340
LTTP06 Numerical Model Calibration 32
LTTP07 Numerical Model Calibration 0.9
Table 4: Estimates of hydraulic conductivity from particle size distribution analysis
Stratigraphic Unit Hydraulic Conductivity (m/d)
Min Max Geomean
Lacustrine Clay 0.01 0.61 0.09
Fluvial Basal Sand 0.35 1.12 0.75
Glacial Fluvial Sand and Gravel 0.07 4.36 0.37
Permian Saprolite 0.07 0.14 0.10

Lake Throssell Sulphate of Potash Project September 2021 Resource Estimate Reported in Accordance with JORC Code 2012
21
7. Brine Characteristics
The average potassium concentration from all samples within the surficial sediments is approximately
5,124 mg/L K (11.4 kg/m3 K2SO4), the lowest concentration is approximately 2,810 mg/L K (6.3 kg/m3
K2SO4) at LGA26 (within an island) and the highest concentration is 6,660 mg/L K (14.8 kg/m3 K2SO4)
at LT016.
Higher concentrations of potassium appear to be located on the western side of the lake associated
with accumulation of more evaporated brine. The lower concentrations of potassium are located in
the northern side of the lake where it is likely more regular inflow of fresher surface water occurs. The
potassium concentration distribution across the lake surface is presented in Figure 11.
Figure 11: Potassium concentration at the lake surface (370 m RL depth slice)
The average potassium concentration from samples within the deep palaeovalley is approximately
4,500 mg/L K (10.0 kg/m3 K2SO4), the lowest concentration is approximately 3,580 mg/L K (8.0 kg/m3
K2SO4) at LTAC005 and the highest concentration is 5,500 mg/L K (12.9 kg/m3 K2SO4) at LTAC040.
The potassium concentration and brine characteristics of the aquifers are very consistent across the
palaeovalley. Figure 12 shows the deep aquifer brine grade concentration distribution, Figure 13
shows that the brine is somewhat uniform with concentration of between 4,000 and 5,000 mg/L K and
8,000 and 10,000 mg/L magnesium (Mg), in comparison to the lake sediments which has a wider
distribution and is subject to more environmental conditions such as recharge and evaporation, and

Lake Throssell Sulphate of Potash Project September 2021 Resource Estimate Reported in Accordance with JORC Code 2012
22
has a more variable grade distribution. The end of pumping trench samples have been added to the
distribution, which now form a cluster with slightly lower Mg and higher K concentrations compared
to the deep aquifer samples.
Figure 12: Potassium concentration in the basal aquifer (280 m RL depth slice)
Overall, the brine chemistry exhibits favourable characteristics for solar evaporative concentration
and lower waste salts, with a relativity low Sodium to K ratio (16:1) and a high SO4 concentration. The
key average characteristics of the brine from the sampling to date at Lake Throssell are presented in
Table 5.

Lake Throssell Sulphate of Potash Project September 2021 Resource Estimate Reported in Accordance with JORC Code 2012
23
Figure 13: Potassium magnesium concentrations for the lake surface and deep brine aquifers
Table 5: Key average brine characteristics of Lake Throssell
Stratigraphy K (mg/L)
SOP Equiv. (K2SO4) (kg/m3)
Mg (mg/L)
Na (mg/L)
SO4 (mg/L)
Total Dissolved
Solids (mg/L)
K:Mg Na:K
Surficial Aquifer 5,078 11.32 7,454 79,354 21,239 253,255 0.7 15.7
Basal Aquifer 4,498 10.03 8,682 76,755 24,141 255,365 0.5 17.6
Note: All concentrations based on average of all samples obtained to date and not spatially weighted. SOP equivalent or
K2SO4 is calculated from K x 2.23.
8. Porosity and Specific Yield
The total volume of brine in a brine deposit is determined by the total porosity, total porosity is made
up of specific retention (also known as retained porosity) and specific yield (also known as effective
porosity). Specific yield is the volume of water that can be drained by gravity from a saturated volume
of sediment. While specific retention is the volume that is retained under gravity drainage. The
specific yield is the ratio used to define the drainable volume of a brine deposit. Portions of specific
retention in the lake surface are accessible in addition to the specific yield but require additional
modifying factors around lake recharge effects to be determined before quantification.
Total porosity and specific yield have been measured in the laboratory from core plugs obtained from
the Lexan tubes during the heli-rotary auger program to depths of 6.3m and using empirical equations
from the PSD results obtained during the air-core program for the deeper sediments.
Core plugs of the lake surface sediments were taken at Corelabs, Perth and analysed using the
saturated centrifuge method.

Lake Throssell Sulphate of Potash Project September 2021 Resource Estimate Reported in Accordance with JORC Code 2012
24
Specific yield has also been determined from test pumping of the lake surface from trial trenches and
test pits. These tests sample a much larger zone of the sequence and provide a bulk estimate of Sy
over the saturated thickness of the excavation.
The results indicate that the sequence is highly heterogeneous throughout the profile with an average
total porosity of 0.38 and the average and weighted average specific yield of 0.17. Results are
presented in Table 6.
Table 6: Total porosity and specific yield estimates for the lake surface
Hole ID Sample Depth
(m) Sample Interval
(m) Total Porosity
(-) Specific Yield
(-)
LTAG01 1.8 0.1 0.34 0.24
LTAG01 3.3 0.1 0.36 0.19
LTAG06 2.5 0.1 0.35 0.17
LTAG06 4 0.1 0.36 0.17
LTAG06 4.8 0.1 0.36 0.17
LTAG14 2.5 0.1 0.36 0.16
LTAG14 1.8 0.1 0.26 0.10
LTAG14 3.3 0.1 0.30 0.11
LTAG14 6.3 0.1 0.35 0.23
LTAG20 2.5 0.1 0.49 0.22
LTAG20 1.8 0.1 0.39 0.16
LTAG20 4 0.1 0.36 0.17
LTAG20 5.5 0.1 0.40 0.19
LTAG24 5.5 0.1 0.31 0.16
LTAG26 2.5 0.1 0.49 0.20
LTAG26 1.8 0.1 0.45 0.13
LTAG26 4 0.1 0.47 0.18
LTAG26 5.5 0.1 0.46 0.17
LTTT01 0.3 to 4.5 4.2 n/a 0.40
LTTT02 0.3 to 4.5 4.2 n/a 0.40
LTTP01 0.3 to 3.7 3.4 n/a 0.01
LTTP02 0.3 to 3 2.7 n/a 0.02
LTTP03 0.3 to 4 3.7 n/a 0.01
LTTP04 0.3 to 3 2.7 n/a 0.05
LTTP05 0.3 to 3 2.7 n/a 0.40
LTTP06 0.3 to 3.8 3.5 n/a 0.10
LTTP07 0.3 to 3.8 3.5 n/a 0.15
Minimum 0.26 0.01
Maximum 0.49 0.40
Average 0.38 0.17
Weighted Average* N/A 0.17
*Removed the upper and lower outliers (LTTT02 and LTTP03) in the trench pumping to account for high heterogeneity.
During the air-core program soil samples were obtained for laboratory analysis of PSD to allow
quantification of sand, silt and clay portions from the various lithological zones across the system. A
field capacity regression calculation at 33 kPa (Saxton Rawls 2006) has been used to determine specific
yield (effective porosity).
A total of 62 samples were selected for laboratory analysis mostly targeting the potentially more
productive aquifer sequences of sand sequences in the glacial fluvial sediments to provide a better
understanding of the lithological composition relative to the geological logging. The samples were
grab samples from drilling spoil and represent a 3m composite interval.

Lake Throssell Sulphate of Potash Project September 2021 Resource Estimate Reported in Accordance with JORC Code 2012
25
The analysis results demonstrate good correlation of aquifer properties to lithological description and
are considered reasonable for disturbed sample analysis, the results are presented in Table 7 below.
The exception being the Lacustrine Clay samples which shows some bias to more granular lithologies
than a pure clay.
Table 7: Total porosity and specific yield estimates from particle size distribution analysis
Stratigraphic Unit Number of Samples
Specific Yield (-)
Min Max Geomean
Lacustrine Clay 4 0.03 0.19 0.09
Fluvial Basal Sand 6 0.17 0.26 0.23
Glacial Fluvial Sand and Gravel 48 0.10 0.32 0.18
Permian Saprolite 4 0.09 0.12 0.10
9. Numerical Modelling
9.1. Model aims and set up
Groundwater numerical modelling has been completed by Advisian (Advisian 2021) using the FEFLOW
modelling code to simulate the potential magnitude of brine abstraction from the surficial and basal
aquifers. The modelling is considered reasonable for determination of the potential scale of
abstraction and variation of potassium concentration over time based on a robust geological and
grade model and reasonable aquifer properties. The modelling was completed to enable a mine plan
to be developed to estimate a Production Target. Further test pumping, installation of test production
bores and model calibration is required to facilitate conversion to Ore Reserves and validation of the
mine plan using the groundwater models.
The model extent was based on the Throssell palaeovalley upstream from the confluence with the Yeo
palaeovalley to a location distant from Lake Throssell and bounded closely by exposed bedrock. The
lateral area of the model incorporated the surrounding surficial catchment. Two individual models
were created to facilitate reasonable run times for predictive scenarios. Both models utilise the
geological model surfaces and the resource model grade distribution. The surficial aquifer model uses
the results from the trench test pumping as a guide to the average aquifer properties of the surficial
aquifer. The aquifer properties of the basal aquifer are based on a desktop assessment of publicly
available data from locally similar projects. The surficial aquifer water levels were calibrated to steady
state conditions, but no transient calibration has been completed.
Information from the trench testing was used to assign hydraulic parameters for the lake sediments.
Other parameters were assigned based on publicly available information for the Yeo palaeochannel
system (Pennington Scott, 2016) and Lake Wells (AQ2, 2019). Table 8 lists the parameters used in the
model for the various lithological units.
Table 8: Numerical model aquifer parameter values
Unit Horizontal Hydraulic
Conductivity (m/day)
Vertical Hydraulic Conductivity
(m/d)
Specific Yield (-)
Specific Storage (m-1)
Bedrock 0.0001 0.0001 0.001 4e-7
Weathered bedrock 0.001 0.001 0.01 4e-6
Alluvium 0.3 0.03 0.1 1e-4
Lakebed 6.5 0.65 0.15 1e-4
Clay 0.03 0.0003 0.05 2e-6
Sand and Gravel 3.0 0.3 0.23 1e-6
Fluvial Sand 0.5 0.05 0.17 2e-6

Lake Throssell Sulphate of Potash Project September 2021 Resource Estimate Reported in Accordance with JORC Code 2012
26
Unit Horizontal Hydraulic
Conductivity (m/day)
Vertical Hydraulic Conductivity
(m/d)
Specific Yield (-)
Specific Storage (m-1)
Saprolite 1 0.1 0.23 1e-6
The models are a solute transport model which simulate potassium grade change over time from each
abstraction point. The initial brine grades in the model were imported from the resource block
model. The islands in the block model are set to grade concentrations of zero which are represented
in the model. The model does not include any recharge; therefore, abstraction is purely from
groundwater storage, reflecting the Mineral Resource. The model simulates 20 years of abstraction
from trenches in the lake surface and proposed bores within the basal aquifer as presented in Figure
14.
Figure 14: Proposed trench network and bore locations
9.2. Trench Abstraction Simulation
The trench simulation was based on a trench network 4 m wide and up to 8 m depth or 0.1 m above
the base of the lake sediments, whichever was the higher. For the trench simulations the lake
sediment was divided into three layers. The elevation of the base of the uppermost layer was specified
at a depth of 6.5 m bgl or 0.15 m above the base of the lake sediments, whichever was higher. The
elevation of the central layer was specified as 8 m bgl or 0.1 m above base the base of the lake
sediments, again whichever was highest.
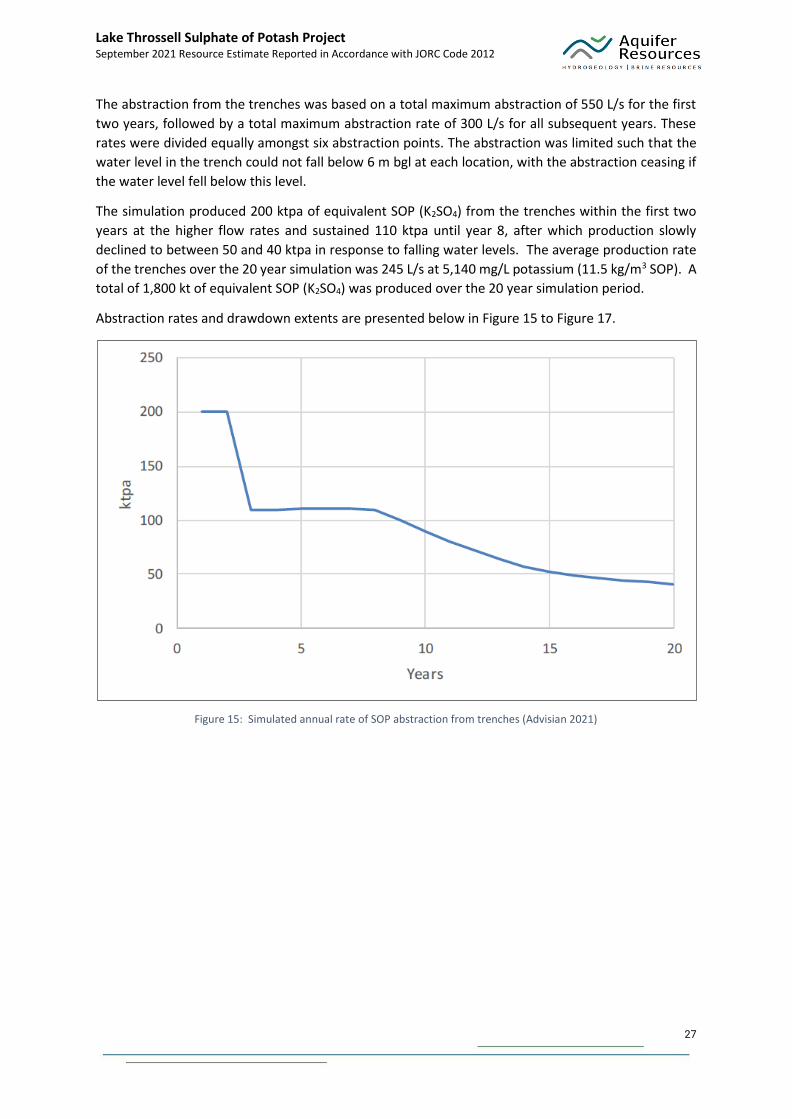
Lake Throssell Sulphate of Potash Project September 2021 Resource Estimate Reported in Accordance with JORC Code 2012
27
The abstraction from the trenches was based on a total maximum abstraction of 550 L/s for the first
two years, followed by a total maximum abstraction rate of 300 L/s for all subsequent years. These
rates were divided equally amongst six abstraction points. The abstraction was limited such that the
water level in the trench could not fall below 6 m bgl at each location, with the abstraction ceasing if
the water level fell below this level.
The simulation produced 200 ktpa of equivalent SOP (K2SO4) from the trenches within the first two
years at the higher flow rates and sustained 110 ktpa until year 8, after which production slowly
declined to between 50 and 40 ktpa in response to falling water levels. The average production rate
of the trenches over the 20 year simulation was 245 L/s at 5,140 mg/L potassium (11.5 kg/m3 SOP). A
total of 1,800 kt of equivalent SOP (K2SO4) was produced over the 20 year simulation period.
Abstraction rates and drawdown extents are presented below in Figure 15 to Figure 17.
Figure 15: Simulated annual rate of SOP abstraction from trenches (Advisian 2021)

Lake Throssell Sulphate of Potash Project September 2021 Resource Estimate Reported in Accordance with JORC Code 2012
28
Figure 16: Simulated drawdown around trenches for year 5 (Advisian 2021)
Figure 17: Simulated drawdown around trenches for year 20 (Advisian 2021)

Lake Throssell Sulphate of Potash Project September 2021 Resource Estimate Reported in Accordance with JORC Code 2012
29
9.3. Production Bore Abstraction Simulation
103 potential abstraction bore locations were identified from the Sand and Gravel zones in the basal
aquifer, located on the shorelines of islands or lake edge. All bores were simulated as either multi-
layer bores for all layers below the clay aquitard or as specified head boundary conditions with
abstraction rate limits and minimum head levels. All bores were assigned a production rate of 7 L/s,
with the exception of the two north eastern most bores, which were assigned rates of 5 L/s, due to
lower aquifer thickness in that section. The total achieved production rate in the model in year 1 was
692 L/s (average bore yield of 6.7 L/s), by year 25 this had reduced to 646 L/s (average bore yield of
6.3 L/s). The average production bore abstraction rate over 25 years is 6.6 L/s at 5,010 mg/L potassium
(11.2 kg/m3 SOP).
The results of the modelling show that the annual rate of equivalent SOP (K2SO4) production was
relatively constant from the bores, initially as high as 250 ktpa declining to 227 ktpa over 25 years. The
total volume of equivalent SOP (K2SO4) produced from the simulation was 5,977 kt.
The abstraction volume and drawdown in the deep aquifer is shown in Figure 18 to Figure 20.
The results indicate that the drawdown is mostly confined to the tenement area, with major
drawdown occurring in the centre of the tenement. Notably, with the aquifer properties used in the
simulation the production bore average flow rates were reasonably sustained over the 25 year period.
The simulation results are based on the geology and grade of the Resource Model and are considered
low confidence. However, the results give confidence in the scale of the basal aquifer to produce
volumes of SOP for a mine plan, but further drilling and installation of test production bores and
extended test pumping is required to increase confidence in the model results to warrant potential
Ore Reserve determination.
Figure 18: Simulated annual rate of SOP abstraction from production bores (Advisian 2021)

Lake Throssell Sulphate of Potash Project September 2021 Resource Estimate Reported in Accordance with JORC Code 2012
30
Figure 19: Simulated drawdown in basal aquifer after 5 years (Advisian 2021)
Figure 20: Simulated drawdown in basal aquifer after 20 years (Advisian 2021)

Lake Throssell Sulphate of Potash Project September 2021 Resource Estimate Reported in Accordance with JORC Code 2012
31
9.4. Model Summary
The results of the combined modelling simulations show that abstraction of SOP from the surficial and
basal aquifers at Lake Throssell may vary between 445 ktpa and 226 ktpa over a 20 year mine life (not
including process recovery losses) based on 110 km of trench and up to 103 production bores.
The modelling results indicate that SOP abstraction from the deep bores remains relatively steady
over the 20 years simulated decreasing by less than 13 kt between year 1 and year 20. The rate of
SOP production from the trench system diminishes substantially over time. It is noted that no
recharge to the lake surface or grade beneath the islands is included in the trench simulations. This
provides a conservative estimate of the recovery from the lake sediments. Large rainfall (recharge)
events may replenish storage and increase yields from the trenches post such events, with an
associated grade change which will need to be assessed in future modelling. The total SOP abstraction
over 20 years is presented in Figure 21.
Figure 21: Simulated annual rate of SOP abstraction from Lake Throssell (Advisian 2021)
10. Mineral Resource Estimation Methodology
The MRE is constrained by the available data, geological confidence, drilling density, sampling intervals
and tenement boundaries. This MRE covers the following updates:
• New Indicated Mineral Resources have been estimated for the basal aquifer based upon review and updated mapping of the high permeability aquifer zones and positive modelling outcomes.
• The Inferred Mineral Resource for the basal aquifer has been updated as a result of the above.
• The basal aquifer has been spilt in to Inferred and Indicated Resource zones.
• The surficial aquifer and confining layer remain unchanged.
• No Measured Mineral Resources or Ore Reserves have been estimated.

Lake Throssell Sulphate of Potash Project September 2021 Resource Estimate Reported in Accordance with JORC Code 2012
32
The geology model was constructed in Leapfrog Geo v6 implicit modelling software. The model used
all available drilling data, surface mapping and geophysical data to model the geology across Lake
Throssell and the Palaeovalley sequence. The topography of the model was derived from 1 second
Shuttle Radar Tomography Mission (SRTM) derived hydrological digital elevation model. All drill holes
were levelled to this topography in the model.
All brine assays (355) for potassium, sulphate and magnesium were brought into the model as intervals where taken from drilling, rotary auger, hand-auger and test pumping.
The Edge module in Leapfrog Geo v6 was used for numerical estimation and block modelling. The
variography of the deposit was modelled using the major axis and radial plot for guidance. Estimators
were set up for potassium, sulphate and magnesium for the below water table domain. The domain
was clipped to boundaries of the tenements and the island perimeters (Surficial aquifer only) as hard
boundaries. The base of the domain was defined as 226 m Australian Height Datum (AHD). Standard
parent block sizes of 1,000 m in the x and y direction and 10 m in the z direction were used. Sub
blocking was used to refine the block model in areas where geological surfaces intersect blocks.
Parent blocks were split by automated sub-blocking by up to two sub-blocks in the x and y direction.
Parameter concentrations were estimated across the blocks using Ordinary Kriging, ellipsoid search
parameters were assigned following review of the variography of each parameter.
The search parameters for the block model are listed below:
Ellipsoid Ranges – Max. = 4500 m, Int. = 2,900 m, Min. = 185 m
No. of Samples – Max = 20, Min = 1.
The block model grade distributions are presented in Figure 22 and Figure 23 with cross sections
presented in Figure 24 to Figure 27.
An inverse distance squared (ID2) estimator was run for potassium to check the accuracy of the
calculation. The average grade of each model swath (average cell value in one plane) and the plots of
each model have been reviewed. These plots show that the model adopted is appropriate when
plotted against the ID2 method and assayed values.
Specific yield for the lake surface was estimated from the weighted average of the core analysis and
trench pumping analysis. For all other stratigraphy’s PSD analysis of disturbed lithological samples
using field capacity regression calculations at 33 kPa (Saxton Rawls 2006) and comparisons to publicly
available data from similar geological settings. The adopted specific yield and total porosity for each
stratigraphy of the model is presented in Table 9 and Table 10.
SOP grade from potassium concentrations were calculated using a conversion of 2.23, accounting for
the atomic weight of sulphate (sulphur and oxygen) in the K2SO4 formula.
Resource tonnages were calculated by multiplying the volume of the block model in each lithology by
the specific yield and SOP grade to obtain the drainable SOP volume.
The Indicated Mineral Resource has been calculated based on the following:
Surficial Aquifer
• Drilling and testing have confirmed local site geology and aquifer geometry;
• Aquifer hydraulic properties (hydraulic conductivity and specific yield) have been determined by two independent methods;
• Test pumping has been completed to demonstrate extractability;

Lake Throssell Sulphate of Potash Project September 2021 Resource Estimate Reported in Accordance with JORC Code 2012
33
• Brine samples have been collected from a denser sample pattern to confirm brine concentration distribution;
• These conditions are only met for the top six metres of the lake surface of the surficial aquifer.
Basal Aquifer
• Drilling and testing have confirmed local site geology and aquifer geometry;
• Review of air-core logs has enabled mapping of the higher permeability sand and gravel zones;
• Brine samples have been collected from a denser sample pattern to confirm brine concentration distribution;
• Groundwater modelling has shown that using reasonable aquifer properties from publicly available information from local projects in lieu of test pumping data suggests that abstraction from the most permeable zones of the aquifer is likely to be achievable;
• No confined aquifer specific storage has been estimated as part of the Mineral Resources.
The basal aquifer resource zones are presented in Figure 28.
The Inferred Mineral Resource has been calculated based on the following:
• Geological evidence exists to imply but not verify the existence of brine grade and aquifer geometry for the entire deposit due to some wide drill and sample spacing;
• Proven geophysical techniques have been used to infer palaeovalley extents away from the main drilling areas and extend the estimate into the pending tenements; and
• Aquifer properties can be calculated from limited laboratory tests, PSD and other publicly available data in comparative geological settings.
Total porosity and total brine SOP mass is provided to compare the total SOP tonnes with the drainable
Resources. As can be seen, the total brine volume is significantly higher than reporting drainable brine
volumes. The drainable brine volume represents the amount of SOP that can be abstracted from the
deposit which is dependent on underlying porosity, permeability and specific yield of the deposit. For
economic production, the drainable brine volume is the most important volume because only a
proportion of brine present can be typically abstracted from the deposit.

Lake Throssell Sulphate of Potash Project September 2021 Resource Estimate Reported in Accordance with JORC Code 2012
34
Figure 22: Lake Throssell shallow potassium grade distribution and sample points (370 m RL depth slice)
Figure 23: Lake Throssell deep potassium grade distribution and sample points (280 m RL depth slice)
A’
A
B’
B
C
C’
D
D’

Lake Throssell Sulphate of Potash Project September 2021 Resource Estimate Reported in Accordance with JORC Code 2012
35
Figure 24: Block model cross section A-A’
Figure 25: Block model cross section B-B’

Lake Throssell Potash Project July 2021 Resource Estimate Reported in Accordance with JORC Code 2012
36
Figure 26: Block model cross section C-C’
Figure 27: block model long section D-D’

Lake Throssell Potash Project Lake Throssell July 2021 Resource Estimate Reported in Accordance with JORC Code 2012
37
Table 9: Lake Throssell Indicated Mineral Resource Estimate
Resource Domain
Volume (106 m3)
Total Porosity
(-)
Brine Volume (106 m3)
Specific Yield
(-)
Drainable Brine
Volume (106 m3)
K Grade (mg/L)
K Mass (Mt)
SO4 Grade (mg/L)
SO4 Mass (Mt)
Mg Grade (mg/L)
Mg Mass (Mt)
Equivalent SOP Grade
(K2SO4)
(kg/m3)
Drainable Brine
SOP Mass (Mt)
Total Brine SOP Mass (Mt)
Surficial Aquifer
1,008 0.40 403 0.17 170 4,985 0.8 22,125 3.8 7,764 1.32 11.1 1.9 4.5
Basal Aquifer 1,150 0.29 329 0.19 225 4,605 1.0 24,420 5.5 8,735 1.97 10.3 2.3 3.4
Total Indicated Resources
2,159 0.34 732 0.18 395 4,770 1.9 23,430 9.3 8,320 3.29 10.6 4.2 7.9
Note: Errors may be present due to rounding
Table 10: Lake Throssell Inferred Mineral Resource Estimate
Resource Domain
Volume (106 m3)
Total Porosity
(%)
Brine Volume (106 m3)
Specific Yield (%)
Drainable Brine
Volume (106 m3)
K Grade (mg/L)
K Mass (Mt)
SO4 Grade (mg/L)
SO4 Mass (Mt)
Mg Grade (mg/L)
Mg Mass (Mt)
Equivalent SOP Grade
(K2SO4)
(kg/m3)
Drainable Brine SOP
Mass (Mt)
Total Brine SOP Mass
(Mt)
Surficial Aquifer 3,074 0.43 1,313 0.10 310 4,605 1.4 21,910 6.8 7,820 2.4 10.3 3.2 13.5
Confining Layer 8,793 0.45 3,957 0.04 350 4,595 1.6 23,140 8.1 8,240 2.9 10.3 3.6 40.6
Basal Aquifer 3,524 0.40 1,394 0.09 330 4,675 1.5 22,920 7.6 8,134 2.7 10.4 3.4 14.5
Total Inferred Resource
15,391 6,664 990 4,625 4.5 22,680 22.5 8,073 8.0 10.3 10.2 68.6
Note: Errors may be present due to rounding, approximately 2.90Mt of Drainable SOP Mass is present in Exploration Licence Applications E38/3544, E38/3483, E38/3458, and E38/3537.

Lake Throssell Potash Project Lake Throssell July 2021 Resource Estimate Reported in Accordance with JORC Code 2012
38
Figure 28: Basal aquifer resource zones
11. Exploration Target
The Exploration Target is an estimate of the exploration potential of a mineral deposit is presented in
Table 11. In a brine hosted deposit, the Exploration Target determines a lower and upper estimate by
varying the geological extent, drainable porosity, and brine grade within reasonable bounds based
upon the information available.
The geological extent (area and thickness) is determined from a combination of the modelled
geological, the gravity model, the mapped outcropping geology and the conceptual model of
regionally described palaeovalley systems.
Islands on the lake surface have been removed from the lake surface and alluvial clay sediment volume
calculation. Brine grade range is based on the average brine grades from the Resource Tables, with
the upper and lower estimates factored for the pending tenements where no data is presently
available.
The Exploration Target encompasses the granted tenement E38/3065 and the surrounding pending
tenements currently under application. There has been no work completed on the pending tenements
meaning that all estimates are based upon reasonable extrapolation from the work completed on
E38/3065. At the time of reporting Trigg sees no reason why these tenements will not be granted in
the future.

Lake Throssell Potash Project Lake Throssell Sept 2021 Resource Estimate Reported in Accordance with JORC Code 2012
39
Table 11: Lake Throssell Exploration Target
Resource Domain
Thickness (m)
Area (km2)
Sediment Volume (106 m3)
Specific Yield
(-)
Drainable Brine
(106 m3)
K Grade (mg/L)
K Mass (Mt)
Equiv. SOP
Grade (K2SO4)
(kg/m3)
Drainable Brine SOP
Mass (Mt)
Surficial Aquifer
19 70 656 0.09 61 3,739 0.2 8.3 0.5
Confining Layer
60 68 4,050 0.03 122 4,356 0.5 9.7 1.2
Basal Aquifer 20 144 1,101 0.10 106 3,961 0.4 8.8 0.9
Total Lower Estimate
282 5,807 288 4,081 1.2 9.1 2.6
Surficial Aquifer
26 88 1,156 0.12 134 4,526 0.6 10.1 1.4
Confining Layer
70 90 6,300 0.05 315 4,740 1.5 10.6 3.3
Basal Aquifer 35 269 3,469 0.14 496 4,277 2.1 9.5 4.7
Total Upper Estimate
447 10,925 945 4,466 4.2 10.0 9.4
Note: Errors may be present due to rounding, approximately 2.5 Mt in the lower estimate and 8.8 Mt in the upper estimate
of equivalent SOP is present in Exploration Licence Applications E38/3544, E38/3483, E38/3458 and E38/3537. SOP is
calculated by multiplying potassium by 2.23.
12. Mine Plan
Groundwater modelling results, presented in Section 9 have simulated flow rate, grade and equivalent
SOP tonnes per annum over a 21 year period from a trench network and brine borefield. The results
of the simulations have been used to determine a preliminary mine plan and production target for the
project of up to 245 ktpa at 82% process recovery.
The mine plan for the surficial aquifer is based on abstraction from the 110 km trench network from
year 1. For the first 5 years of abstraction a rate of 200 ktpa SOP is achieved from the trenches, this
reduces from year 6 to 100ktpa and then by year 10 to 50 ktpa, and by year 20 to 40 ktpa to reflect
the model results. In total, the trench network produces 1,785 kt of SOP over the 20-year period.
Peak flow rate from the trench is approximately 550 L/s at 5,180 mg/L potassium (11.6 kg/m3 SOP)
during the first 5 years. Abstraction from the trench network is 100% from the Indicated Resources.
To achieve the 245 ktpa SOP production rate at 82% recovery, abstraction from the basal aquifer using
production bores is required to make up the shortfall from the trench abstraction. Production bores
are added over time as the trench flow rate reduces. The initial borefield during year 1 and 2 produces
between 50 and 70 ktpa from up to 30 production bores. By year 4, 100 ktpa is produced from the
basal aquifer and by year 6 the borefield has grown to 86 production bores and abstraction of 200
ktpa. From year 7 onwards the borefield progressively increases to 112 production bores and 260
ktpa abstraction by year 17. In total, the basal aquifer produces 4,085 kt of SOP over the 20 year
period. The peak flow rate from the borefield is 751 L/s at 4,920 mg/L potassium (11.0 kg/m3 SOP) in
year 17. The average per bore flow rate is 6.7 L/s at 4,920 mg/L potassium (11.0 kg/m3 SOP), reflecting
The potential quantity and grade of the Exploration Target is conceptual in nature. There has been
insufficient exploration in these areas to estimate a Mineral Resource. It is uncertain if further
exploration will result in the estimation of a Mineral Resource.

Lake Throssell Potash Project Lake Throssell Sept 2021 Resource Estimate Reported in Accordance with JORC Code 2012
40
that of the modelling results. Abstraction from the basal aquifer is from Indicated and Inferred
Resources. The Mine Plan schedule is presented in Figure 29.
The abstraction rates described above are pre-recovery losses. Assuming process recovery loss of
82% this equates to a production target of 219 ktpa for the first 5 years of production and
then 245 ktpa from year 6 onwards, over the mine life.
The first 5 years of the mine plan consists of 82% Indicated Resources and 18% Inferred
Resources. Over the life-of-mine the mine plan consists of an average of 70% Indicated Resources
and 30% Inferred Resources. The Mine Plan utilises 97% of the Total Indicated Resource and 18% of
the Total Inferred Resource.
Future studies will look to extend the mine life well beyond 21 years once test production bores are
installed and test pumping completed in the basal aquifer and additional Measured and Indicated
Mineral Resources is established to support the mine schedule.
Figure 29: Mine Plan Schedule
13. References
Advisian, 2021 – Memo on Lake Throssell Resource Assessment, HG_MEMO_0002 August 2021 AQ2, 2019 - Lake Wells Sulphate of Potash Project: H3 Hydrogeological Assessment for the Abstraction of Brine. Report prepared for Australian Potash Ltd, October 2019, 155pp. Bunting et. al., 1978 – Throssell Western Austrian, Sheet SG/51-15 International Index 1:250 000 Geological Series – Explanatory Notes, Department of Mines, Western Australia, GSWA. Pennington Scott, 2016a - Hydrogeology Summary: Gruyere Gold Project. A report to Gold Road Resources Limited, Report 2088 Rev 1, 25 Feb 2016, 26pp. Pennington Scott, 2016b - Hydrogeological Modelling Synopsis for API: Gruyere Gold Project. A report to Gold Road Resources Limited, Report 2088 Rev 0, 30 Sep 2016, 14pp.
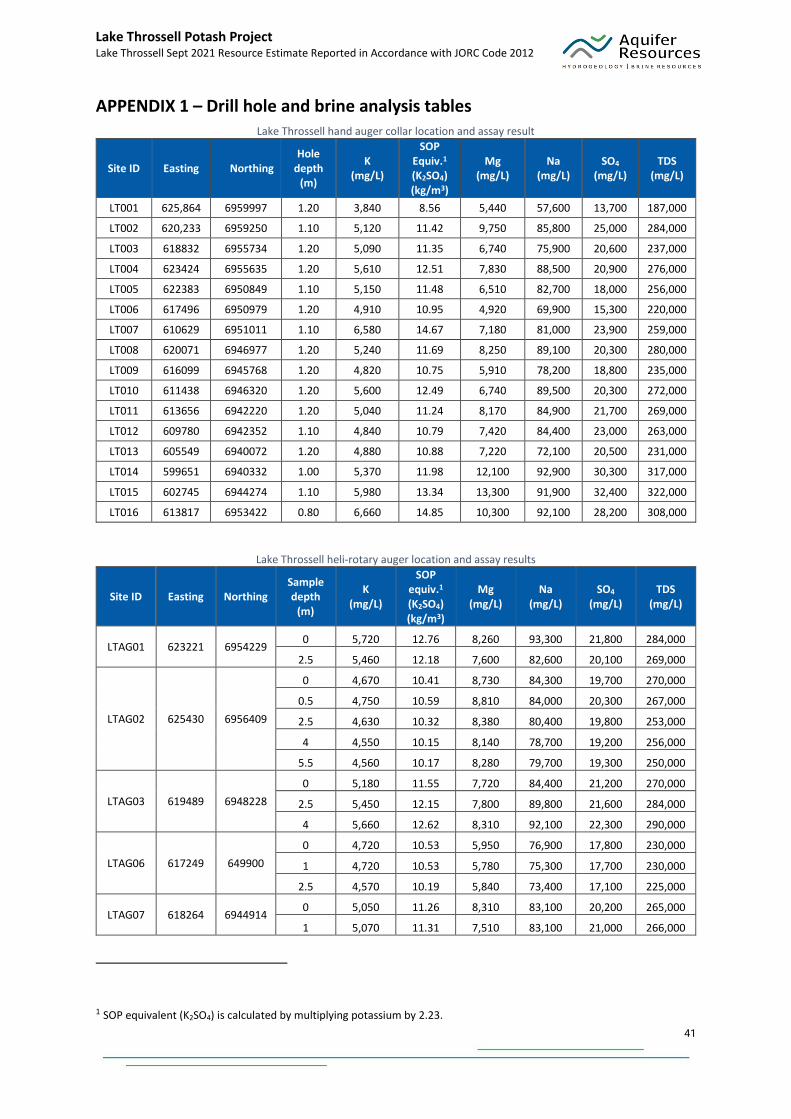
Lake Throssell Potash Project Lake Throssell Sept 2021 Resource Estimate Reported in Accordance with JORC Code 2012
41
APPENDIX 1 – Drill hole and brine analysis tables Lake Throssell hand auger collar location and assay result
Site ID Easting Northing Hole
depth (m)
K (mg/L)
SOP Equiv.1 (K2SO4) (kg/m3)
Mg (mg/L)
Na (mg/L)
SO4
(mg/L) TDS
(mg/L)
LT001 625,864 6959997 1.20 3,840 8.56 5,440 57,600 13,700 187,000
LT002 620,233 6959250 1.10 5,120 11.42 9,750 85,800 25,000 284,000
LT003 618832 6955734 1.20 5,090 11.35 6,740 75,900 20,600 237,000
LT004 623424 6955635 1.20 5,610 12.51 7,830 88,500 20,900 276,000
LT005 622383 6950849 1.10 5,150 11.48 6,510 82,700 18,000 256,000
LT006 617496 6950979 1.20 4,910 10.95 4,920 69,900 15,300 220,000
LT007 610629 6951011 1.10 6,580 14.67 7,180 81,000 23,900 259,000
LT008 620071 6946977 1.20 5,240 11.69 8,250 89,100 20,300 280,000
LT009 616099 6945768 1.20 4,820 10.75 5,910 78,200 18,800 235,000
LT010 611438 6946320 1.20 5,600 12.49 6,740 89,500 20,300 272,000
LT011 613656 6942220 1.20 5,040 11.24 8,170 84,900 21,700 269,000
LT012 609780 6942352 1.10 4,840 10.79 7,420 84,400 23,000 263,000
LT013 605549 6940072 1.20 4,880 10.88 7,220 72,100 20,500 231,000
LT014 599651 6940332 1.00 5,370 11.98 12,100 92,900 30,300 317,000
LT015 602745 6944274 1.10 5,980 13.34 13,300 91,900 32,400 322,000
LT016 613817 6953422 0.80 6,660 14.85 10,300 92,100 28,200 308,000
Lake Throssell heli-rotary auger location and assay results
Site ID Easting Northing Sample depth
(m)
K (mg/L)
SOP equiv.1 (K2SO4) (kg/m3)
Mg (mg/L)
Na (mg/L)
SO4 (mg/L)
TDS (mg/L)
LTAG01 623221 6954229 0 5,720 12.76 8,260 93,300 21,800 284,000
2.5 5,460 12.18 7,600 82,600 20,100 269,000
LTAG02 625430 6956409
0 4,670 10.41 8,730 84,300 19,700 270,000
0.5 4,750 10.59 8,810 84,000 20,300 267,000
2.5 4,630 10.32 8,380 80,400 19,800 253,000
4 4,550 10.15 8,140 78,700 19,200 256,000
5.5 4,560 10.17 8,280 79,700 19,300 250,000
LTAG03 619489 6948228
0 5,180 11.55 7,720 84,400 21,200 270,000
2.5 5,450 12.15 7,800 89,800 21,600 284,000
4 5,660 12.62 8,310 92,100 22,300 290,000
LTAG06 617249 649900
0 4,720 10.53 5,950 76,900 17,800 230,000
1 4,720 10.53 5,780 75,300 17,700 230,000
2.5 4,570 10.19 5,840 73,400 17,100 225,000
LTAG07 618264 6944914 0 5,050 11.26 8,310 83,100 20,200 265,000
1 5,070 11.31 7,510 83,100 21,000 266,000
1 SOP equivalent (K2SO4) is calculated by multiplying potassium by 2.23.

Lake Throssell Potash Project Lake Throssell Sept 2021 Resource Estimate Reported in Accordance with JORC Code 2012
42
Site ID Easting Northing Sample depth
(m)
K (mg/L)
SOP equiv.1 (K2SO4) (kg/m3)
Mg (mg/L)
Na (mg/L)
SO4 (mg/L)
TDS (mg/L)
2.5 5,180 11.55 7,790 86,600 21,300 268,000
4 5,160 11.51 7,690 85,500 20,600 264,000
5.5 4,930 10.99 7,390 79,700 20,000 263,000
LTAG08 613965 6946765
0 4,510 10.06 9,850 96,600 24,500 301,000
1 4,670 10.41 10,300 97,900 24,900 299,000
2.5 4,540 10.12 10,200 95,000 24,800 300,000
4 4,660 10.39 10,300 96,900 25,700 305,000
LTAG09 614144 6943570
1 5,640 12.58 7,360 90,100 20,800 278,000
2.5 4,930 10.99 7,170 80,100 18,800 285,000
4 5,990 13.36 8,640 94,700 23,200 290,000
LTAG10 610882 6942305
1 5,360 11.95 6,920 83,400 22,700 259,000
2.5 5,050 11.26 6,040 80,500 21,400 244,000
4 4,900 10.93 5,980 79,100 21,500 244,000
LTAG11 603216 6942167 0 4,030 8.99 11,800 88,900 27,500 283,000
1 3,950 8.81 11,400 83,200 25,400 285,000
LTAG12 605545 6940077
0 4,470 9.97 6,790 66,500 19,900 234,000
1 4,680 10.44 7,320 71,400 20,700 236,000
2.5 4,890 10.90 7,330 73,700 22,000 230,000
LTAG13 599494 6940005 0 4,960 11.06 11,800 91,500 31,800 311,000
LTAG14 607702 6943633
0 5,970 13.31 7,070 82,600 23,000 265,000
1 6,000 13.38 7,240 85,300 23,600 266,000
2.5 6,080 13.56 7,390 85,100 23,500 274,000
5.5 5,810 12.96 7,060 81,700 23,000 267,000
LTAG15 608710 6946765
0 6,200 13.83 8,330 92,500 23,800 314,000
1 6,520 14.54 8,560 98,100 26,000 308,000
4 6,050 13.49 6,240 82,300 21,600 257,000
LTAG16 612341 6949239 0 5,390 12.02 5,600 75,000 18,400 232,000
2.5 5,330 11.89 5,520 75,500 18,300 231,000
LTAG17 610629 6951013
0 6,350 14.16 7,220 79,900 25,100 261,000
1 6,430 14.34 7,310 81,900 25,200 252,000
4 6,350 14.16 7,590 81,900 25,500 265,000
5.5 6,400 14.27 7,670 83,300 26,000 263,000
LTAG18 612830 6953124 0 4,240 9.46 6,930 55,800 21,700 184,000
1 4,260 9.50 7,370 56,700 21,100 193,000
LTAG19 616742 6954229
0 5,110 11.40 5,660 70,200 18,500 221,000
1 5,180 11.55 5,500 71,900 18,400 217,000
2.5 5,110 11.40 5,690 68,400 18,500 220,000
LTAG20 619339 6952229
0 5,280 11.77 7,070 89,400 20,900 259,000
1 5,120 11.42 6,750 85,400 19,800 262,000
2.5 5,090 11.35 6,390 84,900 19,800 264,000
4 5,200 11.60 6,620 86,400 20,300 266,000
LTAG21 622383 6950850 0 5,090 11.35 6,450 79,000 19,900 253,000
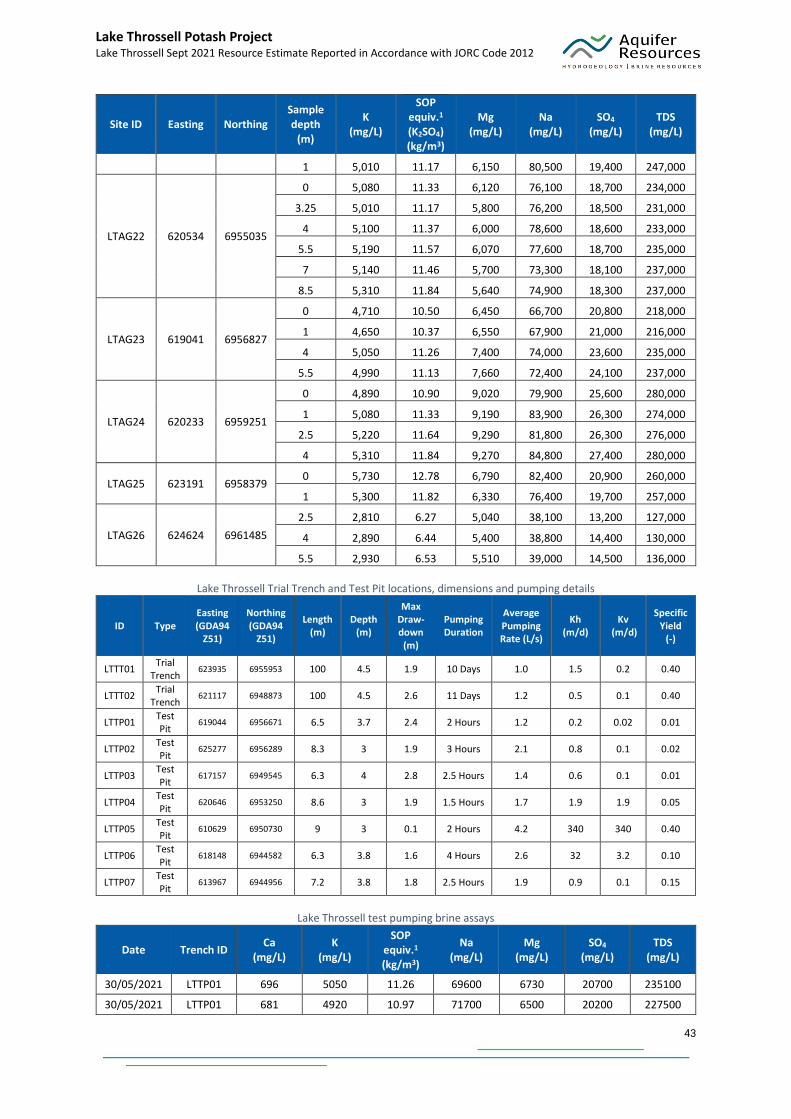
Lake Throssell Potash Project Lake Throssell Sept 2021 Resource Estimate Reported in Accordance with JORC Code 2012
43
Site ID Easting Northing Sample depth
(m)
K (mg/L)
SOP equiv.1 (K2SO4) (kg/m3)
Mg (mg/L)
Na (mg/L)
SO4 (mg/L)
TDS (mg/L)
1 5,010 11.17 6,150 80,500 19,400 247,000
LTAG22 620534 6955035
0 5,080 11.33 6,120 76,100 18,700 234,000
3.25 5,010 11.17 5,800 76,200 18,500 231,000
4 5,100 11.37 6,000 78,600 18,600 233,000
5.5 5,190 11.57 6,070 77,600 18,700 235,000
7 5,140 11.46 5,700 73,300 18,100 237,000
8.5 5,310 11.84 5,640 74,900 18,300 237,000
LTAG23 619041 6956827
0 4,710 10.50 6,450 66,700 20,800 218,000
1 4,650 10.37 6,550 67,900 21,000 216,000
4 5,050 11.26 7,400 74,000 23,600 235,000
5.5 4,990 11.13 7,660 72,400 24,100 237,000
LTAG24 620233 6959251
0 4,890 10.90 9,020 79,900 25,600 280,000
1 5,080 11.33 9,190 83,900 26,300 274,000
2.5 5,220 11.64 9,290 81,800 26,300 276,000
4 5,310 11.84 9,270 84,800 27,400 280,000
LTAG25 623191 6958379 0 5,730 12.78 6,790 82,400 20,900 260,000
1 5,300 11.82 6,330 76,400 19,700 257,000
LTAG26 624624 6961485
2.5 2,810 6.27 5,040 38,100 13,200 127,000
4 2,890 6.44 5,400 38,800 14,400 130,000
5.5 2,930 6.53 5,510 39,000 14,500 136,000
Lake Throssell Trial Trench and Test Pit locations, dimensions and pumping details
ID Type Easting (GDA94
Z51)
Northing (GDA94
Z51)
Length (m)
Depth (m)
Max Draw-down
(m)
Pumping Duration
Average Pumping Rate (L/s)
Kh (m/d)
Kv (m/d)
Specific Yield
(-)
LTTT01 Trial
Trench 623935 6955953 100 4.5 1.9 10 Days 1.0 1.5 0.2 0.40
LTTT02 Trial
Trench 621117 6948873 100 4.5 2.6 11 Days 1.2 0.5 0.1 0.40
LTTP01 Test Pit
619044 6956671 6.5 3.7 2.4 2 Hours 1.2 0.2 0.02 0.01
LTTP02 Test Pit
625277 6956289 8.3 3 1.9 3 Hours 2.1 0.8 0.1 0.02
LTTP03 Test Pit
617157 6949545 6.3 4 2.8 2.5 Hours 1.4 0.6 0.1 0.01
LTTP04 Test Pit
620646 6953250 8.6 3 1.9 1.5 Hours 1.7 1.9 1.9 0.05
LTTP05 Test Pit
610629 6950730 9 3 0.1 2 Hours 4.2 340 340 0.40
LTTP06 Test Pit
618148 6944582 6.3 3.8 1.6 4 Hours 2.6 32 3.2 0.10
LTTP07 Test Pit
613967 6944956 7.2 3.8 1.8 2.5 Hours 1.9 0.9 0.1 0.15
Lake Throssell test pumping brine assays
Date Trench ID Ca
(mg/L) K
(mg/L)
SOP equiv.1
(kg/m3)
Na (mg/L)
Mg (mg/L)
SO4 (mg/L)
TDS (mg/L)
30/05/2021 LTTP01 696 5050 11.26 69600 6730 20700 235100
30/05/2021 LTTP01 681 4920 10.97 71700 6500 20200 227500

Lake Throssell Potash Project Lake Throssell Sept 2021 Resource Estimate Reported in Accordance with JORC Code 2012
44
Date Trench ID Ca
(mg/L) K
(mg/L)
SOP equiv.1
(kg/m3)
Na (mg/L)
Mg (mg/L)
SO4 (mg/L)
TDS (mg/L)
16/05/2021 LTTP02 516 5400 12.04 85800 9260 19500 304700
16/05/2021 LTTP02 514 5330 11.89 89000 9120 19600 309900
29/05/2021 LTTP03 717 5060 11.28 78100 6440 17000 251300
29/05/2021 LTTP03 736 5030 11.22 78300 6430 17300 243600
17/05/2021 LTTP04 582 4850 10.82 79900 7520 21300 265300
17/05/2021 LTTP04 586 4860 10.84 81300 7560 21300 269800
2/06/2021 LTTP05 605 6070 13.54 77700 7010 24000 248100
2/06/2021 LTTP05 611 5870 13.09 75400 6900 23900 238000
27/05/2021 LTTP06 606 5130 11.44 87500 7550 19700 278450
27/05/2021 LTTP06 632 4970 11.08 83200 7180 18900 267300
28/05/2021 LTTP07 585 5140 11.46 80000 6930 21700 265850
28/05/2021 LTTP07 613 5070 11.31 82400 6770 20500 257300
15/05/2021 LTTT01 483 5050 11.26 76800 8600 21100 297250
17/05/2021 LTTT01 500 5660 12.62 85000 9460 23600 372100
20/05/2021 LTTT01 491 5730 12.78 83300 9560 24600 319900
23/05/2021 LTTT01 477 5610 12.51 82700 9370 23900 346350
25/05/2021 LTTT01 488 5700 12.71 82900 9410 24200 292150
21/05/2021 LTTT02 612 4920 10.97 82000 7610 19400 275100
24/05/2021 LTTT02 606 4920 10.97 82200 7670 19400 275100
27/05/2021 LTTT02 571 4610 10.28 80100 7240 18600 276800
30/05/2021 LTTT02 608 4970 11.08 86100 7630 19400 270400
31/05/2021 LTTT02 597 4930 10.99 83600 7620 18300 269200
Lake Throssell air-core drill hole locations
Collar ID Easting
(GDA94 Z51) Northing
(GDA94 Z51) Azimuth Dip
RL (mAHD)
Depth (m)
LTAC001 628388 6962021 0 -90 372 105
LTAC002 628176 6962125 0 -90 372 102
LTAC003 625859 6957880 0 -90 383 105
LTAC004 626076 6957761 0 -90 387 110
LTAC005 626271 6957639 0 -90 380 103
LTAC006 625599 6958044 0 -90 375 102
LTAC007 625013 6958442 0 -90 374 105
LTAC008 625073 6954204 0 -90 380 120
LTAC009 624590 6954598 0 -90 370 109
LTAC010 624330 6954770 0 -90 381 129
LTAC011 624900 6954397 0 -90 344 105
LTAC012 625321 6954113 0 -90 378 120
LTAC013 626684 6957399 0 -90 376 87
LTAC014 624598 6958634 0 -90 374 106
LTAC015 619031 6950979 0 -90 370 97
LTAC016 619951 6950276 0 -90 369 130
LTAC017 620753 6949534 0 -90 368 60
LTAC018 620767 6949553 0 -90 367 129
LTAC019 621325 6949188 0 -90 372 131
LTAC020 618904 6943976 0 -90 376 73

Lake Throssell Potash Project Lake Throssell Sept 2021 Resource Estimate Reported in Accordance with JORC Code 2012
45
Collar ID Easting
(GDA94 Z51) Northing
(GDA94 Z51) Azimuth Dip
RL (mAHD)
Depth (m)
LTAC021 619372 6943476 0 -90 372 54
LTAC022 614538 6941828 0 -90 372 126
LTAC023 609051 6941266 0 -90 379 108
LTAC024 608793 6942149 0 -90 377 108
LTAC025 605931 6941400 0 -90 370 106
LTAC026 606360 6939722 0 -90 371 108
LTAC027 606125 6940664 0 -90 374 104
LTAC028 603361 6939557 0 -90 381 105
LTAC029 608342 6943819 0 -90 374 100
LTAC030 608554 6942945 0 -90 378 104
LTAC031 609306 6940345 0 -90 383 107
LTAC032 608445 6943398 0 -90 372 102
LTAC033 608235 6944107 0 -90 370 95
LTAC034 612058 6942224 0 -90 366 105
LTAC035 612537 6941660 0 -90 381 106
LTAC036 611676 6942812 0 -90 376 111
LTAC037 610808 6944073 0 -90 375 101
LTAC038 613975 6943553 0 -90 378 129
LTAC039 613316 6945407 0 -90 364 62
LTAC040 617061 6945835 0 -90 365 131
LTAC041 615865 6947171 0 -90 372 89
LTAC042 616463 6946466 0 -90 373 101
LTAC043 617612 6945228 0 -90 374 144
LTAC044 618747 6947918 0 -90 372 124
LTAC045 617320 6949225 0 -90 367 78
LTAC046 614871 6951078 0 -90 371 68
LTAC047 611333 6951499 0 -90 351 100
LTAC048 620788 6952231 0 -90 372 117
LTAC049 620226 6952834 0 -90 377 128
LTAC050 621488 6954148 0 -90 375 112
LTAC051 620493 6955247 0 -90 374 68
LTAC052 621948 6956306 0 -90 371 99
LTAC053 623545 6959320 0 -90 378 83
LTAC054 624413 6960692 0 -90 378 106
Lake Throssell air-core assay results
Hole ID From To Ca K SOP equiv. 2 Na Mg S SO4 TDS
(m) (m) (mg/L) (mg/L) (mg/L) (kg/m3) (mg/L) (mg/L) (mg/L) (mg/L) (mg/L)
LTAC001 102 102 570 4,420 9,848 9.85 77,000 8,000 7,470 22,400 248,000
LTAC001 105 105 555 4,700 10,472 10.47 79,700 8,420 7,550 22,700 258,000
LTAC002 0 3 1,090 4,150 9,246 9.25 51,000 5,270 4,380 13,100 161,000
LTAC002 90 90 828 4,730 10,538 10.54 64,700 6,930 5,820 17,500 204,000
LTAC002 96 96 454 5,170 11,519 11.52 89,300 9,420 8,400 25,200 284,000
LTAC002 99 99 560 4,670 10,405 10.41 81,600 8,420 7,630 22,900 261,000
2 SOP equivalent (K2SO4) is calculated by multiplying potassium by 2.23.

Lake Throssell Potash Project Lake Throssell Sept 2021 Resource Estimate Reported in Accordance with JORC Code 2012
46
Hole ID From To Ca K SOP equiv. 2 Na Mg S SO4 TDS
(m) (m) (mg/L) (mg/L) (mg/L) (kg/m3) (mg/L) (mg/L) (mg/L) (mg/L) (mg/L)
LTAC002 102 102 450 5,070 11,296 11.30 87,500 9,250 8,310 24,900 288,000
LTAC003 54 54 646 4,770 10,628 10.63 81,900 7,810 6,310 18,900 257,000
LTAC003 93 93 617 4,430 9,870 9.87 78,800 8,420 7,040 21,100 255,000
LTAC003 96 96 605 4,430 9,870 9.87 76,000 8,300 7,010 21,000 252,000
LTAC003 99 99 609 4,370 9,736 9.74 78,300 8,390 6,990 21,000 251,000
LTAC004 12 12 1,120 2,210 4,924 4.92 40,400 4,100 4,010 12,000 128,000
LTAC004 96 96 601 4,340 9,670 9.67 78,600 8,500 7,290 21,900 257,000
LTAC004 99 99 662 4,160 9,268 9.27 77,100 8,220 7,050 21,200 244,000
LTAC004 102 102 624 4,130 9,202 9.20 73,600 8,100 7,000 21,000 246,000
LTAC004 108 108 575 4,410 9,825 9.83 80,400 8,400 7,290 21,900 258,000
LTAC005 75 75 700 3,580 7,976 7.98 67,700 7,210 6,460 19,400 216,000
LTAC005 90 90 692 3,750 8,355 8.36 69,400 7,560 6,700 20,100 225,000
LTAC005 93 93 600 4,070 9,068 9.07 74,200 8,190 7,150 21,500 249,000
LTAC005 99 99 584 4,230 9,424 9.42 74,400 8,390 7,100 21,300 253,000
LTAC005 102 102 610 4,030 8,979 8.98 70,300 8,070 6,930 20,800 248,000
LTAC006 87 87 576 4,890 10,895 10.90 78,800 8,010 6,450 19,400 273,000
LTAC006 90 90 579 4,480 9,981 9.98 77,300 8,490 6,890 20,700 258,000
LTAC006 93 93 593 4,480 9,981 9.98 78,400 8,410 7,080 21,200 257,000
LTAC006 96 96 583 4,510 10,048 10.05 75,300 8,460 7,060 21,200 259,000
LTAC007 90 90 586 4,480 9,981 9.98 76,800 8,090 7,240 21,700 255,000
LTAC007 93 93 582 4,490 10,004 10.00 77,200 8,030 7,290 21,900 252,000
LTAC007 99 99 589 4,360 9,714 9.71 73,900 7,930 6,990 21,000 252,000
LTAC007 102 102 581 4,410 9,825 9.83 75,000 8,080 7,220 21,700 271,000
LTAC008 75 75 589 4,390 9,781 9.78 75,400 8,280 6,970 20,900 256,000
LTAC008 81 81 597 4,300 9,580 9.58 75,000 8,200 6,880 20,600 253,000
LTAC008 99 99 639 4,020 8,957 8.96 72,300 7,760 6,560 19,700 261,000
LTAC008 105 105 621 4,160 9,268 9.27 73,300 7,880 6,760 20,300 249,000
LTAC008 108 108 618 4,250 9,469 9.47 75,900 8,120 7,130 21,400 250,000
LTAC008 111 111 621 4,170 9,291 9.29 73,000 8,060 6,740 20,200 255,000
LTAC008 114 114 640 4,140 9,224 9.22 75,200 7,890 6,780 20,300 263,000
LTAC008 117 117 643 4,120 9,179 9.18 75,000 7,790 6,680 20,000 260,000
LTAC009 72 72 578 4,230 9,424 9.42 73,600 8,240 7,020 21,100 256,000
LTAC009 75 75 595 4,250 9,469 9.47 75,800 8,220 7,080 21,200 269,000
LTAC009 78 78 587 4,260 9,491 9.49 74,200 8,300 6,920 20,800 269,000
LTAC009 81 81 564 4,370 9,736 9.74 76,000 8,710 7,360 22,100 267,000
LTAC009 87 87 589 4,280 9,536 9.54 75,100 8,510 7,310 21,900 260,000
LTAC009 90 90 596 4,240 9,447 9.45 75,600 8,300 7,070 21,200 254,000
LTAC009 96 96 596 4,220 9,402 9.40 75,500 8,270 6,790 20,400 256,000
LTAC009 105 105 543 4,390 9,781 9.78 81,900 8,750 7,350 22,100 265,000
LTAC010 120 120 515 4,440 9,892 9.89 81,300 9,160 7,630 22,900 272,000

Lake Throssell Potash Project Lake Throssell Sept 2021 Resource Estimate Reported in Accordance with JORC Code 2012
47
Hole ID From To Ca K SOP equiv. 2 Na Mg S SO4 TDS
(m) (m) (mg/L) (mg/L) (mg/L) (kg/m3) (mg/L) (mg/L) (mg/L) (mg/L) (mg/L)
LTAC010 126 126 529 4,440 9,892 9.89 80,300 9,180 7,900 23,700 269,000
LTAC011 15 15 539 4,230 9,424 9.42 77,600 7,960 7,090 21,300 250,000
LTAC011 72 72 618 4,250 9,469 9.47 73,200 8,120 6,710 20,100 251,000
LTAC011 81 81 636 4,250 9,469 9.47 74,800 8,140 6,870 20,600 249,000
LTAC012 75 75 668 4,160 9,268 9.27 73,800 7,780 6,580 19,700 242,000
LTAC012 78 78 674 4,180 9,313 9.31 73,600 8,060 6,690 20,100 243,000
LTAC012 81 81 562 4,430 9,870 9.87 80,300 8,520 6,970 20,900 262,000
LTAC012 96 96 645 4,150 9,246 9.25 72,400 7,860 6,670 20,000 247,000
LTAC012 99 99 672 4,140 9,224 9.22 74,900 7,810 6,490 19,500 245,000
LTAC012 105 105 626 4,340 9,670 9.67 77,900 8,180 6,890 20,700 254,000
LTAC012 108 108 554 4,480 9,981 9.98 81,100 8,680 7,070 21,200 269,000
LTAC012 114 114 680 4,130 9,202 9.20 73,700 7,790 6,440 19,300 243,000
LTAC012 120 120 681 4,110 9,157 9.16 73,800 7,770 6,510 19,500 242,000
LTAC014 36 36 520 4,990 11,118 11.12 81,300 8,740 7,640 22,900 270,000
LTAC014 51 51 555 4,630 10,316 10.32 77,900 8,260 7,450 22,400 270,000
LTAC014 60 60 555 4,520 10,071 10.07 77,800 8,150 7,380 22,100 260,000
LTAC014 99 99 536 4,670 10,405 10.41 79,200 8,750 8,050 24,200 268,000
LTAC015 60 60 482 5,110 11,385 11.39 84,400 9,010 8,310 24,900 280,000
LTAC015 84 84 517 4,750 10,583 10.58 81,700 8,890 8,260 24,800 271,000
LTAC015 87 87 544 4,710 10,494 10.49 79,400 8,610 8,170 24,500 265,000
LTAC015 90 90 455 4,910 10,939 10.94 86,500 9,110 8,620 25,900 285,000
LTAC015 93 93 536 4,630 10,316 10.32 81,800 8,580 8,130 24,400 264,000
LTAC016 99 99 458 4,900 10,917 10.92 88,500 9,430 8,460 25,400 285,000
LTAC016 102 102 482 4,920 10,962 10.96 89,900 9,580 8,670 26,000 286,000
LTAC016 117 117 517 4,620 10,293 10.29 81,400 9,000 7,800 23,400 274,000
LTAC016 123 123 495 4,680 10,427 10.43 88,900 9,090 8,100 24,300 276,000
LTAC016 126 126 495 4,510 10,048 10.05 81,900 8,780 7,930 23,800 271,000
LTAC016 129 129 499 4,560 10,160 10.16 83,200 8,590 8,010 24,000 271,000
LTAC018 72 72 565 4,270 9,522 9.52 82,300 8,820 7,320 22,000 267,000
LTAC018 75 75 553 4,260 9,500 9.50 81,600 8,650 7,150 21,500 267,000
LTAC018 78 78 564 4,230 9,433 9.43 79,400 8,680 7,290 21,900 267,000
LTAC018 81 81 558 4,410 9,834 9.83 84,400 9,120 7,680 23,000 271,000
LTAC018 84 84 569 4,290 9,567 9.57 85,500 8,910 7,530 22,600 269,000
LTAC018 87 87 561 4,330 9,656 9.66 84,100 8,720 7,440 22,300 269,000
LTAC018 90 90 547 4,200 9,366 9.37 82,600 8,540 7,230 21,700 265,000
LTAC018 93 93 548 4,270 9,522 9.52 83,900 8,680 7,590 22,800 268,000
LTAC018 99 99 548 4,130 9,210 9.21 80,100 8,370 7,370 22,100 264,000
LTAC018 102 102 543 4,220 9,411 9.41 82,700 8,640 7,300 21,900 269,000
LTAC018 105 105 470 4,270 9,522 9.52 83,400 8,680 7,590 22,800 283,000
LTAC018 111 111 502 4,210 9,388 9.39 83,900 8,590 8,040 24,100 275,000

Lake Throssell Potash Project Lake Throssell Sept 2021 Resource Estimate Reported in Accordance with JORC Code 2012
48
Hole ID From To Ca K SOP equiv. 2 Na Mg S SO4 TDS
(m) (m) (mg/L) (mg/L) (mg/L) (kg/m3) (mg/L) (mg/L) (mg/L) (mg/L) (mg/L)
LTAC018 114 114 533 4,160 9,277 9.28 83,500 8,540 7,760 23,300 268,000
LTAC018 117 117 513 4,240 9,455 9.46 82,000 8,560 7,760 23,300 272,000
LTAC018 120 120 549 4,160 9,277 9.28 82,400 8,460 7,660 23,000 265,000
LTAC018 123 123 535 4,170 9,299 9.30 81,500 8,630 7,830 23,500 270,000
LTAC018 126 126 525 4,220 9,411 9.41 82,400 8,770 7,730 23,200 272,000
LTAC019 42 42 553 4,330 9,656 9.66 85,900 9,030 7,760 23,300 269,000
LTAC019 45 45 576 4,160 9,277 9.28 78,900 8,790 6,960 20,900 263,000
LTAC019 48 48 553 4,260 9,500 9.50 83,200 8,830 7,320 22,000 271,000
LTAC019 66 66 552 4,240 9,455 9.46 81,600 8,680 7,660 23,000 268,000
LTAC019 69 69 540 4,260 9,500 9.50 83,400 8,570 7,510 22,500 268,000
LTAC019 72 72 549 4,180 9,321 9.32 81,600 8,670 7,590 22,800 267,000
LTAC019 75 75 549 4,220 9,411 9.41 82,100 8,590 7,840 23,500 268,000
LTAC019 78 78 545 4,230 9,433 9.43 82,700 8,670 7,450 22,400 267,000
LTAC019 81 81 560 4,270 9,522 9.52 81,500 8,790 7,480 22,400 267,000
LTAC019 87 87 532 4,180 9,321 9.32 76,900 7,960 7,360 22,100 262,000
LTAC019 90 90 537 4,210 9,388 9.39 83,700 8,470 7,870 23,600 264,000
LTAC019 93 93 542 3,980 8,875 8.88 79,700 8,240 7,220 21,700 264,000
LTAC019 96 96 544 3,980 8,875 8.88 79,200 8,380 7,430 22,300 263,000
LTAC019 99 99 551 4,040 9,009 9.01 79,700 8,460 7,600 22,800 261,000
LTAC019 102 102 557 4,030 8,987 8.99 80,700 8,530 7,870 23,600 262,000
LTAC019 105 105 532 3,950 8,809 8.81 78,900 8,150 7,420 22,300 263,000
LTAC019 108 108 558 4,050 9,032 9.03 82,600 8,600 7,700 23,100 262,000
LTAC019 111 111 556 4,060 9,054 9.05 84,000 8,700 8,020 24,100 263,000
LTAC019 117 117 554 4,040 9,009 9.01 81,300 8,590 8,040 24,100 265,000
LTAC019 120 120 552 4,090 9,121 9.12 82,000 8,660 7,740 23,200 263,000
LTAC019 123 123 524 4,140 9,232 9.23 79,600 8,430 7,520 22,600 265,000
LTAC019 126 126 546 4,110 9,165 9.17 80,200 8,470 7,570 22,700 264,000
LTAC019 129 129 549 4,150 9,255 9.26 80,100 8,600 7,600 22,800 265,000
LTAC020 72 72 551 4,430 9,879 9.88 83,300 8,780 7,710 23,100 270,000
LTAC022 99 99 497 4,330 9,656 9.66 82,800 8,790 8,510 25,500 273,000
LTAC022 111 111 468 4,490 10,013 10.01 86,200 9,080 9,070 27,200 281,000
LTAC022 117 117 498 4,470 9,968 9.97 88,900 9,170 8,940 26,800 278,000
LTAC022 126 126 503 4,350 9,701 9.70 84,100 8,890 8,740 26,200 274,000
LTAC023 105 105 557 4,200 9,366 9.37 77,900 8,460 8,900 26,700 N/A
LTAC023 108 108 544 4,170 9,299 9.30 78,800 8,510 8,860 26,600 258,000
LTAC024 102 102 520 4,220 9,411 9.41 75,700 8,360 8,570 25,700 263,000
LTAC024 108 108 547 4,350 9,701 9.70 80,700 8,760 8,590 25,800 264,000
LTAC025 102 102 428 4,940 11,016 11.02 86,900 9,770 10,300 30,900 287,000
LTAC025 105 105 443 4,780 10,659 10.66 81,800 9,270 9,500 28,500 282,000
LTAC025 106 106 491 4,680 10,436 10.44 81,100 8,960 9,220 27,700 272,000

Lake Throssell Potash Project Lake Throssell Sept 2021 Resource Estimate Reported in Accordance with JORC Code 2012
49
Hole ID From To Ca K SOP equiv. 2 Na Mg S SO4 TDS
(m) (m) (mg/L) (mg/L) (mg/L) (kg/m3) (mg/L) (mg/L) (mg/L) (mg/L) (mg/L)
LTAC026 0.3 0.3 458 5,030 11,217 11.22 78,900 9,020 8,380 25,100 276,000
LTAC026 96 96 459 4,730 10,548 10.55 80,700 9,400 9,780 29,300 276,000
LTAC026 99 99 493 4,570 10,191 10.19 81,200 9,240 9,780 29,300 271,000
LTAC026 108 108 478 4,520 10,080 10.08 81,600 9,090 9,410 28,200 269,000
LTAC027 87 87 467 4,620 10,303 10.30 79,500 8,910 9,300 27,900 273,000
LTAC027 90 90 479 4,660 10,392 10.39 83,500 9,150 9,300 27,900 271,000
LTAC027 93 93 489 4,700 10,481 10.48 84,200 9,170 9,500 28,500 271,000
LTAC027 96 96 438 4,850 10,816 10.82 87,200 9,410 9,780 29,300 285,000
LTAC027 102 102 483 4,660 10,392 10.39 81,100 9,140 9,410 28,200 274,000
LTAC027 104 104 478 4,650 10,370 10.37 82,800 8,980 9,300 27,900 271,000
LTAC028 102 102 520 4,480 9,990 9.99 77,200 9,020 9,410 28,200 265,000
LTAC028 105 105 498 4,460 9,946 9.95 78,200 8,890 9,270 27,800 265,000
LTAC029 75 75 458 4,820 10,749 10.75 88,200 9,300 9,150 27,500 286,000
LTAC029 78 78 456 4,740 10,570 10.57 85,500 9,130 9,280 27,800 282,000
LTAC029 81 81 475 4,710 10,503 10.50 83,800 9,170 9,030 27,100 280,000
LTAC029 84 84 444 4,580 10,213 10.21 78,600 8,670 8,630 25,900 276,000
LTAC029 87 87 447 4,730 10,548 10.55 84,700 9,050 9,580 28,700 281,000
LTAC029 90 90 463 4,560 10,169 10.17 82,400 8,840 8,770 26,300 278,000
LTAC029 93 93 452 4,660 10,392 10.39 84,400 8,930 9,220 27,700 280,000
LTAC029 99 99 452 4,700 10,481 10.48 85,600 8,880 9,410 28,200 280,000
LTAC030 81 81 453 4,660 10,392 10.39 85,700 8,790 9,010 27,000 262,000
LTAC030 84 84 535 4,280 9,544 9.54 75,900 8,410 8,820 26,500 254,000
LTAC030 87 87 549 4,290 9,567 9.57 75,800 8,760 8,500 25,500 259,000
LTAC030 90 90 526 4,360 9,723 9.72 76,100 8,400 8,910 26,700 259,000
LTAC031 102 102 534 4,150 9,255 9.26 77,700 8,320 8,340 25,000 258,000
LTAC031 105 105 547 4,070 9,076 9.08 75,000 8,080 8,340 25,000 254,000
LTAC032 84 84 462 4,660 10,392 10.39 86,000 8,830 8,880 26,600 279,000
LTAC032 87 87 469 4,650 10,370 10.37 83,300 8,760 8,700 26,100 281,000
LTAC032 96 96 479 4,620 10,303 10.30 84,600 8,650 8,630 25,900 278,000
LTAC032 99 99 483 4,800 10,704 10.70 88,300 9,200 9,600 28,800 284,000
LTAC032 102 102 479 4,810 10,726 10.73 86,600 9,020 9,060 27,200 281,000
LTAC033 87 87 456 4,930 10,994 10.99 83,400 9,150 9,600 28,800 284,000
LTAC033 90 90 431 4,970 11,083 11.08 87,300 9,450 10,100 30,300 292,000
LTAC033 93 93 425 4,710 10,503 10.50 83,200 9,050 9,130 27,400 279,000
LTAC033 95 95 485 4,970 11,083 11.08 82,600 8,040 8,500 25,500 270,000
LTAC034 78 78 479 4,630 10,325 10.33 84,800 8,550 8,650 26,000 274,000
LTAC034 102 102 506 4,530 10,102 10.10 81,200 8,610 8,260 24,800 273,000
LTAC035 93 93 509 4,680 10,436 10.44 82,800 9,140 8,450 25,400 279,000
LTAC035 99 99 509 4,680 10,436 10.44 82,800 9,140 8,450 25,400 279,000
LTAC035 106 106 509 4,680 10,436 10.44 82,800 9,140 8,450 25,400 279,000

Lake Throssell Potash Project Lake Throssell Sept 2021 Resource Estimate Reported in Accordance with JORC Code 2012
50
Hole ID From To Ca K SOP equiv. 2 Na Mg S SO4 TDS
(m) (m) (mg/L) (mg/L) (mg/L) (kg/m3) (mg/L) (mg/L) (mg/L) (mg/L) (mg/L)
LTAC034 90 90 509 4,680 10,436 10.44 82,800 9,140 8,450 25,400 279,000
LTAC034 96 96 509 4,680 10,436 10.44 82,800 9,140 8,450 25,400 279,000
LTAC034 99 99 510 4,610 10,280 10.28 83,600 8,700 8,260 24,800 276,000
LTAC034 102 102 511 4,640 10,347 10.35 83,000 8,870 8,330 25,000 279,000
LTAC034 105 105 543 4,660 10,392 10.39 83,500 9,300 8,510 25,500 279,000
LTAC034 108 108 504 4,650 10,370 10.37 83,900 8,700 8,250 24,800 274,000
LTAC037 75 75 480 4,850 10,816 10.82 86,900 9,160 8,640 25,900 286,000
LTAC037 78 78 454 4,690 10,459 10.46 82,700 8,610 8,260 24,800 282,000
LTAC037 81 81 475 4,860 10,838 10.84 85,000 9,020 8,480 25,400 282,000
LTAC037 84 84 478 4,750 10,593 10.59 81,400 8,790 8,300 24,900 280,000
LTAC037 87 87 486 4,780 10,659 10.66 86,400 8,920 8,650 26,000 276,000
LTAC037 90 90 501 4,800 10,704 10.70 86,600 9,170 8,570 25,700 276,000
LTAC037 93 93 486 4,770 10,637 10.64 82,800 8,870 8,560 25,700 276,000
LTAC037 96 96 471 4,900 10,927 10.93 87,000 9,290 8,600 25,800 283,000
LTAC037 99 99 478 4,910 10,949 10.95 86,400 9,470 8,960 26,900 280,000
LTAC038 87 87 491 4,580 10,213 10.21 83,800 9,490 8,870 26,600 281,000
LTAC038 90 90 420 4,790 10,682 10.68 88,000 9,570 9,220 27,700 290,000
LTAC038 93 93 431 4,740 10,570 10.57 89,500 10,100 9,100 27,300 292,000
LTAC038 105 105 421 4,770 10,637 10.64 89,500 9,500 9,350 28,100 291,000
LTAC038 108 108 422 4,780 10,659 10.66 92,200 9,700 9,460 28,400 291,000
LTAC038 111 111 451 4,590 10,236 10.24 86,500 9,420 9,220 27,700 284,000
LTAC038 117 117 439 4,810 10,726 10.73 88,600 9,720 9,190 27,600 288,000
LTAC038 120 120 460 4,650 10,370 10.37 88,200 9,460 9,180 27,500 283,000
LTAC038 123 123 434 4,760 10,615 10.62 89,800 9,690 8,970 26,900 289,000
LTAC038 129 129 440 4,810 10,726 10.73 89,700 9,820 9,030 27,100 290,000
LTAC039 48 48 563 4,340 9,678 9.68 77,400 8,150 7,580 22,700 250,000
LTAC040 99 99 361 5,800 12,934 12.93 95,800 11,200 10,100 30,300 319,000
LTAC040 105 105 458 4,750 10,593 10.59 83,600 8,860 8,280 24,800 275,000
LTAC040 108 108 457 4,690 10,459 10.46 85,200 8,830 8,220 24,700 276,000
LTAC040 111 111 447 4,630 10,325 10.33 84,200 8,720 8,230 24,700 274,000
LTAC040 114 114 473 4,900 10,927 10.93 88,200 9,220 8,710 26,100 283,000
LTAC040 117 117 458 4,780 10,659 10.66 87,500 8,980 8,220 24,700 277,000
LTAC040 120 120 462 4,820 10,749 10.75 86,000 9,070 8,130 24,400 277,000
LTAC040 126 126 466 4,870 10,860 10.86 85,700 9,080 8,360 25,100 277,000
LTAC040 129 129 459 4,760 10,615 10.62 86,700 9,040 8,440 25,300 276,000
LTAC040 131 131 463 4,800 10,704 10.70 84,800 9,020 8,170 24,500 276,000
LTAC041 72 72 516 4,670 10,414 10.41 85,500 8,830 8,110 24,300 269,000
LTAC041 75 75 505 4,720 10,526 10.53 83,800 8,690 8,110 24,300 272,000
LTAC041 78 78 498 4,630 10,325 10.33 82,100 8,550 7,880 23,600 268,000
LTAC041 81 81 493 4,700 10,481 10.48 85,600 8,530 8,080 24,200 270,000

Lake Throssell Potash Project Lake Throssell Sept 2021 Resource Estimate Reported in Accordance with JORC Code 2012
51
Hole ID From To Ca K SOP equiv. 2 Na Mg S SO4 TDS
(m) (m) (mg/L) (mg/L) (mg/L) (kg/m3) (mg/L) (mg/L) (mg/L) (mg/L) (mg/L)
LTAC041 84 84 517 4,570 10,191 10.19 83,600 8,530 8,310 24,900 262,000
LTAC041 87 87 532 4,640 10,347 10.35 82,400 8,950 8,460 25,400 267,000
LTAC042 78 78 463 4,880 10,882 10.88 82,200 8,320 8,030 24,100 271,000
LTAC042 81 81 509 4,800 10,704 10.70 81,000 9,080 8,290 24,900 270,000
LTAC042 84 84 445 4,730 10,548 10.55 79,600 7,980 8,090 24,300 268,000
LTAC042 87 87 444 4,780 10,659 10.66 81,900 8,100 7,970 23,900 272,000
LTAC042 90 90 444 4,830 10,771 10.77 82,800 8,140 8,130 24,400 271,000
LTAC042 93 93 455 4,940 11,016 11.02 85,900 8,420 8,220 24,700 271,000
LTAC042 96 96 457 4,770 10,637 10.64 81,700 8,380 8,280 24,800 272,000
LTAC042 99 99 458 4,690 10,459 10.46 80,900 8,450 8,040 24,100 276,000
LTAC043 90 90 512 4,680 10,436 10.44 85,100 8,650 8,320 25,000 272,000
LTAC043 99 99 482 4,670 10,414 10.41 85,200 8,610 8,270 24,800 276,000
LTAC043 105 105 467 4,660 10,392 10.39 86,100 8,770 8,370 25,100 279,000
LTAC043 108 108 463 4,670 10,414 10.41 86,800 8,690 8,550 25,700 280,000
LTAC043 111 111 461 4,650 10,370 10.37 86,600 8,710 8,290 24,900 278,000
LTAC043 114 114 473 4,650 10,370 10.37 85,400 8,740 8,320 25,000 278,000
LTAC043 117 117 479 4,810 10,726 10.73 88,100 8,920 8,380 25,100 279,000
LTAC043 120 120 470 4,700 10,481 10.48 85,800 8,860 8,670 26,000 278,000
LTAC043 123 123 464 4,650 10,370 10.37 81,400 8,550 8,350 25,100 277,000
LTAC043 126 126 469 4,730 10,548 10.55 87,800 8,720 8,460 25,400 279,000
LTAC043 132 132 468 4,760 10,615 10.62 85,400 8,670 8,520 25,600 281,000
LTAC043 135 135 459 4,760 10,615 10.62 84,000 8,540 8,380 25,100 278,000
LTAC043 141 141 482 4,690 10,459 10.46 84,200 8,690 8,570 25,700 279,000
LTAC044 90 90 575 4,230 9,433 9.43 81,800 8,510 7,530 22,600 264,000
LTAC044 93 93 560 4,170 9,299 9.30 80,900 8,310 7,700 23,100 262,000
LTAC044 96 96 530 4,110 9,165 9.17 80,900 8,220 7,340 22,000 264,000
LTAC044 99 99 550 4,090 9,121 9.12 81,700 8,300 7,590 22,800 265,000
LTAC044 102 102 530 4,100 9,143 9.14 80,900 8,290 7,660 23,000 265,000
LTAC045 75 75 578 4,550 10,147 10.15 83,200 8,100 7,700 23,100 267,000
LTAC048 87 87 526 4,340 9,678 9.68 83,200 8,700 8,080 24,200 269,000
LTAC048 90 90 514 4,370 9,745 9.75 82,700 8,790 8,010 24,000 271,000
LTAC048 93 93 551 4,350 9,701 9.70 81,100 8,770 7,980 23,900 273,000
LTAC048 96 96 528 4,320 9,634 9.63 83,100 8,360 8,100 24,300 271,000
LTAC048 114 114 494 4,340 9,678 9.68 83,700 8,730 7,890 23,700 277,000
LTAC048 117 117 514 4,260 9,500 9.50 83,000 8,550 8,010 24,000 271,000
LTAC049 99 99 524 4,320 9,634 9.63 80,000 8,520 8,170 24,500 266,000
LTAC049 105 105 549 4,310 9,611 9.61 82,100 8,740 8,390 25,200 265,000
LTAC049 108 108 550 4,390 9,790 9.79 87,400 8,830 8,580 25,700 268,000
LTAC049 117 117 570 4,370 9,745 9.75 80,900 9,070 8,790 26,400 268,000
LTAC049 125 125 534 4,310 9,611 9.61 78,600 8,500 8,080 24,200 265,000

Lake Throssell Potash Project Lake Throssell Sept 2021 Resource Estimate Reported in Accordance with JORC Code 2012
52
Hole ID From To Ca K SOP equiv. 2 Na Mg S SO4 TDS
(m) (m) (mg/L) (mg/L) (mg/L) (kg/m3) (mg/L) (mg/L) (mg/L) (mg/L) (mg/L)
LTAC050 96 96 529 4,310 9,611 9.61 82,400 9,040 8,260 24,800 272,000
LTAC050 99 99 507 4,340 9,678 9.68 84,900 8,950 8,360 25,100 272,000
LTAC052 69 69 497 4,760 10,615 10.62 83,800 8,710 7,770 23,300 284,000
LTAC052 84 84 517 4,850 10,816 10.82 89,800 8,930 8,120 24,400 285,000
LTAC052 87 87 510 4,960 11,061 11.06 88,700 8,930 8,280 24,800 288,000
LTAC053 83 83 535 4,880 10,882 10.88 85,000 8,210 7,200 21,600 281,000
LTAC054 105 105 476 4700 10,481 10.48 83,600 8,690 8,130 24,400 278,000
Lake Throssell PSD Analysis Results
Hole ID Depth (m)
% Sand
% Silt
% Clay
Stratigraphy Specific Yield
(%)
Saturated Hydraulic
Conductivity (m/d)
From To
LTAC017 59 68 64 31 4 Lacustrine Clay 19 0.61
LTAC036 87 90 47 44 9 Lacustrine Clay 12 0.15
LTAC043 87 90 13 81 5 Lacustrine Clay 3 0.01
LTAC043 90 93 54 31 16 Lacustrine Clay 11 0.09
LTAC019 69 77 80 16 4 Basal Sand 24 1.02
LTAC043 96 99 83 9 8 Basal Sand 23 0.67
LTAC043 99 102 86 6 8 Basal Sand 23 0.73
LTAC049 96 99 84 9 6 Basal Sand 25 0.91
LTAC050 93 96 64 28 8 Basal Sand 17 0.35
LTAC050 96 99 86 9 5 Basal Sand 26 1.12
LTAC027 90 93 88 5 7 Glacial Fluvial 25 0.90
LTAC027 93 96 94 4 2 Glacial Fluvial 32 4.36
LTAC027 99 102 83 3 13 Glacial Fluvial 19 0.36
LTAC033 84 87 69 26 6 Glacial Fluvial 20 0.63
LTAC033 87 90 38 56 6 Glacial Fluvial 11 0.13
LTAC033 90 93 54 36 10 Glacial Fluvial 14 0.19
LTAC033 93 95 65 27 8 Glacial Fluvial 18 0.39
LTAC035 96 99 81 16 3 Glacial Fluvial 26 1.33
LTAC035 103 106 71 20 9 Glacial Fluvial 19 0.44
LTAC036 93 96 83 10 7 Glacial Fluvial 23 0.73
LTAC036 96 99 76 16 8 Glacial Fluvial 21 0.55
LTAC036 99 102 62 26 12 Glacial Fluvial 15 0.20
LTAC036 105 108 55 35 10 Glacial Fluvial 14 0.20
LTAC036 108 111 55 32 13 Glacial Fluvial 13 0.14
LTAC038 84 87 77 14 9 Glacial Fluvial 20 0.49
LTAC038 102 105 84 9 6 Glacial Fluvial 24 0.87
LTAC038 108 111 55 34 11 Glacial Fluvial 13 0.16
LTAC038 117 120 67 26 7 Glacial Fluvial 19 0.46
LTAC038 123 126 73 15 12 Glacial Fluvial 17 0.30
LTAC040 96 99 88 8 4 Glacial Fluvial 27 1.25
LTAC040 102 105 89 5 5 Glacial Fluvial 27 1.17
LTAC040 105 108 77 5 18 Glacial Fluvial 15 0.17
LTAC040 108 111 82 7 11 Glacial Fluvial 20 0.48
LTAC040 111 114 85 5 10 Glacial Fluvial 22 0.59
LTAC040 114 117 68 20 12 Glacial Fluvial 16 0.27
LTAC040 117 120 64 24 11 Glacial Fluvial 16 0.25
LTAC040 120 123 76 13 10 Glacial Fluvial 19 0.42
LTAC040 123 126 55 30 15 Glacial Fluvial 12 0.11
LTAC040 126 129 70 15 15 Glacial Fluvial 14 0.18
LTAC040 129 132 76 10 14 Glacial Fluvial 17 0.28
LTAC042 75 78 73 20 7 Glacial Fluvial 21 0.61
LTAC042 78 81 84 10 5 Glacial Fluvial 25 1.04

Lake Throssell Potash Project Lake Throssell Sept 2021 Resource Estimate Reported in Accordance with JORC Code 2012
53
Hole ID Depth (m)
% Sand
% Silt
% Clay
Stratigraphy Specific Yield
(%)
Saturated Hydraulic
Conductivity (m/d)
From To
LTAC042 81 84 86 9 5 Glacial Fluvial 26 1.12
LTAC042 84 87 87 6 7 Glacial Fluvial 25 0.89
LTAC042 87 90 82 11 7 Glacial Fluvial 24 0.83
LTAC042 90 93 70 23 7 Glacial Fluvial 20 0.54
LTAC042 93 96 74 15 11 Glacial Fluvial 18 0.37
LTAC042 96 99 80 11 9 Glacial Fluvial 22 0.59
LTAC043 105 108 69 20 11 Glacial Fluvial 17 0.29
LTAC043 108 111 46 47 8 Glacial Fluvial 12 0.16
LTAC043 117 120 63 28 9 Glacial Fluvial 17 0.32
LTAC043 120 123 51 37 12 Glacial Fluvial 12 0.13
LTAC043 123 126 49 39 12 Glacial Fluvial 12 0.12
LTAC043 126 129 68 26 6 Glacial Fluvial 20 0.55
LTAC043 129 132 46 42 12 Glacial Fluvial 11 0.10
LTAC043 132 135 60 30 10 Glacial Fluvial 15 0.25
LTAC043 135 138 48 40 12 Glacial Fluvial 11 0.10
LTAC043 138 141 44 41 14 Glacial Fluvial 10 0.07
LTAC035 90 93 39 55 6 Perm Saprolite 11 0.14
LTAC049 105 108 51 37 12 Perm Saprolite 12 0.13
LTAC049 114 117 39 50 10 Perm Saprolite 10 0.08
LTAC049 123 126 39 50 11 Perm Saprolite 9 0.07

Lake Throssell Potash Project Lake Throssell Sept 2021 Resource Estimate Reported in Accordance with JORC Code 2012
54
APPENDIX 2 – JORC Tables
Section 1: Sampling Techniques and Data
Criteria JORC Code explanation Commentary
Sampling techniques
• Nature and quality of sampling (eg cut channels, random chips, or specific specialised industry standard measurement tools appropriate to the minerals under investigation, such as down hole gamma sondes, or handheld XRF instruments, etc). These examples should not be taken as limiting the broad meaning of sampling.
• Include reference to measures taken to ensure sample representivity and the appropriate calibration of any measurement tools or systems used.
• Aspects of the determination of mineralisation that are Material to the Public Report.
• In cases where ‘industry standard’ work has been done this would be relatively simple (eg ‘reverse circulation drilling was used to obtain 1 m samples from which 3 kg was pulverised to produce a 30 g charge for fire assay’). In other cases more explanation may be required, such as where there is coarse gold that has inherent sampling problems. Unusual commodities or mineralisation types (eg submarine nodules) may warrant disclosure of detailed information.
• During test pumping brine samples were collected from a sample tap on the discharge line down gradient of the pump. Field analysis of Salinity, pH and SG were completed daily. A calibrated mechanical flow meter was used to measure average flow rates, these measurements were validated with bucket and stopwatch estimates.
• During Air-core drilling brine sampling was carried out via airlifting during drilling at specific depths governed by the geology and brine inflow encountered. Brine samples were collected in a bucket, with approximate flow rates measured during sample collection. Fine sediment was allowed to settle prior to the brine sample being collected by decanting from the top of the bucket.
• Brine samples from air-core drilling are considered indicative of the zone directly above the current drill depth, but maybe skewed due the geology and potential for minor volumes to flow down hole in low permeability zones.
• Geological core samples were collected during the heli-rotary auger program using Lexan tubes at specific intervals.
• Brine samples were collected from bailing the auger hole at known intervals.
• A hand auger was used to complete holes to the target depth of ~1.2 metres. The brine was allowed to stand for several minutes to allow fine suspended sediment to settle. The final sample was obtained by decanting from the top of the water column.
Drilling techniques
• Drill type (e.g. core, reverse circulation, open-hole hammer, rotary air blast, auger, Bangka, sonic, etc) and details (e.g. core diameter, triple or standard tube, depth of diamond tails, face-sampling bit or other type, whether core is oriented and if so, by what method, etc).
• Trenches were excavated with a 15-tonne amphibious excavator to as deep as possible with the plant. Shalllower excavations generally being limited by denser geology.
• Air core drilling was at 3.5“ diameter.
• The rotary auger holes were drilled at 7“ hollow stem.
• Hand auger holes were augered with 8“ solid flight augers.
• All holes were drilled vertically.
Drill sample recovery
• Method of recording and assessing core and chip sample recoveries and results assessed.
• Measures taken to maximise sample recovery and ensure representative nature of the samples.
• Whether a relationship exists between sample recovery and grade and whether sample bias may have occurred due to preferential loss/gain of fine/coarse material.
• Lithological sample recovery was very good from air core drilling, indicated by large piles of lithological sample with little contamination.
• Lexan tube recovery was near >90%.
Geologic Logging
• Whether core and chip samples have been geologically and geotechnically logged to a level of detail to support appropriate Mineral Resource
• All excavation faces were visually logged qualitativly by a qualified geologist. A tape measure was used to confirm dimensions of

Lake Throssell Potash Project Lake Throssell Sept 2021 Resource Estimate Reported in Accordance with JORC Code 2012
55
Section 1: Sampling Techniques and Data
Criteria JORC Code explanation Commentary
estimation, mining studies and metallurgical studies.
• Whether logging is qualitative or quantitative in nature. Core (or costean, channel, etc.) photography.
• The total length and percentage of the relevant intersections logged.
the excavations and distances between test pits and monitoring pits.
• All geological samples collected during all forms of drilling are qualitatively logged by a qualified geologist at 1m intervals, to gain an understanding of the variability in aquifer materials hosting the brine.
• Geological logging and other hydrogeological parameter data is recorded within a database.
• Drilling lithological samples are washed and stored in chip trays for future reference.
Subsampling techniques and sample preparation
• If core, whether cut or sawn and whether quarter, half or all core taken.
• If non-core, whether riffled, tube sampled, rotary split, etc and whether sampled wet or dry.
• For all sample types, the nature, quality and appropriateness of the sample preparation technique.
• Quality control procedures adopted for all sub-sampling stages to maximise representivity of samples.
• Measures taken to ensure that the sampling is representative of the in situ material collected, including for instance results for field duplicate/ second-half sampling.
• Whether sample sizes are appropriate to the grain size of the material being sampled.
• During test pumping, brine samples were collected at the start and end of pumping as a minium at all test pits. Trial trenches were sampled daily for field parameters (pH, Salinity, and SG) and approximately every second day for laboratory submitted samples. Bulk samples were obtained for process test work.
• Core samples from the hollow auger drilling were collected at various intervals using Lexan tubes.
• All samples have been stored in core trays and secured for transport back to Perth.
• Core plugs have been taken by cutting the lexan tubes and taking a vertical plug through the centre of the core. All samples were frozen in dry ice prior to trimming and then length and diameter were measured to calculate bulk volume. All samples were kept frozen in dry ice prior then mounted in Nickel sleeving with screens at each end to prevent material loss.
Quality of assay data and laboratory tests
• The nature, quality and appropriateness of the assaying and laboratory procedures used and whether the technique is considered partial or total.
• For geophysical tools, spectrometers, handheld XRF instruments, etc, the parameters used in determining the analysis including instrument make and model, reading times, calibrations factors applied and their derivation, etc.
• Nature of quality control procedures adopted (e.g. standards, blanks, duplicates, external laboratory checks) and whether acceptable levels of accuracy (i.e. lack of bias) and precision have been established.
• All samples are being submitted to Bureau Veritas Pty Ltd in Perth for analysis.
• Brine samples (250ml bottles) have been submitted for determination of Ca, Mg, K and S (as SO4) via ICP-AES analysis.
• Other parameters including TDS (Gravimetric), pH, chloride and SG will also be determined.
• Selected samples have also been submitted for a comprehensive multi-element suite via ICP-MS determination.
• Field duplicates have been collected and lab repeats completed at a rate of 1 in 10 samples for QA/QC purposes.
• All QA/QC stats are within acceptable limits for an Inferred and Indicated Resource.
Verification of sampling and assaying
• The verification of significant intersections by either independent or alternative company personnel.
• The use of twinned holes.
• Documentation of primary data, data entry procedures, data verification, data storage (physical and electronic) protocols.
• Discuss any adjustment to assay data.
• Duplicates and lab repeates have been reviewed and all primary samples remain unchanged.
• All sample and field measurements have been kept in a database.
Location of data points
• Accuracy and quality of surveys used to locate drill holes (collar and down-hole surveys),
• Hole location coordinates obtained by handheld GPS.

Lake Throssell Potash Project Lake Throssell Sept 2021 Resource Estimate Reported in Accordance with JORC Code 2012
56
Section 1: Sampling Techniques and Data
Criteria JORC Code explanation Commentary
trenches, mine workings and other locations used in Mineral Resource estimation.
• Specification of the grid system used.
• Quality and adequacy of topographic control.
• The grid system used was MGA94, Zone 51.
Data spacing and distribution
• Data spacing for reporting of Exploration Results.
• Whether the data spacing and distribution is sufficient to establish the degree of geological and grade continuity appropriate for the Mineral Resource and Ore Reserve estimation procedure(s) and classifications applied.
• Whether sample compositing has been applied.
• Drilling to date in the surface sediments has resulted in and average drill spacing of approximately 2.1km, with a maximum separation of approximately 3.5km.
• Within the confining layer and deeper basal aquifer drilling to date drilling has resulted in nominal drill hole spacing of between 300-500m along drill transects and between 3-5km along strike.
• Data gathered and drill spacing is sufficent for the Mieral Resource. No Ore Reserves have been estimated.
Orientation of data in relation to geological structure
• Whether the orientation of sampling achieves unbiased sampling of possible structures and the extent to which this is known, considering the deposit type.
• If the relationship between the drilling orientation and the orientation of key mineralised structures is considered to have introduced a sampling bias, this should be assessed and reported if material.
• Not applicable, considering the deposit type.
• All drill holes are vertical.
• Trench excavations have provided the best possible mode of logging the lake surface sediments. Pumping data gathered has demonstrated that the bulk aquifer properties of the sequence can yield brine.
Sample security
• The measures taken to ensure sample security. • Samples collected during the work programs were delivered directly from site to the laboratory by field personnel.
Audits or reviews
• The results of any audits or reviews of sampling techniques and data.
• None.
Section 2: Reporting of Exploration Results
Criteria JORC Code explanation Commentary
Mineral tenement and land tenure status
• Type, reference name/number, location and ownership including agreements or material issues with third parties such as joint ventures, partnerships, overriding royalties, native title interests, historical sites, wilderness or national park and environmental settings.
• The security of the tenure held at the time of reporting along with any known impediments to obtaining a licence to operate in the area.
• EL38/3065 is 100% owned by Trigg Mining’s 100% owned subsidiary K2O Minerals Pty Ltd.
• E38/3544, E38/3483, E38/3458 and E38/3537 have been applied for by K2O Minerals Pty Ltd, a 100% owned subsidiary of Trigg Mining Limited., and are pending.
• Trigg Mining has an Exploration Access Agreement with the Ngaanyatjarra, traditional owners of the Lake Throssell area.
Exploration done by other parties
• Acknowledgment and appraisal of exploration by other parties.
• No previous drilling has been completed on Lake Throssell.
Geology • Deposit type, geological setting and style of mineralisation.
• Shallow unconfined surficial lake playa and deep confined palaeo-drainage system as discussed in the report.
• The deposit is a brine containing potassium and sulphate ions that could form a potassium sulphate salt. The brine is contained within saturated sediments.
Drill hole Information
• A summary of all information material to the understanding of the exploration results including a tabulation of the following information for all Material drill holes:
• easting and northing of the drill hole collar;
• Information has been included in Appendix 1 and within this Mineral Resource Report.
• All holes are vertical.

Lake Throssell Potash Project Lake Throssell Sept 2021 Resource Estimate Reported in Accordance with JORC Code 2012
57
Section 2: Reporting of Exploration Results
Criteria JORC Code explanation Commentary
• elevation or RL (Reduced Level – elevation above sea level in metres) of the drill hole collar;
• dip and azimuth of the hole;
• downhole length and interception depth; and
• hole length. If the exclusion of this information is justified on the basis that the information is not Material and this exclusion does not detract from the understanding of the report, the Competent Person should clearly explain why this is the case.
Data aggregation methods
• In reporting Exploration Results, weighting averaging techniques, maximum and/or minimum grade truncations (e.g. cutting of high grades) and cut-off grades are usually Material and should be stated.
• Where aggregate intercepts incorporate short lengths of high-grade results and longer lengths of low-grade results, the procedure used for such aggregation should be stated and some typical examples of such aggregations should be shown in detail.
• The assumptions used for any reporting of metal equivalent values should be clearly stated.
• Weighted averages have been derived for the Sy of the test pumping results. These are weighted by the area of the sampled material (m2). The data exhibits high heterogeneity therefore the lowest and highest samples have been discounted from the calculation.
• All brine sample intervals are stated in the brine tables.
• No cut offs have been applied.
• The potassium to K2SO4 (SOP) conversion is 2.23 as described in the report. This value has been rounded to decimal points.
Relationship between mineralisation widths and intercept lengths
• These relationships are particularly important in the reporting of Exploration Results.
• If the geometry of the mineralisation with respect to the drill hole angle is known, its nature should be reported.
• If it is not known and only the down hole lengths are reported, there should be a clear statement to this effect (e.g. ‘downhole length, true width not known’).
• The mineralisation appears to be continuous in the vicinity of the lake. Grade change laterally away from the lake has not been confirmed by drilling.
Diagrams • Appropriate maps and sections (with scales) and tabulations of intercepts should be included for any significant discovery being reported. These should include, but not be limited to a plan view of drill hole collar locations and appropriate sectional views.
• Refer to figures/tables in this announcement.
Balanced reporting • Where comprehensive reporting of all Exploration Results is not practicable, representative reporting of both low and high grades and/or widths should be practiced to avoid misleading reporting of Exploration Results.
• All pertinent results have been reported.
Other substantive exploration data
• Other exploration data, if meaningful and material, should be reported including (but not limited to): geological observations; geophysical survey results; geochemical survey results; bulk samples – size and method of treatment; metallurgical test results; bulk density, groundwater, geotechnical and rock characteristics; potential deleterious or contaminating substances.
• All meaningful and pertinent exploration results are presented in the report.
• Bulk brine samples have been collected to commence preliminary brine and evaporation salt analysis.

Lake Throssell Potash Project Lake Throssell Sept 2021 Resource Estimate Reported in Accordance with JORC Code 2012
58
Section 2: Reporting of Exploration Results
Criteria JORC Code explanation Commentary
Further work • The nature and scale of planned further work (e.g. tests for lateral extensions or depth extensions or large-scale step-out drilling).
• Diagrams clearly highlighting the areas of possible extensions, including the main geological interpretations and future drilling areas, provided this information is not commercially sensitive.
• Infill air-core drilling at sites identified by the geophysical surveys.
• Installation of test production bores and hydraulic testing of the aquifer to determine aquifer properties, brine grade and allow estimates of sustainable pumping rates.
• Groundwater modelling and recharge studies.
• Additional exploration on tenements as they become granted.
Section 3: Estimation of Mineral Resources
Criteria JORC Code explanation Commentary
Database integrity • Measures taken to ensure that data has not been corrupted by, for example, transcription or keying errors, between its initial collection and its use for Mineral Resource estimation purposes.
• Data validation procedures used.
• Cross-check of laboratory assay reports and the resource database.
• Review of sample histograms used in Resource models.
• QA/QC analysis using Ionic balance and relative percent differences using duplicate samples and lab repeats.
Site visits • Comment on any site visits undertaken by the Competent Person and the outcome of those visits.
• If no site visits have been undertaken indicate why this is the case.
• No site visits have been completed as wet weather prohibited the planned site visit in December 2020.
Geological interpretation
• Confidence in (or conversely, the uncertainty of) the geological interpretation of the mineral deposit.
• Nature of the data used and of any assumptions made.
• The effect, if any, of alternative interpretations on Mineral Resource estimation.
• The use of geology in guiding and controlling Mineral Resource estimation.
• The factors affecting continuity both of grade and geology.
• The resource is contained within brine hosted in Cenozoic Palaeovalley stratigraphy and the underlying weathered Permian bedrock.
• The geological model is considered adequately constrained for an Inferred and Indicated Resource. Drilling transects have confirmed a geological sequence based on well understood stratigraphic depositional processes. The deposit is not structurally complex; it is alluvial fill in a palaeovalley depo-centre, within a sedimentary trough. Weathering profiles within the Permian sediments have complicated the geological model.
• The geological model for the lake surface sediments is shown to be highly heterogeneous, therefore using a statistical method of determining a bulk Sy has been applied. This heterogeneity does not appear to have much effect on brine grades.
• The geological model for the saprolite of the weathered Permian is less certain. The Paterson Formation contains thick unconsolidated sand and gravel sequences derived from weathered sandstone and conglomerate within the Paterson Formation. The continuity and controls on these lenses are not well mapped but has been encountered in a number of the deeper exploration holes.

Lake Throssell Potash Project Lake Throssell Sept 2021 Resource Estimate Reported in Accordance with JORC Code 2012
59
Section 3: Estimation of Mineral Resources
Criteria JORC Code explanation Commentary
• The geological interpretation informs the volume of the resource host.
• Grade variability appears to be largely controlled by recharge runoff and windblown accumulation of surface water at the surface. As well as buffering at depth by vertical recharge around the palaeovalley from outcrop.
Dimensions • The extent and variability of the Mineral Resource expressed as length (along strike or otherwise), plan width, and depth below surface to the upper and lower limits of the Mineral Resource.
• The Mineral Resource extends approximately 50 km along the strike of the lake surface and palaeovalley. The depth of the model is constrained by the depth of investigation and the search parameters used.
• The thickness of the aquifer hosting the brine Mineral Resource has been based on the groundwater elevation (measured as depth below surface) and a sediment thickness above the impermeable bedrock or depth of investigation when open at depth.
• The volume of brine that can be abstracted has been based the adopted specific yields of each lithological category. The specific yields are determined from a combination of test pumping, laboratory PSD analysis, core analysis and comparisons with publicly available data from equivalent geological settings as described in the report.
Estimation and modelling techniques
• The nature and appropriateness of the estimation technique(s) applied and key assumptions, including treatment of extreme grade values, domaining, interpolation parameters and maximum distance of extrapolation from data points. If a computer assisted estimation method was chosen include a description of computer software and parameters used.
• The availability of check estimates, previous estimates and/or mine production records and whether the Mineral Resource estimate takes appropriate account of such data.
• The assumptions made regarding recovery of by- products.
• Estimation of deleterious elements or other non-grade variables of economic significance (e.g. sulphur for acid mine drainage characterisation).
• In the case of block model interpolation, the block size in relation to the average sample spacing and the search employed.
• Any assumptions behind modelling of selective mining units.
• Any assumptions about correlation between variables.
• Description of how the geological interpretation was used to control the resource estimates.
• Discussion of basis for using or not using
• Modelling procedures and parameters are discussed in the Mineral Resource Estimate Report. Additional details are presented below were relevant.
• The Resource zone is constrained by the tenement boundaries, island perimeters of the lake surface, search parameters and sampling intervals.
• The block model cell sizes took into account the density of the sample spacing within the Resource. The block spacing of the z direction considered the vertical variability of the brine within lithologies, increases and decreases in grade with depth are observed across lithologies therefore higher resolution z component (10m) was selected to allow for pinching geology, to enable this trend in grade variability to be reasonably represented.
• The average sample spacing at shallow depths inclusive of test pits and auger holes is approximately 2.1km. At depths greater than 6m the average sample spacing is less than 3.5km, between transects and less than 1km along transects.
• Selective mining units have not been considered.
• There are no assumptions about correlation between variables.
• No cut-off grade has been used.

Lake Throssell Potash Project Lake Throssell Sept 2021 Resource Estimate Reported in Accordance with JORC Code 2012
60
Section 3: Estimation of Mineral Resources
Criteria JORC Code explanation Commentary
grade cutting or capping.
• The process of validation, the checking process used, the comparison of model data to drill hole data, and use of reconciliation data if available.
Moisture • Whether the tonnages are estimated on a dry basis or with natural moisture, and the method of determination of the moisture content.
• Tonnages of potassium have been estimated on a dry, weight volume basis (%w/v). For example, 10 kg SOP per cubic metre of brine.
Cut-off parameters
• The basis of the adopted cut-off grade(s) or quality parameters applied.
• No grade cut-off parameters have been used.
Mining factors or assumptions
• Assumptions made regarding possible mining methods, minimum mining dimensions and internal (or, if applicable, external) mining dilution. It is always necessary as part of the process of determining reasonable prospects for eventual economic extraction to consider potential mining methods, but the assumptions made regarding mining methods and parameters when estimating Mineral Resources may not always be rigorous. Where this is the case, this should be reported with an explanation of the basis of the mining assumptions made.
• The mining method is likely to be via pumping of brine from the aquifers by submersible bore pumps targeting the basal aquifers and shallow trenches targeting the surficial aquifer.
• Abstracted brine will be concentrated, crystallised and purified to produce a product which will have additional recovery factors.
• Though specific yield and total porosity provide a measure of the volume of brine present in an aquifer system hydraulic conductivity, transmissivity and confined storage controls are the main factor in defining mining factors and are addressed during Ore Reserve estimating.
• It is not possible to extract all the drainable porosity contained brine with these methods, due to the natural physical dynamics of abstraction from an aquifer.
• Ore Reserves are required to quantify the economically extractable portion of the Mineral Resources.
Metallurgical factors or assumptions
• The basis for assumptions or predictions regarding metallurgical amenability. It is always necessary as part of the process of determining reasonable prospects for eventual economic extraction to consider potential metallurgical methods, but the assumptions regarding metallurgical treatment processes and parameters made when reporting Mineral Resources may not always be rigorous. Where this is the case, this should be reported with an explanation of the basis of the metallurgical assumptions made.
• Initial test work has been completed using brine from Lake Throssell at Nagrom, Western Australia, to determine the salting path of brine to kainite type mixed salt (KTMS).
• Limited downstream metallurgical test work has been completed on the brine to confirm plant design criteria.
• Hatch Engineering was engaged by Trigg Mining and industry accepted criteria from similar SOP Projects was used to derive the process design used in the Scoping Study.
• Comparisons with peer group brine studies suggest that a SOP product can be obtained from the average composition of the Lake Throssell brine. However further evaporation tests and simulations are ongoing.
• An overall metallurgical recovery of 82% has been used from initial abstraction of brine through to final SOP product.

Lake Throssell Potash Project Lake Throssell Sept 2021 Resource Estimate Reported in Accordance with JORC Code 2012
61
Section 3: Estimation of Mineral Resources
Criteria JORC Code explanation Commentary
Environmental factors or assumptions
• Assumptions made regarding possible waste and process residue disposal options. It is always necessary as part of the process of determining reasonable prospects for eventual economic extraction to consider the potential environmental impacts of the mining and processing operation. While at this stage the determination of potential environmental impacts, particularly for a greenfields project, may not always be well advanced, the status of early consideration of these potential environmental impacts should be reported. Where these aspects have not been considered this should be reported with an explanation of the environmental assumptions made.
• In this early stage of the project it is not possible to quantify environmental impacts. The project is assumed to have a limited, localized environmental impact, associated with minor impacts on surface disturbance associated with excavation of trenches, water quality changes of adjacent ”fresher” aquifer systems, stock piling of salt by- products and potentially groundwater dependent vegetation.
• The degree of abstraction from the trench network may be limited by drawdown constraints on the islands, which will be the subject to future impact assessments.
Bulk density • Whether assumed or determined. If assumed, the basis for the assumptions. If determined, the method used, whether wet or dry, the frequency of the measurements, the nature, size and representativeness of the samples.
• The bulk density for bulk material must have been measured by methods that adequately account for void spaces (vugs, porosity, etc), moisture and differences between rock and alteration zones within the deposit.
• Discuss assumptions for bulk density estimates used in the evaluation process of the different materials.
• Tonnages of potassium have been estimated on a dry, weight volume basis (%w/v). For example, 10kg SOP per cubic metre of brine.
• As the resource is a brine, bulk density is not applicable.
• The resource has been calculated using specific yield (drainable porosity) determined using a combination of test pumping analysis, PSD analysis, core analysis and comparisons to publicly available data.
Classification • The basis for the classification of the Mineral Resources into varying confidence categories.
• Whether appropriate account has been taken of all relevant factors (i.e. relative confidence in tonnage/grade estimations, reliability of input data, confidence in continuity of geology and metal values, quality, quantity and distribution of the data).
• Whether the result appropriately reflects the Competent Person’s view of the deposit.
• At this stage of the project Indicated and Inferred Mineral Resources are defined. The methodology for defined each category is presented in the report.
• The JORC (2012) Code including the Association of Mining and Exploration Companies (AMEC) Brine Guideline were used to determine the confidence category.
Audits or reviews • The results of any audits or reviews of Mineral Resource estimates.
• none
Discussion of relative accuracy/ confidence
• Where appropriate a statement of the relative accuracy and confidence level in the Mineral Resource estimate using an approach or procedure deemed appropriate by the Competent Person. For example, the application of statistical or geostatistical procedures to quantify the relative accuracy of the resource within stated confidence limits, or, if such an approach is not deemed appropriate, a qualitative discussion of the factors that could affect the relative accuracy and confidence of the estimate.
• The statement should specify whether it relates to global or local estimates, and, if local, state the relevant tonnages, which
• The Mineral Resource contains aqueous potassium, sulphate and other ions, existing as a brine in a sub-surface aquifer. The JORC code deals predominantly with solid minerals and does not deal with liquid solutions as a resource. The relative accuracy of the stated resource considers the geological and hydrogeological uncertainties of dealing with a brine. Rounding has occurred to represent the degree of accuracy implied.
• The Association of Mining and Exploration Companies (AMEC) has developed guidelines to define a brine Mineral Resource and Ore Reserve. The brine

Lake Throssell Potash Project Lake Throssell Sept 2021 Resource Estimate Reported in Accordance with JORC Code 2012
62
Section 3: Estimation of Mineral Resources
Criteria JORC Code explanation Commentary
should be relevant to technical and economic evaluation. Documentation should include assumptions made and the procedures used.
• These statements of relative accuracy and confidence of the estimate should be compared with production data, where available.
specific guidance to interpretation of the JORC Code was published by AMEC and accepted by JORC in April 2019. These guidelines are adhered to in this Resource Estimate.
• Specific yield estimates are used to determine drainable brine volume across all domains. In a brine resource this is considered to be the most relevant measure of brine abstraction under reasonable prospects for eventual economic extraction. Given the confine the nature of the basal aquifer a proportion of the resource is not determined due to overburden pressure and compressibility of the brine and aquifer material.
• The basal aquifer has Indicated Resources where no test pumping has been completed. The conversion from Inferred Resources is considered reasonable due to the magnitude of the brine available within the basal aquifer and high prospectivity of abstraction determined from groundwater flow modelling using reasonable aquifer properties.