Embed Size (px)
Citation preview

LAGUARDIA COMMUNITY COLLEGE
Institutional Profile 2021
Division of Academic AffairsOffice of Institutional Research & Assessment
LaGuardia Community College The City University of New York
2021 Institutional Profile
Office of Institutional Research & Assessment Division of Academic Affairs
August 2021
iii
LaGuardia Community College
The City University of New York
Division of Academic Affairs Paul Arcario, Provost/Senior Vice President
Office of Institutional Research & Assessment
Nava Lerer Dean for Institutional Effectiveness
Jeffrey Weintraub Associate Director
Emad Nassar
Senior Institutional Researcher
Jenny Zhu Institutional Research Manager
Veron Sundar Office Assistant
Room M-418 Telephone 718-482-6130 Fax 718-482-5443
iv
Contents Acknowledgments............................................................................................................................................... vii Five Years At A Glance.................................................................................................................................. viii The Student Body Profile Borough of Residence................................................................................................................................. 1 Countries of Origin...................................................................................................................................... 2 Age.................................................................................................................................................................... 3 Gender.............................................................................................................................................................. 4 Ethnic Background....................................................................................................................................... 5 Financial Resources..................................................................................................................................... 6
Enrollment Profile Credit Students.............................................................................................................................................. 7 Degree Type................................................................................................................................................... 8 Major................................................................................................................................................................ 9 Full-Time and Part-Time Status............................................................................................................... 11 Full Time Equivalents................................................................................................................................. 12 Day and Evening........................................................................................................................................... 13 Sessions............................................................................................................................................................ 14 Class Size........................................................................................................................................................ 15
Profile of Entering Students New Students Admission and Enrollment.............................................................................................16 First Time, Transfer, and Non-Degree Status...................................................................................... 17 Degree Type................................................................................................................................................... 18 Major................................................................................................................................................................ 19 Entering Academic Credential.................................................................................................................. 21 High School Averages................................................................................................................................. 22 Sending High Schools................................................................................................................................. 23 Previous Colleges......................................................................................................................................... 24 Basic Skills Needs........................................................................................................................................ 25 CUNY Start, Math Start and CLIP…….….......................................................................................... 26 Measures of Success
Degrees Awarded Degrees Awarded and by Gender................................................................................................... 27 Degree Type.......................................................................................................................................... 28 Major....................................................................................................................................................... 29 Race and Ethnic Origin......................................................................................................................31 Graduate Information Entering Basic Skills Status............................................................................................................. 32 Time to Degree.................................................................................................................................... 33 Ten-Year Graduation Rates............................................................................................................. 34 Eight-Year Graduation, Retention, and Early Transfer Rates All New Full-time.................................................................................................................... 35
v
Contents All New Part-time................................................................................................................... 36 First-time Full-time................................................................................................................. 37 First-time Part-time................................................................................................................. 38 Transfer Full-time.................................................................................................................... 39 Transfer Part-time.................................................................................................................... 40 Six-Year Graduation Rates by Entering Major......................................................................... 41 GPAs of Graduates and Baccalaureate Transfer Rates.............................................................. 45 Five-Year Trend of One-Year Transfer Rate............................................................................. 46 Destinations of Graduates Who Transfer.................................................................................... 46 Employment Status............................................................................................................................ 47 Post-Graduation Employment Satisfaction and Salary........................................................... 48 National Council Licensure Examination (NCLEX)..................................................................... 49 National Certification Examination...................................................................................................... 50 Adult and Continuing Education Annual Registration and Enrollment by Programs............................................................................. 51 Age.................................................................................................................................................................... 52 Race and Ethnic Origin............................................................................................................................... 53 Borough and Gender.................................................................................................................................... 54 Institutional Resources
Faculty and Staff Employee Headcounts by Business Entities............................................................................... 55 Tax Levy Employees by Job Category and Gender................................................................. 56 Full Time Tax Levy Employees Age Ranges............................................................................................................................... 57 Years in Current Title............................................................................................................ 58 Highest Degree Earned.......................................................................................................... 59 Gender and Ethnic Origin .................................................................................................... 60 Full Time Faculty by Rank, Gender and Tenure Status.......................................................... 61 The Library Library Operations.............................................................................................................................. 62 Finances Current Funds Revenues................................................................................................................... 64 Current Funds Expenditures............................................................................................................ 65 Grant Awards Source..................................................................................................................................................... 66 Divisional Distribution...................................................................................................................... 67 Space Daily Class Enrollment by Period................................................................................................. 68 Building Age and Function.............................................................................................................. 69
vi
August 2021 The office of Institutional Research & Assessment is pleased to present the 2020 Institutional Profile. We hope the information it contains will be useful to the college’s faculty, staff, administrators, present and potential students, our alumni, our public representatives, and the wider local community. In order to accommodate such a broad range of interests, we have provided descriptions of many of the college’s aspects. Beginning with Five Years at a Glance, the Profile outlines major trends and statistics. Nevertheless, the Profile’s principal subject continues to be the detailed characteristics, enrollment patterns, and performance outcomes of LaGuardia students. Throughout the sections of tables and charts, five-year trends are shown wherever possible, along with brief analytical remarks. This issue is also available online: https://www.laguardia.edu/ir/ along with available institutional effectiveness information, research reports and further outcomes data. We welcome your comments, as well as suggestions about how future issues may serve your interests more meaningfully. Nava Lerer
Dean for Institutional Effectiveness
vii
Acknowledgments Many people at LaGuardia have collaborated to produce this issue of the Institutional Profile. Emad Nassar coordinated the project and led the compilation and formatting of most of the data presented, with the assistance of Chunjuan (Jenny) Zhu, Veron Sundar, and Jeffrey Weintraub. People from departments throughout the college contributed by providing data or text, submitting parts of their own reports, or helping us meet important deadlines. In particular, we wish to thank John Lagamjis and Kamala Ramsaroop for the information on Adult and Continuing Education; Steven Ovadia for data regarding the Library; Nancy Palma for figures concerning college revenues and expenditures; Gail Baksh-Jarrett and Pierre Jean for student financial aid information, Laura Bartovics for grants information; Cristina Natale for personnel data; and Ruben Mercier for reporting detailed facts on institutional space. We also wish to thank Cindy Busch and Edward Hollins from the Department of Marketing and Communications for the cover design. The contributions and cooperation of all are gratefully acknowledged.
LaGuardiaCommunity College
Five Years At A Glance…2016 2020
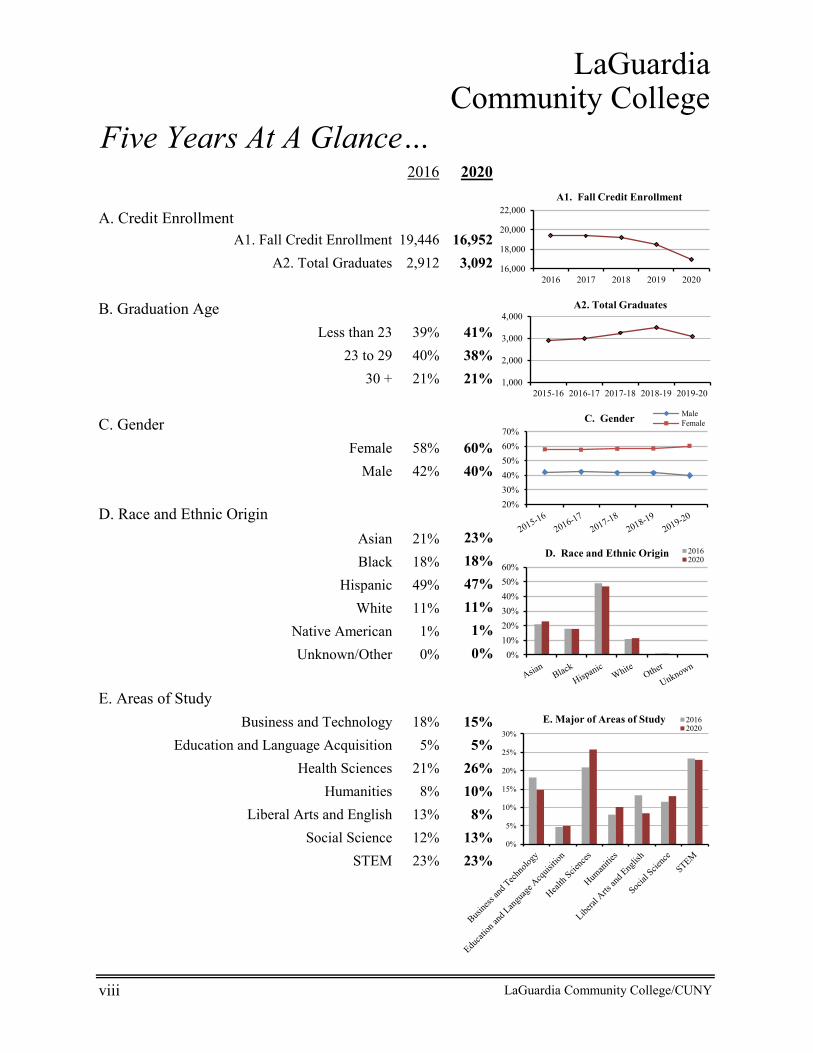
A. Credit EnrollmentA1. Fall Credit Enrollment 19,446 16,952
A2. Total Graduates 2,912 3,092
B. Graduation AgeLess than 23 39% 41%
23 to 29 40% 38%30 + 21% 21%
C. GenderFemale 58% 60%
Male 42% 40%
D. Race and Ethnic OriginAsian 21% 23%Black 18% 18%
Hispanic 49% 47%White 11% 11%
Native American 1% 1%Unknown/Other 0% 0%
E. Areas of StudyBusiness and Technology 18% 15%
Education and Language Acquisition 5% 5%Health Sciences 21% 26%
Humanities 8% 10%Liberal Arts and English 13% 8%
Social Science 12% 13%STEM 23% 23%
viii LaGuardia Community College/CUNY
16,000
18,000
20,000
22,000
2016 2017 2018 2019 2020
A1. Fall Credit Enrollment
0%10%20%30%40%50%60%
D. Race and Ethnic Origin 20162020
0%
5%
10%
15%
20%
25%
30%
20162020
E. Major of Areas of Study
1,000
2,000
3,000
4,000
2015-16 2016-17 2017-18 2018-19 2019-20
A2. Total Graduates
20%30%40%50%60%70%
C. Gender MaleFemale
LaGuardiaCommunity College
Five Years At A Glance…2016 2020
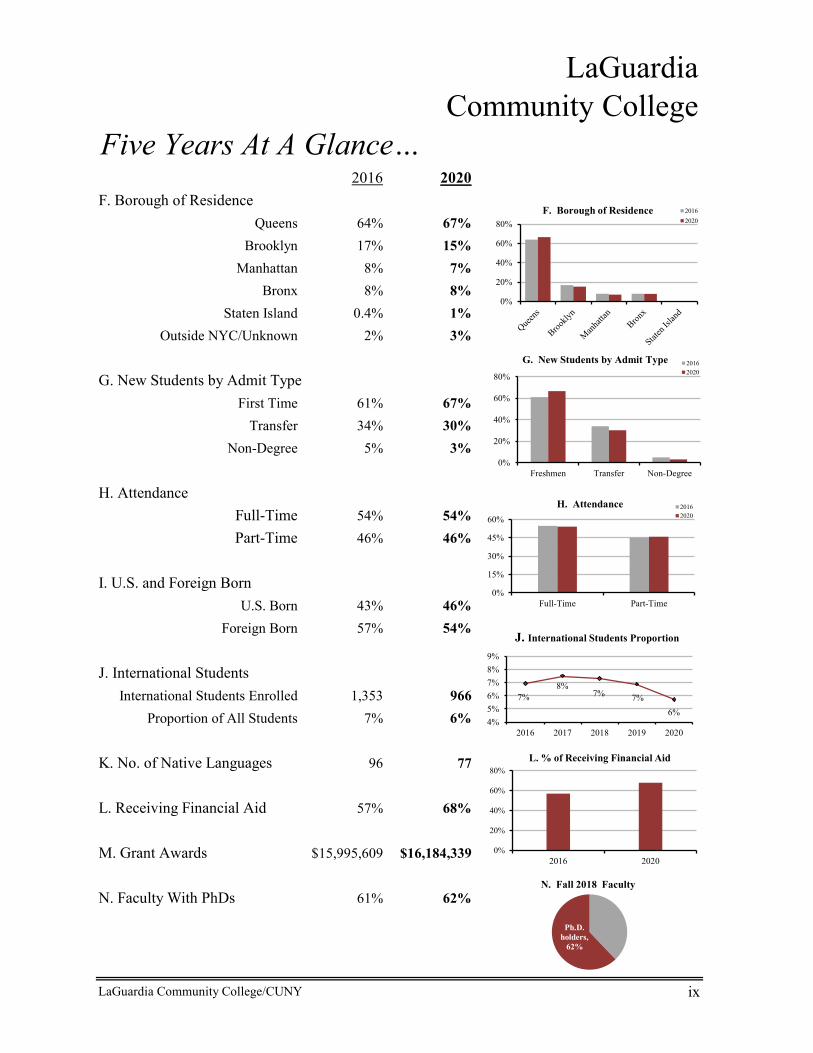
F. Borough of ResidenceQueens 64% 67%
Brooklyn 17% 15%Manhattan 8% 7%
Bronx 8% 8%Staten Island 0.4% 1%
Outside NYC/Unknown 2% 3%
G. New Students by Admit TypeFirst Time 61% 67%
Transfer 34% 30%Non-Degree 5% 3%
H. AttendanceFull-Time 54% 54%Part-Time 46% 46%
I. U.S. and Foreign BornU.S. Born 43% 46%
Foreign Born 57% 54%
J. International StudentsInternational Students Enrolled 1,353 966
Proportion of All Students 7% 6%
K. No. of Native Languages 96 77
L. Receiving Financial Aid 57% 68%
M. Grant Awards $15,995,609 $16,184,339
N. Faculty With PhDs 61% 62%
LaGuardia Community College/CUNY ix
Ph.D. holders,
62%
N. Fall 2018 Faculty
0%
20%
40%
60%
80%F. Borough of Residence 2016
2020
0%
20%
40%
60%
80%
Freshmen Transfer Non-Degree
G. New Students by Admit Type 20162020
0%
20%
40%
60%
80%
2016 2020
L. % of Receiving Financial Aid
0%
15%
30%
45%
60%
Full-Time Part-Time
H. Attendance 20162020
7%8%
7% 7%6%
4%5%6%7%8%9%
2016 2017 2018 2019 2020
J. International Students Proportion
The Student BodyProfile
Fall 2020
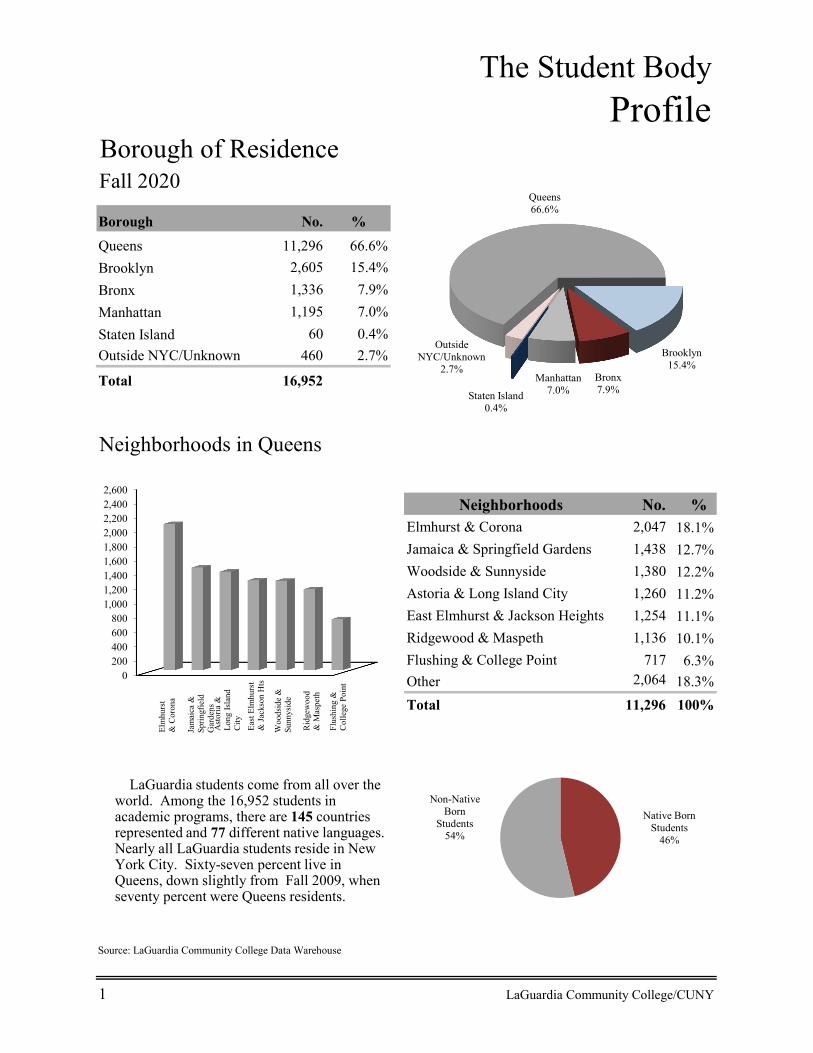
Borough No. %Queens 11,296 66.6%Brooklyn 2,605 15.4%Bronx 1,336 7.9%Manhattan 1,195 7.0%Staten Island 60 0.4%Outside NYC/Unknown 460 2.7%
Total 16,952
Neighborhoods No. %Elmhurst & Corona 2,047 18.1%Jamaica & Springfield Gardens 1,438 12.7%Woodside & Sunnyside 1,380 12.2%
Astoria & Long Island City 1,260 11.2%East Elmhurst & Jackson Heights 1,254 11.1%Ridgewood & Maspeth 1,136 10.1%Flushing & College Point 717 6.3%Other 2,064 18.3%Total 11,296 100%
Source: LaGuardia Community College Data Warehouse
1 LaGuardia Community College/CUNY
Borough of Residence
Neighborhoods in Queens
Queens66.6%
Brooklyn15.4%
Bronx7.9%
Manhattan7.0%Staten Island
0.4%
Outside NYC/Unknown
2.7%
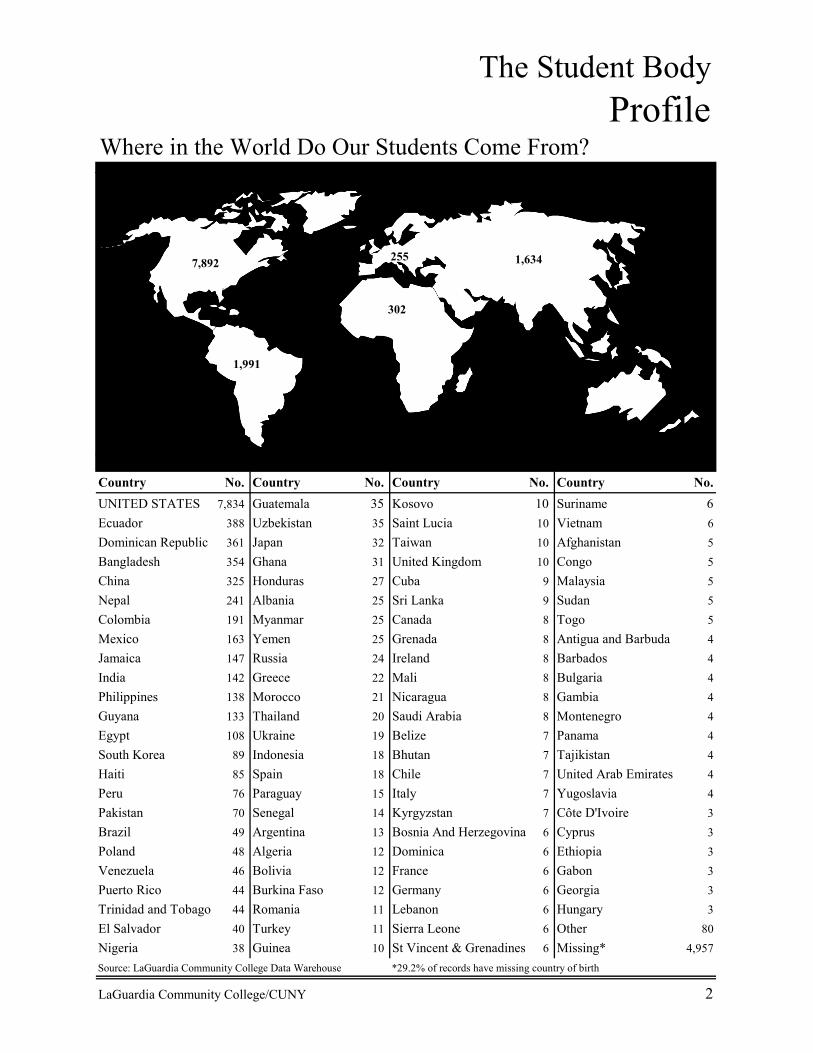
LaGuardia students come from all over the world. Among the 16,952 students in academic programs, there are 145 countries represented and 77 different native languages. Nearly all LaGuardia students reside in New York City. Sixty-seven percent live in Queens, down slightly from Fall 2009, when seventy percent were Queens residents.
Native Born Students
46%
Non-Native Born
Students54%
0200400600800
1,0001,2001,4001,6001,8002,0002,2002,4002,600
Elm
hurs
t &
Cor
ona
Jam
aica
&
Sprin
gfie
ld
Gar
dens
Ast
oria
&
Long
Isla
ndC
ity
Woo
dsid
e &
Su
nnys
ide
Rid
gew
ood
& M
aspe
th
East
Elm
hurs
t &
Jac
kson
Hts
Flus
hing
&
Col
lege
Poi
nt
The Student BodyProfile
Country No. Country No. Country No. Country No.UNITED STATES 7,834 Guatemala 35 Kosovo 10 Suriname 6Ecuador 388 Uzbekistan 35 Saint Lucia 10 Vietnam 6Dominican Republic 361 Japan 32 Taiwan 10 Afghanistan 5Bangladesh 354 Ghana 31 United Kingdom 10 Congo 5China 325 Honduras 27 Cuba 9 Malaysia 5Nepal 241 Albania 25 Sri Lanka 9 Sudan 5Colombia 191 Myanmar 25 Canada 8 Togo 5Mexico 163 Yemen 25 Grenada 8 Antigua and Barbuda 4Jamaica 147 Russia 24 Ireland 8 Barbados 4India 142 Greece 22 Mali 8 Bulgaria 4Philippines 138 Morocco 21 Nicaragua 8 Gambia 4Guyana 133 Thailand 20 Saudi Arabia 8 Montenegro 4Egypt 108 Ukraine 19 Belize 7 Panama 4South Korea 89 Indonesia 18 Bhutan 7 Tajikistan 4Haiti 85 Spain 18 Chile 7 United Arab Emirates 4Peru 76 Paraguay 15 Italy 7 Yugoslavia 4Pakistan 70 Senegal 14 Kyrgyzstan 7 Côte D'Ivoire 3Brazil 49 Argentina 13 Bosnia And Herzegovina 6 Cyprus 3Poland 48 Algeria 12 Dominica 6 Ethiopia 3Venezuela 46 Bolivia 12 France 6 Gabon 3Puerto Rico 44 Burkina Faso 12 Germany 6 Georgia 3Trinidad and Tobago 44 Romania 11 Lebanon 6 Hungary 3El Salvador 40 Turkey 11 Sierra Leone 6 Other 80Nigeria 38 Guinea 10 St Vincent & Grenadines 6 Missing* 4,957Source: LaGuardia Community College Data Warehouse *29.2% of records have missing country of birth
LaGuardia Community College/CUNY 2
Where in the World Do Our Students Come From?
7,892 1,634 255
302
1,991
The Student BodyProfile
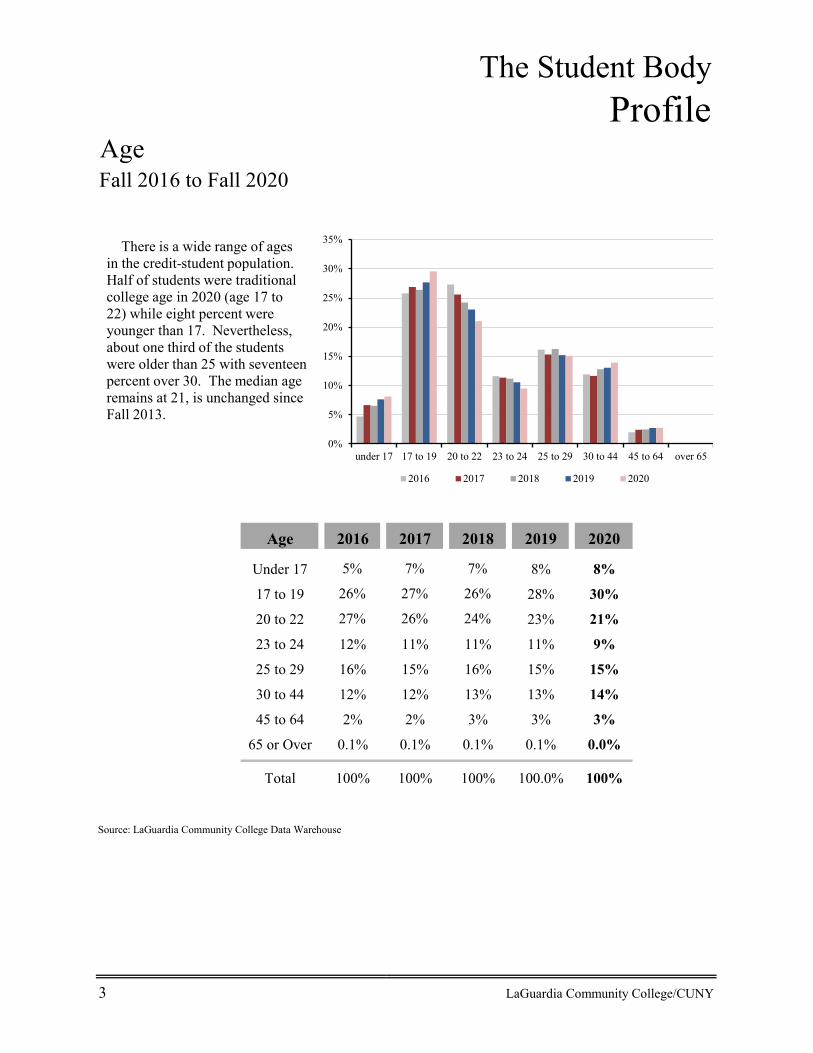
Age Fall 2016 to Fall 2020
Age 2016 2017 2018 2019 2020
Under 17 5% 7% 7% 8% 8%
17 to 19 26% 27% 26% 28% 30%
20 to 22 27% 26% 24% 23% 21%
23 to 24 12% 11% 11% 11% 9%
25 to 29 16% 15% 16% 15% 15%
30 to 44 12% 12% 13% 13% 14%
45 to 64 2% 2% 3% 3% 3%
65 or Over 0.1% 0.1% 0.1% 0.1% 0.0%
Total 100% 100% 100% 100.0% 100%
Source: LaGuardia Community College Data Warehouse
3 LaGuardia Community College/CUNY
There is a wide range of ages in the credit-student population. Half of students were traditional college age in 2020 (age 17 to 22) while eight percent were younger than 17. Nevertheless, about one third of the students were older than 25 with seventeen percent over 30. The median age remains at 21, is unchanged since Fall 2013.
0%
5%
10%
15%
20%
25%
30%
35%
under 17 17 to 19 20 to 22 23 to 24 25 to 29 30 to 44 45 to 64 over 65
2016 2017 2018 2019 2020
The Student BodyProfile
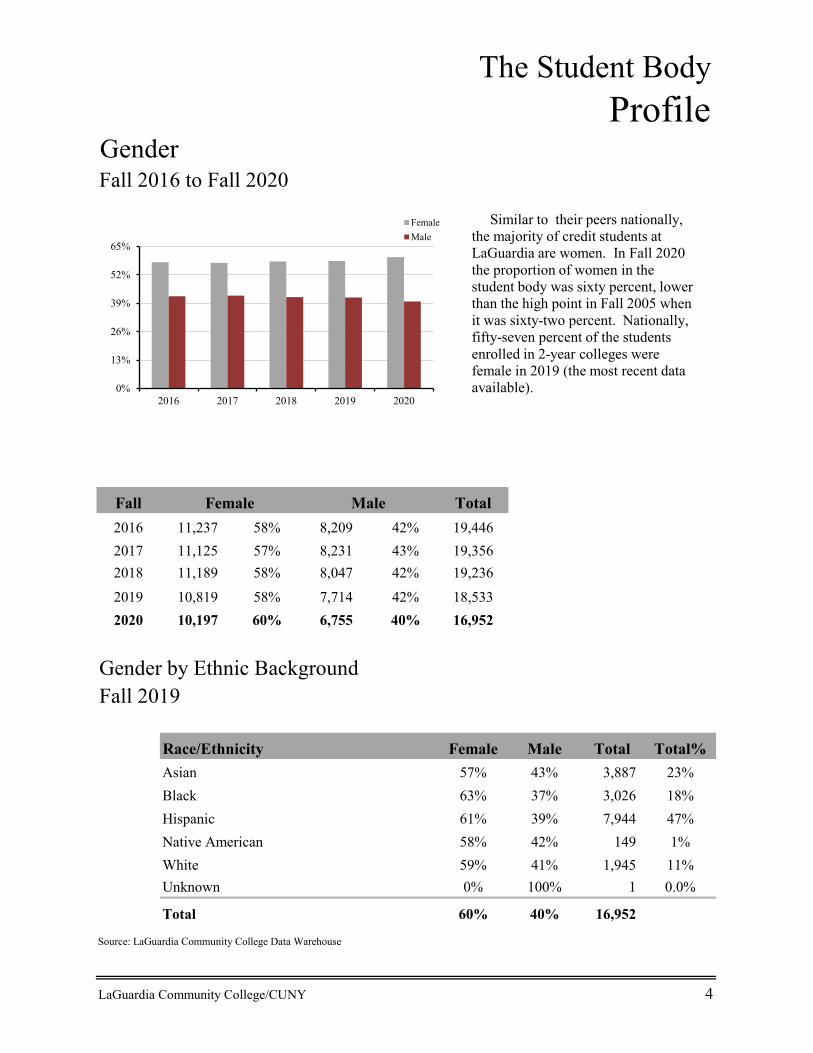
GenderFall 2016 to Fall 2020
Fall Total2016 11,237 58% 8,209 42% 19,4462017 11,125 57% 8,231 43% 19,3562018 11,189 58% 8,047 42% 19,2362019 10,819 58% 7,714 42% 18,5332020 10,197 60% 6,755 40% 16,952
Gender by Ethnic BackgroundFall 2019
Race/Ethnicity Female Male Total Total%Asian 57% 43% 3,887 23%Black 63% 37% 3,026 18%Hispanic 61% 39% 7,944 47%Native American 58% 42% 149 1%White 59% 41% 1,945 11%Unknown 0% 100% 1 0.0%
Total 60% 40% 16,952
Source: LaGuardia Community College Data Warehouse
LaGuardia Community College/CUNY 4
Female Male
Similar to their peers nationally, the majority of credit students at LaGuardia are women. In Fall 2020 the proportion of women in the student body was sixty percent, lower than the high point in Fall 2005 when it was sixty-two percent. Nationally, fifty-seven percent of the students enrolled in 2-year colleges were female in 2019 (the most recent data available). 0%
13%
26%
39%
52%
65%
2016 2017 2018 2019 2020
FemaleMale

The Student BodyProfile
Race and Ethnic BackgroundFall 2005 to Fall 2020
Source: LaGuardia Community College Data Warehouse, and NCES IPEDS data
5 LaGuardia Community College/CUNY
One of the core values of LaGuardia Community College is diversity. The metric often used for diversity is the proportion of under-represented minorities (URM). URM are comprised of Hispanic, Black (Non-Hispanic) and Native American. While non-resident international students are not separated in the previous LaGuardia based charts, mandated federal reports to the National Center of Educational Statistics (NCES) exclude the race/ethnic information of non-resident students. Consequently, when NCES data are used for national comparisons, the race/ethnic information for LaGuardia is slightly different than reported in the previous charts. Accordingly, LaGuardia's URM in Fall 2019 was 61 percent of the student body while the URM for all 2-year public institutions in Fall 2019 according to NCES was 40 percent of the total student population. Additionally, 7% of LaGuardia students are international
0%
5%
10%
15%
20%
25%
30%
35%
40%
45%
50%
2005 2006 2007 2008 2009 2010 2011 2012 2013 2014 2015 2016 2017 2018 2019 2020
Hispanic Black, Non-Hispanic White, Non-Hispanic
Asian or Pacific Islander Native American or Unknown
20%16%
45%
11%7%6%
13%
26%
44%
1%0%
10%
20%
30%
40%
50%
Asian Black Hispanic White Non-resident
Comparison with 2-Year Public Institutions: 2019
LaGuardia Public 2-year Colleges

The Student BodyProfile
Financial Resources2020-2021
Annual Degree Students Full-time Part-time AllAwarded Financial Aid 8,711 2,138 10,849
No Financial Aid 2,396 2,726 5,122All 11,107 4,864 15,971
Living with Parents
Living away from Parents
Family Income Ranges:Less than $5,000 17.8% 27.5%
$5,000 to $14,999 13.1% 16.9%$15,000 to $24,999 18.7% 17.6%
$25,000 or more 50.4% 38.0%
Per-Year Per-Student Costs:Tuition and Fees $5,217 $5,217Room and Board $6,878 $19,363
Books and Supplies $1,516 $1,516Personal Expenses $1,968 $2,672
Transportation $1,320 $1,320Total Costs $16,899 $30,088
Avg. Est. Financial Need $15,745 $20,659Avg. Financial Aid Award $5,881 $4,560Avg. Financial Gap $12,325 $18,903
LaGuardia Community College/CUNY 6
Awarded Students
$15,745
$20,659
$5,881 $4,560
03,0006,0009,000
12,00015,00018,00021,00024,000
Living with Parents Living away fromParents
Financial Gap NeedAward
49.6%62.0%
50.4%38.0%
0%
20%
40%
60%
80%
Living with Parents Living away fromParents
% with Family Income Above and Below $25,000
< $25,000>= $25,000
Sixty-eight percent of annual degree students (10,849 out of 15,971) were awarded some form of grant scholarship financial aid in 2020-21, fifty-one percent of whom lived independently of their parents. Among full-time students, seventy-eight percent (8,711 out of 11,107) were awarded financial aid. Financial need is ascertained by subtracting a federally determined proportion of a student family’s financial resources from the total cost of attendance. Five percent of students receiving aid took out Direct Loans. Half of the financially dependent student families, and sixty-two percent of the financially independent students who were awarded aid earned less than $25,000.
More than fifty percent of annual degree seeking students received some type of COVID-19 financial relief Grants with a grand total of more than $6,000,000 in Academic Year 2020-21.
EnrollmentProfile
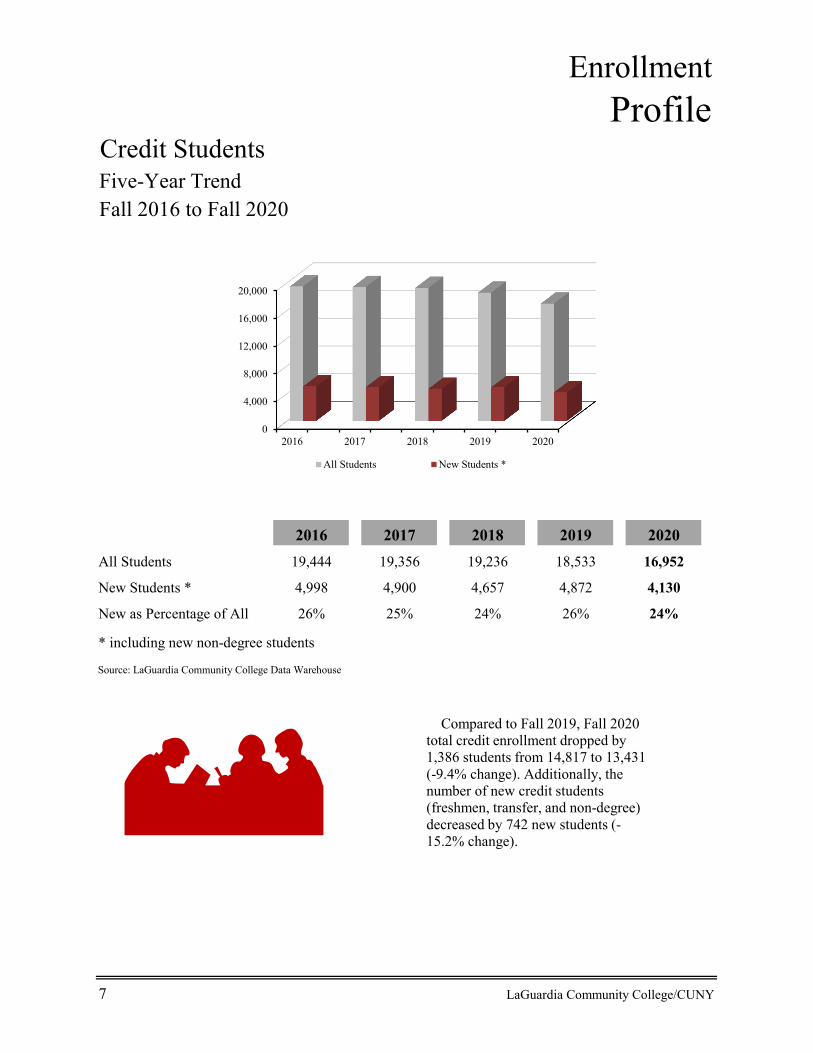
Credit StudentsFive-Year TrendFall 2016 to Fall 2020
2016 2017 2018 2019 2020All Students 19,444 19,356 19,236 18,533 16,952
New Students * 4,998 4,900 4,657 4,872 4,130
New as Percentage of All 26% 25% 24% 26% 24%
* including new non-degree students
Source: LaGuardia Community College Data Warehouse
7 LaGuardia Community College/CUNY
0
4,000
8,000
12,000
16,000
20,000
2016 2017 2018 2019 2020
All Students New Students *
Compared to Fall 2019, Fall 2020 total credit enrollment dropped by 1,386 students from 14,817 to 13,431 (-9.4% change). Additionally, the number of new credit students(freshmen, transfer, and non-degree) decreased by 742 new students (-15.2% change).
EnrollmentProfile
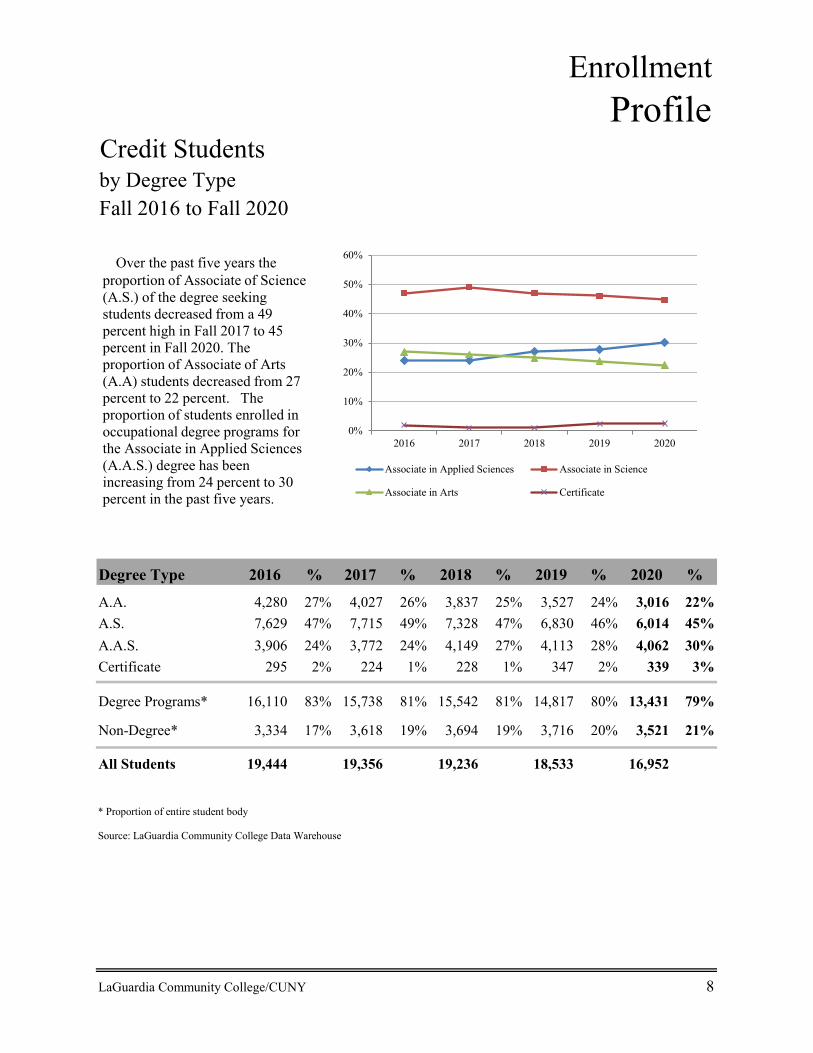
Credit Studentsby Degree TypeFall 2016 to Fall 2020
Degree Type 2016 % 2017 % 2018 % 2019 % 2020 %
A.A. 4,280 27% 4,027 26% 3,837 25% 3,527 24% 3,016 22%A.S. 7,629 47% 7,715 49% 7,328 47% 6,830 46% 6,014 45%A.A.S. 3,906 24% 3,772 24% 4,149 27% 4,113 28% 4,062 30%Certificate 295 2% 224 1% 228 1% 347 2% 339 3%
Degree Programs* 16,110 83% 15,738 81% 15,542 81% 14,817 80% 13,431 79%
Non-Degree* 3,334 17% 3,618 19% 3,694 19% 3,716 20% 3,521 21%
All Students 19,444 19,356 19,236 18,533 16,952
* Proportion of entire student body
Source: LaGuardia Community College Data Warehouse
LaGuardia Community College/CUNY 8
Over the past five years the proportion of Associate of Science (A.S.) of the degree seeking students decreased from a 49 percent high in Fall 2017 to 45 percent in Fall 2020. The proportion of Associate of Arts (A.A) students decreased from 27 percent to 22 percent. The proportion of students enrolled in occupational degree programs for the Associate in Applied Sciences (A.A.S.) degree has been increasing from 24 percent to 30 percent in the past five years.
0%
10%
20%
30%
40%
50%
60%
2016 2017 2018 2019 2020
Associate in Applied Sciences Associate in Science
Associate in Arts Certificate
EnrollmentProfile
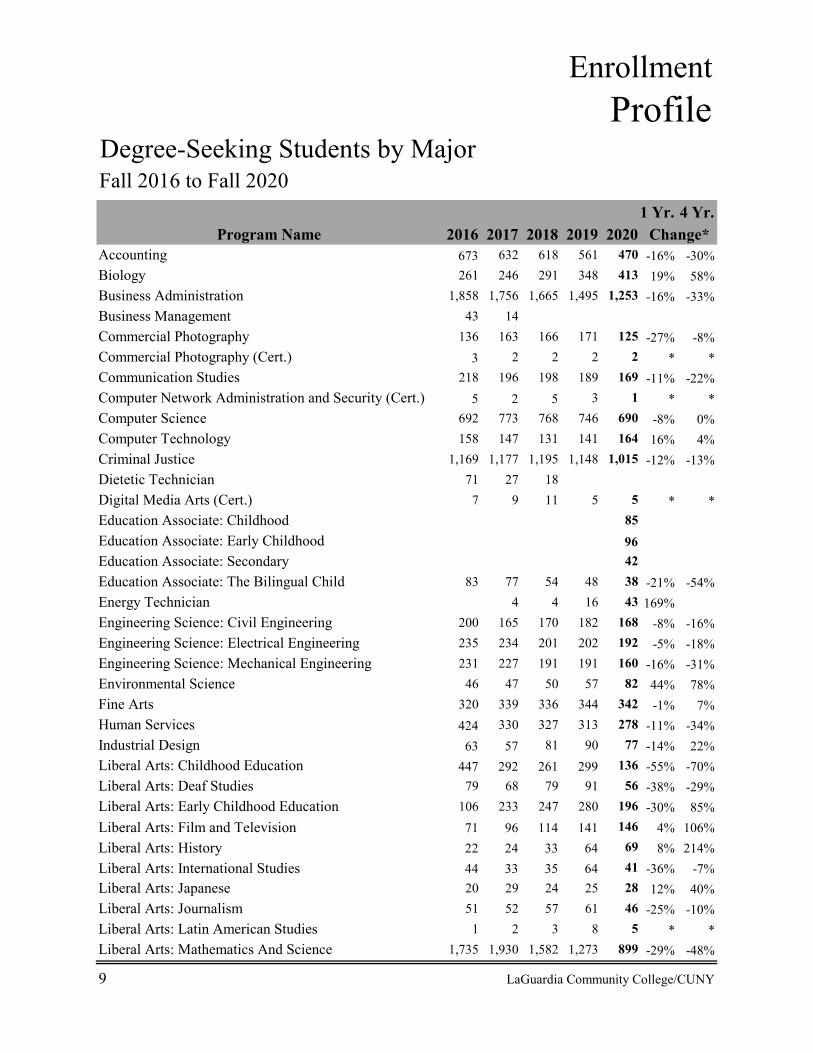
Degree-Seeking Students by MajorFall 2016 to Fall 2020
1 Yr. 4 Yr.
Accounting 673 632 618 561 470 -16% -30%Biology 261 246 291 348 413 19% 58%Business Administration 1,858 1,756 1,665 1,495 1,253 -16% -33%Business Management 43 14Commercial Photography 136 163 166 171 125 -27% -8%Commercial Photography (Cert.) 3 2 2 2 2 * *Communication Studies 218 196 198 189 169 -11% -22%Computer Network Administration and Security (Cert.) 5 2 5 3 1 * *Computer Science 692 773 768 746 690 -8% 0%Computer Technology 158 147 131 141 164 16% 4%Criminal Justice 1,169 1,177 1,195 1,148 1,015 -12% -13%Dietetic Technician 71 27 18Digital Media Arts (Cert.) 7 9 11 5 5 * *Education Associate: Childhood 85Education Associate: Early Childhood 96Education Associate: Secondary 42Education Associate: The Bilingual Child 83 77 54 48 38 -21% -54%Energy Technician 4 4 16 43 169%Engineering Science: Civil Engineering 200 165 170 182 168 -8% -16%Engineering Science: Electrical Engineering 235 234 201 202 192 -5% -18%Engineering Science: Mechanical Engineering 231 227 191 191 160 -16% -31%Environmental Science 46 47 50 57 82 44% 78%Fine Arts 320 339 336 344 342 -1% 7%Human Services 424 330 327 313 278 -11% -34%Industrial Design 63 57 81 90 77 -14% 22%Liberal Arts: Childhood Education 447 292 261 299 136 -55% -70%Liberal Arts: Deaf Studies 79 68 79 91 56 -38% -29%Liberal Arts: Early Childhood Education 106 233 247 280 196 -30% 85%Liberal Arts: Film and Television 71 96 114 141 146 4% 106%Liberal Arts: History 22 24 33 64 69 8% 214%Liberal Arts: International Studies 44 33 35 64 41 -36% -7%Liberal Arts: Japanese 20 29 24 25 28 12% 40%Liberal Arts: Journalism 51 52 57 61 46 -25% -10%Liberal Arts: Latin American Studies 1 2 3 8 5 * *Liberal Arts: Mathematics And Science 1,735 1,930 1,582 1,273 899 -29% -48%
9 LaGuardia Community College/CUNY
Change*Program Name 201820172016 20202019
EnrollmentProfile
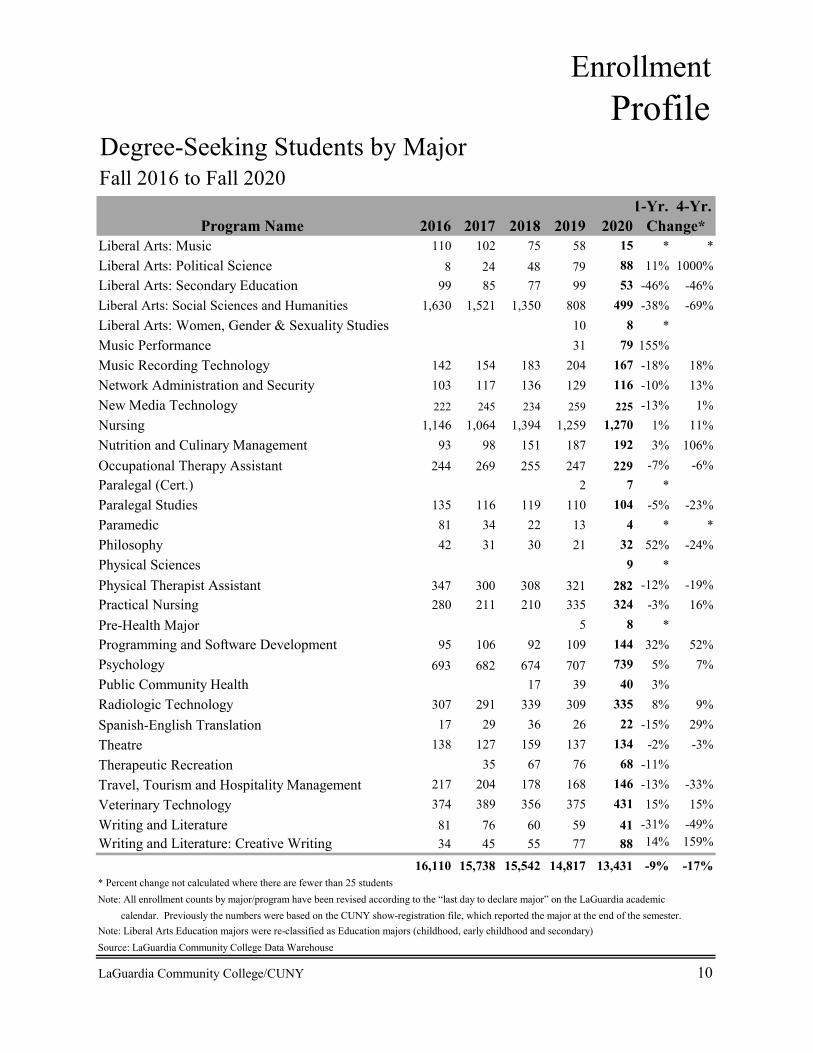
Degree-Seeking Students by MajorFall 2016 to Fall 2020
1-Yr. 4-Yr.Program Name
Liberal Arts: Music 110 102 75 58 15 * *Liberal Arts: Political Science 8 24 48 79 88 11% 1000%Liberal Arts: Secondary Education 99 85 77 99 53 -46% -46%Liberal Arts: Social Sciences and Humanities 1,630 1,521 1,350 808 499 -38% -69%Liberal Arts: Women, Gender & Sexuality Studies 10 8 *Music Performance 31 79 155%Music Recording Technology 142 154 183 204 167 -18% 18%Network Administration and Security 103 117 136 129 116 -10% 13%New Media Technology 222 245 234 259 225 -13% 1%Nursing 1,146 1,064 1,394 1,259 1,270 1% 11%Nutrition and Culinary Management 93 98 151 187 192 3% 106%Occupational Therapy Assistant 244 269 255 247 229 -7% -6%Paralegal (Cert.) 2 7 *Paralegal Studies 135 116 119 110 104 -5% -23%Paramedic 81 34 22 13 4 * *Philosophy 42 31 30 21 32 52% -24%Physical Sciences 9 *Physical Therapist Assistant 347 300 308 321 282 -12% -19%Practical Nursing 280 211 210 335 324 -3% 16%Pre-Health Major 5 8 *Programming and Software Development 95 106 92 109 144 32% 52%Psychology 693 682 674 707 739 5% 7%Public Community Health 17 39 40 3%Radiologic Technology 307 291 339 309 335 8% 9%Spanish-English Translation 17 29 36 26 22 -15% 29%Theatre 138 127 159 137 134 -2% -3%Therapeutic Recreation 35 67 76 68 -11%Travel, Tourism and Hospitality Management 217 204 178 168 146 -13% -33%Veterinary Technology 374 389 356 375 431 15% 15%Writing and Literature 81 76 60 59 41 -31% -49%Writing and Literature: Creative Writing 34 45 55 77 88 14% 159%
16,110 15,738 15,542 14,817 13,431 -9% -17%
Note: All enrollment counts by major/program have been revised according to the “last day to declare major” on the LaGuardia academic calendar. Previously the numbers were based on the CUNY show-registration file, which reported the major at the end of the semester.Note: Liberal Arts Education majors were re-classified as Education majors (childhood, early childhood and secondary)Source: LaGuardia Community College Data Warehouse
LaGuardia Community College/CUNY 10
* Percent change not calculated where there are fewer than 25 students
Change*201820172016 20202019
EnrollmentProfile
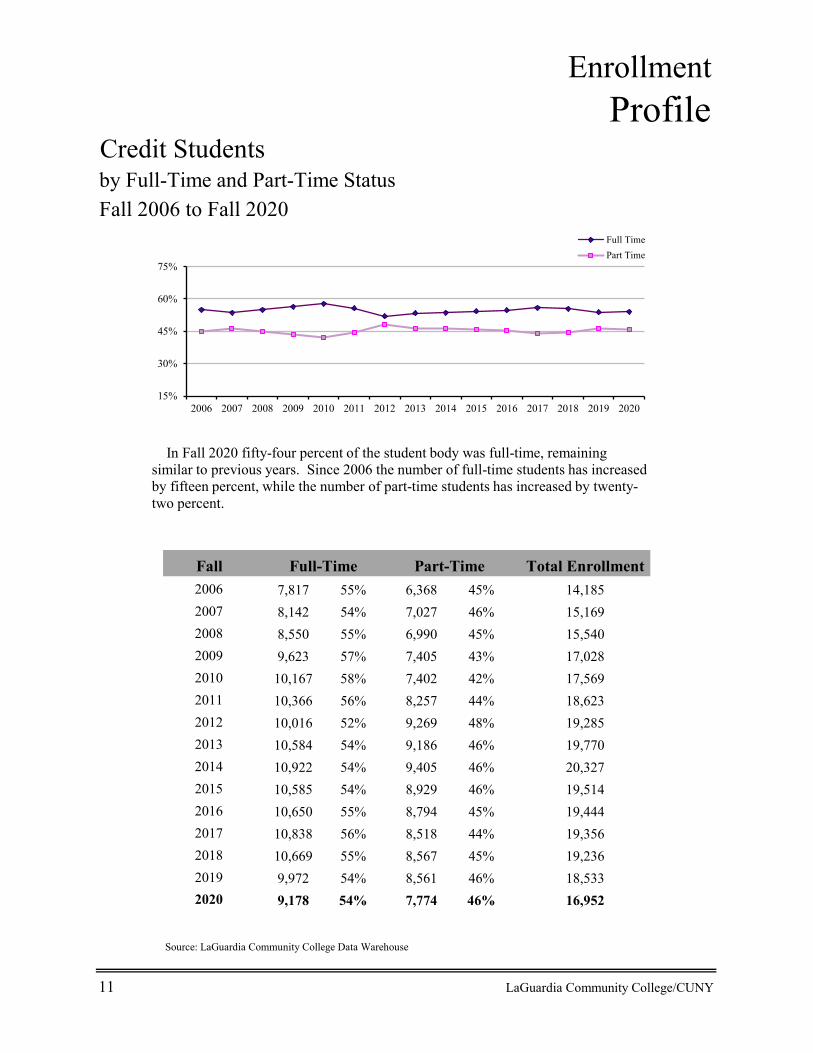
Credit Studentsby Full-Time and Part-Time StatusFall 2006 to Fall 2020
Fall Total Enrollment2006 7,817 55% 6,368 45% 14,1852007 8,142 54% 7,027 46% 15,1692008 8,550 55% 6,990 45% 15,5402009 9,623 57% 7,405 43% 17,0282010 10,167 58% 7,402 42% 17,5692011 10,366 56% 8,257 44% 18,6232012 10,016 52% 9,269 48% 19,2852013 10,584 54% 9,186 46% 19,7702014 10,922 54% 9,405 46% 20,3272015 10,585 54% 8,929 46% 19,5142016 10,650 55% 8,794 45% 19,4442017 10,838 56% 8,518 44% 19,3562018 10,669 55% 8,567 45% 19,2362019 9,972 54% 8,561 46% 18,5332020 9,178 54% 7,774 46% 16,952
Source: LaGuardia Community College Data Warehouse
11 LaGuardia Community College/CUNY
Part-Time Full-Time
In Fall 2020 fifty-four percent of the student body was full-time, remaining similar to previous years. Since 2006 the number of full-time students has increased by fifteen percent, while the number of part-time students has increased by twenty-two percent.
15%
30%
45%
60%
75%
2006 2007 2008 2009 2010 2011 2012 2013 2014 2015 2016 2017 2018 2019 2020
Full TimePart Time
EnrollmentProfile
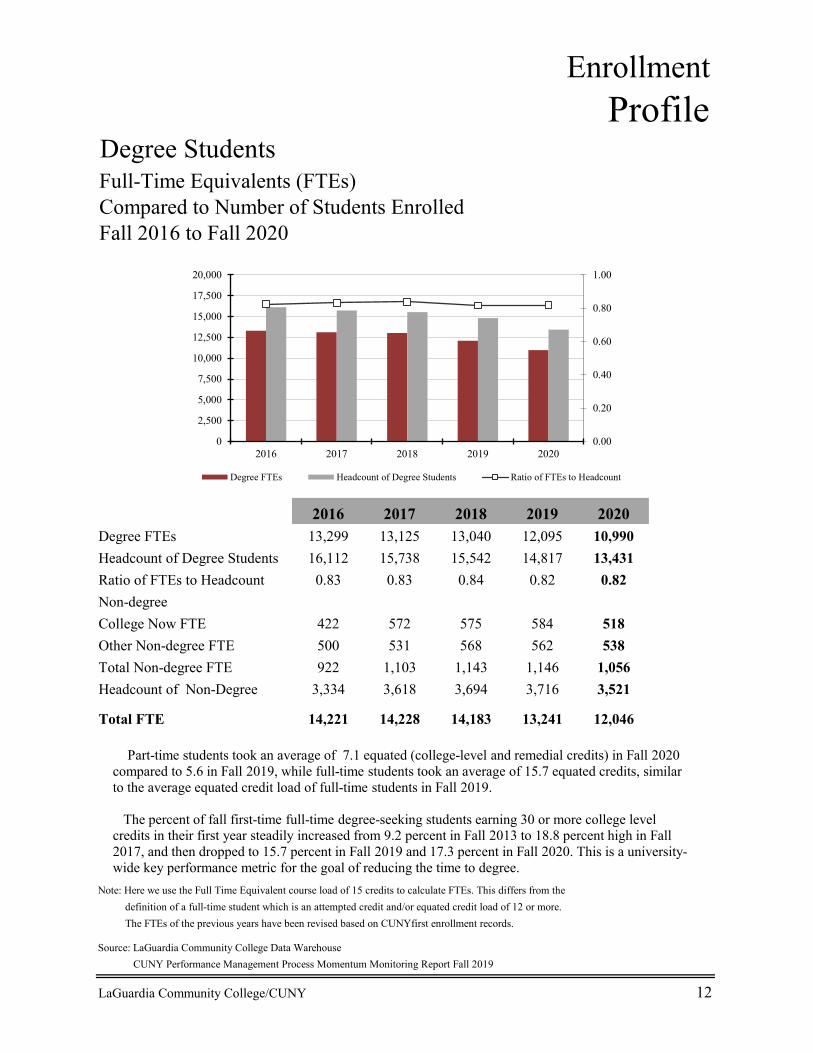
Degree StudentsFull-Time Equivalents (FTEs)Compared to Number of Students EnrolledFall 2016 to Fall 2020
2016 2017 2018 2019 2020Degree FTEs 13,299 13,125 13,040 12,095 10,990Headcount of Degree Students 16,112 15,738 15,542 14,817 13,431Ratio of FTEs to Headcount 0.83 0.83 0.84 0.82 0.82Non-degreeCollege Now FTE 422 572 575 584 518Other Non-degree FTE 500 531 568 562 538Total Non-degree FTE 922 1,103 1,143 1,146 1,056Headcount of Non-Degree 3,334 3,618 3,694 3,716 3,521
Total FTE 14,221 14,228 14,183 13,241 12,046
Note: Here we use the Full Time Equivalent course load of 15 credits to calculate FTEs. This differs from the definition of a full-time student which is an attempted credit and/or equated credit load of 12 or more. The FTEs of the previous years have been revised based on CUNYfirst enrollment records.
Source: LaGuardia Community College Data Warehouse CUNY Performance Management Process Momentum Monitoring Report Fall 2019
LaGuardia Community College/CUNY 12
0.00
0.20
0.40
0.60
0.80
1.00
0
2,500
5,000
7,500
10,000
12,500
15,000
17,500
20,000
2016 2017 2018 2019 2020
Degree FTEs Headcount of Degree Students Ratio of FTEs to Headcount
Part-time students took an average of 7.1 equated (college-level and remedial credits) in Fall 2020 compared to 5.6 in Fall 2019, while full-time students took an average of 15.7 equated credits, similar to the average equated credit load of full-time students in Fall 2019.
The percent of fall first-time full-time degree-seeking students earning 30 or more college level credits in their first year steadily increased from 9.2 percent in Fall 2013 to 18.8 percent high in Fall 2017, and then dropped to 15.7 percent in Fall 2019 and 17.3 percent in Fall 2020. This is a university-wide key performance metric for the goal of reducing the time to degree.
EnrollmentProfile
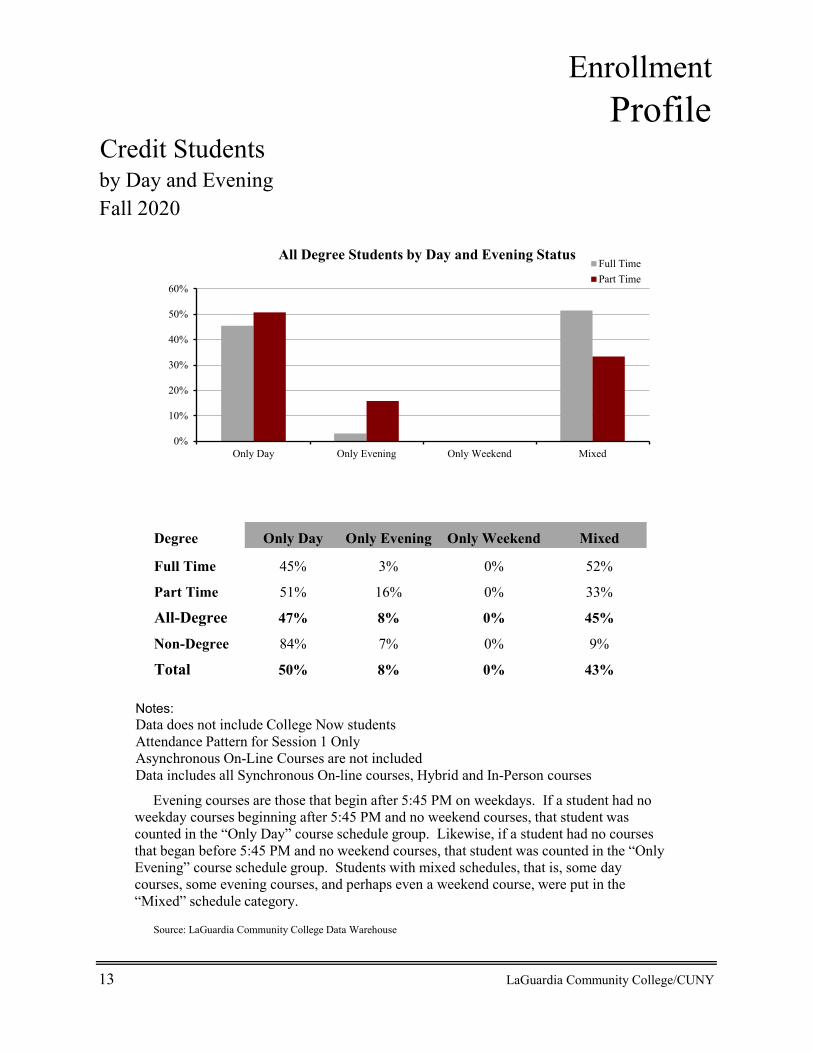
Credit Studentsby Day and EveningFall 2020
Degree Only Day Only Evening Only Weekend Mixed
Full Time 45% 3% 0% 52%
Part Time 51% 16% 0% 33%
All-Degree 47% 8% 0% 45%
Non-Degree 84% 7% 0% 9%
Total 50% 8% 0% 43%
Source: LaGuardia Community College Data Warehouse
13 LaGuardia Community College/CUNY
Evening courses are those that begin after 5:45 PM on weekdays. If a student had no weekday courses beginning after 5:45 PM and no weekend courses, that student was counted in the “Only Day” course schedule group. Likewise, if a student had no courses that began before 5:45 PM and no weekend courses, that student was counted in the “Only Evening” course schedule group. Students with mixed schedules, that is, some day courses, some evening courses, and perhaps even a weekend course, were put in the “Mixed” schedule category.
0%
10%
20%
30%
40%
50%
60%
Only Day Only Evening Only Weekend Mixed
All Degree Students by Day and Evening StatusFull TimePart Time
Notes:Data does not include College Now studentsAttendance Pattern for Session 1 OnlyAsynchronous On-Line Courses are not includedData includes all Synchronous On-line courses, Hybrid and In-Person courses
EnrollmentProfile
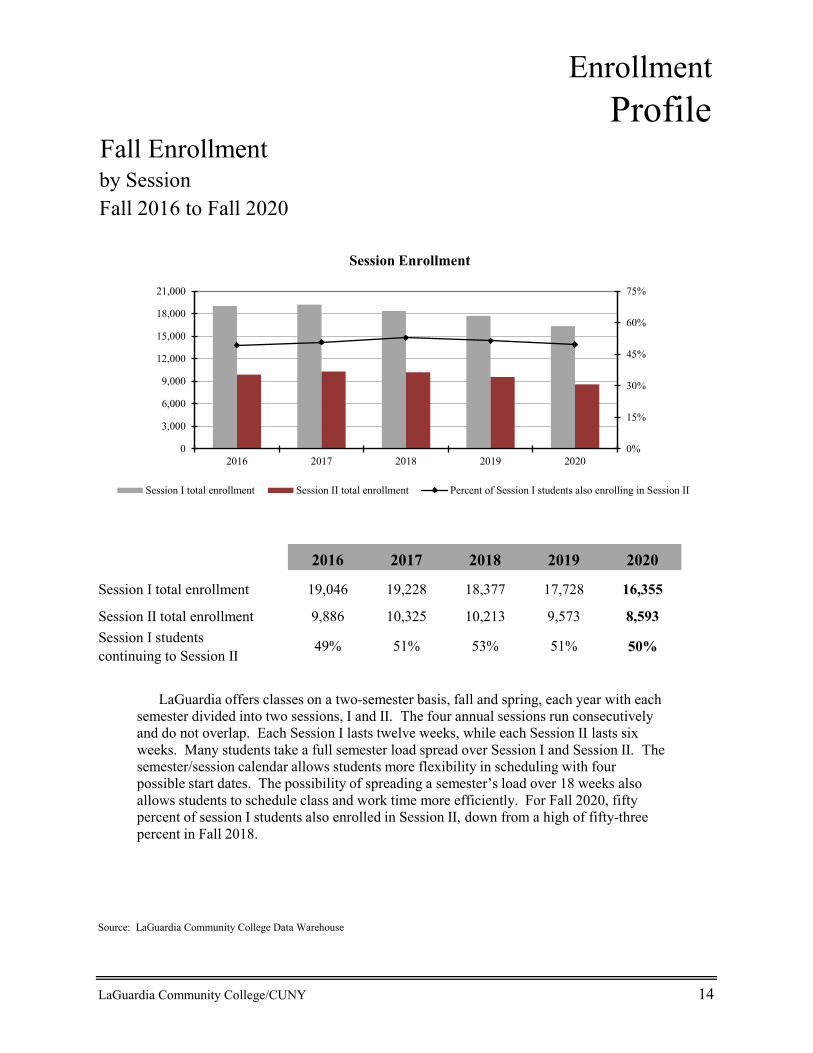
Fall Enrollmentby SessionFall 2016 to Fall 2020
2016 2017 2018 2019 2020
19,046 19,228 18,377 17,728 16,355
9,886 10,325 10,213 9,573 8,593
49% 51% 53% 51% 50%
Source: LaGuardia Community College Data Warehouse
LaGuardia Community College/CUNY 14
Session I total enrollment
Session II total enrollmentSession I students .A continuing to Session II
0%
15%
30%
45%
60%
75%
0
3,000
6,000
9,000
12,000
15,000
18,000
21,000
2016 2017 2018 2019 2020
Session Enrollment
Session I total enrollment Session II total enrollment Percent of Session I students also enrolling in Session II
LaGuardia offers classes on a two-semester basis, fall and spring, each year with each semester divided into two sessions, I and II. The four annual sessions run consecutively and do not overlap. Each Session I lasts twelve weeks, while each Session II lasts six weeks. Many students take a full semester load spread over Session I and Session II. The semester/session calendar allows students more flexibility in scheduling with four possible start dates. The possibility of spreading a semester’s load over 18 weeks also allows students to schedule class and work time more efficiently. For Fall 2020, fifty percent of session I students also enrolled in Session II, down from a high of fifty-three percent in Fall 2018.
EnrollmentProfile
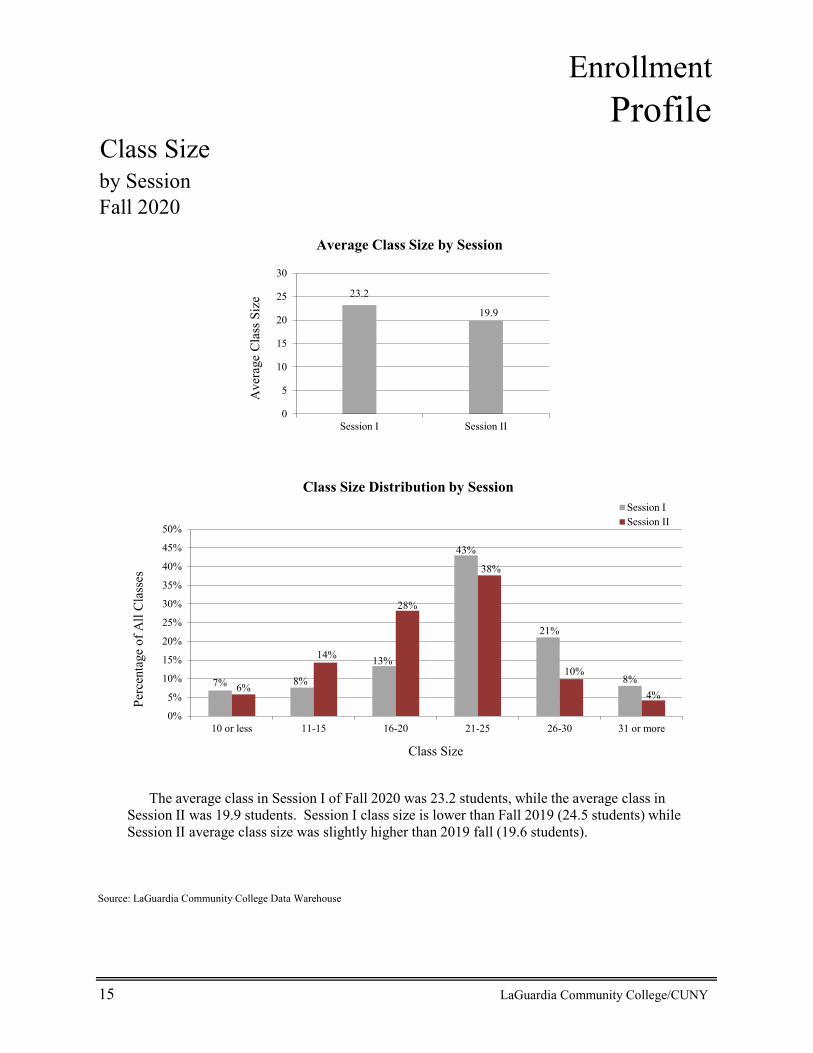
Class Sizeby SessionFall 2020
Source: LaGuardia Community College Data Warehouse
15 LaGuardia Community College/CUNY
23.2
19.9
0
5
10
15
20
25
30
Session I Session II
Ave
rage
Cla
ss S
ize
Average Class Size by Session
7% 8%
13%
43%
21%
8%6%
14%
28%
38%
10%
4%
0%
5%
10%
15%
20%
25%
30%
35%
40%
45%
50%
10 or less 11-15 16-20 21-25 26-30 31 or more
Perc
enta
ge o
f All
Cla
sses
Class Size
Class Size Distribution by Session Session ISession II
The average class in Session I of Fall 2020 was 23.2 students, while the average class in Session II was 19.9 students. Session I class size is lower than Fall 2019 (24.5 students) while Session II average class size was slightly higher than 2019 fall (19.6 students).
Profile ofEntering Students
New Students Admission and EnrollmentDegree-Seeking StudentsFall 2016 to Fall 2020
Fall Admitted Enrolled % Admitted Enrolled % Admitted Enrolled % 2016 20,051 3,071 15% 3,706 1,696 46% 23,757 4,769 20%2017 21,335 2,959 14% 3,802 1,722 45% 25,137 4,684 19%2018 21,106 2,652 13% 3,524 1,769 50% 24,630 4,421 18%2019 21,291 3,021 14% 4,030 1,700 42% 25,321 4,721 19%2020 19,067 2,753 14% 2,955 1,247 42% 22,022 4,000 18%
Source: LaGuardia Community College Data Warehouse
LaGuardia Community College/CUNY 16
Freshmen Transfers Total New
0%
10%
20%
30%
40%
50%
60%
20162017201820192020
% Transfer Enroll % Freshmen Enroll
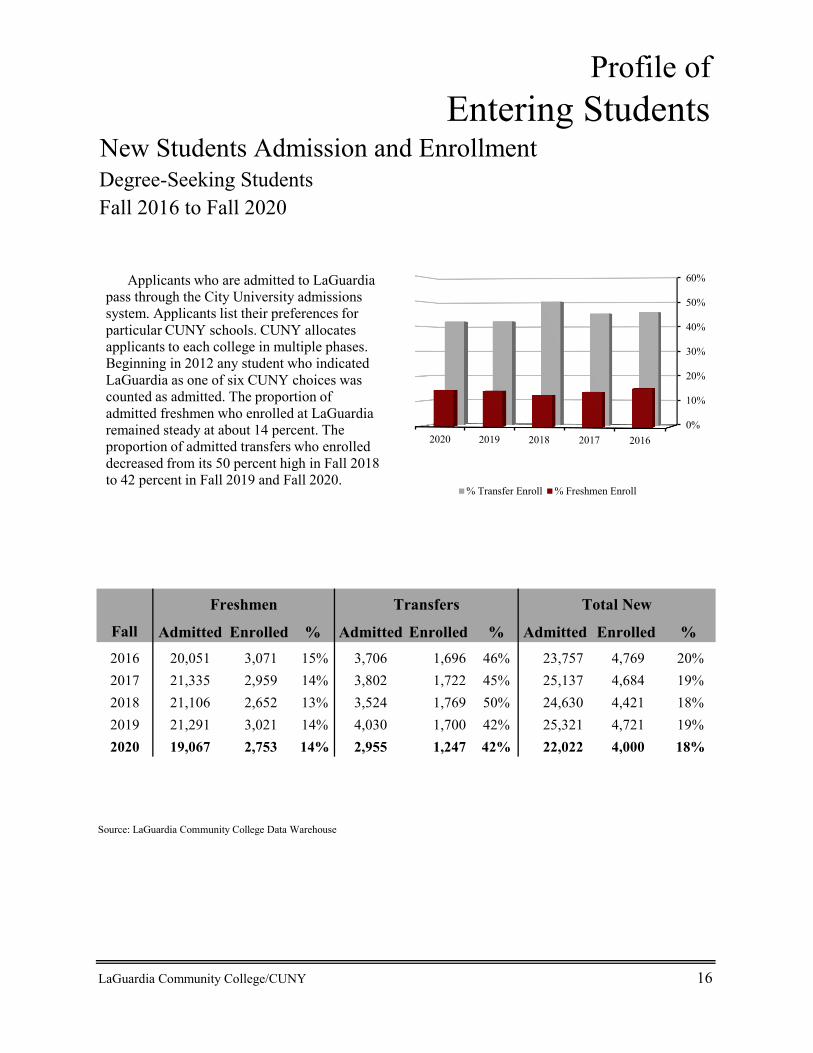
Applicants who are admitted to LaGuardia pass through the City University admissions system. Applicants list their preferences for particular CUNY schools. CUNY allocates applicants to each college in multiple phases. Beginning in 2012 any student who indicated LaGuardia as one of six CUNY choices was counted as admitted. The proportion of admitted freshmen who enrolled at LaGuardia remained steady at about 14 percent. The proportion of admitted transfers who enrolled decreased from its 50 percent high in Fall 2018 to 42 percent in Fall 2019 and Fall 2020.
Profile ofEntering Students
by First-Time, Transfer, and Non-Degree StatusFall 2016 to Fall 2020
Total
3,071 62% 1,696 34% 231 5% 4,9982,959 61% 1,722 34% 219 5% 4,9002,652 60% 1,769 35% 236 4% 4,6573,021 57% 1,700 38% 151 5% 4,8722,753 67% 1,247 30% 130 3% 4,130
Source: LaGuardia Community College Data Warehouse
17 LaGuardia Community College/CUNY
First-Time Transfer Non-Degree
2019
New Credit Students
Fall
201620172018
2020
0%
13%
25%
38%
50%
63%
75%
First-Time Transfer Non-Degree
2016 2017 2018 2019 2020
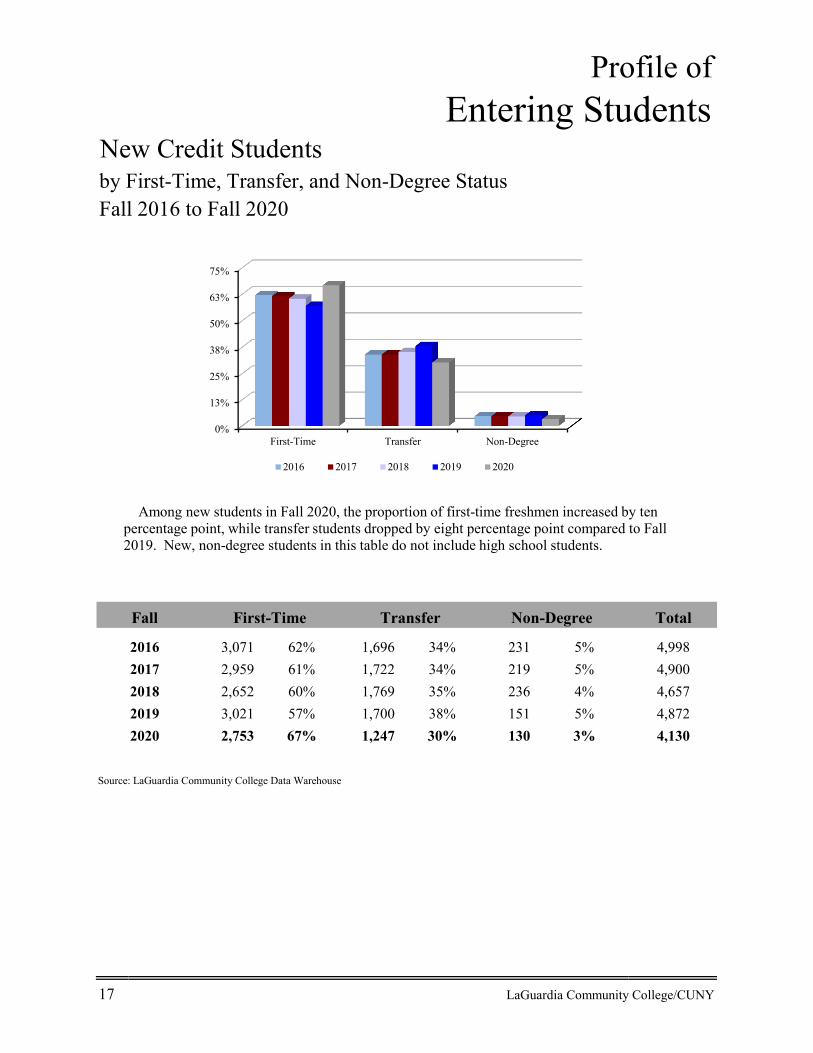
Among new students in Fall 2020, the proportion of first-time freshmen increased by ten percentage point, while transfer students dropped by eight percentage point compared to Fall 2019. New, non-degree students in this table do not include high school students.
Profile ofEntering Students
New Credit Studentsby Degree TypeFall 2016 to Fall 2020
Degree TypeA.A. 1,149 24% 1,059 23% 960 22% 972 21% 787 20%A.S. 2,247 48% 2,206 48% 1,847 42% 1,977 42% 1,613 40%A.A.S. 1,302 26% 1,367 28% 1,556 35% 1,628 34% 1,448 36%Certificate 69 1% 49 1% 58 1% 144 3% 152 4%
Degree Total 4,767 100% 4,681 100% 4,421 100% 4,721 100% 4,000 100%
Non-Degree 231 219 236 151 130
Credit Total 4,998 4,900 4,657 4,872 4,130
Source: LaGuardia Community College Data Warehouse
LaGuardia Community College/CUNY 18
20172016 20202018 2019
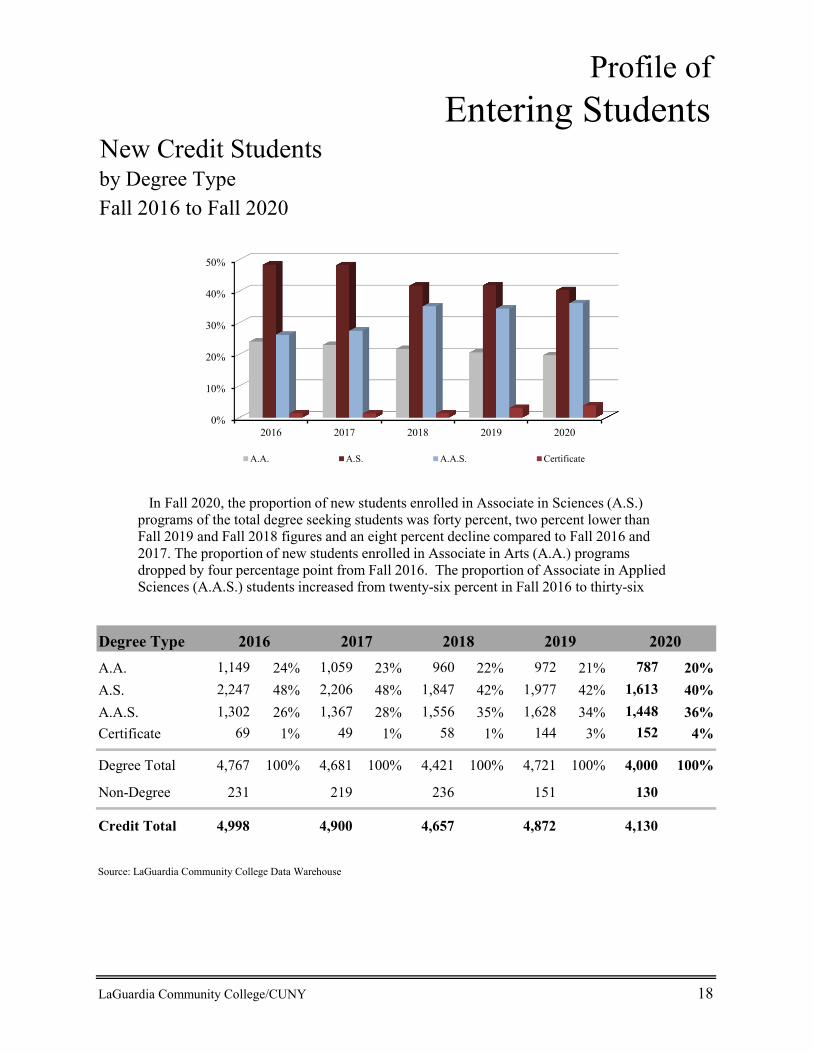
In Fall 2020, the proportion of new students enrolled in Associate in Sciences (A.S.) programs of the total degree seeking students was forty percent, two percent lower thanFall 2019 and Fall 2018 figures and an eight percent decline compared to Fall 2016 and 2017. The proportion of new students enrolled in Associate in Arts (A.A.) programs dropped by four percentage point from Fall 2016. The proportion of Associate in Applied Sciences (A.A.S.) students increased from twenty-six percent in Fall 2016 to thirty-six
0%
10%
20%
30%
40%
50%
2016 2017 2018 2019 2020
A.A. A.S. A.A.S. Certificate
EnrollmentProfile
New Degree-Seeking Students by MajorFall 2016 to Fall 2020
1-Yr. 4-Yr.
Accounting 176 153 124 147 108 -27% -39%
Biology 68 65 98 163 165 1% 143%
Business Administration 447 408 378 336 274 -18% -39%
Commercial Photography 36 60 53 67 38 -43% 6%
Commercial Photography (Cert.) 1 1 1 *
Communication Studies 41 43 36 38 39 3% -5%
Computer Network Administration and Security (Cert.) 5 3 1 1 * *
Computer Science 242 228 213 220 168 -24% -31%
Computer Technology 61 51 45 55 70 27% 15%
Criminal Justice 344 372 361 380 330 -13% -4%
Dietetic Technician 13 4
Digital Media Arts (Cert.) 4 8 6 2 4 * *
Education Associate: Childhood 52 27 69 91 54 -41% 4%
Education Associate: Early Childhood 51 54 40 54 60 11% 18%
Education Associate: Secondary 17 16 20 32 30 -6% 76%
Education Associate: The Bilingual Child 19 19 15 14 10 * *
Energy Technician 2 3 12 35 192%
Engineering Science: Civil Engineering 49 43 35 51 45 -12% -8%
Engineering Science: Electrical Engineering 66 46 37 71 67 -6% 2%
Engineering Science: Mechanical Engineering 71 58 47 54 42 -22% -41%
Environmental Science 15 11 14 20 26 30% 73%
Fine Arts 73 113 101 102 103 1% 41%
Human Services 76 58 67 59 55 -7% -28%
Industrial Design 18 10 19 25 16 * *
Liberal Arts: Deaf Studies 17 12 23 34 11 * *
Liberal Arts: Film and Television 17 20 26 66 52 -21% 206%
Liberal Arts: History 3 3 12 31 17 * *
Liberal Arts: International Studies 6 6 5 29 9 * *
Liberal Arts: Japanese 5 6 4 14 15 * *
Liberal Arts: Journalism 10 9 11 19 10 * *
Liberal Arts: Latin American Studies 2 4 *
Liberal Arts: Mathematics And Science 627 642 366 346 182 -47% -71%
Liberal Arts: Music 33 21 16 23 1 * *
19 LaGuardia Community College/CUNY
Change*Program Name 2019201820172016 2020
EnrollmentProfile
New Degree-Seeking Students by MajorFall 2016 to Fall 2020
1-Yr. 4-Yr.
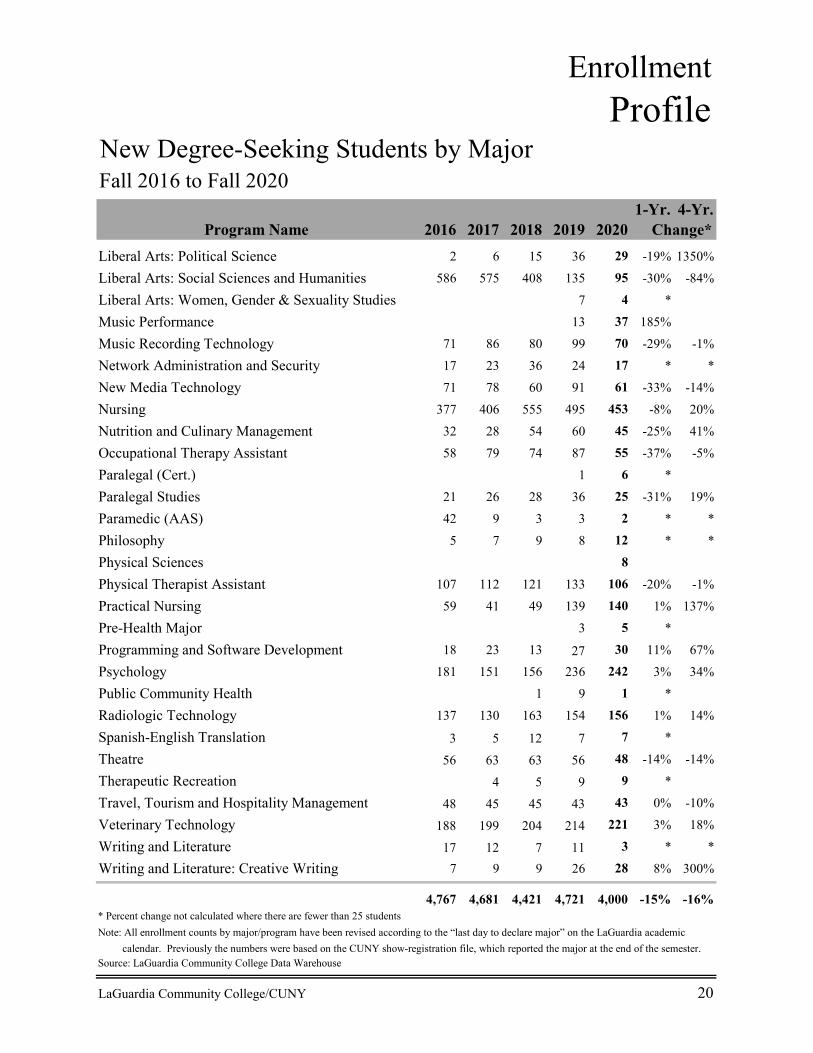
Liberal Arts: Political Science 2 6 15 36 29 -19% 1350%
Liberal Arts: Social Sciences and Humanities 586 575 408 135 95 -30% -84%
Liberal Arts: Women, Gender & Sexuality Studies 7 4 *
Music Performance 13 37 185%
Music Recording Technology 71 86 80 99 70 -29% -1%
Network Administration and Security 17 23 36 24 17 * *
New Media Technology 71 78 60 91 61 -33% -14%
Nursing 377 406 555 495 453 -8% 20%
Nutrition and Culinary Management 32 28 54 60 45 -25% 41%
Occupational Therapy Assistant 58 79 74 87 55 -37% -5%
Paralegal (Cert.) 1 6 *
Paralegal Studies 21 26 28 36 25 -31% 19%
Paramedic (AAS) 42 9 3 3 2 * *
Philosophy 5 7 9 8 12 * *
Physical Sciences 8
Physical Therapist Assistant 107 112 121 133 106 -20% -1%
Practical Nursing 59 41 49 139 140 1% 137%
Pre-Health Major 3 5 *
Programming and Software Development 18 23 13 27 30 11% 67%
Psychology 181 151 156 236 242 3% 34%
Public Community Health 1 9 1 *
Radiologic Technology 137 130 163 154 156 1% 14%
Spanish-English Translation 3 5 12 7 7 *
Theatre 56 63 63 56 48 -14% -14%
Therapeutic Recreation 4 5 9 9 *
Travel, Tourism and Hospitality Management 48 45 45 43 43 0% -10%
Veterinary Technology 188 199 204 214 221 3% 18%
Writing and Literature 17 12 7 11 3 * *
Writing and Literature: Creative Writing 7 9 9 26 28 8% 300%
4,767 4,681 4,421 4,721 4,000 -15% -16%
Note: All enrollment counts by major/program have been revised according to the “last day to declare major” on the LaGuardia academic calendar. Previously the numbers were based on the CUNY show-registration file, which reported the major at the end of the semester.Source: LaGuardia Community College Data Warehouse
LaGuardia Community College/CUNY 20
* Percent change not calculated where there are fewer than 25 students
Program Name Change*2019201820172016 2020
Profile ofEntering Students
Entering Academic CredentialTASC*, High School Diploma or Previous College Attendee (Transfer)Degree-Seeking Students, Fall 2016 to Fall 2020
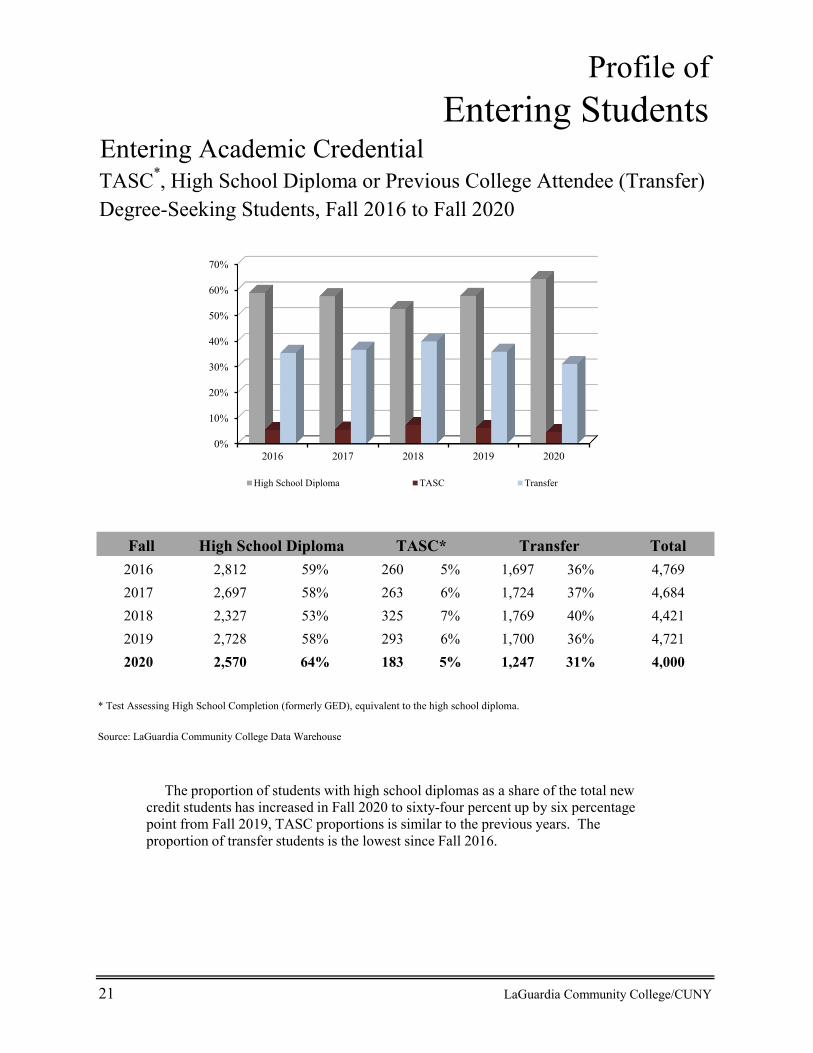
Total2016 2,812 59% 260 5% 1,697 36% 4,7692017 2,697 58% 263 6% 1,724 37% 4,6842018 2,327 53% 325 7% 1,769 40% 4,4212019 2,728 58% 293 6% 1,700 36% 4,7212020 2,570 64% 183 5% 1,247 31% 4,000
* Test Assessing High School Completion (formerly GED), equivalent to the high school diploma.
Source: LaGuardia Community College Data Warehouse
21 LaGuardia Community College/CUNY
TASC*High School DiplomaFall Transfer
0%
10%
20%
30%
40%
50%
60%
70%
2016 2017 2018 2019 2020
High School Diploma TASC Transfer
The proportion of students with high school diplomas as a share of the total new credit students has increased in Fall 2020 to sixty-four percent up by six percentage point from Fall 2019, TASC proportions is similar to the previous years. The proportion of transfer students is the lowest since Fall 2016.
Profile ofEntering Students
High School Averages
High School Average 2016 % 2017 % 2018 % 2019 % 2020 %
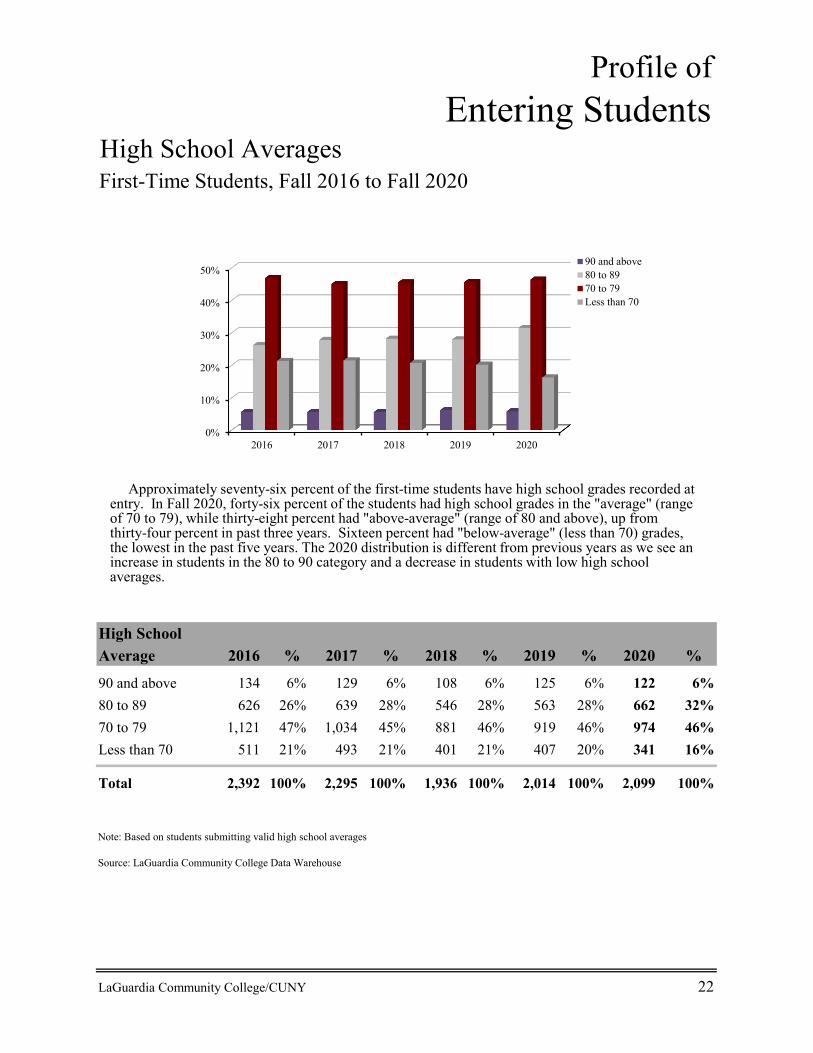
90 and above 134 6% 129 6% 108 6% 125 6% 122 6%80 to 89 626 26% 639 28% 546 28% 563 28% 662 32%70 to 79 1,121 47% 1,034 45% 881 46% 919 46% 974 46%Less than 70 511 21% 493 21% 401 21% 407 20% 341 16%
Total 2,392 100% 2,295 100% 1,936 100% 2,014 100% 2,099 100%
Note: Based on students submitting valid high school averages
Source: LaGuardia Community College Data Warehouse
LaGuardia Community College/CUNY 22
First-Time Students, Fall 2016 to Fall 2020
Approximately seventy-six percent of the first-time students have high school grades recorded at entry. In Fall 2020, forty-six percent of the students had high school grades in the "average" (range of 70 to 79), while thirty-eight percent had "above-average" (range of 80 and above), up from thirty-four percent in past three years. Sixteen percent had "below-average" (less than 70) grades, the lowest in the past five years. The 2020 distribution is different from previous years as we see an increase in students in the 80 to 90 category and a decrease in students with low high school averages.
0%
10%
20%
30%
40%
50%
2016 2017 2018 2019 2020
90 and above80 to 8970 to 79Less than 70
Profile ofEntering Students
First-time Freshmen by Sending High SchoolsHigh School Name Neighborhood Admitted Enrolled
Enrollment Rate
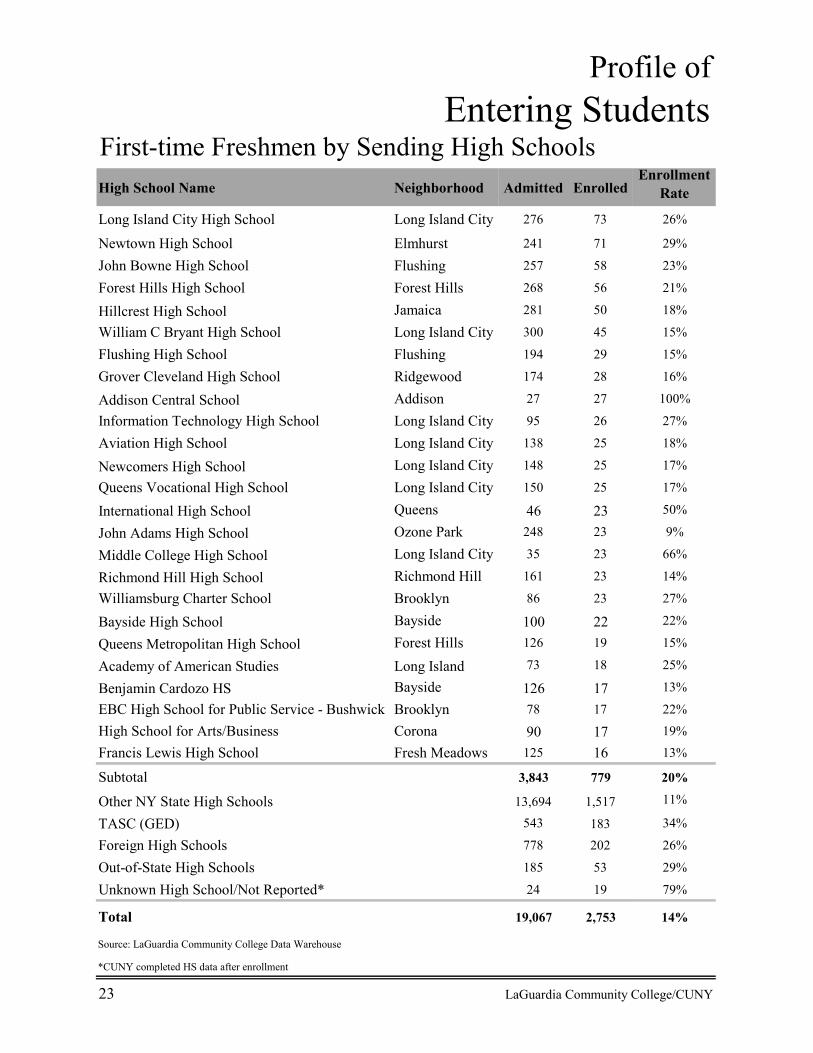
Long Island City High School Long Island City 276 73 26%
Newtown High School Elmhurst 241 71 29%
John Bowne High School Flushing 257 58 23%
Forest Hills High School Forest Hills 268 56 21%
Hillcrest High School Jamaica 281 50 18%
William C Bryant High School Long Island City 300 45 15%
Flushing High School Flushing 194 29 15%
Grover Cleveland High School Ridgewood 174 28 16%
Addison Central School Addison 27 27 100%
Information Technology High School Long Island City 95 26 27%
Aviation High School Long Island City 138 25 18%
Newcomers High School Long Island City 148 25 17%
Queens Vocational High School Long Island City 150 25 17%
International High School Queens 46 23 50%
John Adams High School Ozone Park 248 23 9%
Middle College High School Long Island City 35 23 66%
Richmond Hill High School Richmond Hill 161 23 14%
Williamsburg Charter School Brooklyn 86 23 27%
Bayside High School Bayside 100 22 22%
Queens Metropolitan High School Forest Hills 126 19 15%
Academy of American Studies Long Island 73 18 25%
Benjamin Cardozo HS Bayside 126 17 13%
EBC High School for Public Service - Bushwick Brooklyn 78 17 22%
High School for Arts/Business Corona 90 17 19%
Francis Lewis High School Fresh Meadows 125 16 13%
Subtotal 3,843 779 20%
Other NY State High Schools 13,694 1,517 11%
TASC (GED) 543 183 34%
Foreign High Schools 778 202 26%
Out-of-State High Schools 185 53 29%
Unknown High School/Not Reported* 24 19 79%
Total 19,067 2,753 14%
Source: LaGuardia Community College Data Warehouse
*CUNY completed HS data after enrollment
23 LaGuardia Community College/CUNY
Profile ofEntering Students
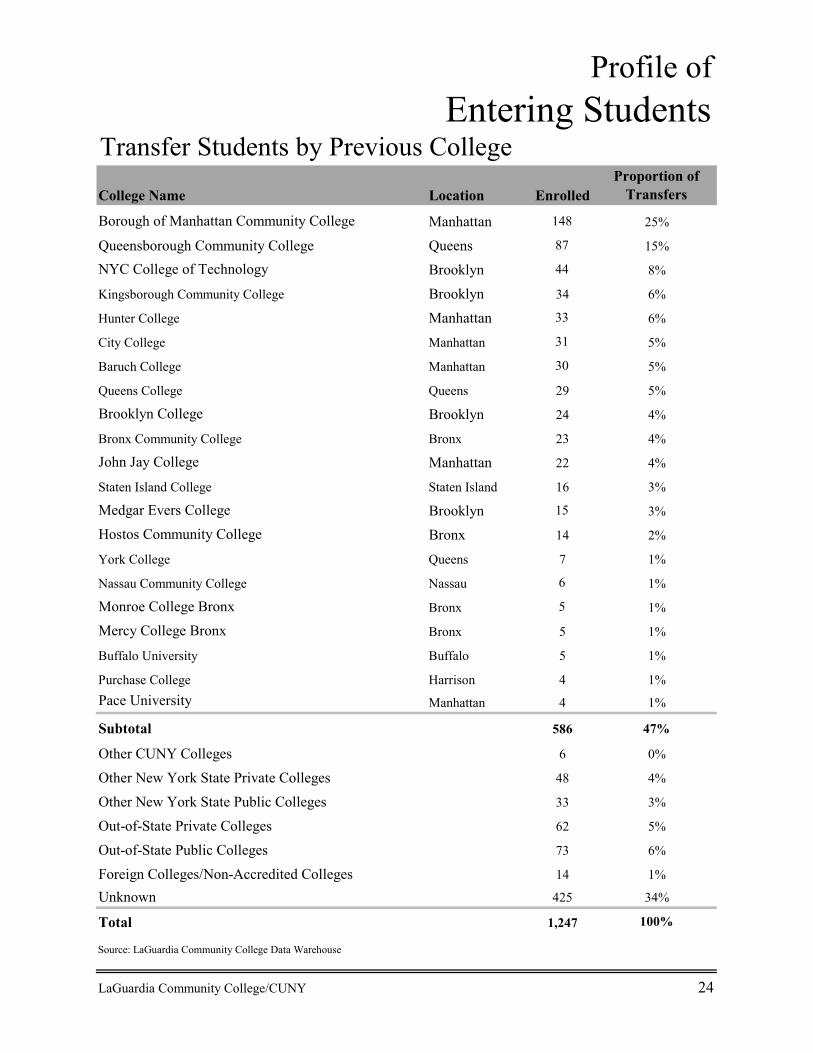
Transfer Students by Previous College
College Name Location EnrolledProportion of
Transfers
Borough of Manhattan Community College Manhattan 148 25%
Queensborough Community College Queens 87 15%
NYC College of Technology Brooklyn 44 8%
Kingsborough Community College Brooklyn 34 6%
Hunter College Manhattan 33 6%
City College Manhattan 31 5%
Baruch College Manhattan 30 5%
Queens College Queens 29 5%
Brooklyn College Brooklyn 24 4%
Bronx Community College Bronx 23 4%
John Jay College Manhattan 22 4%
Staten Island College Staten Island 16 3%
Medgar Evers College Brooklyn 15 3%
Hostos Community College Bronx 14 2%
York College Queens 7 1%
Nassau Community College Nassau 6 1%
Monroe College Bronx Bronx 5 1%
Mercy College Bronx Bronx 5 1%
Buffalo University Buffalo 5 1%
Purchase College Harrison 4 1%Pace University Manhattan 4 1%
Subtotal 586 47%
Other CUNY Colleges 6 0%
Other New York State Private Colleges 48 4%
Other New York State Public Colleges 33 3%
Out-of-State Private Colleges 62 5%
Out-of-State Public Colleges 73 6%
Foreign Colleges/Non-Accredited Colleges 14 1%
Unknown 425 34%
Total 1,247 100%
Source: LaGuardia Community College Data Warehouse
LaGuardia Community College/CUNY 24

Profile ofEntering Students
Basic Skills NeedsFirst-Time Degree-Seeking Students, Fall 2016 to Fall 2020
Fall
2016 2,170 71% 578 19% 396 13% 2,415 79% 3,0722017 1,385 47% 498 17% 384 13% 1,756 59% 2,9602018 1,003 38% 428 16% 332 13% 1,422 54% 2,6522019 1,084 36% 528 17% 394 13% 1,678 56% 3,0212020 966 35% 585 21% 368 13% 1,419 52% 2,753
Source: LaGuardia Community College Data Warehouse
* Starting in Spring 2020 placement is based on the Proficiency Index and not on testing
25 LaGuardia Community College/CUNY
Percent Requiring Basic Skills
Basic Math Basic Reading ESL
Remediation / Co-req Remediation in one or more
areasTotal
Freshmen
0%
13%
25%
38%
50%
63%
75%
Basic Math Basic Reading ESL
Percent Requiring Basic Skills
2016 2017 2018 2019 2020
In Fall 2020 the proportion of students required to take basic skills math fell to an all-time low of thirty-five percent. This is less than half of what the math remedial rate was just five years ago in 2016. Please note that until 2019 student placementswere based on the accuplacer exams which were switched to the Proficiency Index in 2020.
Profile ofEntering Students
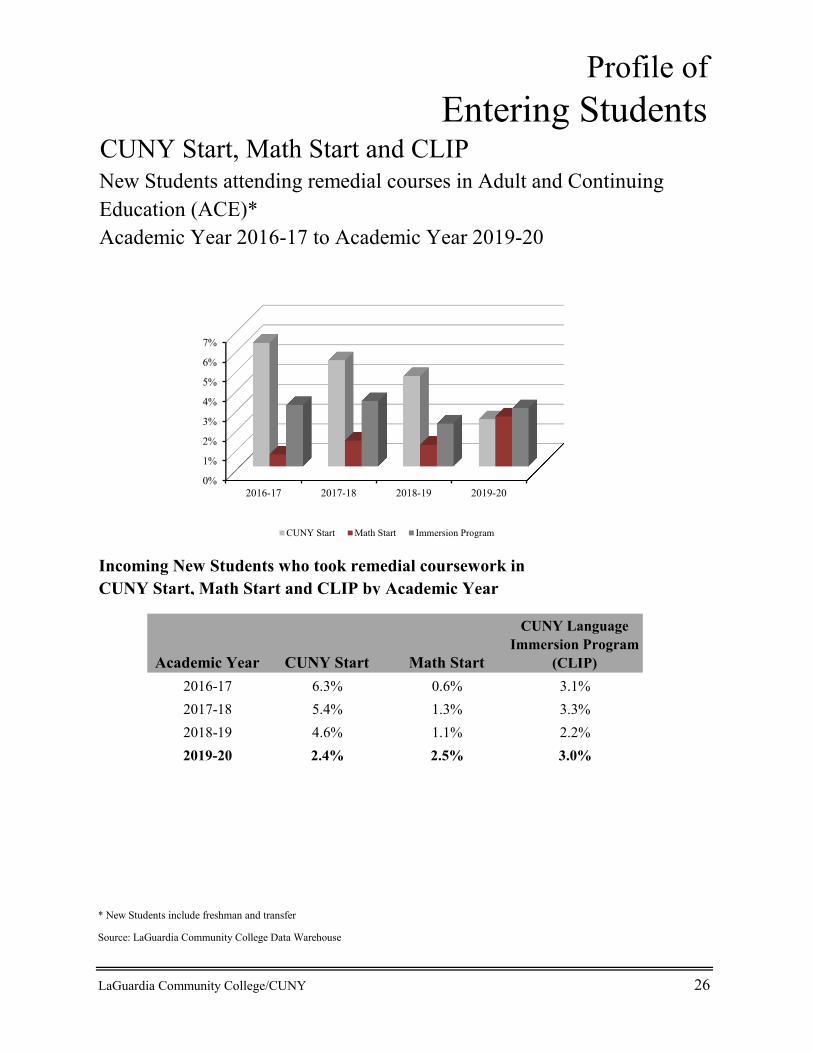
CUNY Start, Math Start and CLIPNew Students attending remedial courses in Adult and ContinuingEducation (ACE)*Academic Year 2016-17 to Academic Year 2019-20
Incoming New Students who took remedial coursework in CUNY Start, Math Start and CLIP by Academic Year
* New Students include freshman and transfer
Source: LaGuardia Community College Data Warehouse
LaGuardia Community College/CUNY 26
Academic Year
2.2%1.3%
3.1%3.3%
2019-20
2017-182018-19
0.6%
4.6%2.4% 2.5%
2016-17
1.1%
6.3%5.4%
3.0%
CUNY Start Math Start
CUNY Language Immersion Program
(CLIP)
0%
1%
2%
3%
4%
5%
6%
7%
2016-17 2017-18 2018-19 2019-20
CUNY Start Math Start Immersion Program
Measures ofSuccess
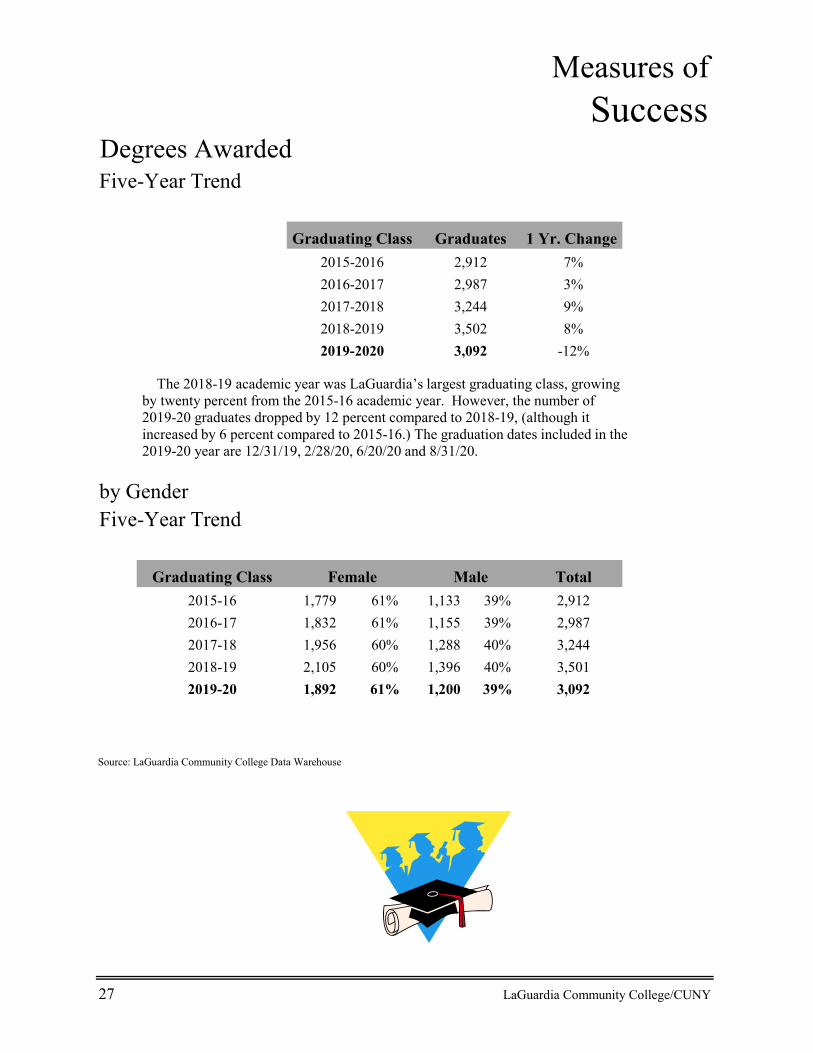
Degrees AwardedFive-Year Trend
1 Yr. Change 7%3%9%8%
-12%
by GenderFive-Year Trend
Graduating Class Total2015-16 1,779 61% 1,133 39% 2,9122016-17 1,832 61% 1,155 39% 2,9872017-18 1,956 60% 1,288 40% 3,2442018-19 2,105 60% 1,396 40% 3,5012019-20 1,892 61% 1,200 39% 3,092
Source: LaGuardia Community College Data Warehouse
27 LaGuardia Community College/CUNY
Graduating Class2015-2016
Graduates2,9122,987
2019-2020
Female
3,5023,092
Male
3,2442016-20172017-20182018-2019
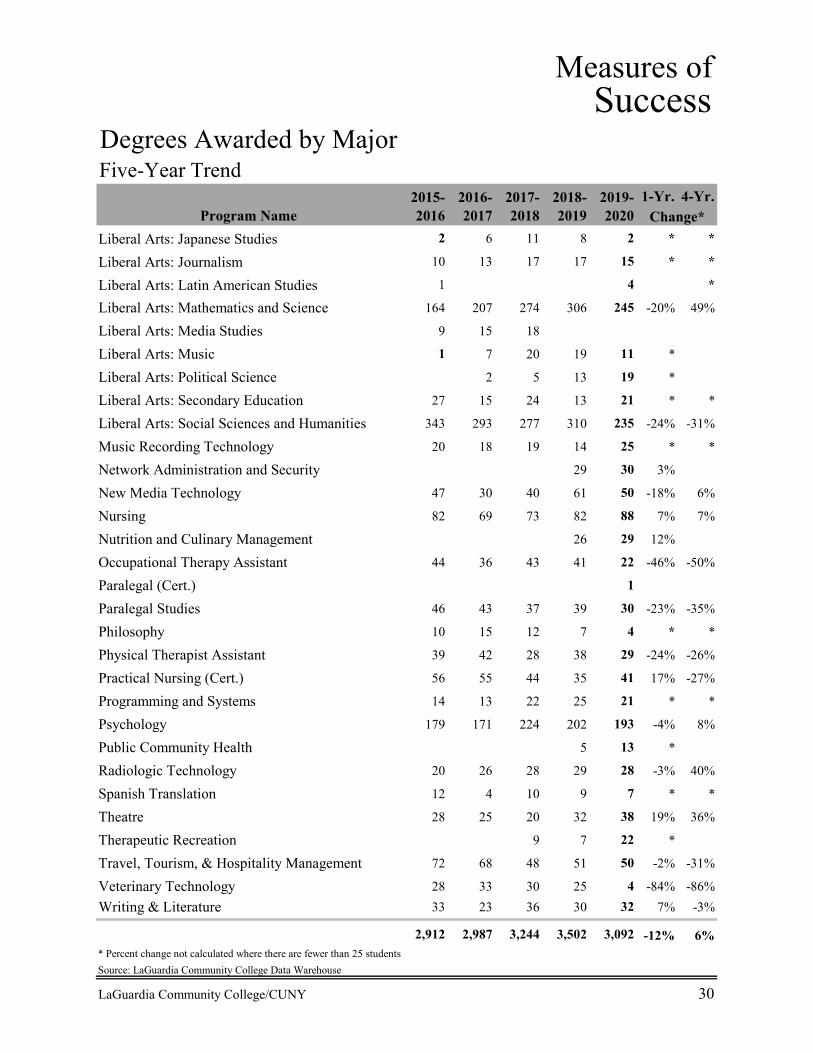
The 2018-19 academic year was LaGuardia’s largest graduating class, growing by twenty percent from the 2015-16 academic year. However, the number of 2019-20 graduates dropped by 12 percent compared to 2018-19, (although it increased by 6 percent compared to 2015-16.) The graduation dates included in the 2019-20 year are 12/31/19, 2/28/20, 6/20/20 and 8/31/20.

Measures ofSuccess
Degrees Awardedby Degree TypeFive-Year Trend
A.A. 962 33% 968 32% 1032 32% 1052 30% 932 30%A.S. 1,349 46% 1,467 49% 1,686 52% 1,877 54% 1,640 53%A.A.S. 544 19% 496 17% 481 15% 536 15% 478 15%Certificate 57 2% 56 2% 45 1% 37 1% 42 1%
Total 2,912 2,987 3,244
Source: LaGuardia Community College Data Warehouse
LaGuardia Community College/CUNY 28
3,092
Degrees Awarded 2018-19
3,502
2015-16 2016-17 2017-18 2019-20
0%
10%
20%
30%
40%
50%
2015-16 2016-17 2017-18 2018-19 2019-20
Associate in Applied Sciences Associate in Science Associate in Arts Certificate
The proportion of A.S. degrees conferred reached their highest level in 2018-19 (8 percentage point increase from 2015-16), but in 2019-20 it dropped from 54% to 53%. The increase is due in part to efforts to promote enrollment in Science, Technology, Engineering and Math majors (STEM). The proportion of A.A.S. degrees remained the same for the past three years,while the proportions of A.A. declined by 2 percentage point compared to 2016-17 and 2017-18.
Measures ofSuccess
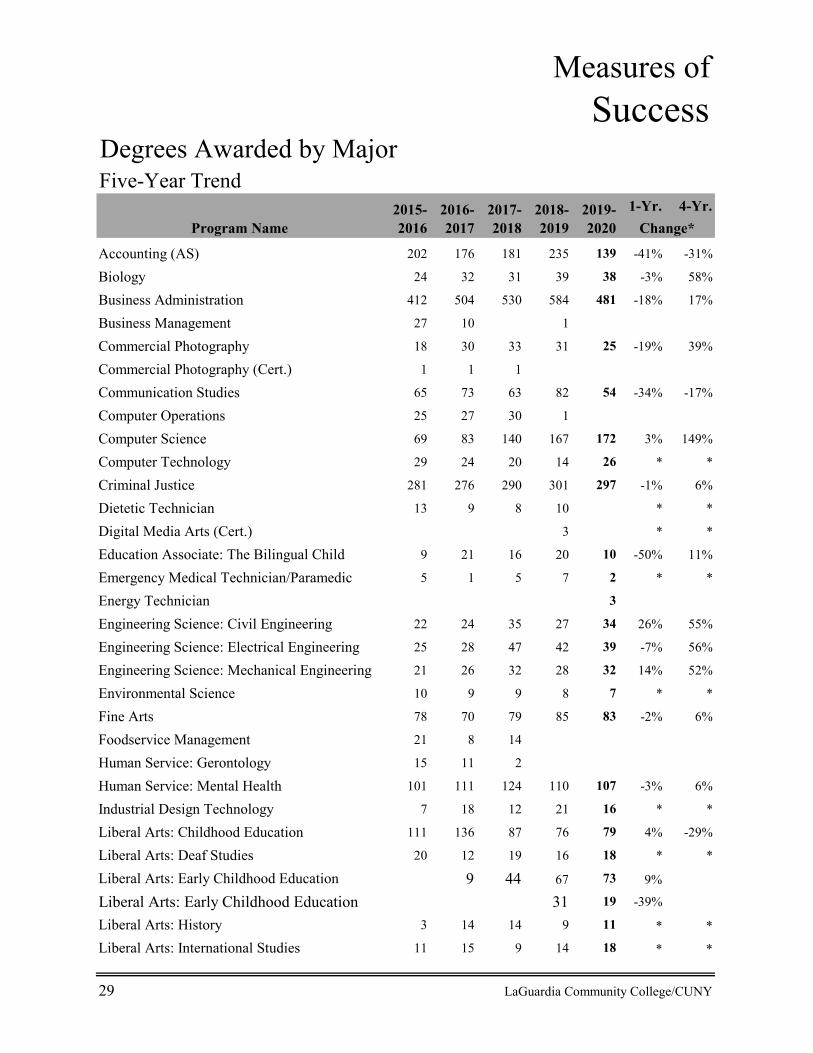
Degrees Awarded by MajorFive-Year Trend
1-Yr. 4-Yr.
Accounting (AS) 202 176 181 235 139 -41% -31%
Biology 24 32 31 39 38 -3% 58%
Business Administration 412 504 530 584 481 -18% 17%
Business Management 27 10 1
Commercial Photography 18 30 33 31 25 -19% 39%
Commercial Photography (Cert.) 1 1 1
Communication Studies 65 73 63 82 54 -34% -17%
Computer Operations 25 27 30 1
Computer Science 69 83 140 167 172 3% 149%
Computer Technology 29 24 20 14 26 * *
Criminal Justice 281 276 290 301 297 -1% 6%
Dietetic Technician 13 9 8 10 * *
Digital Media Arts (Cert.) 3 * *
Education Associate: The Bilingual Child 9 21 16 20 10 -50% 11%
Emergency Medical Technician/Paramedic 5 1 5 7 2 * *
Energy Technician 3
Engineering Science: Civil Engineering 22 24 35 27 34 26% 55%
Engineering Science: Electrical Engineering 25 28 47 42 39 -7% 56%
Engineering Science: Mechanical Engineering 21 26 32 28 32 14% 52%
Environmental Science 10 9 9 8 7 * *
Fine Arts 78 70 79 85 83 -2% 6%
Foodservice Management 21 8 14
Human Service: Gerontology 15 11 2
Human Service: Mental Health 101 111 124 110 107 -3% 6%
Industrial Design Technology 7 18 12 21 16 * *
Liberal Arts: Childhood Education 111 136 87 76 79 4% -29%
Liberal Arts: Deaf Studies 20 12 19 16 18 * *
Liberal Arts: Early Childhood Education 9 44 67 73 9%
Liberal Arts: Early Childhood Education 31 19 -39%
Liberal Arts: History 3 14 14 9 11 * *
Liberal Arts: International Studies 11 15 9 14 18 * *
29 LaGuardia Community College/CUNY
Change*Program Name2018-2019
2017-2018
2016-2017
2015-2016
2019-2020
Measures ofSuccess
Degrees Awarded by MajorFive-Year Trend
1-Yr. 4-Yr.
Liberal Arts: Japanese Studies 2 6 11 8 2 * *
Liberal Arts: Journalism 10 13 17 17 15 * *
Liberal Arts: Latin American Studies 1 4 *
Liberal Arts: Mathematics and Science 164 207 274 306 245 -20% 49%
Liberal Arts: Media Studies 9 15 18
Liberal Arts: Music 1 7 20 19 11 *
Liberal Arts: Political Science 2 5 13 19 *
Liberal Arts: Secondary Education 27 15 24 13 21 * *
Liberal Arts: Social Sciences and Humanities 343 293 277 310 235 -24% -31%
Music Recording Technology 20 18 19 14 25 * *
Network Administration and Security 29 30 3%
New Media Technology 47 30 40 61 50 -18% 6%
Nursing 82 69 73 82 88 7% 7%
Nutrition and Culinary Management 26 29 12%
Occupational Therapy Assistant 44 36 43 41 22 -46% -50%
Paralegal (Cert.) 1
Paralegal Studies 46 43 37 39 30 -23% -35%
Philosophy 10 15 12 7 4 * *
Physical Therapist Assistant 39 42 28 38 29 -24% -26%
Practical Nursing (Cert.) 56 55 44 35 41 17% -27%
Programming and Systems 14 13 22 25 21 * *
Psychology 179 171 224 202 193 -4% 8%
Public Community Health 5 13 *
Radiologic Technology 20 26 28 29 28 -3% 40%
Spanish Translation 12 4 10 9 7 * *
Theatre 28 25 20 32 38 19% 36%
Therapeutic Recreation 9 7 22 *
Travel, Tourism, & Hospitality Management 72 68 48 51 50 -2% -31%
Veterinary Technology 28 33 30 25 4 -84% -86%Writing & Literature 33 23 36 30 32 7% -3%
2,912 2,987 3,244 3,502 3,092 -12% 6%* Percent change not calculated where there are fewer than 25 studentsSource: LaGuardia Community College Data Warehouse
LaGuardia Community College/CUNY 30
Program Name Change*2015-2016
2016-2017
2017-2018
2018-2019
2019-2020
Measures ofSuccess
Degrees Awardedby Race and Ethnic Origin
* Not-reported and unknown race and identity individuals are not included in the results.
Source: LaGuardia Community College Data Warehouse
31 LaGuardia Community College/CUNY
0%
10%
20%
30%
40%
50%
Asian Black Hispanic White Native//Unknown
Comparative Racial and Ethnic Distribution
2019-20 GradsFall 2020 Enrolled
0%
10%
20%
30%
40%
50%
Asian Black Hispanic White Native/Unknown
2015-162016-172017-182018-192019-20
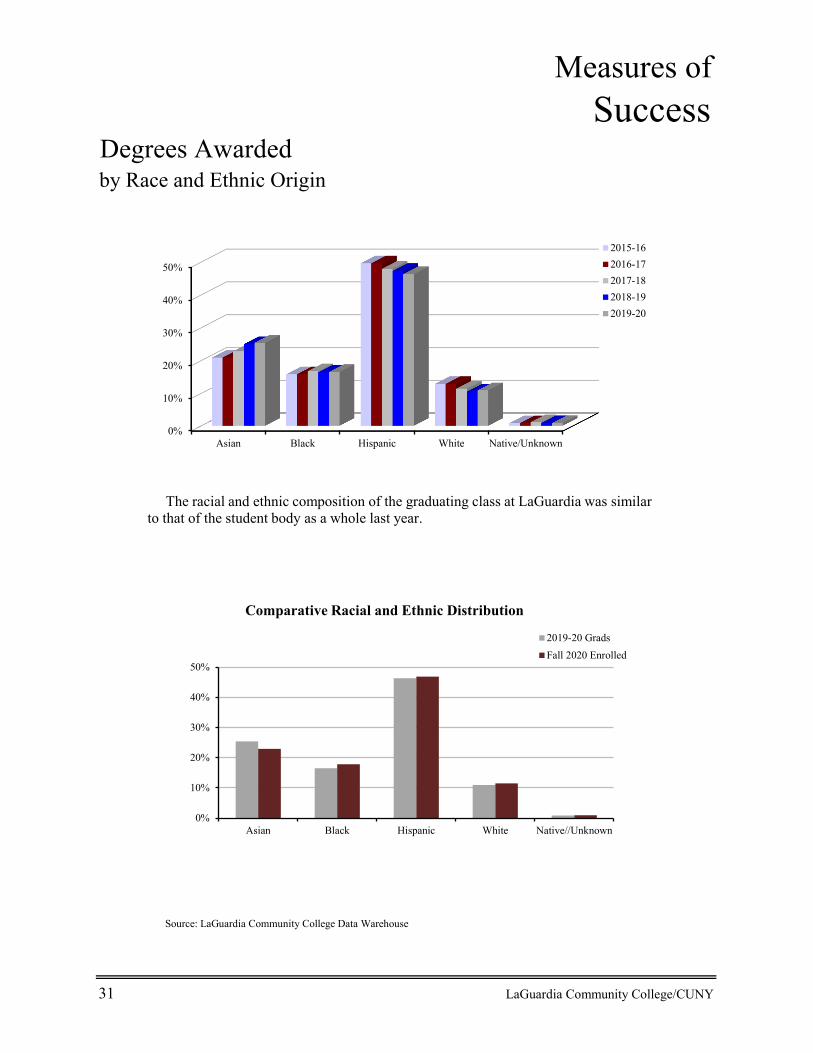
The racial and ethnic composition of the graduating class at LaGuardia was similar to that of the student body as a whole last year.
Measures ofSuccess
Degrees Awardedby Entering Basic Skills StatusFive-Year Trend
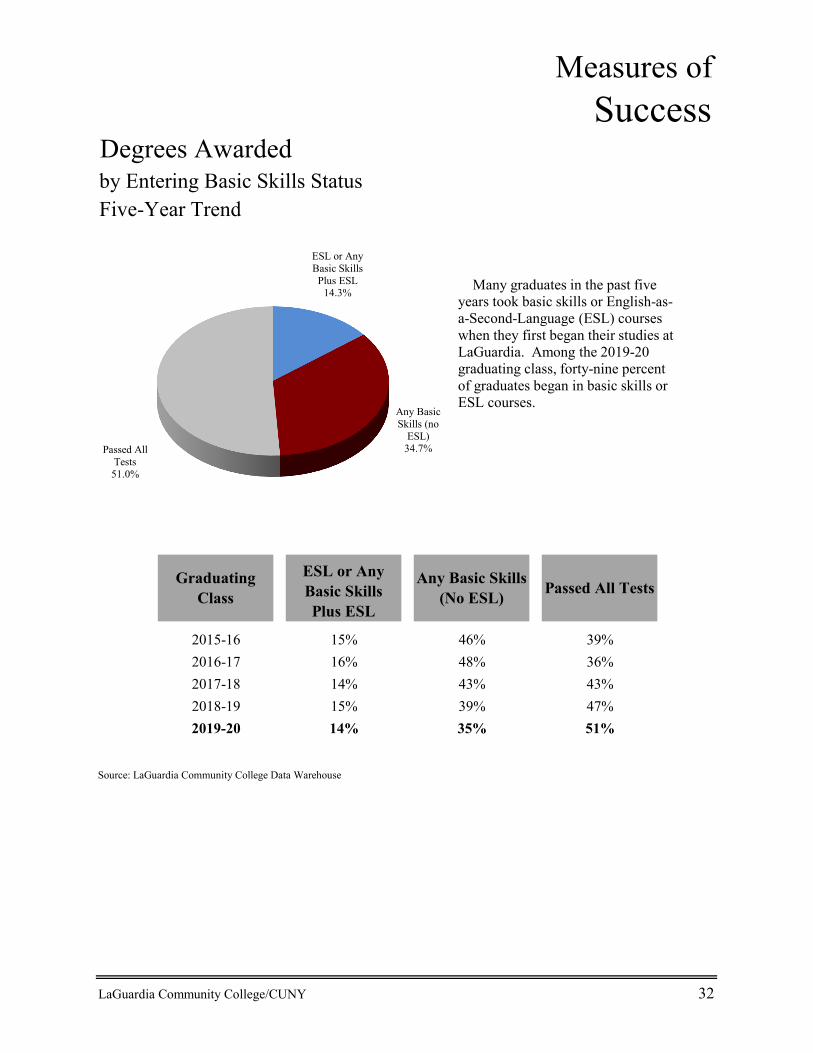
2015-16 15% 46% 39%2016-17 16% 48% 36%2017-18 14% 43% 43%2018-19 15% 39% 47%2019-20 14% 35% 51%
Source: LaGuardia Community College Data Warehouse
LaGuardia Community College/CUNY 32
ESL or Any Basic Skills Plus ESL
Any Basic Skills (No ESL)
Graduating Class Passed All Tests
ESL or Any Basic Skills
Plus ESL14.3%
Any Basic Skills (no
ESL)34.7%Passed All
Tests51.0%
Many graduates in the past five years took basic skills or English-as-a-Second-Language (ESL) courses when they first began their studies at LaGuardia. Among the 2019-20 graduating class, forty-nine percent of graduates began in basic skills or ESL courses.
Measures ofSuccess
Time to DegreeFive-Year Trend2015-16 to 2019-20
2015-16 2016-17 2017-18 2018-19 2019-20
7.3 7.5 7.9 7.5 7.3
6.1 6.1 6.0 5.8 5.8
Source: LaGuardia Community College Data Warehouse
33 LaGuardia Community College/CUNY
Average Active Semesters Enrolled
Average Calendar Semesters Enrolled
Graduating Class
0.0 2.0 4.0 6.0 8.0
2015-16
2016-17
2017-18
2018-19
2019-20
Gra
duat
ing
Cla
sses
Average ActiveSemesters EnrolledAverage CalendarSemesters Enrolled
Semesters
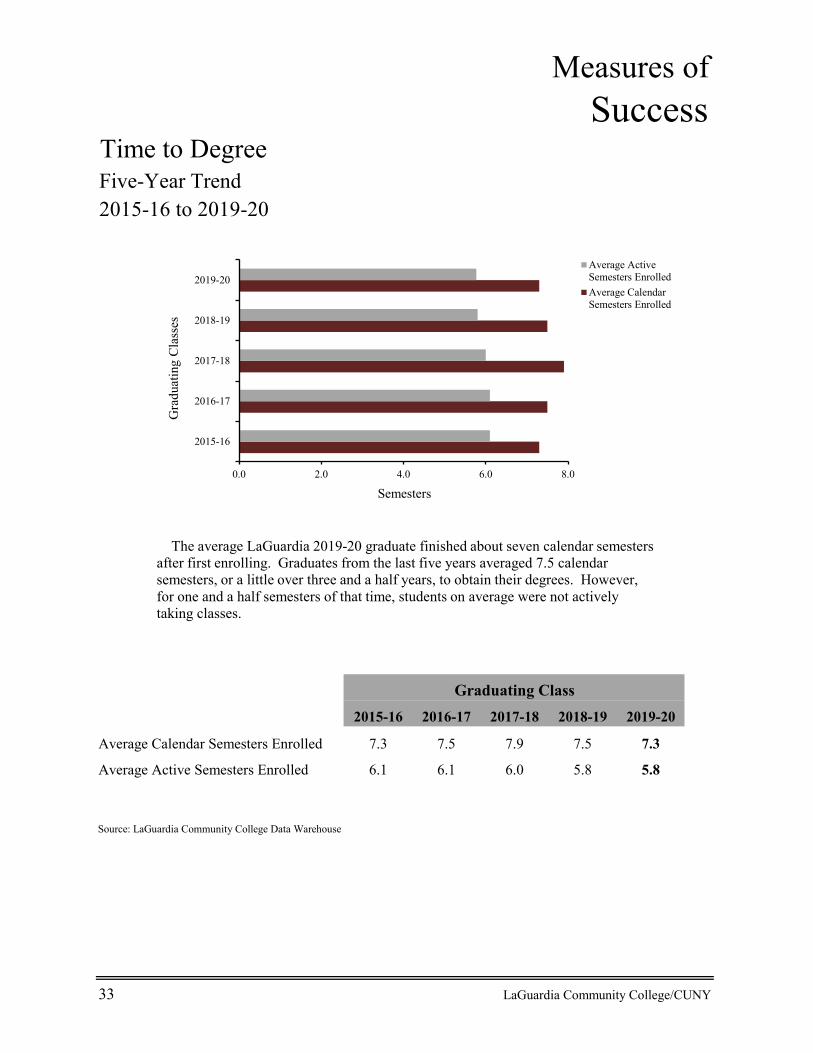
The average LaGuardia 2019-20 graduate finished about seven calendar semesters after first enrolling. Graduates from the last five years averaged 7.5 calendar semesters, or a little over three and a half years, to obtain their degrees. However, for one and a half semesters of that time, students on average were not actively taking classes.
Measures ofSuccess
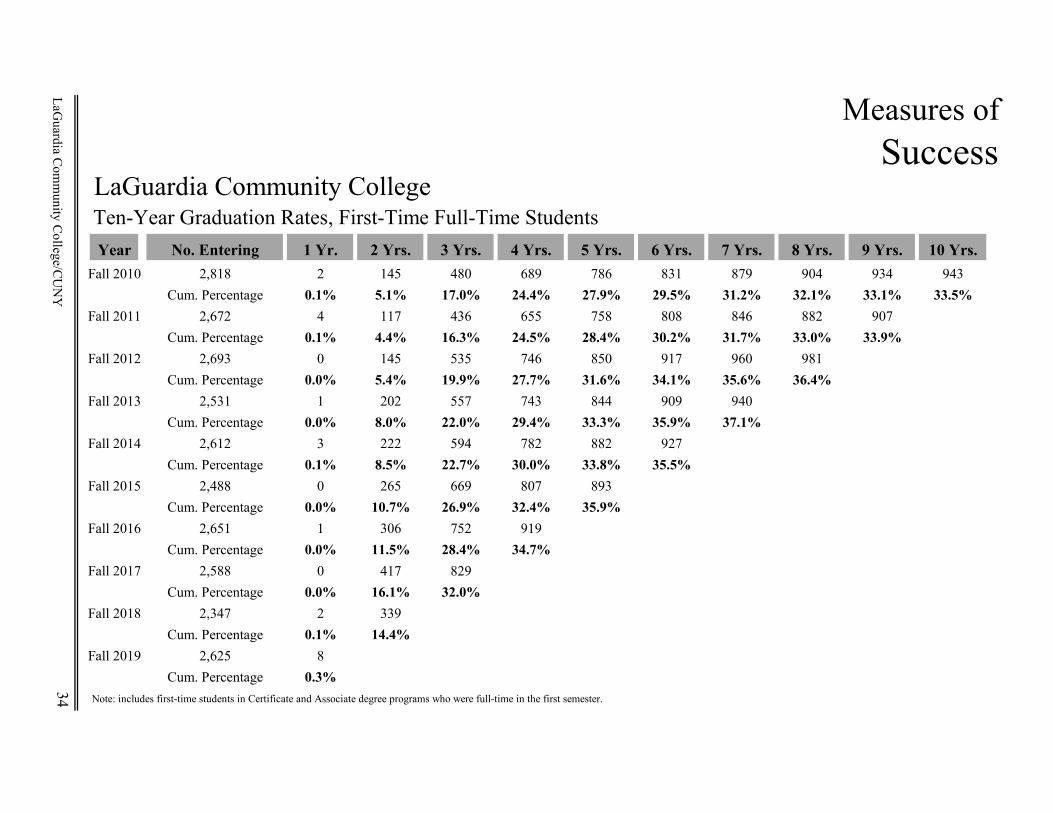
LaGuardia Community CollegeTen-Year Graduation Rates, First-Time Full-Time Students Year No. Entering 1 Yr. 2 Yrs. 3 Yrs. 4 Yrs. 5 Yrs. 6 Yrs. 7 Yrs. 8 Yrs. 9 Yrs. 10 Yrs.
Fall 2010 2,818 2 145 480 689 786 831 879 904 934 943Cum. Percentage 0.1% 5.1% 17.0% 24.4% 27.9% 29.5% 31.2% 32.1% 33.1% 33.5%
Fall 2011 2,672 4 117 436 655 758 808 846 882 907Cum. Percentage 0.1% 4.4% 16.3% 24.5% 28.4% 30.2% 31.7% 33.0% 33.9%
Fall 2012 2,693 0 145 535 746 850 917 960 981Cum. Percentage 0.0% 5.4% 19.9% 27.7% 31.6% 34.1% 35.6% 36.4%
Fall 2013 2,531 1 202 557 743 844 909 940Cum. Percentage 0.0% 8.0% 22.0% 29.4% 33.3% 35.9% 37.1%
Fall 2014 2,612 3 222 594 782 882 927Cum. Percentage 0.1% 8.5% 22.7% 30.0% 33.8% 35.5%
Fall 2015 2,488 0 265 669 807 893Cum. Percentage 0.0% 10.7% 26.9% 32.4% 35.9%
Fall 2016 2,651 1 306 752 919Cum. Percentage 0.0% 11.5% 28.4% 34.7%
Fall 2017 2,588 0 417 829Cum. Percentage 0.0% 16.1% 32.0%
Fall 2018 2,347 2 339Cum. Percentage 0.1% 14.4%
Fall 2019 2,625 8Cum. Percentage 0.3%
Note: includes first-time students in Certificate and Associate degree programs who were full-time in the first semester.
LaGuardia C
omm
unity College/C
UN
Y34
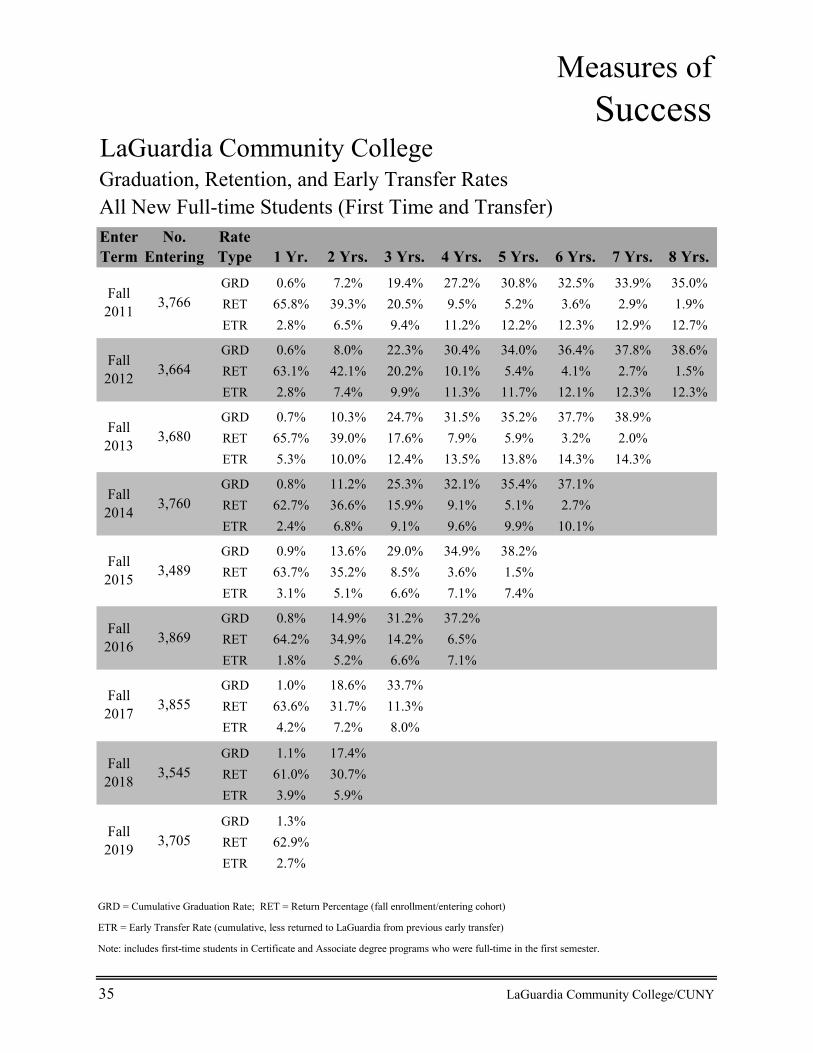
Measures ofSuccess
LaGuardia Community CollegeGraduation, Retention, and Early Transfer Rates All New Full-time Students (First Time and Transfer)Enter Term
No. Entering
Rate Type 1 Yr. 2 Yrs. 3 Yrs. 4 Yrs. 5 Yrs. 6 Yrs. 7 Yrs. 8 Yrs.GRD 0.6% 7.2% 19.4% 27.2% 30.8% 32.5% 33.9% 35.0%RET 65.8% 39.3% 20.5% 9.5% 5.2% 3.6% 2.9% 1.9%ETR 2.8% 6.5% 9.4% 11.2% 12.2% 12.3% 12.9% 12.7%
GRD 0.6% 8.0% 22.3% 30.4% 34.0% 36.4% 37.8% 38.6%RET 63.1% 42.1% 20.2% 10.1% 5.4% 4.1% 2.7% 1.5%ETR 2.8% 7.4% 9.9% 11.3% 11.7% 12.1% 12.3% 12.3%
GRD 0.7% 10.3% 24.7% 31.5% 35.2% 37.7% 38.9%RET 65.7% 39.0% 17.6% 7.9% 5.9% 3.2% 2.0%ETR 5.3% 10.0% 12.4% 13.5% 13.8% 14.3% 14.3%
GRD 0.8% 11.2% 25.3% 32.1% 35.4% 37.1%RET 62.7% 36.6% 15.9% 9.1% 5.1% 2.7%ETR 2.4% 6.8% 9.1% 9.6% 9.9% 10.1%
GRD 0.9% 13.6% 29.0% 34.9% 38.2%RET 63.7% 35.2% 8.5% 3.6% 1.5%ETR 3.1% 5.1% 6.6% 7.1% 7.4%
GRD 0.8% 14.9% 31.2% 37.2%RET 64.2% 34.9% 14.2% 6.5%ETR 1.8% 5.2% 6.6% 7.1%
GRD 1.0% 18.6% 33.7%RET 63.6% 31.7% 11.3%ETR 4.2% 7.2% 8.0%
GRD 1.1% 17.4%RET 61.0% 30.7%ETR 3.9% 5.9%
GRD 1.3%RET 62.9%ETR 2.7%
GRD = Cumulative Graduation Rate; RET = Return Percentage (fall enrollment/entering cohort)
ETR = Early Transfer Rate (cumulative, less returned to LaGuardia from previous early transfer)
Note: includes first-time students in Certificate and Associate degree programs who were full-time in the first semester.
35 LaGuardia Community College/CUNY
Fall 2017
Fall 2015 3,489
3,869
3,855
3,766Fall 2011
Fall 2012 3,664
3,680
Fall 2019 3,705
Fall 2018 3,545
Fall 2016
Fall 2014
Fall 2013
3,760
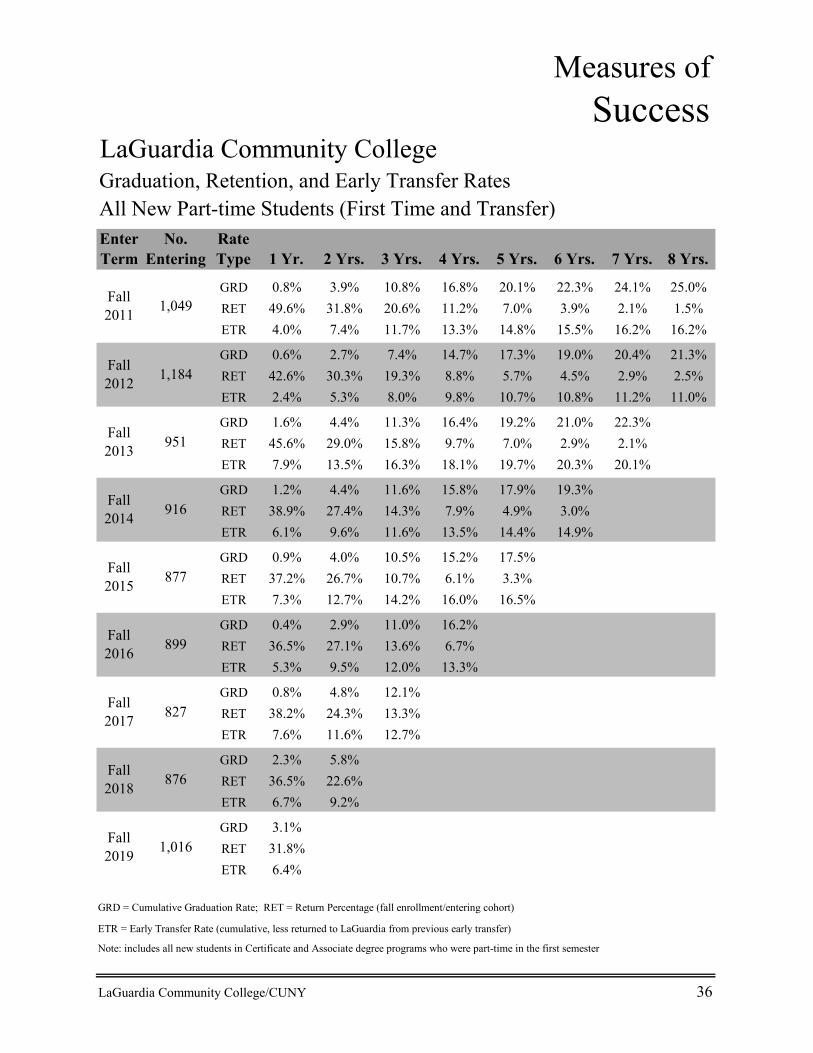
Measures ofSuccess
LaGuardia Community CollegeGraduation, Retention, and Early Transfer Rates All New Part-time Students (First Time and Transfer)Enter Term
No. Entering
Rate Type 1 Yr. 2 Yrs. 3 Yrs. 4 Yrs. 5 Yrs. 6 Yrs. 7 Yrs. 8 Yrs.
GRD 0.8% 3.9% 10.8% 16.8% 20.1% 22.3% 24.1% 25.0%RET 49.6% 31.8% 20.6% 11.2% 7.0% 3.9% 2.1% 1.5%ETR 4.0% 7.4% 11.7% 13.3% 14.8% 15.5% 16.2% 16.2%
GRD 0.6% 2.7% 7.4% 14.7% 17.3% 19.0% 20.4% 21.3%RET 42.6% 30.3% 19.3% 8.8% 5.7% 4.5% 2.9% 2.5%ETR 2.4% 5.3% 8.0% 9.8% 10.7% 10.8% 11.2% 11.0%
GRD 1.6% 4.4% 11.3% 16.4% 19.2% 21.0% 22.3%RET 45.6% 29.0% 15.8% 9.7% 7.0% 2.9% 2.1%ETR 7.9% 13.5% 16.3% 18.1% 19.7% 20.3% 20.1%
GRD 1.2% 4.4% 11.6% 15.8% 17.9% 19.3%RET 38.9% 27.4% 14.3% 7.9% 4.9% 3.0%ETR 6.1% 9.6% 11.6% 13.5% 14.4% 14.9%
GRD 0.9% 4.0% 10.5% 15.2% 17.5%RET 37.2% 26.7% 10.7% 6.1% 3.3%ETR 7.3% 12.7% 14.2% 16.0% 16.5%
GRD 0.4% 2.9% 11.0% 16.2%RET 36.5% 27.1% 13.6% 6.7%ETR 5.3% 9.5% 12.0% 13.3%
GRD 0.8% 4.8% 12.1%RET 38.2% 24.3% 13.3%ETR 7.6% 11.6% 12.7%
GRD 2.3% 5.8%RET 36.5% 22.6%ETR 6.7% 9.2%
GRD 3.1%RET 31.8%ETR 6.4%
GRD = Cumulative Graduation Rate; RET = Return Percentage (fall enrollment/entering cohort)
ETR = Early Transfer Rate (cumulative, less returned to LaGuardia from previous early transfer)
Note: includes all new students in Certificate and Associate degree programs who were part-time in the first semester
LaGuardia Community College/CUNY 36
Fall 2014
876
Fall 2016 899
Fall 2017 827
Fall 2018
916
Fall 2019 1,016
1,049Fall 2011
Fall 2015 877
Fall 2012 1,184
Fall 2013 951
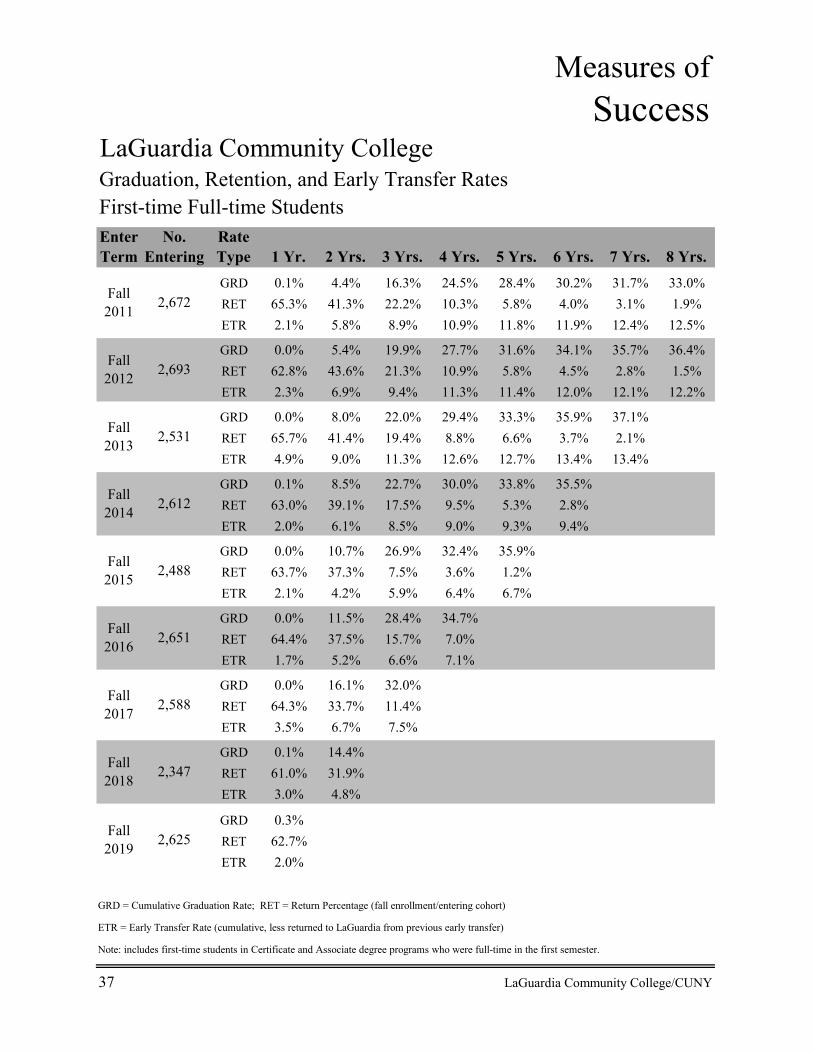
Measures ofSuccess
LaGuardia Community CollegeGraduation, Retention, and Early Transfer Rates First-time Full-time Students Enter Term
No. Entering
Rate Type 1 Yr. 2 Yrs. 3 Yrs. 4 Yrs. 5 Yrs. 6 Yrs. 7 Yrs. 8 Yrs.GRD 0.1% 4.4% 16.3% 24.5% 28.4% 30.2% 31.7% 33.0%RET 65.3% 41.3% 22.2% 10.3% 5.8% 4.0% 3.1% 1.9%ETR 2.1% 5.8% 8.9% 10.9% 11.8% 11.9% 12.4% 12.5%
GRD 0.0% 5.4% 19.9% 27.7% 31.6% 34.1% 35.7% 36.4%RET 62.8% 43.6% 21.3% 10.9% 5.8% 4.5% 2.8% 1.5%ETR 2.3% 6.9% 9.4% 11.3% 11.4% 12.0% 12.1% 12.2%
GRD 0.0% 8.0% 22.0% 29.4% 33.3% 35.9% 37.1%RET 65.7% 41.4% 19.4% 8.8% 6.6% 3.7% 2.1%ETR 4.9% 9.0% 11.3% 12.6% 12.7% 13.4% 13.4%
GRD 0.1% 8.5% 22.7% 30.0% 33.8% 35.5%RET 63.0% 39.1% 17.5% 9.5% 5.3% 2.8%ETR 2.0% 6.1% 8.5% 9.0% 9.3% 9.4%
GRD 0.0% 10.7% 26.9% 32.4% 35.9%RET 63.7% 37.3% 7.5% 3.6% 1.2%ETR 2.1% 4.2% 5.9% 6.4% 6.7%
GRD 0.0% 11.5% 28.4% 34.7%RET 64.4% 37.5% 15.7% 7.0%ETR 1.7% 5.2% 6.6% 7.1%
GRD 0.0% 16.1% 32.0%RET 64.3% 33.7% 11.4%ETR 3.5% 6.7% 7.5%
GRD 0.1% 14.4%RET 61.0% 31.9%ETR 3.0% 4.8%
GRD 0.3%RET 62.7%ETR 2.0%
GRD = Cumulative Graduation Rate; RET = Return Percentage (fall enrollment/entering cohort)
ETR = Early Transfer Rate (cumulative, less returned to LaGuardia from previous early transfer)
Note: includes first-time students in Certificate and Associate degree programs who were full-time in the first semester.
37 LaGuardia Community College/CUNY
Fall 2019 2,625
2,672
Fall 2014
2,488
Fall 2011
Fall 2012
Fall 2013
2,612
Fall 2018
2,693
2,531
2,347
2,651
2,588
Fall 2016
Fall 2017
Fall 2015
Measures ofSuccess
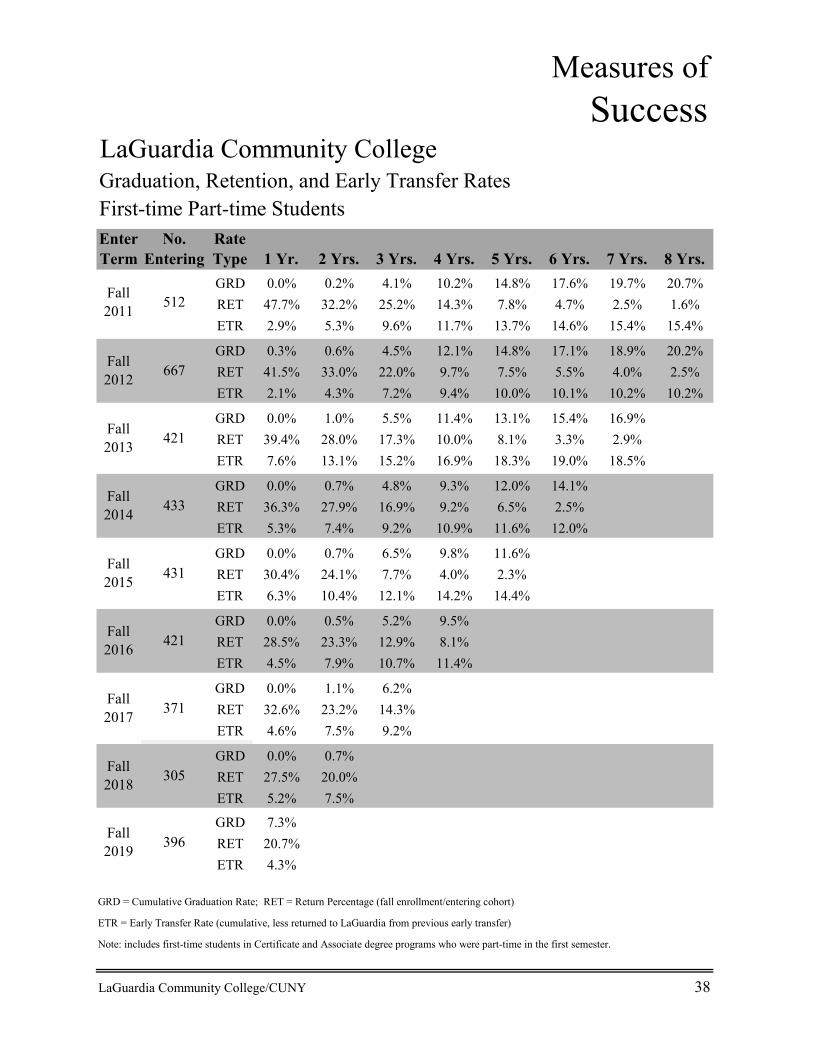
LaGuardia Community CollegeGraduation, Retention, and Early Transfer Rates First-time Part-time Students Enter Term
No. Entering
Rate Type 1 Yr. 2 Yrs. 3 Yrs. 4 Yrs. 5 Yrs. 6 Yrs. 7 Yrs. 8 Yrs.GRD 0.0% 0.2% 4.1% 10.2% 14.8% 17.6% 19.7% 20.7%RET 47.7% 32.2% 25.2% 14.3% 7.8% 4.7% 2.5% 1.6%ETR 2.9% 5.3% 9.6% 11.7% 13.7% 14.6% 15.4% 15.4%
GRD 0.3% 0.6% 4.5% 12.1% 14.8% 17.1% 18.9% 20.2%RET 41.5% 33.0% 22.0% 9.7% 7.5% 5.5% 4.0% 2.5%ETR 2.1% 4.3% 7.2% 9.4% 10.0% 10.1% 10.2% 10.2%
GRD 0.0% 1.0% 5.5% 11.4% 13.1% 15.4% 16.9%RET 39.4% 28.0% 17.3% 10.0% 8.1% 3.3% 2.9%ETR 7.6% 13.1% 15.2% 16.9% 18.3% 19.0% 18.5%
GRD 0.0% 0.7% 4.8% 9.3% 12.0% 14.1%RET 36.3% 27.9% 16.9% 9.2% 6.5% 2.5%ETR 5.3% 7.4% 9.2% 10.9% 11.6% 12.0%
GRD 0.0% 0.7% 6.5% 9.8% 11.6%RET 30.4% 24.1% 7.7% 4.0% 2.3%ETR 6.3% 10.4% 12.1% 14.2% 14.4%
GRD 0.0% 0.5% 5.2% 9.5%RET 28.5% 23.3% 12.9% 8.1%ETR 4.5% 7.9% 10.7% 11.4%
GRD 0.0% 1.1% 6.2%RET 32.6% 23.2% 14.3%ETR 4.6% 7.5% 9.2%
GRD 0.0% 0.7%RET 27.5% 20.0%ETR 5.2% 7.5%
GRD 7.3%RET 20.7%ETR 4.3%
GRD = Cumulative Graduation Rate; RET = Return Percentage (fall enrollment/entering cohort)
ETR = Early Transfer Rate (cumulative, less returned to LaGuardia from previous early transfer)
Note: includes first-time students in Certificate and Associate degree programs who were part-time in the first semester.
LaGuardia Community College/CUNY 38
Fall 2019 396
667
Fall 2014
305
Fall 2016 421
Fall 2017 371
Fall 2018
512Fall 2011
Fall 2015 431
Fall 2012
Fall 2013 421
433

Measures ofSuccess
LaGuardia Community CollegeGraduation, Retention, and Early Transfer Rates Transfer Full-time Students Enter Term
No. Entering
Rate Type 1 Yr. 2 Yrs. 3 Yrs. 4 Yrs. 5 Yrs. 6 Yrs. 7 Yrs. 8 Yrs.GRD 1.7% 14.3% 27.1% 33.6% 36.7% 37.9% 39.2% 39.8%RET 67.0% 34.5% 16.3% 7.5% 3.8% 2.4% 2.2% 1.6%ETR 4.4% 8.2% 10.5% 12.1% 13.2% 13.3% 13.4% 13.4%
GRD 2.4% 15.3% 29.1% 38.0% 40.7% 42.7% 43.8% 44.5%RET 64.0% 37.9% 17.2% 7.9% 4.2% 3.2% 2.6% 1.4%ETR 4.0% 8.7% 11.1% 11.5% 12.3% 12.4% 12.9% 12.9%
GRD 2.0% 15.4% 30.5% 36.4% 39.4% 41.8% 42.6%RET 65.5% 33.6% 13.4% 6.0% 4.2% 2.2% 1.7%ETR 6.0% 12.4% 14.9% 15.5% 16.0% 16.5% 16.4%
GRD 2.4% 17.4% 31.1% 36.9% 39.1% 40.8%RET 62.1% 31.0% 12.2% 8.1% 4.7% 2.5%ETR 3.2% 8.4% 10.5% 10.7% 11.3% 11.6%
GRD 3.0% 20.9% 34.3% 41.2% 44.1%RET 63.7% 29.8% 11.0% 3.8% 2.0%ETR 5.6% 7.4% 8.3% 9.0% 9.1%
GRD 2.5% 22.2% 37.4% 42.7%RET 63.8% 29.4% 10.8% 5.4%ETR 2.1% 5.1% 6.4% 7.1%
GRD 3.0% 23.7% 37.2%RET 62.2% 27.5% 11.2%ETR 5.6% 8.1% 9.0%
GRD 3.2% 23.3%RET 61.1% 28.5%ETR 5.7% 8.1%
GRD 3.7%RET 63.5%ETR 4.4%
GRD = Cumulative Graduation Rate; RET = Return Percentage (fall enrollment/entering cohort)
ETR = Early Transfer Rate (cumulative, less returned to LaGuardia from previous early transfer)
Note: includes transfer students in Certificate and Associate degree programs who were full-time in the first semester.
39 LaGuardia Community College/CUNY
1,094Fall 2011
Fall 2015 1,001
Fall 2012 971
Fall 2013 1,149
Fall 2019 1,080
Fall 2014
Fall 2018 1,198
Fall 2016 1,218
Fall 2017 1,267
1,148
Measures ofSuccess
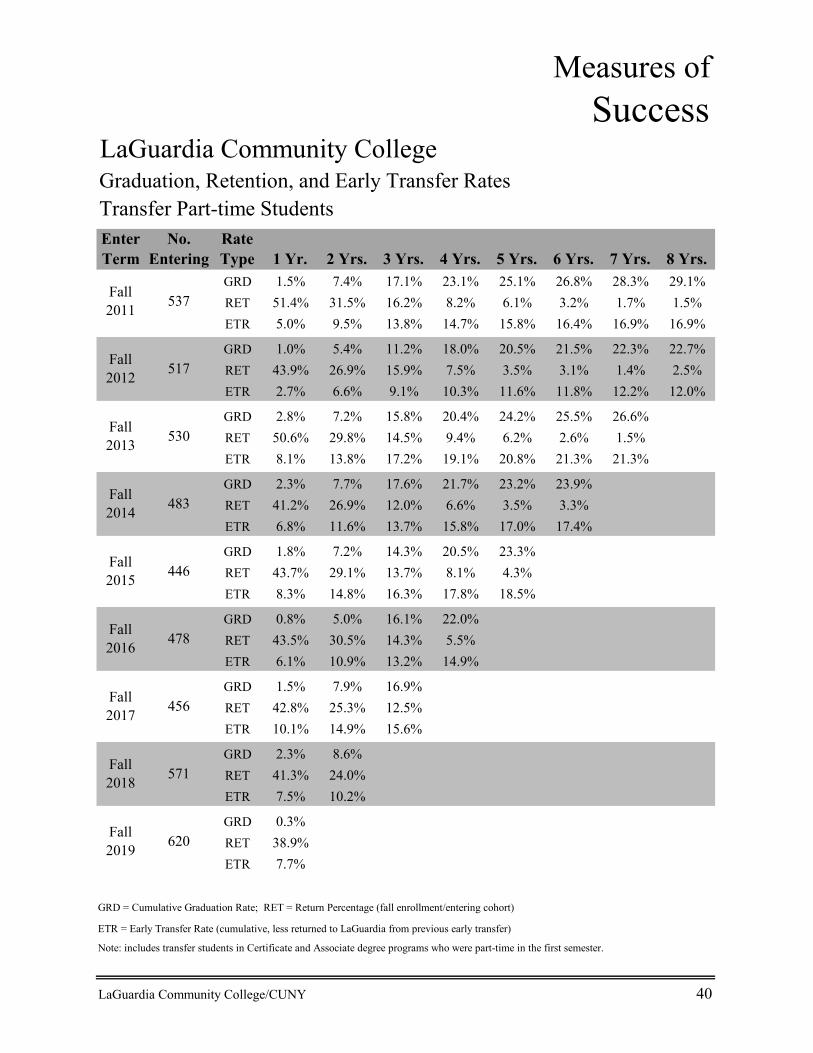
LaGuardia Community CollegeGraduation, Retention, and Early Transfer Rates Transfer Part-time Students Enter Term
No. Entering
Rate Type 1 Yr. 2 Yrs. 3 Yrs. 4 Yrs. 5 Yrs. 6 Yrs. 7 Yrs. 8 Yrs.GRD 1.5% 7.4% 17.1% 23.1% 25.1% 26.8% 28.3% 29.1%RET 51.4% 31.5% 16.2% 8.2% 6.1% 3.2% 1.7% 1.5%ETR 5.0% 9.5% 13.8% 14.7% 15.8% 16.4% 16.9% 16.9%
GRD 1.0% 5.4% 11.2% 18.0% 20.5% 21.5% 22.3% 22.7%RET 43.9% 26.9% 15.9% 7.5% 3.5% 3.1% 1.4% 2.5%ETR 2.7% 6.6% 9.1% 10.3% 11.6% 11.8% 12.2% 12.0%
GRD 2.8% 7.2% 15.8% 20.4% 24.2% 25.5% 26.6%RET 50.6% 29.8% 14.5% 9.4% 6.2% 2.6% 1.5%ETR 8.1% 13.8% 17.2% 19.1% 20.8% 21.3% 21.3%
GRD 2.3% 7.7% 17.6% 21.7% 23.2% 23.9%RET 41.2% 26.9% 12.0% 6.6% 3.5% 3.3%ETR 6.8% 11.6% 13.7% 15.8% 17.0% 17.4%
GRD 1.8% 7.2% 14.3% 20.5% 23.3%RET 43.7% 29.1% 13.7% 8.1% 4.3%ETR 8.3% 14.8% 16.3% 17.8% 18.5%
GRD 0.8% 5.0% 16.1% 22.0%RET 43.5% 30.5% 14.3% 5.5%ETR 6.1% 10.9% 13.2% 14.9%
GRD 1.5% 7.9% 16.9%RET 42.8% 25.3% 12.5%ETR 10.1% 14.9% 15.6%
GRD 2.3% 8.6%RET 41.3% 24.0%ETR 7.5% 10.2%
GRD 0.3%RET 38.9%ETR 7.7%
GRD = Cumulative Graduation Rate; RET = Return Percentage (fall enrollment/entering cohort)
ETR = Early Transfer Rate (cumulative, less returned to LaGuardia from previous early transfer)
Note: includes transfer students in Certificate and Associate degree programs who were part-time in the first semester.
LaGuardia Community College/CUNY 40
537Fall 2011
Fall 2015 446
Fall 2012 517
Fall 2013 530
Fall 2019 620
Fall 2014
Fall 2018 571
Fall 2016 478
Fall 2017 456
483
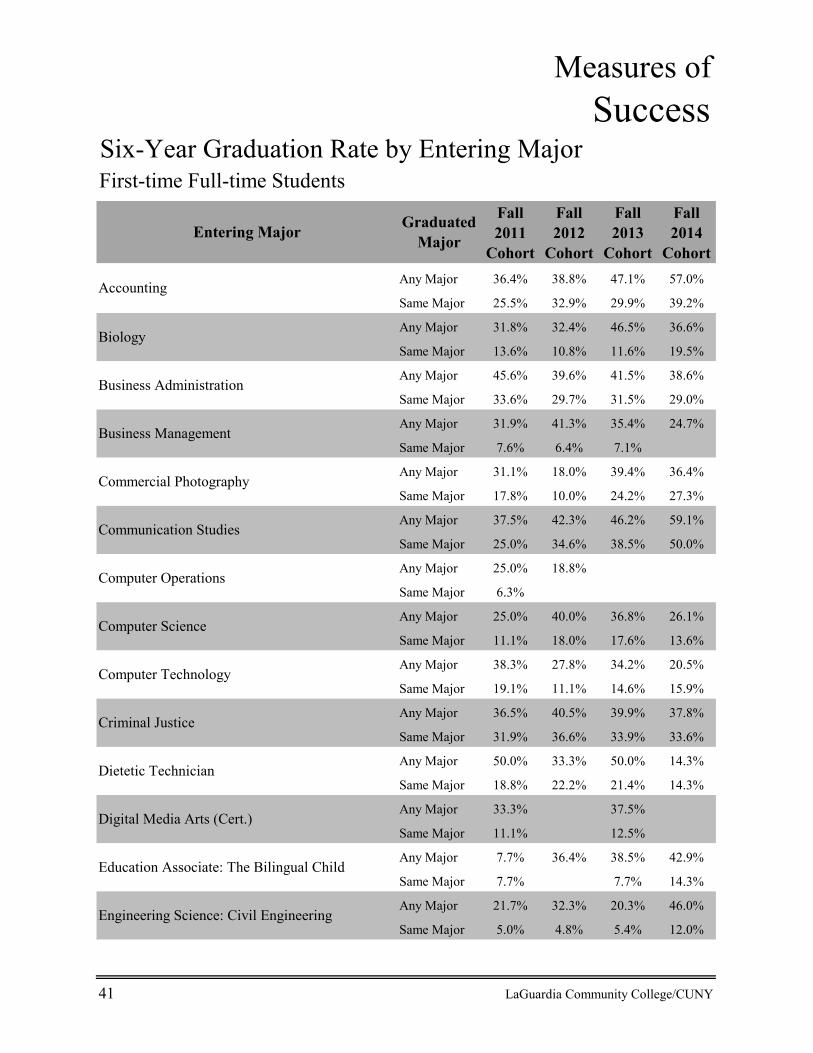
Measures ofSuccess
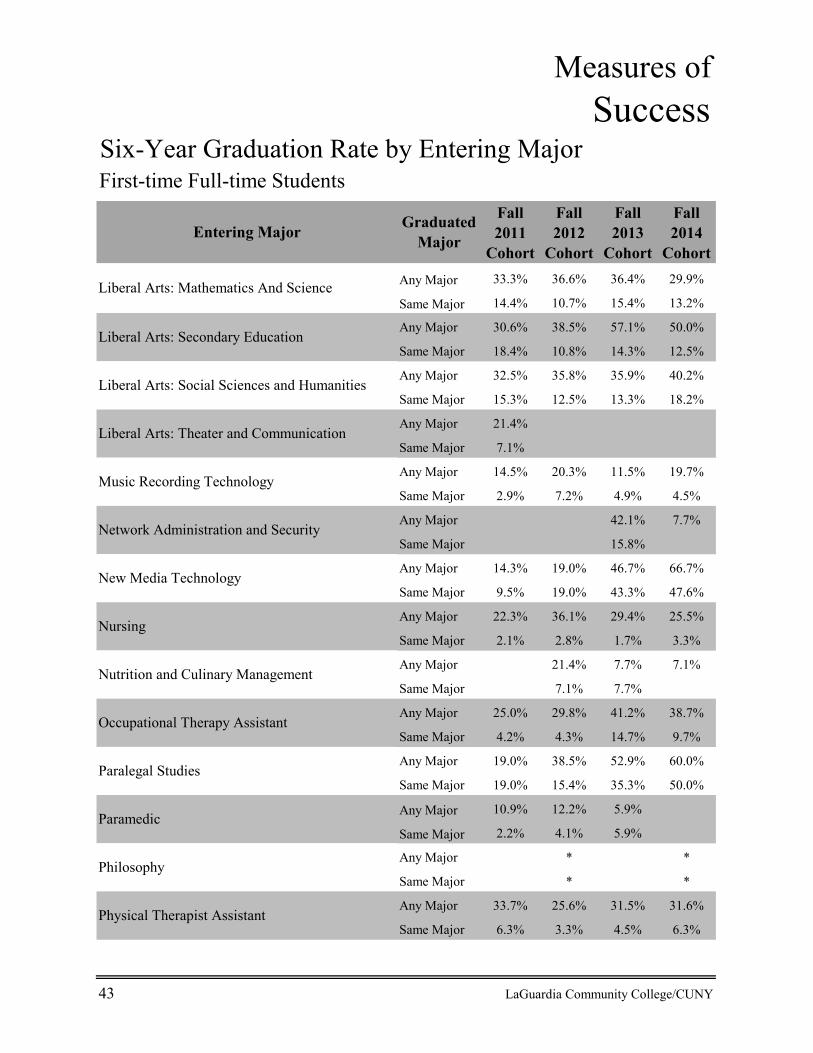
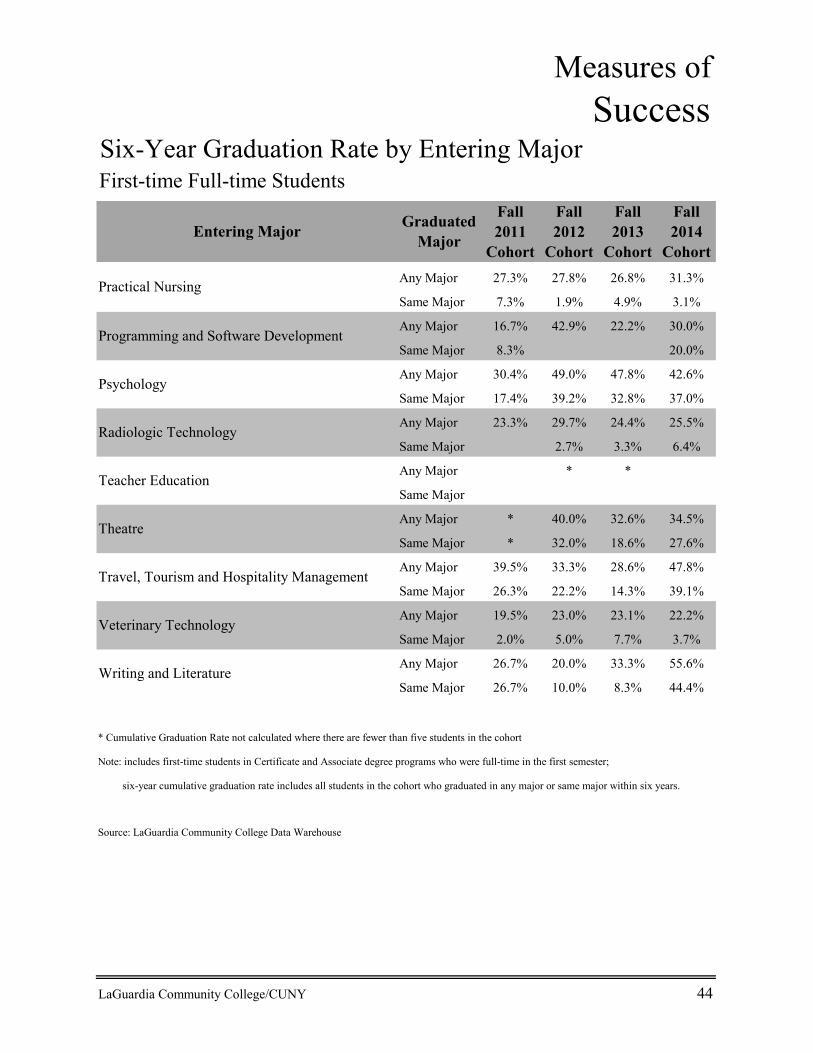
Six-Year Graduation Rate by Entering MajorFirst-time Full-time Students
Any Major 36.4% 38.8% 47.1% 57.0%
Same Major 25.5% 32.9% 29.9% 39.2%
Any Major 31.8% 32.4% 46.5% 36.6%
Same Major 13.6% 10.8% 11.6% 19.5%
Any Major 45.6% 39.6% 41.5% 38.6%
Same Major 33.6% 29.7% 31.5% 29.0%
Any Major 31.9% 41.3% 35.4% 24.7%
Same Major 7.6% 6.4% 7.1%
Any Major 31.1% 18.0% 39.4% 36.4%
Same Major 17.8% 10.0% 24.2% 27.3%
Any Major 37.5% 42.3% 46.2% 59.1%
Same Major 25.0% 34.6% 38.5% 50.0%
Any Major 25.0% 18.8%
Same Major 6.3%
Any Major 25.0% 40.0% 36.8% 26.1%
Same Major 11.1% 18.0% 17.6% 13.6%
Any Major 38.3% 27.8% 34.2% 20.5%
Same Major 19.1% 11.1% 14.6% 15.9%
Any Major 36.5% 40.5% 39.9% 37.8%
Same Major 31.9% 36.6% 33.9% 33.6%
Any Major 50.0% 33.3% 50.0% 14.3%
Same Major 18.8% 22.2% 21.4% 14.3%
Any Major 33.3% 37.5%
Same Major 11.1% 12.5%
Any Major 7.7% 36.4% 38.5% 42.9%
Same Major 7.7% 7.7% 14.3%
Any Major 21.7% 32.3% 20.3% 46.0%
Same Major 5.0% 4.8% 5.4% 12.0%
41 LaGuardia Community College/CUNY
Business Management
Commercial Photography
Engineering Science: Civil Engineering
Fall 2014
Cohort
Fall 2013
CohortEntering Major
Fall 2011
Cohort
Fall 2012
Cohort
Digital Media Arts (Cert.)
Graduated Major
Accounting
Biology
Business Administration
Education Associate: The Bilingual Child
Communication Studies
Computer Operations
Computer Science
Computer Technology
Criminal Justice
Dietetic Technician
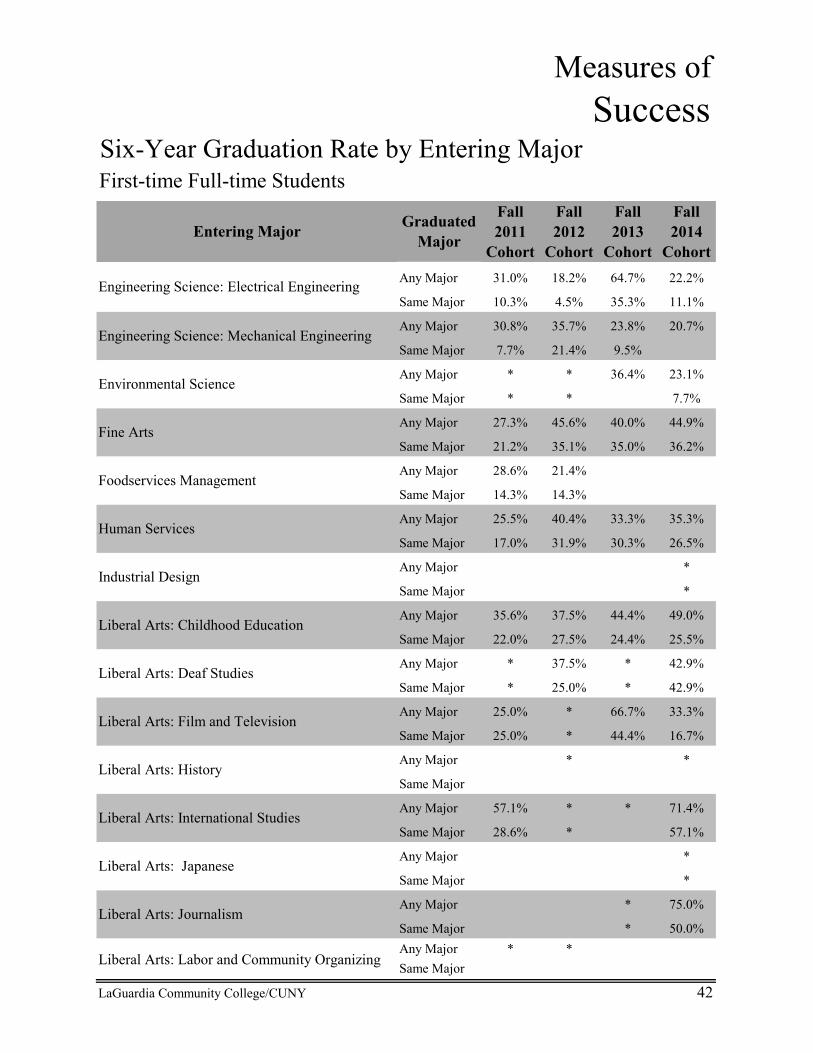
Measures ofSuccess
Six-Year Graduation Rate by Entering MajorFirst-time Full-time Students
Any Major 31.0% 18.2% 64.7% 22.2%
Same Major 10.3% 4.5% 35.3% 11.1%
Any Major 30.8% 35.7% 23.8% 20.7%
Same Major 7.7% 21.4% 9.5%
Any Major * * 36.4% 23.1%
Same Major * * 7.7%
Any Major 27.3% 45.6% 40.0% 44.9%
Same Major 21.2% 35.1% 35.0% 36.2%
Any Major 28.6% 21.4%
Same Major 14.3% 14.3%
Any Major 25.5% 40.4% 33.3% 35.3%
Same Major 17.0% 31.9% 30.3% 26.5%
Any Major *
Same Major *
Any Major 35.6% 37.5% 44.4% 49.0%
Same Major 22.0% 27.5% 24.4% 25.5%
Any Major * 37.5% * 42.9%
Same Major * 25.0% * 42.9%
Any Major 25.0% * 66.7% 33.3%
Same Major 25.0% * 44.4% 16.7%
Any Major * *
Same Major
Any Major 57.1% * * 71.4%
Same Major 28.6% * 57.1%
Any Major *
Same Major *
Any Major * 75.0%
Same Major * 50.0%Any Major * *Same Major
LaGuardia Community College/CUNY 42
Graduated Major
Liberal Arts: Deaf Studies
Engineering Science: Mechanical Engineering
Liberal Arts: History
Liberal Arts: Japanese
Liberal Arts: Journalism
Fall 2014
Cohort
Fall 2013
CohortEntering Major
Fall 2011
Cohort
Fall 2012
Cohort
Liberal Arts: Film and Television
Engineering Science: Electrical Engineering
Liberal Arts: Labor and Community Organizing
Environmental Science
Fine Arts
Foodservices Management
Human Services
Liberal Arts: International Studies
Industrial Design
Liberal Arts: Childhood Education
Measures ofSuccess
Six-Year Graduation Rate by Entering MajorFirst-time Full-time Students
Any Major 33.3% 36.6% 36.4% 29.9%
Same Major 14.4% 10.7% 15.4% 13.2%
Any Major 30.6% 38.5% 57.1% 50.0%
Same Major 18.4% 10.8% 14.3% 12.5%
Any Major 32.5% 35.8% 35.9% 40.2%
Same Major 15.3% 12.5% 13.3% 18.2%
Any Major 21.4%
Same Major 7.1%
Any Major 14.5% 20.3% 11.5% 19.7%
Same Major 2.9% 7.2% 4.9% 4.5%
Any Major 42.1% 7.7%
Same Major 15.8%
Any Major 14.3% 19.0% 46.7% 66.7%
Same Major 9.5% 19.0% 43.3% 47.6%
Any Major 22.3% 36.1% 29.4% 25.5%
Same Major 2.1% 2.8% 1.7% 3.3%
Any Major 21.4% 7.7% 7.1%
Same Major 7.1% 7.7%
Any Major 25.0% 29.8% 41.2% 38.7%
Same Major 4.2% 4.3% 14.7% 9.7%
Any Major 19.0% 38.5% 52.9% 60.0%
Same Major 19.0% 15.4% 35.3% 50.0%
Any Major 10.9% 12.2% 5.9%
Same Major 2.2% 4.1% 5.9%
Any Major * *
Same Major * *
Any Major 33.7% 25.6% 31.5% 31.6%
Same Major 6.3% 3.3% 4.5% 6.3%
43 LaGuardia Community College/CUNY
Liberal Arts: Mathematics And Science
Liberal Arts: Secondary Education
Philosophy
Liberal Arts: Social Sciences and Humanities
Liberal Arts: Theater and Communication
New Media Technology
Music Recording Technology
Paralegal Studies
Paramedic
Network Administration and Security
Physical Therapist Assistant
Fall 2014
Cohort
Fall 2013
CohortEntering Major
Fall 2011
Cohort
Fall 2012
Cohort
Graduated Major
Nursing
Nutrition and Culinary Management
Occupational Therapy Assistant
Measures ofSuccess
Six-Year Graduation Rate by Entering MajorFirst-time Full-time Students
Any Major 27.3% 27.8% 26.8% 31.3%
Same Major 7.3% 1.9% 4.9% 3.1%
Any Major 16.7% 42.9% 22.2% 30.0%
Same Major 8.3% 20.0%
Any Major 30.4% 49.0% 47.8% 42.6%
Same Major 17.4% 39.2% 32.8% 37.0%
Any Major 23.3% 29.7% 24.4% 25.5%
Same Major 2.7% 3.3% 6.4%
Any Major * *
Same Major
Any Major * 40.0% 32.6% 34.5%
Same Major * 32.0% 18.6% 27.6%
Any Major 39.5% 33.3% 28.6% 47.8%
Same Major 26.3% 22.2% 14.3% 39.1%
Any Major 19.5% 23.0% 23.1% 22.2%
Same Major 2.0% 5.0% 7.7% 3.7%
Any Major 26.7% 20.0% 33.3% 55.6%
Same Major 26.7% 10.0% 8.3% 44.4%
* Cumulative Graduation Rate not calculated where there are fewer than five students in the cohort
Note: includes first-time students in Certificate and Associate degree programs who were full-time in the first semester;
six-year cumulative graduation rate includes all students in the cohort who graduated in any major or same major within six years.
Source: LaGuardia Community College Data Warehouse
LaGuardia Community College/CUNY 44
Practical Nursing
Programming and Software Development
Psychology
Fall 2014
Cohort
Fall 2013
CohortEntering Major
Fall 2011
Cohort
Fall 2012
Cohort
Graduated Major
Radiologic Technology
Teacher Education
Theatre
Travel, Tourism and Hospitality Management
Veterinary Technology
Writing and Literature
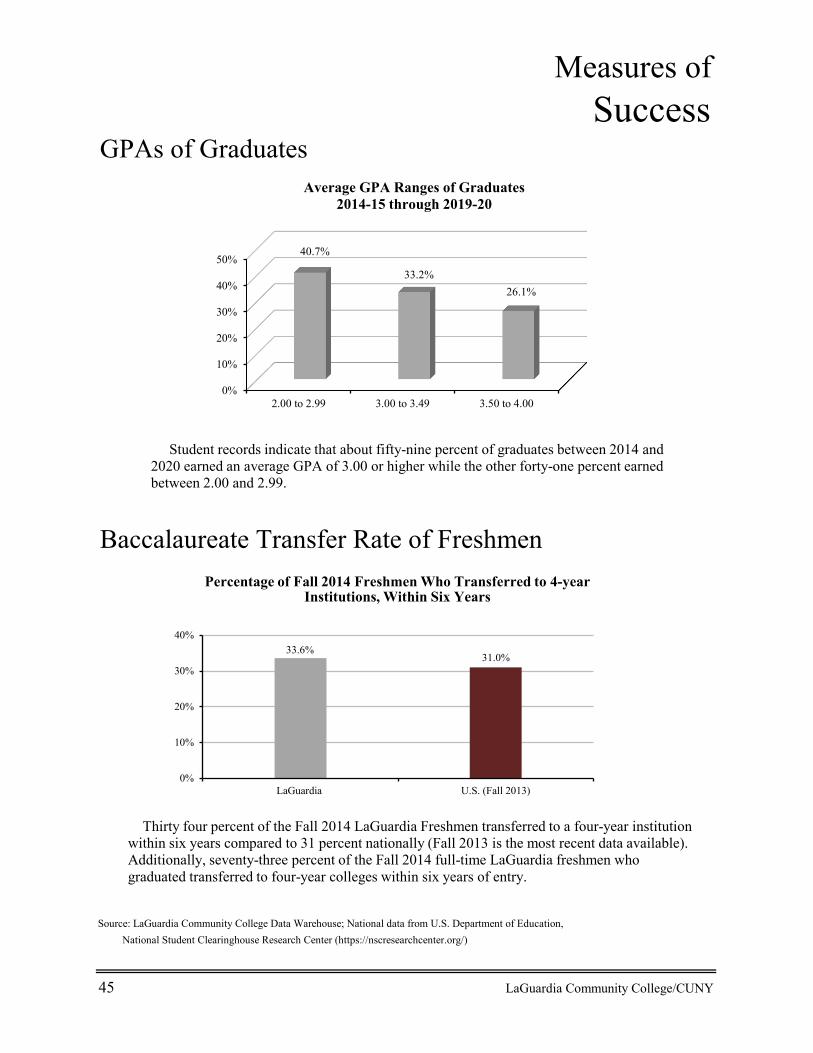
Measures ofSuccess
GPAs of Graduates
Baccalaureate Transfer Rate of Freshmen
Source: LaGuardia Community College Data Warehouse; National data from U.S. Department of Education, National Student Clearinghouse Research Center (https://nscresearchcenter.org/)
45 LaGuardia Community College/CUNY
33.6%31.0%
0%
10%
20%
30%
40%
LaGuardia U.S. (Fall 2013)
Student records indicate that about fifty-nine percent of graduates between 2014 and 2020 earned an average GPA of 3.00 or higher while the other forty-one percent earned between 2.00 and 2.99.
0%
10%
20%
30%
40%
50%
2.00 to 2.99 3.00 to 3.49 3.50 to 4.00
40.7%
33.2%26.1%
Average GPA Ranges of Graduates 2014-15 through 2019-20
Percentage of Fall 2014 Freshmen Who Transferred to 4-year Institutions, Within Six Years
Thirty four percent of the Fall 2014 LaGuardia Freshmen transferred to a four-year institution within six years compared to 31 percent nationally (Fall 2013 is the most recent data available). Additionally, seventy-three percent of the Fall 2014 full-time LaGuardia freshmen who graduated transferred to four-year colleges within six years of entry.

Measures ofSuccess
Five-Year Trend of One-Year Transfer Rates
Source: LaGuardia Community College Data Warehouse; National Student Clearinghouse, 2015-16 through 2019-20 Graduates
Destinations of Graduates2019-20 Graduates
Source: National Student Clearinghouse, 2019-20 Graduates
LaGuardia Community College/CUNY 46
52%
59% 62%
54%54%
30%
40%
50%
60%
70%
80%
Most graduates who continued their education remained within the City University of New York system (eighty-nine percent). Queens, John Jay, Baruch, Hunter and City colleges were the most popular choices, with nearthree-quarters of all transfers selecting those five sister institutions.
Queens18%
John Jay16%
Baruch14%Hunter
11%
City8%
Other CUNY23%
SUNY3%
Private Colleges/Other Out-of-State Public
Colleges7%
One year after graduation, fifty-four percent of the 2019-2020 graduating class had transferred to four-year colleges, the same proportion as in 2018-19.
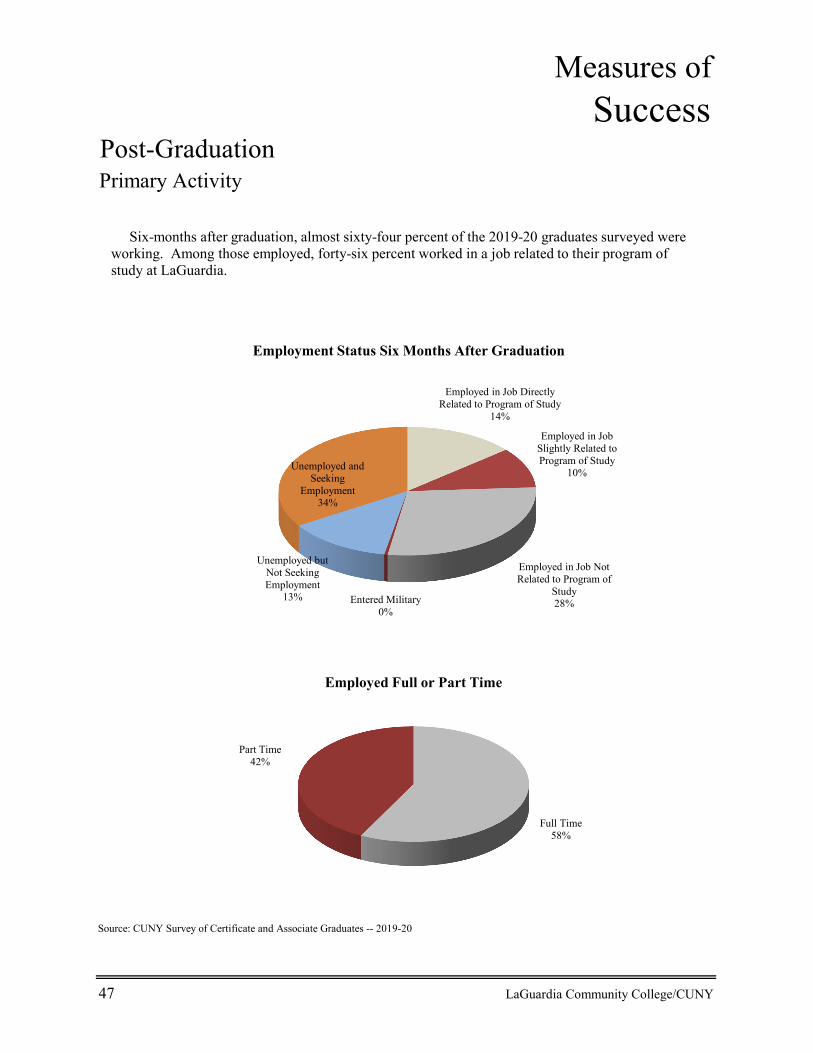
Measures ofSuccess
Post-Graduation Primary Activity
Source: CUNY Survey of Certificate and Associate Graduates -- 2019-20
47 LaGuardia Community College/CUNY
Employed in Job Directly Related to Program of Study
14%
Employed in Job Slightly Related to Program of Study
10%
Employed in Job Not Related to Program of
Study28%Entered Military
0%
Unemployed but Not Seeking Employment
13%
Unemployed and Seeking
Employment34%
Employment Status Six Months After Graduation
Full Time58%
Part Time42%
Employed Full or Part Time
Six-months after graduation, almost sixty-four percent of the 2019-20 graduates surveyed were working. Among those employed, forty-six percent worked in a job related to their program of study at LaGuardia.
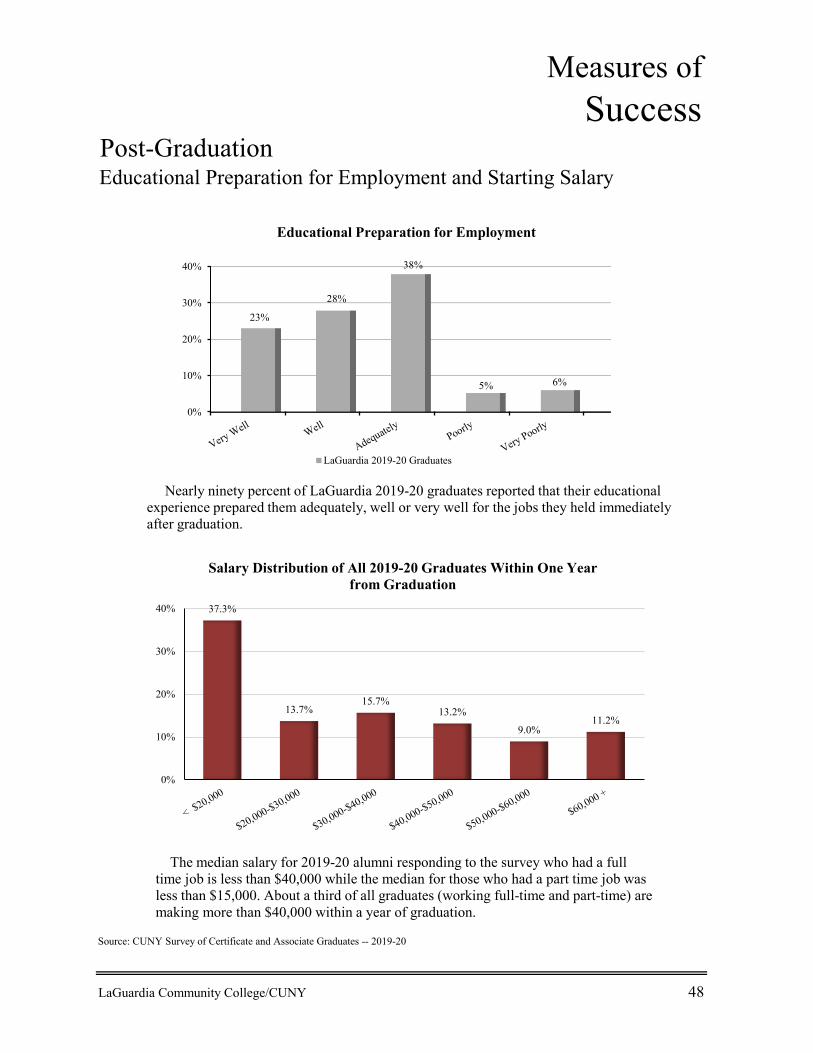
Measures ofSuccess
Post-Graduation Educational Preparation for Employment and Starting Salary
Source: CUNY Survey of Certificate and Associate Graduates -- 2019-20
LaGuardia Community College/CUNY 48
0%
10%
20%
30%
40%
23%
28%
38%
5% 6%
Educational Preparation for Employment
LaGuardia 2019-20 Graduates
Nearly ninety percent of LaGuardia 2019-20 graduates reported that their educational experience prepared them adequately, well or very well for the jobs they held immediately after graduation.
The median salary for 2019-20 alumni responding to the survey who had a full time job is less than $40,000 while the median for those who had a part time job was less than $15,000. About a third of all graduates (working full-time and part-time) are making more than $40,000 within a year of graduation.
37.3%
13.7%15.7%
13.2%
9.0%11.2%
0%
10%
20%
30%
40%
Salary Distribution of All 2019-20 Graduates Within One Year from Graduation
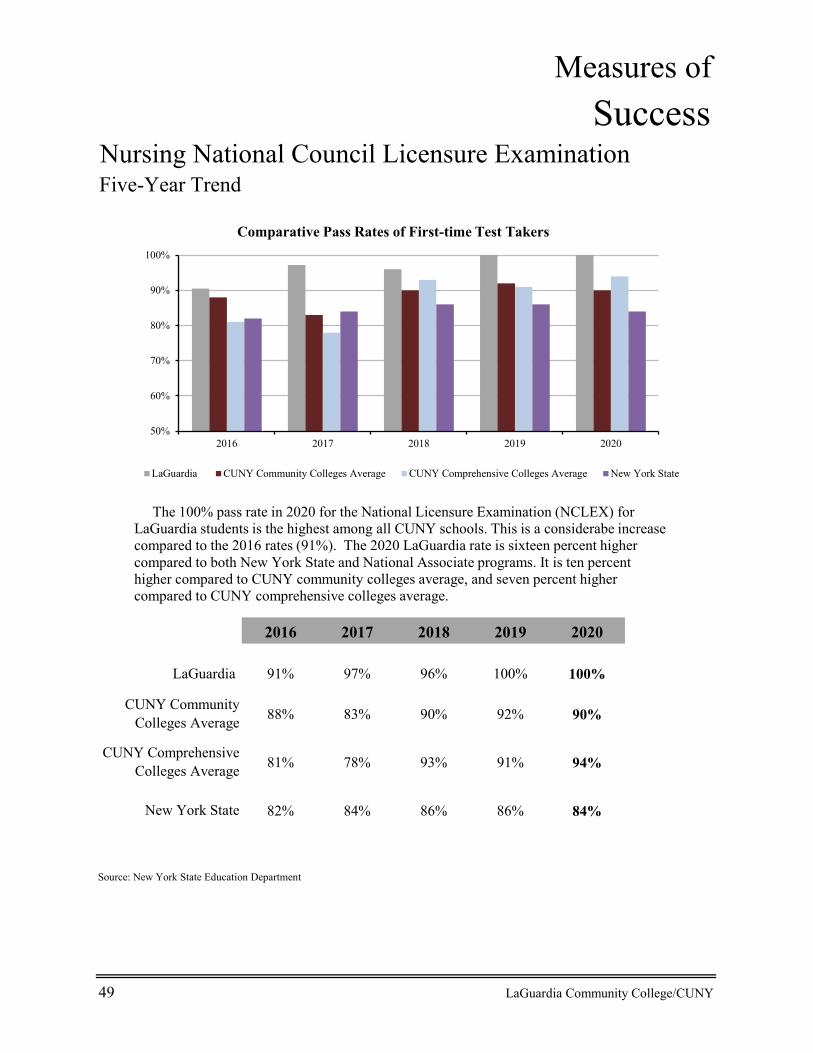
Measures ofSuccess
Nursing National Council Licensure ExaminationFive-Year Trend
2016 2017 2018 2019 2020
LaGuardia 91% 97% 96% 100% 100%
88% 83% 90% 92% 90%
81% 78% 93% 91% 94%
82% 84% 86% 86% 84%
Source: New York State Education Department
49 LaGuardia Community College/CUNY
New York State
CUNY Community Colleges Average
CUNY Comprehensive Colleges Average
50%
60%
70%
80%
90%
100%
2016 2017 2018 2019 2020
Comparative Pass Rates of First-time Test Takers
LaGuardia CUNY Community Colleges Average CUNY Comprehensive Colleges Average New York State
The 100% pass rate in 2020 for the National Licensure Examination (NCLEX) for LaGuardia students is the highest among all CUNY schools. This is a considerabe increase compared to the 2016 rates (91%). The 2020 LaGuardia rate is sixteen percent higher compared to both New York State and National Associate programs. It is ten percent higher compared to CUNY community colleges average, and seven percent higher compared to CUNY comprehensive colleges average.
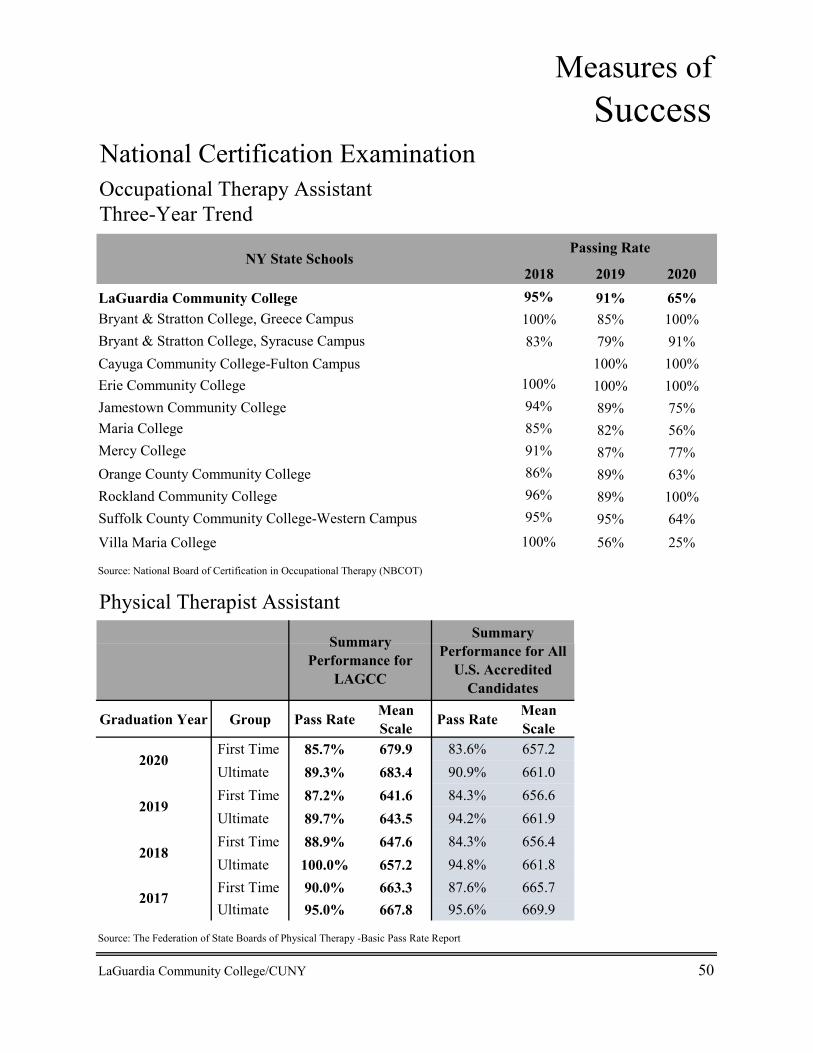
Measures ofSuccess
National Certification ExaminationOccupational Therapy Assistant Three-Year Trend
2018 2019 202095% 91% 65%100% 85% 100%83% 79% 91%
Cayuga Community College-Fulton Campus 100% 100%100% 100% 100%94% 89% 75%
Maria College 85% 82% 56%Mercy College 91% 87% 77%
86% 89% 63%96% 89% 100%95% 95% 64%
100% 56% 25%
Source: National Board of Certification in Occupational Therapy (NBCOT)
Physical Therapist Assistant
Graduation Year Group Pass Rate Mean Scale Pass Rate Mean
Scale First Time 85.7% 679.9 83.6% 657.2 Ultimate 89.3% 683.4 90.9% 661.0 First Time 87.2% 641.6 84.3% 656.6 Ultimate 89.7% 643.5 94.2% 661.9 First Time 88.9% 647.6 84.3% 656.4 Ultimate 100.0% 657.2 94.8% 661.8 First Time 90.0% 663.3 87.6% 665.7 Ultimate 95.0% 667.8 95.6% 669.9
Source: The Federation of State Boards of Physical Therapy -Basic Pass Rate Report
LaGuardia Community College/CUNY 50
NY State Schools
LaGuardia Community College
Erie Community CollegeJamestown Community College
Passing Rate
2019
Villa Maria College
2018
2017
2020
Summary Performance for
LAGCC
Summary Performance for All
U.S. Accredited Candidates
Orange County Community CollegeRockland Community CollegeSuffolk County Community College-Western Campus
Bryant & Stratton College, Greece CampusBryant & Stratton College, Syracuse Campus
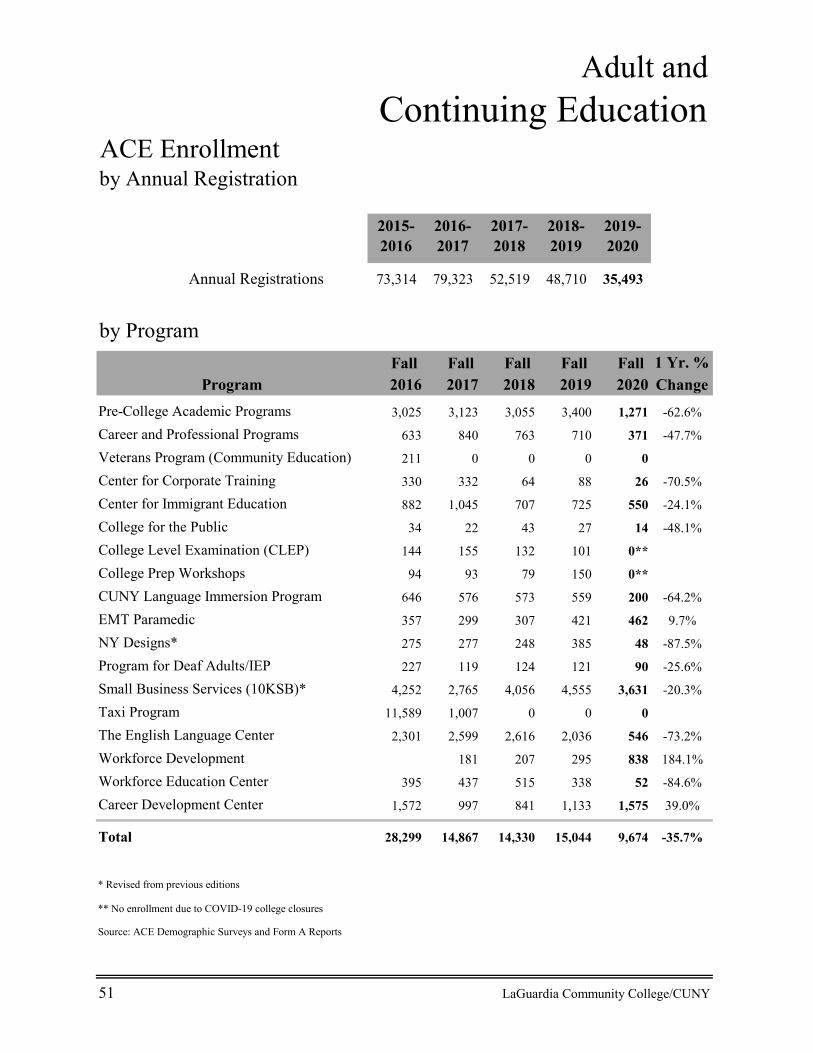
Adult andContinuing Education
ACE Enrollmentby Annual Registration
2015-2016
2016-2017
2017-2018
2018-2019
2019-2020
Annual Registrations 73,314 79,323 52,519 48,710 35,493
by ProgramFall Fall Fall Fall Fall 1 Yr. %
Program 2016 2017 2018 2019 2020 Change Pre-College Academic Programs 3,025 3,123 3,055 3,400 1,271 -62.6%
Career and Professional Programs 633 840 763 710 371 -47.7%
Veterans Program (Community Education) 211 0 0 0 0
Center for Corporate Training 330 332 64 88 26 -70.5%
Center for Immigrant Education 882 1,045 707 725 550 -24.1%
College for the Public 34 22 43 27 14 -48.1%
College Level Examination (CLEP) 144 155 132 101 0**
College Prep Workshops 94 93 79 150 0**
CUNY Language Immersion Program 646 576 573 559 200 -64.2%
EMT Paramedic 357 299 307 421 462 9.7%
NY Designs* 275 277 248 385 48 -87.5%
Program for Deaf Adults/IEP 227 119 124 121 90 -25.6%
Small Business Services (10KSB)* 4,252 2,765 4,056 4,555 3,631 -20.3%
Taxi Program 11,589 1,007 0 0 0
The English Language Center 2,301 2,599 2,616 2,036 546 -73.2%
Workforce Development 181 207 295 838 184.1%
Workforce Education Center 395 437 515 338 52 -84.6%
Career Development Center 1,572 997 841 1,133 1,575 39.0%
Total 28,299 14,867 14,330 15,044 9,674 -35.7%
* Revised from previous editions
** No enrollment due to COVID-19 college closures
Source: ACE Demographic Surveys and Form A Reports
51 LaGuardia Community College/CUNY
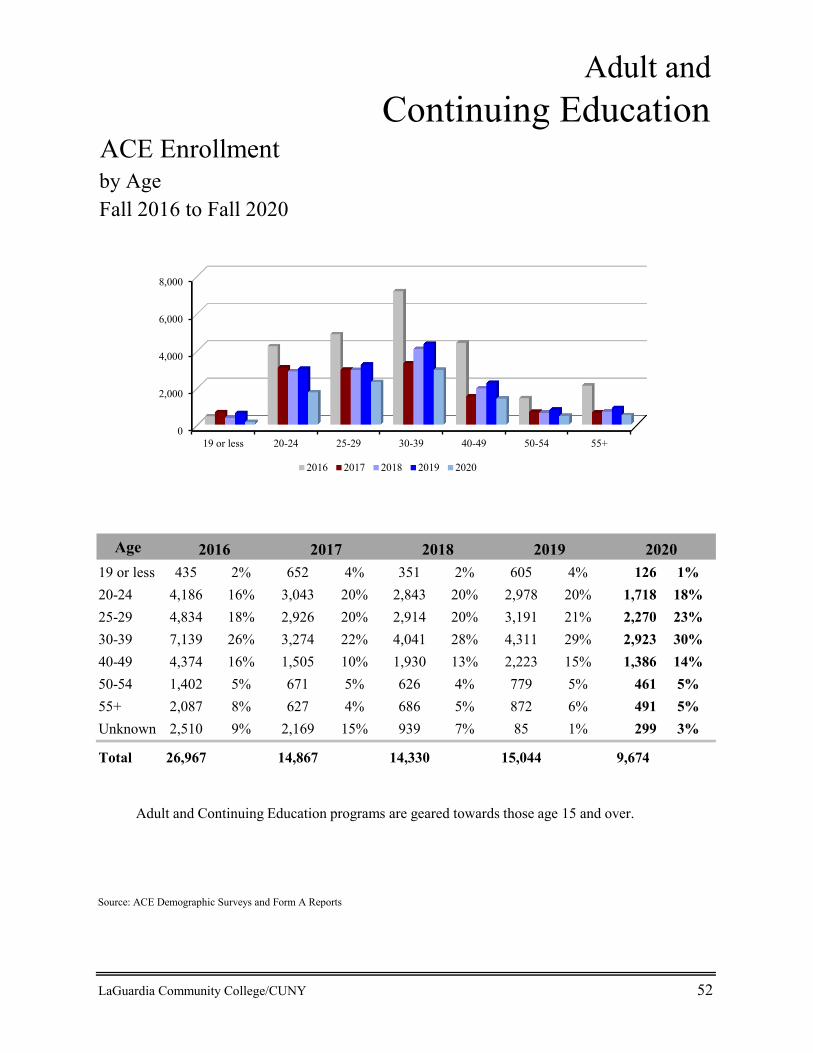
Adult andContinuing Education
ACE Enrollmentby AgeFall 2016 to Fall 2020
Age19 or less 435 2% 652 4% 351 2% 605 4% 126 1%20-24 4,186 16% 3,043 20% 2,843 20% 2,978 20% 1,718 18%25-29 4,834 18% 2,926 20% 2,914 20% 3,191 21% 2,270 23%30-39 7,139 26% 3,274 22% 4,041 28% 4,311 29% 2,923 30%40-49 4,374 16% 1,505 10% 1,930 13% 2,223 15% 1,386 14%50-54 1,402 5% 671 5% 626 4% 779 5% 461 5%55+ 2,087 8% 627 4% 686 5% 872 6% 491 5%Unknown 2,510 9% 2,169 15% 939 7% 85 1% 299 3%
Total 26,967 14,867 14,330 15,044 9,674
Source: ACE Demographic Surveys and Form A Reports
LaGuardia Community College/CUNY 52
2016 2017 2018 20202019
0
2,000
4,000
6,000
8,000
19 or less 20-24 25-29 30-39 40-49 50-54 55+
2016 2017 2018 2019 2020
Adult and Continuing Education programs are geared towards those age 15 and over.
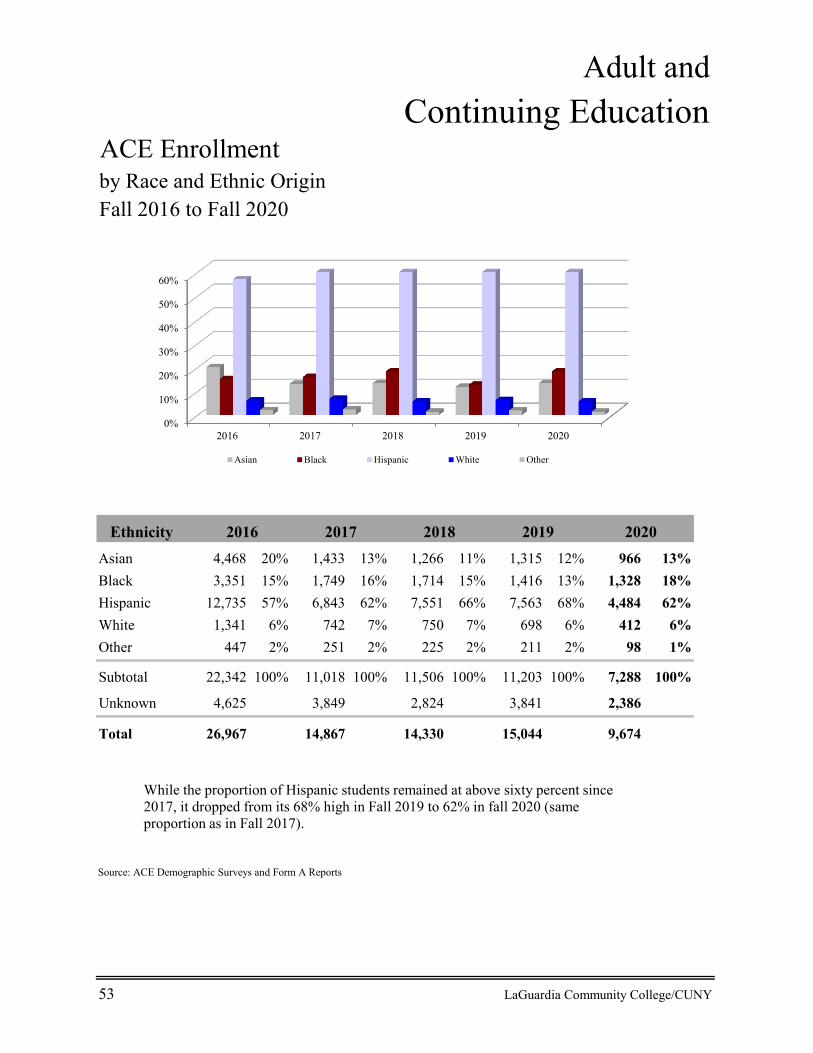
Adult and Continuing Education
ACE Enrollmentby Race and Ethnic OriginFall 2016 to Fall 2020
EthnicityAsian 4,468 20% 1,433 13% 1,266 11% 1,315 12% 966 13%Black 3,351 15% 1,749 16% 1,714 15% 1,416 13% 1,328 18%Hispanic 12,735 57% 6,843 62% 7,551 66% 7,563 68% 4,484 62%White 1,341 6% 742 7% 750 7% 698 6% 412 6%Other 447 2% 251 2% 225 2% 211 2% 98 1%
Subtotal 22,342 100% 11,018 100% 11,506 100% 11,203 100% 7,288 100%
Unknown 4,625 3,849 2,824 3,841 2,386
Total 26,967 14,867 14,330 15,044 9,674
Source: ACE Demographic Surveys and Form A Reports
53 LaGuardia Community College/CUNY
2019 20202016 2017 2018
0%
10%
20%
30%
40%
50%
60%
2016 2017 2018 2019 2020
Asian Black Hispanic White Other
While the proportion of Hispanic students remained at above sixty percent since 2017, it dropped from its 68% high in Fall 2019 to 62% in fall 2020 (same proportion as in Fall 2017).

Adult andContinuing Education
ACE Enrollmentby Borough Fall 2020
by GenderFall 2016 to Fall 2020
2016 2017 2018 2019 2020Male 65% 47% 42% 44% 42%Female 35% 53% 58% 56% 58%
Source: ACE Demographic Surveys and Form A Reports
LaGuardia Community College/CUNY 54
0
2,000
4,000
6,000
Queens Brooklyn Manhattan Bronx Staten Island Other Unknown
5,440
1,196372 487 68 254
1,857
Adult and Continuing Education programs primarily serve residents of Queens. The percentage of Queens residents remain relatively unchanged since Fall 2018.
The shift toward more females-enrollment has maintained since 2017. The drop in the proportion of male students compared to the 2016 is because the mostly male Taxi Program was closed.
0%10%20%30%40%50%60%70%
2016 2017 2018 2019 2020
MaleFemale
56.2% 12.4% 3.8% 5.0% 0.7% 2.6% 19.2%

Institutional ResourcesFaculty & Staff
Employee Headcounts by Business EntitiesFall 2020
Business EntitiesTax Levy - New York City General Fund 1,073 49.7% 1,088 50.3% 2,161 80.5%
Research Foundation CUNY 128 26.7% 352 73.3% 480 17.9%Education Fund 0 0% 0 0% 0 0.0%
College Association 5 29.4% 12 70.6% 17 0.6%
Auxiliary Enterprises Corporation 1 16.7% 5 83.3% 6 0.2%
Early Childhood Learning Center (ECLC) 20 90.9% 2 9.1% 22 0.8%
Employee Total 1,227 46% 1,459 54% 2,686 100%
Source: CUNYfirst Data; Division of Administration
55 LaGuardia Community College/CUNY
Full Time Part Time Total
Tax Levy80.5%
Research Foundation17.9%
Education Fund0.0%
College Association0.6%
Auxiliary Enterprises0.2%
ECLC0.8%
Fall 2019 Employees by Business Entities
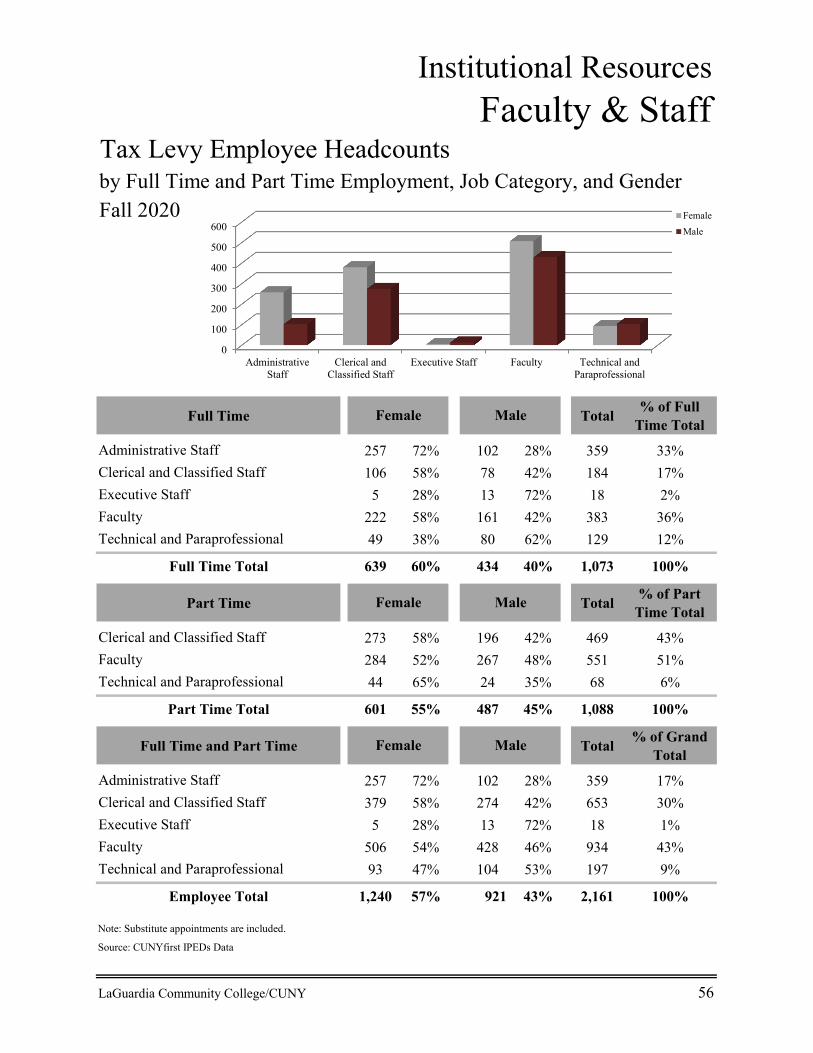
Institutional ResourcesFaculty & Staff
Tax Levy Employee Headcounts by Full Time and Part Time Employment, Job Category, and GenderFall 2020
Full Time Total % of Full Time Total
Administrative Staff 257 72% 102 28% 359 33%Clerical and Classified Staff 106 58% 78 42% 184 17%Executive Staff 5 28% 13 72% 18 2%Faculty 222 58% 161 42% 383 36%Technical and Paraprofessional 49 38% 80 62% 129 12%
Full Time Total 639 60% 434 40% 1,073 100%
Part Time Total % of Part Time Total
Clerical and Classified Staff 273 58% 196 42% 469 43%Faculty 284 52% 267 48% 551 51%Technical and Paraprofessional 44 65% 24 35% 68 6%
Part Time Total 601 55% 487 45% 1,088 100%
Full Time and Part Time Total % of Grand Total
Administrative Staff 257 72% 102 28% 359 17%Clerical and Classified Staff 379 58% 274 42% 653 30%Executive Staff 5 28% 13 72% 18 1%Faculty 506 54% 428 46% 934 43%Technical and Paraprofessional 93 47% 104 53% 197 9%
Employee Total 1,240 57% 921 43% 2,161 100%
Note: Substitute appointments are included.
Source: CUNYfirst IPEDs Data
LaGuardia Community College/CUNY 56
Female Male
Female Male
Female Male
0
100
200
300
400
500
600
AdministrativeStaff
Clerical andClassified Staff
Executive Staff Faculty Technical andParaprofessional
FemaleMale
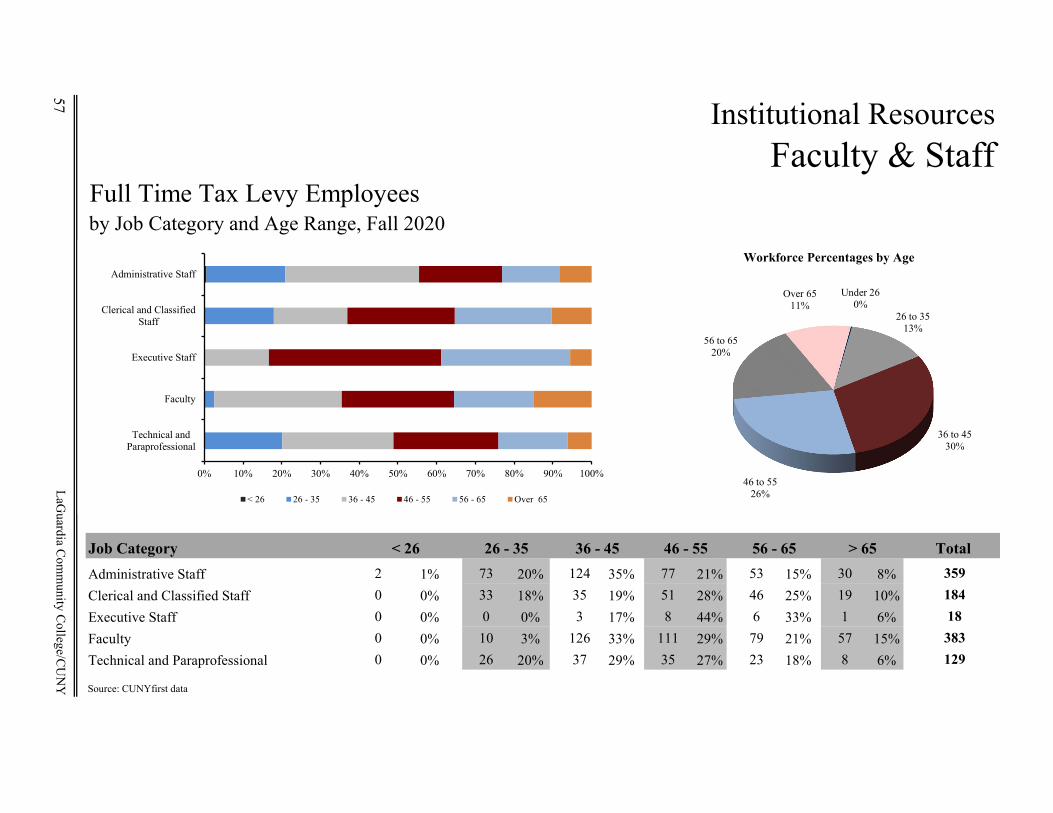
57 Institutional ResourcesFaculty & Staff
Full Time Tax Levy Employees
Job Category Total Administrative Staff 2 1% 73 20% 124 35% 77 21% 53 15% 30 8% 359Clerical and Classified Staff 0 0% 33 18% 35 19% 51 28% 46 25% 19 10% 184Executive Staff 0 0% 0 0% 3 17% 8 44% 6 33% 1 6% 18Faculty 0 0% 10 3% 126 33% 111 29% 79 21% 57 15% 383Technical and Paraprofessional 0 0% 26 20% 37 29% 35 27% 23 18% 8 6% 129
Source: CUNYfirst data
by Job Category and Age Range, Fall 2020
> 65
LaGuardia C
omm
unity College/C
UN
Y
< 26 26 - 35 36 - 45 46 - 55 56 - 65
0% 10% 20% 30% 40% 50% 60% 70% 80% 90% 100%
Technical andParaprofessional
Faculty
Executive Staff
Clerical and ClassifiedStaff
Administrative Staff
< 26 26 - 35 36 - 45 46 - 55 56 - 65 Over 65
Under 260%
26 to 3513%
36 to 4530%
46 to 5526%
56 to 6520%
Over 6511%
Workforce Percentages by Age
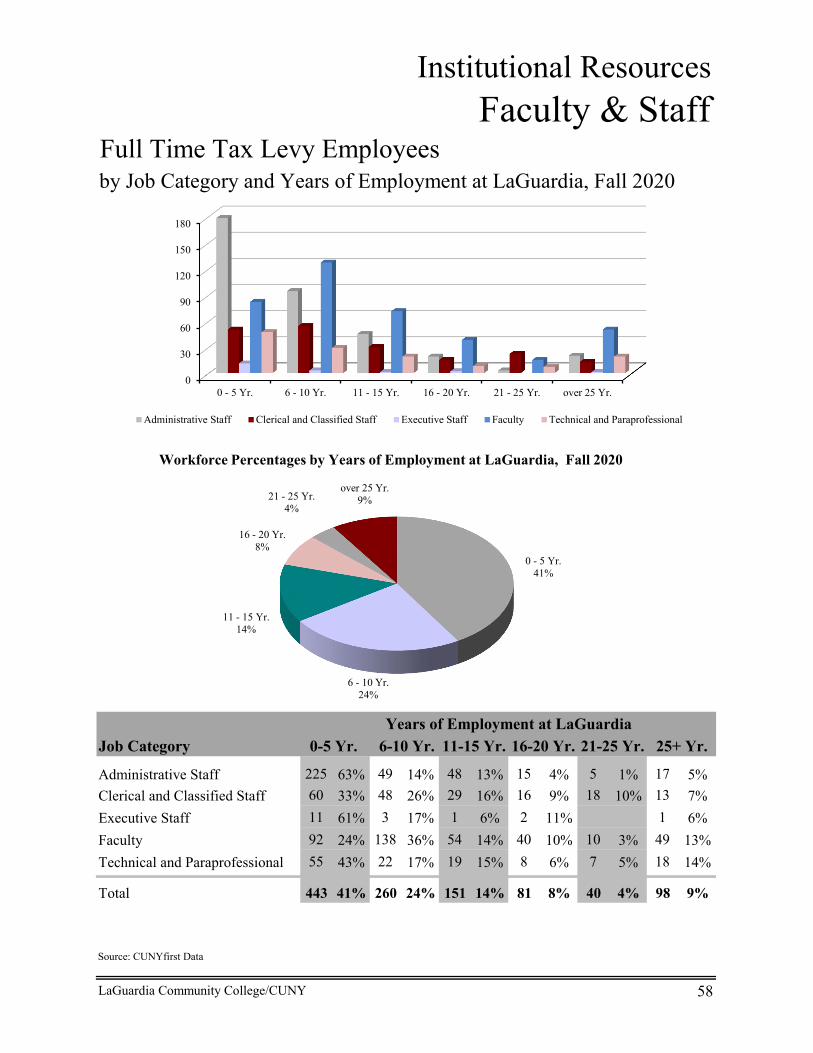
Institutional ResourcesFaculty & Staff
Full Time Tax Levy Employees by Job Category and Years of Employment at LaGuardia, Fall 2020
Job Category
Administrative Staff 225 63% 49 14% 48 13% 15 4% 5 1% 17 5%Clerical and Classified Staff 60 33% 48 26% 29 16% 16 9% 18 10% 13 7%Executive Staff 11 61% 3 17% 1 6% 2 11% 1 6%Faculty 92 24% 138 36% 54 14% 40 10% 10 3% 49 13%Technical and Paraprofessional 55 43% 22 17% 19 15% 8 6% 7 5% 18 14%
Total 443 41% 260 24% 151 14% 81 8% 40 4% 98 9%
Source: CUNYfirst Data
58LaGuardia Community College/CUNY
Years of Employment at LaGuardia25+ Yr.21-25 Yr.16-20 Yr.11-15 Yr. 6-10 Yr.0-5 Yr.
0
30
60
90
120
150
180
0 - 5 Yr. 6 - 10 Yr. 11 - 15 Yr. 16 - 20 Yr. 21 - 25 Yr. over 25 Yr.
Administrative Staff Clerical and Classified Staff Executive Staff Faculty Technical and Paraprofessional
0 - 5 Yr.41%
6 - 10 Yr.24%
11 - 15 Yr.14%
16 - 20 Yr.8%
21 - 25 Yr.4%
over 25 Yr.9%
Workforce Percentages by Years of Employment at LaGuardia, Fall 2020

Institutional ResourcesFaculty & Staff
Full Time Tax Levy Employees
Job Category Doctorate % Master's % Bachelor's % Associate's % No Degree % TotalAdministrative Staff 15 4% 150 42% 186 52% 4 1% 4 1% 359Clerical and Classified Staff 5 3% 30 16% 26 14% 123 67% 184Executive Staff 10 56% 6 33% 2 11% 18Faculty 238 62% 122 32% 21 5% 2 1% 383Technical and Paraprofessional 2 2% 14 11% 45 35% 36 28% 32 25% 129
Total 265 25% 297 28% 284 26% 66 6% 161 15% 1,073
Source: CUNYfirst Data
LaGuardia C
omm
unity College/C
UN
Y59
by Job Category and Highest Degree Earned, Fall 2020
0 50 100 150 200 250
No Degree
Associate's
Bachelor's
Master's
Doctorate
Technical and Paraprofessional
Faculty
Executive Staff
Clerical and Classified Staff
Administrative Staff
62.1%
31.9%
6.0%
0%
20%
40%
60%
80%
Ph.D. or FirstProfessional
Master's Bachelor's or less
Faculty Highest Degree Earned
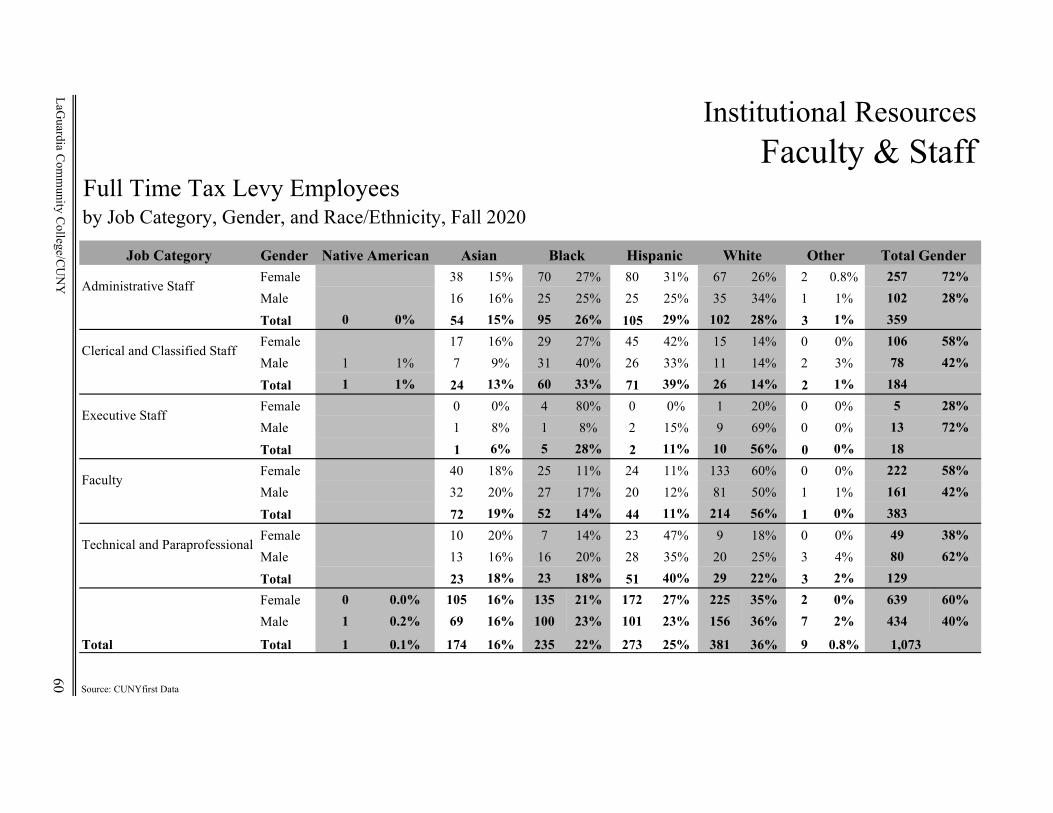
Institutional ResourcesFaculty & Staff
Full Time Tax Levy Employeesby Job Category, Gender, and Race/Ethnicity, Fall 2020
Job Category GenderFemale 38 15% 70 27% 80 31% 67 26% 2 0.8% 257 72%Male 16 16% 25 25% 25 25% 35 34% 1 1% 102 28%
Total 0 0% 54 15% 95 26% 105 29% 102 28% 3 1% 359Female 17 16% 29 27% 45 42% 15 14% 0 0% 106 58%Male 1 1% 7 9% 31 40% 26 33% 11 14% 2 3% 78 42%
Total 1 1% 24 13% 60 33% 71 39% 26 14% 2 1% 184Female 0 0% 4 80% 0 0% 1 20% 0 0% 5 28%Male 1 8% 1 8% 2 15% 9 69% 0 0% 13 72%
Total 1 6% 5 28% 2 11% 10 56% 0 0% 18Female 40 18% 25 11% 24 11% 133 60% 0 0% 222 58%Male 32 20% 27 17% 20 12% 81 50% 1 1% 161 42%
Total 72 19% 52 14% 44 11% 214 56% 1 0% 383Female 10 20% 7 14% 23 47% 9 18% 0 0% 49 38%Male 13 16% 16 20% 28 35% 20 25% 3 4% 80 62%
Total 23 18% 23 18% 51 40% 29 22% 3 2% 129Female 0 0.0% 105 16% 135 21% 172 27% 225 35% 2 0% 639 60%Male 1 0.2% 69 16% 100 23% 101 23% 156 36% 7 2% 434 40%
Total Total 1 0.1% 174 16% 235 22% 273 25% 381 36% 9 0.8% 1,073
Source: CUNYfirst Data
LaGuardia C
omm
unity College/C
UN
Y
Total Gender
60
Administrative Staff
Clerical and Classified Staff
Black Hispanic
Faculty
White OtherNative American Asian
Technical and Paraprofessional
Executive Staff
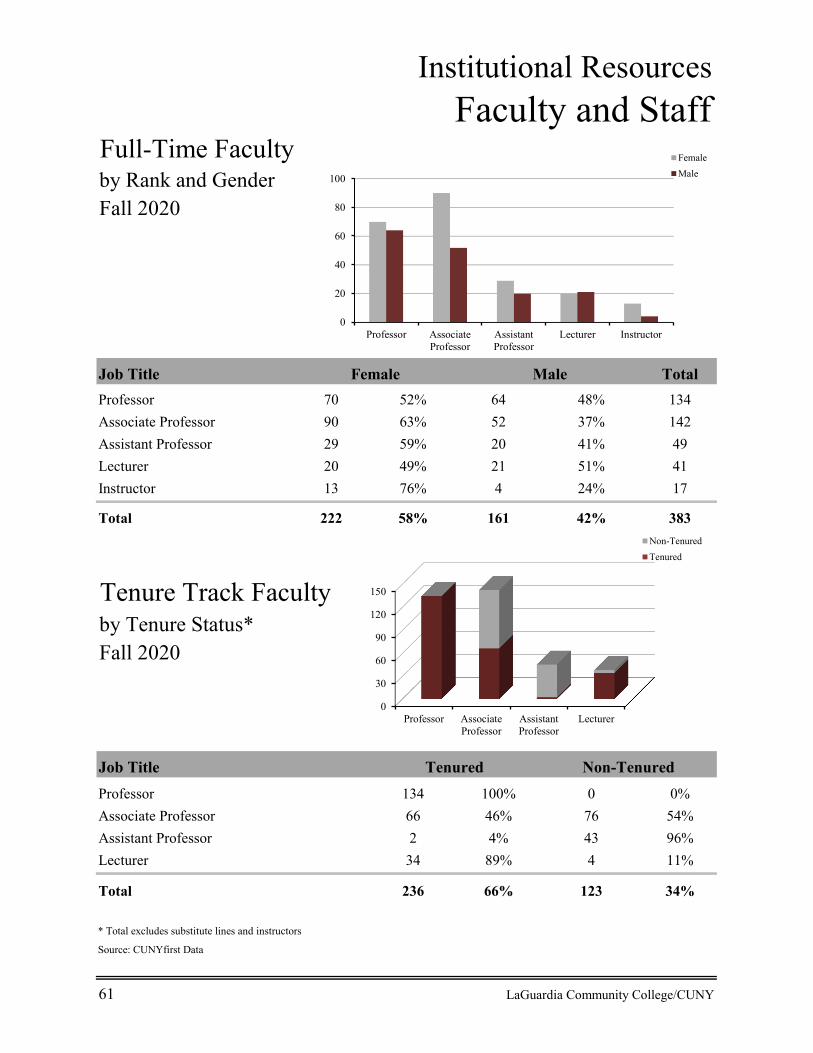
Institutional ResourcesFaculty and Staff
Full-Time Facultyby Rank and GenderFall 2020
Job Title TotalProfessor 70 52% 64 48% 134Associate Professor 90 63% 52 37% 142Assistant Professor 29 59% 20 41% 49Lecturer 20 49% 21 51% 41Instructor 13 76% 4 24% 17
Total 222 58% 161 42% 383
Tenure Track Facultyby Tenure Status*Fall 2020
Job TitleProfessor 134 100% 0 0%Associate Professor 66 46% 76 54%Assistant Professor 2 4% 43 96%Lecturer 34 89% 4 11%
Total 236 66% 123 34%
* Total excludes substitute lines and instructors
Source: CUNYfirst Data
61 LaGuardia Community College/CUNY
MaleFemale
Tenured Non-Tenured
0
30
60
90
120
150
Professor AssociateProfessor
AssistantProfessor
Lecturer
Non-TenuredTenured
0
20
40
60
80
100
Professor AssociateProfessor
AssistantProfessor
Lecturer Instructor
FemaleMale
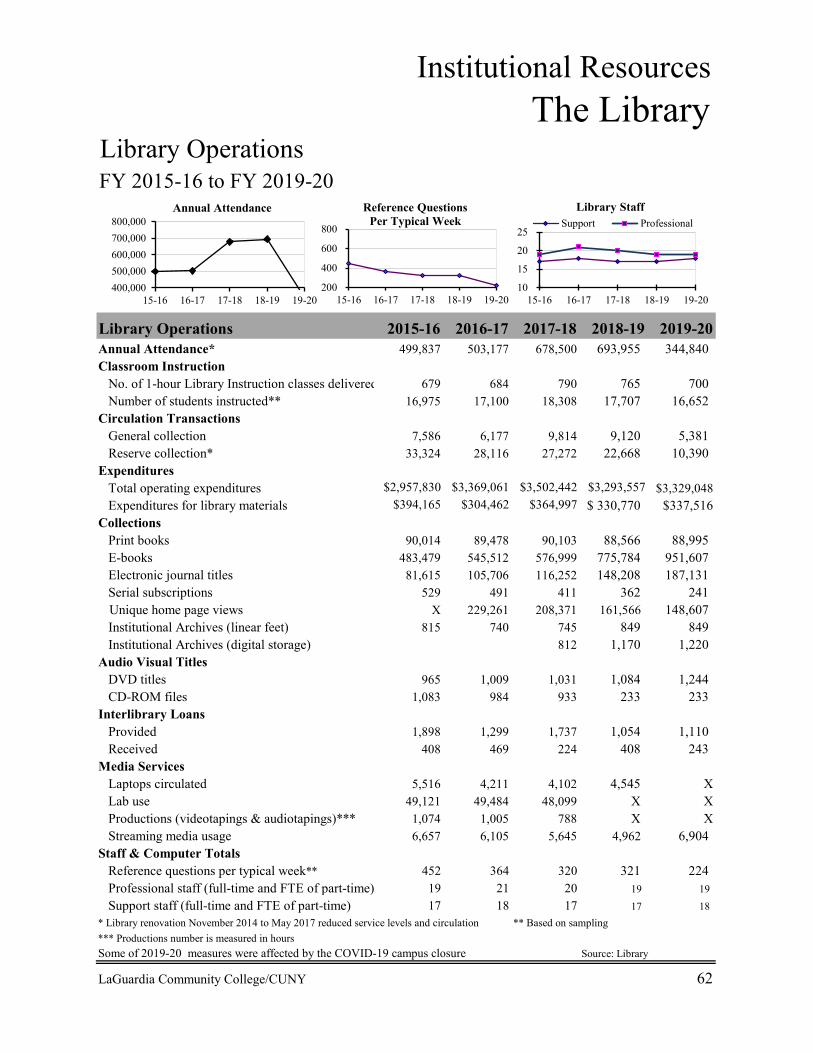
Institutional ResourcesThe Library
Library OperationsFY 2015-16 to FY 2019-20
Library Operations 2015-16 2016-17 2017-18 2018-19 2019-20Annual Attendance* 499,837 503,177 678,500 693,955 344,840 Classroom Instruction No. of 1-hour Library Instruction classes delivered 679 684 790 765 700 Number of students instructed** 16,975 17,100 18,308 17,707 16,652 Circulation Transactions General collection 7,586 6,177 9,814 9,120 5,381 Reserve collection* 33,324 28,116 27,272 22,668 10,390 Expenditures Total operating expenditures $2,957,830 $3,369,061 $3,502,442 $3,293,557 $3,329,048 Expenditures for library materials $394,165 $304,462 $364,997 330,770$ $337,516Collections Print books 90,014 89,478 90,103 88,566 88,995 E-books 483,479 545,512 576,999 775,784 951,607 Electronic journal titles 81,615 105,706 116,252 148,208 187,131 Serial subscriptions 529 491 411 362 241
Unique home page views X 229,261 208,371 161,566 148,607 Institutional Archives (linear feet) 815 740 745 849 849 Institutional Archives (digital storage) 812 1,170 1,220 Audio Visual Titles DVD titles 965 1,009 1,031 1,084 1,244 CD-ROM files 1,083 984 933 233 233 Interlibrary Loans Provided 1,898 1,299 1,737 1,054 1,110 Received 408 469 224 408 243Media Services Laptops circulated 5,516 4,211 4,102 4,545 X Lab use 49,121 49,484 48,099 X X Productions (videotapings & audiotapings)*** 1,074 1,005 788 X X Streaming media usage 6,657 6,105 5,645 4,962 6,904 Staff & Computer Totals Reference questions per typical week** 452 364 320 321 224 Professional staff (full-time and FTE of part-time) 19 21 20 19 19 Support staff (full-time and FTE of part-time) 17 18 17 17 18* Library renovation November 2014 to May 2017 reduced service levels and circulation ** Based on sampling*** Productions number is measured in hoursSome of 2019-20 measures were affected by the COVID-19 campus closure Source: Library
LaGuardia Community College/CUNY 62
400,000500,000600,000700,000800,000
15-16 16-17 17-18 18-19 19-20
Annual Attendance
200
400
600
800
15-16 16-17 17-18 18-19 19-20
Reference Questions Per Typical Week
10
15
20
25
15-16 16-17 17-18 18-19 19-20
Library StaffSupport Professional
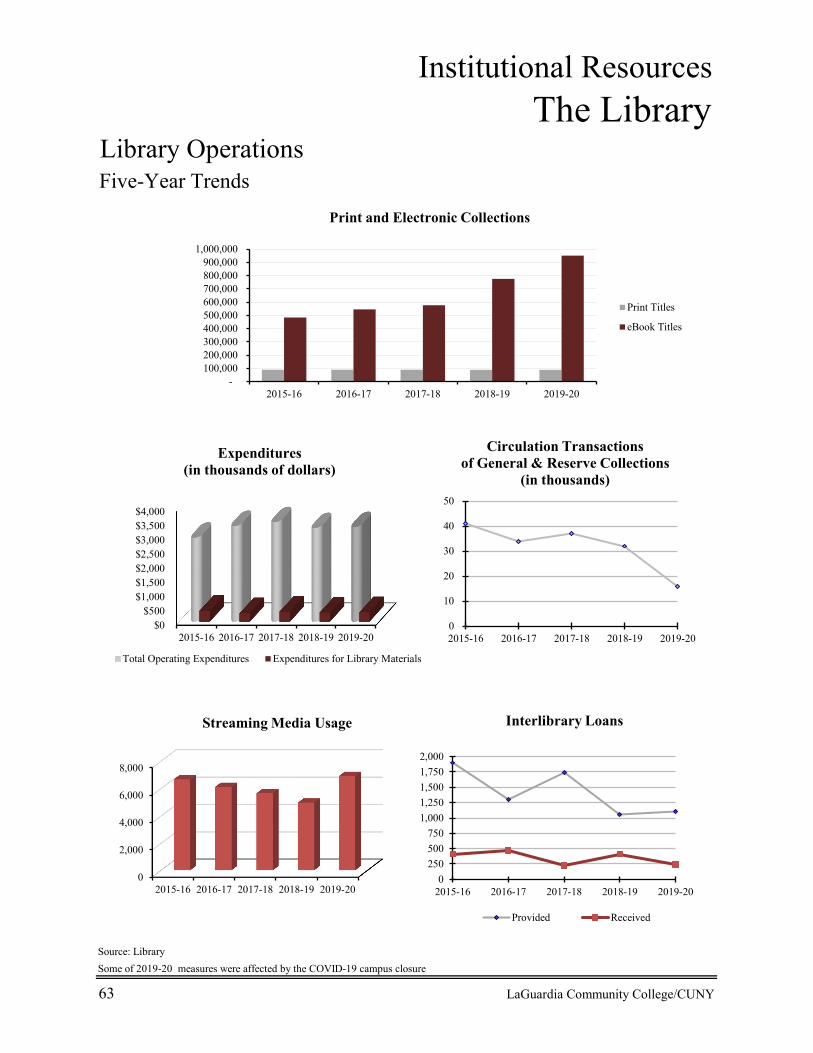
Institutional ResourcesThe Library
Library OperationsFive-Year Trends
Source: LibrarySome of 2019-20 measures were affected by the COVID-19 campus closure
63 LaGuardia Community College/CUNY
0
10
20
30
40
50
2015-16 2016-17 2017-18 2018-19 2019-20
Circulation Transactions of General & Reserve Collections
(in thousands)
$0$500
$1,000$1,500$2,000$2,500$3,000$3,500$4,000
2015-16 2016-17 2017-18 2018-19 2019-20
Expenditures(in thousands of dollars)
Total Operating Expenditures Expenditures for Library Materials
0250500750
1,0001,2501,5001,7502,000
2015-16 2016-17 2017-18 2018-19 2019-20
Interlibrary Loans
Provided Received
- 100,000 200,000 300,000 400,000 500,000 600,000 700,000 800,000 900,000
1,000,000
2015-16 2016-17 2017-18 2018-19 2019-20
Print Titles
eBook Titles
Print and Electronic Collections
0
2,000
4,000
6,000
8,000
2015-16 2016-17 2017-18 2018-19 2019-20
Streaming Media Usage
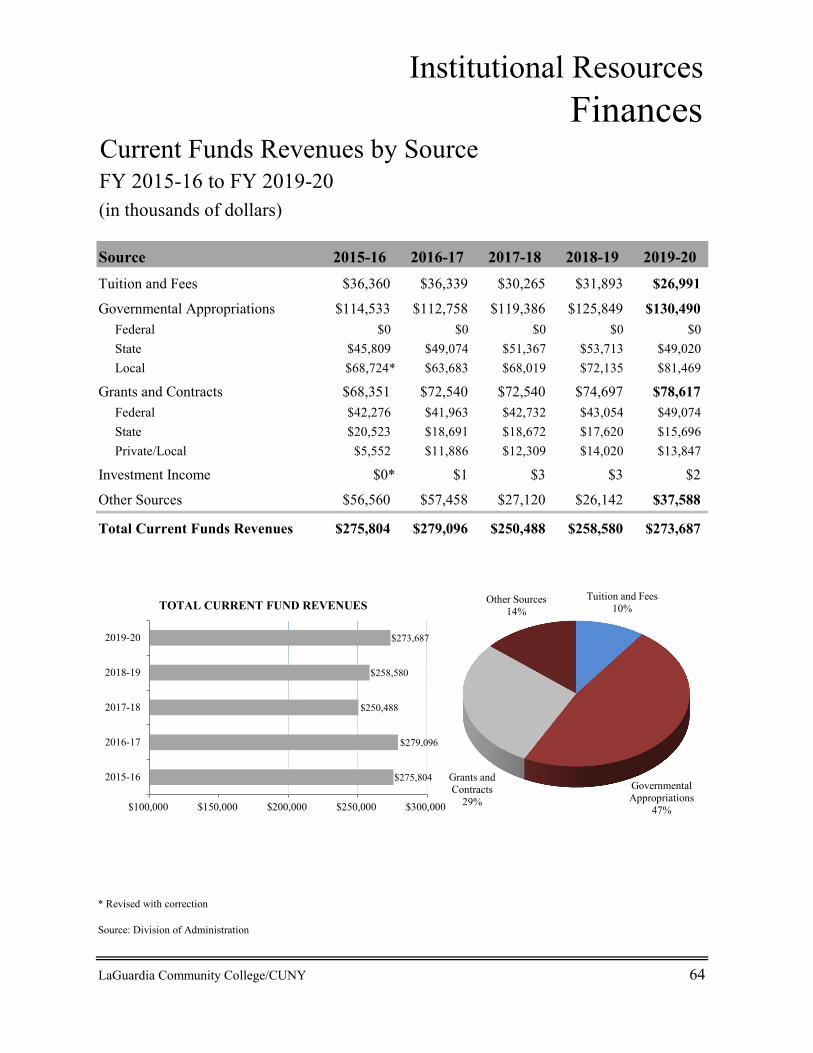
Institutional ResourcesFinances
Current Funds Revenues by SourceFY 2015-16 to FY 2019-20(in thousands of dollars)
Source 2015-16 2016-17 2017-18 2018-19 2019-20Tuition and Fees $36,360 $36,339 $30,265 $31,893 $26,991
Governmental Appropriations $114,533 $112,758 $119,386 $125,849 $130,490 Federal $0 $0 $0 $0 $0 State $45,809 $49,074 $51,367 $53,713 $49,020 Local $68,724* $63,683 $68,019 $72,135 $81,469
Grants and Contracts $68,351 $72,540 $72,540 $74,697 $78,617 Federal $42,276 $41,963 $42,732 $43,054 $49,074 State $20,523 $18,691 $18,672 $17,620 $15,696 Private/Local $5,552 $11,886 $12,309 $14,020 $13,847
Investment Income $0* $1 $3 $3 $2
Other Sources $56,560 $57,458 $27,120 $26,142 $37,588
Total Current Funds Revenues $275,804 $279,096 $250,488 $258,580 $273,687
* Revised with correction
Source: Division of Administration
LaGuardia Community College/CUNY 64
$275,804
$279,096
$250,488
$258,580
$273,687
$100,000 $150,000 $200,000 $250,000 $300,000
2015-16
2016-17
2017-18
2018-19
2019-20
TOTAL CURRENT FUND REVENUESTuition and Fees
10%
Governmental Appropriations
47%
Grants and Contracts
29%
Other Sources14%
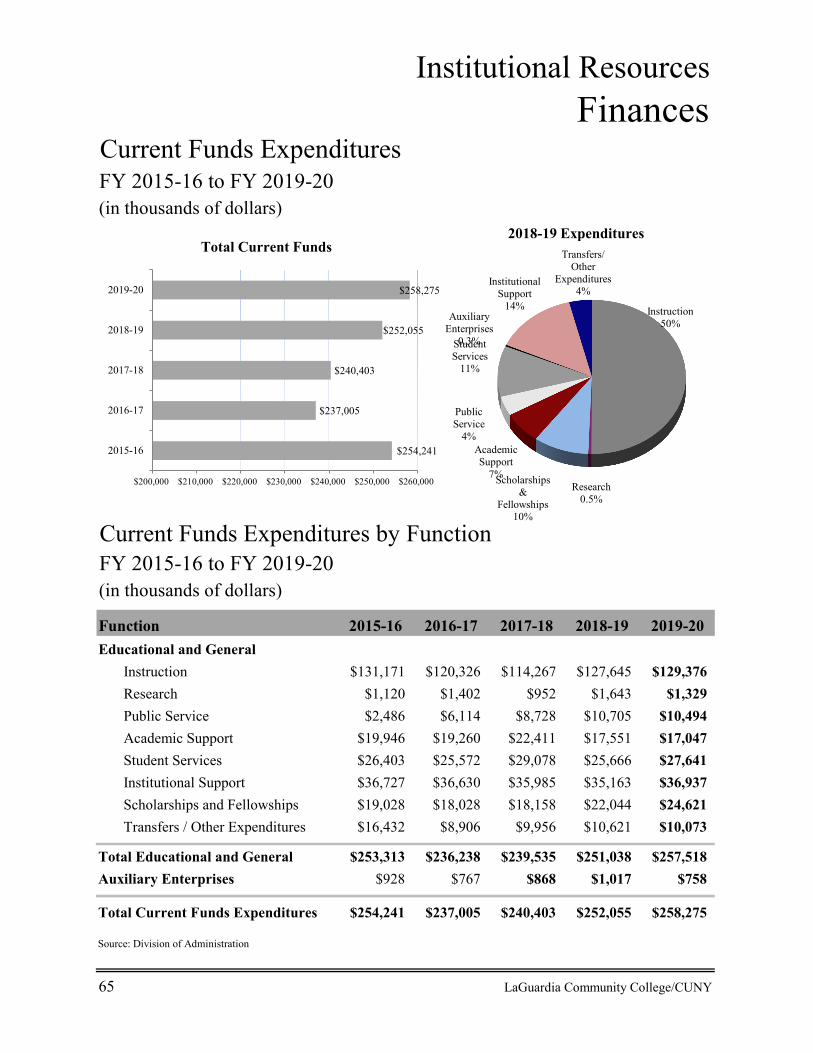
Institutional ResourcesFinances
Current Funds ExpendituresFY 2015-16 to FY 2019-20(in thousands of dollars)
Current Funds Expenditures by FunctionFY 2015-16 to FY 2019-20(in thousands of dollars)
Function 2015-16 2016-17 2017-18 2018-19 2019-20Educational and General
Instruction $131,171 $120,326 $114,267 $127,645 $129,376Research $1,120 $1,402 $952 $1,643 $1,329Public Service $2,486 $6,114 $8,728 $10,705 $10,494Academic Support $19,946 $19,260 $22,411 $17,551 $17,047Student Services $26,403 $25,572 $29,078 $25,666 $27,641Institutional Support $36,727 $36,630 $35,985 $35,163 $36,937Scholarships and Fellowships $19,028 $18,028 $18,158 $22,044 $24,621Transfers / Other Expenditures $16,432 $8,906 $9,956 $10,621 $10,073
Total Educational and General $253,313 $236,238 $239,535 $251,038 $257,518Auxiliary Enterprises $928 $767 $868 $1,017 $758
Total Current Funds Expenditures $254,241 $237,005 $240,403 $252,055 $258,275
Source: Division of Administration
65 LaGuardia Community College/CUNY
$254,241
$237,005
$240,403
$252,055
$258,275
$200,000 $210,000 $220,000 $230,000 $240,000 $250,000 $260,000
2015-16
2016-17
2017-18
2018-19
2019-20
Total Current Funds
Instruction50%
Research0.5%
Scholarships &
Fellowships10%
Academic Support
7%
Public Service
4%
Student Services
11%
Auxiliary Enterprises
0.3%
Institutional Support
14%
Transfers/ Other
Expenditures4%
2018-19 Expenditures

Institutional ResourcesGrant Awards
Grant Awards by SourceFY 2015-16 to FY 2019-20
FY 2019-20
Total Grant AwardsFY 2015-16 to FY 2019-20
Funding Source 2015-16 2016-17 2017-18 2018-19 2019-20City $3,715,126 $5,815,200 $4,310,312 $4,747,114 4,316,098$ Federal $2,277,901 $5,381,189 $6,291,521 $4,580,232 4,746,082$ Private $7,502,530 $3,332,454 $3,333,638 $3,728,355 4,215,148$ State $2,500,052 $2,869,684 $2,877,095 $3,190,895 2,907,011$
Total Awards $15,995,609 $17,398,527 $16,812,566 $16,246,596 $16,184,339Note: Awards are shown once in the year when funding begins. Actual funding may stretch over longer periods.
Source: Grants Development Office
LaGuardia Community College/CUNY 66
Percent of Awards by Source
City27%
Federal29%
Private26%
State18%
$14,000,000
$15,000,000
$16,000,000
$17,000,000
$18,000,000
2015-16 2016-17 2017-18 2018-19 2019-20
Tota
l Aw
ards
Fiscal Year
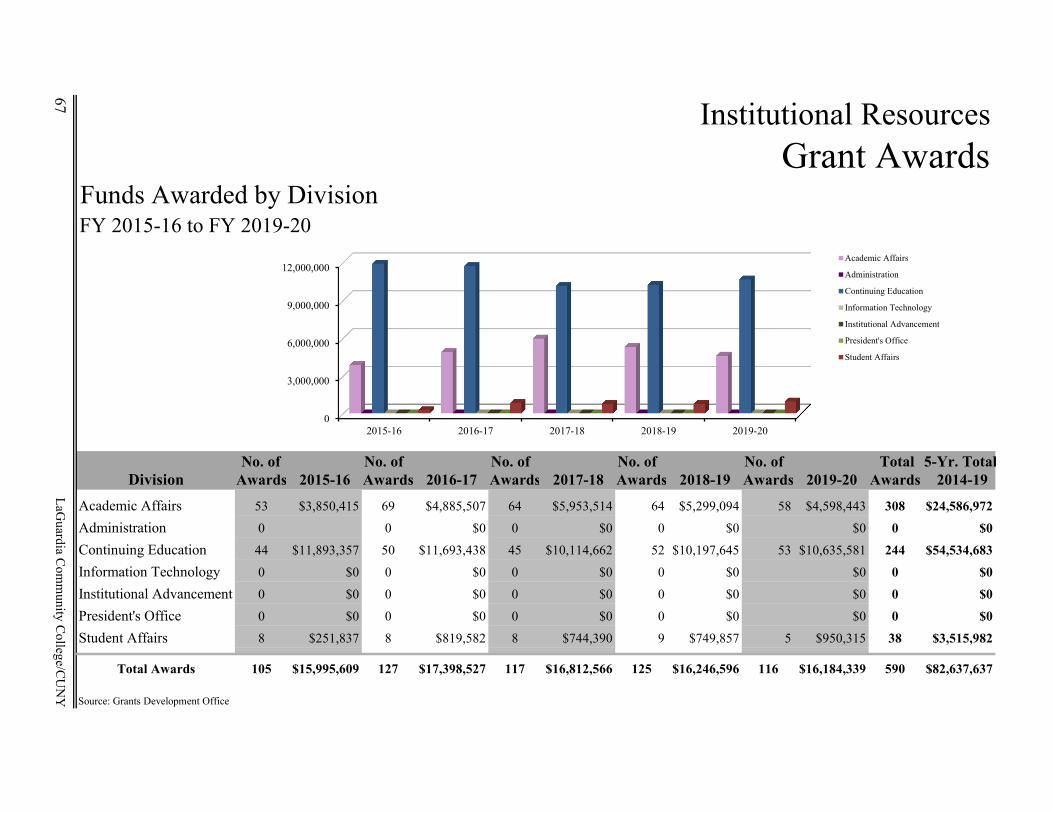
67 Institutional ResourcesGrant Awards
Funds Awarded by DivisionFY 2015-16 to FY 2019-20
No. of No. of No. of No. of No. of Total 5-Yr. TotalDivision Awards 2015-16 Awards 2016-17 Awards 2017-18 Awards 2018-19 Awards 2019-20 Awards 2014-19
Academic Affairs 53 $3,850,415 69 $4,885,507 64 $5,953,514 64 $5,299,094 58 $4,598,443 308 $24,586,972
Administration 0 0 $0 0 $0 0 $0 $0 0 $0
Continuing Education 44 $11,893,357 50 $11,693,438 45 $10,114,662 52 $10,197,645 53 $10,635,581 244 $54,534,683
Information Technology 0 $0 0 $0 0 $0 0 $0 $0 0 $0
Institutional Advancement 0 $0 0 $0 0 $0 0 $0 $0 0 $0
President's Office 0 $0 0 $0 0 $0 0 $0 $0 0 $0
Student Affairs 8 $251,837 8 $819,582 8 $744,390 9 $749,857 5 $950,315 38 $3,515,982
Total Awards 105 $15,995,609 127 $17,398,527 117 $16,812,566 125 $16,246,596 116 $16,184,339 590 $82,637,637
Source: Grants Development Office
LaGuardia C
omm
unity College/C
UN
Y
0
3,000,000
6,000,000
9,000,000
12,000,000
2015-16 2016-17 2017-18 2018-19 2019-20
Academic Affairs
Administration
Continuing Education
Information Technology
Institutional Advancement
President's Office
Student Affairs
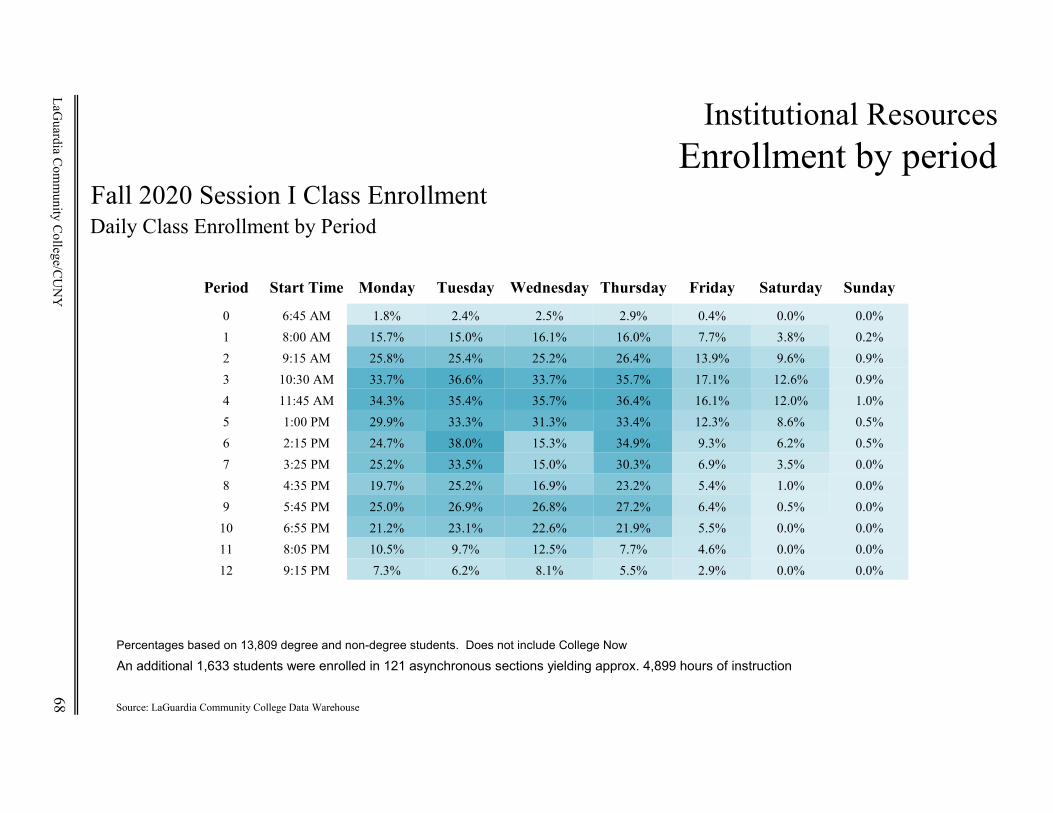
Institutional ResourcesEnrollment by period
Fall 2020 Session I Class EnrollmentDaily Class Enrollment by Period
Period Start Time Monday Tuesday Wednesday Thursday Friday Saturday Sunday
0 6:45 AM 1.8% 2.4% 2.5% 2.9% 0.4% 0.0% 0.0%1 8:00 AM 15.7% 15.0% 16.1% 16.0% 7.7% 3.8% 0.2%2 9:15 AM 25.8% 25.4% 25.2% 26.4% 13.9% 9.6% 0.9%3 10:30 AM 33.7% 36.6% 33.7% 35.7% 17.1% 12.6% 0.9%4 11:45 AM 34.3% 35.4% 35.7% 36.4% 16.1% 12.0% 1.0%5 1:00 PM 29.9% 33.3% 31.3% 33.4% 12.3% 8.6% 0.5%6 2:15 PM 24.7% 38.0% 15.3% 34.9% 9.3% 6.2% 0.5%7 3:25 PM 25.2% 33.5% 15.0% 30.3% 6.9% 3.5% 0.0%8 4:35 PM 19.7% 25.2% 16.9% 23.2% 5.4% 1.0% 0.0%9 5:45 PM 25.0% 26.9% 26.8% 27.2% 6.4% 0.5% 0.0%
10 6:55 PM 21.2% 23.1% 22.6% 21.9% 5.5% 0.0% 0.0%11 8:05 PM 10.5% 9.7% 12.5% 7.7% 4.6% 0.0% 0.0%12 9:15 PM 7.3% 6.2% 8.1% 5.5% 2.9% 0.0% 0.0%
Percentages based on 13,809 degree and non-degree students. Does not include College Now
An additional 1,633 students were enrolled in 121 asynchronous sections yielding approx. 4,899 hours of instruction
68 Source: LaGuardia Community College Data Warehouse
LaGuardia C
omm
unity College/C
UN
Y

Institutional ResourcesSpace
College PropertiesSpring 2021Table 1
Original Construction Alteration Year Net Sq. Gross Sq.
Year Year Occupied Footage FootageShenker Hall (M) 1920 1971-1974 1971 162,067 282,285 Annex Building (E) 1930 1989-1992 1991 222,939 380,286 B Building 1914 2009 2009 107,524 199,787 Center III Building: College-occupied portion (C) 1913 1991-1992 1992 579,520 858,680
Subtotal of All College-Occupied Educational Space 1,072,050 1,721,038 Open Parking Lot (47th Ave. & 29th St.) 1998 106,248 Parking Lot (47th Ave. & 30th St.) 1998 24,115
Subtotal of All College-Occupied Non-Educational Space 130,363
Grand Total of All Educational and Non-Educational Space in Square Feet 1,072,050 1,851,401
Net Square Footage by College Building and Function*Table 2
Shenker E B C All Hall Building Building Building Buildings
57,107 96,446 74,602 161,724 389,879Administration Offices 40,808 41,404 13,591 100,007 195,810Assembly 9,608 19,709 0 3,094 32,411Campus Services 5,197 41 163 15,839 21,240Computing and Telecom 2,014 0 0 412 2,426Instructional Resources 2,938 4,762 15,178 2,363 25,241Library 246 45,070 0 0 45,316Physical Education 17,428 10,271 0 781 28,480Student/Faculty Services 25,980 4,646 154 19,203 49,983Other 741 590 3,836 276,097 281,264
Grand Totals in Square Feet 162,067 222,939 107,524 579,520 1,072,050* The total NSF 1,072,050 includes the educational facilities only. It excludes all non-educational facilities as defined above in Table 1.
Instructional SpaceTable 3
Shenker E B C All Hall Building Building Building Buildings
Classrooms and Lecture Halls 20,816 17,981 32,085 55,440 126,322Class Laboratories 15,552 47,863 11,772 29,533 104,720Research and Support 1,711 0 1,149 1,875 4,735Academic Offices 19,028 30,602 29,596 74,876 154,102
Totals in Square Feet 57,107 96,446 74,602 161,724 389,879Source: Campus Facilities Office/Division of Administration
69 LaGuardia Community College/CUNY
Instruction Space (See Detail in Table 3 below)
Function
Building Name
Function
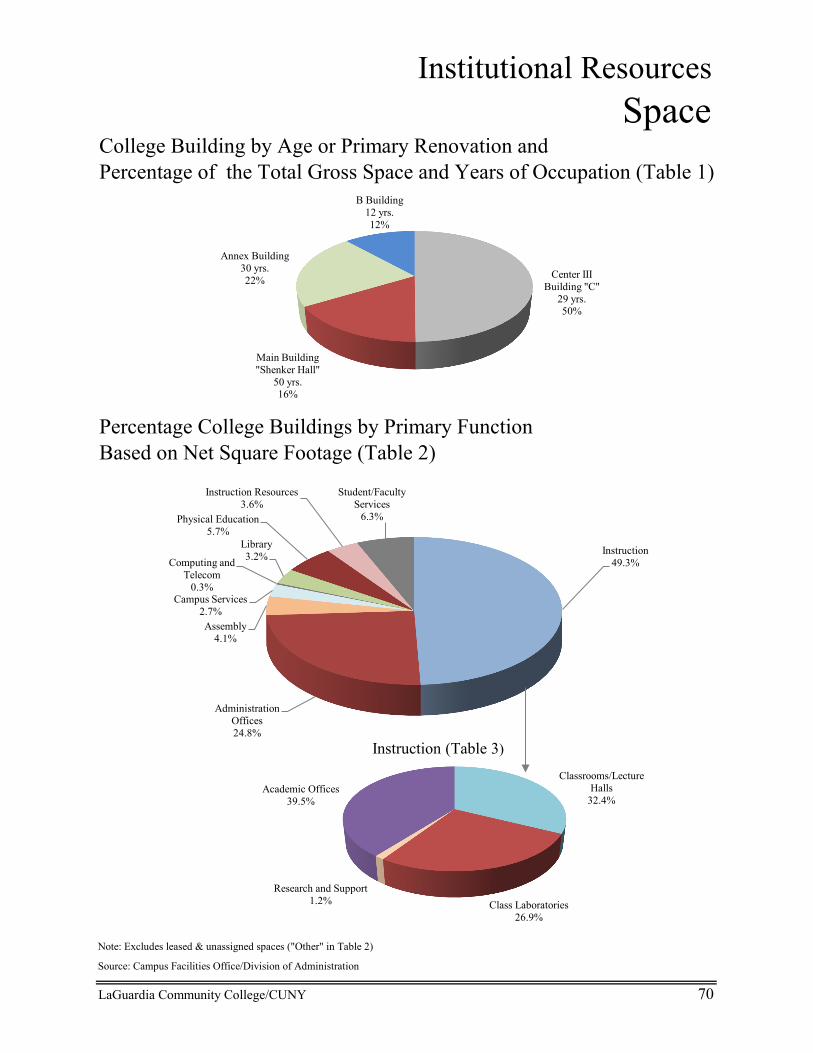
Institutional ResourcesSpace
College Building by Age or Primary Renovation and Percentage of the Total Gross Space and Years of Occupation (Table 1)
Percentage College Buildings by Primary FunctionBased on Net Square Footage (Table 2)
Note: Excludes leased & unassigned spaces ("Other" in Table 2)
Source: Campus Facilities Office/Division of Administration
LaGuardia Community College/CUNY 70
Instruction49.3%
Administration Offices24.8%
Assembly4.1%
Campus Services2.7%
Computing and Telecom
0.3%
Library3.2%
Physical Education5.7%
Instruction Resources3.6%
Student/Faculty Services
6.3%
Classrooms/Lecture Halls
32.4%
Class Laboratories26.9%
Research and Support1.2%
Academic Offices39.5%
Instruction (Table 3)
Center III Building "C"
29 yrs.50%
Main Building "Shenker Hall"
50 yrs.16%
Annex Building 30 yrs.22%
B Building 12 yrs.12%

An online version of the complete 2021 Institutional Profile, as well as many other LaGuardia statistics and reports are available on the Institutional Research & Assessment Office website at www.laguardia.edu/ir/
31-10 Thomson AvenueLong Island City, NY 11101718-482-7200www.laguardia.edu