Embed Size (px)
Citation preview
Int. J. Corros. Scale Inhib., 2013, 2, no. 4, 287–303
Laboratory assessment of the efficiency of corrosion inhibitors
at oilfield pipelines of the West Siberia region
V. Rotating cylinder and cage
I. A. Gedvillo,1 S. V. Oleinik,
1 I. S. Sivokon
2 and N. N. Andreev
1
1A. N. Frumkin Institute of Physical Chemistry and Electrochemistry, Russian Academy
of Sciences, Leninskii pr. 31, Moscow, 119071 Russian Federation
*E-mail: [email protected] 2Open Joint Stock Company TNK-BP Management, Moscow
Abstract
This paper continues a series of publications dedicated to lab assessment of efficiency of
carbon dioxide corrosion inhibitors at the oilfield pipelines of West Siberia region. It reviews
the results of tests performed on “rotating cylinder” and “rotating cage” facilities. The article
reviews the effect of temperature, specimen surface condition, flow velocity, presence of a
hydrocarbon phase and inhibitor concentration on corrosion rate and protective properties of
a wide range of commercial inhibitors. Recommendations on specific inhibitor test
conditions are given to assess their applicability for protection of water lines, oil pipelines
with low watercut and oil pipelines with high product watercut.
Key words: corrosion inhibitors, test methods, oilfield pipelines.
Received: September 1, 2013. doi: 10.17675/2305-6894-2013-2-4-287-303
Previously [1 – 3], the specifics of tests in glass U-cell, flow-through recirculation loop,
and bubble method have been studied to assess the efficiency of carbon dioxide corrosion
inhibitors. This paper reviews the potential of another two methods for inhibitor testing
that according to [4 – 9] are quite accurate in simulation of the corrosion scenario in oilfield
pipelines, namely, the rotating cylindrical electrode and rotating cage methods.
The potential of these methods was analyzed by the example of the same inhibitors as
in the previous articles [1 – 3], so the numeration of the inhibitors accepted there is kept
unchanged. Inhibitors No. 3, 4 and 7 are qualified by the manufacturers as imidazolines
and No. 5 is a quaternary ammonium base. Inhibitor No.1 is a mixture of quaternary
ammonium bases and imidazoline derivatives. Inhibitors No. 2 and 6 are amines.
Experimental
The rotating cylindrical electrode method involves measuring the corrosion rates (K) of a
steel cylinder rotating at a certain rate in corrosive liquid media placed in an air-tight
electrochemical cell. The K values were estimated on the basis of specimen mass loss and
by the polarization curve method [10]. At least five parallel experiments were made in each
test fluid.
Int. J. Corros. Scale Inhib., 2013, 2, no. 4, 287–303 288
The outward appearance of the unit was published previously [4]. It consists of a glass
electrochemical cell fit with a jacket and an electric belt drive that ensures rotation of a
metal cylinder with isolated end face surface. A platinum mesh was used as the auxiliary
electrode and a saturated silver/silver chloride electrode was the reference electrode.
Before a test, the cell was washed with a detergent, with distilled water, then rinsed
with ethanol and dried. After that, it was re-installed on the rack, and a cylindrical steel
specimen was fastened to the shaft holder. The cell was purged down for 10 minutes with
an inert gas flow to remove oxygen. To keep the required temperature (t), the cell jacket
was connected to the thermostat.
The simulation fluid (0.2 liters) prepared for the tests was pressure-forced by the inert
gas flow into the test cell. After that, liquid circulation in the jacket and electrode rotation
were started. The flow rate of the corrosive fluid sustained by the drive belt was 1 m/s,
1.9 m/s, or 4.1 m/s. The tests lasted for 6 hours.
In 5.0 hours after a tests start, anodic and cathodic polarization curves were recorded
using an IPC-Pro potentiostat at a potentiodynamic scan rate of 60 mV/min. The maximum
potential displacement with respect to the corrosion potential was 0.30 V.
The rotating “cage” method involves corrosion rate measurement of steel specimens
fastened in a special cage rotated by an electric motor in liquid corrosive environments. At
least three parallel experiments were made in each test fluid. The mass loss was estimated
in at least six specimens from each test.
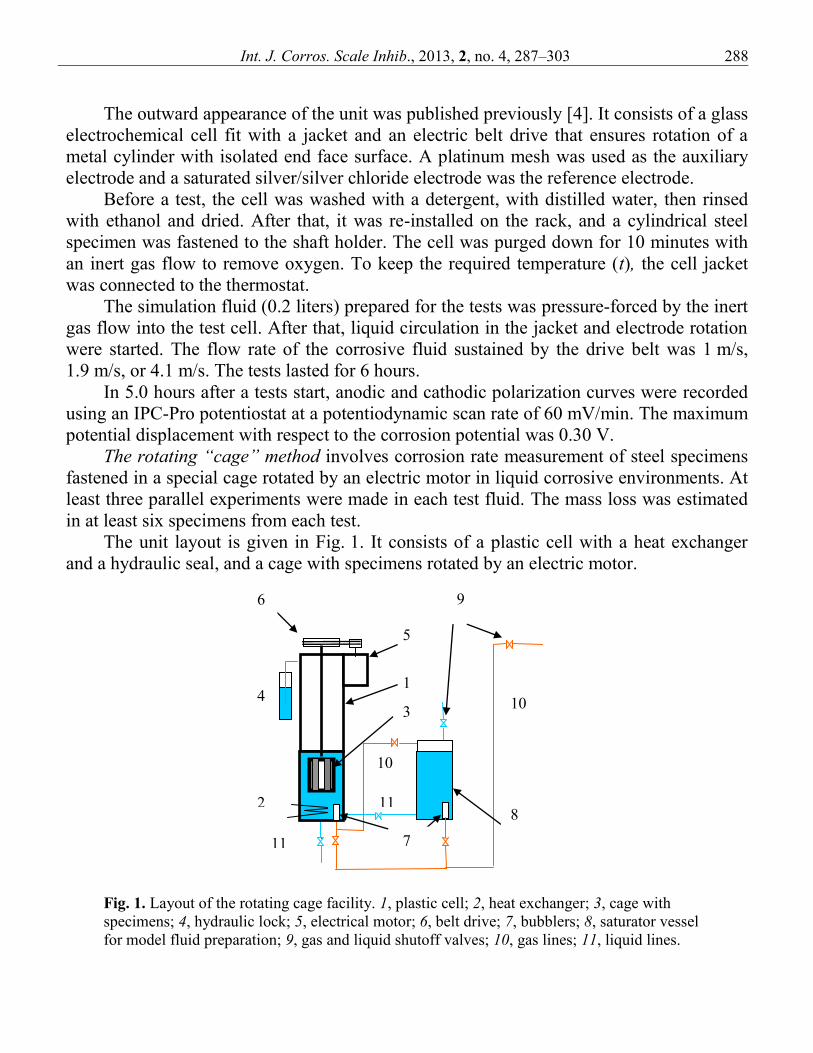
The unit layout is given in Fig. 1. It consists of a plastic cell with a heat exchanger
and a hydraulic seal, and a cage with specimens rotated by an electric motor.
Fig. 1. Layout of the rotating cage facility. 1, plastic cell; 2, heat exchanger; 3, cage with
specimens; 4, hydraulic lock; 5, electrical motor; 6, belt drive; 7, bubblers; 8, saturator vessel
for model fluid preparation; 9, gas and liquid shutoff valves; 10, gas lines; 11, liquid lines.
1
2
4 3
5
7
8
6 9
11
10
10
11
Int. J. Corros. Scale Inhib., 2013, 2, no. 4, 287–303 289
Before the tests, the facility was disassembled. The elements contacting a test fluid
were washed with a detergent, then with distilled water and dried. After that, the cell was
re-installed and the specimens mounted on the holder. The cell was purged for 30 minutes
with an inert gas flow to remove dissolved oxygen.
After the simulation fluid (15 liters) was prepared for the tests, it was pressure-forced
by the inert gas flow into the test cell and the electric motor was started (v = 160 rpm) to
ensure fluid circulation. The tests lasted for 6 hours. The test time was measured from the
moment of cell filling with the simulation fluid.
Preparation of the specimens and the simulation fluids for the tests of both types and
post-test treatment of the specimens were similar to those described in [1].
The corrosion rate (K) was calculated on the basis of specimen mass loss and/or, in
case of the rotating cylinder, on the basis of corrosion current data obtained through
projection of the polarization curves linearized in semilog coordinates to the corrosion
potential.
Results and discussion
Rotating cylinder. In all tests with the rotating cylinder, the polarization curve method
provided erroneously low results. In the polarization curves built in semilog coordinates, it
was impossible to outline close-to-linear sections whose projection to the corrosion
potential would make it possible to estimate K values comparable with those calculated on
the basis of specimen mass loss. The differences between the values identified through
electrochemical and gravimetric methods are illustrated in Table 1 and are very large in
some cases. This made electrochemical measurements not informative and justified the
gravimetrical method for this type of experiments. However, even its accuracy left much to
be desired considering that the continuous operation time of the unit did not exceed 6 hours
and the electrode surface was relatively small. This inherent disadvantage of the unit
mostly affected the efficiency measurement accuracy for the additives tested. By the end of
the test, the adsorption film of the inhibitors was still developing. Be as it may, the data
obtained using this method are presented in Tables 1 and 2. The key focus of the tests was
made on ranking of the additives under conditions simulating the operation of water lines
and oil pipelines with low watercut.
As expected, the effect of the flow rate on K in uninhibited model environments
manifested itself as a K growth with an increase in the electrode rotating speed (Table 1).
At 1 m·s–1
flow rate and t = 8°C, the K values are 15.8 and 25.3 g·m–2
·day–1
for air-
oxidized and activated specimens, respectively, while at 4.1 m·s–1
these values increased
almost twice and now equaled 30.4 and 52 g·m–2
·day–1
, respectively. One can easily note
that the K value is many times smaller in electrochemical measurements. For this reason,
electrochemical measurement data were not taken into consideration in subsequent analysis
of results.
Int. J. Corros. Scale Inhib., 2013, 2, no. 4, 287–303 290
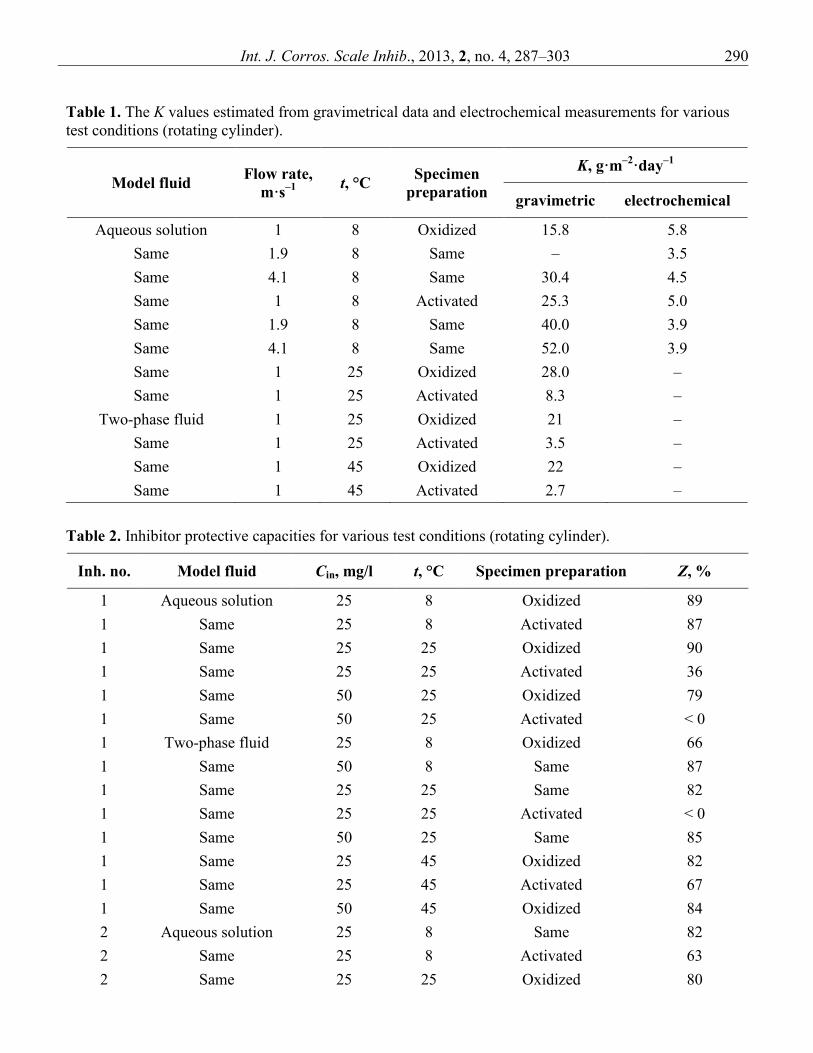
Table 1. The K values estimated from gravimetrical data and electrochemical measurements for various
test conditions (rotating cylinder).
Model fluid Flow rate,
m·s–1 t, °C
Specimen
preparation
K, g·m–2
·day–1
gravimetric electrochemical
Aqueous solution 1 8 Oxidized 15.8 5.8
Same 1.9 8 Same – 3.5
Same 4.1 8 Same 30.4 4.5
Same 1 8 Activated 25.3 5.0
Same 1.9 8 Same 40.0 3.9
Same 4.1 8 Same 52.0 3.9
Same 1 25 Oxidized 28.0 –
Same 1 25 Activated 8.3 –
Two-phase fluid 1 25 Oxidized 21 –
Same 1 25 Activated 3.5 –
Same 1 45 Oxidized 22 –
Same 1 45 Activated 2.7 –
Table 2. Inhibitor protective capacities for various test conditions (rotating cylinder).
Inh. no. Model fluid Cin, mg/l t, °C Specimen preparation Z, %
1 Aqueous solution 25 8 Oxidized 89
1 Same 25 8 Activated 87
1 Same 25 25 Oxidized 90
1 Same 25 25 Activated 36
1 Same 50 25 Oxidized 79
1 Same 50 25 Activated < 0
1 Two-phase fluid 25 8 Oxidized 66
1 Same 50 8 Same 87
1 Same 25 25 Same 82
1 Same 25 25 Activated < 0
1 Same 50 25 Same 85
1 Same 25 45 Oxidized 82
1 Same 25 45 Activated 67
1 Same 50 45 Oxidized 84
2 Aqueous solution 25 8 Same 82
2 Same 25 8 Activated 63
2 Same 25 25 Oxidized 80
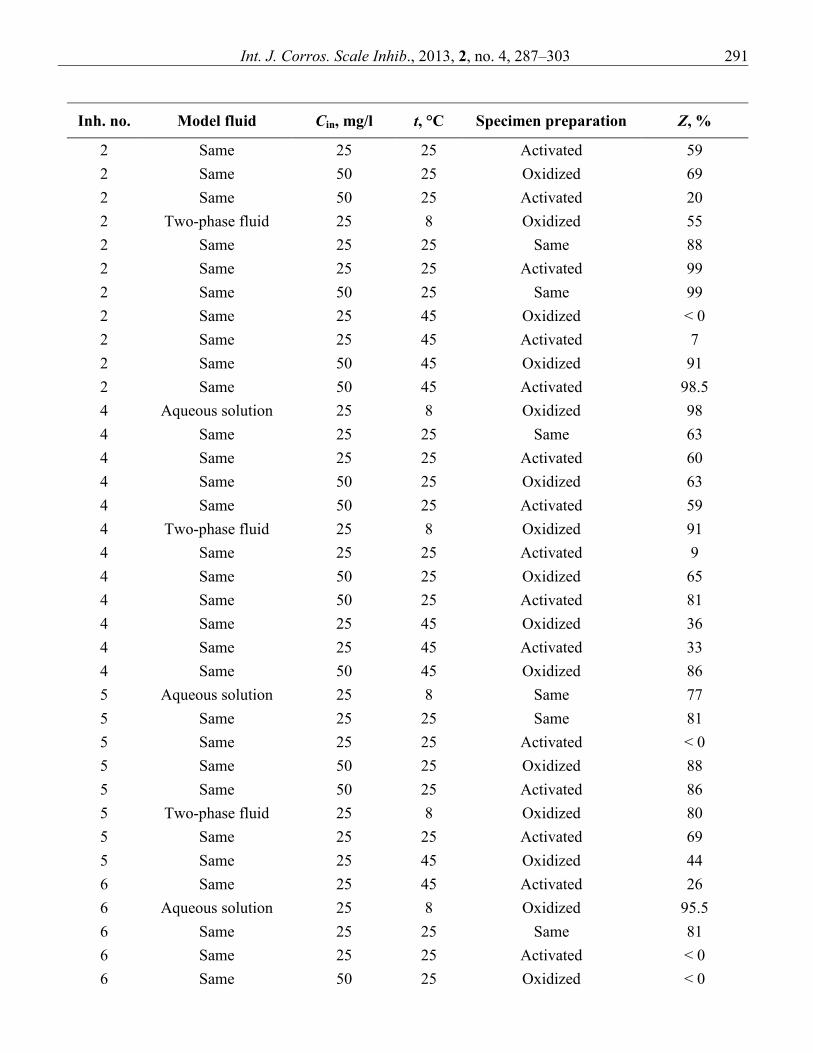
Int. J. Corros. Scale Inhib., 2013, 2, no. 4, 287–303 291
Inh. no. Model fluid Cin, mg/l t, °C Specimen preparation Z, %
2 Same 25 25 Activated 59
2 Same 50 25 Oxidized 69
2 Same 50 25 Activated 20
2 Two-phase fluid 25 8 Oxidized 55
2 Same 25 25 Same 88
2 Same 25 25 Activated 99
2 Same 50 25 Same 99
2 Same 25 45 Oxidized < 0
2 Same 25 45 Activated 7
2 Same 50 45 Oxidized 91
2 Same 50 45 Activated 98.5
4 Aqueous solution 25 8 Oxidized 98
4 Same 25 25 Same 63
4 Same 25 25 Activated 60
4 Same 50 25 Oxidized 63
4 Same 50 25 Activated 59
4 Two-phase fluid 25 8 Oxidized 91
4 Same 25 25 Activated 9
4 Same 50 25 Oxidized 65
4 Same 50 25 Activated 81
4 Same 25 45 Oxidized 36
4 Same 25 45 Activated 33
4 Same 50 45 Oxidized 86
5 Aqueous solution 25 8 Same 77
5 Same 25 25 Same 81
5 Same 25 25 Activated < 0
5 Same 50 25 Oxidized 88
5 Same 50 25 Activated 86
5 Two-phase fluid 25 8 Oxidized 80
5 Same 25 25 Activated 69
5 Same 25 45 Oxidized 44
6 Same 25 45 Activated 26
6 Aqueous solution 25 8 Oxidized 95.5
6 Same 25 25 Same 81
6 Same 25 25 Activated < 0
6 Same 50 25 Oxidized < 0

Int. J. Corros. Scale Inhib., 2013, 2, no. 4, 287–303 292
Inh. no. Model fluid Cin, mg/l t, °C Specimen preparation Z, %
6 Same 50 25 Activated 60
6 Two-phase fluid 25 8 Oxidized 57
6 Same 25 25 Activated < 0
6 Same 50 25 Oxidized 93
6 Same 50 25 Activated 57
7 Aqueous solution 25 8 Oxidized 93
7 Same 25 25 Same 78
7 Same 25 25 Activated < 0
7 Same 50 25 Oxidized 80
7 Same 50 25 Activated 80
7 Two-phase fluid 25 8 Oxidized 79
7 Same 25 25 Activated 70
7 Same 25 45 Oxidized 36
7 Same 25 45 Activated 67
The effect of temperature on the K value in the uninhibited model electrolyte is quite
considerable. Thus, a temperature increase from 8 to 25°C caused a K increase from 15.8
to 28 g·m–2
·day–1
according to gravimetric data (Table 1). On the other hand, in a two-
phase model environment at t = 25 and 45°C, air-oxidized specimens corroded at nearly
the same rate of 21–22 g·m–2
·day–1
in the entire tested temperature range.
The effect of specimen activation on K in the uninhibited model environments also
varies. Thus, preliminary etching enhanced corrosion in the model aqueous solution at t =
8°C: the K value increased from 15.8 to 25.3 g·m–2
·day–1
(Table 1). However, at t = 25°C
in the same electrolyte, the opposite effect of specimen activation on K was observed: the
K value decreased from 28 to 8.3 g·m–2
·day–1
. In the two-phase model environment at t =
25°C, activation hindered corrosion: K decreased from 21.3 to 3.5 g·m–2
·day–1
. This trend
also holds at t = 45°C.
The effect of a hydrocarbon phase on K in uninhibited model environments at 1 m·s–1
flow rate is rather weak. According to mass loss measurements, the presence of
hydrocarbons slightly slows down the corrosion of both air-oxidized and activated
specimens (Table 1).
The effect of inhibitor concentration (Cin) was expressed in most cases as a decrease
in the K value for steel and an increase in the protective effect (Z) with a Cin increase
(Table 2). However, in the model aqueous solution, inhibitor No. 3 at t = 5 and 25°C
activated the corrosion of air-oxidized steel specimens in the Cin range tested (25 and 50
mg/l). Addition of inhibitors No.5, 6 and 7 also stimulated corrosion of activated
specimens at t =25°C in aqueous solution at Cin = 25 mg/l; the effect of inhibitor No. 1 at
Cin = 50 mg/l was similar.
Int. J. Corros. Scale Inhib., 2013, 2, no. 4, 287–303 293
In the model two-phase fluid, corrosion of activated specimens was stimulated upon
addition of 25 mg/l of inhibitors No. 1, 2 and 6. At t = 45°C, this was also observed on air-
oxidized specimens at Cin = 50 mg/l with inhibitor No.2.
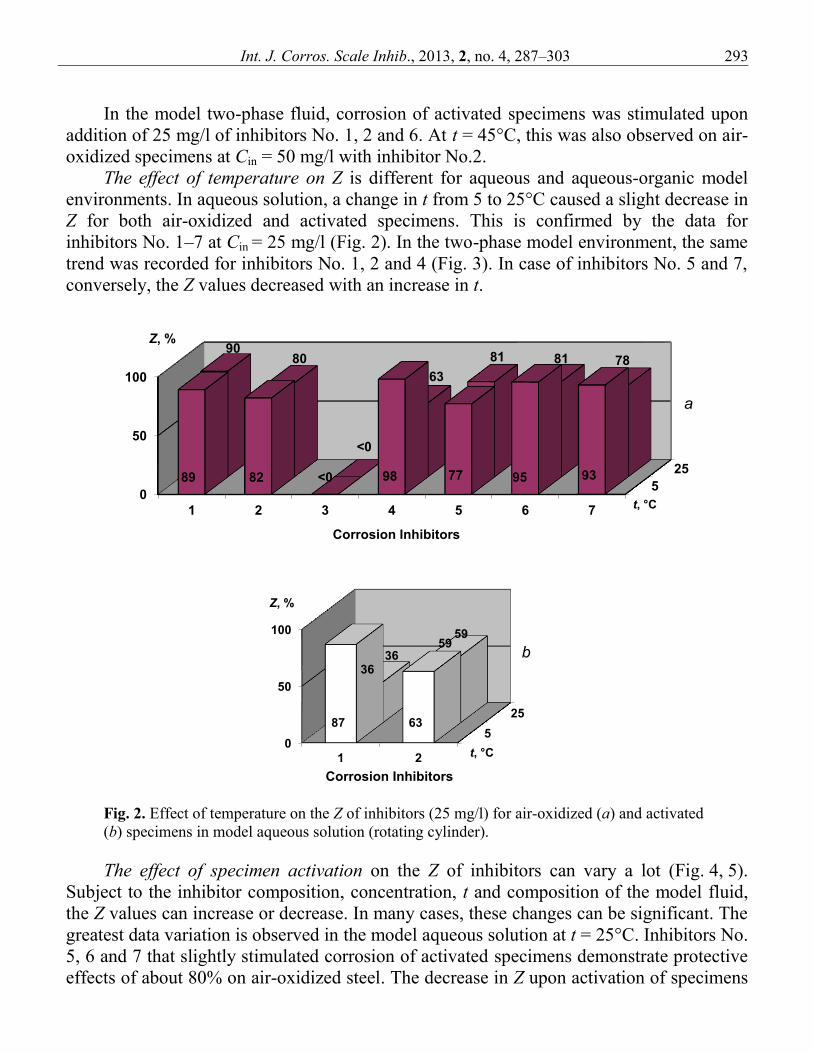
The effect of temperature on Z is different for aqueous and aqueous-organic model
environments. In aqueous solution, a change in t from 5 to 25°C caused a slight decrease in
Z for both air-oxidized and activated specimens. This is confirmed by the data for
inhibitors No. 1–7 at Cin = 25 mg/l (Fig. 2). In the two-phase model environment, the same
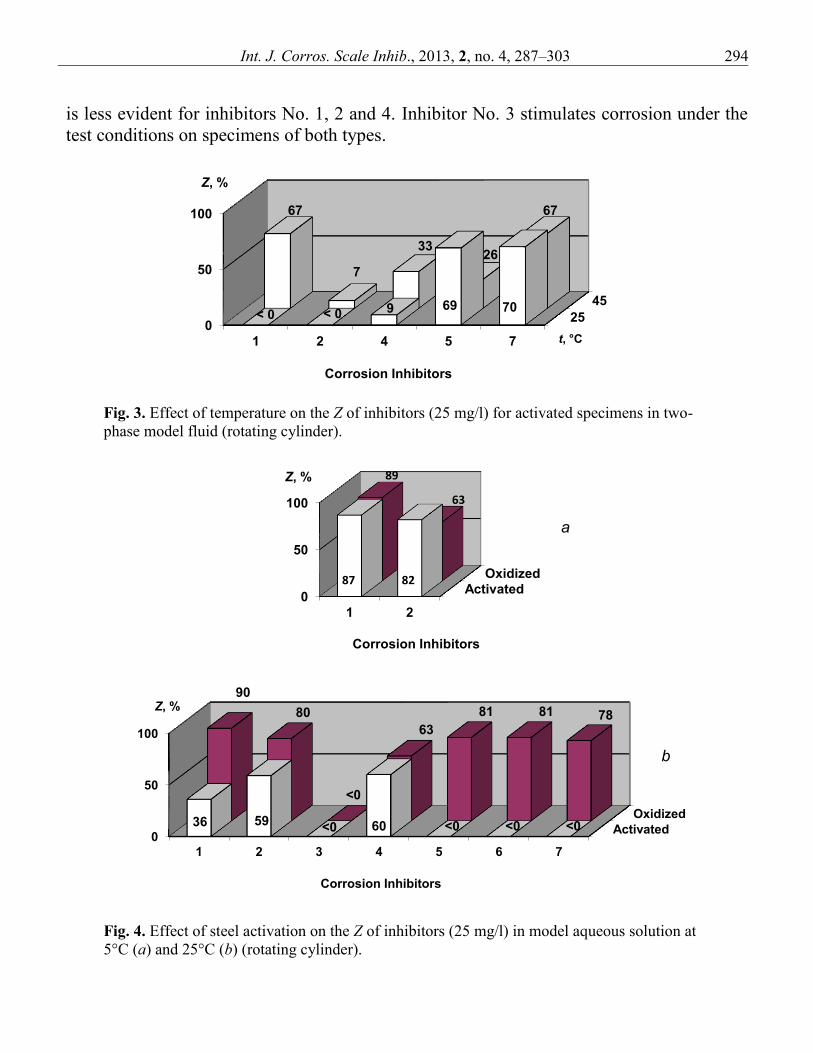
trend was recorded for inhibitors No. 1, 2 and 4 (Fig. 3). In case of inhibitors No. 5 and 7,
conversely, the Z values decreased with an increase in t.
Fig. 2. Effect of temperature on the Z of inhibitors (25 mg/l) for air-oxidized (a) and activated
(b) specimens in model aqueous solution (rotating cylinder).
The effect of specimen activation on the Z of inhibitors can vary a lot (Fig. 4, 5).
Subject to the inhibitor composition, concentration, t and composition of the model fluid,
the Z values can increase or decrease. In many cases, these changes can be significant. The
greatest data variation is observed in the model aqueous solution at t = 25°C. Inhibitors No.
5, 6 and 7 that slightly stimulated corrosion of activated specimens demonstrate protective
effects of about 80% on air-oxidized steel. The decrease in Z upon activation of specimens
5
25
0
50
100
1 2 3 4 5 6 7 t, °C
Z, %
Corrosion Inhibitors
82 <0 98 77 95 93 89
90 80
63
81 81 78
<0
5
25
0
50
100
1 2
36
59
t, °C
Z, %
Corrosion Inhibitors
87 63
36
59
a
b
Int. J. Corros. Scale Inhib., 2013, 2, no. 4, 287–303 294
is less evident for inhibitors No. 1, 2 and 4. Inhibitor No. 3 stimulates corrosion under the
test conditions on specimens of both types.
Fig. 3. Effect of temperature on the Z of inhibitors (25 mg/l) for activated specimens in two-
phase model fluid (rotating cylinder).
Fig. 4. Effect of steel activation on the Z of inhibitors (25 mg/l) in model aqueous solution at
5°C (a) and 25°C (b) (rotating cylinder).
25
45
0
50
100
1 2 4 5 7 t, °C
Z, %
Corrosion Inhibitors
< 0 < 0 9 69 70
67
26 33
7
67
Activated
Oxidized
0
50
100
1 2
Z, %
Corrosion Inhibitors
87 82
89
63
Activated
Oxidized
0
50
100
1 2 3 4 5 6 7
Z, %
Corrosion Inhibitors
59 36 <0 60 <0 <0 <0
<0
90
80
63
81 81 78
a
b
Int. J. Corros. Scale Inhib., 2013, 2, no. 4, 287–303 295
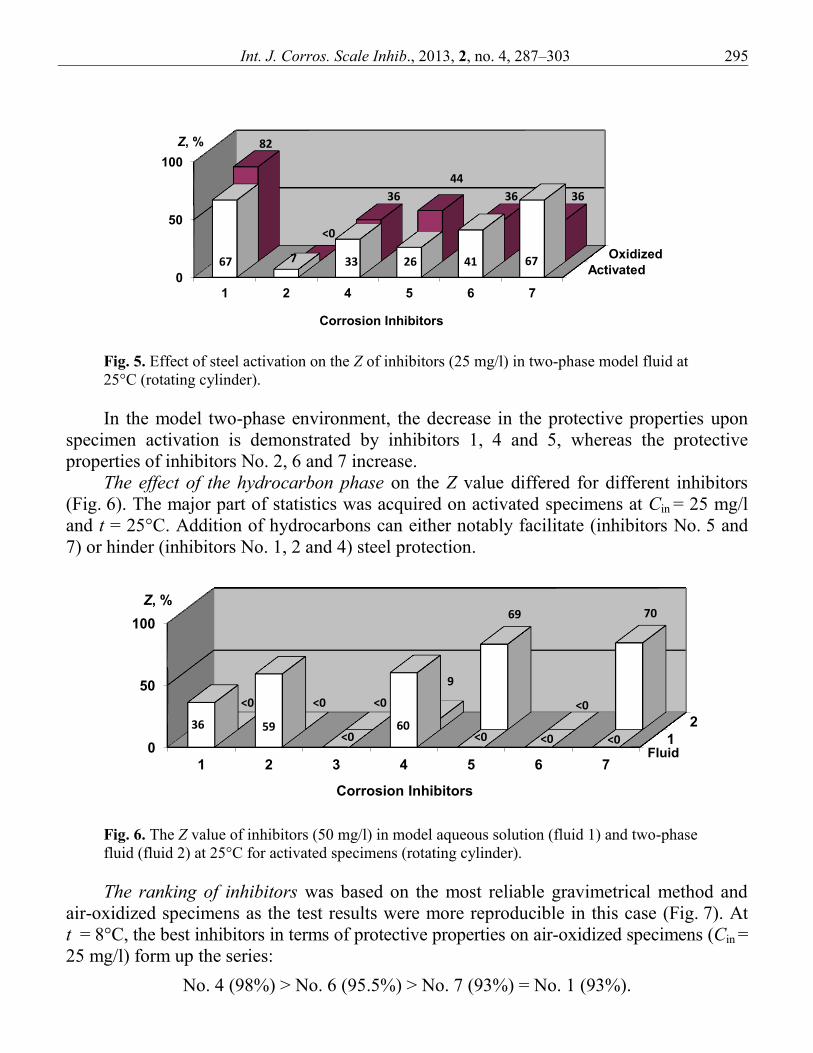
Fig. 5. Effect of steel activation on the Z of inhibitors (25 mg/l) in two-phase model fluid at
25°C (rotating cylinder).
In the model two-phase environment, the decrease in the protective properties upon
specimen activation is demonstrated by inhibitors 1, 4 and 5, whereas the protective
properties of inhibitors No. 2, 6 and 7 increase.
The effect of the hydrocarbon phase on the Z value differed for different inhibitors
(Fig. 6). The major part of statistics was acquired on activated specimens at Cin = 25 mg/l
and t = 25°C. Addition of hydrocarbons can either notably facilitate (inhibitors No. 5 and
7) or hinder (inhibitors No. 1, 2 and 4) steel protection.
Fig. 6. The Z value of inhibitors (50 mg/l) in model aqueous solution (fluid 1) and two-phase
fluid (fluid 2) at 25°C for activated specimens (rotating cylinder).
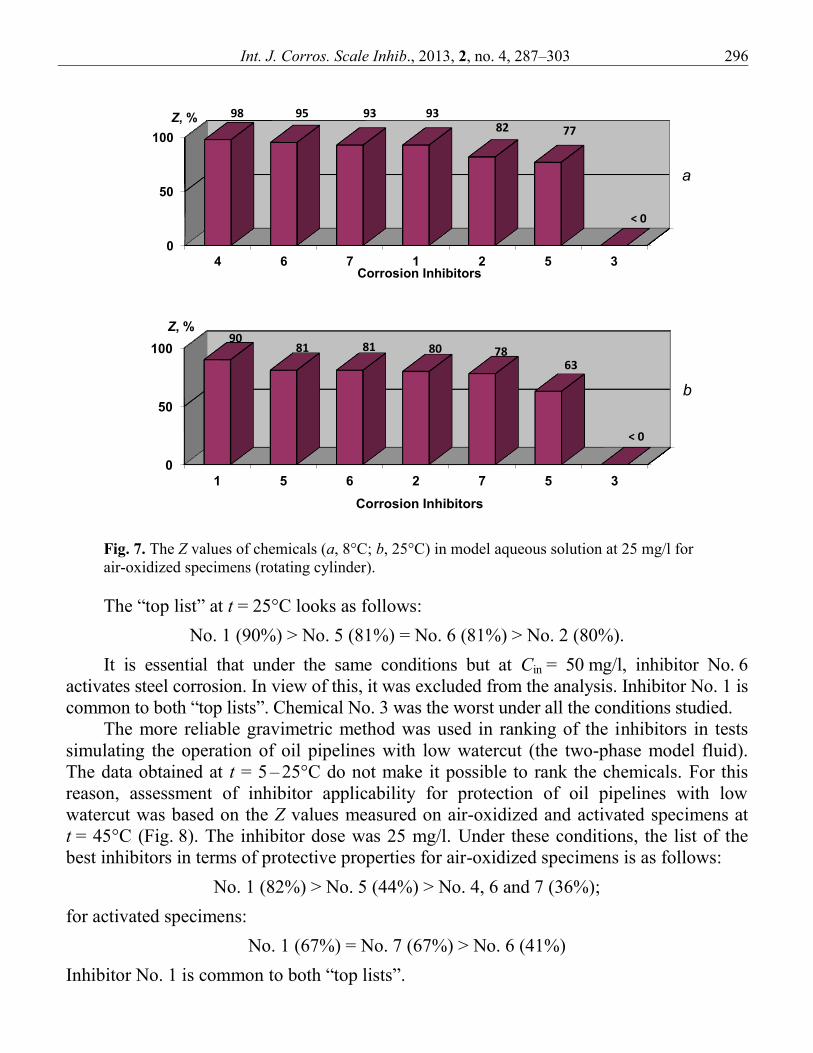
The ranking of inhibitors was based on the most reliable gravimetrical method and
air-oxidized specimens as the test results were more reproducible in this case (Fig. 7). At
t = 8°C, the best inhibitors in terms of protective properties on air-oxidized specimens (Cin =
25 mg/l) form up the series:
No. 4 (98%) > No. 6 (95.5%) > No. 7 (93%) = No. 1 (93%).
Activated
Oxidized
0
50
100
1 2 4 5 6 7
Z, %
Corrosion Inhibitors
67 7 33 26 41 67
82
<0
36
44
36 36
1
2
0
50
100
1 2 3 4 5 6 7
Z, %
Corrosion Inhibitors
Fluid
36 59
<0
60
9
69 70
<0 <0 <0
<0 <0 <0 <0
Int. J. Corros. Scale Inhib., 2013, 2, no. 4, 287–303 296
Fig. 7. The Z values of chemicals (a, 8°C; b, 25°C) in model aqueous solution at 25 mg/l for
air-oxidized specimens (rotating cylinder).
The “top list” at t = 25°C looks as follows:
No. 1 (90%) > No. 5 (81%) = No. 6 (81%) > No. 2 (80%).
It is essential that under the same conditions but at Cin = 50 mg/l, inhibitor No. 6
activates steel corrosion. In view of this, it was excluded from the analysis. Inhibitor No. 1 is
common to both “top lists”. Chemical No. 3 was the worst under all the conditions studied.
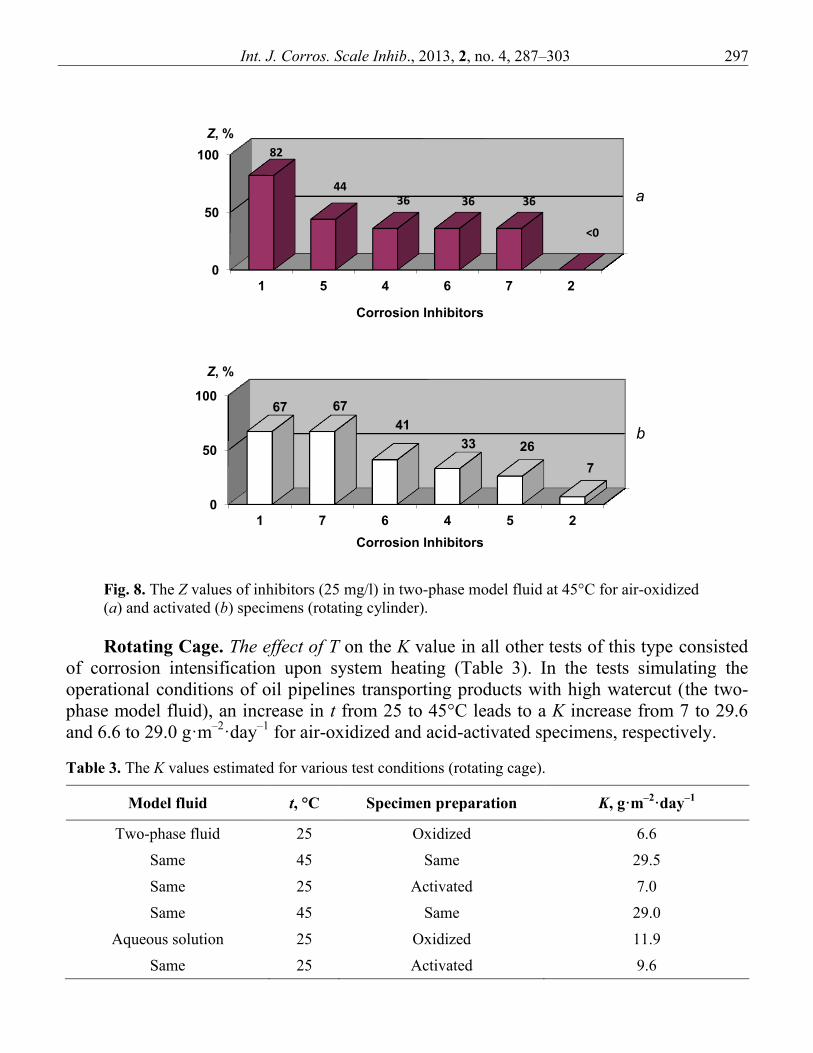
The more reliable gravimetric method was used in ranking of the inhibitors in tests
simulating the operation of oil pipelines with low watercut (the two-phase model fluid).
The data obtained at t = 5 – 25°C do not make it possible to rank the chemicals. For this
reason, assessment of inhibitor applicability for protection of oil pipelines with low
watercut was based on the Z values measured on air-oxidized and activated specimens at
t = 45°C (Fig. 8). The inhibitor dose was 25 mg/l. Under these conditions, the list of the
best inhibitors in terms of protective properties for air-oxidized specimens is as follows:
No. 1 (82%) > No. 5 (44%) > No. 4, 6 and 7 (36%);
for activated specimens:
No. 1 (67%) = No. 7 (67%) > No. 6 (41%)
Inhibitor No. 1 is common to both “top lists”.
0
50
100
4 6 7 1 2 5 3
Z, %
Corrosion Inhibitors
95 98 93 93 82 77
< 0
0
50
100
1 5 6 2 7 5 3
Z, %
Corrosion Inhibitors
90 81 81 80 78
63
< 0
a
b
Int. J. Corros. Scale Inhib., 2013, 2, no. 4, 287–303 297
Fig. 8. The Z values of inhibitors (25 mg/l) in two-phase model fluid at 45°C for air-oxidized
(a) and activated (b) specimens (rotating cylinder).
Rotating Cage. The effect of T on the K value in all other tests of this type consisted
of corrosion intensification upon system heating (Table 3). In the tests simulating the
operational conditions of oil pipelines transporting products with high watercut (the two-
phase model fluid), an increase in t from 25 to 45°C leads to a K increase from 7 to 29.6
and 6.6 to 29.0 g·m–2
·day–1
for air-oxidized and acid-activated specimens, respectively.
Table 3. The K values estimated for various test conditions (rotating cage).
Model fluid t, °C Specimen preparation K, g·m–2
·day–1
Two-phase fluid 25 Oxidized 6.6
Same 45 Same 29.5
Same 25 Activated 7.0
Same 45 Same 29.0
Aqueous solution 25 Oxidized 11.9
Same 25 Activated 9.6
0
50
100
1 5 4 6 7 2
Z, %
Corrosion Inhibitors
82
44 36 36 36
<0
0
50
100
1 7 6 4 5 2
Z, %
Corrosion Inhibitors
67 67
41
33 26
7
a
b
Int. J. Corros. Scale Inhib., 2013, 2, no. 4, 287–303 298
Specimen activation by acid etching nearly does not affect values K across the range
of conditions analyzed (Table 3). Differences in the K values for air-oxidized and activated
specimens did not exceed the test error.
Addition of hydrocarbons to the model fluid slows down the corrosion (Table 3). Thus,
for air-oxidized specimens in the model aqueous solution at t = 25°C, K = 11.9 g·m–2
·day–1
,
while in the model two-phase fluid containing 5% white spirit, K = 7.0 g·m–2
·day–1
. In case
of specimens activated by acid etching, the K value decreased from 9.6 to 6.6 g·m–2
·day–1
after addition of the same quantity of hydrocarbons.
The tested inhibitors reduce steel K in most cases at 25 mg/l, although exceptions
from this rule were observed (Fig. 9). In fact, addition of inhibitor No.1 to the two-phase
model fluid stimulated corrosion of the activated specimens at t = 25°C.
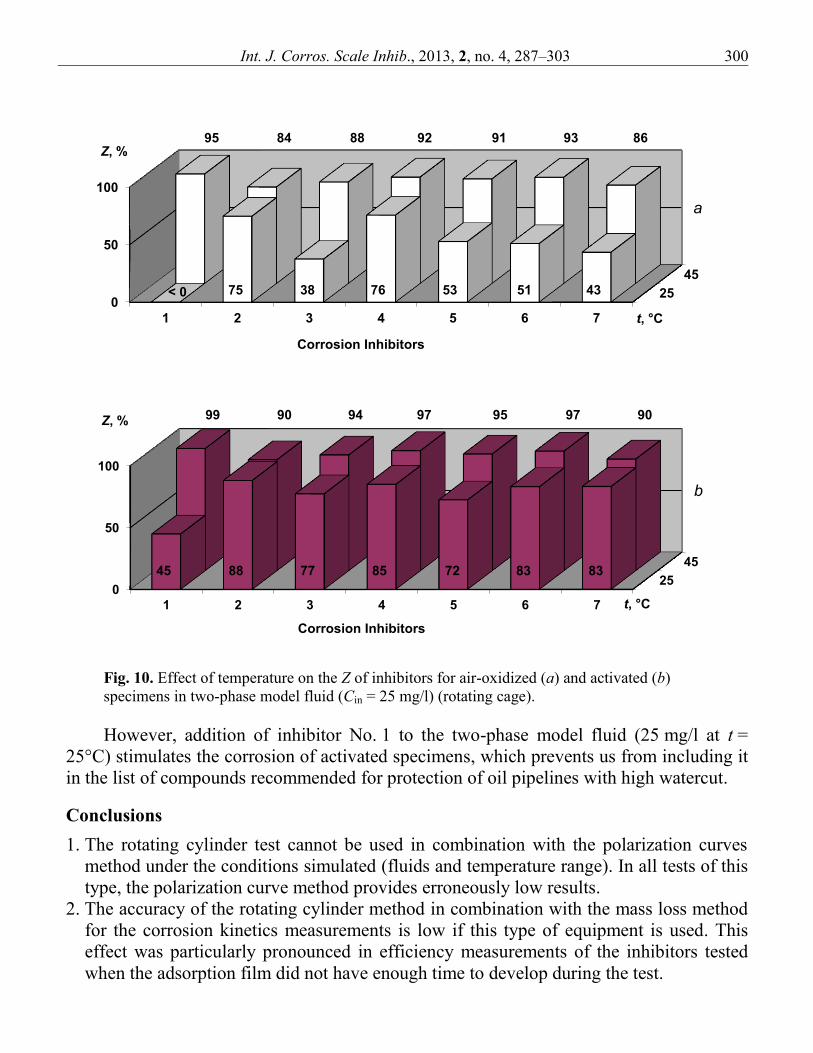
The effect of temperature on the Z value was studied for the two-phase model fluid. In
all cases, an increase in t from 25 to 45°C improved steel protection (Fig. 10).
The effect of specimen activation on the Z value of inhibitors manifested itself as a
decrease in the protective effect. This effect was observed in all tests completed on the
rotating cage facility (Fig. 9).
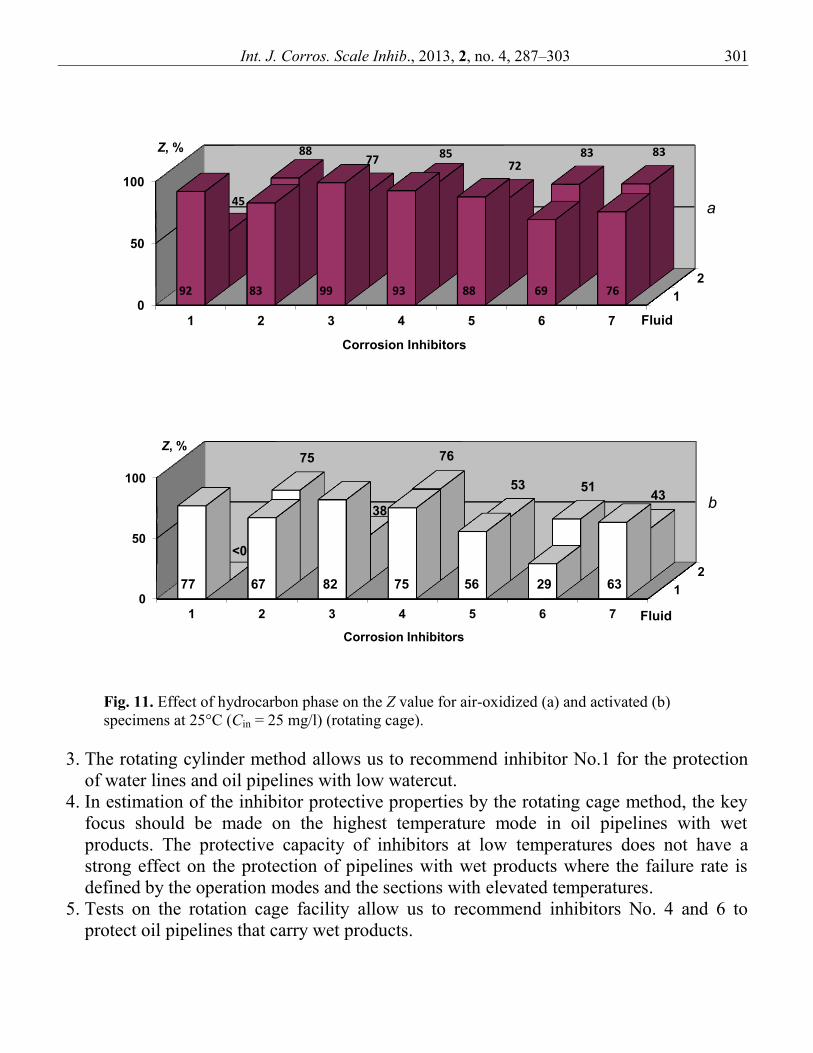
The effect of hydrocarbon phase on the Z value of inhibitors varies (Fig. 11).
Comparison of Z values obtained for the inhibitors tested in the model aqueous solution
and in the two-phase fluid demonstrates that the Z values could increase, decrease, or stay
the same subject to the chemical selected and specimen preparation.
In fact, for air-oxidized specimens, an increase in Z after hydrocarbon addition is
observed for inhibitors No.2, 6 and 7. Conversely, the efficiency of inhibitors No.1, 3, 4,
and 5 decreases.
For activated specimens, white spirit addition to the system is accompanied by an
increase in Z if inhibitors No. 2 and 6 are used. The opposite effect is typical of inhibitors
No. 1, 3 and 7. In case of inhibitors No.4 and 5, transition from the model aqueous
electrolyte to the two-phase fluid practically does not affect the protection efficiency.
To rank inhibitors in the simulation of oil pipelines transporting products with high
watercut (two-phase model fluid), the key focus was made on t = 45°C. This is because
under these conditions, even the best tested inhibitors provided a decrease K to a level
close to the corrosion rate in uninhibited electrolyte at t = 25°C. Thus, the protective
capacity of inhibitors at low t is not likely to have a strong effect on the protection status of
this type of pipelines where the failure rate is defined by the operation modes and the
sections with increased temperature.
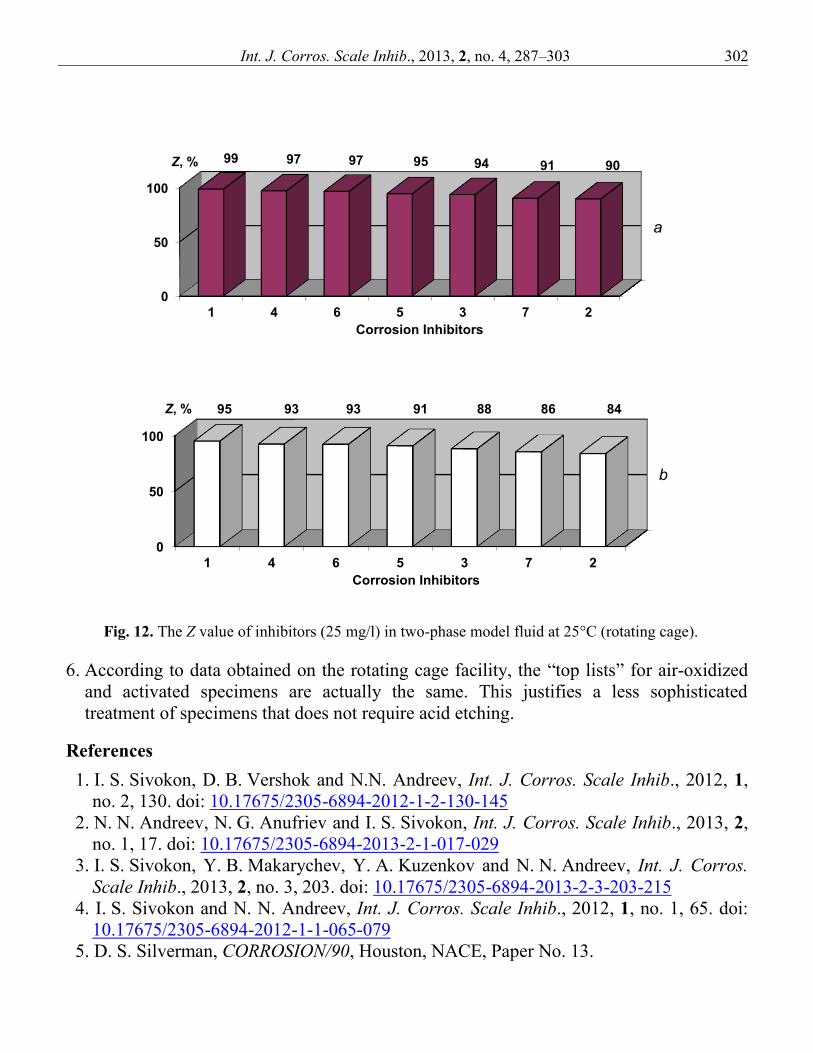
Under the conditions studied, the inhibitor “top list” at 25 mg/l concentration with air-
oxidized specimens was as follows (Fig. 12):
No. 1 (98.9%) > No. 4 (97.2%) > No. 6 (96.8%).
It is practically the same as the “top list” for activated specimens:
No. 1 (95.3%) > No. 4 (92.6%) > No. 6 (92.5%).
In both cases, the worst performance was provided by inhibitors No. 7 and No. 2.

Int. J. Corros. Scale Inhib., 2013, 2, no. 4, 287–303 299
Fig. 9. Effect of inhibitors on the Z value for air-oxidized and activated specimens in model
aqueous solution at 25°C (a), in two-phase model fluid at 25 (b) and 45°C (c) (rotating cage).
Activated
Oxidized
0
50
100
1 2 3 4 5 6 7
Z, %
Corrosion Inhibitors
77 67 82 75 57 29 63
92 83
99 93 88
69 76
Activated
Oxidized
0
50
100
1 2 4 5 6 7 8
Z, %
Corrosion Inhibitors
<0 75 38 76 53 51 43
45
88 77
85 72
83 43
Activated
Oxidized
0
50
100
1 2 3 4 5 6 7
Z, %
Corrosion Inhibitors
95 84 88 93 57 29 63
99 90 94 97 91 93 86
a
b
c
Int. J. Corros. Scale Inhib., 2013, 2, no. 4, 287–303 300
Fig. 10. Effect of temperature on the Z of inhibitors for air-oxidized (a) and activated (b)
specimens in two-phase model fluid (Cin = 25 mg/l) (rotating cage).
However, addition of inhibitor No. 1 to the two-phase model fluid (25 mg/l at t =
25°C) stimulates the corrosion of activated specimens, which prevents us from including it
in the list of compounds recommended for protection of oil pipelines with high watercut.
Conclusions
1. The rotating cylinder test cannot be used in combination with the polarization curves
method under the conditions simulated (fluids and temperature range). In all tests of this
type, the polarization curve method provides erroneously low results.
2. The accuracy of the rotating cylinder method in combination with the mass loss method
for the corrosion kinetics measurements is low if this type of equipment is used. This
effect was particularly pronounced in efficiency measurements of the inhibitors tested
when the adsorption film did not have enough time to develop during the test.
25
45
0
50
100
1 2 3 4 5 6 7
Z, %
Corrosion Inhibitors
t, °C
< 0 75 38 76 53 51 43
95 84 88 92 91 93 86
25
45
0
50
100
1 2 3 4 5 6 7
Z, %
Corrosion Inhibitors
t, °C
45 88 77 85 72 83 83
99 90 94 97 95 97 90
a
b
Int. J. Corros. Scale Inhib., 2013, 2, no. 4, 287–303 301
Fig. 11. Effect of hydrocarbon phase on the Z value for air-oxidized (a) and activated (b)
specimens at 25°C (Cin = 25 mg/l) (rotating cage).
3. The rotating cylinder method allows us to recommend inhibitor No.1 for the protection
of water lines and oil pipelines with low watercut.
4. In estimation of the inhibitor protective properties by the rotating cage method, the key
focus should be made on the highest temperature mode in oil pipelines with wet
products. The protective capacity of inhibitors at low temperatures does not have a
strong effect on the protection of pipelines with wet products where the failure rate is
defined by the operation modes and the sections with elevated temperatures.
5. Tests on the rotation cage facility allow us to recommend inhibitors No. 4 and 6 to
protect oil pipelines that carry wet products.
1
2
0
50
100
1 2 3 4 5 6 7
Z, %
Corrosion Inhibitors
Fluid
92 83 99 93 88 69 76
45
88 77 85
72 83 83
1
2
0
50
100
1 2 3 4 5 6 7
Z, %
Corrosion Inhibitors
Fluid
77 67 82 75 56 29 63
<0
75
38
76
53 51 43
a
b
Int. J. Corros. Scale Inhib., 2013, 2, no. 4, 287–303 302
Fig. 12. The Z value of inhibitors (25 mg/l) in two-phase model fluid at 25°C (rotating cage).
6. According to data obtained on the rotating cage facility, the “top lists” for air-oxidized
and activated specimens are actually the same. This justifies a less sophisticated
treatment of specimens that does not require acid etching.
References
1. I. S. Sivokon, D. B. Vershok and N.N. Andreev, Int. J. Corros. Scale Inhib., 2012, 1,
no. 2, 130. doi: 10.17675/2305-6894-2012-1-2-130-145
2. N. N. Andreev, N. G. Anufriev and I. S. Sivokon, Int. J. Corros. Scale Inhib., 2013, 2,
no. 1, 17. doi: 10.17675/2305-6894-2013-2-1-017-029
3. I. S. Sivokon, Y. B. Makarychev, Y. A. Kuzenkov and N. N. Andreev, Int. J. Corros.
Scale Inhib., 2013, 2, no. 3, 203. doi: 10.17675/2305-6894-2013-2-3-203-215
4. I. S. Sivokon and N. N. Andreev, Int. J. Corros. Scale Inhib., 2012, 1, no. 1, 65. doi:
10.17675/2305-6894-2012-1-1-065-079
5. D. S. Silverman, CORROSION/90, Houston, NACE, Paper No. 13.
0
50
100
1 4 6 5 3 7 2
Z, %
Corrosion Inhibitors
99 97 97 95 94 91 90
0
50
100
1 4 6 5 3 7 2
Z, %
Corrosion Inhibitors
95 93 93 91 88 86 84
a
b
Int. J. Corros. Scale Inhib., 2013, 2, no. 4, 287–303 303
6. S. Papavinasam, R. V. Revie and M. Bartos, CORROSION/2004, Houston, NACE,
Paper No. 42.
7. S. Papavinasam, R. V. Revie, M. Attard, A. Demoz, H. Sun, J. C. Donini and
K. Michaelian, 9th Europ. Symp. on Corrosion Inhibitors, Ferrara, 2000, 989.
8. S. Papavinasam, R. V. Revie, M. Attard, A. Demoz, J. C. Donini and K. Michaelian,
CORROSION/2001, Houston, NACE, Paper No. 01061.
9. ASTM standard G 170-06. Standard guide for evaluating and qualifying oilfield and
refinery corrosion inhibitors in the laboratory, ASTM International, 2006.
10. GOST 9.506–87, Unified system of protection from corrosion and ageing. Metal
corrosion inhibitors in water and crude environment. Protective capacity testing
methods, Moscow, Standards publishing house, 1988 (in Russian).