Embed Size (px)
Citation preview
PNNL-16482
Laboratory Assessment of Potential Impacts to Dungeness Crabs from Disposal of Dredged Material from the Columbia River J. Vavrinec W.H. Pearson N.P. Kohn J.R. Skalski C. Lee K.D. Hall B.A. Romano M.C. Miller T.P. Khangaonkar May 2007 Final Report Prepared for the U.S. Army Corps of Engineers, Portland District Portland, Oregon under a Related Services Agreement with the U.S. Department of Energy Contract DE-AC05-76RL01830

DISCLAIMER
This report was prepared as an account of work sponsored by an agency of the United States Government. Neither the United States Government nor any agency thereof, nor Battelle Memorial Institute, nor any of their employees, makes any warranty, express or implied, or assumes any legal liability or responsibility for the accuracy, completeness, or usefulness of any information, apparatus, product, or process disclosed, or represents that its use would not infringe privately owned rights. Reference herein to any specific commercial product, process, or service by trade name, trademark, manufacturer, or otherwise does not necessarily constitute or imply its endorsement, recommendation, or favoring by the United States Government or any agency thereof, or Battelle Memorial Institute. The views and opinions of authors expressed herein do not necessarily state or reflect those of the United States Government or any agency thereof.
PACIFIC NORTHWEST NATIONAL LABORATORY operated by BATTELLE
for the UNITED STATES DEPARTMENT OF ENERGY
under Contract DE-AC05-76RL01830
Printed in the United States of America
Available to DOE and DOE contractors from the Office of Scientific and Technical Information,
P.O. Box 62, Oak Ridge, TN 37831-0062; ph: (865) 576-8401 fax: (865) 576-5728
email: [email protected]
Available to the public from the National Technical Information Service, U.S. Department of Commerce, 5285 Port Royal Rd., Springfield, VA 22161
ph: (800) 553-6847 fax: (703) 605-6900
email: [email protected] online ordering: http://www.ntis.gov/ordering.htm
This document was printed on recycled paper.
(9/2003)
PNNL-16482 Laboratory Assessment of Potential Impacts to Dungeness Crabs from Disposal of Dredged Material from the Columbia River J. Vavrinec W.H. Pearson1
N.P. Kohn J. R. Skalski2
C. Lee K.D. Hall B.A. Romano M.C. Miller T.P. Khangaonkar Marine Sciences Laboratory Sequim, Washington May 2007 Final Report Prepared for the U.S. Army Corps of Engineers, Portland District Portland, Oregon under a Related Services Agreement with the U.S. Department of Energy Contract DE-AC05-76RL01830 Pacific Northwest National Laboratory Richland, Washington 99352
1Peapod Research, Port Angeles, Washington. 2University of Washington, Seattle, Washington.
vii
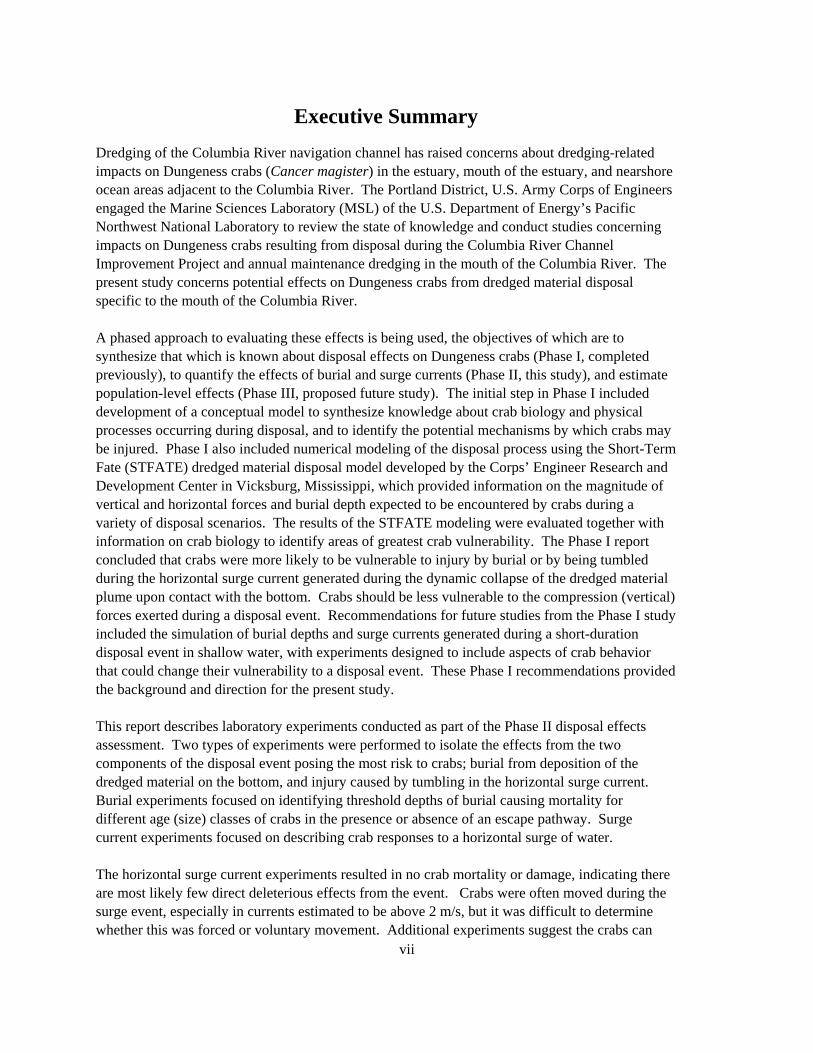
Executive Summary Dredging of the Columbia River navigation channel has raised concerns about dredging-related impacts on Dungeness crabs (Cancer magister) in the estuary, mouth of the estuary, and nearshore ocean areas adjacent to the Columbia River. The Portland District, U.S. Army Corps of Engineers engaged the Marine Sciences Laboratory (MSL) of the U.S. Department of Energy’s Pacific Northwest National Laboratory to review the state of knowledge and conduct studies concerning impacts on Dungeness crabs resulting from disposal during the Columbia River Channel Improvement Project and annual maintenance dredging in the mouth of the Columbia River. The present study concerns potential effects on Dungeness crabs from dredged material disposal specific to the mouth of the Columbia River. A phased approach to evaluating these effects is being used, the objectives of which are to synthesize that which is known about disposal effects on Dungeness crabs (Phase I, completed previously), to quantify the effects of burial and surge currents (Phase II, this study), and estimate population-level effects (Phase III, proposed future study). The initial step in Phase I included development of a conceptual model to synthesize knowledge about crab biology and physical processes occurring during disposal, and to identify the potential mechanisms by which crabs may be injured. Phase I also included numerical modeling of the disposal process using the Short-Term Fate (STFATE) dredged material disposal model developed by the Corps’ Engineer Research and Development Center in Vicksburg, Mississippi, which provided information on the magnitude of vertical and horizontal forces and burial depth expected to be encountered by crabs during a variety of disposal scenarios. The results of the STFATE modeling were evaluated together with information on crab biology to identify areas of greatest crab vulnerability. The Phase I report concluded that crabs were more likely to be vulnerable to injury by burial or by being tumbled during the horizontal surge current generated during the dynamic collapse of the dredged material plume upon contact with the bottom. Crabs should be less vulnerable to the compression (vertical) forces exerted during a disposal event. Recommendations for future studies from the Phase I study included the simulation of burial depths and surge currents generated during a short-duration disposal event in shallow water, with experiments designed to include aspects of crab behavior that could change their vulnerability to a disposal event. These Phase I recommendations provided the background and direction for the present study. This report describes laboratory experiments conducted as part of the Phase II disposal effects assessment. Two types of experiments were performed to isolate the effects from the two components of the disposal event posing the most risk to crabs; burial from deposition of the dredged material on the bottom, and injury caused by tumbling in the horizontal surge current. Burial experiments focused on identifying threshold depths of burial causing mortality for different age (size) classes of crabs in the presence or absence of an escape pathway. Surge current experiments focused on describing crab responses to a horizontal surge of water. The horizontal surge current experiments resulted in no crab mortality or damage, indicating there are most likely few direct deleterious effects from the event. Crabs were often moved during the surge event, especially in currents estimated to be above 2 m/s, but it was difficult to determine whether this was forced or voluntary movement. Additional experiments suggest the crabs can
viii
either maintain their orientation, or quickly right themselves after being moved in a surge current. The few individuals that landed inverted were able to right themselves within seconds, which was faster than the settlement of the sediment producing burial. Therefore, it is not probable that the crabs can be buried in an inverted position. The burial study results indicate that suffocation from the mound created during a disposal event may be a concern to Columbia River crab populations, depending on burial depth. Logistic regression analyses of the burial test data suggest that survival increases as burial depth decreases, and survival increases as crab size increases. Male crabs had a higher survival rate than female crabs. In this study, crab survival was not significantly dependent on the initial burrowed state (i.e., whether a crab was on the surface or buried prior to the burial event). Within the range of observations, carapace hardness was unrelated to the survival of the buried crabs. The survivorship curves suggest that the 3+ age class of crabs (>150 mm carapace width [CW]) is most likely able to survive the maximum 12-cm burial depth predicted by the Phase I study for typical disposal operations. The 2+ age class, however, is predicted to experience significant mortality at a burial depth of 12 cm: 47% mortality in females and 20% in males. The elevated crab mortality from burial, as measured during this study, could be less during an actual disposal operation because of the surge current generated during the disposal operation. Although the actual distances moved by the crabs resulting from the surge current could not be definitively evaluated because of the scaling effects in the experimental flume, it was apparent that the surge currents were able to move the crabs. Based on the STFATE model, dredged material deposition thickness decreases with increasing distance from the point of impact of the disposal plume. Thus, depending on the distance the crabs are moved by the surge current, the burial depth could be reduced significantly, greatly increasing the survivability of the crabs. In conclusion, the following answers can be provided to the questions posed in the Phase I analysis:
• If no escape response is permitted, what is the threshold for effects from burial for each age class and molting stage?
When restrained and not allowed an escape response, all the adult (≥120 mm CW) crabs suffocated and died within 24 h when buried in 8 cm of dredged material. The observations clearly show that maintaining the respiratory pathway is the key to surviving burial. Crabs >120 mm CW could recover the respiratory pathway when buried to 6 cm depth. Crabs of about 60 mm CW size could recover the respiratory pathway when buried to 3 cm depth. These results are for intermolt and soft-shell crabs. Paper-shelled crabs could not be tested.
• If escape response is permitted in a realistically designed disposal simulation, to what extent do escape and other behavioral responses reduce effects from burial?
For unrestrained crabs tested in large tanks with sufficient space for escape response, survival increased substantially. Logistic regression analyses of the results for unrestrained crabs found that the probability of survival was significantly related to burial

ix
depth, carapace width, and gender. Carapace hardness and initial burrowing state did not significantly affect survival after burial. An unrestrained female age 2+ crab of 132 mm CW and an unrestrained female age 3+ crab, each buried to 8 cm, would be predicted to have a 93.1% and 99.8% survival probability, respectively. Thus, escape response and other adaptive behavior clearly enabled the subadult and adult crabs to achieve almost 100% survival under the same burial depth that allowed no survival at all for restrained crabs. For unrestrained age 2+ crabs, predicted survival begins to decrease at burial depths greater than 10 cm, and is less than 10% at burial depths greater than 16 cm.
• What is the threshold for effects from mobilization and transport by surge currents?
Survival of unrestrained crabs was 100% up to and including a surge current velocity of 3.2 m/s of 10-s duration, the highest velocity that could be tested in the apparatus. Modeling by Pearson et al. (2006b) predicted maximum surge current velocities to be 3.3 m/s for the dredge Essayons and 4.1 m/s for the dredge Sugar Island when disposing their load at water depths of 45 ft.
• To what extent do escape and other behavioral responses reduce surge-current effects?
Although crabs were observed frequently to be tumbled by surge currents, their behavioral responses prevented damage and enabled 100% survival up to the maximum surge current tested. The behavioral observations indicate that crabs are unlikely to be buried in an inverted position. In 37 tests at 3.2 m/s, crabs landed in an inverted position only twice (5%). The inverted crabs were able to right themselves within 2 s.
• To what extent does exposure to surge currents influence the occurrence and extent of effects from subsequent burial?
The results of the surge current experiments showed no damage, 100% survival, and the behavioral capability to recover the proper orientation after tumbling. Crabs are unlikely to be buried in an inverted position. Therefore, specific experiments to address this question are not needed. However, the surge current and the behavioral response to it may carry the crabs away from the center of the disposal footprint and thereby substantially reduce their actual burial depths, thus increasing their survivability.
During Phase I of the dredged material disposal study, researchers concluded that there is likely to be minimal effect from the vertical impact of the descending dredged material as it encounters the bottom while the impacts from the horizontal surge current and burial may be a concern. The present Phase II laboratory study shows that horizontal surge currents do not produce damage or decreased survival up to current velocities of 3.2 m/s, which are among the highest velocities predicted for typical MCR disposal operations. Furthermore, Phase II logistic regression analyses for unrestrained age 2+ crabs suggest mortalities of 47% for females and 20% for males at a maximum burial depth of 12 cm predicted for typical dredged material disposal operations. Unrestrained age 3+ crab are predicted to have mortalities less than 2% at a burial depth of 12 cm. The behavioral observations and survival results show that subadult and adult Dungeness crabs have capabilities to respond to surge currents and burial in ways that substantially reduce exposure to stress and allow high survival.
x
Contents Executive Summary ....................................................................................................................................vii Contents ........................................................................................................................................................ x 1.0 Introduction ......................................................................................................................................... 1 2.0 Approach............................................................................................................................................. 3
2.1 Review of Phase I Findings....................................................................................................... 3 2.1.1 Conceptual Model ........................................................................................................ 3 2.1.2 Numerical Modeling .................................................................................................... 3 2.1.3 Literature Review and Vulnerability Analysis ............................................................. 5
2.2 Phase II Laboratory Study Design............................................................................................. 6 3.0 Methods............................................................................................................................................... 9
3.1 Sediment Source and Handling ................................................................................................. 9 3.2 Crab Source and Handling ...................................................................................................... 11 3.3 Burial Experiments.................................................................................................................. 12
3.3.1 Preliminary Burial Experiments ................................................................................. 13 3.3.2 Definitive Burial Experiments.................................................................................... 16
3.4 Surge Current Experiments ..................................................................................................... 16 3.4.1 Physical Characterization of Experimental Flume Flow Field................................... 18 3.4.2 Surge Current Exposure Experiments with Dungeness Crabs ................................... 18
3.5 Data Analysis .......................................................................................................................... 20 4.0 Results ............................................................................................................................................... 21
4.1 Burial Experiments.................................................................................................................. 21 4.1.1 Preliminary Burial Results ......................................................................................... 21 4.1.2 Definitive Burial Results ............................................................................................ 22 4.1.3 Examination of Dead Specimens ............................................................................... 35
4.2 Surge Current Experiments ..................................................................................................... 35 4.2.1 Physical Characterization of Flow Field in Experimental Flume............................... 35 4.2.2 Observations of Crabs in a Clear Water Surge Current ............................................. 39 4.2.3 Effects of a Sediment Slurry Surge Current on Crab on a Natural Substrate............. 42
5.0 Discussion and Conclusions.............................................................................................................. 45 6.0 Acknowledgements ........................................................................................................................... 50 7.0 References ......................................................................................................................................... 51

xi
Figures Figure 1. Flow chart of the idealized adaptive experimental design............................................................ 8 Figure 2. Grain size distribution of MCR sand and Arness sand used in the experiments .......................... 9 Figure 3. Slurry mixing tank, original pump, and surge current flume...................................................... 10 Figure 4. Dungeness crab marked with paint and PIT tag ......................................................................... 12 Figure 5. Durometer used to measure crab carapace hardness .................................................................. 12 Figure 6. Dungeness crab burial test sequence .......................................................................................... 14 Figure 7. Smaller (0.9-m diameter) tanks used for crab burial tests .......................................................... 15 Figure 8. Netted bin containing one adult Dungeness crab for a preliminary burial test........................... 15 Figure 9. Nozzle used to introduce surge current into flume..................................................................... 17 Figure 10. Surge current test with sediment slurry .................................................................................... 19 Figure 11. Surface disturbance from a respiratory pathway through the sediment created by buried
crabs .......................................................................................................................................... 22 Figure 12. Survivorship curves for Dungeness crabs as a function of burial depth................................... 34 Figure 13. Photographs of posterior and anterior interior of crab carapace after crab was mortally
buried in sand............................................................................................................................ 35 Figure 14. Conceptual model of the plume development in the flume ....................................................... 36 Figure 15. Plume centerline velocity over distance as modeled by UPLUME for multiple port
openings .................................................................................................................................... 37 Figure 16. Maximum centerline velocity measured in the flume during a 10-s burst of water .................. 38 Figure 17. Horizontal development of the plume using average maximum velocities; flume
measures another 38 cm on each side and 650 cm to the end................................................... 38 Figure 18. Photograph of the sand scour produced in the flume ................................................................ 39 Figure 19. Example of crab tumbling during the course of a surge event .................................................. 41 Figure 20. Time sequence of the approaching slurry plume in the flume................................................... 44
xii
Tables Table 1. Predicted maximum values of impact pressure, horizontal shear stress, mound thickness,
and horizontal bottom velocity ................................................................................................... 4 Table 2. MSL seawater temperature average and range by month during the experiments ...................... 21 Table 3. Summary of definitive burial experiments with Dungeness crabs............................................... 23 Table 4. Results of Dungeness crab definitive burial tests ........................................................................ 24 Table 5. Analysis of deviance for crab burial study covariates, based on binomial error and
logistic-link function................................................................................................................. 31 Table 6. Analysis of deviance for an additional covariate, Carapace Width, added to the Burial
Depth model, based on binomial error and logistic-link function............................................. 31 Table 7. Analysis of deviance for an additional covariate, Gender, added to the Burial Depth and
Carapace Width model, based on binomial error and logistic-link function ............................ 31 Table 8. Analysis of deviance when no additional covariates are added to the Burial Depth,
Carapace Width, and Gender model, based on binomial error and logistic-link function ....... 32 Table 9. Analysis of deviance examining interaction terms to be added to the Burial Depth,
Carapace Width, and Gender model, based on binomial error and logistic-link function (no interaction terms selected) .................................................................................................. 32
Table 10. Table of regression coefficients comparing initial 118 observations with additional 15 observations for potential tank size effect................................................................................. 33
Table 11. Analysis of deviance when 15 additional observations are added to the Burial Depth, Carapace Width, and Gender model, based on binomial error and logistic-link function ....... 33
Table 12. Results of experiments on crab exposed to surge currents ......................................................... 40 Table 13. Summary of tests performed with sediment slurry and crabs on natural substrate..................... 43

xiii

1.0 Introduction Dredging of the Columbia River navigation channel has raised concerns about dredging-related impacts on Dungeness crabs (Cancer magister) in the estuary, mouth of the estuary, and nearshore ocean areas around the Columbia River. The Portland District, U.S. Army Corps of Engineers (Corps) engaged the Marine Sciences Laboratory (MSL) of the U.S. Department of Energy’s Pacific Northwest National Laboratory (PNNL) to review the state of knowledge and conduct studies concerning impacts on Dungeness crab resulting from entrainment and disposal during the Columbia River Channel Improvement Project and during annual maintenance dredging in the mouth of the Columbia River (MCR). Crab entrainment was directly measured during research by MSL in 2002, 2004, and 2006 (Pearson et al. 2002, 2003, 2005, and 2006a). Previously, the MSL had performed studies for the Corps’ Seattle District related to dredging impacts on crabs during the Grays Harbor Navigation Improvement Project (e.g., Pearson 1987, Pearson and Woodruff 1987, Pearson et al. 1987). However, studies were still needed on the potential effects of dredged material disposal on Dungeness crabs specific to the Columbia River. A phased approach is being used to address objectives related to the potential effects of disposal on Dungeness crabs from dredging of the Columbia River. The overall objectives of the effort are to:
1. synthesize existing knowledge about disposal effects on Dungeness crabs and to offer approaches to quantify these effects (Phase I, Pearson et al. 2006b);
2. conduct laboratory studies to quantify effects of burial and surge on crab survival (Phase II, this report);
3. use previous results with a demographic model to predict losses to the actual MCR crab populations (Phase III, possible future research).
The initial step in Phase I was the development of a conceptual model to synthesize knowledge about crab biology and physical processes occurring during disposal, and to identify potential mechanisms by which crabs may be injured. Phase I also included the numerical modeling of the disposal process using the Short-Term Fate (STFATE) dredged material disposal model developed by the Corps’ Engineer Research and Development Center in Vicksburg, Mississippi, which provided information on the magnitude of vertical and horizontal forces and burial depth expected to be encountered by crabs during a variety of disposal scenarios. The results of the STFATE modeling were evaluated together with published information on crab biology to identify areas of greatest crab vulnerability (Pearson et al. 2006b). The Phase I study concluded that crabs were more likely to be vulnerable to injury by tumbling in a surge current or by burial, and less vulnerable to the compression (vertical) forces exerted during a disposal event. The recommended priority for future studies was simulation of burial depths and surge currents generated during a short-duration disposal event in shallow water, with experiments designed to include aspects of crab behavior that could change the vulnerability to a disposal event (Pearson et al. 2006b). We review Phase I findings in more detail in Section 2.1. This report describes laboratory experiments conducted in Phase II to specifically look at the effects of burial and surge current on crabs. Burial experiments focused on identifying threshold depths of burial
1
2
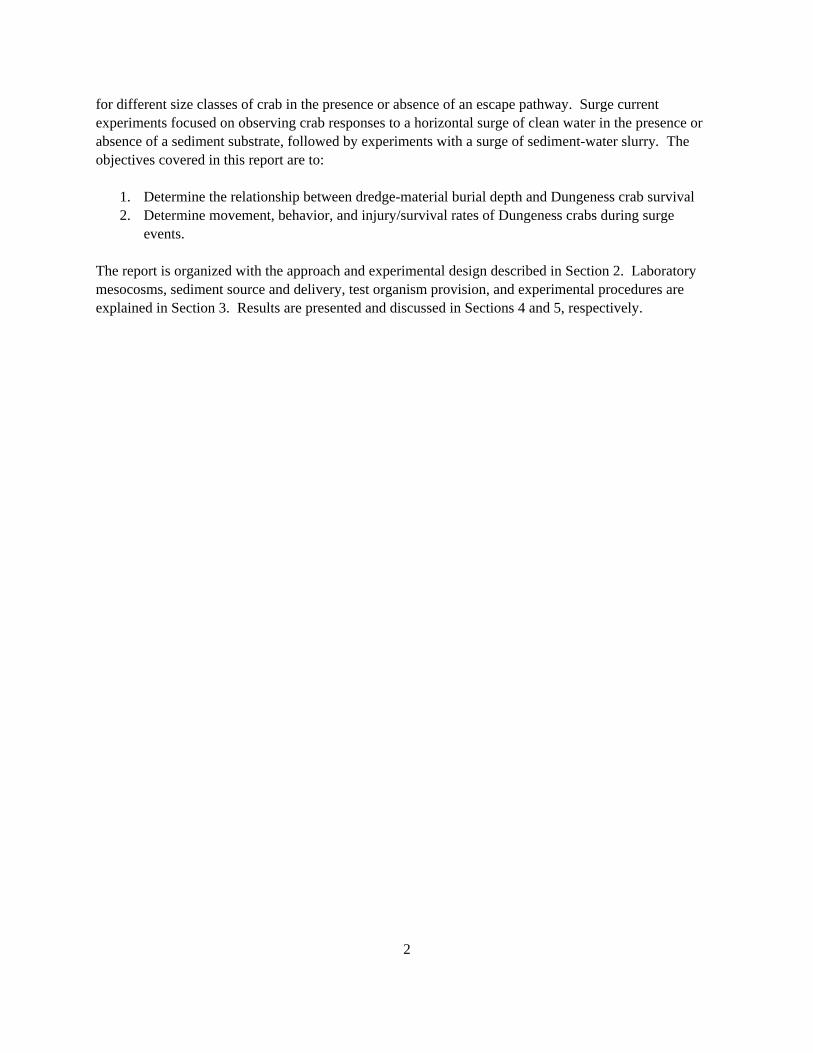
for different size classes of crab in the presence or absence of an escape pathway. Surge current experiments focused on observing crab responses to a horizontal surge of clean water in the presence or absence of a sediment substrate, followed by experiments with a surge of sediment-water slurry. The objectives covered in this report are to:
1. Determine the relationship between dredge-material burial depth and Dungeness crab survival 2. Determine movement, behavior, and injury/survival rates of Dungeness crabs during surge
events. The report is organized with the approach and experimental design described in Section 2. Laboratory mesocosms, sediment source and delivery, test organism provision, and experimental procedures are explained in Section 3. Results are presented and discussed in Sections 4 and 5, respectively.
3
2.0 Approach The results of Phase I are reviewed here (Section 2.1) to provide background for the approach to the Phase II laboratory experiments (Section 2.2).
2.1 Review of Phase I Findings
Phase I (Pearson et al. 2006b), completed in 2005, consisted of the following steps:
• Conceptual model to describe disposal event and potential impacts on crabs • Numerical model to develop the range of potential forces and mounding depths relevant to MCR
disposal events • Review of literature on compression forces, shear stress or surge current velocities, and burial
impacts to crabs • Assessment of vulnerability of Dungeness crabs to potential forces and mounding depths
predicted to occur for MCR disposal events.
2.1.1 Conceptual Model
The conceptual model considers that an open-water dredged material disposal event has the following sequence of physical forces that could affect Dungeness crabs:
• Convective Descent and Bottom Encounter. The material falls through the water column (convective descent) and at bottom encounter, the momentum attained during the fall produces compression and shear forces on the bottom.
• Dynamic Collapse and Spreading. During dynamic collapse, the vertical momentum of the falling material is converted to the horizontal, and the material spreads along the bottom away from the area of bottom encounter. The physical forces generated during dynamic collapse create surge currents along the bottom that may mobilize bottom sediment or crabs.
• Mounding. As falling and spreading material comes to rest, the material forms a disposal mound which may bury crabs. This process is also influenced by passive transport-dispersion, during which the material transport and spreading may be determined more by ambient currents and turbulence than by the dynamics of the disposal event operation.
The resulting physical forces and disposal mound are affected by the characteristics of the dredged material (e.g., grain size distribution, cohesiveness) and the disposal site (e.g., bottom slope, grain size distribution, currents), as well as by characteristics of the disposal operation (e.g., vessel capacity, speed, discharge duration). The next step of the Phase I assessment was to conduct numerical modeling to obtain the range of compression force, shear force, and extent of mounding predicted to occur for a MCR material disposal event.
2.1.2 Numerical Modeling
Pearson et al. (2006b) used the STFATE dredged material disposal model to estimate the magnitude of the three main parameters thought to have the potential to affect Dungeness crabs: 1) pressure developed
4
by the convective descent, 2) the horizontal shear stress generated during dynamic collapse, and 3) the depth of burial following settling of the material. A matrix of disposal conditions was developed for the two dredges most likely to be used in the Lower Columbia River dredging operations, the Essayons and the Sugar Island, resulting in 36 test scenarios modeled in STFATE as follows:
“The water depths selected for modeling represent conditions at the North Jetty disposal site (45 ft) at the MCR, the shallow-water ocean dredged material disposal site (65 ft), and the shallower and deeper ends of the deepwater disposal site (230 ft and 280 ft). Current velocity conditions at the sites were considered uniform from surface to bottom for all cases, and were taken as 2 ft/s for 45-ft and 65-ft depths, and 1 ft/s for 230-ft and 280-ft depths. The current direction was applied in the direction of vessel motion for all cases. The model was run for each vessel moving parallel to the isobaths, perpendicular to the isobaths, and over a flat bottom. A constant bottom slope of 1:100 was selected for the 45-ft and 65-ft water depths and 1:200 for 230-ft and 280-ft cases.”
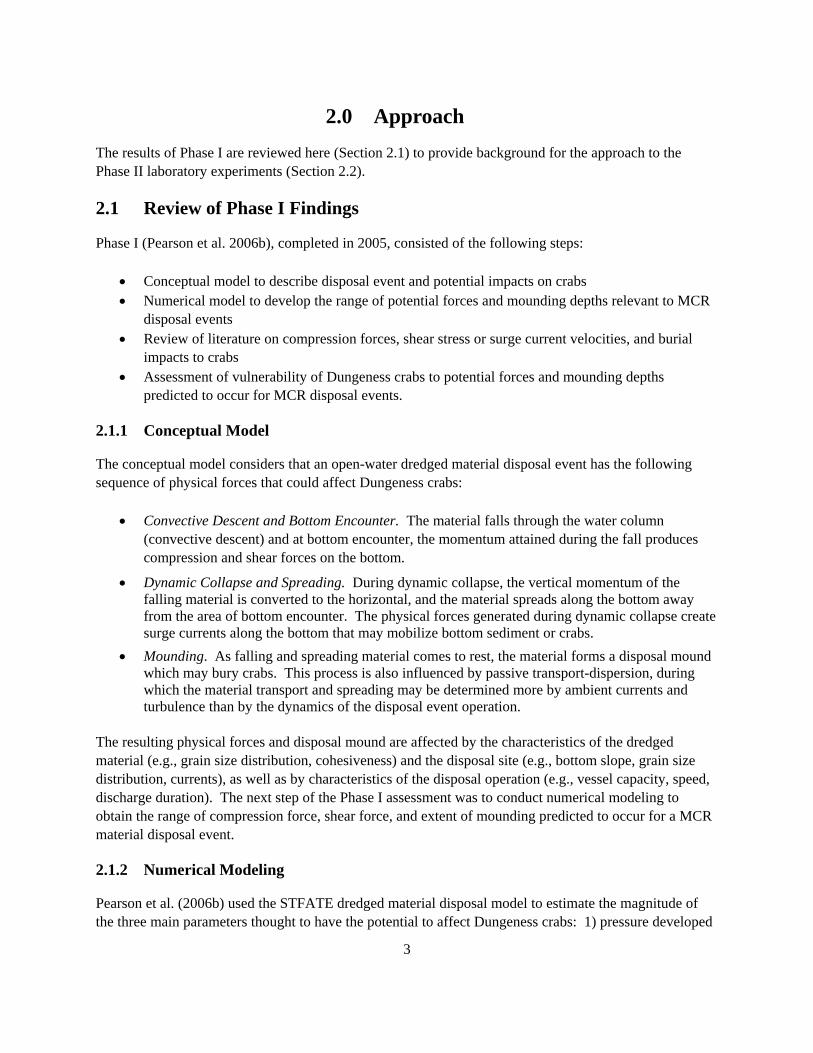
The resulting maximum impact pressure, shear stress, and mound depth are summarized in Table 1. The maximum impact pressure, shear stress, and mounding were predicted to occur with short-duration discharges in shallow water (45 ft); values for these parameters were reduced by discharge in deep water and by longer duration dumps.
Table 1. Predicted maximum values of impact pressure, horizontal shear stress, mound thickness, and horizontal bottom velocity
Vessel Name Water Depth
(ft)
Discharge Duration
(min)
Vertical Impact Pressurea
(Pab)
Horizontal Shear
Stressa (Pa)
Mound Thicknessc
(cm)
Horizontal Bottom Velocityd
(m/s) Essayons 45 9 37,611 42.77 12.6 3.32 Essayons 65 9 7,427 18.87 9.7 2.40 Essayons 230 9 36 1.15 6.2 0.79 Essayons 280 9 13 0.59 5.3 0.72 Essayons 45 14 22,095 34.08 9.6 3.03 Essayons 65 14 4,531 13.80 7.6 2.12 Essayons 230 14 17 0.89 4.4 0.73 Essayons 280 14 6 0.59 3.9 0.65 Sugar Island 45 3 55,669 73.80 10.8 4.13 Sugar Island 65 3 24,944 52.66 8.2 3.61 Sugar Island 230 3 642 6.90 2.7 1.61 Sugar Island 280 3 340 4.96 2.3 1.41 a) Maximum vertical impact and shear stresses were predicted when dredged traveled across (perpendicular to)
bottom slope. b) Pascal (Pa), a unit of pressure equal to the pressure resulting from a force of 1 Newton acting uniformly over an
area of 1 m2. c) Maximum mound thickness was generally predicted with the no slope bottom condition. d) Horizontal bottom velocity was determined using Miller et al. (1977).

5
2.1.3 Literature Review and Vulnerability Analysis
The STFATE model results for impact pressure, shear stress, mound depth, and horizontal bottom velocity were compared with literature on what is known about the effects of these stresses on Dungeness crabs. The intent was to identify which parameters were most likely to impact the crabs, and whether known aspects of crab behavior, size, or molt stage would make them more or less vulnerable to potential disposal impacts. Pearson et al. (2006b) presented a detailed discussion of each potential disposal impact parameter, relating modeled outcomes to crab biology. The authors concluded that impact or injury from the vertical compression forces generated by a disposal event was less likely than injury from either the horizontal surge or burial. Although there are no experimental data that specifically indicate the vertical impact or compression force that would damage or deform an intact carapace, measurements of carapace hardness and chitin (carapace component material) tensile strength indicate that the carapace material can withstand much greater vertical stress than the maximum levels predicted by the STFATE model (Pearson et al. 2006b). No studies specific to C. magister stability, motion, or behavior under hydrodynamic forces were found that would allow comparison with model predictions of horizontal surge velocities (as calculated from the shear stress values; Pearson et al. 2006b). However, Martinez (2001) found that current velocities of 0.25 m/s to 5.72 m/s could wash a species of shore crab (Grapsus tenuicrustatus) from its substrate. This wide range of critical velocities resulted from differing crab behavior and the crab’s ability to cling to the substrate. From the horizontal shear forces predicted by STFATE, surge current velocities were estimated to be in the range of 0.65 m/s to 4.13 m/s (Table 1; Miller et al. 1977). The surge current velocities generated by shallow-water disposal events may be capable of scouring bottom material and associated crabs. Miller et al. (1977) calculated that bed sediment particles of 10-mm to 40-mm diameter could be mobilized by surge current velocities of 1.8 m/s to 3.4 m/s, respectively. However, if crabs were exposed to such surge currents, their behavioral responses could reduce the occurrence and extent of injury from the surge. Therefore, the available information suggests that crabs may be vulnerable to injury from surge currents, but there is insufficient information to determine whether the surge current and associated horizontal shear stresses generated by a disposal event could adversely affect Dungeness crabs. There is more information available for assessing predicted disposal mound thickness and potential burial impacts to Dungeness crabs than for the impact of vertical compression forces or horizontal surge. Pearson et al. (2006b) summarized the results of various laboratory and field studies conducted with a variety of benthic fauna, including several that focused on C. magister. For Dungeness crabs, burrowing into the sediment is a normal behavior -- they typically burrow until the carapace is completely covered and only eyestalks and antennae are exposed, establishing a respiratory pathway to the sediment surface to bring oxygenated water over their gills (McGaw 2004, 2005). Maintaining this respiratory pathway to oxygenated water allows crabs to remain burrowed for long periods of time (average about 4 h, maximum more than 50 h; McGaw 2004). Pearson et al. (2006b) suggested that the effects of burial in dredged material depend on a crab’s ability to establish and maintain the respiratory pathway. Studies of direct burial of Dungeness crabs had variable results, depending on burial depth and crab size, among other factors (Chang and Levings 1978; Antrim and Gruendell 1998; Corps 1999). In short,
6
reduced survival was noted in crabs buried in more than 10 cm of material, but most studies did not allow a range of behavioral (e.g., escape) responses, or did not test a variety of size classes. Therefore, Dungeness crabs are probably vulnerable to burial, but the extent to which their behavior modifies the impacts under the disposal mounding scenarios and sediments expected for the mouth of the Columbia River is unknown. The findings of the Phase I vulnerability analyses were used to develop and prioritize study questions for Phase II as follows (Pearson et al. 2006b):
1. If no escape response is permitted, what is the threshold for effects from burial for each age class and molting stage?
2. If escape response is permitted in a realistically designed disposal simulation, to what extent do escape and other behavioral responses reduce effects from burial?
3. What is the threshold for adverse effects from mobilization and transport by surge currents?
4. To what extent do escape and other behavioral responses reduce surge current effects?
5. To what extent does exposure to surge currents influence the occurrence and extent of effects from subsequent burial?
As recommended, the Phase II studies focus on the shallow water, short-duration disposal scenarios that would result in the maximum surge velocities and mound depths. The experiments described in the following section are designed to evaluate threshold responses to burial and surge currents and provide biological response data that can be used to estimate mortality as a response to stressor level. The final proposed phase (Phase III) of the study will be to incorporate these mortality estimates with a demographic model of crab distribution by age class for the disposal area, providing input to the population-level adult equivalent loss (AEL) model. The AEL model was used by Pearson et al. (2002, 2003, 2005, 2006a) to estimate crab losses by dredge entrainment, and could be easily modified to estimate losses from disposal-related impacts.
2.2 Phase II Laboratory Study Design
The goals of the Phase II laboratory studies are to quantify the following parameters for Dungeness crabs exposed to surge currents and burial depths representing typical to worst-case MCR dredged disposal scenarios as modeled in Phase I:
• Effects of burial on crab survival • Effects of surge current horizontal shear stress on crab injury and mortality • Effects of the combined burial and surge current on crab injury and mortality.
As described above, the factors of primary importance identified by the Phase I study (Pearson et al. 2006b) are the velocity of the horizontal surge current and the thickness of the mount produced (i.e., burial depth). There are, however, a number of covariables that complicate the understanding of the impacts from these factors, as follows:
• Crab size – The Dungeness crab population found in the mouth of the Columbia River is composed of all size and age classes (Pearson et al. 2003). This is important to consider because
7
there is some indication that smaller juvenile crabs may have different mortality rates in response to burial than do larger adult crabs (Antrim and Gruendell 1998).
• Crab burrowed state – Dungeness crabs naturally burrow into the sediment for extended periods of time (MacKay 1942; McGaw 2004). Whether the crabs are on the surface, burrowed into the sediment just below the surface, or deeply burrowed into the sediment may change the way they interact with forces produced in the disposal event and their subsequent survival.
• Crab orientation after surge event – Crabs may become inverted during a surge event, which may affect their ability emerge from the subsequent burial.
• Crab damage/disorientation – Crabs that are tumbled in the surge current of a disposal event may be damaged (e.g., broken legs, cracked carapace) or disoriented. Such damage may affect the ability of the crab to return to the sediment-water interface after a burial event, thereby increasing mortality.
• Crab escape response – Dungeness crabs may be able to avoid some of the deleterious effects of the disposal event through behavioral or physical mechanisms. There are indications that small crabs may be able to “ride” the surge current to safety or are buoyed above the relatively more dense sediment slurry, thereby avoiding burial (Antrim and Gruendell 1998; Pearson et al. 2006b).
• Crab molt stage – Dungeness crabs at various molt stages may have different mortalities when encountering the forces from a disposal event. For example, hard shell crabs may be able to survive tumbling better than soft shell crabs, or vice versa.
• Sediment mobilization/excavation – The forces predicted in the STFATE model will most likely scour the bottom sediment at the disposal site (Miller et al. 1977; Pearson et al. 2006b), although the depth of scour is unknown. This can be important even for burrowed crabs, because they could lose all leverage to counteract the forces from the disposal event.
Given the complexity of the interaction of the covariables and the logistical constraints of the experiments, an adaptive and phased experimental design was followed (Figure 1). The study involved surge current experiments in a long rectangular flume, where a horizontal current of clear seawater or sediment-water slurry was injected near the bottom. Prior to introducing sediment or crabs, the current velocity regime within the flume was thoroughly measured. Subsequent flume experiments with the various age/size classes of crabs were initially conducted with an artificial substrate and clear seawater to allow visual observations to be made of the crabs’ response to the surge current. These experiments were then followed by experiments with a natural sediment substrate and sediment-water slurry, where the crabs were either allowed to burrow or were forced to stay on the surface of the bed prior to exposure to the surge current. For the burial experiments, preliminary tests were conducted to determine the threshold burial response with and without the opportunity for crabs to establish a respiratory pathway. These preliminary tests were also used to determine an appropriate observation period for other burial experiments. Definitive burial tests were then conducted in large tanks where the sediment-water slurry was introduced into the tanks, burying the crabs to a pre-determined depth. Section 3 provides the detailed methods used in the surge current and burial experiments.

Shear force studies in flumeVariables:
•crab size•crab burrowed state•crab molt stage
Information collected:•sizes affected•delayed mortality•damage, inversion, disorientation•sediment mobilization and excavation
Damageor
Inversion?
Burial experiments on tumbled crabs with different starting orientations (appropriate sizes tested)
yes
damage
no
yes
inversion
Burial experiments with damaged tumbled crabs (appropriate sizes tested)
Disposal simulationExperiment combines forces above.Uses crab parameters indicated as vulnerable in previous experiments.
Burial experiments with deeply burrowed crabs
Figure 1. Flow chart of the idealized adaptive experimental design. Due to logistical constraints, the actual sequence of experiments differed slightly (see text).
The desired outcome of initial surge current and burial experiments was to identify crab age/size classes and behaviors that were most vulnerable to the effects from dredged material disposal operations. The next step, although ultimately unnecessary, was to conduct sequential surge current-burial exposure experiments intended to duplicate the combined effects of disposal on the crab classes identified as more vulnerable in the separate burial and surge current experiments. This experimental design allowed the best use of limited replicates to ensure a statistically valid study by conducting experiments focused on those crabs shown in previous tests to be vulnerable to disposal forces. This study design minimized a priori guesses concerning factors expected to be important and those expected to improve resolution of the significant covariables.
8
3.0 Methods Experiments were designed to mimic the bottom conditions modeled for a disposal event as presented in Pearson et al. (2006b). This required the design of experimental systems that could introduce a sediment-water slurry both slowly for diffuse burial experiments and quickly to simulate a surge current with velocities greater than 3 m/s. The components of the experiments consisted of a large slurry mixing tank attached to a strong slurry pump, large tanks for burial experiments that would allow crabs sufficient space to move unhindered, and a flume large enough to simulate the large horizontal surge current generated during the dynamic collapse.
3.1 Sediment Source and Handling
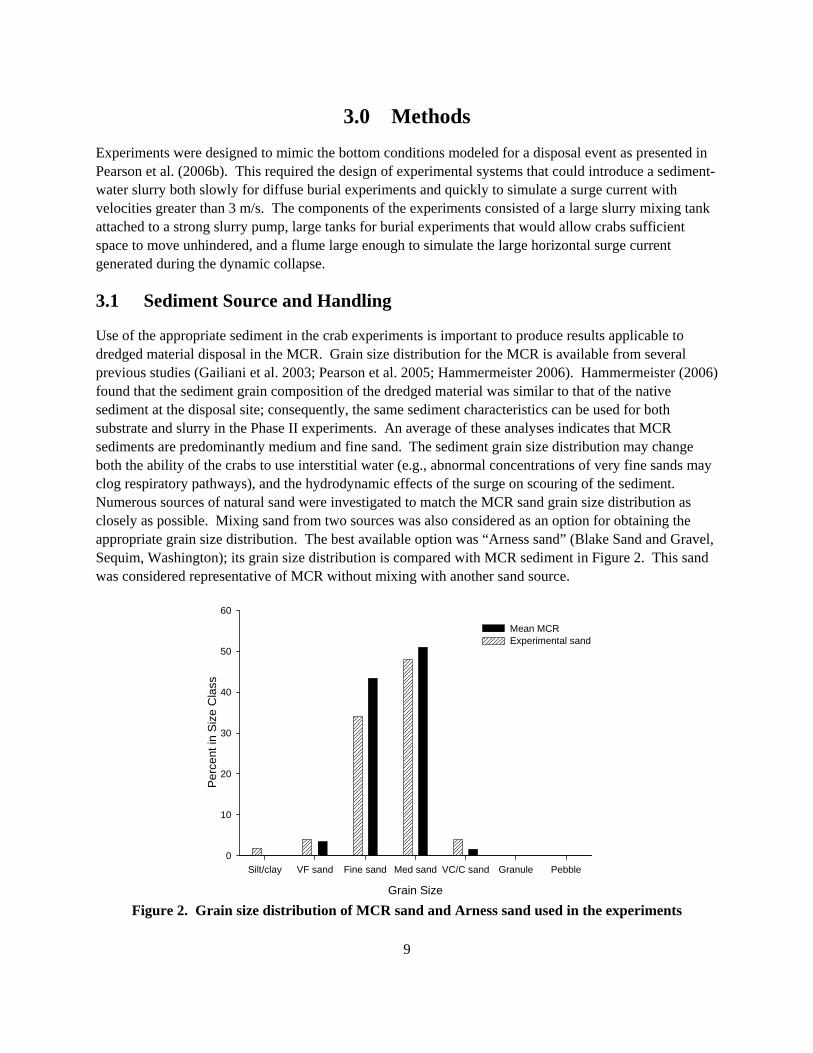
Use of the appropriate sediment in the crab experiments is important to produce results applicable to dredged material disposal in the MCR. Grain size distribution for the MCR is available from several previous studies (Gailiani et al. 2003; Pearson et al. 2005; Hammermeister 2006). Hammermeister (2006) found that the sediment grain composition of the dredged material was similar to that of the native sediment at the disposal site; consequently, the same sediment characteristics can be used for both substrate and slurry in the Phase II experiments. An average of these analyses indicates that MCR sediments are predominantly medium and fine sand. The sediment grain size distribution may change both the ability of the crabs to use interstitial water (e.g., abnormal concentrations of very fine sands may clog respiratory pathways), and the hydrodynamic effects of the surge on scouring of the sediment. Numerous sources of natural sand were investigated to match the MCR sand grain size distribution as closely as possible. Mixing sand from two sources was also considered as an option for obtaining the appropriate grain size distribution. The best available option was “Arness sand” (Blake Sand and Gravel, Sequim, Washington); its grain size distribution is compared with MCR sediment in Figure 2. This sand was considered representative of MCR without mixing with another sand source.
Grain Size
PebbleGranuleVC/C sandMed sandFine sandVF sandSilt/clay
Perc
ent i
n Si
ze C
lass
0
10
20
30
40
50
60
Mean MCR Experimental sand
Figure 2. Grain size distribution of MCR sand and Arness sand used in the experiments
9
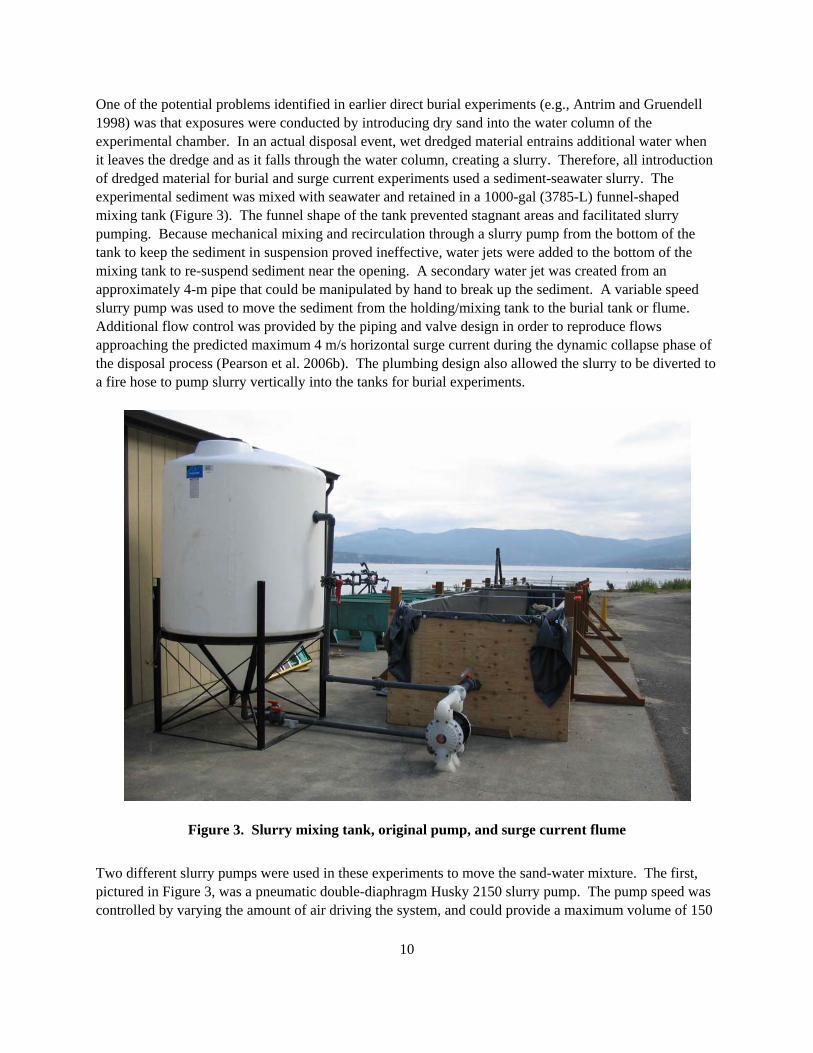
One of the potential problems identified in earlier direct burial experiments (e.g., Antrim and Gruendell 1998) was that exposures were conducted by introducing dry sand into the water column of the experimental chamber. In an actual disposal event, wet dredged material entrains additional water when it leaves the dredge and as it falls through the water column, creating a slurry. Therefore, all introduction of dredged material for burial and surge current experiments used a sediment-seawater slurry. The experimental sediment was mixed with seawater and retained in a 1000-gal (3785-L) funnel-shaped mixing tank (Figure 3). The funnel shape of the tank prevented stagnant areas and facilitated slurry pumping. Because mechanical mixing and recirculation through a slurry pump from the bottom of the tank to keep the sediment in suspension proved ineffective, water jets were added to the bottom of the mixing tank to re-suspend sediment near the opening. A secondary water jet was created from an approximately 4-m pipe that could be manipulated by hand to break up the sediment. A variable speed slurry pump was used to move the sediment from the holding/mixing tank to the burial tank or flume. Additional flow control was provided by the piping and valve design in order to reproduce flows approaching the predicted maximum 4 m/s horizontal surge current during the dynamic collapse phase of the disposal process (Pearson et al. 2006b). The plumbing design also allowed the slurry to be diverted to a fire hose to pump slurry vertically into the tanks for burial experiments.
Figure 3. Slurry mixing tank, original pump, and surge current flume
Two different slurry pumps were used in these experiments to move the sand-water mixture. The first, pictured in Figure 3, was a pneumatic double-diaphragm Husky 2150 slurry pump. The pump speed was controlled by varying the amount of air driving the system, and could provide a maximum volume of 150
10

gal/min (ca. 570 L/min). This pump worked well to move the slurry as long as the sand was coarse-sieved to 125 mm and care was taken not to let the chambers become packed with sand. This pump was used in the preliminary work and in early burial tests; however, its operation required such a large volume of air that a commercial compressor had to be used. Pulsations in the flow caused by the action of the double pistons were noticeable in the quantification of the flow field in the flume, which was considered undesirable. Therefore, a second pump was substituted for the remainder of the burial tests and all of the flume tests. The 8-hp centrifugal Honda WT308 trash pump (Figure 6) had the advantages of having a self-contained gas motor, steadier flow output at maximum of 250 gal/min (ca. 1000 L/min), and larger particle size capacity (it could pass sediment >2.5 cm in diameter). Flow was controlled with a throttle on the engine. This pump worked well in moving dense slurry in all the applications of this study. No differences in crab mortality were found between comparable burial tests using the two pumps.
3.2 Crab Source and Handling
The Dungeness crabs used in the Phase II experiments were obtained from a variety of sources, although all were from Washington state waters, and most were from the Strait of Juan de Fuca or Sequim Bay. Crabs of all size classes were collected using dip nets, crab traps, or by hand while SCUBA diving. Some juvenile crabs (<100 mm carapace width [CW]) were netted from large eelgrass propagation tanks at the MSL. Additional large (legal-sized) crabs were purchased from local commercial fishermen. Use of local crabs minimized stress associated with handling and transport of the animals to the laboratory. In the laboratory, crabs were held in tanks or on water tables with flowing raw seawater at ambient Sequim Bay temperature, salinity, pH, and dissolved oxygen levels. Crabs were fed clams, mussels, and fish scraps ad libitum during the holding period. Crab density in the tanks and feeding during holding was balanced to avoid cannibalization. All crabs were positively identified as C. magister prior to use in the experiments. Only healthy, vigorous C. magister crabs were used in surge current and burial experiments. Each individual crab was assigned a unique identification number, which was painted onto the carapace in three places. Individuals used in surge current experiments were also marked with passive integrated transponder (PIT) tags glued to the carapace (Figure 4). Carapace width (to 1 mm) and durometer hardness were recorded when each crab was assigned its number, which was within 1 week prior to its exposure test. Carapace hardness was measured with a Pacific Transducer Corporation (PTC) Instruments Model 307LCRBIV crab durometer (Figure 5). This durometer was specifically designed to provide a relative measure of shell hardness, used as a proxy for molt stage, for management of Dungeness crab fisheries in Alaska (see description in Hicks and Johnson 1991, 1999). The instrument measures in durometer units (DU) from 0 to 100 and provides a scale for assessing the softness of the carapace. Shell hardness is lowest immediately after a molt and becomes progressively higher in succeeding weeks, and crabs with values below 64 DU are generally considered to be soft-shell (Hicks and Johnson 1999). Measurements were made on the ventral side of the carapace centered behind the second walking leg, as suggested by Hicks and Johnson (1999). The authors found that the area was the last to fully harden on the shell and that the flat surface allowed consistent readings. While crabs as soft as 28 DU were used in the experiments, the very new molts (so-called “paper shells”) were not tested due to excessive damage during collection and handling of the few available specimens.
11

Figure 4. Dungeness crab marked with paint and PIT tag
Figure 5. Durometer used to measure crab carapace hardness
3.3 Burial Experiments
The burial experiments were designed to establish a dose-response curve that identifies lethal burial depths for different age/size classes of crabs. Thus, it was important that the tanks be deep enough to accommodate the initial substrate thickness (ca. 0.2 m) in addition to the volume of slurry needed to create the desired burial depths. Burial experiments were conducted in two sizes of circular tanks. Larger crabs were exposed in large 2747-L tanks (1.8 m diameter by 0.9 m depth; Figure 6) while smaller crabs were exposed in 528-L tanks (0.9 m diameter by 0.76 m depth; Figure 7). Two tanks of each size were available for these experiments. The smaller tanks used in these experiments were substantially larger than the tanks used in two previous burial experiments with Dungeness crabs (presumably 19 L in Chang and Levings 1978 and 94 L in Antrim and Gruendell 1998).
12
13
All burial exposure tanks were provided with circulating ambient seawater for temperature control and oxygen supply. Slurry was pumped into each tank through a fire hose with a nozzle that discharged a high volume in a conical pattern at relatively moderate pressure to allow the sediment to fall through the water column and cover the crabs (Figure 6). Care was taken to dissipate the energy created during introduction of the slurry to the tanks to prohibit bottom scour in the tanks. The crab burial experiments were intended to mimic disposal conditions and to allow for realistic behavioral responses of the crabs, such as escape responses using the relatively lower specific gravity of the crabs. In all tests, the amount of sediment calculated to attain the target burial depth was placed in the slurry mixing tank, and then mixed with seawater to create the slurry. Care was taken to ensure that the volume of water used to prepare the slurry was such that the total slurry volume did not exceed the freeboard height of the burial tank. The slurry was allowed to settle for 4 hours before the fluid in the tank was decanted and normal flow of raw seawater was restored. Preliminary experiments were conducted to determine the lethal burial depth when crabs were not allowed any escape response, such as access to the sediment surface, or the time or space for lateral movement on the sediment surface. Preliminary experiments also helped to determine the appropriate observation period for burial mortality. Definitive experiments were conducted to determine lethal burial depth when normal crab behavior, such as possible escape or rapid establishment of respiratory pathway, was allowed.
3.3.1 Preliminary Burial Experiments
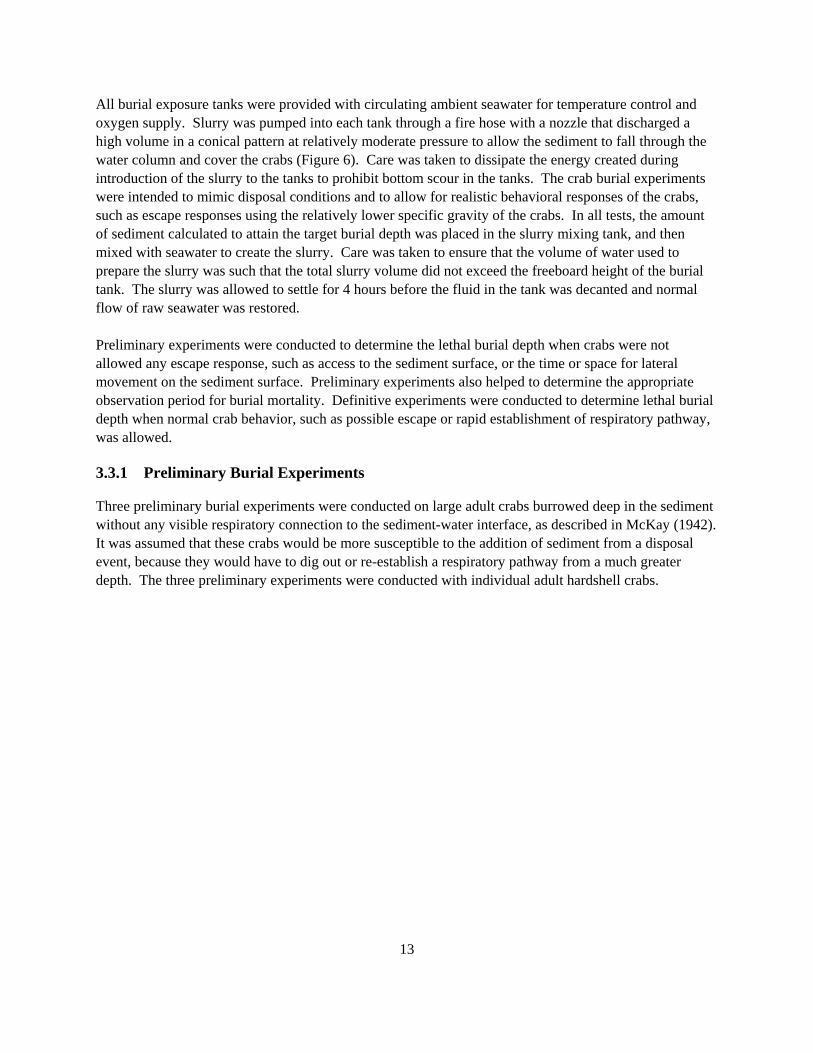
Three preliminary burial experiments were conducted on large adult crabs burrowed deep in the sediment without any visible respiratory connection to the sediment-water interface, as described in McKay (1942). It was assumed that these crabs would be more susceptible to the addition of sediment from a disposal event, because they would have to dig out or re-establish a respiratory pathway from a much greater depth. The three preliminary experiments were conducted with individual adult hardshell crabs.
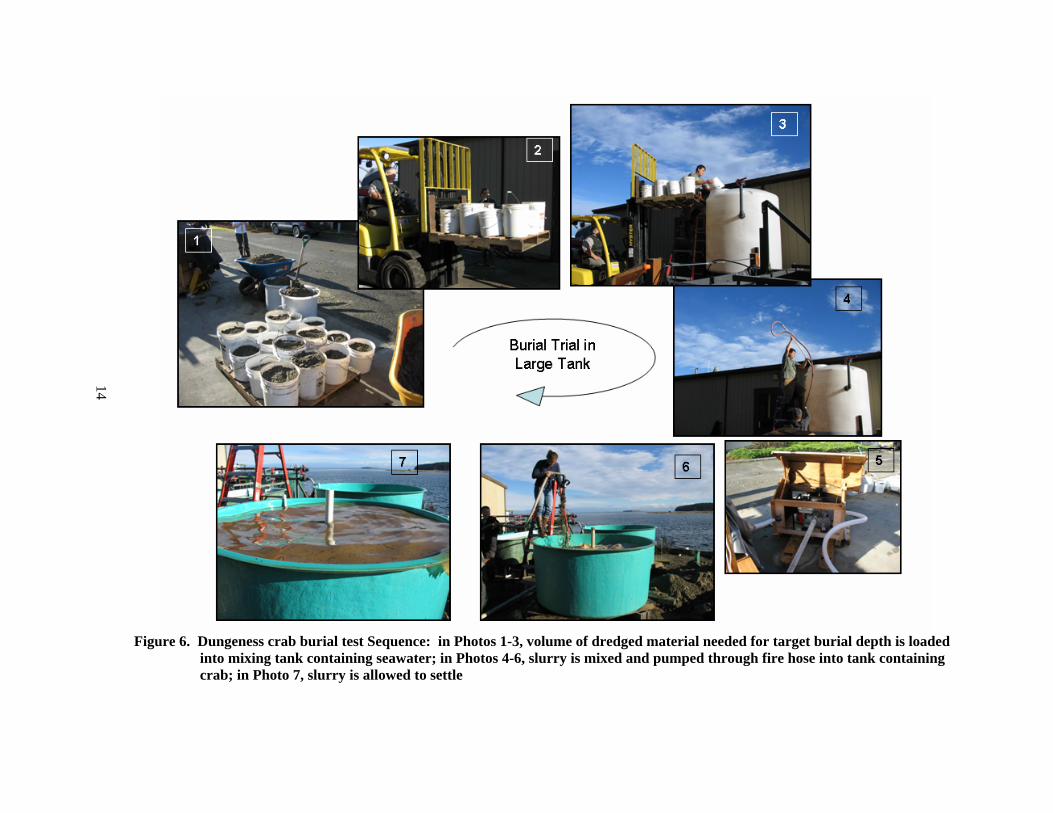
Figure 6. Dungeness crab burial test Sequence: in Photos 1-3, volume of dredged material needed for target burial depth is loaded
into mixing tank containing seawater; in Photos 4-6, slurry is mixed and pumped through fire hose into tank containing crab; in Photo 7, slurry is allowed to settle
14

Figure 7. Smaller (0.9-m diameter) tanks used for crab burial tests
Figure 8. Netted bin containing one adult Dungeness crab for a preliminary burial test
Each crab was allowed to burrow to its preferred depth (generally just below the surface) in a bin of sediment approximately 42 cm long by 30 cm wide by 12.5 cm deep. Aquaculture netting was then placed over the bin so that the crabs were confined and unable to dig out, but could easily maintain their respiratory pathway if no additional sediment was placed on them (Figure 8). The three experiments were conducted as follows:
1. Crabs were buried to a depth of 8 cm in the bins with no respiratory connection to sediment surface to determine the time to suffocation when crabs were not allowed an escape response (digging out) or means to establish a respiratory pathway.
15
16
2. Crabs were buried to a depth of 8 cm in the bins, but a silicone tube was inserted into the sediment to the crab’s carapace. The tubing provided a connection to bring oxygenated water to the crab to determine whether crab could survive if no escape were possible, but oxygenated pore water was available.
3. Crabs were buried in the bin under incrementally increasing depths of sediment to determine the depth limit at which crabs could no longer establish a respiratory pathway when no escape response was possible.
After burial, the tanks were monitored to determine if the respiratory pathway to the surface could be re-established. To determine an appropriate observation time interval for relevant endpoints during the definitive tests, the crabs were excavated at 24, 36, 48 and 72 h after test initiation and checked for mortality. The outcome of the preliminary tests guided definitive test scenarios by establishing relevant target burial depths and observation periods.
3.3.2 Definitive Burial Experiments
Definitive burial experiments were conducted by placing marked crabs (10 large crabs or 5 medium crabs) into a burial tank containing at least 10 cm of sediment substrate. Prior to exposure, the size, gender, and shell hardness were recorded for each individual. Crabs would typically burrow into the sediment within seconds to minutes. The sediment-water slurry was then pumped into the tank to create the desired burial depth (Figure 6). The addition of the slurry could take anywhere from 30 s in the smaller tanks to almost 4 min in the large tanks with a high sediment load. Burial depths used bracketed the extremes of 0 cm (control) and 12 cm (modeled maximum); other depths were selected based on the preliminary experiments and outcomes of preceding definitive burial experiments. After burial, the tanks were monitored for emerging crabs or re-establishment of a respiratory pathway (i.e., emergence, visible eye stalks, surface disturbance, etc.). The observation intervals were every 30 min after the water cleared (ca. 4 h – 5 h) until Hour 8, then periodically to Hour 48. At 48 h, all the crabs were located, manually dug out, and evaluated for mortality and relative level of activity. In most cases, the crab burial depth for each crab was determined at the end of the test. Additional burial experiments were planned if certain sizes of crabs were found to be susceptible to the surge current effects described below (Section 3.4). However, these experiments were deemed unnecessary because no deleterious effects to the crabs were observed in the flume experiments (see Section 4.2).
3.4 Surge Current Experiments
The surge current experiments were designed to evaluate the effects of the horizontal surge currents on the substrate and Dungeness crabs. The experiments were conducted in a 9.1 m long, 1.5 m wide, and 1.2 m deep linear flume specially constructed for these experiments (Figure 3). The linear shape of the flume was intended to minimize the effects of the flume sidewalls on the experiments, while allowing the interaction of the surge current with the bottom sediment in the flume. The flume was able to contain up to 1 m of sediment and overlying water and was plumbed for raw seawater. The 1000-gal funnel-shaped
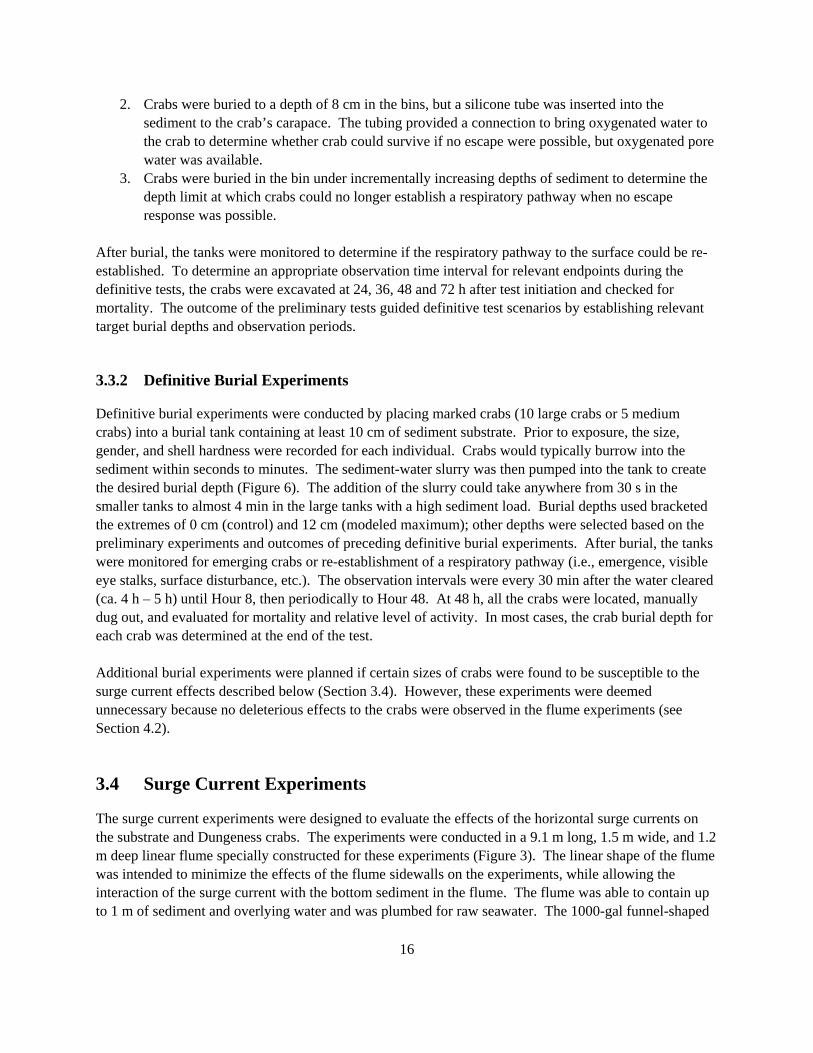
mixing tank and large slurry pump described above were positioned near one end of the flume, as shown in Figure 3, for introduction of the sediment-water slurry into the flume during the tests. An outlet pipe fitted with a fan-shaped nozzle was inserted through the wall of the flume at a height of about 0.4 m above the bottom. The nozzle was designed to provide velocities that approached those that would be generated during the dynamic collapse phase of the dredged material plume, and to provide as much width to the surge current front as possible while maintaining the desired velocities (Figure 9). It was important in the experimental design to insure that the forces from the surge were exerted on the whole crab, not just a portion of the crab. During the experimental tests the sediment-water slurry was injected through the nozzle at one end of the flume and was allowed to move unimpeded along the length of the flume. A net baffle was placed at the opposite end of the flume to absorb the remaining energy of the surge to prevent reflection of the energy wave from the opposite end of the flume. A drainage standpipe was also positioned at the far end of the flume to control water depth and drain the flume.
Figure 9. Nozzle used to introduce surge current into flume
The sediment slurry or clear seawater (depending on the experiment) was introduced into the flume through the mixing tank and pump transfer system described above. This system was designed to simulate the velocities during the dynamic collapse of the dredged material plume as predicted by the STFATE model (approaching 4 m/s current velocity). Exposure velocities could be varied by changing the pump settings or by increasing the distance the test crab was placed from the nozzle. Slurry was created by adding ca. 0.04 m3 of sand to the mixing tank. Therefore, the average water:sand ratio of the ca. 125 L of slurry used during a 10-s trial was just over 2:1 by volume. Surge current experiments were conducted to quantify the following variables (in order):
• bottom sediment scour by the simulated disposal plume; • inversion of crabs and time required to return to the upright position; • damage or mortality to the crabs; • susceptibility to movement of crabs in different burrowing states within the bed; • delayed crab mortality from the disposal process.
17
18
3.4.1 Physical Characterization of Experimental Flume Flow Field
During the design of the flume, a numerical model of the flume surge nozzle was applied to insure that the velocities and width of the surge current front were adequate for the experiments. The UPLUME numerical model (Muellenhoff et al. 1985) was used for the design. This model simulates the development and dissipation of a water jet as it is forced out of a constricted opening into a separate body of water. We applied this model to evaluate different initial velocities and nozzle configurations within the dimensions of the flume to optimize the design of the nozzle. After completion of flume construction and numerical modeling, but before initiation of the crab experiments, we conducted tests using clear seawater to accurately map the velocity distribution within the flume during a 10-s surge current burst. An acoustic Doppler velicometer (ADV; SonTek YSi ADV 10 MHz PN1ADV-11000) was sequentially positioned in a grid pattern across the flume (center and halfway to each side at increasing distances downstream of the nozzle). Measurement distances were 0, 0.5, 1, 1.2, 1.5, 2, 2.4, and 3.7 m from the nozzle. Also, multiple strain gauges were simultaneously placed on the bottom of the flume at different locations to map the flow field, but the flow was too turbulent to provide consistent readings, so their use was discontinued. Measurements of substrate scour were also made during these tests. These tests were repeated using the sediment-water slurry to insure that the addition of the slurry did not unduly affect the results.
3.4.2 Surge Current Exposure Experiments with Dungeness Crabs
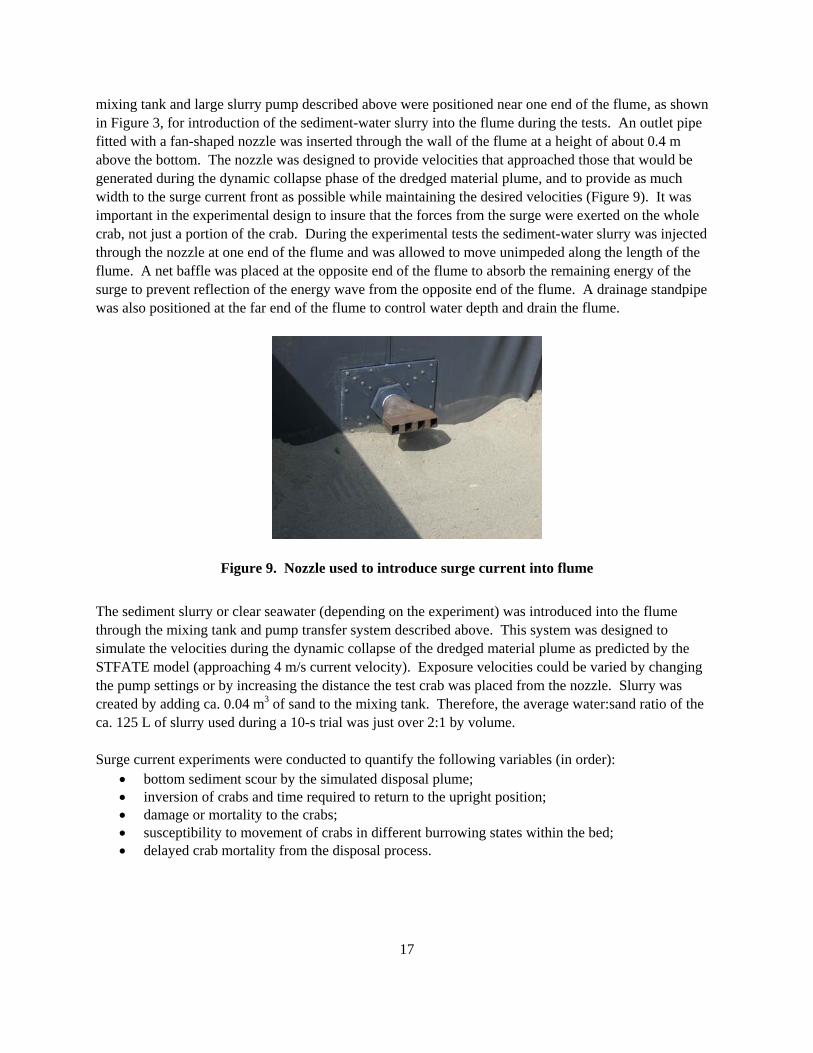
Once the physical parameters of the flume were quantified, crabs were placed in the flume and exposed to a 10-s surge current (Figure 10). The duration of 10 s was chosen based on the diminution curves of energy over time from the previous STFATE modeling (Pearson et al. 2006b). Each test consisted of a single naïve crab, so that the initial position/burrowing status could be documented and there were no interactions between crabs (e.g., shadowing or collisions). Clear seawater and sediment-water slurry tests were conducted to better isolate the different potential impacts of the surge current. Both sets of tests were monitored with underwater videotape to maximize the amount of information. In the first set of tests, the crabs were placed on a smooth PVC sheet and clear seawater was injected into the flume. These tests were designed so that we could visually observe the physical effects of the surge current on the test crabs. Clear seawater, rather than a sediment-water slurry, was used to better facilitate visual tracking of the animals, because the addition of a slurry would immediately obscure the view both from the surface and from video cameras in the flume. Observation parameters of interest in these experiments were damage to the crabs, disorientation of the crabs, and inversion of the crabs (both in the water and upon landing). Crabs were placed in a position where the highest flows would occur and held in that position until just prior to initiating the surge event. They were then released and videotaped for the duration of the test. Upon completion of the test, the crabs were immediately caught and evaluated for damage, then placed in a holding tank to assess delayed mortality. Video was later analyzed to determine the number of times the crab was completely flipped, whether it landed in an inverted orientation, and the time required for the crab to right itself.
Figure 10. Surge current test with sediment slurry
19
During the second set of tests, the crabs were placed on the sand substrate and exposed to a 10-s surge of sediment-water slurry. These tests were designed primarily to determine whether the crabs would be moved by the surge current, and whether the crabs were damaged by the surge current. Crabs in these tests were fitted with PIT tags as described above and placed on the substrate at various distances from the nozzle. Some were allowed to burrow prior to initiating the sediment-water surge, whereas others were kept at the surface. Immediately after the 10-s surge, a PIT tag reader (Destron Technologies FS2001 portable transceiver system) was used to locate the crabs in the now-turbid water in order to determine whether they had moved from their initial starting location. The crabs were then removed, evaluated for damage, and monitored for 48 h for delayed mortality. After allowing the suspended sediment in the flume to settle, the flume was drained, the bed was raked smooth, and the flume was refilled for the next test. Video of the test was later analyzed to gain any information on the movement or behavior of the crab before the view was obscured by the slurry.
3.5 Data Analysis
Crab burial data were analyzed using a generalized linear model (GLM) performed on the individual fates of Dungeness crabs buried with varying depths of sediment during laboratory tests. The analysis was based on a logistic-link function and a binomial (i.e., Bernoulli) error structure. The logistic link was of the form
ln1
i
i
p xp
β⎛ ⎞ ′=⎜ ⎟−⎝ ⎠ % %
or, conversely, the probability of survival was modeled as
1
x
i xep
e
β
β
′
′=+
% %
% %
where x′%
is the vector of covariates and β%
, the vector of regression coefficients. The probability of
survival was modeled as a function of burial depth, along with individual covariates fit using a stepwise regression. Among the individual covariates considered were size (i.e., CW [mm]), shell hardness, gender, and initial burrowed state (i.e., buried or on surface). Analysis of deviance (ANODEV) was used to test the significance of the regression coefficients and to compute their standard error. The data collected in the horizontal surge experiments tended to be more observational due to issues with the visibility in the flume tests and the highly turbulent nature of the flow. The primary outcomes of interest for the experiments (i.e., crab damage and/or mortality) were homogenous and therefore did not need to be statistically analyzed. Descriptors were therefore compiled for each experiment in an attempt to add information to the observations to better interpret the crab behavior and the implications to dredged material disposal operations.
20
21
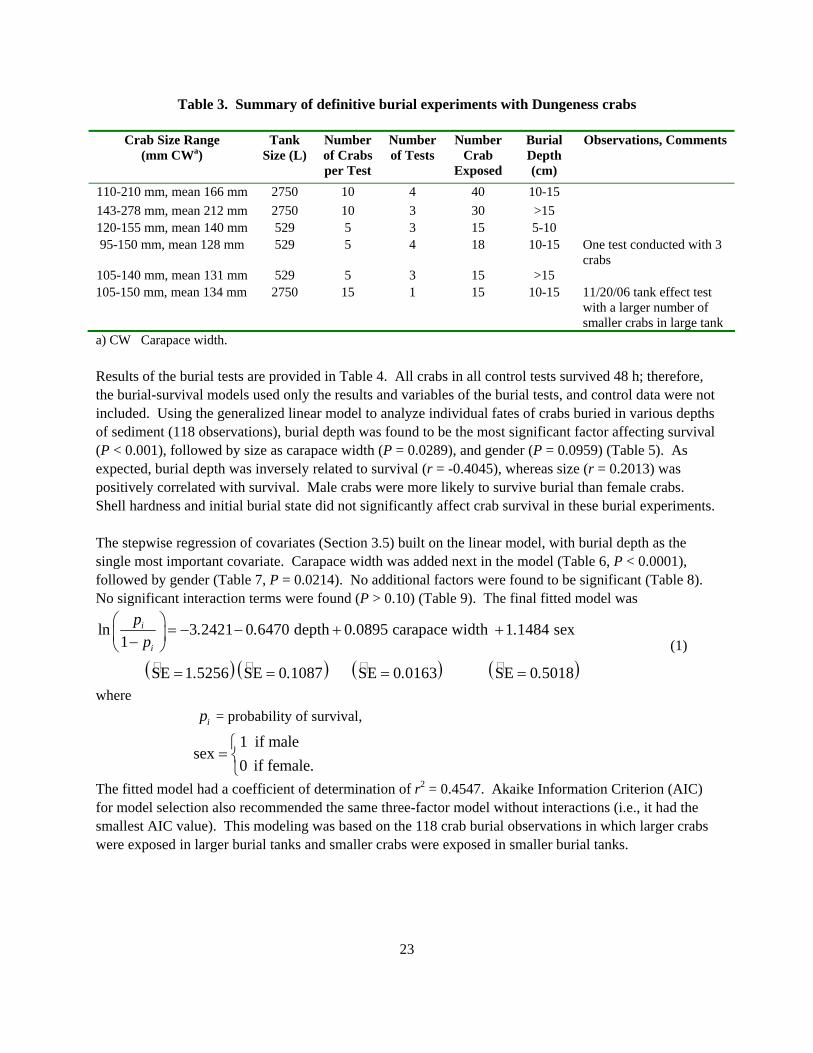
4.0 Results Development of the complex systems needed to perform these experiments was initiated when the contract was approved and continued through the summer of 2006. The preliminary experiments were conducted in July and August at the MSL. The definitive experiments were performed from 19 September through 10 December 2006. Seawater temperatures at the MSL during this time averaged 10.3°C, although temperatures varied during the course of this study as shown in Table 2.
Table 2. MSL seawater temperature average and range by month during the experiments
Month Average temperature
(°C)
Range of Temperature
(°C) July 12.2 10.0 – 14.8 August 12.0 10.3 – 13.6 September 11.5 9.5 – 13.3 October 9.3 8.2 – 10.4 November 8.3 6.6 – 8.9 December 7.6 6.9 – 8.2
4.1 Burial Experiments
4.1.1 Preliminary Burial Results
Three preliminary burial experiments were conducted with adult crabs to determine:
1. the time to suffocation if crab were not allowed an escape response; 2. whether crabs, when not allowed an escape response, could survive if oxygenated pore water
were provided; and 3. the depth limit at which crabs could no longer establish a respiratory pathway when no escape
response were possible. This third experiment was also conducted with juvenile crabs to investigate whether size differences affect survival during burial.
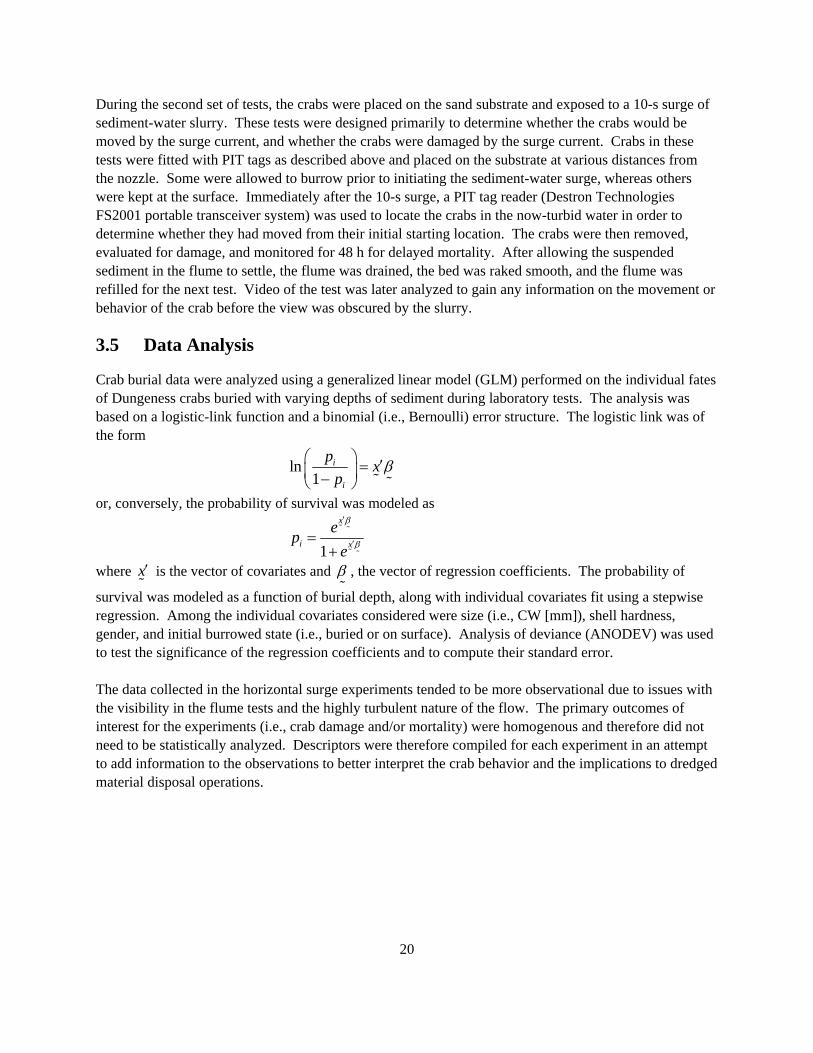
All (n=8) adult (≥120 mm CW) crabs suffocated and died within 24 h when buried in 8 cm of dredged material and not allowed an escape response or respiratory pathway. However, adult crab buried at the same depth (8 cm) survived at least 72 h when oxygenated water was supplied to the carapace depth through silicone tubing. These results indicate that crab survival is enhanced when oxygenated interstitial water is available to the crab when it cannot reach the surface on its own accord. In the third experiment, sediment was incrementally added to bins in which crabs were held down by netting to prevent escape by digging upward. Crabs could create a respiratory pathway through a layer of sand to oxygenate the interstitial pore water (Figure 11). When no escape response was allowed, larger
crabs could establish a respiratory pathway through sediment when buried to a depth of 6 cm; smaller crabs (60 mm CW) could only establish a respiratory pathway when buried in less than 3 cm of sediment.
Figure 11. Surface disturbance from a respiratory pathway through the sediment created
by buried crabs
4.1.2 Definitive Burial Results
The preliminary test results were used to establish a standard observation period of 48 h and relevant target burial depths for the definitive burial experiments. Because the experiments were conducted in late summer and into fall, crab availability was limited in number and also limited to mostly adult and subadult individuals (there were few to no crab <100 mm CW). Definitive burial experiments were conducted with two general size classes of crabs, those >150 mm CW (age 3+ years), and those <150 mm CW (mostly age 2+ years). In a few tests conducted when crab availability was severely limited, crab sizes were mixed. In total, 18 burial tests were conducted with Dungeness crabs (Table 3). With each round of burial tests, control tests were conducted concurrently with at least one set of processed crabs that were not buried. In definitive burial tests, crabs were not restrained by netting and always had an escape pathway to the sediment surface. As noted in Section 3.3.2, either 5 or 10 individuals were exposed per test, with the exception of one test of only 3 individuals. Crab size, gender, shell hardness, and initial burrowed state were recorded prior to addition of sediment slurry to bury crabs. As described in Section 3, large crabs were exposed in tanks 1.8 m in diameter by 0.9 m deep, whereas smaller crabs were exposed in smaller tanks 0.9 m diameter by 0.76 m deep. In a subsequent test to evaluate for tank effects, smaller crabs were exposed in one of the large burial tanks.
22
23
Crab Size Range (mm CWa)
Tank Size (L)
Number of Crabs per Test
Number of Tests
Number Crab
Exposed
Burial Depth (cm)
Observations, Comments
110-210 mm, mean 166 mm 2750 10 4 40 10-15 143-278 mm, mean 212 mm 2750 10 3 30 >15 120-155 mm, mean 140 mm 529 5 3 15 5-10 95-150 mm, mean 128 mm 529 5 4 18 10-15 One test conducted with 3
crabs 105-140 mm, mean 131 mm 529 5 3 15 >15 105-150 mm, mean 134 mm 2750 15 1 15 10-15 11/20/06 tank effect test
with a larger number of smaller crabs in large tank
Table 3. Summary of definitive burial experiments with Dungeness crabs
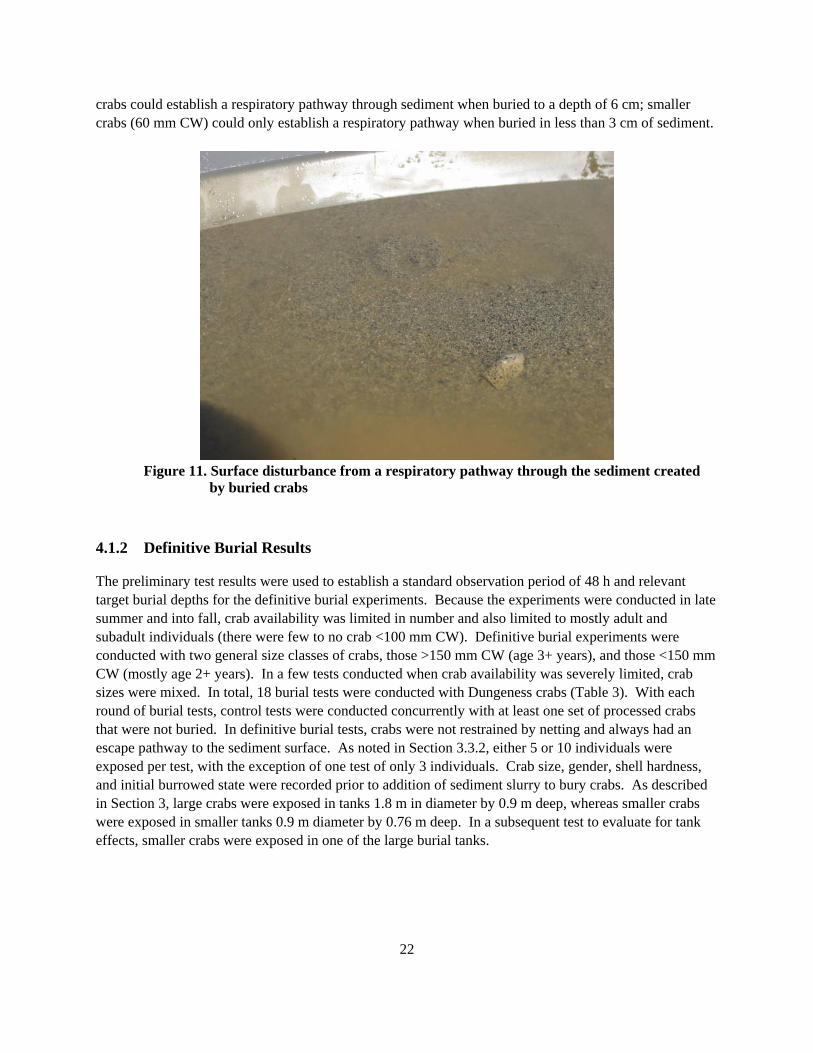
a) CW Carapace width. Results of the burial tests are provided in Table 4. All crabs in all control tests survived 48 h; therefore, the burial-survival models used only the results and variables of the burial tests, and control data were not included. Using the generalized linear model to analyze individual fates of crabs buried in various depths of sediment (118 observations), burial depth was found to be the most significant factor affecting survival (P < 0.001), followed by size as carapace width (P = 0.0289), and gender (P = 0.0959) (Table 5). As expected, burial depth was inversely related to survival (r = -0.4045), whereas size (r = 0.2013) was positively correlated with survival. Male crabs were more likely to survive burial than female crabs. Shell hardness and initial burial state did not significantly affect crab survival in these burial experiments. The stepwise regression of covariates (Section 3.5) built on the linear model, with burial depth as the single most important covariate. Carapace width was added next in the model (Table 6, P < 0.0001), followed by gender (Table 7, P = 0.0214). No additional factors were found to be significant (Table 8). No significant interaction terms were found (P > 0.10) (Table 9). The final fitted model was
( ) ( ) ( ) ( )
ln 3 2421 0 6470 depth 0 0895 carapace width 1 1484 sex1
SE 1 5256 SE 0 1087 SE 0 0163 SE 0 5018
i
i
p . . . .p
. . . .
⎛ ⎞ = − − + +⎜ ⎟−⎝ ⎠
= = = =
i p = probability of survival, where
1 if male sex
0 if female.⎧
= ⎨⎩
The fitted model had a coefficient of determination of r2 = 0.4547. Akaike Information Criterion (AIC) for model selection also recommended the same three-factor model without interactions (i.e., it had the smallest AIC value). This modeling was based on the 118 crab burial observations in which larger crabs were exposed in larger burial tanks and smaller crabs were exposed in smaller burial tanks.
(1)
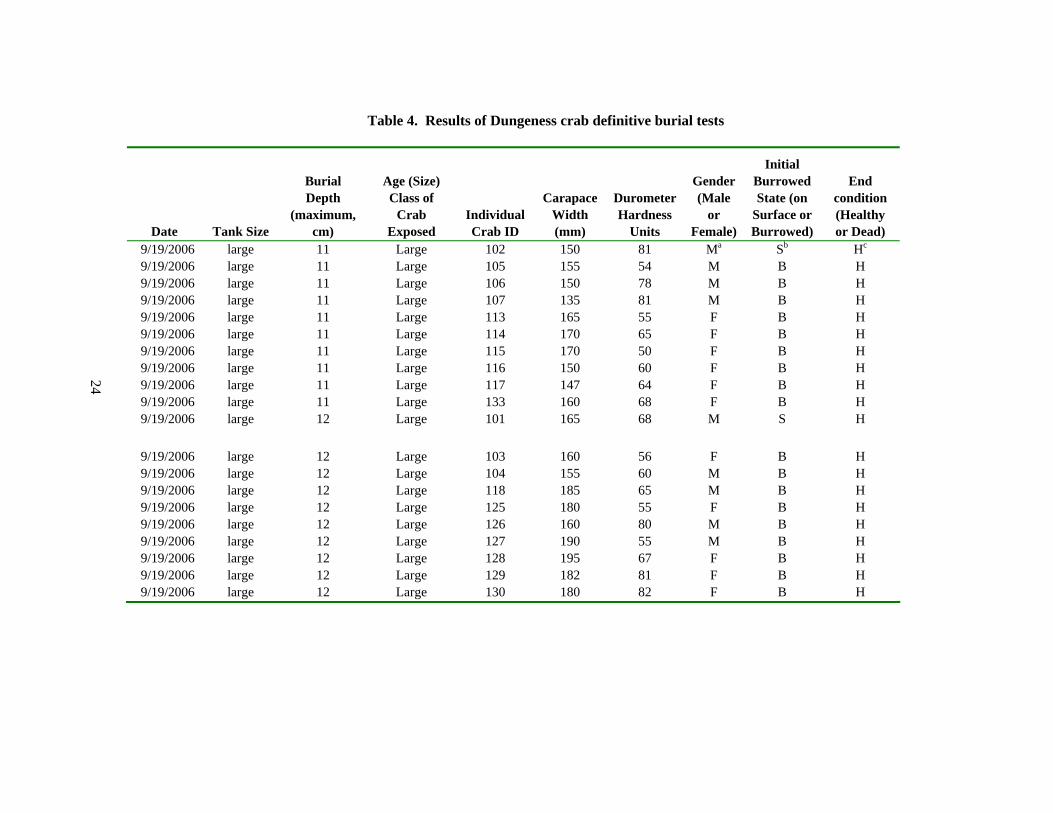
Table 4. Results of Dungeness crab definitive burial tests
Date Tank Size
Burial Depth
(maximum, cm)
Age (Size) Class of
Crab Exposed
Individual Crab ID
CarapaceWidth (mm)
Durometer Hardness
Units
Gender (Male
or Female)
Initial Burrowed State (on
Surface or Burrowed)
End condition (Healthy or Dead)
9/19/2006 large 11 Large 102 150 81 Ma Sb Hc
9/19/2006 large 11 Large 105 155 54 M B H 9/19/2006 large 11 Large 106 150 78 M B H 9/19/2006 large 11 Large 107 135 81 M B H 9/19/2006 large 11 Large 113 165 55 F B H 9/19/2006 large 11 Large 114 170 65 F B H 9/19/2006 large 11 Large 115 170 50 F B H 9/19/2006 large 11 Large 116 150 60 F B H 9/19/2006 large 11 Large 117 147 64 F B H 9/19/2006 large 11 Large 133 160 68 F B H 9/19/2006 large 12 Large 101 165 68 M S H
9/19/2006 large 12 Large 103 160 56 F B H 9/19/2006 large 12 Large 104 155 60 M B H 9/19/2006 large 12 Large 118 185 65 M B H 9/19/2006 large 12 Large 125 180 55 F B H 9/19/2006 large 12 Large 126 160 80 M B H 9/19/2006 large 12 Large 127 190 55 M B H 9/19/2006 large 12 Large 128 195 67 F B H 9/19/2006 large 12 Large 129 182 81 F B H 9/19/2006 large 12 Large 130 180 82 F B H
24
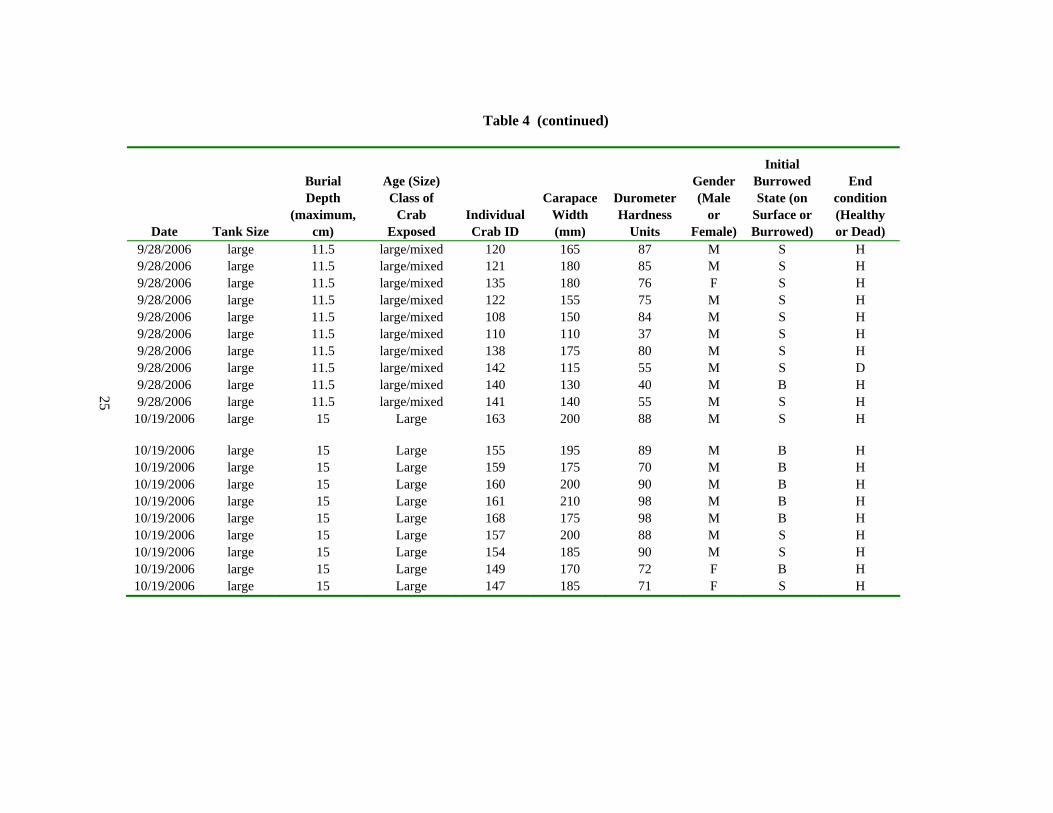
Table 4 (continued)
Date Tank Size
Burial Depth
(maximum, cm)
Age (Size) Class of
Crab Exposed
Individual Crab ID
CarapaceWidth (mm)
Durometer Hardness
Units
Gender (Male
or Female)
Initial Burrowed State (on
Surface or Burrowed)
End condition (Healthy or Dead)
9/28/2006 large 11.5 large/mixed 120 165 87 M S H 9/28/2006 large 11.5 large/mixed 121 180 85 M S H 9/28/2006 large 11.5 large/mixed 135 180 76 F S H 9/28/2006 large 11.5 large/mixed 122 155 75 M S H 9/28/2006 large 11.5 large/mixed 108 150 84 M S H 9/28/2006 large 11.5 large/mixed 110 110 37 M S H 9/28/2006 large 11.5 large/mixed 138 175 80 M S H 9/28/2006 large 11.5 large/mixed 142 115 55 M S D 9/28/2006 large 11.5 large/mixed 140 130 40 M B H 9/28/2006 large 11.5 large/mixed 141 140 55 M S H 10/19/2006 large 15 Large 163 200 88 M S H
10/19/2006 large 15 Large 155 195 89 M B H 10/19/2006 large 15 Large 159 175 70 M B H 10/19/2006 large 15 Large 160 200 90 M B H 10/19/2006 large 15 Large 161 210 98 M B H 10/19/2006 large 15 Large 168 175 98 M B H 10/19/2006 large 15 Large 157 200 88 M S H 10/19/2006 large 15 Large 154 185 90 M S H 10/19/2006 large 15 Large 149 170 72 F B H 10/19/2006 large 15 Large 147 185 71 F S H
25
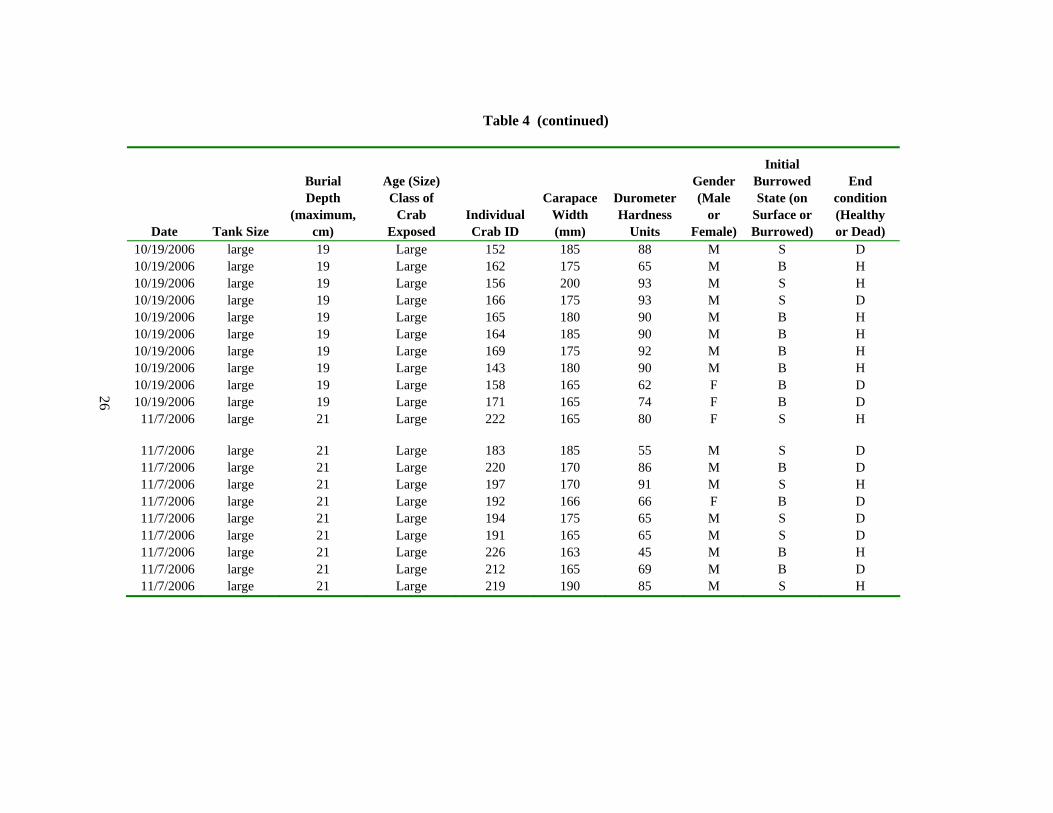
Table 4 (continued)
Date Tank Size
Burial Depth
(maximum, cm)
Age (Size) Class of
Crab Exposed
Individual Crab ID
CarapaceWidth (mm)
Durometer Hardness
Units
Gender (Male
or Female)
Initial Burrowed State (on
Surface or Burrowed)
End condition (Healthy or Dead)
10/19/2006 large 19 Large 152 185 88 M S D 10/19/2006 large 19 Large 162 175 65 M B H 10/19/2006 large 19 Large 156 200 93 M S H 10/19/2006 large 19 Large 166 175 93 M S D 10/19/2006 large 19 Large 165 180 90 M B H 10/19/2006 large 19 Large 164 185 90 M B H 10/19/2006 large 19 Large 169 175 92 M B H 10/19/2006 large 19 Large 143 180 90 M B H 10/19/2006 large 19 Large 158 165 62 F B D 10/19/2006 large 19 Large 171 165 74 F B D 11/7/2006 large 21 Large 222 165 80 F S H
11/7/2006 large 21 Large 183 185 55 M S D 11/7/2006 large 21 Large 220 170 86 M B D 11/7/2006 large 21 Large 197 170 91 M S H 11/7/2006 large 21 Large 192 166 66 F B D 11/7/2006 large 21 Large 194 175 65 M S D 11/7/2006 large 21 Large 191 165 65 M S D 11/7/2006 large 21 Large 226 163 45 M B H 11/7/2006 large 21 Large 212 165 69 M B D 11/7/2006 large 21 Large 219 190 85 M S H
26
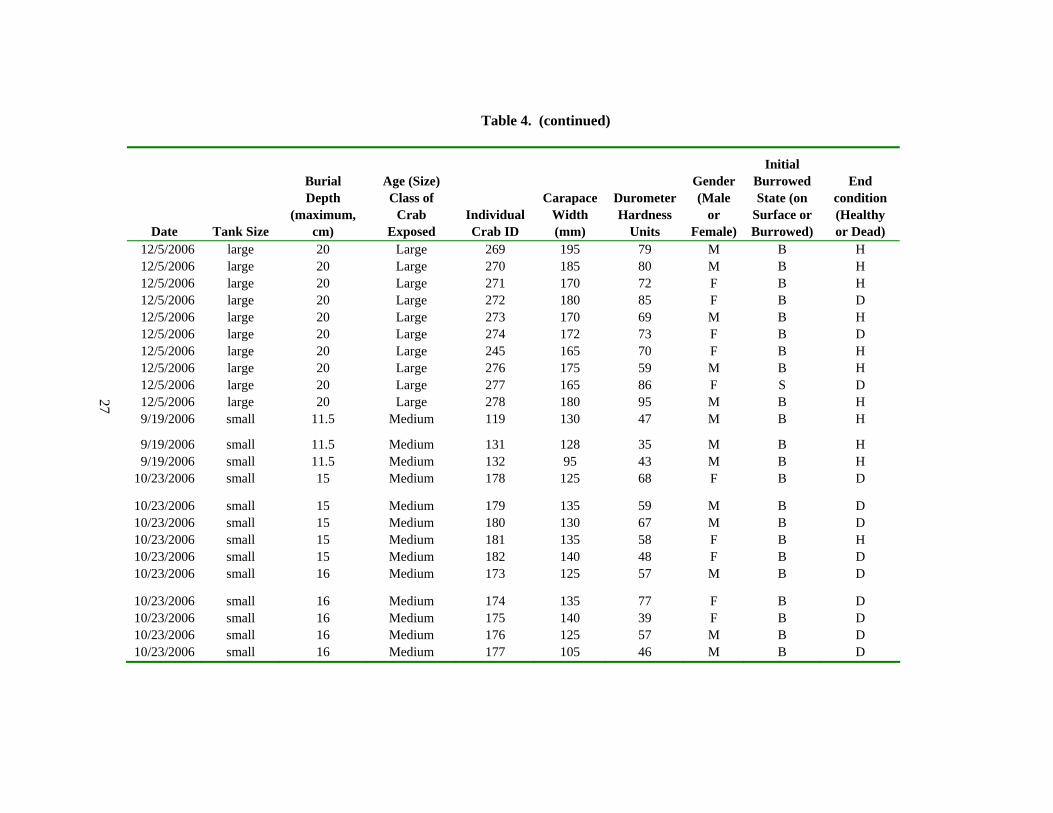
Table 4. (continued)
Date Tank Size
Burial Depth
(maximum, cm)
Age (Size) Class of
Crab Exposed
Individual Crab ID
CarapaceWidth (mm)
Durometer Hardness
Units
Gender (Male
or Female)
Initial Burrowed State (on
Surface or Burrowed)
End condition (Healthy or Dead)
12/5/2006 large 20 Large 269 195 79 M B H 12/5/2006 large 20 Large 270 185 80 M B H 12/5/2006 large 20 Large 271 170 72 F B H 12/5/2006 large 20 Large 272 180 85 F B D 12/5/2006 large 20 Large 273 170 69 M B H 12/5/2006 large 20 Large 274 172 73 F B D 12/5/2006 large 20 Large 245 165 70 F B H 12/5/2006 large 20 Large 276 175 59 M B H 12/5/2006 large 20 Large 277 165 86 F S D 12/5/2006 large 20 Large 278 180 95 M B H 9/19/2006 small 11.5 Medium 119 130 47 M B H
9/19/2006 small 11.5 Medium 131 128 35 M B H 9/19/2006 small 11.5 Medium 132 95 43 M B H
10/23/2006 small 15 Medium 178 125 68 F B D
10/23/2006 small 15 Medium 179 135 59 M B D 10/23/2006 small 15 Medium 180 130 67 M B D 10/23/2006 small 15 Medium 181 135 58 F B H 10/23/2006 small 15 Medium 182 140 48 F B D 10/23/2006 small 16 Medium 173 125 57 M B D
10/23/2006 small 16 Medium 174 135 77 F B D 10/23/2006 small 16 Medium 175 140 39 F B D 10/23/2006 small 16 Medium 176 125 57 M B D 10/23/2006 small 16 Medium 177 105 46 M B D
27
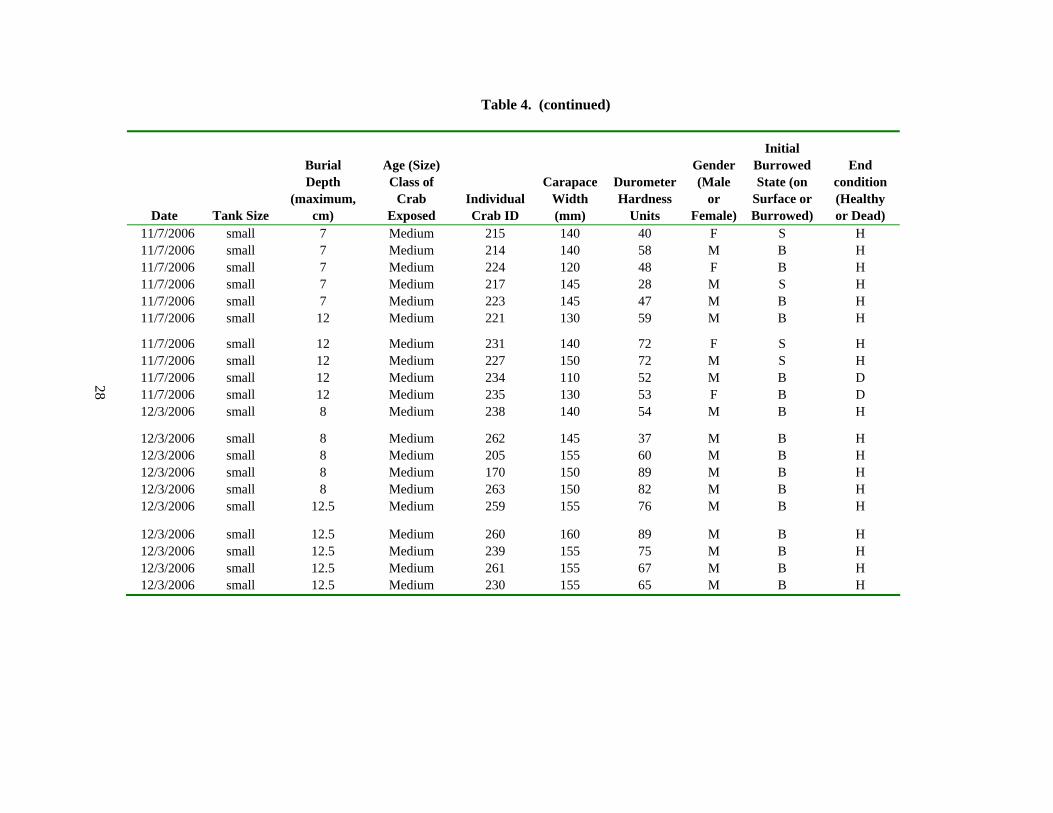
Table 4. (continued)
Date Tank Size
Burial Depth
(maximum, cm)
Age (Size) Class of
Crab Exposed
Individual Crab ID
CarapaceWidth (mm)
Durometer Hardness
Units
Gender (Male
or Female)
Initial Burrowed State (on
Surface or Burrowed)
End condition (Healthy or Dead)
11/7/2006 small 7 Medium 215 140 40 F S H 11/7/2006 small 7 Medium 214 140 58 M B H 11/7/2006 small 7 Medium 224 120 48 F B H 11/7/2006 small 7 Medium 217 145 28 M S H 11/7/2006 small 7 Medium 223 145 47 M B H 11/7/2006 small 12 Medium 221 130 59 M B H
11/7/2006 small 12 Medium 231 140 72 F S H 11/7/2006 small 12 Medium 227 150 72 M S H 11/7/2006 small 12 Medium 234 110 52 M B D 11/7/2006 small 12 Medium 235 130 53 F B D 12/3/2006 small 8 Medium 238 140 54 M B H
12/3/2006 small 8 Medium 262 145 37 M B H 12/3/2006 small 8 Medium 205 155 60 M B H 12/3/2006 small 8 Medium 170 150 89 M B H 12/3/2006 small 8 Medium 263 150 82 M B H 12/3/2006 small 12.5 Medium 259 155 76 M B H
12/3/2006 small 12.5 Medium 260 160 89 M B H 12/3/2006 small 12.5 Medium 239 155 75 M B H 12/3/2006 small 12.5 Medium 261 155 67 M B H 12/3/2006 small 12.5 Medium 230 155 65 M B H
28
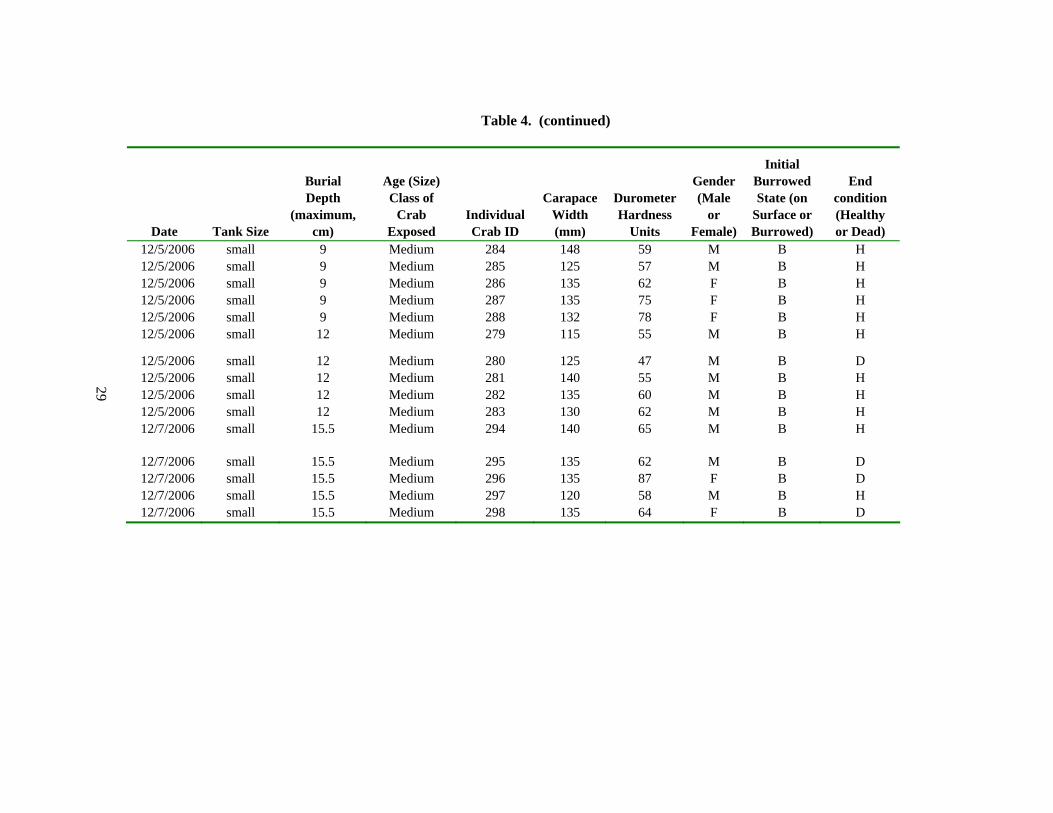
Table 4. (continued)
Date Tank Size
Burial Depth
(maximum, cm)
Age (Size) Class of
Crab Exposed
Individual Crab ID
CarapaceWidth (mm)
Durometer Hardness
Units
Gender (Male
or Female)
Initial Burrowed State (on
Surface or Burrowed)
End condition (Healthy or Dead)
12/5/2006 small 9 Medium 284 148 59 M B H 12/5/2006 small 9 Medium 285 125 57 M B H 12/5/2006 small 9 Medium 286 135 62 F B H 12/5/2006 small 9 Medium 287 135 75 F B H 12/5/2006 small 9 Medium 288 132 78 F B H 12/5/2006 small 12 Medium 279 115 55 M B H
12/5/2006 small 12 Medium 280 125 47 M B D 12/5/2006 small 12 Medium 281 140 55 M B H 12/5/2006 small 12 Medium 282 135 60 M B H 12/5/2006 small 12 Medium 283 130 62 M B H 12/7/2006 small 15.5 Medium 294 140 65 M B H
12/7/2006 small 15.5 Medium 295 135 62 M B D 12/7/2006 small 15.5 Medium 296 135 87 F B D 12/7/2006 small 15.5 Medium 297 120 58 M B H 12/7/2006 small 15.5 Medium 298 135 64 F B D
29
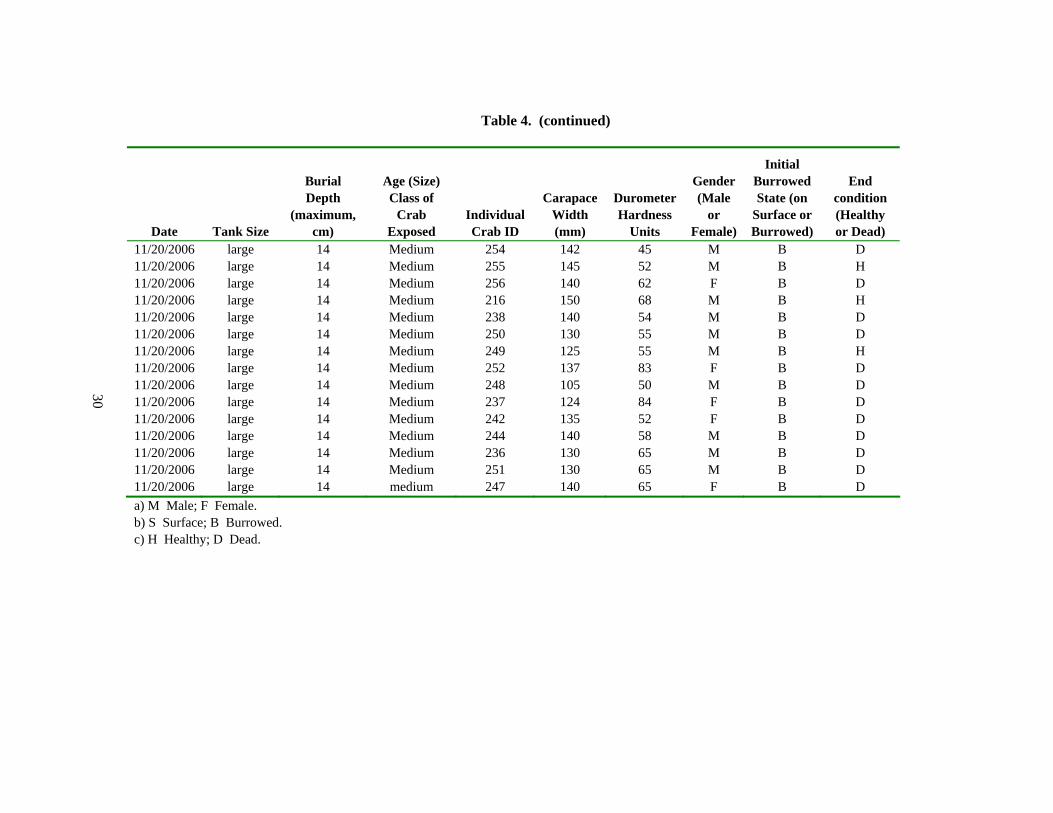
Date Tank Size
Burial Depth
(maximum, cm)
Age (Size) Class of
Crab Exposed
Individual Crab ID
CarapaceWidth (mm)
Durometer Hardness
Units
Gender (Male
or Female)
Initial Burrowed State (on
Surface or Burrowed)
End condition (Healthy or Dead)
11/20/2006 large 14 Medium 254 142 45 M B D 11/20/2006 large 14 Medium 255 145 52 M B H 11/20/2006 large 14 Medium 256 140 62 F B D 11/20/2006 large 14 Medium 216 150 68 M B H 11/20/2006 large 14 Medium 238 140 54 M B D 11/20/2006 large 14 Medium 250 130 55 M B D 11/20/2006 large 14 Medium 249 125 55 M B H 11/20/2006 large 14 Medium 252 137 83 F B D 11/20/2006 large 14 Medium 248 105 50 M B D 11/20/2006 large 14 Medium 237 124 84 F B D 11/20/2006 large 14 Medium 242 135 52 F B D 11/20/2006 large 14 Medium 244 140 58 M B D 11/20/2006 large 14 Medium 236 130 65 M B D 11/20/2006 large 14 Medium 251 130 65 M B D 11/20/2006 large 14 medium 247 140 65 F B D
Table 4. (continued)
a) M Male; F Female. b) S Surface; B Burrowed. c) H Healthy; D Dead.
30
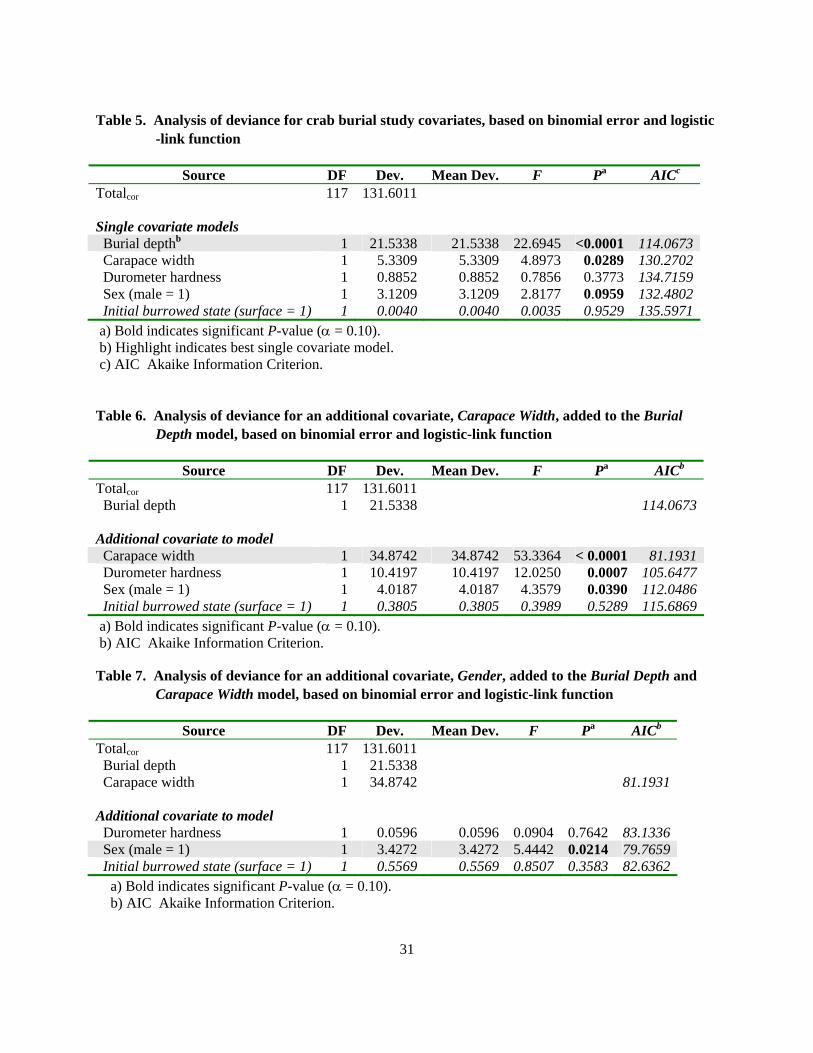
31
Table 5. Analysis of deviance for crab burial study covariates, based on binomial error and logistic -link function
Source DF Dev. Mean Dev. F Pa AICc
Totalcor 117 131.6011 Single covariate models Burial depthb 1 21.5338 21.5338 22.6945 <0.0001 114.0673 Carapace width 1 5.3309 5.3309 4.8973 0.0289 130.2702 Durometer hardness 1 0.8852 0.8852 0.7856 0.3773 134.7159 Sex (male = 1) 1 3.1209 3.1209 2.8177 0.0959 132.4802 Initial burrowed state (surface = 1) 1 0.0040 0.0040 0.0035 0.9529 135.5971 a) Bold indicates significant P-value (α = 0.10). b) Highlight indicates best single covariate model. c) AIC Akaike Information Criterion.
Table 6. Analysis of deviance for an additional covariate, Carapace Width, added to the Burial Depth model, based on binomial error and logistic-link function
Source DF Dev. Mean Dev. F Pa AICb
Totalcor 117 131.6011 Burial depth 1 21.5338 114.0673 Additional covariate to model Carapace width 1 34.8742 34.8742 53.3364 < 0.0001 81.1931 Durometer hardness 1 10.4197 10.4197 12.0250 0.0007 105.6477 Sex (male = 1) 1 4.0187 4.0187 4.3579 0.0390 112.0486 Initial burrowed state (surface = 1) 1 0.3805 0.3805 0.3989 0.5289 115.6869 a) Bold indicates significant P-value (α = 0.10). b) AIC Akaike Information Criterion.
Table 7. Analysis of deviance for an additional covariate, Gender, added to the Burial Depth and Carapace Width model, based on binomial error and logistic-link function
Source DF Dev. Mean Dev. F Pa AICb
Totalcor 117 131.6011 Burial depth 1 21.5338 Carapace width 1 34.8742 81.1931 Additional covariate to model Durometer hardness 1 0.0596 0.0596 0.0904 0.7642 83.1336 Sex (male = 1) 1 3.4272 3.4272 5.4442 0.0214 79.7659 Initial burrowed state (surface = 1) 1 0.5569 0.5569 0.8507 0.3583 82.6362 a) Bold indicates significant P-value (α = 0.10). b) AIC Akaike Information Criterion.
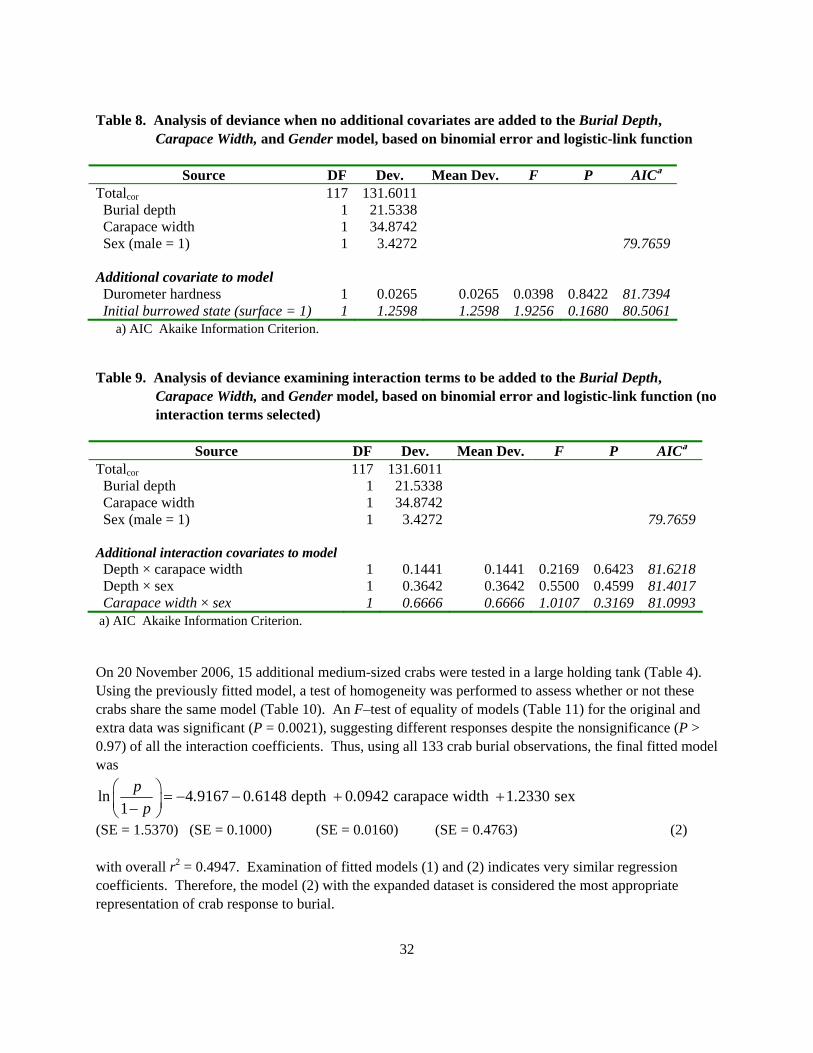
Table 8. Analysis of deviance when no additional covariates are added to the Burial Depth, Carapace Width, and Gender model, based on binomial error and logistic-link function
Source DF Dev. Mean Dev. F P AICa
Totalcor 117 131.6011 Burial depth 1 21.5338 Carapace width 1 34.8742 Sex (male = 1) 1 3.4272 79.7659 Additional covariate to model Durometer hardness 1 0.0265 0.0265 0.0398 0.8422 81.7394 Initial burrowed state (surface = 1) 1 1.2598 1.2598 1.9256 0.1680 80.5061 a) AIC Akaike Information Criterion.
Table 9. Analysis of deviance examining interaction terms to be added to the Burial Depth, Carapace Width, and Gender model, based on binomial error and logistic-link function (no interaction terms selected)
Source DF Dev. Mean Dev. F P AICa
Totalcor 117 131.6011 Burial depth 1 21.5338 Carapace width 1 34.8742 Sex (male = 1) 1 3.4272 79.7659 Additional interaction covariates to model Depth × carapace width 1 0.1441 0.1441 0.2169 0.6423 81.6218 Depth × sex 1 0.3642 0.3642 0.5500 0.4599 81.4017 Carapace width × sex 1 0.6666 0.6666 1.0107 0.3169 81.0993 a) AIC Akaike Information Criterion. On 20 November 2006, 15 additional medium-sized crabs were tested in a large holding tank (Table 4). Using the previously fitted model, a test of homogeneity was performed to assess whether or not these crabs share the same model (Table 10). An F–test of equality of models (Table 11) for the original and extra data was significant (P = 0.0021), suggesting different responses despite the nonsignificance (P > 0.97) of all the interaction coefficients. Thus, using all 133 crab burial observations, the final fitted model was
ln 4 9167 0 6148 depth 0 0942 carapace width 1 2330 sex1
p . . . .p
⎛ ⎞ = − − + +⎜ ⎟−⎝ ⎠
(SE = 1.5370) (SE = 0.1000) (SE = 0.0160) (SE = 0.4763) (2) with overall r2 = 0.4947. Examination of fitted models (1) and (2) indicates very similar regression coefficients. Therefore, the model (2) with the expanded dataset is considered the most appropriate representation of crab response to burial.
32

33
Table 10. Table of regression coefficients comparing initial 118 observations with additional 15 observations for potential tank size effect
Coefficient Estimate Std. Error z value Pr(>|z|) (Intercept) –3.2421 1.9276 –1.6820 0.0926 Depth –0.6470 0.1357 –4.7673 0.0000 Indicator –17.0507 1733.7755 –0.0098 0.9922 Width 0.0895 0.0206 4.3529 0.0000 Sex 1.1484 0.6324 1.8159 0.0694 Indicator: width –0.0028 0.0889 –0.0315 0.9748 Indicator: sex 15.5525 1733.7326 0.0090 0.9928
a) AIC Akaike Information Criterion.
Table 11. Analysis of deviance when 15 additional observations are added to the Burial Depth, Carapace Width, and Gender model, based on binomial error and logistic-link function
Source DF Dev. Mean Dev. F P AICa
Totalcor 132 164.3109 Burial depth + carapace width + sex 3 71.5786 100.7322 Addition of data indicator variables Extra + extra × width + extra × sex 3 10.1510 3.3837 5.1627 0.0021 96.5812Error 126 82.5813 0.6554 a) AIC Akaike Information Criterion. Using the fitted model (2) (Section 4.1.2), four survivorship curves were generated as a function of burial depth. Curves (Figure 12) were generated for male and female crabs age 2+ (average 132.12 mm CW) and for male and female crabs age 3+ (average 171.8 mm CW). These curves indicate that the 3+ age class of crabs (>150 mm CW) has high probability of surviving the maximum 12-cm depth burial event predicted by Pearson et al. (2006b) for typical disposal operations. For the 2+ age class, however, notable mortality is projected at a burial depth of 12 cm, with mortalities of 47% in female crabs and 20% in male crabs.
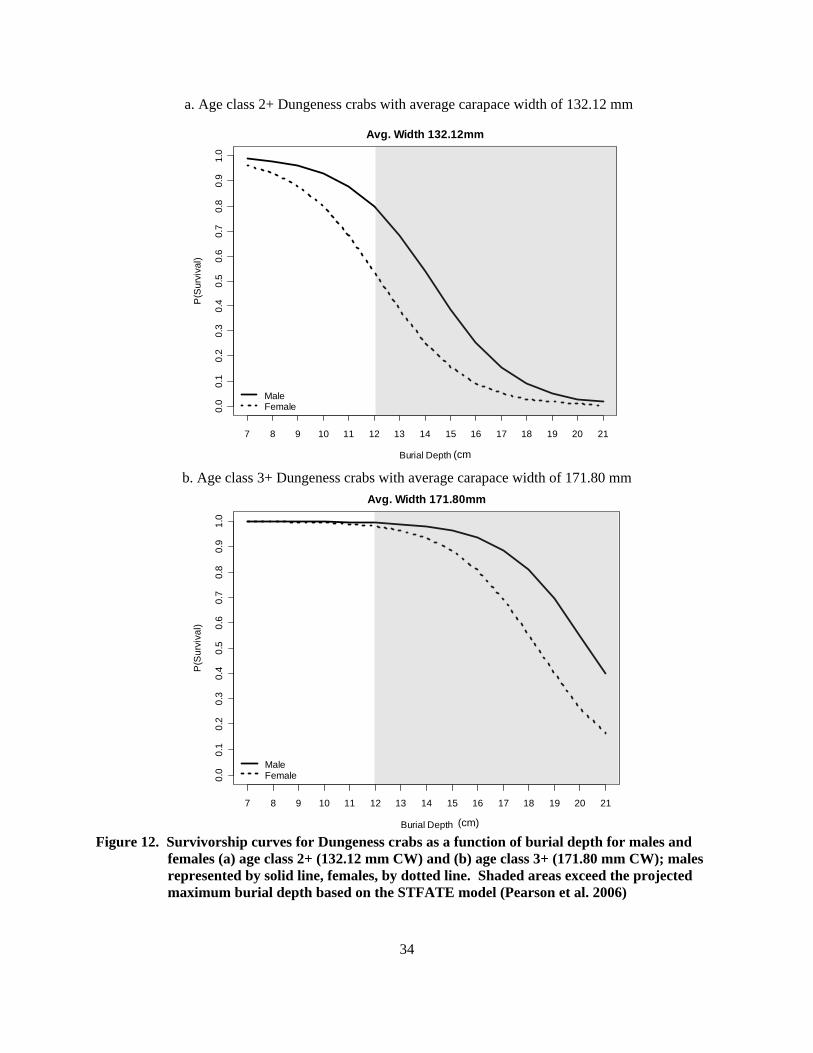
a. Age class 2+ Dungeness crabs with average carapace width of 132.12 mm
7 8 9 10 11 12 13 14 15 16 17 18 19 20 21
0.0
0.1
0.2
0.3
0.4
0.5
0.6
0.7
0.8
0.9
1.0
Avg. Width 132.12mm
Burial Depth
P(S
urvi
val)
MaleFemale
(cm
b. Age class 3+ Dungeness crabs with average carapace width of 171.80 mm
7 8 9 10 11 12 13 14 15 16 17 18 19 20 21
0.0
0.1
0.2
0.3
0.4
0.5
0.6
0.7
0.8
0.9
1.0
Avg. Width 171.80mm
Burial Depth
P(S
urvi
val)
MaleFemale
(cm)
Figure 12. Survivorship curves for Dungeness crabs as a function of burial depth for males and females (a) age class 2+ (132.12 mm CW) and (b) age class 3+ (171.80 mm CW); males represented by solid line, females, by dotted line. Shaded areas exceed the projected maximum burial depth based on the STFATE model (Pearson et al. 2006)
34
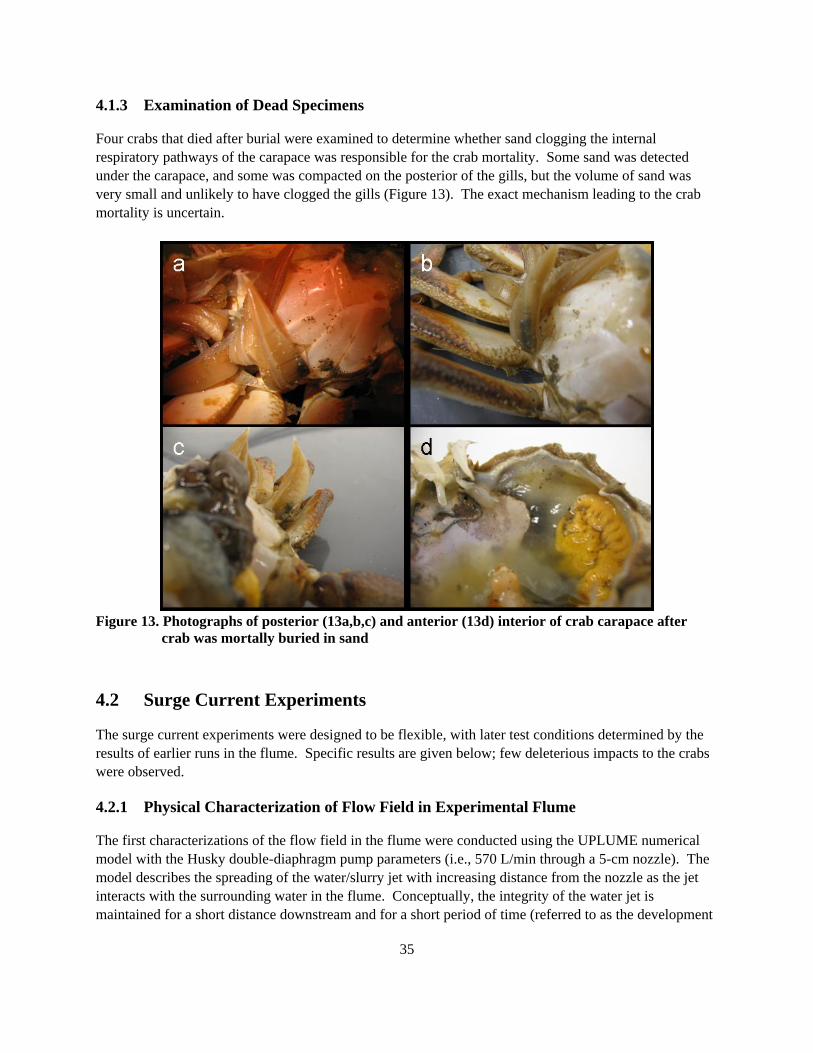
4.1.3 Examination of Dead Specimens
Four crabs that died after burial were examined to determine whether sand clogging the internal respiratory pathways of the carapace was responsible for the crab mortality. Some sand was detected under the carapace, and some was compacted on the posterior of the gills, but the volume of sand was very small and unlikely to have clogged the gills (Figure 13). The exact mechanism leading to the crab mortality is uncertain.
Figure 13. Photographs of posterior (13a,b,c) and anterior (13d) interior of crab carapace after
crab was mortally buried in sand
4.2 Surge Current Experiments
The surge current experiments were designed to be flexible, with later test conditions determined by the results of earlier runs in the flume. Specific results are given below; few deleterious impacts to the crabs were observed.
4.2.1 Physical Characterization of Flow Field in Experimental Flume
35
The first characterizations of the flow field in the flume were conducted using the UPLUME numerical model with the Husky double-diaphragm pump parameters (i.e., 570 L/min through a 5-cm nozzle). The model describes the spreading of the water/slurry jet with increasing distance from the nozzle as the jet interacts with the surrounding water in the flume. Conceptually, the integrity of the water jet is maintained for a short distance downstream and for a short period of time (referred to as the development
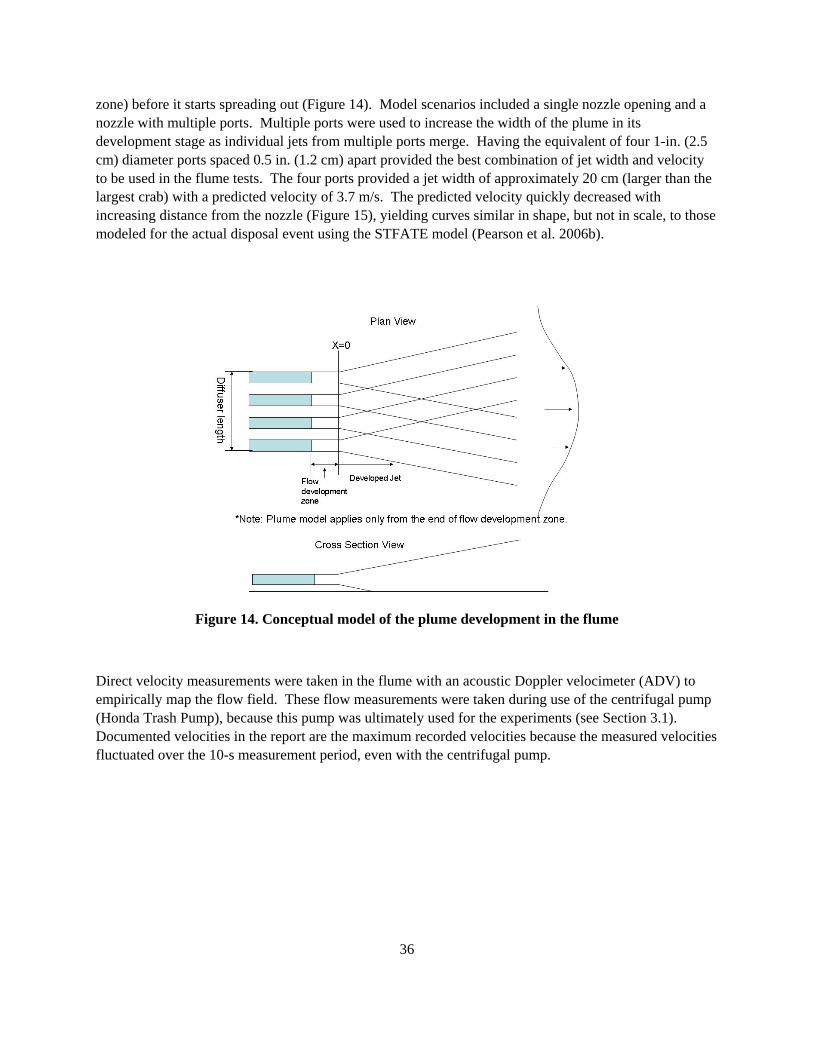
zone) before it starts spreading out (Figure 14). Model scenarios included a single nozzle opening and a nozzle with multiple ports. Multiple ports were used to increase the width of the plume in its development stage as individual jets from multiple ports merge. Having the equivalent of four 1-in. (2.5 cm) diameter ports spaced 0.5 in. (1.2 cm) apart provided the best combination of jet width and velocity to be used in the flume tests. The four ports provided a jet width of approximately 20 cm (larger than the largest crab) with a predicted velocity of 3.7 m/s. The predicted velocity quickly decreased with increasing distance from the nozzle (Figure 15), yielding curves similar in shape, but not in scale, to those modeled for the actual disposal event using the STFATE model (Pearson et al. 2006b).
Figure 14. Conceptual model of the plume development in the flume
Direct velocity measurements were taken in the flume with an acoustic Doppler velocimeter (ADV) to empirically map the flow field. These flow measurements were taken during use of the centrifugal pump (Honda Trash Pump), because this pump was ultimately used for the experiments (see Section 3.1). Documented velocities in the report are the maximum recorded velocities because the measured velocities fluctuated over the 10-s measurement period, even with the centrifugal pump.
36
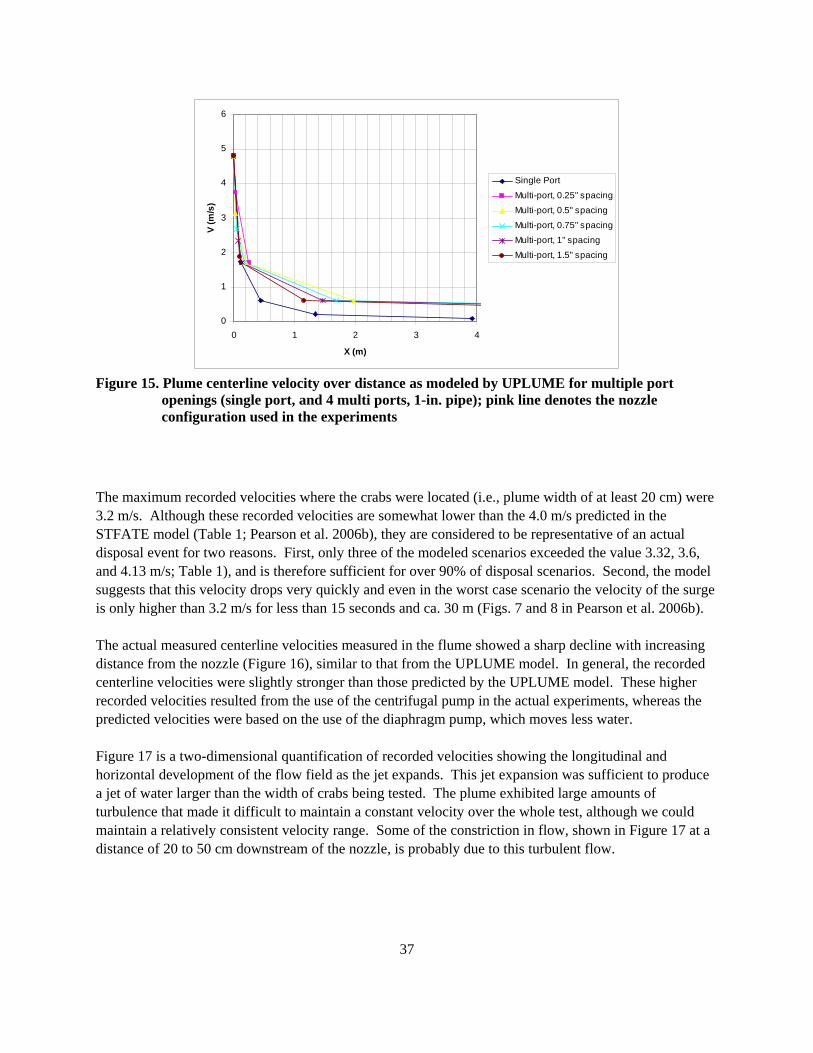
0
1
2
3
4
5
6
0 1 2 3 4
X (m)
V (m
/s)
Single Port
Multi-port, 0.25" spacing
Multi-port, 0.5" spacing
Multi-port, 0.75" spacing
Multi-port, 1" spacing
Multi-port, 1.5" spacing
Figure 15. Plume centerline velocity over distance as modeled by UPLUME for multiple port
openings (single port, and 4 multi ports, 1-in. pipe); pink line denotes the nozzle configuration used in the experiments
The maximum recorded velocities where the crabs were located (i.e., plume width of at least 20 cm) were 3.2 m/s. Although these recorded velocities are somewhat lower than the 4.0 m/s predicted in the STFATE model (Table 1; Pearson et al. 2006b), they are considered to be representative of an actual disposal event for two reasons. First, only three of the modeled scenarios exceeded the value 3.32, 3.6, and 4.13 m/s; Table 1), and is therefore sufficient for over 90% of disposal scenarios. Second, the model suggests that this velocity drops very quickly and even in the worst case scenario the velocity of the surge is only higher than 3.2 m/s for less than 15 seconds and ca. 30 m (Figs. 7 and 8 in Pearson et al. 2006b). The actual measured centerline velocities measured in the flume showed a sharp decline with increasing distance from the nozzle (Figure 16), similar to that from the UPLUME model. In general, the recorded centerline velocities were slightly stronger than those predicted by the UPLUME model. These higher recorded velocities resulted from the use of the centrifugal pump in the actual experiments, whereas the predicted velocities were based on the use of the diaphragm pump, which moves less water. Figure 17 is a two-dimensional quantification of recorded velocities showing the longitudinal and horizontal development of the flow field as the jet expands. This jet expansion was sufficient to produce a jet of water larger than the width of crabs being tested. The plume exhibited large amounts of turbulence that made it difficult to maintain a constant velocity over the whole test, although we could maintain a relatively consistent velocity range. Some of the constriction in flow, shown in Figure 17 at a distance of 20 to 50 cm downstream of the nozzle, is probably due to this turbulent flow.
37
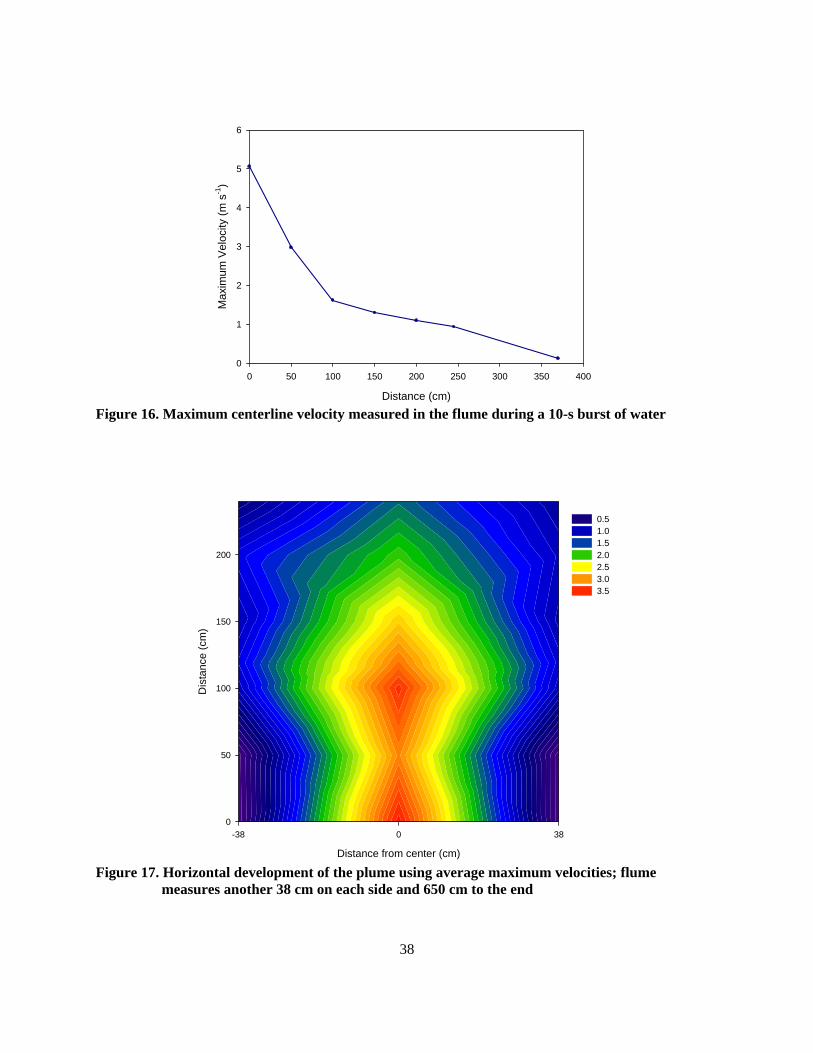
Distance (cm)
0 50 100 150 200 250 300 350 400
Max
imum
Vel
ocity
(m s
-1)
0
1
2
3
4
5
6
Figure 16. Maximum centerline velocity measured in the flume during a 10-s burst of water
Distance from center (cm)
-38 0 38
Dis
tanc
e (c
m)
0
50
100
150
200
0.5 1.0 1.5 2.0 2.5 3.0 3.5
Figure 17. Horizontal development of the plume using average maximum velocities; flume
measures another 38 cm on each side and 650 cm to the end
38
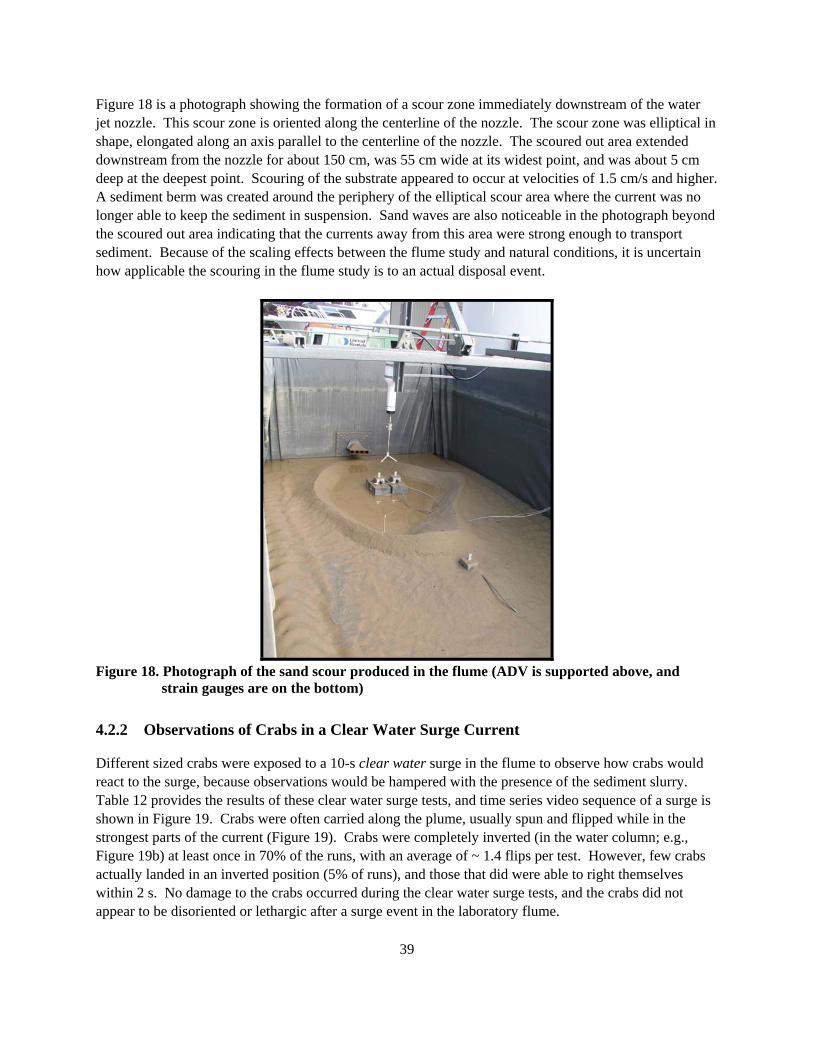
Figure 18 is a photograph showing the formation of a scour zone immediately downstream of the water jet nozzle. This scour zone is oriented along the centerline of the nozzle. The scour zone was elliptical in shape, elongated along an axis parallel to the centerline of the nozzle. The scoured out area extended downstream from the nozzle for about 150 cm, was 55 cm wide at its widest point, and was about 5 cm deep at the deepest point. Scouring of the substrate appeared to occur at velocities of 1.5 cm/s and higher. A sediment berm was created around the periphery of the elliptical scour area where the current was no longer able to keep the sediment in suspension. Sand waves are also noticeable in the photograph beyond the scoured out area indicating that the currents away from this area were strong enough to transport sediment. Because of the scaling effects between the flume study and natural conditions, it is uncertain how applicable the scouring in the flume study is to an actual disposal event.
Figure 18. Photograph of the sand scour produced in the flume (ADV is supported above, and
strain gauges are on the bottom)
4.2.2 Observations of Crabs in a Clear Water Surge Current
Different sized crabs were exposed to a 10-s clear water surge in the flume to observe how crabs would react to the surge, because observations would be hampered with the presence of the sediment slurry. Table 12 provides the results of these clear water surge tests, and time series video sequence of a surge is shown in Figure 19. Crabs were often carried along the plume, usually spun and flipped while in the strongest parts of the current (Figure 19). Crabs were completely inverted (in the water column; e.g., Figure 19b) at least once in 70% of the runs, with an average of ~ 1.4 flips per test. However, few crabs actually landed in an inverted position (5% of runs), and those that did were able to right themselves within 2 s. No damage to the crabs occurred during the clear water surge tests, and the crabs did not appear to be disoriented or lethargic after a surge event in the laboratory flume. 39

40
Table 12. Results of experiments on crab exposed to surge currents
Test # Run # Crab Width
(mm) # Times Flipped
Landed Inverted
Time to Right (s) Damage
102601 1 120 0 No -- No 2 1 No -- No 3 1 No -- No
102602 1 148 2 * * No 2 1 No -- No 3 2 No -- No
102603 1 130 * No -- No 2 * No -- No 3 1 No -- No
102604 1 195 1 No -- No 2 3 No -- No 3 2 No -- No
102605 1 150 1 No -- No 2 2 No -- No 3 1 Yes 2.07 No
102606 1 165 0 No -- No 0 No -- No 2
3 1 No -- No 102607 1 195 1 No -- No
2 0 No -- No 3 0 No -- No
102608 1 165 0 No -- No 2 1 No -- No 3 0 No -- No
102609 1 124 1 No -- No 2 1 Yes 0.85 No 3 1 * * No
102610 1 130 0 No -- No 2 2 No -- No 3 0 No -- No
102713 1 135 1 No -- No 2 3 * * No 3 2 No -- No
102714 1 155 1 No -- No 2 1 * * No 3 1 No -- No
102715 1 117 1 No -- No 2 0 No -- No 3 1 No -- No
102716 1 120 0 No -- No 2 0 No -- No
*Visibility was obscured for this portion of the test.
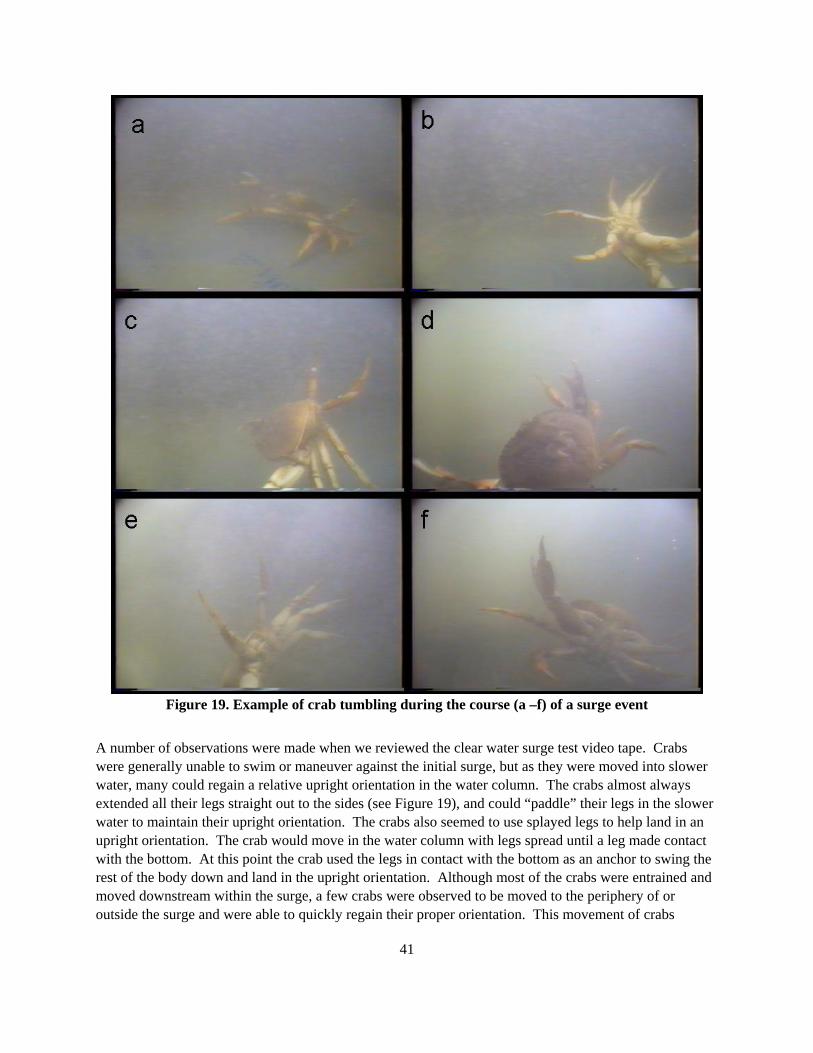
Figure 19. Example of crab tumbling during the course (a –f) of a surge event
41
A number of observations were made when we reviewed the clear water surge test video tape. Crabs were generally unable to swim or maneuver against the initial surge, but as they were moved into slower water, many could regain a relative upright orientation in the water column. The crabs almost always extended all their legs straight out to the sides (see Figure 19), and could “paddle” their legs in the slower water to maintain their upright orientation. The crabs also seemed to use splayed legs to help land in an upright orientation. The crab would move in the water column with legs spread until a leg made contact with the bottom. At this point the crab used the legs in contact with the bottom as an anchor to swing the rest of the body down and land in the upright orientation. Although most of the crabs were entrained and moved downstream within the surge, a few crabs were observed to be moved to the periphery of or outside the surge and were able to quickly regain their proper orientation. This movement of crabs
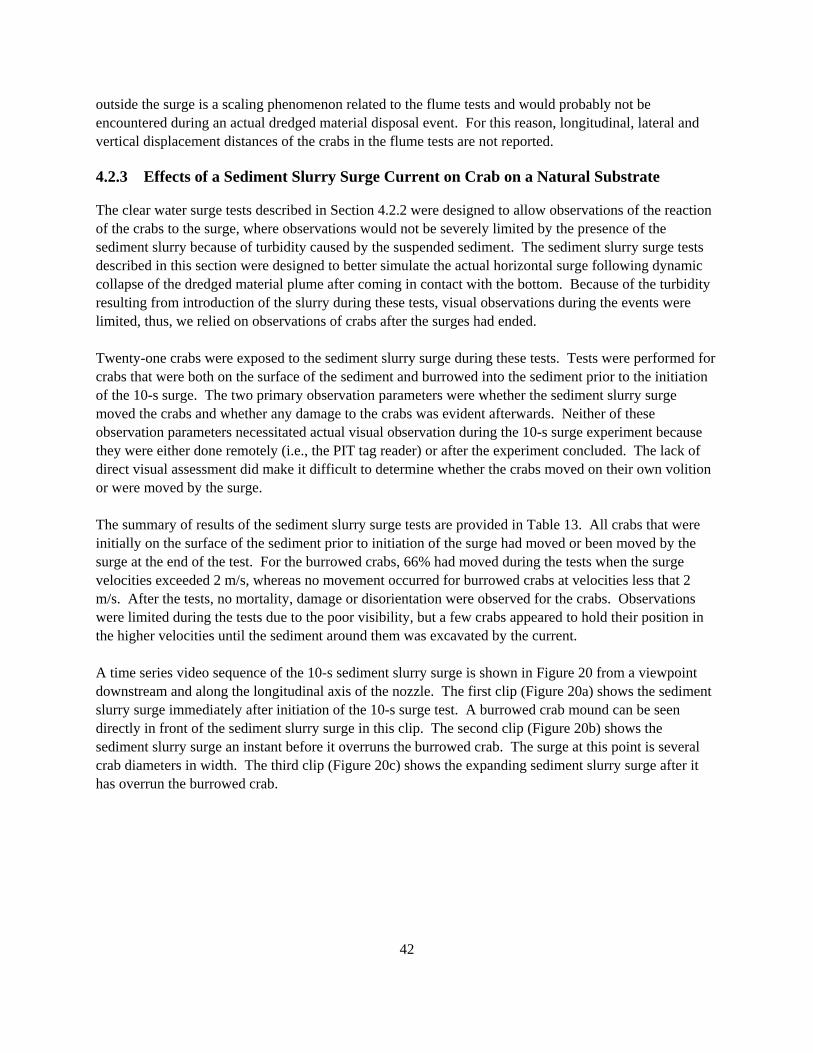
42
outside the surge is a scaling phenomenon related to the flume tests and would probably not be encountered during an actual dredged material disposal event. For this reason, longitudinal, lateral and vertical displacement distances of the crabs in the flume tests are not reported.
4.2.3 Effects of a Sediment Slurry Surge Current on Crab on a Natural Substrate
The clear water surge tests described in Section 4.2.2 were designed to allow observations of the reaction of the crabs to the surge, where observations would not be severely limited by the presence of the sediment slurry because of turbidity caused by the suspended sediment. The sediment slurry surge tests described in this section were designed to better simulate the actual horizontal surge following dynamic collapse of the dredged material plume after coming in contact with the bottom. Because of the turbidity resulting from introduction of the slurry during these tests, visual observations during the events were limited, thus, we relied on observations of crabs after the surges had ended. Twenty-one crabs were exposed to the sediment slurry surge during these tests. Tests were performed for crabs that were both on the surface of the sediment and burrowed into the sediment prior to the initiation of the 10-s surge. The two primary observation parameters were whether the sediment slurry surge moved the crabs and whether any damage to the crabs was evident afterwards. Neither of these observation parameters necessitated actual visual observation during the 10-s surge experiment because they were either done remotely (i.e., the PIT tag reader) or after the experiment concluded. The lack of direct visual assessment did make it difficult to determine whether the crabs moved on their own volition or were moved by the surge. The summary of results of the sediment slurry surge tests are provided in Table 13. All crabs that were initially on the surface of the sediment prior to initiation of the surge had moved or been moved by the surge at the end of the test. For the burrowed crabs, 66% had moved during the tests when the surge velocities exceeded 2 m/s, whereas no movement occurred for burrowed crabs at velocities less that 2 m/s. After the tests, no mortality, damage or disorientation were observed for the crabs. Observations were limited during the tests due to the poor visibility, but a few crabs appeared to hold their position in the higher velocities until the sediment around them was excavated by the current. A time series video sequence of the 10-s sediment slurry surge is shown in Figure 20 from a viewpoint downstream and along the longitudinal axis of the nozzle. The first clip (Figure 20a) shows the sediment slurry surge immediately after initiation of the 10-s surge test. A burrowed crab mound can be seen directly in front of the sediment slurry surge in this clip. The second clip (Figure 20b) shows the sediment slurry surge an instant before it overruns the burrowed crab. The surge at this point is several crab diameters in width. The third clip (Figure 20c) shows the expanding sediment slurry surge after it has overrun the burrowed crab.
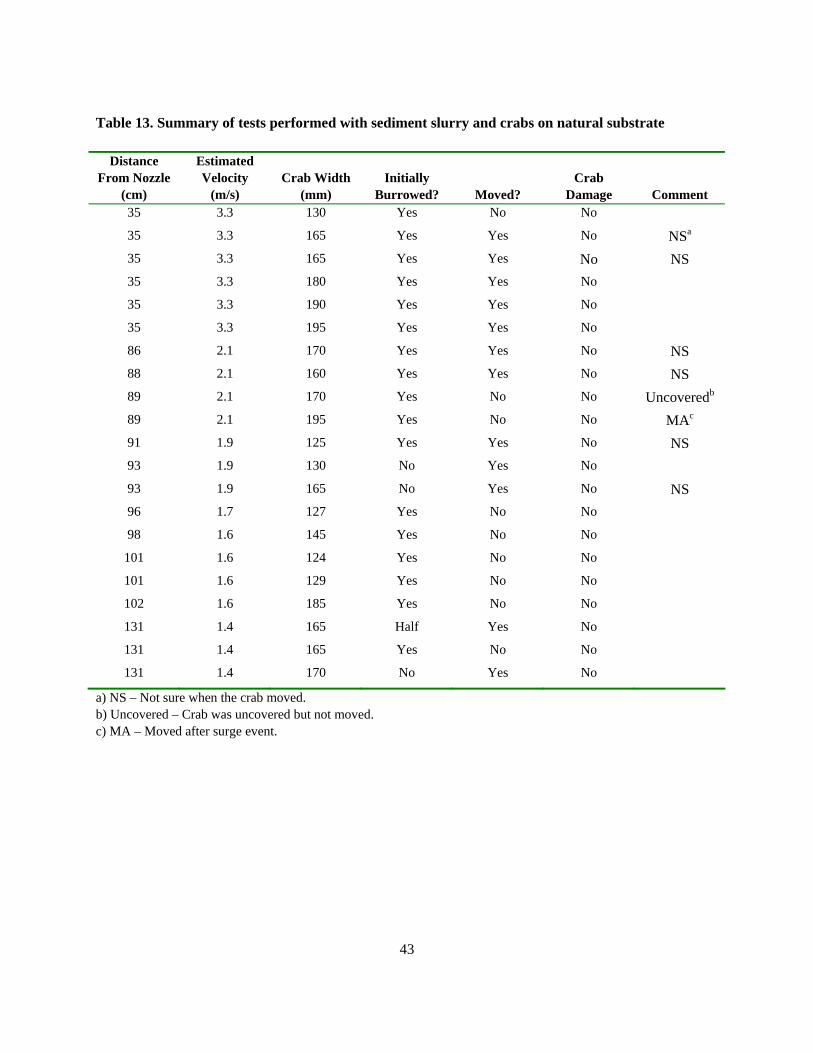
43
Table 13. Summary of tests performed with sediment slurry and crabs on natural substrate
Distance From Nozzle
(cm)
Estimated Velocity
(m/s) Crab Width
(mm) Initially
Burrowed? Moved? Crab
Damage Comment 35 3.3 130 Yes No No
35 3.3 165 Yes Yes No NSa
35 3.3 165 Yes Yes No NS 35 3.3 180 Yes Yes No 35 3.3 190 Yes Yes No
35 3.3 195 Yes Yes No
86 2.1 170 Yes Yes No NS 88 2.1 160 Yes Yes No NS 89 2.1 170 Yes No No Uncoveredb
89 2.1 195 Yes No No MAc
91 1.9 125 Yes Yes No NS 93 1.9 130 No Yes No 93 1.9 165 No Yes No NS 96 1.7 127 Yes No No 98 1.6 145 Yes No No
101 1.6 124 Yes No No 101 1.6 129 Yes No No 102 1.6 185 Yes No No 131 1.4 165 Half Yes No 131 1.4 165 Yes No No 131 1.4 170 No Yes No
a) NS – Not sure when the crab moved. b) Uncovered – Crab was uncovered but not moved. c) MA – Moved after surge event.
Figure 20. Time sequence of the approaching slurry plume in the flume (a crab is burrowed in the
center of the frame)
44
45
5.0 Discussion and Conclusions This laboratory study was designed to evaluate injury or mortality of Dungeness crabs (Cancer magister) exposed to two components of a dredged material disposal operation in the mouth of the Columbia River: 1) horizontal surge current produced during the dynamic collapse of the dredged material plume upon contact with the bottom, and 2) burial of crabs as dredged material settles on the bottom. These two factors were isolated in laboratory experiments and tested on age 2+ and age 3+ Dungeness crabs. The tests were designed to mimic the conditions modeled in Phase I of this study using the STFATE model (Pearson et al. 2006b). Two types of experiments were conducted to evaluate these potential effects: horizontal surge current tests using a flume and burial tests using sediment slurry in holding tanks, both designed to simulate specific physical events during a disposal event. The horizontal surge current experiments showed that crabs can either maintain their proper orientation on the bottom and in the water column, or quickly right themselves after being moved by a 3.2-m/s surge current. In clear water tests designed to evaluate damage to the crabs and their ability to regain proper orientation after being tumbled in the surge current, the crabs were not damaged or adversely affected. The few individuals that did land in an inverted position were able to quickly right themselves within seconds. Our clear water surge current experiments revealed behavioral mechanisms, such as leg splaying, which could minimize injuries during an actual disposal operation. Experiments using the sediment slurry, likewise, did not result in any damage or mortality to the crabs. Crabs were often moved by the surge event, especially in currents estimated to be above 2 m/s. Regardless of whether the movement was voluntary or induced by the surge current, the result was that the crabs were not injured. It appeared that burrowed crabs were better able to hold their position at higher surge current velocities (>2 m/s) than those on the surface of the sediment during the sediment slurry surge tests. In fact, crabs appeared to be secure until the sediment around them was scoured. Although care was taken to mimic the disposal operation conditions during the horizontal surge experiments, as provided by the STFATE model in Phase I, caution should be used in interpreting the results because of scaling effects that were apparent during the conduct of the surge tests in the flume. The flume experiments were able to reasonably reproduce the magnitude of the velocities and duration of the surge provided by the model (Pearson et al. 2006b). The surge velocities of 3.2 m/s produced in the flume were somewhat lower than the maximum velocities of 4 m/s provided by the model, but these maximum modeled velocities quickly dropped off exponentially with time and distance (longitudinal and lateral) from the impact point in the model. The primary scale effect in the flume was that of the magnitude or size of the sediment-laden horizontal surge front relative to the size of a crab. Although care was taken to insure that the horizontal surge front created in the flume was greater than the width of the crabs being tested, the magnitude of the disposal plume front during an actual disposal operation cannot be simulated in the laboratory. Some crabs tended to be thrown out of the surge current, either laterally to the side, or vertically up out of the surge current. Although we believe the initial forces on the crabs from the surge front in the flume are reasonable, the distances that the crabs were moved were not representative of actual conditions because of these scale effects. We therefore did not measure the distances the crabs were moved by the horizontal surge currents in the flume.

46
The crab burial experiments indicate burial resulting from a disposal event may impact MCR crab populations more than the horizontal surge currents. Regression analysis of the results of the burial tests suggest that survival from burial increases as burial depth decreases, and survival increases as crab size increases. Male crabs also had a higher survival rate than female crabs. In this study, crab survival was not significantly dependent on initial burrowed state (i.e., whether a crab was on the surface or burrowed prior to the burial event). Within the range of observations, carapace hardness (28–98 durometer units) was also unrelated to the survival of the buried crabs. These observations included both hard (i.e., intermolt) and soft shell (defined as less than 64 DU carapace hardness; Hicks and Johnson 1999), but did not include paper shell crabs. Thus, the burial tests did not test the full range of carapace hardness that would be found in the field. The survivorship curves (Figure 12) suggest that the 3+ age class of crabs (>150 mm CW) has a greater ability to survive a single 12-cm depth burial event as predicted by Pearson et al. (2006b) for typical disposal operations. For the 2+ age class, however, significant mortality occurred at this burial depth of 12 cm, with mortalities of 47% in females crabs and 20% in male crabs. While these burial depths are only expected over a relatively small percentage of the total disposal area and only in shallow water disposals (see Fig. 9 in Pearson et al. 2006b), there is the possibility of some mortality to the population. The mortalities from burial to 2+ age crabs found in this study are higher than those found in the literature. Chang and Levings (1978) reported no mortality of crabs with carapace widths of 120 – 290 mm for burial depths of 5 cm and 10 cm. They further found that for a burial depth of 20 cm, crabs did not re-establish a respiratory current pathway, and only two individuals emerged from burial within 24 h. Crabs buried for 24 h and 48 h were recovered alive, but mortality occurred for crabs buried for 120 h (although the exact mortality associated with the 120-h burial duration given above is not definitively known, there were 10 of 12 crabs that did not reach the surface within 24 h). The burial depths of 5, 10 and 20 cm used by Chang and Levings (1978) bracket those used in this study and do not specifically address the maximum target burial depth of 12 cm. Even so, the assumed survival found by Chang and Levings (1978) is higher than that for the age 2+ crabs reported here, but is not as high as that of the age 3+ crabs. In another study at Scripps Institute of Oceanography (Corps 1999), the mortality of adult hard-shelled crabs was reported at a burial depth of 21 cm where the sandy sediment was deposited over the full width of the tank. Although the text of the report for this study does not clearly state the actual observed crab mortality rate, it appears that as much as 25% of the crabs died with a burial depth of 21 cm. A mortality of 25% is lower than that found in this study for age 2+ male and female crabs, and about the same for age 3+ female crabs. Antrim and Gruendell (1998) studied the mortality in three age classes of Dungeness crabs at various burial depths. For all burial depths between 6 cm and 26 cm, the mean survival rates were 85% for age 0+, 52% for age 1+, and 50% for adult crabs. The pattern of survival by depth also differed by age class. For the age 0+ crabs, survival was greater than 75% for all burial depths. For the age 1+ crabs survival decreased to about 60% at a 12 cm burial depth, and the survival was 40% to 50% at burial depths greater than 17 cm. Survival of adult crabs decreased from 100% at 12 cm burial depth to less than 30% at burial depth of 17 cm and greater. The study done by Antrim and Gruendell (1998) differs from our study in
47
that they combined the age 2+ and 3+ size classes, whereas in this study these two size classes were tested separately. The adult survival curve from Antrim and Gruendell (1998) appears to be similar to the survival estimates of the age 3+ crabs in this study, but is higher than that estimated for the age 2+ crabs in this study. The studies by Chang and Levings (1978), Corps (1999), and Antrim and Gruendell (1998) were pioneering studies from which the experimental design of the present study was built. The present study design did differ from these previous studies in that it tried to more closely mimic actual conditions during a dredged material disposal operation as provided by the STFATE model (Pearson et al. 2006b). Much of this information was not available to these earlier studies. First, the delivery of the sand to the burial tanks in the present study was radically different. The burial simulation in the earlier studies used mostly dry sand poured into the tanks, either directly from a bucket (Chang and Levings 1978) or from a louvered container (Antrim and Gruendell 1998, Corps 1999). The present study used a sediment-water slurry which more closely represents the actual dredged material deposition process. Although more challenging to accomplish, this approach provided the most realistic introduction of the sand into the experimental tanks. The natural sand that was used in the present study also closely matched the grain size distribution of MCR sediment. Previous studies apparently used construction sands mixed to provide the desired grain size distribution. Additionally, Chang and Levings (1978) did not apparently use a natural substrate for the crabs at initiation of their tests. Another distinct feature of the present crab burial study is the size of the experimental tanks used. The present study was designed to minimize artifacts of the experimental setup on the behavior of the crabs by using larger burial tanks and using a sandy substrate. In these tests, 1 m and 2 m tanks were used, along with relatively low crab densities in the tanks. Chang and Levings (1978) simply introduced sand into 45 cm diameter pails or oval tanks (64 cm by 45 cm). The Scripps study (Corps 1999) used larger rectangular tanks that were 3 m by 0.6 m. Antrim and Gruendell (1998) used cylindrical tanks 53 cm in diameter for their studies. Antrim and Gruendell (1998) acknowledged the possibility that the small size and configuration of their experimental tanks could affect their results because freedom of movement of crabs in these small tanks was severely restricted. Additionally, unintended turbulence was developed in their tanks that could have lifted crabs, especially smaller specimens, into the water column, preventing burial. Antrim and Gruendell (1998) cited their observations of such movement into the water column to explain the unexpectedly high survival of the age 0+ crabs. The difference in results between the Scripps study (Corps 1999) and Antrim and Gruendell (1998) may be related to provision in the former for some escape behavior, in contrast to little or no opportunity for escape response provided in the latter. Another difference between the present study and earlier studies should be noted. The present study was largely completed in the fall and early winter, whereas the earlier studies were performed in the spring or summer months. The range of temperatures in the present study was large (6.9°C to 10.4°C). As a result there could have been differences in the results associated with differences in seawater temperatures. For example, Chang and Levings (1978) conducted their study in April and June with a seawater temperature of 10°C, and Antrim and Gruendell (1998) performed their study in July and September with seawater temperatures between 12°C and 14°C.
48
Neither the present or earlier crab burial studies have adequately taken into consideration the effects of the horizontal surge current on the crab’s ability to survive a burial event. The elevated mortality from burial during an actual disposal event could be reduced from that found in the present and earlier crab burial studies when the horizontal surge current is taken into account. Although during the present study it was not possible to empirically evaluate the extent of crab movement resulting from the horizontal surge current because of scaling effects of the flume, there is some ancillary evidence that the horizontal surge current can lift and move the crabs out of the lethal burial zone. It may be possible to use the STFATE modeling results in the Phase I study and findings in this Phase II study to predict how many of the susceptible crabs could be pushed out of the lethal burial zone by the horizontal surge current. For example, the Phase II results suggest that sediment will be mobilized at current velocities greater than 1.5 m/s and that burrowed crabs will be moved at velocities greater than 2 m/s. Using estimates from the “worst case” curves generated for the dredge Sugar Island (3-minute disposal duration, 45 ft depth; Figure 12 in Pearson et al. [2006b]), the horizontal surge would be greater than 2 m/s for approximately 35 m from the impact point and would not decrease to below 1.5 m/s for about 55 m from the impact point. Assuming that a crab would be carried by the surge current this entire distance, a crab at the impact site could be transported from a position where the potential burial depth would be 12 cm to a position away from the impact point where the burial depth would be reduced to 5 to 7 cm (estimated from Figure 9 in Pearson et al. 2006b). For an age 2+ female, this difference would increase the chance for survival from 70% to almost 100% (Figure 12 this report). Even if only 66% (Section 4.2.3) of the burrowed crabs were moved to this distance, the average survival of age 2+ females in the area would increase from 70% to 90%. A similar analysis for the dredge Essayons suggests crabs would not be moved as far because the surge velocities produced in the disposal event decrease to below 1.5 m/s within 20 m. Again assuming that the crabs are carried the full distance by the surge, crabs may move from a potential burial depth of 12 cm to one possibly approaching 7 cm. There are still gaps in information for predicting population-level impacts. Unfortunately, the time of year of the present study precluded the collection of smaller size classes of crabs. Therefore, little is known about the disposal impacts to Young of Year (YOY) and age 1+ crabs from this study. Antrim and Gruendell (1998) reported higher survival for these smaller size classes, but it is uncertain whether these results were due to the experimental design as discussed previously. The present study does indicate that for restrained crabs, the smaller crabs are less able to recover the respiratory pathway than are larger crabs. The observations made during the present study on the ability of the crabs to be moved by the horizontal surge current and then to recover orientation, and the observations by Antrim and Gruendell (1998) of the higher survival rates of age 0+ and age 1+ that were lifted or moved into the water column, suggest that physical transport and behavioral responses could substantially increase the survivability of smaller crabs during an actual dredged material disposal operation. Confirmation of this suggestion through further focused experiments is warranted. The adult equivalent loss modeling to be accomplished for population-level impact assessment also requires more information from the field on such topics as crab density and recolonization rates. In conclusion, the following are responses, based on the present study, to the questions posed by Pearson et al. (2006b).
• If no escape response is permitted, what is the threshold for effects from burial for each age class and molting stage?
49
When restrained and not allowed an escape response, all the adult (≥120 mm CW) crabs suffocated and died within 24 h when buried in 8 cm of dredged material. The observations clearly show that maintaining the respiratory pathway is a critical factor to surviving burial. Crabs >120 mm CW could recover the respiratory pathway when buried to 6 cm depth. Crabs of about 60 mm CW could recover the respiratory pathway when buried to 3 cm depth. These results are for intermolt and soft-shelled crabs; paper shelled crabs were not tested.
• If escape response is permitted in a realistically designed disposal simulation, to what extent do escape and other behavioral responses reduce effects from burial?
For unrestrained crabs tested in large tanks with sufficient space for escape response, survival increased substantially. Logistic regression analyses of the results for unrestrained crabs found that the probability of survival was significantly related to burial depth, CW, and gender. Carapace hardness and initial burrowing state did not significantly affect survival after burial. An unrestrained female age 2+ crab of 132 mm CW and an unrestrained female age 3+ crab, each buried to 8 cm, would be predicted to have a 93.1% and 99.8% survival probability, respectively. Thus, escape response and other adaptive behavior clearly enabled the subadult and adult crabs to achieve almost 100% survival under the same burial depth that allowed no survival at all for restrained crabs. For unrestrained age 2+ crab, predicted survival begins to decrease at burial depths greater than 10 cm, and is less than 10% at burial depths greater than 16 cm (Figure 12). For unrestrained age 3+ crab, predicted survival begins to decrease at burial depths greater than 13 cm, and is less than 10% at burial depths greater than 22 cm.
• What is the threshold for effects from mobilization and transport by surge currents?
Survival of unrestrained crabs was 100% up to and including a surge current velocity of 3.2 m/s of 10-s duration, the highest velocity that could be tested in the apparatus. Modeling by Pearson et al. (2006b) predicted maximum surge current velocities to be 3.3 m/s for the dredge Essayons and 4.1 m/s for the dredge Sugar Island when disposing their load at water depths of 45 ft.
• To what extent do escape and other behavioral responses reduce surge-current effects?
Although crabs were observed to be tumbled by surge currents, there was no observed damage to the crabs, and there was 100% survival for up to the maximum surge current tested. The behavioral observations indicate that crabs are unlikely to be buried in an inverted position. In 37 tests with surge current velocities of 3.2 m/s, crabs landed in an inverted position only twice (5%). The inverted crabs righted themselves within 2 s.
• To what extent does exposure to surge currents influence the occurrence and extent of effects from subsequent burial?
The results of the surge current tests showed no damage to the crabs, 100% survival, and the behavioral capability to recover the proper orientation after tumbling. Crabs are unlikely to be buried in an inverted position. Therefore, specific experiments to address this question are not needed. However, the surge current and the behavioral response to it may carry the crabs away from the point of impact of the disposal footprint and thereby substantially reduce their actual burial depths.
50
Pearson et al. (2006b) determined in Phase I of the dredged material disposal study that there is likely to be minimal effect from the vertical impact of the descending dredged material as it encounters the bottom. The present Phase II laboratory study shows that horizontal surge currents do not produce damage or decreased survival up to current velocities of 3.2 m/s, which are among the highest velocities predicted for typical MCR disposal operations. Furthermore, Phase II logistic regression analyses for unrestrained age 2+ crabs suggest mortalities of 47% for females and 20% for males at a maximum burial depth of 12 cm predicted for typical dredged material disposal operations. Unrestrained age 3+ crab are predicted to have mortalities less than 2% at a burial depth of 12 cm. The behavioral observations and survival results show that subadult and adult Dungeness crabs have capabilities to respond to surge currents and burial in ways that substantially reduce exposure to stress and allow high survival.
6.0 Acknowledgements We are grateful to all the people that helped make this difficult project work. J. Hinnenkamp, J. Southard, and R. Karls helped in all facets of the work. P. Fallon, J. Coley, D. Erickson, M. Sula, V. Briggs, and G. Dennis were invaluable in setting up the systems. D. Ewert provided electronic expertise for sensors and monitoring equipment. P. Jumars provided technical advice on the flume construction. M. Anderson and K. Hartman provided a helping hand whenever needed to conduct the experiments. M. Blanton provided many of the crabs used and W. Combs provided the PIT tags and reader. Lastly, S. Thomas, G. Johnson, and D. Ecker provided needed comments and editing on this complex report.
51
7.0 References Antrim, L.D., and B.D. Gruendell. 1998. Effects of Sand Accumulation on Juvenile Flatfish and Soft-shelled Dungeness Crab. PNNL-1202. Prepared by the Battelle Marine Sciences Laboratory, Sequim, Washington, for the U.S. Army Corps of Engineers, Portland District, Portland, Oregon. 22 pp. Chang, B.D., and C.D. Levings. 1978. Effects of burial on the heart cockle and the Dungeness crab. Est. Coast. Mar. Sci. 7: 409-412. Corps (U.S. Army Corps of Engineers). 1999. Integrated Feasibility Report for Channel Improvements and Environmental Impact Statement Columbia and Lower Willamette River Federal Navigation Channel. August, 1999. Published by the U.S. Army Corps of Engineers, Portland District, Oregon. Galiani, J.Z., J.W. Smith, N.C. Kraus, D.D. McGee, E.B. Hands, C.J. Mayers, H.R. Mortiz, H.P. Mortiz, M.D. Siipola, D.B. Slocum, M.R. Byrnes, F. Li, T.L. Dibble, W.H. Hollings, C.R. Lund, C.K. Sollitt, and D.R. Standley. 2003. Monitoring Dredged Material Disposal at Mouth of Columbia River, Washington/Oregon, USA. Coastal and Hydraulics Laboratory ERDC/CHL TR-03-5. Prepared for the U.S. Army Corps of Engineers, Washington, DC. Hammermeister, T. 2006. Pilot Project Survey Results for Nearshore Beneficial Use of Dredge Material at the South Jetty of the Coumbia River. Prepared for the Lower Columbia Solutions Group, Portland, Oregon, and the U.S. Army Corps of Engineers, Portland District, by SAIC, Bothell, Washington. Hicks, D., and B.A. Johnson. 1991. A Device to Measure Shell Hardness of Dungeness Crabs. Prof. Paper 001. Alaska Department of Fish and Game, Division of Commercial Fisheries, Juneau, Alaska. Hicks, D., and B.A. Johnson. 1999. A device to measure shell hardness of Dungeness crabs and trial application in the Kodiak Island, Alaska, commercial fishery. Nor. Amer. J. Fish. Man.19: 581-590. MacKay, D.C.G. 1942. The Pacific edible crab, Cancer magister. Bulletin of Fisheries Research Board of Canada LXII: 1-32. Martinez, M.M. 2001. Running in the surf: hydrodynamics of the shore crab Grapsus tenuicrustatus. J. Experimental Biology 204: 2097-2112. McGaw, I.J. 2004. Ventilatory and cardiovascular modulation associated with burying behaviour in two sympatric crab species, Cancer magister and Cancer productus. J. Experimental Marine Biology and Ecology 303: 47-63. McGaw, I.J. 2005. Burying behaviour of two sympatric crab species: Cancer magister and Cancer productus. Sci. Mar. 69(3): 375-381.
52
Miller, M.C, I.N. McCave, and P.D. Komar. 1977. Threshold of sediment motion under unidirectional currents. Sedimentology 24: 507–527. Muellenhoff, W.P., A.M. Soldate Jr., D.J. Baumgartner, M.D. Schuldt, L.R. Davis, and W.E. Frick. 1985. Initial Mixing Characteristics of Municipal Ocean Discharge. EPA/600/3-85/073b. U.S. Environmental Protection Agency, Washington, D.C. Pearson, W.H. 1987. Conclusions of the Third Meeting of the Crab Study Panel Examining Issues Related to Dungeness Crab for the Grays Harbor Navigation Improvement Project. PNL-6257. Prepared for the U.S. Army Corps of Engineers, Seattle District, by Battelle/Marine Sciences Laboratory, Sequim, Washington. Pearson, W.H., and D.L. Woodruff. 1987. Effects of Proposed Dredged Materials from Grays Harbor on Bait Odor Response in Dungeness Crab (Cancer magister). PNL-6436. Prepared for the U.S. Army Corps of Engineers, Seattle District, by Battelle/Marine Sciences Laboratory, Sequim, Washington. Published by Pacific Northwest Laboratory, Richland, Washington. Pearson, W.H., D.L. Woodruff, P. Wilkinson, J.S. Young, H.L. McCartney, and D.C. Klopfer. 1987. Data Report for the 1984-1985 Ocean Surveys to Investigate Potential Ocean Disposal Sites off Grays Harbor, Washington. PNL-6280. Prepared for the U.S. Army Corps of Engineers, Seattle District, by Battelle/Marine Sciences Laboratory, Sequim, Washington. Published by Pacific Northwest Laboratory, Richland, Washington. Pearson, W.H., G.D. Williams, and J.R. Skalski. 2002. Estimated Entrainment of Dungeness Crab During Dredging for the Columbia River Channel Improvement Project. PNNL-14129. Prepared for the U.S. Army Corps of Engineers, Portland District, by Pacific Northwest National Laboratory, Marine Sciences Laboratory, Sequim, Washington. Pearson, W.H., G.D. Williams, and J.R. Skalski. 2003. Estimated Entrainment of Dungeness Crabs During Maintenance Dredging of the Mouth of the Columbia River, Summer 2002. PNNL-14190. Prepared for the U.S. Army Corps of Engineers, Portland District, by Pacific Northwest National Laboratory, Marine Sciences Laboratory, Sequim, Washington. Pearson, W.H., G.D. Williams, and J.R. Skalski. 2005. Dungeness Crab Dredging-Entrainment Studies in the Lower Columbia River, 2002-2004: Loss Projections, Salinity Model, and Scenario Analysis. PNNL-15021. Prepared for the U.S. Army Corps of Engineers, Portland District, by Pacific Northwest National Laboratory, Marine Sciences Laboratory, Sequim, Washington. Pearson, W.H., N.P. Kohn, and J.R. Skalski. 2006a. Entrainment of Dungeness Crabs in the Desdemona Shoals Reach of the Lower Columbia River Navigation Channel. PNNL-16139. Prepared for the U.S. Army Corps of Engineers, Portland District, by Pacific Northwest National Laboratory, Marine Sciences Laboratory, Sequim, Washington.

53
Pearson, W.H., M.C. Miller, G.D. Williams, N.P. Kohn, J.R. Skalski. 2006b. Preliminary Assessment of Potential Impacts to Dungeness Crabs from Disposal of Dredged Materials from the Columbia River. PNNL-15477. Prepared for the U.S. Army Corps of Engineers, Portland District, by Pacific Northwest National Laboratory, Marine Sciences Laboratory, Sequim, Washington.
PNNL-XXXXX
Distribution
No. of Copies OFFSITE 6 K.W. Larson U. S. Army Corps of Engineers Portland District Environmental Resources CENWP-PE-E P. O. Box 2946 Portland, OR 97208-2946 1 J.R. Skalski
University of Washington Fisheries Department 1325 4th Ave., Suite 1820 Box 358218 Seattle, WA 98101-2509
1 W.H. Pearson 332 Viewcrest Avenue
Port Angeles, WA 98362
No. of Copies ONSITE 4 Pacific Northwest National Laboratory J. Vavrinec SEQUIM M.C. Miller SEQUIM N.P. Kohn SEQUIM Information Release K1-06
54