Embed Size (px)
Citation preview
Labor Market Returns for Graduates ofHispanic-Serving Institutions
Toby J. Park1 • Stella M. Flores2 • Christopher J. Ryan Jr.3
Received: 23 March 2016� Springer Science+Business Media New York 2017
Abstract Latinos have become the largest minority group in American postsecondary
education, a majority of whom attend two- or four-year Hispanic-Serving Institutions
(HSIs). However, little is known about labor market outcomes as result of attending these
institutions. Using a unique student-level administrative database in Texas, and accounting
for college selectivity, we examine whether attending an HSI influences labor market
outcomes ten years after high school graduation for Latino students in Texas. We find no
difference in the earnings of Hispanic graduates from HSIs and non-HSIs. This analysis
represents one of the first to examine the labor market outcomes for Latino students in this
sector of education accounting for critical factors that include a student’s high school and
community context.
Keywords Hispanic-serving institutions � HSIs � Wage returns � Labormarket returns
The data for this study include restricted-use administrative records from the Texas Education Agency, theTexas Higher Education Coordinating Board, and the Texas Workforce Commission. The conclusions ofthis research do not necessarily reflect the opinions or official position of the Texas Education Agency, theTexas Higher Education Coordinating Board, the Texas Workforce Commission, or the state of Texas.
& Toby J. [email protected]
Stella M. [email protected]
Christopher J. Ryan [email protected]
1 Florida State University College of Education, 1205D Stone Building, 1114 W. Call Street,Tallahassee, FL 32306-4450, USA
2 New York University Steinhardt School of Culture, Education, and Human Development, 82Washington Square East, 7th Floor, New York, NY 10003-6674, USA
3 Vanderbilt University Peabody College, 230 Appleton Place, #414, Nashville, TN 37203-5721,USA
123
Res High EducDOI 10.1007/s11162-017-9457-z
Introduction
It is a well-known fact that Latinos have become the largest minority group in the United
States (Ennis et al. 2011).1 A significant demographic shift also has occurred in the U.S.
higher education population: with more than 2.4 million postsecondary students in 2012,
Latinos have replaced Blacks as the largest minority group attending two- and four-year
institutions (Fry and Lopez 2012; Krogstad and Fry 2014). As of 2013, 58.9% of Hispanic
college students were attending two- or four-year Hispanic-Serving Institutions (HSIs), a
category of institution that is accredited, grants degrees, and whose full-time-equivalent
undergraduate enrollment is at least 25% Hispanic (Hispanic Association of Colleges and
Universities 2015; Santiago and Andrade 2010; U.S. Department of Education
2009, 2013). These institutions, which are located primarily in areas with a high Latino
demographic presence, such as the U.S. West, Southwest, and some parts of the Northeast,
began to emerge officially in greater numbers in the 1980s. However, the HSI designation
does not mean that an institution was founded specifically to promote the education of
Hispanic students (Espino and Cheslock 2008; Harmon 2012), which contrasts with the
Historically Black Colleges and Universities (HBCUs) founded in the mid-nineteenth
century. While a number of institutions today can identify as an HSI due to a demographic
tipping point (their student population becomes more than 25 percent Hispanic over time),
most HSIs that demonstrate a formal commitment to serving Latino students do so through
programming funded through federal policy specific to these institutions. This is done
through programs tied to Title III and Title V funding focused on student success initia-
tives. The most recent program through Title V known as ‘‘Developing Hispanic Serving
Institutions’’ has evolved over time, becoming more specific about funding objectives
related to serving Latino students through the reauthorization of the 1998 and 2008 higher
education acts (U.S. Department of Education 2013). HSIs nonetheless have not received
much attention in terms of policy analysis, although their increasingly being the first-
choice institution for a majority of Latino students highlights their importance in the Latino
postsecondary trajectory (Benitez and DeAro 2004; Flores and Park 2013; Laden 2004;
Nunez and Bowers 2011; Provasnik and Shafer 2004). In sum, HSIs educate a greater
number of Latino students as a proportion of the college-going population than any other
set of postsecondary institutions.
The number of Latinos enrolled in U.S. postsecondary institutions grew more than
240% from 1996 (728,000) to 2012 (2.4 M), far outpacing growth among Blacks (72%:
897,000–1.7 M) and Whites (12%: 6.2 M–7.2 M). While this unprecedented growth has
received increasing attention, so has the value of the college degree (Krogstad and Fry
2014). While the cost to attend college has risen at an alarming rate in many states across
the nation, the value of a college degree, particularly the four-year degree, has sustained its
relevance in the 21st-century U.S. economy (Carnevale et al. 2010; Perna and Finney
2014). For example, Carnevale et al. (2010) estimate that the lifetime earnings of those
with a four-year college degree will be $1.6 million higher than those with only a high
1 This study utilized the same definitional construction of the term ‘‘Hispanic’’ as is used by the 2010 U.S.Census. That is, an individual’s self-identification of Hispanic origin, regardless of race, triggers theirinclusion in this group. While we use the terms ‘‘Latino’’ and ‘‘Hispanic’’ interchangeably, Hispanic isprimarily used to be consistent with this nomenclature present in U.S. policy documentation and the federalhigher education funding program serving this population: Hispanic-Serving Institutions.
Res High Educ
123
school diploma; this amounts to more than a 191% difference in lifetime earnings between
college and high school graduates. Moreover, those with an associate’s degree or some
college are likely to earn 26% more than high school graduates, who in turn can expect to
earn 68% more than non-high school graduates.
In states where Latinos are already the majority minority group and the majority
population in some school districts, the cost of not educating this population goes beyond
the matter of individual wages. It may in fact compromise the economic welfare of those
states—and the nation (Smith 2012). As such, and given the established literature on the
returns to education, fully understanding the three points in the education pipeline most
likely to have an impact on wages—graduation from high school, enrolling in any college,
and earning a bachelor’s degree (Monks 2000)—is paramount. In this paper we explore the
third milestone, earning a bachelor’s degree, as we also focus on a set of institutions not
widely represented in the literature: Hispanic-Serving Institutions.
We begin by examining the earning power Latino students gain by getting a four-year
college degree from the schools they are most likely to attend, HSIs. Earlier studies of labor
market returns on attending college have tended to focus on college as a homogeneous
treatment, making distinctions only between such broad categories as two-year and four-
year schools (Kane and Rouse 1995). More recently, however, researchers have begun to
untangle the heterogeneous nature of college and explore whether different types of insti-
tutions have differential returns for graduates in the labor market. Studies conducted within
the last few decades have provided analytic detail by assessing the value of earning a degree
from a selective college (Black and Smith 2006; Long 2010; Monks 2000), attending a
selective flagship public university, and majoring in certain disciplines (Andrews et al.
2012, 2014; Hoekstra 2009).2 More recent exploration of the role school selectivity plays in
how college graduates fare in the labor market provides substantial contemporary results,
which confirm previous findings that attending a more selective institution yields greater
earnings (Dale and Krueger 2002; Zhang 2005). Barron’s selectivity index is one particular
measure used in this exploration. Studies using Barron’s index have consistently found that
students who graduate from more selective universities have higher earnings than graduates
of other colleges (Brewer and Ehrenberg 1996; Brewer et al. 1999; Long 2010; Monks
2000).
Another similar avenue of exploration is the returns on attending a Historically Black
College or University. Two studies to date have framed the relationship between graduating
from an HBCU and individual wages. Fryer and Greenstone (2010), who utilized three large
datasets (the National Longitudinal Survey of the High School Class of 1972, Baccalaureate
and Beyond, and College and Beyond) to examine the impact in the labor market of
graduating from an HBCU, found changes in the returns over time. In fact, from 1970 to
1990, they found a 20% decline in the relative wages of HBCU graduates. By the 1990s, this
decline had in effect become a wage penalty when compared with the market outcome for
those attending a traditionally White institution. Strayhorn’s 2008 analysis, which used
Baccalaureate and Beyond longitudinal survey data for the 1993 and 1997 cohorts,
examined labor market outcomes for African Americans who graduated from HBCUs. The
findings from this study revealed a moderate negative statistically significant relationship
2 Reducing a university’s decision to admit or deny students to both observable—standardized test scoresand GPA—and unobservable variables, Dale and Krueger (2002) intuitively define selective institutions asthose with higher thresholds necessary for admissions acceptance. Thus, the present study operationalized‘‘selective flagship public universities’’ as the premier institutions of their respective university systems,such as the University of Texas at Austin and Texas A&M University at College Station, which corre-spondingly have the lowest, and therefore most selective, acceptance rates in the state of Texas.
Res High Educ
123
between attending an HBCU and post-baccalaureate earnings. While these studies used data
from several years ago and do not represent the definitive answer on the relationship
between attending an HBCU and wages, they are helpful for future studies seeking to better
understand the earning power of a college degree from other Minority-Serving Institutions
(MSIs), which are postsecondary institutions that enroll a significant percentage of under-
graduate minority students or that serve minority students through programs created by
specific congressional legislation (U. S. Department of Education, n.d.).
Little to no current research exists on the relationship between Latinos who attend a
particular type of higher education institution and their individual wages. For example, do
wages differ for Latinos based on the type of four-year institution where they earn a college
degree? Previous work that examined the impact attending a selective public flagship
university in Texas had on wages found that White students were more likely to benefit
from attending this type of institution than their Black and Latino peers (Andrews et al.
2012, 2014). Meanwhile, other studies have demonstrated that Latinos are not likely to
attend a selective four-year institution in Texas and, moreover, are at least 3.5 times more
likely to attend a two- or four-year HSI than a four-year non-HSI (Flores and Park 2013).
While foundational to the research on wage returns to attending higher education, prior
work has often utilized older datasets in which Latinos comprised a very small sample of
the population and were assessed by comparing Whites to non-Whites, rather than by
comparing Latinos who attend different types of institutions within the four-year sector
(Black and Smith 2006; Long 2010; Monks 2000).
We set out to expand on these studies by constructing an analytic model using more
recent data from a comprehensive student-level dataset from Texas. Our goal was to
understand the relationship for Hispanic students between graduating from an HSI and
their labor market earnings in a post-2000 economy. We specifically asked:
1. Is there a difference in Hispanic students’ characteristics between HSI and non-HSI
graduates in Texas?
2. What is the relationship between attending an HSI and later earnings for Hispanic
college graduates in Texas?
To answer our questions, we first discuss the theoretical foundations that guided our
investigation and previous research exploring labor market returns to higher education.
Second, we provide more detailed information about the demographic and educational
landscape of Texas, our focal state. We next present our research design, including a
description of the student-level state dataset we used for our analysis, its limitations, and
our analytic approach. Fourth, we present our findings, including a descriptive portrait of
the data and the results from our econometric model. We end with a discussion of our
findings, including recommendations for future research and a general conclusion, which
highlight the challenges and the importance of access to data, as well as continued research
on HSIs and on MSIs more generally.
While previous authors have provided relevant work regarding the relationship between
institution type, college selectivity, and wages, much of this work has focused on cohorts
graduating high school in the late 1970s with outcomes into the 1990s, with some
exceptions previously noted (Black and Smith 2006; Long 2010; Monks 2000). We thus
contribute to the literature in two unique ways.
Postsecondary education in the United States is becoming increasingly diverse, both in
terms of the students enrolled and the types of institutions serving them, yet the impact
these institutions have on their graduates’ long-term outcomes, in particular on their wages,
is under-examined, despite the many new data sources now available. We seek to remedy
Res High Educ
123
that deficiency. Furthermore, while the research suggests that the greatest increase in the
number of students attending college is among minority students, many of whom enroll in
MSIs (Conrad and Gasman 2015; Flores and Park 2013), little is known about how the
labor market outcomes of minority students who attend both HBCUs and HSIs compare to
those who attend similarly ranked but less racially diverse institutions. This paper seeks to
fill that void by examining the earnings of HSI graduates in a post-2000 economy.
Previous Literature and Conceptual Framework
From the mid-1990s to 2004, HSIs grew from being 2 to 9% of the nation’s total post-
secondary institutions (Li 2007). There were 409 HSIs in the United States in 2014, a
116% increase from 189 in 1995 (Excelencia in Education 2015a). Of these 409 HSIs, 81
were four-year public universities, 190 were two-year public colleges, 125 were four-year
private not-for-profit institutions, and 13 were two-year private not-for-profit institutions
(Excelencia in Education 2015b). HSIs are typically located in the western and the
southwestern United States, with the greatest concentration in Florida, Texas, and Cali-
fornia (Gasman et al. 2008; Harmon 2012). Because of classification requirements, the HSI
designation does not mean these institutions were founded specifically to promote the
education and growth of Hispanic students (Harmon 2012). Nevertheless, HSIs serve 42%
of all Hispanic students, a figure that grows every year. The students attending HSIs are
likely to be first-generation college students from low-income backgrounds and to have a
lower level of academic preparation than those attending non-MSIs (Flores and Park 2013;
Gasman et al. 2008; Harmon 2012; Institute for Higher Education Policy 2004; Li 2007).
For instance, approximately 44% of Hispanic students attending HSIs in 2003 were low-
income, versus 30% of those attending non-MSIs (Li 2007).
While a handful of studies have empirically examined the economic returns for
attending an HBCU (e.g., Fryer and Greenstone 2010), much less is known about the
returns on attending an HSI. Indeed, only a few reports are available on the economic
consequences of attending an HSI, and we have found none that employs an econometric
model to examine the individual return on investment of attending an HSI. What is cur-
rently known about HSIs is largely descriptive. For instance, a report commissioned by the
Center for Urban Education at the University of Southern California indicates that His-
panic students in California are disproportionately enrolled in community colleges, thus the
majority of the state’s HSIs are two-year institutions (Malcom-Piquex et al. 2013).
However, two concurrent studies—Flores and Park (2015) and Rodrıguez and Calderon
Galdeano (2015)—employed a more rigorous approach to compare HSIs to non-HSIs.
Both studies used propensity score matching to make more reasonable comparisons
between both the students attending HSIs versus non-HSIs, and the institutions themselves.
These studies suggest three principle findings. First, HSIs and non-HSIs have different
student body characteristics, institutional resources, and finance structures; for instance,
HSIs tend to enroll more students than non-HSIs. Second, propensity score matching on
institutional characteristics yields mixed results; for example, some HSIs (specifically two-
year not-for-profit institutions) did not have non-HSI matches based on institutional
characters such as sector. However, when matched at the student level, HSIs and non-HSIs
have comparable outcomes (Flores and Park 2015; Rodrıguez and Calderon Galdeano
2015). This result provides counter evidence to previous notions that Hispanic students at
HSIs underperform, at least in terms of the likelihood of graduating, when compared with
Res High Educ
123
Hispanic students attending non-HSI two- and four-year colleges and universities (Dayton
et al. 2004; Gastic and Nieto 2010; Laden 2004; Nunez et al. 2011; Nunez et al. 2016;
Rodrıguez and Calderon Galdeano 2014, 2015; Stearns et al. 2002). Still, little is known
about the economic impact of attending an MSI, and an HSI more specifically (Bridges
et al. 2005; Laden 2004; Rodrıguez and Calderon Galdeano 2015).
In fact, much of the research on MSIs to date has dealt with the economic impact the
institutions themselves have on outcomes other than student success. For instance, an
Institute for Education Sciences (IES) report authored by Humphreys and Korb (2006)
used data from the National Center for Education Statistics and U.S. Bureau of Labor
Statistics to analyze the collective short-term economic impact HBCUs have on their
regional economies. They concluded that the economic impact HBCUs have on their host
communities relates to ‘‘output, value-added, labor income, and employment.’’ Employing
a similar method of analysis, the American Indian Higher Education Consortium (AIHEC,
2000) produced a report that described the economic development efforts of the Tribal
Colleges and Universities. The report argued that, despite the lack of regional and national
data to confirm their effect, these colleges do in fact affect local economic development.
Importantly, neither the IES nor the AIHEC study focused on individual wage returns to
graduates of these institutions. They instead used the institution as the primary unit of
analysis, and linked its expenditures to returns to the economies of the host nation’s
network of colleges or universities that were serving their respective minority populations.
Finally, applying an investigatory focus that differed from the IES and AIHEC studies, the
National Commission on Asian American and Pacific Islander Research in Education
(NCAAPIRE 2014) issued a brief descriptive report that analyzed three-year-longitudinal
institutional data from Asian American, Native American, and Pacific Islander Serving
Institutions (AANAPISIs). This report describes the impact federally funded campus
programs have on persistence, degree attainment, and transfer to four-year institutions for
the low-income Asian American and Pacific Islander students enrolled at these schools.
This report centers on student academic returns and thus does not consider individual
economic returns in the short or long term. To date we know of no other major study on the
economic impact or on the individual return on investment of attending an HSI.
Conceptual Framework
We draw our framework using an economic lens that is informed first by human capital
theory, and by social and cultural capital theories. From an economic perspective, a
number of empirical studies confirm that college graduates earn more than high school
graduates (Card 1999; Pascarella and Terenzini 1991, 2005; Smart 1986). Indeed, Goldin
and Katz (2007) have found that the correlation between education and labor market
outcomes continues to increase in the United States. Although some question the extent to
which education is the causal mechanism for higher earnings, many have demonstrated
that, net of other factors, education has a strong impact on labor market outcomes (Hout
2012). Previous research demonstrates, for example, that students from socially or eco-
nomically disadvantaged backgrounds tend to show the greatest gains from getting an
advanced education—a theory known as negative selection (Brand and Xie 2010; Hout
2012; Monks 2000). In other words, negative selection suggests that, since low-income or
minority students are likely to select out of higher education altogether, thus negatively
impacting their earning potential, these students would have the most to gain by earning an
advanced credential.
Res High Educ
123
Human capital theory is one body of literature that guides our investigation of the
relationship between education and earnings. It suggests that the more education and skills
an individual acquires, the greater their earnings in the labor market (Becker
1964, 1967, 1993). As such, we controlled for measures of academic ability, major area of
study, and years of work experience, all known to have a discernable relationship to labor
market earnings (specific details on these measures appear later in this manuscript; see also
Mincer 1974; Pascarella and Terenzini 2005). Research has demonstrated that an important
extension of human capital theory is to condition earning functions on the location of
individuals, as local prices and economic health also influence wages (Black et al. 2009).
Social and cultural capital theories add to our conceptual framework, as they provide
additional insights into the factors that influence labor market outcomes. These theories
suggest that information available via formal and informal networks, as well as normative
structures put in place by local context, may influence earnings (Bourdieu and Passeron 1977;
McDonough 1997; Perna et al. 2008). Where a student attends college is thus critical to how
their degree is rewarded in the labor market. For example, factors such as secondary school
context, academic preparation, and the college attended play a role in predicting the odds of
college enrollment, as do the local economic and state policy contexts (Perna et al. 2008). As
such, we include proxies for social and cultural capital through measures of community
context and economic capacity, which several previous studies have done (Nunez and
Bowers 2011; Perna 1998, 2004; Perna et al. 2008; Strayhorn 2008; Zhang 2005).
Using this framework, and given that Hispanic postsecondary students are at least 1.5
times more likely to attend two-year than four-year colleges (Flores and Park 2013), we
argue that, in keeping with the negative selection theory, these students stand to benefit
greatly from postsecondary education (Hout 2012). Furthermore, evidence suggests that
Hispanic students graduate from HSIs at a rate comparable to those who attend non-HSIs,
after controlling for similar measures of capital, as defined above (Flores and Park 2015).
Therefore, we evaluate how the wages of HSI graduates compare to those of non-HSI
graduates, an area that has received little scholarly attention to date, due in part to policy
interest, data access, and availability.
The Texas Context
Given its sizeable number of Hispanic students and HSIs, we used data from Texas to
conduct our analyses. In doing so, we acknowledge that the Texas economy—and,
specifically, variations across it—have a particular relationship to labor market outcomes.
In the following sections, we provide more information about both of these.
Texas Hispanic Population and HSIs
The Hispanic population in Texas is projected to grow by 31% from 2010 to 2020, which
will far outpace the White population’s projected growth of 2% (Fletcher and Webster
2010). As the HSI designation is determined by the percentage of Hispanic students
enrolled, the number of HSIs in Texas is likely to increase over the next decade. Therefore,
studying the return on investment for HSIs as compared to non-HSIs is critical to ensuring
that national policy goals, and that of some grant-disbursing organizations (e.g., the
Lumina Foundation), of increasing attainment are met (Lumina Foundation, n.d.).
Res High Educ
123
In 2004, 64 HSIs in Texas (including for-profit institutions) were educating 23% of the
Hispanic students attending U.S. postsecondary institutions. Texas has the second largest
number of HSIs, after California, the majority of them two-year schools (Li 2007). The
racial/ethnic breakdown of students attending the institutions that met the 25% Hispanic
student enrollment required to be eligible for HSI designation in 2008 was 55% Hispanic,
9% African American, 27% White, and 9% Asian American.
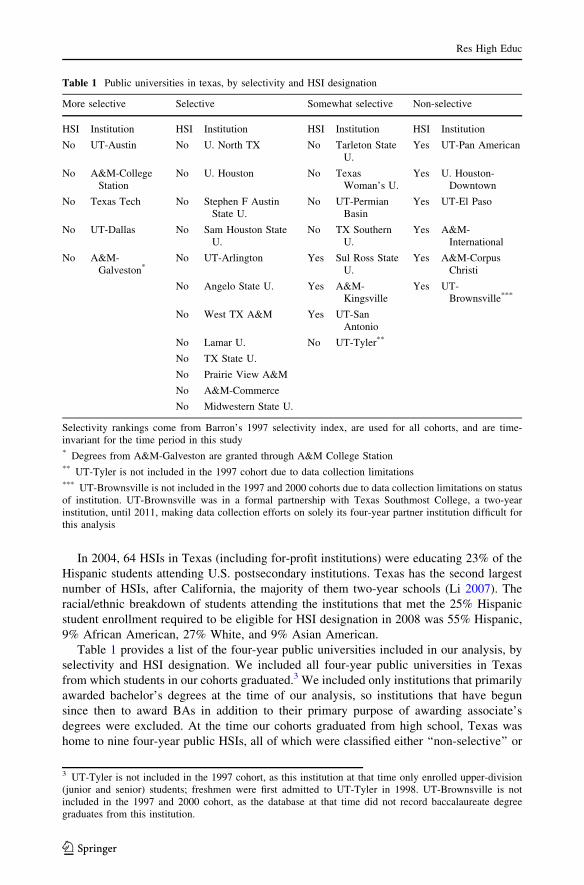
Table 1 provides a list of the four-year public universities included in our analysis, by
selectivity and HSI designation. We included all four-year public universities in Texas
from which students in our cohorts graduated.3 We included only institutions that primarily
awarded bachelor’s degrees at the time of our analysis, so institutions that have begun
since then to award BAs in addition to their primary purpose of awarding associate’s
degrees were excluded. At the time our cohorts graduated from high school, Texas was
home to nine four-year public HSIs, all of which were classified either ‘‘non-selective’’ or
Table 1 Public universities in texas, by selectivity and HSI designation
More selective Selective Somewhat selective Non-selective
HSI Institution HSI Institution HSI Institution HSI Institution
No UT-Austin No U. North TX No Tarleton StateU.
Yes UT-Pan American
No A&M-CollegeStation
No U. Houston No TexasWoman’s U.
Yes U. Houston-Downtown
No Texas Tech No Stephen F AustinState U.
No UT-PermianBasin
Yes UT-El Paso
No UT-Dallas No Sam Houston StateU.
No TX SouthernU.
Yes A&M-International
No A&M-Galveston*
No UT-Arlington Yes Sul Ross StateU.
Yes A&M-CorpusChristi
No Angelo State U. Yes A&M-Kingsville
Yes UT-Brownsville***
No West TX A&M Yes UT-SanAntonio
No Lamar U. No UT-Tyler**
No TX State U.
No Prairie View A&M
No A&M-Commerce
No Midwestern State U.
Selectivity rankings come from Barron’s 1997 selectivity index, are used for all cohorts, and are time-invariant for the time period in this study* Degrees from A&M-Galveston are granted through A&M College Station** UT-Tyler is not included in the 1997 cohort due to data collection limitations*** UT-Brownsville is not included in the 1997 and 2000 cohorts due to data collection limitations on statusof institution. UT-Brownsville was in a formal partnership with Texas Southmost College, a two-yearinstitution, until 2011, making data collection efforts on solely its four-year partner institution difficult forthis analysis
3 UT-Tyler is not included in the 1997 cohort, as this institution at that time only enrolled upper-division(junior and senior) students; freshmen were first admitted to UT-Tyler in 1998. UT-Brownsville is notincluded in the 1997 and 2000 cohort, as the database at that time did not record baccalaureate degreegraduates from this institution.
Res High Educ
123
‘‘somewhat selective.’’4 All those classified ‘‘more selective’’ or ‘‘selective’’ were non-
HSIs, including the state’s two major flagship universities, The University of Texas at
Austin and Texas A&M University in College Station.5 As noted, Hispanic students in
Texas experience labor market gains from attending a state flagship university, yet these
‘‘more selective’’ institutions are the schools Hispanic students in Texas are the least likely
to attend (Andrews et al. 2012, 2014; Flores and Park 2013). Therefore, to provide a more
accurate and fair comparison of earnings for HSI and non-HSI graduates, we control for
selectivity in our full models, which we discuss in more detail in the research design
section.
Texas Economic Regions
Texas state agencies classify the regional economies into: (1) twelve economic regions, the
classification used by the Texas Comptroller’s Office6; and (2) workforce development
areas, the classification used by the Texas Market and Career Information program of the
Texas Workforce Commission. Economic regions often are synonymous with or comprised
of multiple workforce development areas. The HSIs used in our analysis are located in the
following economic regions: Alamo (University of Texas at San Antonio); Coastal Bend
(Texas A&M University-Corpus Christi and Texas A&M University-Kingsville); Gulf
Coast (University of Houston-Downtown); South Texas Border (Texas A&M International
University, University of Texas Pan-American, and University of Texas at Brownsville);
and Upper Rio Grande (Sul Ross State University, and University of Texas at El Paso).
With the exception of the Gulf Coast economic region, which encompasses Houston, the
state’s largest city, these regional economic areas tend to support service industry jobs
rather than professional jobs and to have weekly wages below the state average. The top
three industries in these regions by number of employees are (1) trade, transportation, and
utilities; (2) education and health services; and (3) travel and leisure. While unemployment
rates vary among regions and are occasionally above state averages, the average weekly
wages in these regions are well below the state average (Texas Workforce Commission
2015). Thus, it is likely that regional differences across economic regions will also con-
tribute to labor market outcomes. We account for these differences using economic region
fixed effects, as will be discussed in more detail in our research design.
Research Design
Our research design is divided into two main sections, one that describes the data sources
used for this paper, and one that describes the analytic approach we used to answer our
research questions. The description of the data sources includes a section on how we
defined post-graduation earnings, our inclusion criteria, and some limitations of the data.
4 UT-Permian Basin is not flagged as an HSI as it did not meet the 25% threshold in 1997. Furthermore, wedo not include Brazosport College, Midland College, or South Texas College as HSIs; although theseinstitutions meet the 25% threshold, they primarily award associate degrees.5 Selectivity rankings come from Barron’s 1997 index and are time-invariant in cohort analyses.6 For a map of the Texas economic regions, see https://texaspolitics.utexas.edu/archive/html/pec/features/0302_02/regmap.html.
Res High Educ
123
Data Sources
Data for this paper came from the Education Research Center housed at the University of
Texas at Dallas, which manages student-level data from the Texas Education Agency, the
Texas Higher Education Coordinating Board, and the Texas Workforce Commission.
Using a de-identified student indicator, we were able to link these data together and to
include information on students from high school through college and on into the
workforce.
Our independent variable of interest—whether the school a student graduated from was
an HSI—was defined using the federal HSI designation, which includes any higher edu-
cation institution that is accredited, grants degrees, and whose full-time-equivalent
undergraduate enrollment is at least 25% Hispanic (Santiago and Andrade 2010; U.S.
Department of Education 2009, 2013). We also acknowledged recent work that has begun
to examine the heterogeneity within HSIs and to properly question whether the HSI
enrollment criteria of 25% or more accurately represents the variation within the HSI
institutional community. Generally, federal HSI designation meets three identity criteria:
(1) the institution is located in a highly populated Hispanic area and thus is likely to qualify
demographically to enroll a significant Hispanic student population; (2) the institution has
a stated ‘‘mission to serve’’ Hispanic students; and (3) the institution has executed its
mission to serve by formally applying for federal HSI designation (Nunez and Bowers
2011; Nunez et al. 2011; Nunez et al. 2016). The institutions in our sample meet at least
two of these three criteria. For example, most of the institutions in our sample have
formally received federal funding from the DHSI program, have an explicit mission to
serve Latino students, or has recently met the 25% full-time Hispanic enrollment criteria
through demographic changes regarding student enrollment in an area. We did not require
all institutions to meet all three criteria as the federal government does not provide
comprehensive yearly data on all DHSI applicants and recipients in public format.
To isolate the relationship more clearly between graduating from an HSI and labor
market earnings, we controlled for a number of factors also plausibly related to both
graduating from an HSI and eventual earnings:
1. Student background characteristics [S] sex (coded as 1 for male) and limited English
proficiency status. English learner status is coded as 1 for a student having been
designated by their K-12 school district at the time of high school graduation. We note
that the English learner designation in 12th grade is distinct from being so identified in
earlier grades;7
2. High school academic preparation [ACAD] taking an Advanced Placement or
International Baccalaureate course (coded as 1 for taken), taking a trigonometry course
(coded as 1 for taken), state mathematics exam score (a linear measure), and enrolling
at a college while still in high school (coded as 1 for students who dual enrolled);
3. Community context [COMM] high school pupil-teacher ratio (a simple ratio), high
school enrollment (logged), high school minority percentage (a percentage of Hispanic
and Black students), high school per-pupil expenditures (logged), urbanicity (as
defined by the U.S. Census), county unemployment rate (a percentage), and a binary
indicator of whether the student’s high school was within 25 miles of a postsecondary
institution;
7 For a more detailed description of the identification of English learners in Texas at the point of classi-fication, see Flores et al. (2012).
Res High Educ
123
4. Economic capacity [ECON] a binary indicator for free or reduced-price lunch status
(FRL) in high school (a measure of economic disadvantage) and a binary indicator for
whether the student worked while still in high school;8
5. Years of experience [EXPER] defined as the number of calendar years following
graduation from high school in which an individual earned at least $100 in at least one
quarter of the year;
6. Major area [MAJ] included in the model as fixed effects, defined by the two-digit
Classification of Instructional Programs for the program from which an individual
graduated (all graduates regardless of major area are included in the analysis); and
7. Job location [LOC] included in the model as fixed effects for state of Texas economic
regions.
Defining Earnings
For our dependent variable—labor market return as represented by wages—data were
available from the Texas Workforce Commission, they were reported quarterly, and there
were separate records for individuals reporting income from more than one source. First we
determined the total earnings for individuals reporting more than one income source in a
given quarter to achieve a quarterly earnings figure. Then we defined annual earnings as
the total earnings reported in a calendar year (four-quarter) cycle, beginning in January ten
years after high school graduation. Thus, earnings for the 1997 cohort came from 2007,
earnings for the 2000 cohort came from 2010, and earnings for the 2002 cohort came from
2012. We selected this timeframe based on work by Mincer (1974), who showed that the
return to schooling could be underestimated if measured before enough time had passed
since graduation. Mincer and others have suggested specifically that using earnings data
from an individual’s early twenties can be problematic, as the return to a postsecondary
education may not yet have been realized in the labor market (Andrews et al. 2012, 2014;
Hoekstra 2009; Mincer 1974). As we investigated each cohort separately and were inter-
ested in the difference in earnings between HSI and non-HSI graduates, we did not adjust
wage figures for inflation in our models; however, we do present constant, CPI-adjusted
2002 dollars in our descriptive portraits. Finally, due to the distribution of the earnings
data, we used logged wages in our analytic model.
Sample Inclusion Criteria
Given the limitations associated with merging three independent data sources, we included
three cohorts of Hispanic students who graduated from public high schools in Texas in the
spring of 1997, 2000, and 2002, and analyzed each cohort separately. Each year represents
a cohort that enrolled in college prior to a particular policy change in Texas higher
education, and that meets the required six-year graduation rate for the last year of data
available to us at the time of our analysis. For example, 1997 is the year before the Texas
Top Ten Percent Plan was fully implemented; 2000 is the year preceding implementation
of the in-state resident tuition policy, House Bill 1403, and a new influx of state financial
8 Unfortunately, our data do not include financial aid information for respondents so we are not able tomeasure issues of affordability. The analysis focuses instead on the level of economic disadvantage.
Res High Educ
123
aid; and, finally, 2002 is the year before Texas colleges and universities deregulated
tuition, which made Texas tuition significantly higher than in other states (Flores and
Shepherd 2014). Thus, we used these cohorts as a robustness check to determine whether
our findings were consistent across multiple cohorts that corresponded with significant
shifts in Texas higher education policy. To be included in the cohorts, individuals must
have (1) enrolled in a public four-year university in Texas in the fall immediately fol-
lowing high school graduation (transfer students were not included in this analysis); (2)
completed a college degree within six years at the same institution they started at; (3) had
no missing data on any of the covariates used in the analysis; and (4) showed earnings of at
least $100 in all four quarters in the calendar year (four-quarter) cycle beginning in January
ten years after high school graduation. Unlike other studies, we did not restrict our sample
to males; however, we followed conventions similar to those used by Andrews et al.
(2012, 2014) and Hoekstra (2009), who also used similar data.
Data Limitations
These data are subject to limitations in terms of the availability of a more comprehensive
set of variables that may be available in other datasets, such as parental education and
income, and generational status in the U.S. We note, however, that our measures for
student demographic characteristics and pre-college preparation and economic status are
proxies for these measures, a strategy employed by previous work in economics (Black and
Smith 2006). The data also do not contain information on students who attended private
schools or on the earnings of individuals working outside of Texas. However, we
emphasize the opportunity made possible by the Texas dataset that allowed us to (1) access
wage records not available nationally, (2) provide a longitudinal perspective on multiple
cohorts across various economic periods in the U.S. and Texas, and (3) link student
characteristics and academic preparation as well as high school, postsecondary, and
community contexts to wage records in ways not possible with other datasets. Thus, while
no dataset is perfect, we argue that it is worth investigating the individual-level returns to
wages that result from attending HSIs, especially since they have not previously been
evaluated in this manner.
Analytic Approach
To answer the first research question, we compiled a detailed descriptive portrait that com-
pares Hispanic college graduates who attended HSIs to those who attended non-HSIs, with a
focus on labor market earnings. In so doing, we examined the earnings data, the character-
istics of graduates, and where these individuals were working. We conducted this investi-
gation using a series of descriptive tables that will be discussed in the following section.
Hispanic student earnings ten years after college enrollment are a function of demo-
graphics, pre-college academic preparation, community context, economic context, years
of experience, major area, physical location, and whether or not the student attend an HSI,
which is formally modeled as:
log earningsð Þ ¼ a þ b HSIð Þ þ h Sð Þ þ d ACADð Þ þ n COMMð Þ þ k ECONð Þþ pðEXPERÞ þMAJ þ LOC þ e ð1Þ
Res High Educ
123
Under this specification, b captures the net relationship between graduating from an HSI
and earnings, controlling for vectors S, ACAD, COMM, ECON, and EXPER, as identified
above, as well as a set of fixed effects (included as dummy variables) for MAJ and LOC; eis an individual specific error term. By including the MAJ and LOC fixed effects, we
account for the fact that students with different college majors and the economic regions in
which students are working are likely related to earnings. Earnings are logged due to their
distribution and in accordance with previous literature (e.g., Cellini and Chaudhary 2012;
Dagdar and Weiss 2012).
As previous research has indicated that attending a more selective, better-resourced
institution has a positive impact on earnings, we performed an additional iteration of the
model by including indicators for Barron’s selectivity index (a single indicator that equals
1 for the more selective and somewhat selective institutions and 0 otherwise), the per-
centage of tenured faculty members at the institution, the faculty-to-student ratio, the
number of full-time-equivalent students (logged), and the number of state appropriations
for students (logged). We did this to provide a more reasonable comparison between the
outcomes for those graduating from HSIs and non-HSIs, as there currently are no HSIs in
the top Barron categories. In essence, we controlled for selectivity and institutional
capacity, thus allowing for a more precise estimate of any effect of attending an HSI on
labor market outcomes for Hispanic students.
This approach builds on earlier studies that investigated the impact postsecondary edu-
cation has on labor market oucomes (Andrews et al. 2012, 2014; Hoekstra 2009; Strayhorn
2008). As noted by Kaymak (2009), however, without proper statistical controls and care-
fully chosen comparison groups, it is difficult to identify the relationship between education
and labor market outcomes, due to the spurious relationship between academic ability,
college selectivity, and post-graduation earnings. As such, we were careful to construct our
model with a number of controls designed to capture human and social capital factors, and
then restricted our sample in a manner that provided a more accurate comparison between
institutions. We now offer a discussion of the results gleaned from these approaches.
Results
We begin with a descriptive portrait of Hispanic students who have graduated from HSIs
and non-HSIs, and their average post-graduation earnings, as motivation for the results
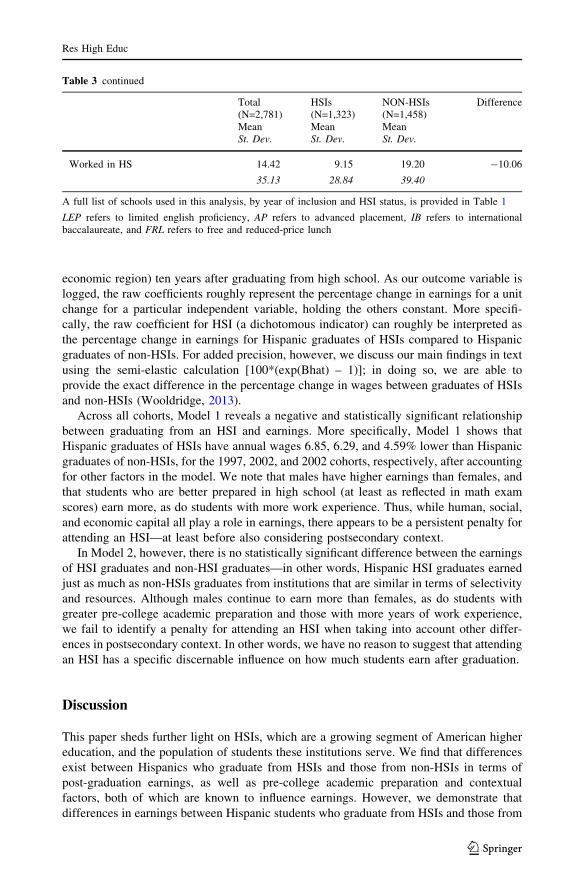
from our analytic model. Tables 2, 3, and 4 provide key descriptive statistics, such as mean
and standard deviation or the primary variables of the analysis, organized by the 1997
(N = 2,106), 2000 (N = 2,781), and 2002 (N = 3,196) cohort years. We present them in
aggregated totals by year, and also broken out by institution type (i.e., HSI or non-HSI); the
far-right column lists the difference between the types of institutions. Three main themes
emerge from this table, which we discuss below.
First, it is worth noting that, while the overall samples remain relatively consistent in
terms of gender breakdown, with fewer males than females, there is a gender shift between
HSIs and non-HSIs. More specifically, approximately 40% of each cohort is male: 39.65%
in 1997, 39.23% in 2000, and 40.05% in 2002. However, the proportion of Hispanic male
graduates is greater at HSIs (39.8%) than at non-HSIs (37.62%) only in the 1997 cohort. In
2000 and 2002, total HSI graduates (N = 1,323 and N = 1,636) and non-HSI graduates
(N = 1,458, and N = 1,560) included 3.75 and 2.41% more males than females, respec-
tively. As for English learner status, the percentage of students classified as limited English
Res High Educ
123
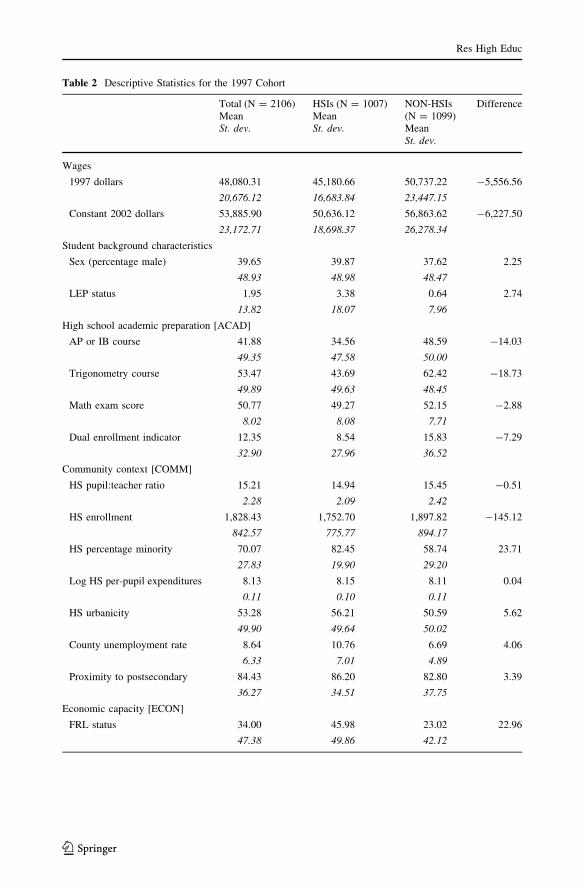
Table 2 Descriptive Statistics for the 1997 Cohort
Total (N = 2106)MeanSt. dev.
HSIs (N = 1007)MeanSt. dev.
NON-HSIs(N = 1099)MeanSt. dev.
Difference
Wages
1997 dollars 48,080.31 45,180.66 50,737.22 -5,556.56
20,676.12 16,683.84 23,447.15
Constant 2002 dollars 53,885.90 50,636.12 56,863.62 -6,227.50
23,172.71 18,698.37 26,278.34
Student background characteristics
Sex (percentage male) 39.65 39.87 37.62 2.25
48.93 48.98 48.47
LEP status 1.95 3.38 0.64 2.74
13.82 18.07 7.96
High school academic preparation [ACAD]
AP or IB course 41.88 34.56 48.59 -14.03
49.35 47.58 50.00
Trigonometry course 53.47 43.69 62.42 -18.73
49.89 49.63 48.45
Math exam score 50.77 49.27 52.15 -2.88
8.02 8.08 7.71
Dual enrollment indicator 12.35 8.54 15.83 -7.29
32.90 27.96 36.52
Community context [COMM]
HS pupil:teacher ratio 15.21 14.94 15.45 -0.51
2.28 2.09 2.42
HS enrollment 1,828.43 1,752.70 1,897.82 -145.12
842.57 775.77 894.17
HS percentage minority 70.07 82.45 58.74 23.71
27.83 19.90 29.20
Log HS per-pupil expenditures 8.13 8.15 8.11 0.04
0.11 0.10 0.11
HS urbanicity 53.28 56.21 50.59 5.62
49.90 49.64 50.02
County unemployment rate 8.64 10.76 6.69 4.06
6.33 7.01 4.89
Proximity to postsecondary 84.43 86.20 82.80 3.39
36.27 34.51 37.75
Economic capacity [ECON]
FRL status 34.00 45.98 23.02 22.96
47.38 49.86 42.12
Res High Educ
123
proficient dropped across all cohorts and across HSI designation, which signals a poten-
tially more selective cohort over time. The data show that the percentage of students
classified as limited English proficient dropped from 3.38% in 1997 to 1.50% in 2000, and
to 0.61% in 2002 at HSIs, and at non-HSIs it dropped from 0.64% in 1997 to 0.48% in
2000, and to 0.38% in 2002.
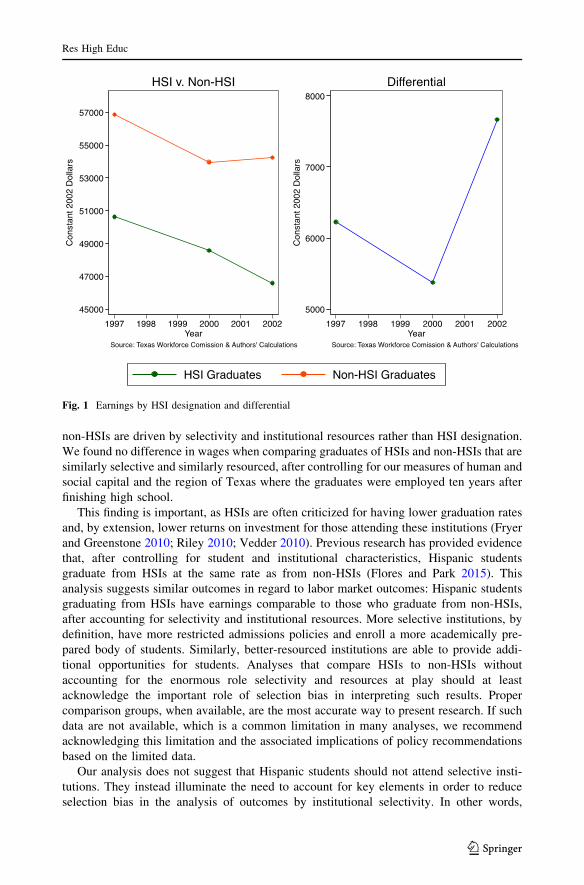
Second, wage differentials and economic disadvantage between institution types are
striking. For instance, in the 1997 cohort, graduates of non-HSIs had a $6,227.50 average
wage premium over HSI graduates; the number fell to $5,375.13 for the 2000 cohort but
increased to $7,667.13 for the 2002 cohort (all expressed in constant, CPI-adjusted 2002
dollars). This widening wage gap is depicted by institution type in Fig. 1, and is consistent
with the literature on wage gap differentials (e.g., Monks 2000; Strayhorn 2008). Along the
same lines, the percentage of students classified as economically disadvantaged (those
students who receive free or reduced priced lunch) grew in each cohort year, as did the gap
by institution type: 1997—45.98% at HSIs and 23.02% at non-HSIs; 2000—51.85% at
HSIs and 28.05% at non-HSIs; and 2002—54.89% at HSIs and 29.94% at non-HSIs. Put
differently, the proportion of HSI graduates who were classified as economically disad-
vantaged was nearly double that of non-HSI graduates in every cohort.
Third, in terms of academic preparation, we found that graduates of both HSIs and non-
HSIs were better prepared for college entry over time for each cohort year; however, HSI
graduates remained slightly less prepared to participate in rigorous academic coursework at
the postsecondary level than graduates of non-HSIs. Participation in AP/IB courses at HSIs
was 34.56% in 1997, 68.32% in 2000, and 65.65% in 2002; at non-HSIs it was 48.59% in
1997, 71.87% in 2000, and 75.13% in 2002. In short, HSI graduates were enrolled in advanced
coursework at a rate 14.03%points lower than non-HSIs in 1997, but only 3.49 points lower in
2000 and 9.48% points lower in 2002. The gap in the percentage of graduates from HSIs and
non-HSIs who participated in dual-enrollment programs while still in high school was 7.29%
points in 1997, but there was nearly no difference in 2002, a mere 0.67% points.
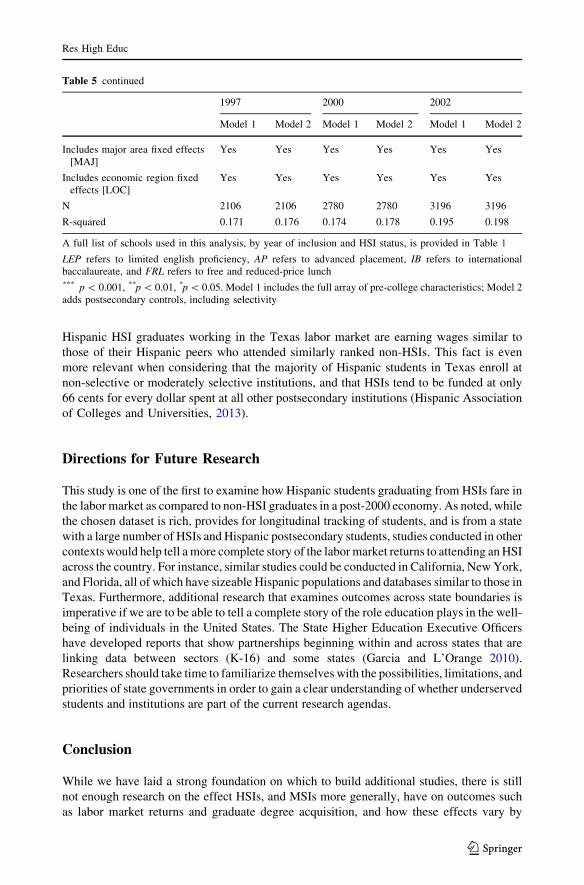
Econometric Model Results
Table 5 presents regression results for our cohorts. Model 1 for each cohort is the full
sample, including the main array of control variables; Model 2 adds the postsecondary
controls, including selectivity. All models include the full array of covariates that account
for differences in human capital, social capital, and location of employment (Texas
Table 2 continued
Total (N = 2106)MeanSt. dev.
HSIs (N = 1007)MeanSt. dev.
NON-HSIs(N = 1099)MeanSt. dev.
Difference
Worked in HS 13.06 10.53 15.38 -4.85
33.70 30.70 36.09
A full list of schools used in this analysis, by year of inclusion and HSI status, is provided in Table 1
LEP refers to limited english proficiency, AP refers to advanced placement, IB refers to internationalbaccalaureate, and FRL refers to free and reduced-price lunch, a measure of economic disadvantage
Res High Educ
123
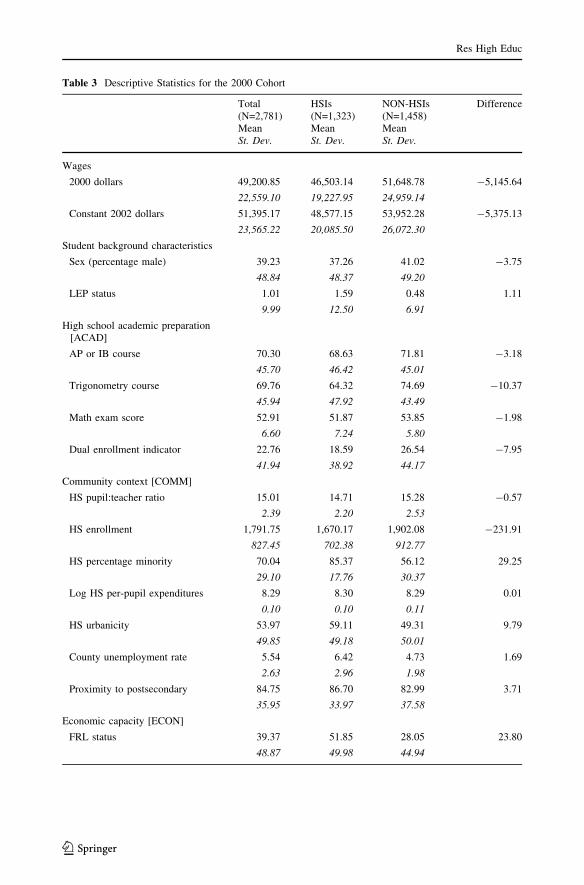
Table 3 Descriptive Statistics for the 2000 Cohort
Total(N=2,781)MeanSt. Dev.
HSIs(N=1,323)MeanSt. Dev.
NON-HSIs(N=1,458)MeanSt. Dev.
Difference
Wages
2000 dollars 49,200.85 46,503.14 51,648.78 -5,145.64
22,559.10 19,227.95 24,959.14
Constant 2002 dollars 51,395.17 48,577.15 53,952.28 -5,375.13
23,565.22 20,085.50 26,072.30
Student background characteristics
Sex (percentage male) 39.23 37.26 41.02 -3.75
48.84 48.37 49.20
LEP status 1.01 1.59 0.48 1.11
9.99 12.50 6.91
High school academic preparation[ACAD]
AP or IB course 70.30 68.63 71.81 -3.18
45.70 46.42 45.01
Trigonometry course 69.76 64.32 74.69 -10.37
45.94 47.92 43.49
Math exam score 52.91 51.87 53.85 -1.98
6.60 7.24 5.80
Dual enrollment indicator 22.76 18.59 26.54 -7.95
41.94 38.92 44.17
Community context [COMM]
HS pupil:teacher ratio 15.01 14.71 15.28 -0.57
2.39 2.20 2.53
HS enrollment 1,791.75 1,670.17 1,902.08 -231.91
827.45 702.38 912.77
HS percentage minority 70.04 85.37 56.12 29.25
29.10 17.76 30.37
Log HS per-pupil expenditures 8.29 8.30 8.29 0.01
0.10 0.10 0.11
HS urbanicity 53.97 59.11 49.31 9.79
49.85 49.18 50.01
County unemployment rate 5.54 6.42 4.73 1.69
2.63 2.96 1.98
Proximity to postsecondary 84.75 86.70 82.99 3.71
35.95 33.97 37.58
Economic capacity [ECON]
FRL status 39.37 51.85 28.05 23.80
48.87 49.98 44.94
Res High Educ
123
economic region) ten years after graduating from high school. As our outcome variable is
logged, the raw coefficients roughly represent the percentage change in earnings for a unit
change for a particular independent variable, holding the others constant. More specifi-
cally, the raw coefficient for HSI (a dichotomous indicator) can roughly be interpreted as
the percentage change in earnings for Hispanic graduates of HSIs compared to Hispanic
graduates of non-HSIs. For added precision, however, we discuss our main findings in text
using the semi-elastic calculation [100*(exp(Bhat) – 1)]; in doing so, we are able to
provide the exact difference in the percentage change in wages between graduates of HSIs
and non-HSIs (Wooldridge, 2013).
Across all cohorts, Model 1 reveals a negative and statistically significant relationship
between graduating from an HSI and earnings. More specifically, Model 1 shows that
Hispanic graduates of HSIs have annual wages 6.85, 6.29, and 4.59% lower than Hispanic
graduates of non-HSIs, for the 1997, 2002, and 2002 cohorts, respectively, after accounting
for other factors in the model. We note that males have higher earnings than females, and
that students who are better prepared in high school (at least as reflected in math exam
scores) earn more, as do students with more work experience. Thus, while human, social,
and economic capital all play a role in earnings, there appears to be a persistent penalty for
attending an HSI—at least before also considering postsecondary context.
In Model 2, however, there is no statistically significant difference between the earnings
of HSI graduates and non-HSI graduates—in other words, Hispanic HSI graduates earned
just as much as non-HSIs graduates from institutions that are similar in terms of selectivity
and resources. Although males continue to earn more than females, as do students with
greater pre-college academic preparation and those with more years of work experience,
we fail to identify a penalty for attending an HSI when taking into account other differ-
ences in postsecondary context. In other words, we have no reason to suggest that attending
an HSI has a specific discernable influence on how much students earn after graduation.
Discussion
This paper sheds further light on HSIs, which are a growing segment of American higher
education, and the population of students these institutions serve. We find that differences
exist between Hispanics who graduate from HSIs and those from non-HSIs in terms of
post-graduation earnings, as well as pre-college academic preparation and contextual
factors, both of which are known to influence earnings. However, we demonstrate that
differences in earnings between Hispanic students who graduate from HSIs and those from
Table 3 continued
Total(N=2,781)MeanSt. Dev.
HSIs(N=1,323)MeanSt. Dev.
NON-HSIs(N=1,458)MeanSt. Dev.
Difference
Worked in HS 14.42 9.15 19.20 -10.06
35.13 28.84 39.40
A full list of schools used in this analysis, by year of inclusion and HSI status, is provided in Table 1
LEP refers to limited english proficiency, AP refers to advanced placement, IB refers to internationalbaccalaureate, and FRL refers to free and reduced-price lunch
Res High Educ
123
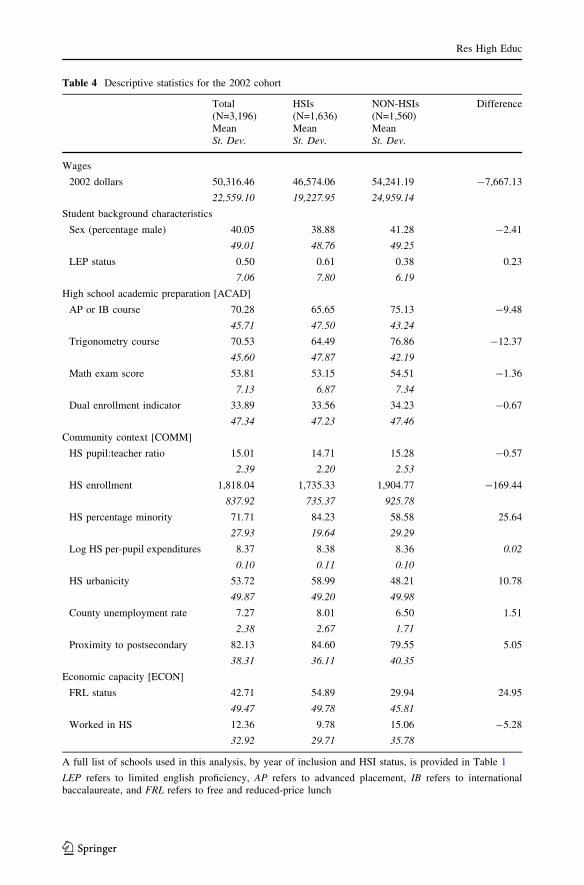
Table 4 Descriptive statistics for the 2002 cohort
Total(N=3,196)MeanSt. Dev.
HSIs(N=1,636)MeanSt. Dev.
NON-HSIs(N=1,560)MeanSt. Dev.
Difference
Wages
2002 dollars 50,316.46 46,574.06 54,241.19 -7,667.13
22,559.10 19,227.95 24,959.14
Student background characteristics
Sex (percentage male) 40.05 38.88 41.28 -2.41
49.01 48.76 49.25
LEP status 0.50 0.61 0.38 0.23
7.06 7.80 6.19
High school academic preparation [ACAD]
AP or IB course 70.28 65.65 75.13 -9.48
45.71 47.50 43.24
Trigonometry course 70.53 64.49 76.86 -12.37
45.60 47.87 42.19
Math exam score 53.81 53.15 54.51 -1.36
7.13 6.87 7.34
Dual enrollment indicator 33.89 33.56 34.23 -0.67
47.34 47.23 47.46
Community context [COMM]
HS pupil:teacher ratio 15.01 14.71 15.28 -0.57
2.39 2.20 2.53
HS enrollment 1,818.04 1,735.33 1,904.77 -169.44
837.92 735.37 925.78
HS percentage minority 71.71 84.23 58.58 25.64
27.93 19.64 29.29
Log HS per-pupil expenditures 8.37 8.38 8.36 0.02
0.10 0.11 0.10
HS urbanicity 53.72 58.99 48.21 10.78
49.87 49.20 49.98
County unemployment rate 7.27 8.01 6.50 1.51
2.38 2.67 1.71
Proximity to postsecondary 82.13 84.60 79.55 5.05
38.31 36.11 40.35
Economic capacity [ECON]
FRL status 42.71 54.89 29.94 24.95
49.47 49.78 45.81
Worked in HS 12.36 9.78 15.06 -5.28
32.92 29.71 35.78
A full list of schools used in this analysis, by year of inclusion and HSI status, is provided in Table 1
LEP refers to limited english proficiency, AP refers to advanced placement, IB refers to internationalbaccalaureate, and FRL refers to free and reduced-price lunch
Res High Educ
123
non-HSIs are driven by selectivity and institutional resources rather than HSI designation.
We found no difference in wages when comparing graduates of HSIs and non-HSIs that are
similarly selective and similarly resourced, after controlling for our measures of human and
social capital and the region of Texas where the graduates were employed ten years after
finishing high school.
This finding is important, as HSIs are often criticized for having lower graduation rates
and, by extension, lower returns on investment for those attending these institutions (Fryer
and Greenstone 2010; Riley 2010; Vedder 2010). Previous research has provided evidence
that, after controlling for student and institutional characteristics, Hispanic students
graduate from HSIs at the same rate as from non-HSIs (Flores and Park 2015). This
analysis suggests similar outcomes in regard to labor market outcomes: Hispanic students
graduating from HSIs have earnings comparable to those who graduate from non-HSIs,
after accounting for selectivity and institutional resources. More selective institutions, by
definition, have more restricted admissions policies and enroll a more academically pre-
pared body of students. Similarly, better-resourced institutions are able to provide addi-
tional opportunities for students. Analyses that compare HSIs to non-HSIs without
accounting for the enormous role selectivity and resources at play should at least
acknowledge the important role of selection bias in interpreting such results. Proper
comparison groups, when available, are the most accurate way to present research. If such
data are not available, which is a common limitation in many analyses, we recommend
acknowledging this limitation and the associated implications of policy recommendations
based on the limited data.
Our analysis does not suggest that Hispanic students should not attend selective insti-
tutions. They instead illuminate the need to account for key elements in order to reduce
selection bias in the analysis of outcomes by institutional selectivity. In other words,
Fig. 1 Earnings by HSI designation and differential
Res High Educ
123
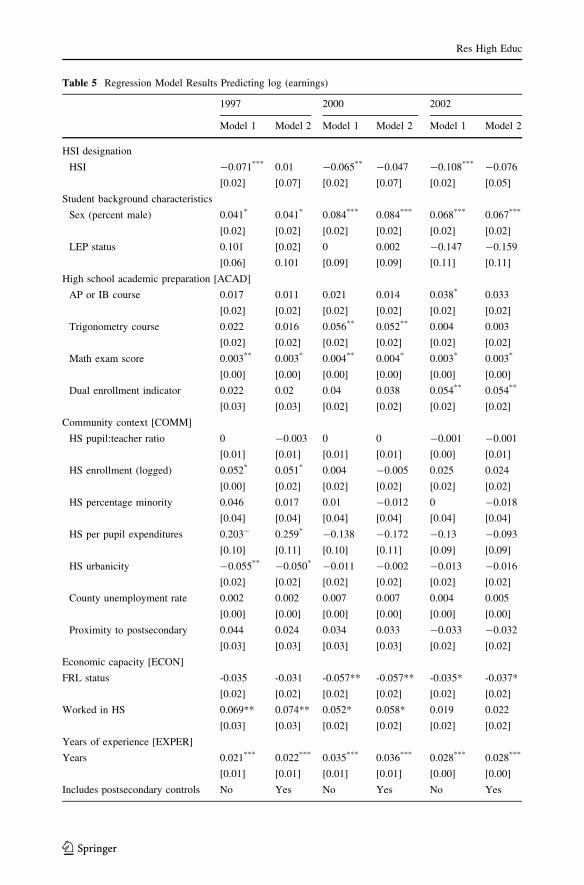
Table 5 Regression Model Results Predicting log (earnings)
1997 2000 2002
Model 1 Model 2 Model 1 Model 2 Model 1 Model 2
HSI designation
HSI -0.071*** 0.01 -0.065** -0.047 -0.108*** -0.076
[0.02] [0.07] [0.02] [0.07] [0.02] [0.05]
Student background characteristics
Sex (percent male) 0.041* 0.041* 0.084*** 0.084*** 0.068*** 0.067***
[0.02] [0.02] [0.02] [0.02] [0.02] [0.02]
LEP status 0.101 [0.02] 0 0.002 -0.147 -0.159
[0.06] 0.101 [0.09] [0.09] [0.11] [0.11]
High school academic preparation [ACAD]
AP or IB course 0.017 0.011 0.021 0.014 0.038* 0.033
[0.02] [0.02] [0.02] [0.02] [0.02] [0.02]
Trigonometry course 0.022 0.016 0.056** 0.052** 0.004 0.003
[0.02] [0.02] [0.02] [0.02] [0.02] [0.02]
Math exam score 0.003** 0.003* 0.004** 0.004* 0.003* 0.003*
[0.00] [0.00] [0.00] [0.00] [0.00] [0.00]
Dual enrollment indicator 0.022 0.02 0.04 0.038 0.054** 0.054**
[0.03] [0.03] [0.02] [0.02] [0.02] [0.02]
Community context [COMM]
HS pupil:teacher ratio 0 -0.003 0 0 -0.001 -0.001
[0.01] [0.01] [0.01] [0.01] [0.00] [0.01]
HS enrollment (logged) 0.052* 0.051* 0.004 -0.005 0.025 0.024
[0.00] [0.02] [0.02] [0.02] [0.02] [0.02]
HS percentage minority 0.046 0.017 0.01 -0.012 0 -0.018
[0.04] [0.04] [0.04] [0.04] [0.04] [0.04]
HS per pupil expenditures 0.203- 0.259* -0.138 -0.172 -0.13 -0.093
[0.10] [0.11] [0.10] [0.11] [0.09] [0.09]
HS urbanicity -0.055** -0.050* -0.011 -0.002 -0.013 -0.016
[0.02] [0.02] [0.02] [0.02] [0.02] [0.02]
County unemployment rate 0.002 0.002 0.007 0.007 0.004 0.005
[0.00] [0.00] [0.00] [0.00] [0.00] [0.00]
Proximity to postsecondary 0.044 0.024 0.034 0.033 -0.033 -0.032
[0.03] [0.03] [0.03] [0.03] [0.02] [0.02]
Economic capacity [ECON]
FRL status -0.035 -0.031 -0.057** -0.057** -0.035* -0.037*
[0.02] [0.02] [0.02] [0.02] [0.02] [0.02]
Worked in HS 0.069** 0.074** 0.052* 0.058* 0.019 0.022
[0.03] [0.03] [0.02] [0.02] [0.02] [0.02]
Years of experience [EXPER]
Years 0.021*** 0.022*** 0.035*** 0.036*** 0.028*** 0.028***
[0.01] [0.01] [0.01] [0.01] [0.00] [0.00]
Includes postsecondary controls No Yes No Yes No Yes
Res High Educ
123
Hispanic HSI graduates working in the Texas labor market are earning wages similar to
those of their Hispanic peers who attended similarly ranked non-HSIs. This fact is even
more relevant when considering that the majority of Hispanic students in Texas enroll at
non-selective or moderately selective institutions, and that HSIs tend to be funded at only
66 cents for every dollar spent at all other postsecondary institutions (Hispanic Association
of Colleges and Universities, 2013).
Directions for Future Research
This study is one of the first to examine how Hispanic students graduating from HSIs fare in
the labor market as compared to non-HSI graduates in a post-2000 economy. As noted, while
the chosen dataset is rich, provides for longitudinal tracking of students, and is from a state
with a large number of HSIs and Hispanic postsecondary students, studies conducted in other
contexts would help tell amore complete story of the labormarket returns to attending anHSI
across the country. For instance, similar studies could be conducted in California, NewYork,
and Florida, all of which have sizeable Hispanic populations and databases similar to those in
Texas. Furthermore, additional research that examines outcomes across state boundaries is
imperative if we are to be able to tell a complete story of the role education plays in the well-
being of individuals in the United States. The State Higher Education Executive Officers
have developed reports that show partnerships beginning within and across states that are
linking data between sectors (K-16) and some states (Garcia and L’Orange 2010).
Researchers should take time to familiarize themselves with the possibilities, limitations, and
priorities of state governments in order to gain a clear understanding of whether underserved
students and institutions are part of the current research agendas.
Conclusion
While we have laid a strong foundation on which to build additional studies, there is still
not enough research on the effect HSIs, and MSIs more generally, have on outcomes such
as labor market returns and graduate degree acquisition, and how these effects vary by
Table 5 continued
1997 2000 2002
Model 1 Model 2 Model 1 Model 2 Model 1 Model 2
Includes major area fixed effects[MAJ]
Yes Yes Yes Yes Yes Yes
Includes economic region fixedeffects [LOC]
Yes Yes Yes Yes Yes Yes
N 2106 2106 2780 2780 3196 3196
R-squared 0.171 0.176 0.174 0.178 0.195 0.198
A full list of schools used in this analysis, by year of inclusion and HSI status, is provided in Table 1
LEP refers to limited english proficiency, AP refers to advanced placement, IB refers to internationalbaccalaureate, and FRL refers to free and reduced-price lunch*** p\ 0.001, **p\ 0.01, *p\ 0.05. Model 1 includes the full array of pre-college characteristics; Model 2adds postsecondary controls, including selectivity
Res High Educ
123
context. For example, how does the effect of attending an HSI vary by state? What role do
HSIs in Texas play in the acquisition of graduate degrees, and what effect do graduate
degrees have on labor market outcomes? Finding answers to these questions and others will
only be possible if there is more high-quality data available and better access to it. U.S.
higher education is experiencing profound changes related to demography, technology,
costs, and outcomes. As policies are suggested, implemented, and retracted, we recom-
mend that giving precise and sustained attention to the changing student demography of
U.S. higher education be a key priority for all states. A lack of responsiveness to the
evolving national demographics will be not only costly but also counter to the goal of
improving educational opportunity for reasons of civic and social justice, and for the
economic survival of states and institutions. The changing demographics in many of our
states and institutions will require us to make a unified effort to provide educational
opportunity for all. We thus urge state agencies, funding organizations, and other scholars
to appreciate the importance and research power of state education data systems, as we
have outlined both here and in a 2015 special issue of Educational Evaluation and Policy
Analysis. Only continued research using sophisticated datasets, as well as funding to
support the research work, will enable us to gain a full understanding of the role played by
HSIs in the nation’s higher education system, and thus allow us to offer the best possible
recommendations for state and federal policy that will improve educational outcomes for
all students.
Acknowledgements The authors would like to thank the University of Pennsylvania Center for MinorityServing Institutions, the Educational Testing Service, the University of Texas at Dallas Education ResearchCenter, and New York University for their assistance and support of this study.
References
American Indian Higher Education Consortium. (2000). Tribal college contributions to local economicdevelopment. Alexandria, VA: Author. Retrieved from http://www.aihec.org/our-stories/docs/reports/TC_contributionsLocalEconDevmt.pdf
Andrews, R. J., Li, J., & Lovenheim, M. F. (2012). Quantile treatment effects of college quality on earnings:Evidence from administrative data in Texas (NBER Working Paper No. w18068). Cambridge, MA:National Bureau of Economic Research.
Andrews, R., Li, J., & Lovenheim, M. F. (2014). Heterogeneous paths through college: detailed patterns andrelationships with graduation and earnings. Economics of Education Review, 42, 93–108.
Becker, G. (1964). Human capital: a theoretical and empirical analysis. New York: Columbia UniversityPress.
Becker, G. S. (1967). Human capital and the personal distribution of income: An analytical approach (IPAWorking Paper No. 1). Ann Arbor: University of Michigan Institute of Public Administration.
Becker, G. S. (1993). Nobel lecture: the economic way of looking at behavior. Journal of PoliticalEconomy, 101, 385–409.
Benitez, M., & DeAro, J. (2004). Realizing student success at Hispanic-serving institutions. In B. V. Laden(Ed.), Serving minority populations: New directions for community colleges (pp. 35–49). San Fran-cisco: Jossey-Bass.
Black, D., Kolesnikova, N., & Taylor, L. (2009). Earnings functions when wages and prices vary bylocation. Journal of Labor Economics, 27(1), 21–47.
Black, D., & Smith, J. (2006). Estimating the returns to college quality with multiple proxies for quality.Journal of Labor Economics, 24(3), 701–728.
Bourdieu, P., & Passeron, J. C. (1977). Reproduction in education, culture and society. London: Sage.Brand, J. E., & Xie, Y. (2010). Who benefits most from college? Evidence for negative selection in
heterogeneous effects. Demography, 48, 863–887.Brewer, D., & Ehrenberg, R. (1996). Does it pay to attend an elite private college? Evidence from the senior
class of 1980. Research in Labor Economics, 15, 239–272.
Res High Educ
123
Brewer, D., Eide, E., & Ehrenberg, R. (1999). Does it pay to attend an elite private college? Cross cohortevidence on the effects of college type on earnings. Journal of Human Resources, 34(1), 104–123.
Bridges, B. K., Cambridge, B., Kuh, G. D., & Leegwater, L. H. (2005). Student engagement at minorityserving institutions: emerging lessons from the BEAMS Project. New Directions for InstitutionsResearch, 125, 25–43.
Card, D. (1999). Causal effects of education. Handbook of Labor Economics, 3, 1802–1863.Carnevale, A. P., Smith, N., & Strohl, J. (2010). Help wanted: Projections of job and education require-
ments through 2018. Washington, DC: Center on Education and the Workforce.Cellini, S., & Chaudhary, L. (2012). The labor market returns to a for-profit college education (NBER
Working Paper No. 18343). Cambridge, MA: National Bureau of Economic Research.Conrad, C., & Gasman, M. (2015). Educating a diverse nation: Lessons from minority-serving institutions.
Cambridge, MA: Harvard University Press.Dagdar, M., & Weiss, M. J. (2012). Labor market returns to sub-baccalaureate credentials: How much does
a community college degree or certificate pay? (CCRC Working Paper No. 45). New York: Com-munity College Research Center.
Dale, S. B., & Krueger, A. B. (2002). Estimating the payoff to attending a more selective college: anapplication of selection on observables and unobservables. Quarterly Journal of Economics, 117,1491–1527.
Dayton, B., Gonzalez-Vasquez, N., Martinez, C. R., & Plum, C. (2004). Hispanic-serving institutionsthrough the eyes of students and administrators. New Directions for Student Services, 105, 29–40.
Ennis, S. R., Rios-Vargas, M., & Albert, N. G. (2011). The Hispanic population: 2010 census briefs.Washington, DC: U.S. Census Bureau. Retrieved from http://www.census.gov/prod/cen2010/briefs/c2010br-04.pdf
Espino, M., & Cheslock, J. (2008). Considering the federal classification of Hispanic serving institutions andhistorically Black colleges and universities. In M. Gasman, B. Baez, & C. Turner (Eds.), Under-standing minority-serving institutions (pp. 257–268). Albany: State University of New York Press.
Excelencia in Education. (2015a). Growth: HSIs 1994-95 to 2013-14. Washington, DC: Author. Retrievedfrom http://www.edexcelencia.org/hsi-cp2/research/growth-hsis-1994-95-2013-14#sthash.g9K5i7TC.dpuf
Excelencia in Education. (2015b). HSIs by sector: 1994-95 to 2013-14. Washington, DC: Author. Retrievedfrom http://www.edexcelencia.org/hsi-cp2/research/hsis-sector-1994-95-2013-14
Fletcher, C., & Webster, J. (2010). A profile of minority-serving institutions in Texas (TG Research Report).Round Rock, TX: Texas Guaranteed Student Loan Corporation. Retrieved from http://www.tgslc.org/pdf/HSI-HBCU-Summary.pdf
Flores, S. M., Batalova, J., & Fix, M. (2012). The educational trajectories of English language learners inTexas. Washington, DC: The Migration Policy Institute.
Flores, S. M., & Park, T. J. (2013). Race, ethnicity, and college success: examining the continued signifi-cance of the minority-serving institution. Education Researcher, 42, 115–128.
Flores, S. M., & Park, T. J. (2015). The effect of enrolling in a minority-serving institution for Black andHispanic students in Texas. Research in Higher Education, 56, 247–276.
Flores, S. M., & Shepherd, J. (2014). The effect of tuition deregulation on low-income and underrepresentedstudents in Texas. ANNALS of the American Academy of Political and Social Science, 655, 99–112.
Fry, R., & Lopez, M. (2012). Hispanic student enrollments reach new highs in 2011: Now largest minoritygroup on four-year college campuses. Washington, DC: Pew Hispanic Center. Retrieved from http://www.pewhispanic.org/files/2012/08/Hispanic-Student-Enrollments-Reach-New-Highs-in-2011_FINAL.pdf
Fryer, R. G., & Greenstone, M. (2010). The changing consequences of attending historically Black collegesand universities. American Economic Journal: Applied Economics, 2, 116–148.
Garcia, T. I., & L’Orange, H. P. (2010). Strong foundations: The state of state postsecondary data systems.Boulder, CO: State Higher Education Executive Officers.
Gasman, M., Baez, B., & Turner, C. S. V. (2008). Understanding minority-serving institutions. Albany:State University of New York Press.
Gastic, B., & Nieto, D. G. (2010). Latinos’ economic recovery: postsecondary participation and Hispanic-serving institutions. Community College Journal of Research and Practice, 34, 833–838.
Goldin, C., & Katz, L. F. (2007). The race between education and technology. Cambridge, MA: BelknapPress.
Harmon, N. (2012). The role of minority-serving institutions in national college completion goals. Wash-ington, DC: Institute for Higher Education Policy.
Res High Educ
123
Hispanic Association of Colleges and Universities. (2013). HACU public policy priorities for the 2013reauthorization of the Higher Education Act. Washington, DC: Author. Retrieved from https://www.hacu.net/images/hacu/OPAI/2013_CF_Docs/HACU.HEA%20Policy%20Document.pdf
Hispanic Association of Colleges and Universities. (2015). Hispanic higher education and HSIs (2014 FactSheet). Washington, DC: Author. Retrieved from http://www.hacu.net/hacu/hsi_fact_sheet.asp
Hoekstra, M. (2009). The effect of attending the flagship state university on earnings: a discontinuity-basedapproach. Review of Economics and Statistics, 91, 717–724.
Hout, M. (2012). Social and economic returns to college education in the United States. The Annual Reviewof Sociology, 38, 379–400.
Humphreys, J., & Korb, R. (2006). Economic impact of the nation’s historically black colleges and uni-versities. Washington, DC: Institute for Education Sciences.
Institute for Higher Education Policy. (2004). Serving the nation. Washington, DC: Author.Kane, T., & Rouse, C. E. (1995). Labor-market returns to two- and four-year colleges. American Economic
Review, 85, 600–614.Kaymak, B. (2009). Ability bias and the rising education premium in the U.S.: a cohort-based analysis.
Journal of Human Capital, 3, 224–267.Krogstad, J. M., & Fry, R. (2014, April 24). More Hispanics, Blacks enrolling in college, but lag in
bachelor’s degrees. Washington, DC: Pew Research Center. Retrieved from http://www.pewresearch.org/fact-tank/2014/04/24/more-hispanics-blacks-enrolling-in-college-but-lag-in-bachelors-degrees/
Laden, B. V. (2004). Hispanic-serving institutions: what are they? Where are they? Community CollegeJournal of Research and Practice, 28, 181–198.
Li, X. (2007). Characteristics of minority-serving institutions and minority undergraduates enrolled in theseinstitutions (NCES Working Paper 2008-156). Washington, DC: U.S. Department of Education,Institute of Education Sciences, National Center for Education Statistics.
Long, M. C. (2010). Changes in returns to education and college quality. Economics of Education Review,29, 338–347.
Lumina Foundation. (n.d.). Goal 2025. Washington, DC: Author. Retrieved from https://www.luminafoundation.org/goal_2025
Malcom-Piquex, L., Bensimon, E. M., Suro, R., Fischer, A., Bartle, A., Loudenback, J., et al. (2013).Addressing Latino outcomes at California’s Hispanic-serving institutions. Los Angeles: University ofSouthern California Center for Urban Education.
McDonough, P. M. (1997). Choosing colleges: How social class and schools structure opportunity. Albany:State University of New York Press.
Mincer, J. (1974). Schooling, experience, and earnings. New York: Columbia University Press.Monks, J. (2000). The return to individual and college characteristics: evidence from the National Longi-
tudinal Survey of Youth. Economics of Education Review, 19, 279–289.National Commission on Asian American and Pacific Islander Research in Education. (2014). Measuring
the impact of MSI-funded programs on student success: Findings from the evaluation of AsianAmerican and Native American Pacific Islander-serving institutions. Los Angeles, CA: Author.Retrieved from http://www.apiasf.org/pdfs/2014_peer_report/APIASF_and_CARE_PEER_Report_April_2014.pdf
Nunez, A. M., & Bowers, A. J. (2011). Exploring what leads high school students to enroll in Hispanic-serving institutions: a multilevel analysis. American Educational Research Journal, 48, 1286–1313.
Nunez, A., Crisp, G., & Elizondo, D. (2016). Mapping Hispanic-serving institutions: a typology of insti-tutional diversity. Journal of Higher Education, 87(1), 55–83.
Nunez, A. M., Sparks, P. J., & Hernandez, E. A. (2011). Latino access to community colleges and Hispanic-serving institutions: a national study. Journal of Hispanic Higher Education, 10(1), 18–40.
Pascarella, E. T., & Terenzini, P. T. (1991). How college affects students: Findings and insights from twentyyears of research. San Francisco: Jossey-Bass.
Pascarella, E. T., & Terenzini, P. T. (2005). How college affects students: A third decade of research (Vol.2). San Francisco: Jossey-Bass.
Perna, L. W. (1998). Does financial aid help students to attend higher priced colleges? Journal of StudentFinancial Aid, 28(1), 19–38.
Perna, L. W. (2004). Understanding the decision to enroll in graduate school: sex and racial/ethnic groupdifferences. Journal of Higher Education, 75, 487–527.
Perna, L. W., & Finney, J. E. (2014). The attainment agenda: State policy leadership in higher education.Baltimore: Johns Hopkins University Press.
Perna, L. W., Rowan-Kenyon, H. T., Bell, A., Thomas, S. L., & Li, C. (2008). A typology of federal andstate programs designed to promote college enrollment. Journal of Higher Education, 79, 243–267.
Res High Educ
123
Provasnik, S., & Shafer, L. L. (2004). Historically Black colleges and universities, 1976 to 2001 (NCESWorking Paper No. 2004-062). Washington, DC: Government Printing Office.
Riley, J. (2010). Black colleges need a new mission. Wall Street Journal. Retrieved from http://online.wsj.com/news/articles/SB10001424052748704654004575517822124077834
Rodrıguez, A., & Calderon-Galdeano, E. (2014). What is working for Latinos? Understanding Latinos’postsecondary outcomes at HSIs versus non-HSIs. Paper presented at the meeting of the AmericanEducational Research Association, Philadelphia, PA.
Rodrıguez, A., & Calderon Galdeano, E. (2015). Do Hispanic-serving institutions really underperform?Using propensity score matching to compare outcomes of Hispanic-Serving and non-Hispanic-ServingInstitutions. In A.-M. Nunez, S. Hurtado & E. Calderon Galdeano (Eds.), Hispanic-Serving Institu-tions: Advancing research and transformative practice (pp. 196-216). New York: Routledge.
Santiago, D. A., & Andrade, S. J. (2010). Emerging Hispanic serving institutions (HSIs): Serving Latinostudents. Washington, DC: Excelencia in Education. Retrieved from http://files.eric.ed.gov/fulltext/ED508202.pdf
Smart, J. C. (1986). College effects on occupational status attainment. Research in Higher Education, 24,47–72.
Smith, M. (2012). At some schools, the demographic future is now. Texas Tribune. Retrieved from https://www.texastribune.org/2012/08/31/some-schools-texas-demographic-future-here-now/
Stearns, C., Watanabe, S., & Snyder, T. (2002). Hispanic-serving institutions: statistical trends from1990–1999 (NCES Report No. 2002-051). Washington: Department of Education, National Center forEducation Statistics.
Strayhorn, T. L. (2008). Influences on labor market outcomes of African American college graduates: anational study. Journal of Higher Education, 79, 28–57.
Texas Workforce Commission (2015). LCMI WDA Economic Profiles: Alamo, Cameron, Capital, CoastalBend, Dallas, Gulf Coast, Lower Rio Grande Valley, Middle Rio Grande Valley, North Central, RuralCapital, South Texas, Tarrant, Texoma, Upper Rio Grande Valley. Retrieved from http://www.tracer2.com/default.asp?PAGEID=94&SUBID=150
U.S. Department of Education (2009). Developing Hispanic-serving institutions program: Title V. Retrievedfrom http://www.ed.gov/programs/idueshsi/legislation.html
U.S. Department of Education (2013). Developing Hispanic-serving institutions program: Title V. Retrievedfrom http://www2.ed.gov/programs/idueshsi/definition.html
U.S. Department of Education. (n.d.). United States Department of Education lists of postsecondary insti-tutions enrolling populations with significant percentages of undergraduate minority students.Retrieved from https://www2.ed.gov/about/offices/list/ocr/edlite-minorityinst.html
Vedder, R. (2010). Why do we have HBCUs? Chronicle of higher education. Retrieved from http://chronicle.com/blogs/innovations/why-do-we-have-hbcus/27506
Wooldridge, J. M. (2013). Introductory econometrics: a modern approach (5th ed.). Mason: South-Western.Zhang, L. (2005). Do measures of college quality matter? The effect of college quality on graduates’
earnings. Review of Higher Education, 28, 571–596.
Res High Educ
123