Embed Size (px)
Citation preview
Labor Market Information
Joseph WinterSupervisor Current Employment Statistics and
Local Area Unemployment Statistics
Todd NielsenRegional Economist – Eastern Region

Economic Horoscope for Colorado
• Colorado was declared a state on Aug 1, 1876.
• Star sign: Leo
• Characteristics: (Colorado) is colorful, self assured, and expansive.

Economic Horoscope for Eastern Region 2005
• Leo: Your talents are varied. You're valued for your potential -- and you'll certainly live up to it -- but pause to be sure it's what you really want.
• As goes the Dollar, so may agricultural exports.
• Oil and gas add high value positions• As Denver Metro lost 75,000 jobs (02-03),
Eastern gained 468 jobs (1.3%)

2005 Statewide Projections from Colorado Business Economic Outlook
(In Millions of Dollars)
Livestock Crops Total Value
2005 $ 3,491.0 $ 1,367.0 $ 4,858.0
% change 04-05
4.15% 1.11% 3.27%
Source: Business Research Division, Leeds School of Business, University of Colorado at Boulder

2005 Statewide Projections from Colorado Business Economic Outlook
(In Millions of Dollars)
Value of Services & Forestry
Gov’t Payments
Gross Value of Farm Rev.
2005 $ 660.0 $ 250.0 $ 5,768.0
% change 04-05
1.54% -6.72% 1.00%
Source: Business Research Division, Leeds School of Business, University of Colorado at Boulder

QCEW-Top Sectors Industry Mix
0.0%
2.0%
4.0%
6.0%
8.0%
10.0%
12.0%
14.0%
16.0%
18.0%
11 Agriculture,Forestry, Fishing
and Hunting
21 Mining 22 Utilities 31-33Manufacturing
42 Wholesaletrade
44-45 Retail Trade 62 Health Careand SocialAssistance
Eastern Region Colorado

Labor Market Information
• Eastern Region Job Vacancy Survey Highlights
• Labor Force
• Long Term Outlook

Eastern JVS
• Conducted August 4-15, 2004
• Total of 767 employers
• Representing 54% of regional non-farm employment
• Estimated: 249 job vacancies
• Average wage of $12.00 per hour

Historical Vacancies
490
350345
249
-
50
100
150
200
250
300
350
400
450
500
Fall 2001 Summer 2002 Summer 2003 Summer 2004
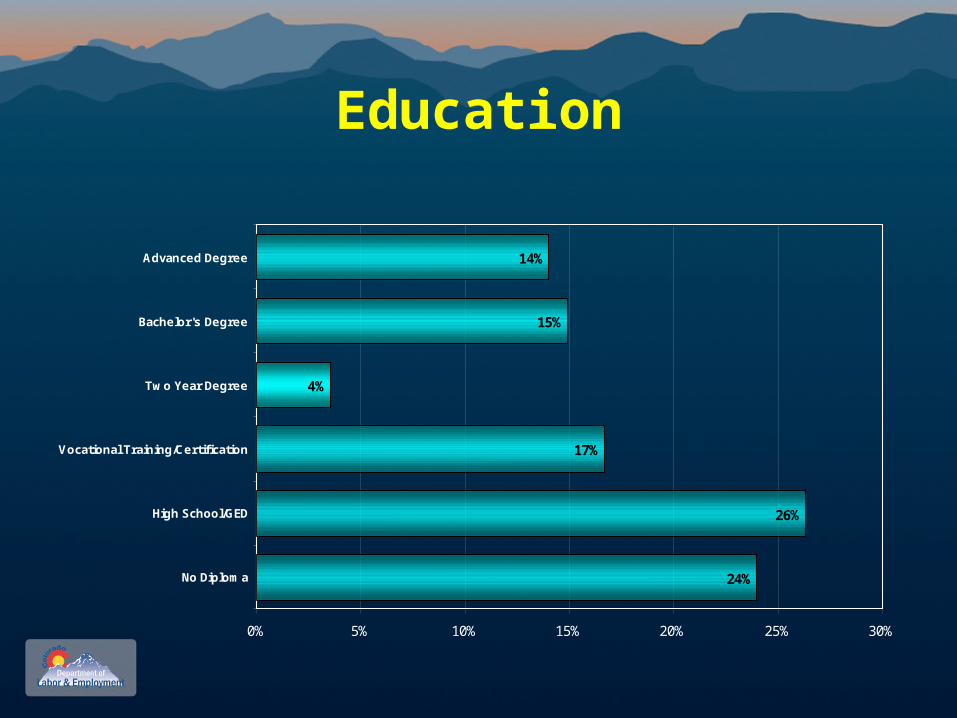
Education
24%
26%
17%
4%
15%
14%
0% 5% 10% 15% 20% 25% 30%
No Diploma
High School/GED
Vocational Training/Certification
Two Year Degree
Bachelor's Degree
Advanced Degree

Experience
No Experience Required, 28% Experience in a Related Field, 26%
Experience in this Occupation, 37%General Work Experience, 9%

Vacancies & Wages by Employer Size
$7.70
$13.60
$11.30
0
20
40
60
80
100
120
Government Large Small to Mid-Size
Es
tim
ate
d V
ac
an
cie
s
$0.00
$2.00
$4.00
$6.00
$8.00
$10.00
$12.00
$14.00
$16.00
Av
era
ge
Wa
ge
s

Vacancies & Avg. Wage by JVS Sectors
$11.30
$5.50
$18.40
$11.00
$9.20
$11.70
0
10
20
30
40
50
60
70
80
Goods-Producing Trade,Transportation,Utilities & Other
Services
Information, FinancialActivities &
Professional &Business Services
Education & HealthServices
Leisure & Hospitality Government
Es
tim
ate
d V
ac
an
cie
s
$0
$3
$6
$9
$12
$15
$18
$21
Av
era
ge
Wa
ge
s

Hot Jobs
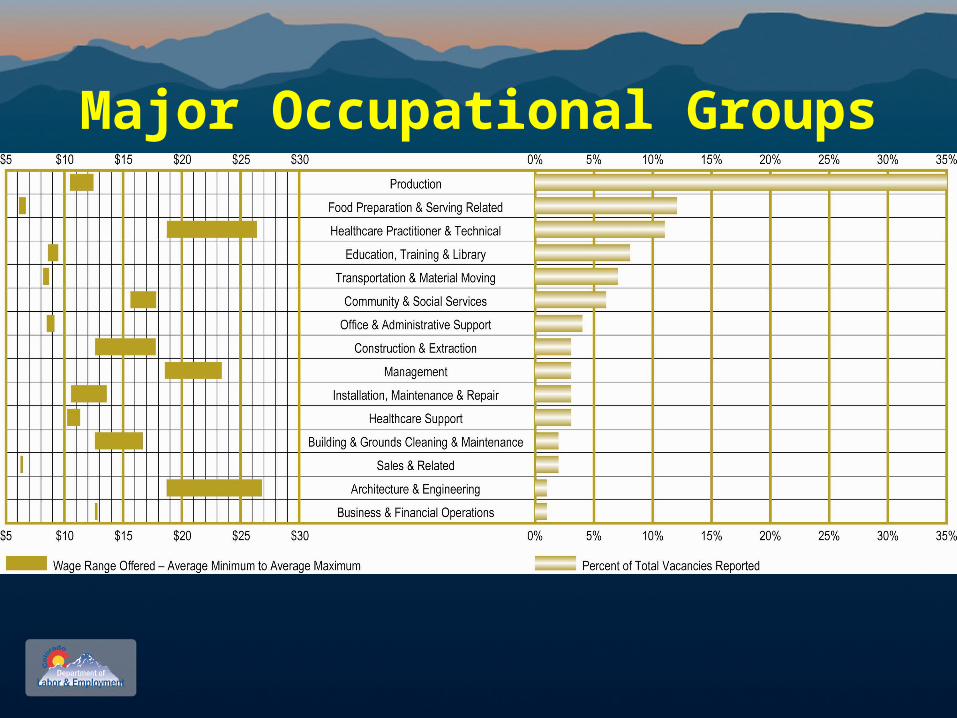
Major Occupational Groups
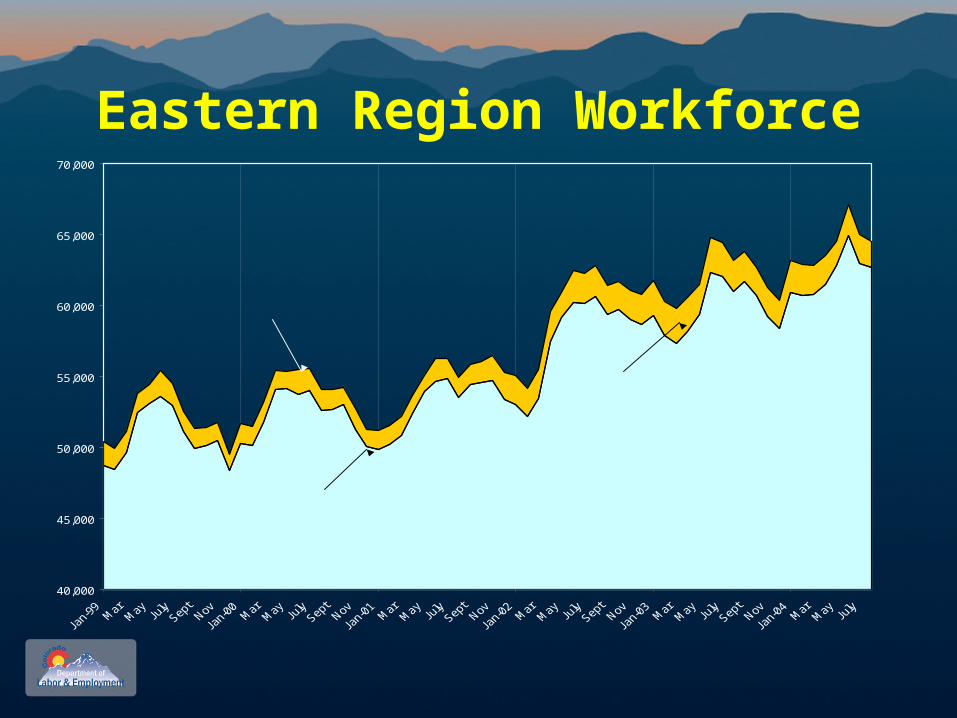
Eastern Region Workforce
40,000
45,000
50,000
55,000
60,000
65,000
70,000
Labor Force
Employment
Unemployed

Long Term Outlook
• Employment is closely related to population.

QCEW by Pop. 1990-2003
y = 0.3208x + 797.77
R2 = 0.9914
25000
27000
29000
31000
33000
35000
37000
80,000 85,000 90,000 95,000 100,000 105,000 110,000 115,000
POPULATION
QC
EW

QCEW by Pop. 1990-2014
25000
27000
29000
31000
33000
35000
37000
39000
41000
43000
45000
80,000 90,000 100,000 110,000 120,000 130,000 140,000
QCEW
PO
PU
LA
TIO
N
HISTORCAL QCEW PROJECTED QCEW

Population and Employment
0
20,000
40,000
60,000
80,000
100,000
120,000
140,000
160,000
1990 1991 1992 1993 1994 1995 1996 1997 1998 1999 2000 2001 2002 2003 2004 2005 2006 2007 2008 2009 2010 2011 2012 2013 2014
Population Covered Employment Population Forecast Covered Employment Forecast

Long Term Outlook
• Employment to population relationship trend over the next ten years
Year Population Covered Employment
2004 112,000 36,700
2009 122,400 40,100
2014 135,400 44,200

Final Thought
• Remember: Your talents are varied, you're valued for your potential -- and you'll certainly live up to it -- but pause to be sure it's what you really want.

Contact Information
Joseph WinterSupervisor CES/LAUS
Colorado Dept of Labor
1515 Arapahoe T/2 #300
Denver, CO 80202
303-318-8857
Fax: 303-318-8871
Todd NielsenRegional Economist
Colorado Dept of Labor
1515 Arapahoe T/2 #300
Denver, CO 80202
303-318-8895
Fax: 303-318-8899