Embed Size (px)
Citation preview
St Ivo School Geography Department - GCSE REVISION
Give 4 advantages of using ICT in the collection of data
can use a handheld GPS to get accurate location information
which can be used to show data linked to specific locations
within a GIS
can collect qualitative data using digital cameras which can be
used to help explain findings / anomalies
can access data that may not otherwise have been available -
e.g. secondary data from internet
can ensure greater accuracy in readings and automatic
collection to enable studies of change over time (using data
loggers)
St Ivo School Geography Department - GCSE REVISION
Give
Give 4 disadvantages in the use of ICT in the collection
of data
often requires expensive equipment (e.g. data loggers /
Global Positioning Systems)
may require specific software to actually make use of the
data collected using data loggers etc.
data from the internet may have some bias (need to
consider reliability)
St Ivo School Geography Department - GCSE REVISION
Give 4 advantages of using ICT in the presentation and
analysis of data
provides the ability to process, search and query data
using GIS
can save time - some graphical techniques and statistical
tests are time consuming by hand (time saved can be
spent on interpreting findings)
wide variety of different graphs can be produced quickly
base maps can be produced quickly
St Ivo School Geography Department - GCSE REVISION
Give 4 disadvantages of using ICT in the presentation
and analysis of data
may require particular computer programmes (may
be expensive)
need to ensure type of graph chosen is appropriate
for data being presented
accuracy of graphs produced will only be as
accurate as the raw data
some inaccuracies may occur during data input
St Ivo School Geography Department - GCSE REVISION
Give 3 advantages of GIS
provides ability to show lots of information on one map
information can be linked together to help identify spatial
patterns / support analysis of data
more and more people have access to GIS - e.g. i-phones etc.
GIS used by many public services to improve services offered
GPS combined with GIS has made travelling between places
easier
Fold
alo
ng
her
e
Fold
alo
ng
her
e
Fold
alo
ng
her
e
Fold
alo
ng
her
e
Fold
alo
ng
her
e
Year 11 - Geographical Skills www.geobytesgcse.wordpress.com
Year 11 - Geographical Skills www.geobytesgcse.wordpress.com
Year 11 - Geographical Skills www.geobytesgcse.wordpress.com
Year 11 - Geographical Skills www.geobytesgcse.wordpress.com
Year 11 - Geographical Skills www.geobytesgcse.wordpress.com
www.geobytesgcse.wordpress.com
www.geobytesgcse.wordpress.com
www.geobytesgcse.wordpress.com
www.geobytesgcse.wordpress.com
www.geobytesgcse.wordpress.com
St Ivo School Geography Department - GCSE REVISION
Give 3 disadvantages of GIS
May include:
May require expensive software and a computer which
needs keeping updated
Some software is complicated to use / may require
training
if too many layers or data are added to a map it can be
difficult to interpret
GIS produces maps - but skills is still required to interpret
the maps in a geographical context.
St Ivo School Geography Department - GCSE REVISION
How could you improve a geographical enquiry using
GIS?
upload photographs onto Google Earth using place
marks
Measure straight line distances and irregular lines
Locate study areas and access aerial photographs
Link data / graphs collected with specific places in a
GIS system
St Ivo School Geography Department - GCSE REVISION
What steps would you take to download a satellite
image to help with data presentation in a geographical
enquiry?
1. Identify a source for satellite images, e.g. through a google search, or
using a specific programme such as Google Earth.
2. Once located image - right click and save, or print screen image
3. Image can then be pasted within text and given a title. Annotations can
be made using text boxes.
4. A figure number should be given so that it can be made reference to in
text and the source of the image added.
St Ivo School Geography Department - GCSE REVISION
What is meant by the site of a settlement?
What could be included in a description of site?
This refers to the physical characteristics of the place
and the land it is built on.
S H A W L
Slope; Height above sea level; Aspect (way slope
faces); Water Supply; Land (e.g. floodplain)
St Ivo School Geography Department - GCSE REVISION
How could you use the internet to search for a
particular topic area to support a geographical
enquiry?
1. Use a google search, with appropriate key words and where
appropriate the + sign in between to get more focused results
2. Check origin of the information given in the website (to consider
reliability / possible bias)
3. If it is a controversial topic that is being investigated, or involves
specific points of view - look for a number of different views to get
a more balanced overview.
Fold
alo
ng
her
e
Fold
alo
ng
her
e
Fold
alo
ng
her
e
Fold
alo
ng
her
e
Fold
alo
ng
her
e
Yr 11 - Tectonics www.geobytesgcse.wordpress.com
Year 11 - Geographical Skills www.geobytesgcse.wordpress.com
Year 11 - Geographical Skills www.geobytesgcse.wordpress.com
Year 11 - Geographical Skills www.geobytesgcse.wordpress.com
Year 11 - Geographical Skills www.geobytesgcse.wordpress.com
www.geobytesgcse.wordpress.com
www.geobytesgcse.wordpress.com
www.geobytesgcse.wordpress.com
www.geobytesgcse.wordpress.com
www.geobytesgcse.wordpress.com
St Ivo School Geography Department - GCSE REVISION
What is meant by the situation of a place?
The location of a place in relation to other places (e.g. 2
km northwest of the A428, or located on the south bank of the
River Ouse) etc.
Remember - P A R C
Places (nearby Settlements); Accessibility; Relief (near hills
etc.) Communications (e.g. near roads / rivers)
St Ivo School Geography Department - GCSE REVISION
What is the difference between an aerial photograph
and an oblique photograph?
An aerial photograph is a photograph taken directly
from above - i.e. a birds-eye view, whereas an oblique
photograph is one taken from above, but from an
angle.
St Ivo School Geography Department - GCSE REVISION
What is the difference between a label and an
annotation?
A label is a simple descriptive point whereas an
annotation is an explanatory label.
e.g. outside of meander (label)
outside of a meander which river flows faster due to less
friction (annotation)
St Ivo School Geography Department - GCSE REVISION
Briefly describe the main stage in drawing a sketch
map
1. Draw a simple box frame and add grid lines to act as
guidelines
2. Draw any features relevant to the question asked and
which will help make the map make more sense (e.g. roads /
major settlements)
3. Add appropriate labels and annotations
St Ivo School Geography Department - GCSE REVISION
Define the following terms:
Linear Settlement
Nucleated Settlement
Dispersed Settlement
Linear Settlement - where buildings are located either side
of a main road
Nucleated Settlement - where buildings are grouped
together (often at a crossroads or around a village green)
Dispersed Settlement - where individual buildings are
spread out around an area
Fold
alo
ng
her
e
Fold
alo
ng
her
e
Fold
alo
ng
her
e
Fold
alo
ng
her
e
Fold
alo
ng
her
e
Year 11 - Geographical Skills www.geobytesgcse.wordpress.com
Year 11 - Geographical Skills www.geobytesgcse.wordpress.com
Year 11 - Geographical Skills www.geobytesgcse.wordpress.com
Year 11 - Geographical Skills www.geobytesgcse.wordpress.com
Year 11 - Geographical Skills www.geobytesgcse.wordpress.com
www.geobytesgcse.wordpress.com
www.geobytesgcse.wordpress.com
www.geobytesgcse.wordpress.com
www.geobytesgcse.wordpress.com
www.geobytesgcse.wordpress.com
St Ivo School Geography Department - GCSE REVISION
What does scale mean and what does a scale of
1:50,000 mean?
Scale is the link between real life distances and those
shown on a map. 1:50,000 means that 1cm on the map
is equal to 50,000cm in real life - i.e. 1cm on a map =
0.5km in real life.
St Ivo School Geography Department - GCSE REVISION
If asked to measure distance on a map, what is the
difference between direct or straight line distance and
actual distance?
Direct, or straight line distance, means measuring the
direct distance between two places on a map (i.e. not
following roads)
Actual distance, means measuring the distance by
roads between two places.
St Ivo School Geography Department - GCSE REVISION
Give examples of human features that you could
describe from a map
Relates to man-made features / influenced by humans
and may include:
Land-use (i.e. residential, recreation, industrial etc.)
Communications (i.e. roads, railways etc.)
Settlement (inc. site, situation, shape (linear,
nucleated etc.))
St Ivo School Geography Department - GCSE REVISION
Give examples of physical features that you could
describe from a map.
Relates to natural features - so may include:
- relief (shape of land - e.g. contour patterns, shape of land -
e.g. valleys, height above sea level etc.)
- Drainage (e.g. number of rivers, width, lakes, marsh etc.)
- Vegetation - woodland, type vegetation etc.
St Ivo School Geography Department - GCSE REVISION
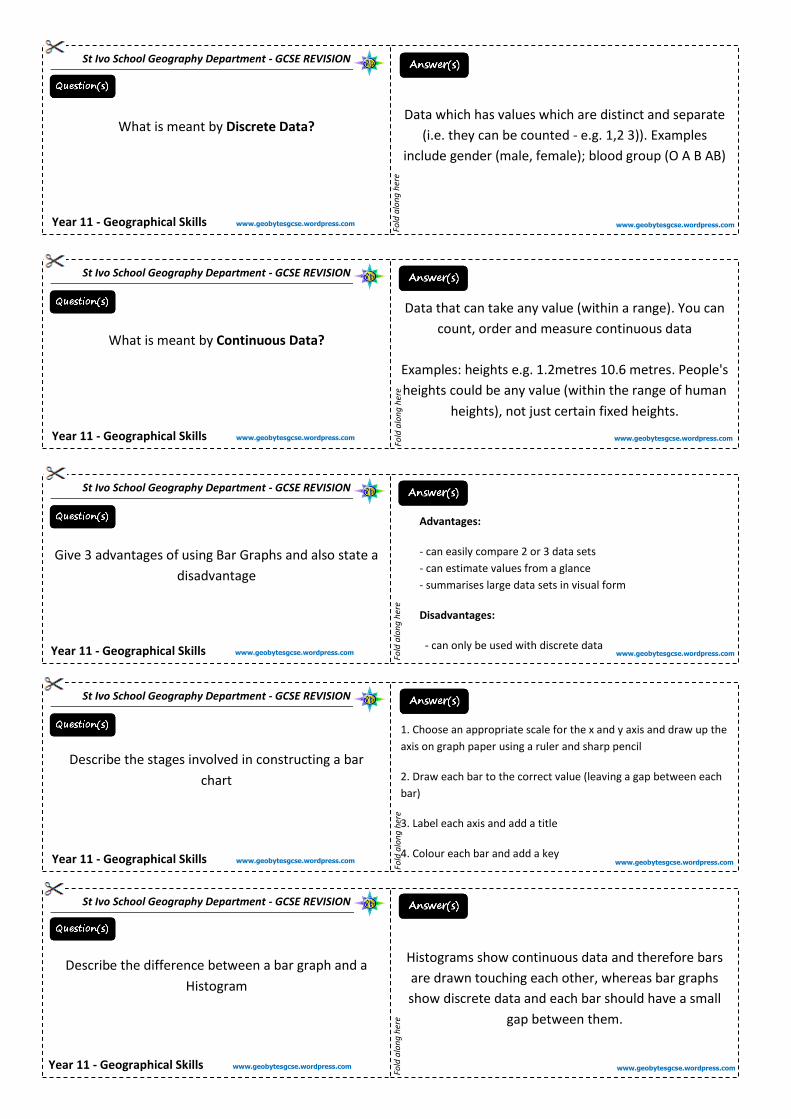
A. B.
What landscape features would these contour patterns
represent?
A. A V-shaped valley
B. East facing steep sided slope
Fold
alo
ng
her
e
Fold
alo
ng
her
e
Fold
alo
ng
her
e
Fold
alo
ng
her
e
Fold
alo
ng
her
e
Year 11 - Geographical Skills www.geobytesgcse.wordpress.com
Year 11 - Geographical Skills www.geobytesgcse.wordpress.com
Year 11 - Geographical Skills www.geobytesgcse.wordpress.com
Year 11 - Geographical Skills www.geobytesgcse.wordpress.com
Year 11 - Geographical Skills www.geobytesgcse.wordpress.com
www.geobytesgcse.wordpress.com
www.geobytesgcse.wordpress.com
www.geobytesgcse.wordpress.com
www.geobytesgcse.wordpress.com
www.geobytesgcse.wordpress.com
St Ivo School Geography Department - GCSE REVISION
What is meant by Continuous Data?
Data that can take any value (within a range). You can
count, order and measure continuous data
Examples: heights e.g. 1.2metres 10.6 metres. People's
heights could be any value (within the range of human
heights), not just certain fixed heights.
St Ivo School Geography Department - GCSE REVISION
What is meant by Discrete Data?
Data which has values which are distinct and separate
(i.e. they can be counted - e.g. 1,2 3)). Examples
include gender (male, female); blood group (O A B AB)
St Ivo School Geography Department - GCSE REVISION
Give 3 advantages of using Bar Graphs and also state a
disadvantage
Advantages:
- can easily compare 2 or 3 data sets
- can estimate values from a glance
- summarises large data sets in visual form
Disadvantages:
- can only be used with discrete data
St Ivo School Geography Department - GCSE REVISION
Describe the stages involved in constructing a bar
chart
1. Choose an appropriate scale for the x and y axis and draw up the
axis on graph paper using a ruler and sharp pencil
2. Draw each bar to the correct value (leaving a gap between each
bar)
3. Label each axis and add a title
4. Colour each bar and add a key
St Ivo School Geography Department - GCSE REVISION
Describe the difference between a bar graph and a
Histogram
Histograms show continuous data and therefore bars
are drawn touching each other, whereas bar graphs
show discrete data and each bar should have a small
gap between them.
Fold
alo
ng
her
e
Fold
alo
ng
her
e
Fold
alo
ng
her
e
Fold
alo
ng
her
e
Fold
alo
ng
her
e
Year 11 - Geographical Skills www.geobytesgcse.wordpress.com
Year 11 - Geographical Skills www.geobytesgcse.wordpress.com
Year 11 - Geographical Skills www.geobytesgcse.wordpress.com
Year 11 - Geographical Skills www.geobytesgcse.wordpress.com
Year 11 - Geographical Skills www.geobytesgcse.wordpress.com
www.geobytesgcse.wordpress.com
www.geobytesgcse.wordpress.com
www.geobytesgcse.wordpress.com
www.geobytesgcse.wordpress.com
www.geobytesgcse.wordpress.com
St Ivo School Geography Department - GCSE REVISION
Give one advantage of a located bar chart over a
normal bar graph
Located bar charts help to give spatial relevance to
data and therefore help identify differences between
places enabling easy visual comparison
St Ivo School Geography Department - GCSE REVISION
What are flow lines used for?
These lines can be used to show direction and
movement - the direction of the line representing the
direction of the flow and the thickness of the line
representing the volume of flow.
St Ivo School Geography Department - GCSE REVISION
Give 2 advantages and 2 disadvantages of isolines
Advantages:
1. good for showing gradual changes over space
2. avoids the abrupt changes shown on choropleth maps
Disadvantages:
1. requires a large amount of data for accurate drawing
2. unsuitable for showing discontinuous patchy
distributions
St Ivo School Geography Department - GCSE REVISION
What data to the following isolines show? - Isohyets
- Contour Lines
- Isochrones
- Isobars
- Isovels
- Isohyets - join places of equal rainfall
- Contour Lines - join places of equal height
- Isochrones - join places which are of equal time distance
from an area
- Isobars - join places of equal air pressure
- Isovels - join places of equal velocity in a river
St Ivo School Geography Department - GCSE REVISION
What is meant by an isoline?
An isoline joins places of equal value and show the
distribution of a variable over an area.
Fold
alo
ng
her
e
Fold
alo
ng
her
e
Fold
alo
ng
her
e
Fold
alo
ng
her
e
Fold
alo
ng
her
e
Year 11 - Geographical Skills
www.geobytesgcse.wordpress.com
Year 11 - Geographical Skills www.geobytesgcse.wordpress.com
Year 11 - Geographical Skills
www.geobytesgcse.wordpress.com
Year 11 - Geographical Skills www.geobytesgcse.wordpress.com
Year 11 - Geographical Skills www.geobytesgcse.wordpress.com
www.geobytesgcse.wordpress.com
www.geobytesgcse.wordpress.com
www.geobytesgcse.wordpress.com
www.geobytesgcse.wordpress.com
www.geobytesgcse.wordpress.com
St Ivo School Geography Department - GCSE REVISION
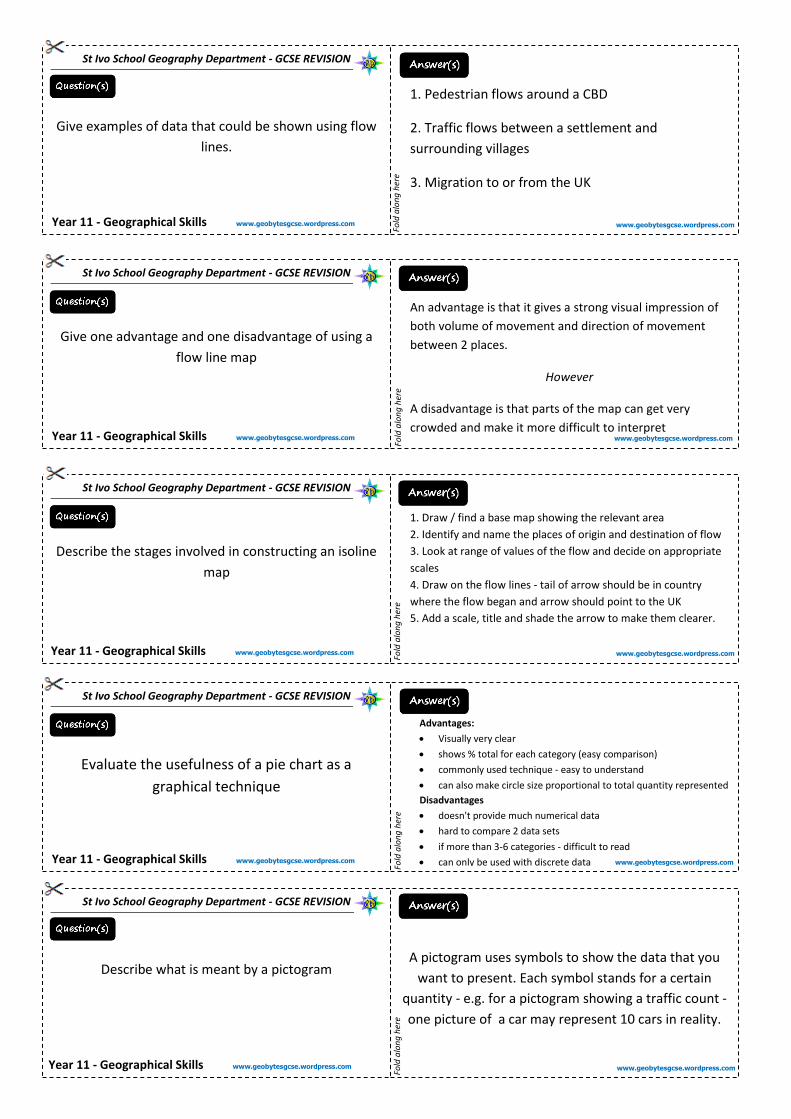
Give one advantage and one disadvantage of using a
flow line map
An advantage is that it gives a strong visual impression of
both volume of movement and direction of movement
between 2 places.
However
A disadvantage is that parts of the map can get very
crowded and make it more difficult to interpret
St Ivo School Geography Department - GCSE REVISION
Give examples of data that could be shown using flow
lines.
1. Pedestrian flows around a CBD
2. Traffic flows between a settlement and
surrounding villages
3. Migration to or from the UK
St Ivo School Geography Department - GCSE REVISION
Evaluate the usefulness of a pie chart as a
graphical technique
Advantages:
Visually very clear
shows % total for each category (easy comparison)
commonly used technique - easy to understand
can also make circle size proportional to total quantity represented
Disadvantages
doesn't provide much numerical data
hard to compare 2 data sets
if more than 3-6 categories - difficult to read
can only be used with discrete data
St Ivo School Geography Department - GCSE REVISION
Describe the stages involved in constructing an isoline
map
1. Draw / find a base map showing the relevant area
2. Identify and name the places of origin and destination of flow
3. Look at range of values of the flow and decide on appropriate
scales
4. Draw on the flow lines - tail of arrow should be in country
where the flow began and arrow should point to the UK
5. Add a scale, title and shade the arrow to make them clearer.
St Ivo School Geography Department - GCSE REVISION
Describe what is meant by a pictogram
A pictogram uses symbols to show the data that you
want to present. Each symbol stands for a certain
quantity - e.g. for a pictogram showing a traffic count -
one picture of a car may represent 10 cars in reality.
Fold
alo
ng
her
e
Fold
alo
ng
her
e
Fold
alo
ng
her
e
Fold
alo
ng
her
e
Fold
alo
ng
her
e
Year 11 - Geographical Skills www.geobytesgcse.wordpress.com
Year 11 - Geographical Skills www.geobytesgcse.wordpress.com
Year 11 - Geographical Skills www.geobytesgcse.wordpress.com
Year 11 - Geographical Skills www.geobytesgcse.wordpress.com
Year 11 - Geographical Skills www.geobytesgcse.wordpress.com
www.geobytesgcse.wordpress.com
www.geobytesgcse.wordpress.com
www.geobytesgcse.wordpress.com
www.geobytesgcse.wordpress.com
www.geobytesgcse.wordpress.com

St Ivo School Geography Department - GCSE REVISION
What criteria need to be met to use a Triangular Graph
to represent a data set?
The data set needs to be made up of 3 parts and each
needs to be in % adding up to 100%
St Ivo School Geography Department - GCSE REVISION
Give 3 advantages of a Triangular Graph
1. A large number of data can be shown one graph
2. Enables data to be classified easily
3. A sophisticated technique showing information
about several variables on one graph
4. Dominant characteristics can be shown clearly
St Ivo School Geography Department - GCSE REVISION
Give examples of data which could be represented
using a triangular graph
1. Employment Structure (i.e. % working in primary,
secondary and tertiary industry)
2. Land use (i.e. % residential, recreational and
industrial)
3. Soil Texture (i.e. % sand, % clay and % loam)
St Ivo School Geography Department - GCSE REVISION
What is a choropleth map?
These maps are shaded according to a pre-arranged
range, with each colour presenting a particular range
of values. For example showing population density
St Ivo School Geography Department - GCSE REVISION
State 2 disadvantages of a Triangular Graph as a
presentation technique
1. Can be difficult and time consuming to construct
2. Can only be used for data with 3 components
given in % form and which adds up to 100%
Fold
alo
ng
her
e
Fold
alo
ng
her
e
Fold
alo
ng
her
e
Fold
alo
ng
her
e
Fold
alo
ng
her
e
Year 11 - Geographical Skills www.geobytesgcse.wordpress.com
www.geobytesgcse.wordpress.com
Year 11 - Geographical Skills www.geobytesgcse.wordpress.com
Year 11 - Geographical Skills www.geobytesgcse.wordpress.com
Year 11 - Geographical Skills www.geobytesgcse.wordpress.com
Year 11 - Geographical Skills www.geobytesgcse.wordpress.com
www.geobytesgcse..wordpress.com
www.geobytesgcse..wordpress.com
www.geobytesgcse..wordpress.com
www.geobytesgcse..wordpress.com
www.geobytesgcse..wordpress.com
St Ivo School Geography Department - GCSE REVISION
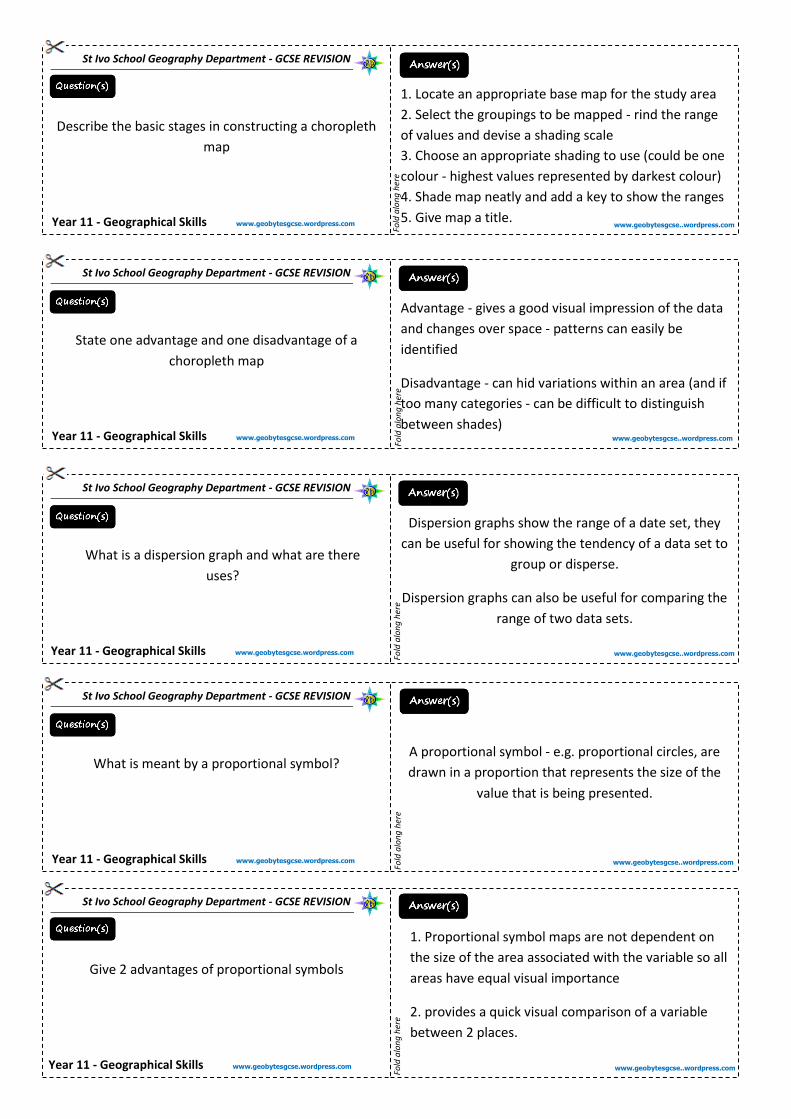
Describe the basic stages in constructing a choropleth
map
1. Locate an appropriate base map for the study area
2. Select the groupings to be mapped - rind the range
of values and devise a shading scale
3. Choose an appropriate shading to use (could be one
colour - highest values represented by darkest colour)
4. Shade map neatly and add a key to show the ranges
5. Give map a title.
St Ivo School Geography Department - GCSE REVISION
What is a dispersion graph and what are there
uses?
Dispersion graphs show the range of a date set, they
can be useful for showing the tendency of a data set to
group or disperse.
Dispersion graphs can also be useful for comparing the
range of two data sets.
St Ivo School Geography Department - GCSE REVISION
State one advantage and one disadvantage of a
choropleth map
Advantage - gives a good visual impression of the data
and changes over space - patterns can easily be
identified
Disadvantage - can hid variations within an area (and if
too many categories - can be difficult to distinguish
between shades)
St Ivo School Geography Department - GCSE REVISION
What is meant by a proportional symbol?
A proportional symbol - e.g. proportional circles, are
drawn in a proportion that represents the size of the
value that is being presented.
St Ivo School Geography Department - GCSE REVISION
Give 2 advantages of proportional symbols
1. Proportional symbol maps are not dependent on
the size of the area associated with the variable so all
areas have equal visual importance
2. provides a quick visual comparison of a variable
between 2 places.
Fold
alo
ng
her
e
Fold
alo
ng
her
e
Fold
alo
ng
her
e
Fold
alo
ng
her
e
Fold
alo
ng
her
e
Year 11 - Geographical Skills www.geobytesgcse.wordpress.com
Year 11 - Geographical Skills www.geobytesgcse.wordpress.com
Year 11 - Geographical Skills www.geobytesgcse.wordpress.com
Year 11 - Geographical Skills www.geobytesgcse.wordpress.com
Year 11 - Geographical Skills www.geobytesgcse.wordpress.com
www.geobytesgcse..wordpress.com
www.geobytesgcse..wordpress.com
www.geobytesgcse..wordpress.com
www.geobytesgcse..wordpress.com
www.geobytesgcse..wordpress.com

St Ivo School Geography Department - GCSE REVISION
On a scattergraph - how do you decide which variable
is plotted on the x axis and which variable is plotted on
the y-axis?
The independent variable is plotted on the x axis and the
dependent variable (i.e. the variable that is believed to rely on the
other) is plotted on the y axis.
For example - GNP and Birth Rate: GNP is a measure of wealth and
will affect Birth Rate - therefore GNP is the independent variable
and is plotted on the x-axis whereas Birth Rate is the independent
variable and is plotted on the y axis.
St Ivo School Geography Department - GCSE REVISION
What are Scattergraphs used for?
Scattergraphs can be used to see if there is a
relationship between two sets of data and can indicate
the nature of the relationship.
St Ivo School Geography Department - GCSE REVISION
What is a best fit line used for on a scattergraph?
A best fit line is used to indicate the strength of a
relationship shown between two variables on a
scattergraph
St Ivo School Geography Department - GCSE REVISION
Give 2 ways in which GIS can be used in society.
1. Emergency Services - ambulances use GIS to improve response time to
identify where the nearest ambulance is to an emergency. A traffic map can
help controllers make a decision on which ambulance to send, depending
on how close and any traffic congestion / road works.
2. GIS is used to provide navigation systems in cars
3. Utility companies use GIS to locate and manage water, drains, gas and
electricity supplies.
St Ivo School Geography Department - GCSE REVISION
What is meant by GIS?
GIS is a Geographical Information System
- it is software tool that is available to geographers to
aid the mapping and spatial analysis of data and
information. It enables data to plotted and
interrogated digitally in a map form. GIS can involve
the layering of data, to overlay different data sets and
look for spatial patterns and relationships therefore
enabling us to make sense of large amounts of data
Fold
alo
ng
her
e
Fold
alo
ng
her
e
Fold
alo
ng
her
e
Fold
alo
ng
her
e
Fold
alo
ng
her
e
Year 11 - Geographical Skills www.geobytesgcse.wordpress.com
Year 11 - Geographical Skills www.geobytesgcse.wordpress.com
Year 11 - Geographical Skills www.geobytesgcse.wordpress.com
Year 11 - Geographical Skills www.geobytesgcse.wordpress.com
Year 11 - Geographical Skills www.geobytesgcse.wordpress.com
www.geobytesgcse..wordpress.com
www.geobytesgcse..wordpress.com
www.geobytesgcse..wordpress.com
www.geobytesgcse..wordpress.com
www.geobytesgcse..wordpress.com
St Ivo School Geography Department - GCSE REVISION
St Ivo School Geography Department - GCSE REVISION
St Ivo School Geography Department - GCSE REVISION
St Ivo School Geography Department - GCSE REVISION
St Ivo School Geography Department - GCSE REVISION
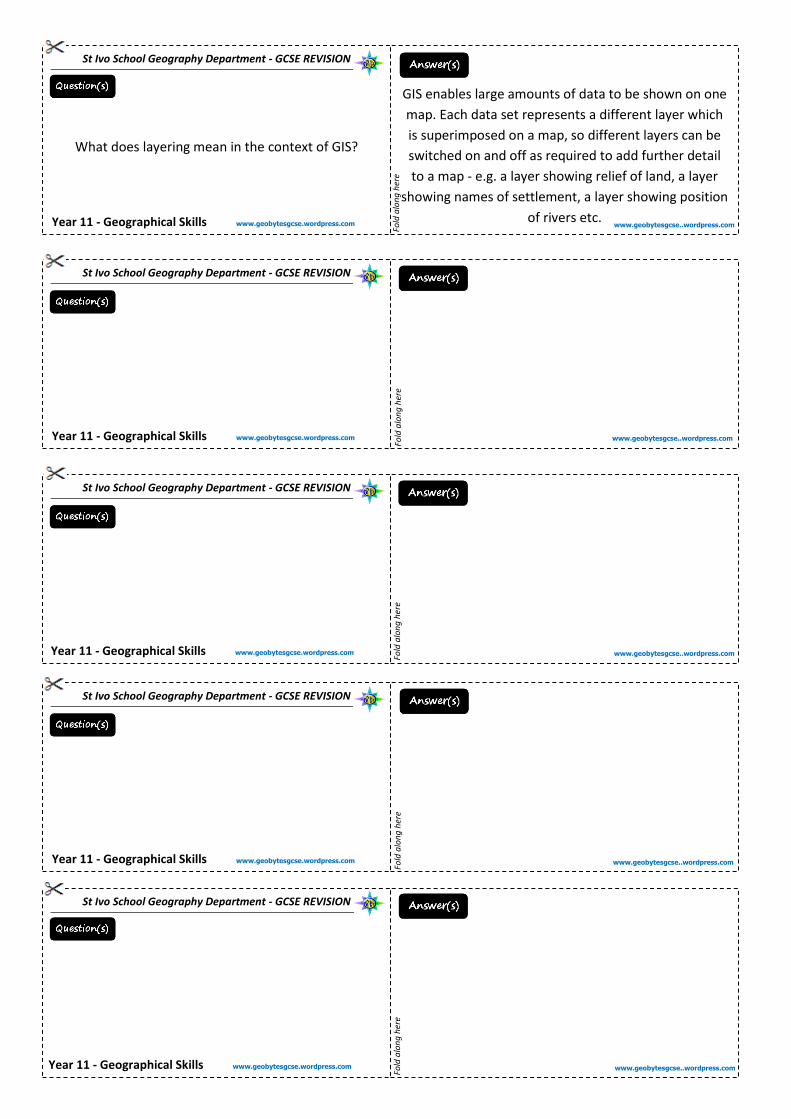
What does layering mean in the context of GIS?
GIS enables large amounts of data to be shown on one
map. Each data set represents a different layer which
is superimposed on a map, so different layers can be
switched on and off as required to add further detail
to a map - e.g. a layer showing relief of land, a layer
showing names of settlement, a layer showing position
of rivers etc.
Fold
alo
ng
her
e
Fold
alo
ng
her
e
Fold
alo
ng
her
e
Fold
alo
ng
her
e
Fold
alo
ng
her
e
Year 11 - Geographical Skills www.geobytesgcse.wordpress.com
Year 11 - Geographical Skills www.geobytesgcse.wordpress.com
Year 11 - Geographical Skills www.geobytesgcse.wordpress.com
Year 11 - Geographical Skills www.geobytesgcse.wordpress.com
Year 11 - Geographical Skills www.geobytesgcse.wordpress.com
www.geobytesgcse..wordpress.com
www.geobytesgcse..wordpress.com
www.geobytesgcse..wordpress.com
www.geobytesgcse..wordpress.com
www.geobytesgcse..wordpress.com
St Ivo School Geography Department - GCSE REVISION
St Ivo School Geography Department - GCSE REVISION
St Ivo School Geography Department - GCSE REVISION
St Ivo School Geography Department - GCSE REVISION
St Ivo School Geography Department - GCSE REVISION
Fold
alo
ng
her
e
Fold
alo
ng
her
e
Fold
alo
ng
her
e
Fold
alo
ng
her
e
Fold
alo
ng
her
e
Year 11 - Geographical Skills www.geobytesgcse.wordpress.com
Year 11 - Geographical Skills www.geobytesgcse.wordpress.com
Year 11 - Geographical Skills www.geobytesgcse.wordpress.com
Year 11 - Geographical Skills www.geobytesgcse.wordpress.com
Year 11 - Geographical Skills www.geobytesgcse.wordpress.com
www.geobytesgcse..wordpress.com
www.geobytesgcse..wordpress.com
www.geobytesgcse..wordpress.com
www.geobytesgcse..wordpress.com
www.geobytesgcse..wordpress.com